Article

Influence of Corrosion Damage on Fatigue Limit Capacities of Offshore Wind Turbine Substructure

1
Chinese–German Institute of Engineering, Zhejiang University of Science and Technology, Hangzhou 310023, China
2
State Key Laboratory of Coastal and Offshore Engineering, Faculty of Infrastructure Engineering, Dalian University of Technology, Dalian 116024, China
3
Institute of Earthquake Engineering, Faculty of Infrastructure Engineering, Dalian University of Technology, Dalian 116024, China
4
Key Laboratory of Far-Shore Wind Power Technology of Zhejiang Province, Hangzhou 311122, China
5
Powerchina Huadong Engineering Corporation Limited, Hangzhou 311122, China
*
Author to whom correspondence should be addressed.
J. Mar. Sci. Eng. 2022, 10(8), 1011; https://doi.org/10.3390/jmse10081011
Submission received: 25 June 2022 / Revised: 19 July 2022 / Accepted: 19 July 2022 / Published: 24 July 2022
(This article belongs to the Special Issue Offshore Wind Turbine Foundations)

Abstract

:
The decrease in structural capacities under the limit states caused by structural corrosion is a potential hazard for the safety of offshore structures. Considering the influence of corrosion factors, a fatigue analysis of the typical tubular joints of an offshore wind turbine (OWT) substructure under operation and wave loads during the service period was performed. The structural corrosion was equivalent to a two-parameter Weibull distribution in the analysis. According to the Miner linear fatigue accumulation criterion, the accumulated fatigue damage of three different typical tubular joints in the initial stage and at operation periods of 10, 20, and 30 years was calculated. The most critical tubular joint of the studied OWT substructure is located at the connection between the pile foundations and braces. Owing to the increase in structural corrosion during the operation period, a remarkable decrease in the tubular joint fatigue capacities under the operation and wave loads was observed.

1. Introduction

In recent years, the Chinese offshore wind power system has undergone rapid development. By the end of 2020, the total installed capacity of offshore wind power reached 9 GW in China. It is expected that the proportion of offshore wind energy will exceed 20% in the next three years [1,2]. The power produced from offshore wind turbines (OWTs) in China has been increasing since the beginning of the 21st century. OWTs generally have design lifetimes of 20–25 years. Thus, some offshore wind farm structures have entered the middle and late periods of their design life. In long-term service, OWT structures are exposed to an extremely harsh and complex marine environment, affected by wave impacts, the erosion of marine organisms, and changes in environmental temperature and humidity [3]. The tubular joints can easily crack in such a complex environment. Peng et al. [4] proposed a ductile fracture model for fracture prediction ranging from negative to high-stress triaxiality through a comparative study with four typical ductile fracture criteria and by analyzing the ductile fracture of the alloy metal. Under repeated loads of wind and waves, corroded components are more prone to the initiation of fatigue cracks [5], which reduces the thickness of components and leads to a reduction in the structural bearing capacity. Therefore, it is necessary to consider the changes in the structure’s bearing capacity caused by corrosion and fatigue during its life cycle.
The structural fatigue in marine corrosive environments has been investigated. Mehmanparast et al. [6] proposed a fatigue data testing and analysis method for the prediction of S–N fatigue curves of steel in different environments (air, salt fog, and seawater). Guo et al. [7] performed a high-cycle fatigue test on Q690 high-strength steel. The S–N curves of specimens with different corrosion periods were fitted and the corrosion fatigue failure degree of steel was evaluated. Guo et al. [8] modified the S–N curve of steel based on the three-parameter Weibull distribution and obtained a calculation formula for the S–N curve under different failure probabilities. Du et al. [9] proposed a fatigue damage evaluation method for mooring line considering the influence of marine corrosion conditions. The results verify that the mooring line corrosion has a significant influence on the tension distribution and fatigue capacity. Xie [10] analyzed the tower cylinder in the splash zone of an OWT based on the corrosion fatigue mechanism and energy change during the evolution of a corrosion fatigue crack. The overall corrosion fatigue life was obtained and a general model to predict the corrosion fatigue life was proposed. Liao et al. [11] performed corrosion fatigue tests on T-shaped welded joint samples and proposed a corrosion fatigue life prediction model, considering the coupling effect of the corrosion environment and cyclic load based on continuous damage mechanics. Wang et al. [12] proposed a combined concept consisting of a 5 MW braceless semisubmersible floating OWT (FOWT) and a torus-type wave energy converter. It was focused on the effect of wind and wave loadings on the dynamic response characteristics of the combined structure under different environmental load cases, considering the effect of wave nonlinearity on the fatigue damage. Zhao et al. [13] proposed a conceptual semisubmersible platform through a fully coupled analysis at moderate water depths. The columns of the braceless semisubmersible FOWT were connected by pontoons rather than braces, making it less prone to fatigue at the welded joints. This design reduced the fatigue sensitivity, corrosion hot spot, and complexity of the welding process.
According to the above works, corrosion has a significant impact on the ultimate fatigue-bearing capacity of foundation structures, particularly for offshore engineering structures. Focusing on a three-pile foundation in an offshore wind machine, considering the influence of corrosion on tubular joint structure parameters, we performed a calculation for a maritime wind turbine foundation structure of a typical tubular joint under cumulative fatigue. The equivalent load and structural fatigue damage were obtained under the joint action of wave load, which provides a reference for the safety assessment of an OWT foundation structure in long-term service.

2. Theory of Fatigue Damage Analysis

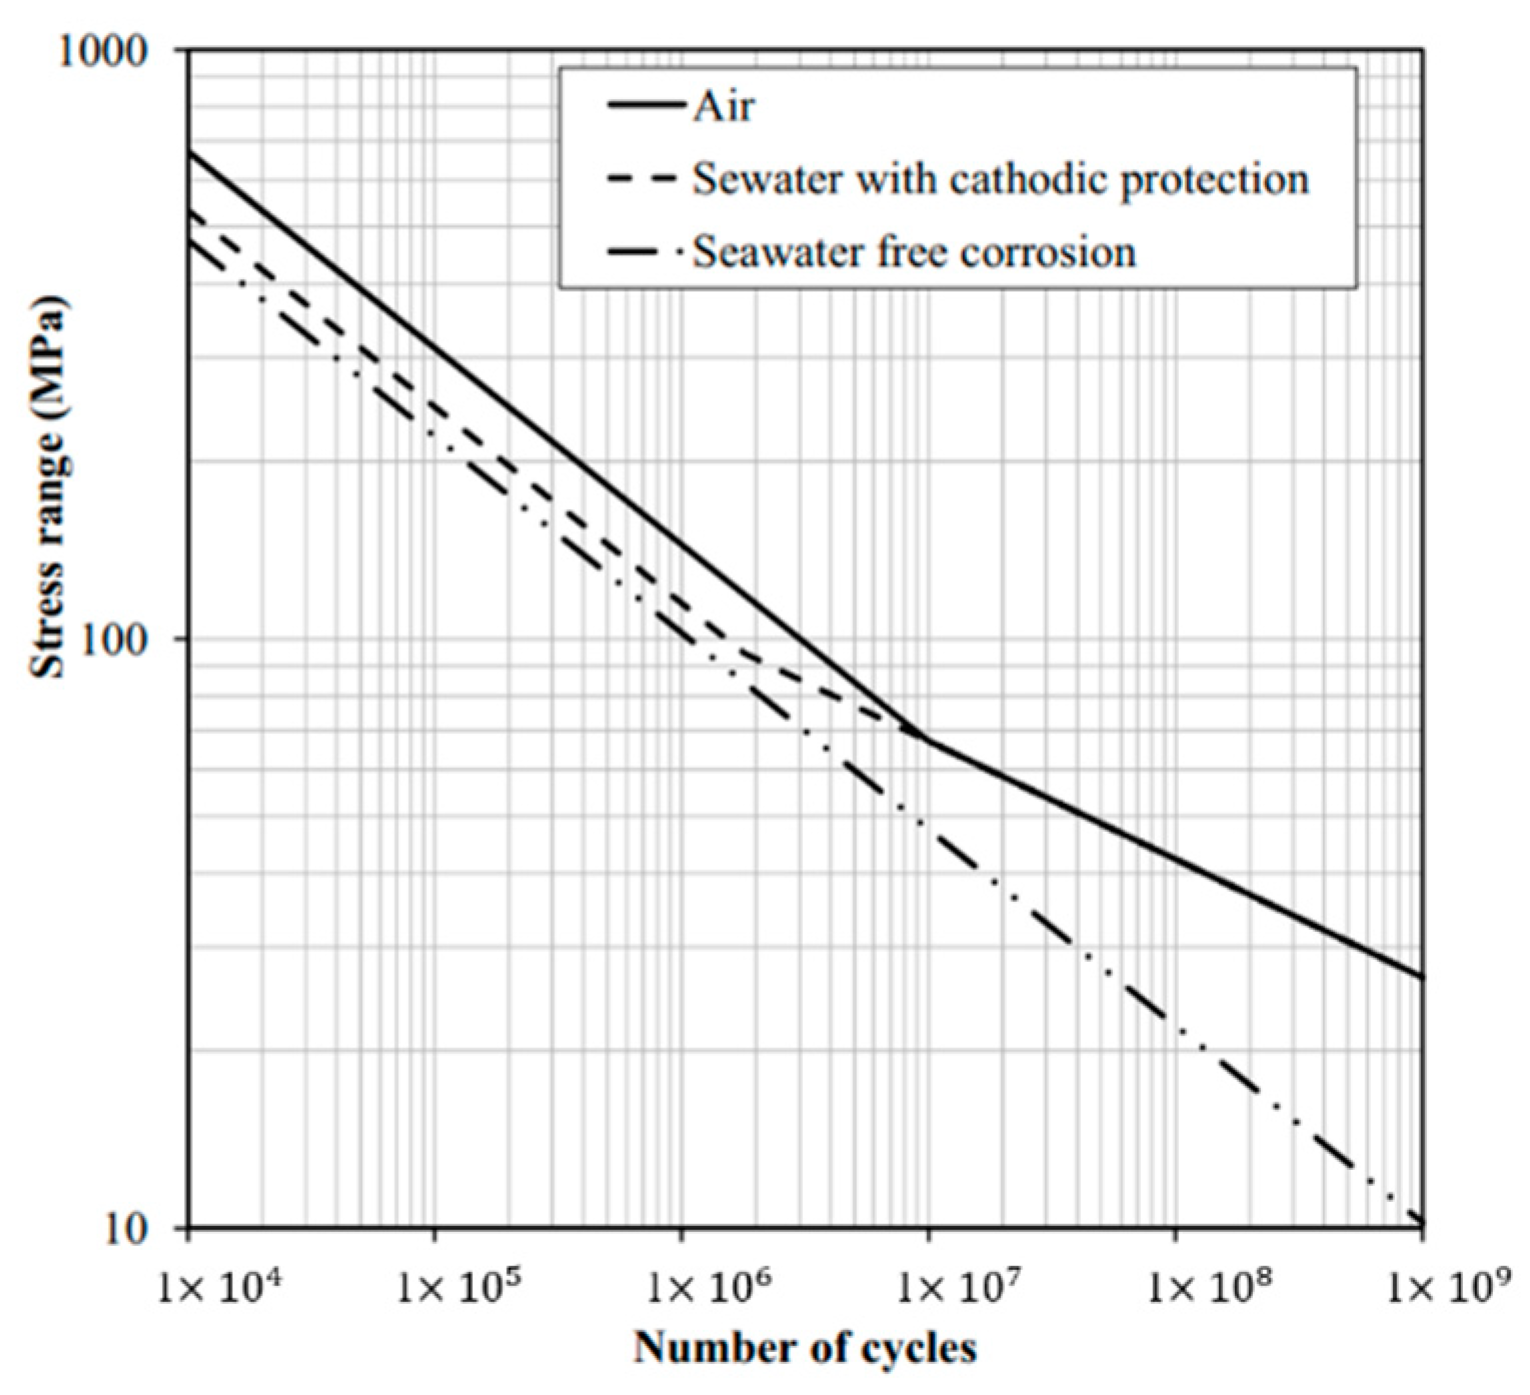
2.1. Fatigue Analysis Using a Deterministic Method

The deterministic fatigue analysis method is based on the S–N curve and Palmgren–Miner linear cumulative damage criterion to calculate the fatigue damage rate of joints. The S–N curve [14] describes the relationship between the structural stress/strain amplitude and maximum allowable cycles of action, which indicates the ultimate fatigue-bearing capacity of the structure. Generally, S–N curves of various materials can be obtained through the analysis of a large number of experiments.
The fatigue strength of welded joints in actual engineering is to some extent dependent on pipe wall thickness. The thickness effect, which is due to the local geometry of the weld toe in relation to the wall thickness of the adjoining member, is accounted for by a modification of the stress range in the function. As thickness is larger than the reference thickness, the design S-N curve is obtained by using Equation (1) [14].
lgN = lg a ¯ mlg [ Δ σ ( t t ref ) ] k ,
where N is the predicted number of cycles to failure for stress range Δ σ , Δ σ is stress range with unit MPa, m is the negative inverse slope of the S-N curve, lg a ¯ is the intercept of the log N-axis, tref is the reference thickness, the welded pipe node value is 32 mm, the bolt value is 25 mm, and t is the thickness at which the cracking is most likely. If the thickness is smaller than the reference thickness, t = tref; k is the thickness index.
The S–N curve of double curvature of tubular joints in a seawater environment recommended by DNV-RP-C203 [14] and corresponding parameter values are shown in Figure 1 and Table 1.
In the deterministic fatigue analysis of wind turbine load, it is assumed that the fatigue damage caused by the action of each stress amplitude is independent. The annual fatigue damage rate of each joint of the support structure under the action of a unidirectional fatigue load of the wind turbine is calculated using Equation (2) [15], according to Miner’s linear cumulative damage criterion.
D = j = 1 n n j ( σ γ j ) N j ( σ γ j ) ,
where n j is the actual number of stress cycles corresponding to the stress amplitude σ γ j ,   N j is the number of fatigue failure stress cycles corresponding to the stress amplitude   σ γ j , and n is the number of total stress amplitudes.

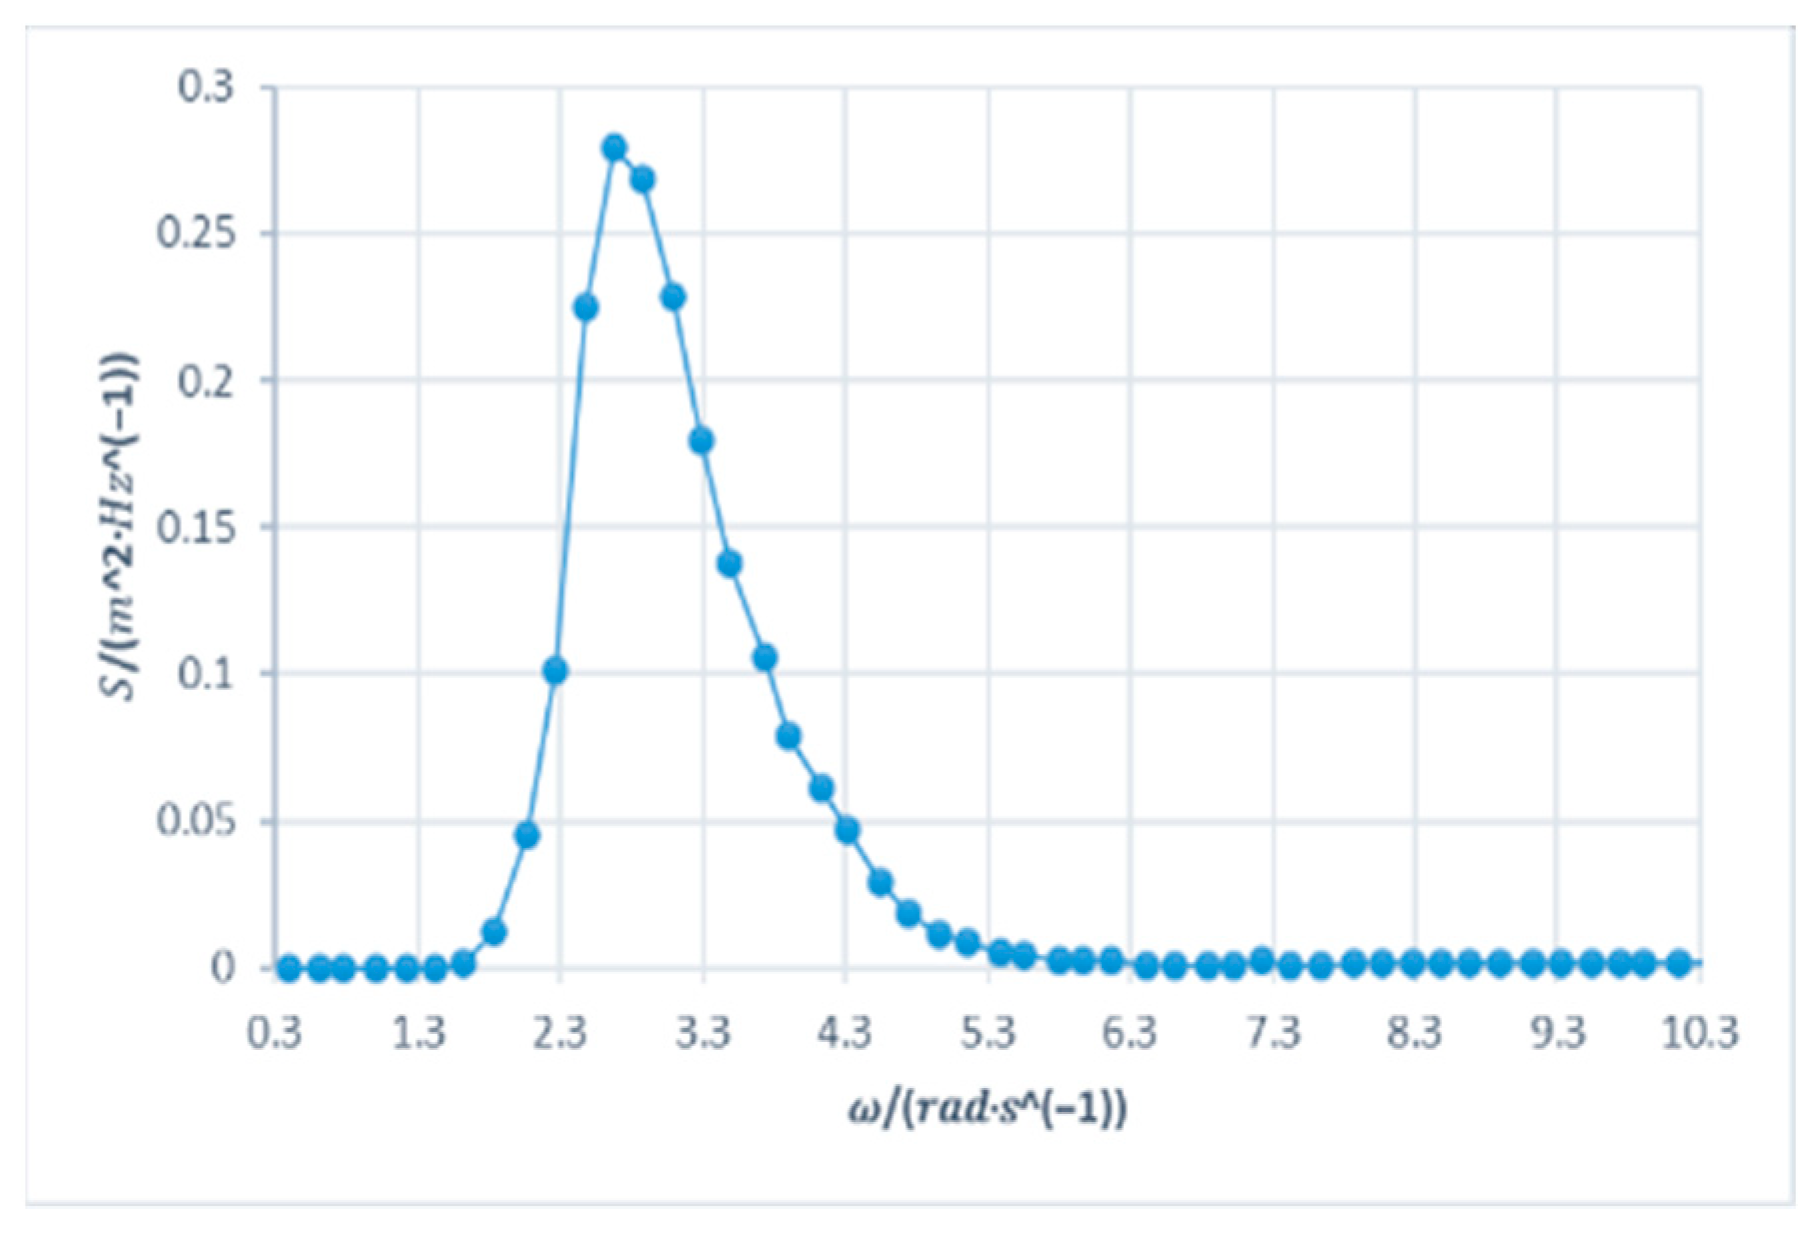
2.2. Spectral Fatigue Analysis Method

For a linear system, it is assumed that the wave load is a narrow-band stationary random process of each state and that it obeys the Rayleigh distribution in the short term. The alternating stress borne by the structure can also be assumed to follow the same distribution model. The corresponding probability density function is shown in Equation (3) [16]. When the spectral fatigue analysis method is used to carry out the cumulative calculation of structural fatigue under wave load, the stress transfer function T ( ω ) at the corresponding position of the structure should be obtained according to the alternating stress generated under random wave action. Furthermore, according to the stress transfer function T ( ω ) and wave spectrum S ( ω ), the fatigue stress spectrum σ ( ω ) under various sea conditions is obtained, as shown in Equation (4) [16]. Finally, based on the stress response spectrum and Miner’s linear fatigue accumulation criterion, the fatigue damage accumulation of structures under various sea conditions was calculated. The fatigue damage accumulation of structures under long-term sea conditions was obtained by stacking.
f s ( s ) = s 4 σ x 2 e ( s 2 8 σ x 2 ) ,
σ ( ω ) = | T ( ω ) | 2 S ( ω ) ,
where S is the stress range amplitude, σ x is the standard deviation of the alternating stress process, and m0 = σ x 2 is the variance of the alternating stress process.

2.3. Direct Formula Solution

First, the fatigue accumulation of the OWT foundation structure under equivalent operating load and wave load is obtained using the deterministic fatigue calculation method and spectral fatigue analysis method, respectively. Then, it is assumed that the long-term equivalent operating load and wave load obey a Gaussian distribution and Weibull distribution, respectively. Equation (5) [17] can be used to calculate the long-term fatigue accumulation of the OWT structure under the combined action of equivalent operating load and wave load.
D z = [ ( D 1 v 1 ) 2 / m + ( D 2 v 2 ) 2 / m ] ( m 2 ) / 2 [ v 1 2 ( D 1 v 1 ) 2 / m + v 2 2 ( D 2 v 2 ) 2 / m ] 3 / 2 / [ v 1 4 ( D 1 v 1 ) 2 / m + v 2 4 ( D 2 v 2 ) 2 / m ] 1 / 2 ,
where Dz is the fatigue damage of the joint response, D1 is the fatigue damage of the high-frequency response, D2 is the fatigue damage of the low-frequency response, v1 is the average zero crossing rate of the high-frequency response, and v2 is the mean zero crossing rate of the low-frequency response.
The average zero crossing rate [17] is
v i = n i / T d ,
where ni is the actual cycle number of the structure under the action of alternating stress within the stress range and Td is the design life of the offshore wind power structure.

2.4. Constant Amplitude Load Method

The superposition of the stress amplitude [18] of the OWT foundation structure is generated by the action of equivalent operating load and wave load. The stress amplitude after superposition can be calculated using Equation (7) [17] to obtain the long-term fatigue accumulation of the OWT structure under the combined action of equivalent operating load and wave load.
D = D 1 ( 1 v 2 v 1 ) + v 2 { ( D 1 v 1 ) 1 / m + ( D 2 v 2 ) 1 / m } m ,
where Dz is the fatigue damage of the combined response, D1 is the fatigue damage of the high-frequency response, D2 is the fatigue damage of the low-frequency response, v1 is the average zero crossing rate of the high-frequency response, v2 is the mean zero crossing rate of the low-frequency response, and m is the negative inverse of the slope of the S–N curve.

2.5. Weibull Corrosion Model

Qin et al. [19] divided the corrosion process into two stages based on previous studies. The noncorrosive stage is the first stage, t     [0, Tst], while the corrosion stage is the second stage, t   [Tst, TL]. The equations of the nonlinear corrosion model are shown as Equations (8) and (9).
The corrosion rate is
r ( t ) = { 0                                                                                                                                           0 t T st d β η ( t T st η ) β 1 exp ( t T st η ) β                                         T st t T L ,
The corrosion thickness at any time is
d ( t ) = { 0                                                                                                       0 t T st d { 1 exp ( t T st η ) β }                             T st t T L ,
where d(t) is the corrosion thickness at any time, d is the corrosion limit thickness, Tst is the moment when the corrosion begins, TL is the service life and maintenance cycle of the structure, and η and β are undetermined coefficients.

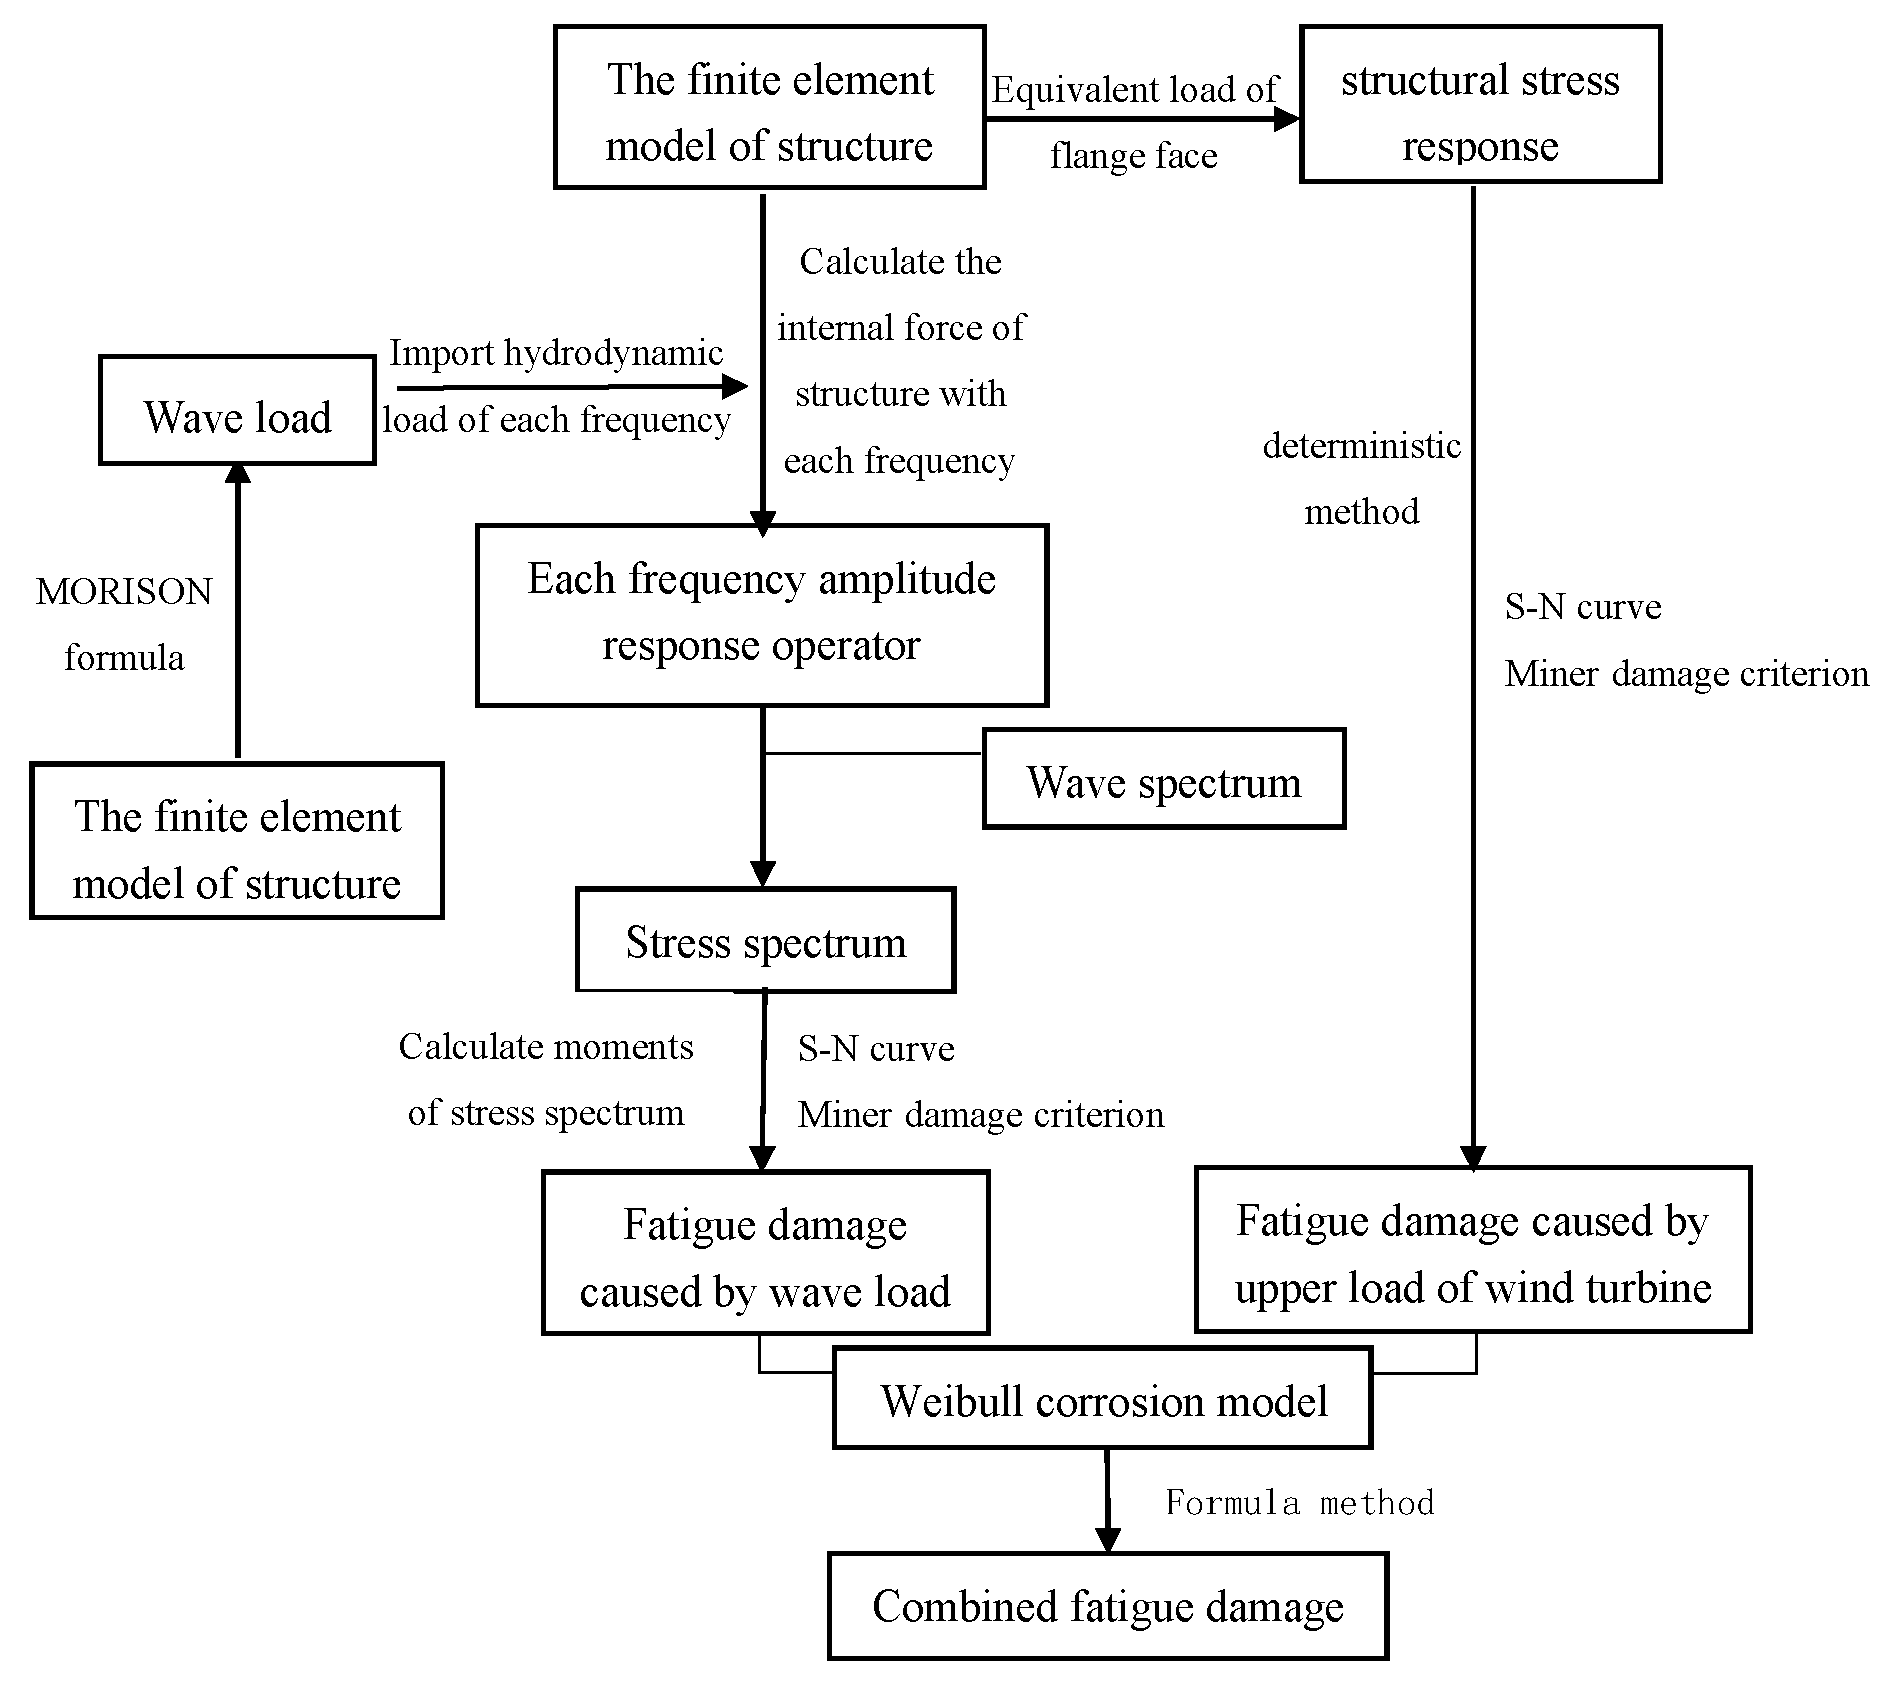
2.6. Long-Term Fatigue Analysis Method Considering Corrosion Effects

The research route shown in Figure 2 is used to calculate the fatigue accumulation of the OWT foundation structure under equivalent operating load and wave load using the deterministic fatigue analysis method and spectral fatigue analysis method, respectively. Furthermore, it is assumed that the above environmental loads obey the Gaussian distribution and Weibull distribution, respectively, in the long term. The fatigue accumulation of the OWT structure under the combined action of the equivalent running load and wave load can be obtained according to the long-term fatigue accumulation calculation formula in Equations (5) or (7). In the calculation, the influence of floating on the structural parameters of OWTs in different operating stages was considered based on the corrosion model in Equations (8) and (9).

3. Basic Parameters of the OWT Infrastructure

The site of reference for a wind turbine in a wind farm was the western area of the Bohai Sea. According to the survey data between the Yellow Sea and Bohai Sea, and the PH value measured by total hydrogen concentration at the site, the pH of the surface seawater in the Bohai Sea ranges from 8.03 to 8.26 [20]. The vertical distribution of water temperature and salinity is uniform up and down with almost zero vertical gradient. At the same time, the water temperature and the salinity affected by seasonal factors are about −1 °C~28 °C and 29‰~31.20‰, respectively [21].
Based on the location of the reference wind turbine, it is assumed that the seawater temperature is 25 °C. The steel’s elastic modulus, density, and Poisson’s ratio are 2.05 × 10⁵ Pa, 7860 kg∙m−3, and 0.3, respectively.

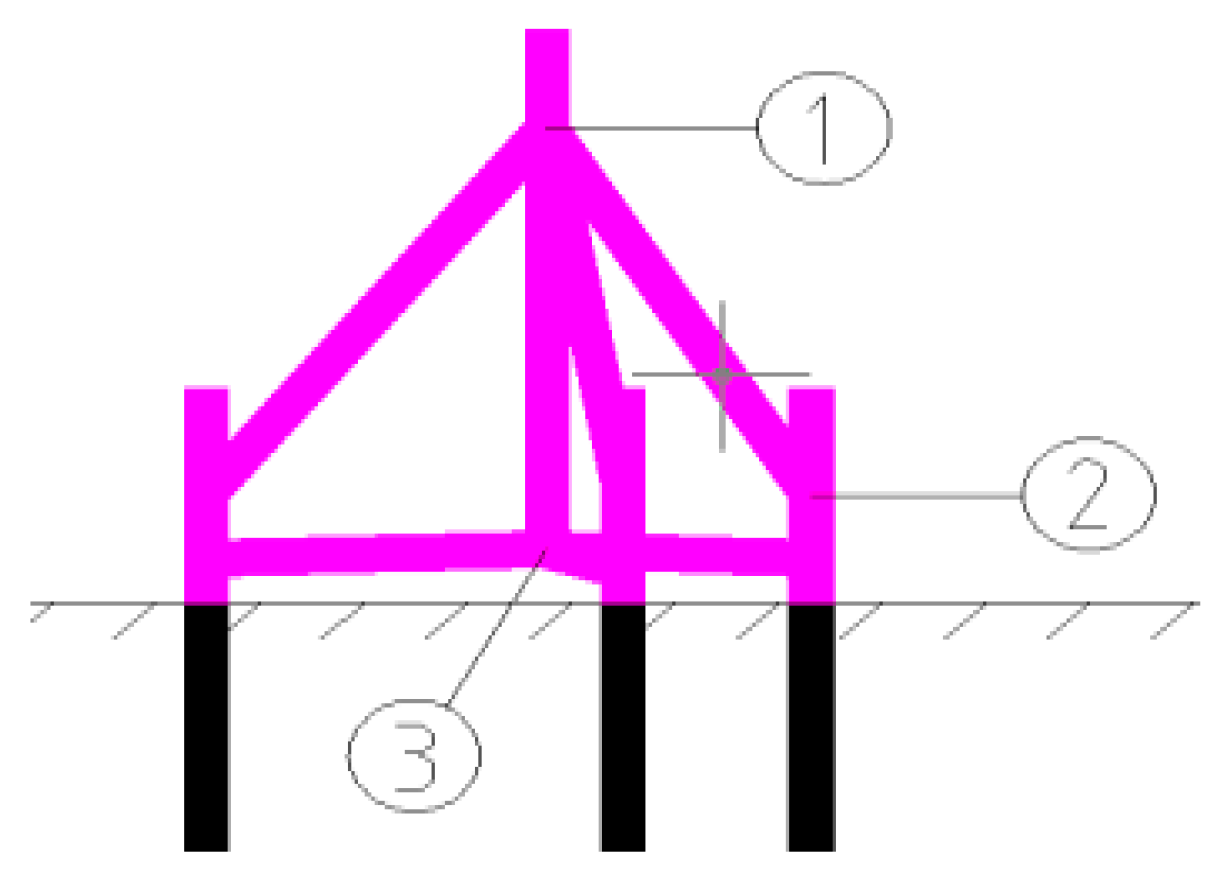
3.1. Stress Hot-Spot Location

According to the stress distribution law and fatigue damage mechanism, the stress concentration phenomenon of the tubular joints of the wind turbine infrastructure is obvious. Therefore, three types of typical tubular joints are selected for the calculation of the cumulative fatigue of the OWT infrastructure, as shown in Figure 3. Location ① (Y-joints) is the connection between the main cylinder and upper inclined support. Location ② (K-joints) is the joint between the pile casing and brace rod. Location ③ (T-joints) is the joint between the main cylinder body and lower inclined brace. The stress concentration factor of each type of tubular joint was calculated according to the Efthymiou empirical formula. The minimum stress concentration coefficient was set to 1.5.

3.2. Corrosion Parameters
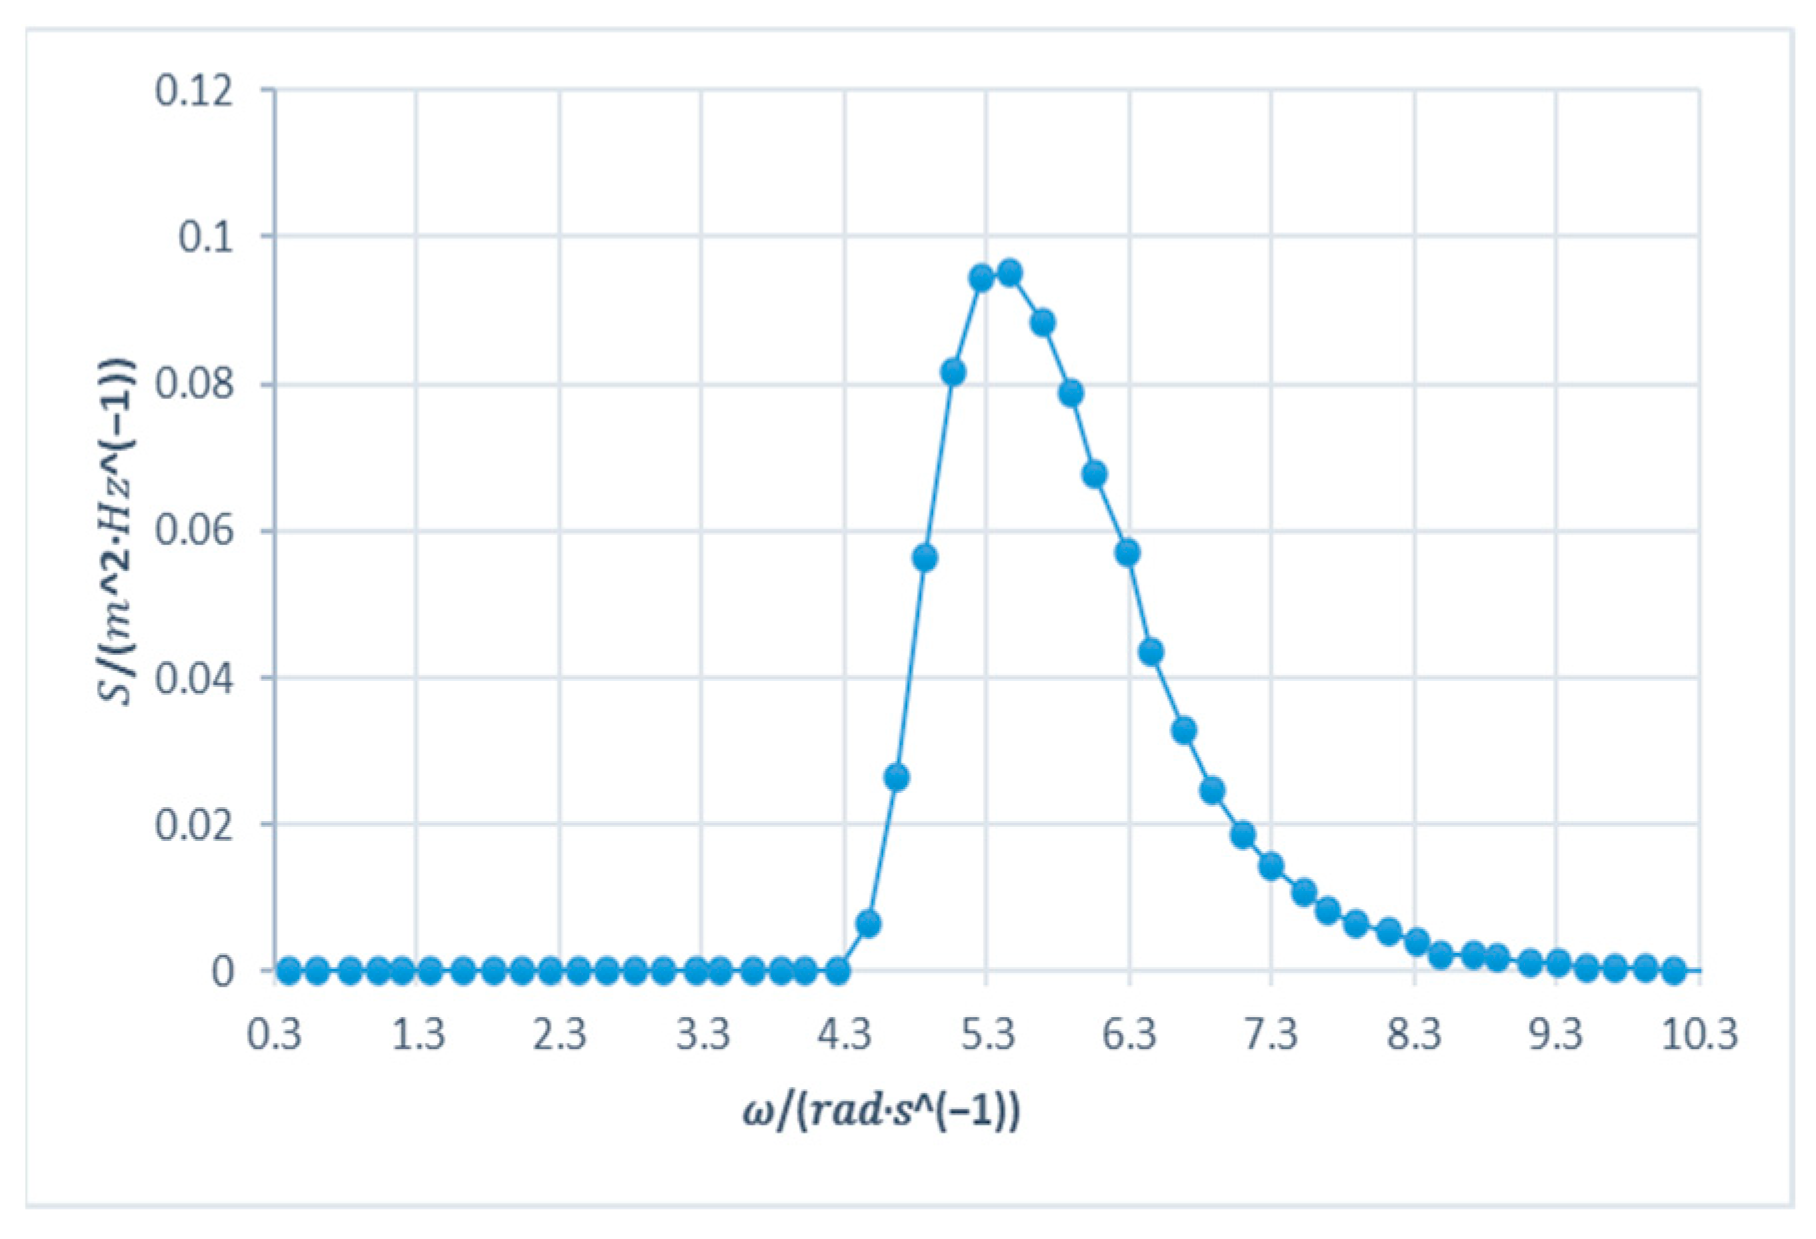
Based on the corrosion model described in Equations (8) and (9), the calculated corrosion parameters at each stage of the operation period and the infrastructure parameters of the OWT are shown in Table 2 and Table 3.

3.3. Load Data

The long-term alternating load generated by wind turbine operation on the foundation is converted into the equivalent load at the bottom of the tower. The equivalent operating load amplitude and annual cycle times are shown in Table 4.
The wave spectra under the selected typical sea conditions are shown in Figure 4 and Figure 5. For the selected sea state, the spectral energy is mainly concentrated in the angular frequency range of 0.60–9.15 rad/s.

4. Corrosion Fatigue Damage Analysis of Typical Tubular Joints

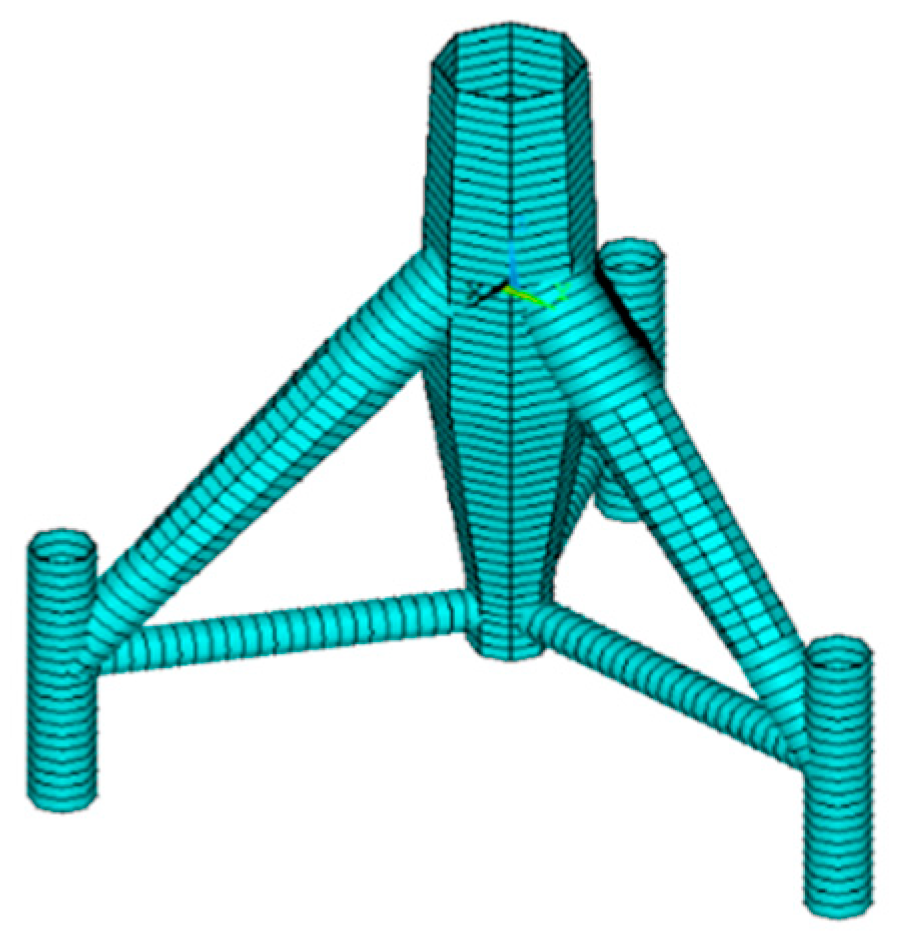
4.1. Finite-Element Modeling

The studied structural foundation form is a tripod structure with a hub height of 90 m. Through the ANSYS software, a tripod structure model is established with a PIPE59 element and then transformed into an ASAS operational model file by the ANSTOASAS command. The centralized MASS is edited in the form of additional MASS in the MASS output file to complete the creation of the model, as shown in Figure 6. In addition, this study assumes that the tripod foundation is embedded in the seabed, which imposes consolidation constraints on the model.

4.2. Fatigue Damage under Equivalent Loads of the Wind Turbine and Wave Loads

With the known equivalent load at the tower base of the wind turbine, using the S–N curve and Miner fatigue damage criterion, the fatigue damage of the foundation stress hot spot caused by the equivalent load at the bottom of the tower in each period is obtained using the finite-element software ASAS. Meanwhile, considering the importance of the influence of stress concentration coefficients on the structural ultimate fatigue bearing capacity [22,23], the relevant ones of the selected tubular joints are estimated using the recommended formulas in the offshore standard [14]. The analyzed accumulated fatigue results during the service period are shown in Figure 7.
Based on the structural fatigue analysis of the OWT, as shown in Figure 2, considering the influences of the corrosion in the operating period of different phases, the fatigue damage variation rules of typical tubular joints of the support structure under the action of equivalent fatigue loads of the wind turbine and wave loads are obtained by deterministic fatigue analysis and spectrum analysis, respectively. The results are shown in Figure 7 and Figure 8.
The change rule in Figure 7 shows that the fatigue damage of the tubular joints of the foundation structure accumulates continuously under the action of the equivalent fatigue loads of the wind turbine. Along with the deepening run-time support structure corrosion and the K-joint (selection of the pile casing and brace connection position), fatigue accumulated to a significantly larger value than those of the other two types of joints. For example, the equivalent fatigue load calculated at this time, i.e., the fatigue accumulation of this type of tubular joint under the long-term operation load, reached 0.021 when the operation period of the OWT reached 30 years. Regarding the fatigue damage accumulation of the foundation structure tubular joints caused by the wave load, as shown in Figure 8, the change rule is basically consistent with that in Figure 7. This implies that the fatigue damage of tubular joints in the foundation structure under the influence of long-term wave load and structural corrosion accumulates continuously during the operation period. The fatigue damage of K-joints at the connection position between the pile casing and brace is considerably larger than those of other selected tubular joints. Under the conditions of environmental load and corrosion, the maximum fatigue damage accumulation of the selected tubular joints during the whole operation period is 0.009.
The above comparison shows that the long-term fatigue accumulation of tubular joints under the wave load is significantly smaller than the effect of the equivalent fatigue load of the wind turbine. Therefore, the equivalent long-term fatigue load generated by the wind turbine operation is the control load of the ultimate fatigue-bearing capacity of the foundation structure of the OWT.

4.3. Fatigue Damage under the Combined Equivalent Load of the Wind Turbine and Wave Load

Using the direct formula method, based on the calculation results in Figure 7 and Figure 8, the fatigue damage variation rule of the tubular joints of the foundation structure during operation under the combined action of the equivalent fatigue load of the wind turbine and wave load was obtained, as shown in Figure 9. Under the combined action of the wind turbine operating load, wave load, and structural corrosion factors, the fatigue damage of tubular joints in the foundation structure accumulates rapidly during the operation period. The fatigue accumulation of K-joints at the selected connection position between the pile casing and brace is most significant, reaching 0.05. However, the fatigue damage accumulation and change rule of Y-joints and T-joints at the connection position of the main cylinder with the upper and lower inclined braces are basically the same, as shown in Figure 9.
Based on the structural stress response of the flange surface equivalent load and sea condition fatigue stress spectrum σ ( ω ) obtained by the stress transfer function T ( ω ) and wave spectrum S ( ω ), using the method of equal-amplitude loading, the run-time infrastructure tubular joint change law of fatigue damage was obtained under the combined action of the equivalent fatigue wind turbine loads and wave loads, as shown in Figure 10. With the increase in the OWT operating period, the fatigue damage of tubular joints increases and accumulates under the influence of corrosion factors, and the fatigue accumulation of tubular joints increases under the combined action of the equivalent fatigue wind turbine load and wave load. The fatigue accumulation of the k-type tubular joint is the largest, being significantly larger than those of the other two types of tubular joint. When the OWT operates for 30 years, the fatigue accumulation of this type of tubular joint can reach 0.077 under the combined action of the equivalent fatigue load and wave load calculated using Formula (7).
The total fatigue damage of the OWT foundation structure under the combined action of the equivalent fatigue wind turbine load and wave load is obtained by the simple addition method, which implies that the fatigue damage caused by the equivalent fatigue wind turbine load and wave load alone is added directly, as shown in Figure 11. The cumulative change rule of the long-term fatigue damage of tubular joints under the combined action of the equivalent wind turbine load and wave load is basically consistent with that in Figure 10. The K-joint fatigue of the selected pile sleeve-type pipe connected to the brace position accumulated to a significant value, reaching 0.03. However, the fatigue damage accumulation of Y- and T-shaped tubular joints at the connection positions of the main cylinder and upper and lower inclined braces is slightly different, as shown in Figure 11.
According to the comparison of the cumulative fatigue results obtained by different calculation methods for the OWT infrastructure under the combined action of the equivalent wind turbine load and wave load, as shown in Figure 9, Figure 10 and Figure 11, the values obtained by the equal-amplitude load method are largest, followed by the results obtained by the direct formula method, while the values obtained by the simple addition method are smallest. For example, the estimated structural fatigue damage at location ② using the direct formula, equal-amplitude load and simple addition methods are about 0.04174, 0.06692 and 0.02696, when the OWT service period reached 20 years, as listed in Table 5. So, the values of the accumulated fatigue damage obtained using the simple addition method are considerably smaller than the accumulated values obtained by the constant amplitude load method, which is only 0.03062 at the same tubular joint in Table 5. However, the variation trends of the three results are consistent when the fatigue accumulation of the tubular joints in the infrastructure is affected by corrosion factors in different operating periods. It can be observed that the longer the corrosion period, the more obvious the cumulative fatigue damage obtained by the three methods. For example, the fatigue damage at Location ① obtained by direct formula method in 10, 20, and 30 years of corrosion period is 0.01295, 0.01602, and 0.01788, respectively.

5. Conclusions

In this study, based on the two-parameter Weibull model, the corrosion model of the OWT’s structure during operation was established. The fatigue damage accumulation of tubular joints under the equivalent fatigue load of the wind turbine and wave load was calculated using the deterministic fatigue analysis method and spectral fatigue analysis method, respectively. Furthermore, the cumulative change rule of the fatigue damage of the tubular joints of foundation structures, under the combined action of the environmental load and corrosion factors, was obtained by the direct formula method. The results of this study can be summarized as follows:
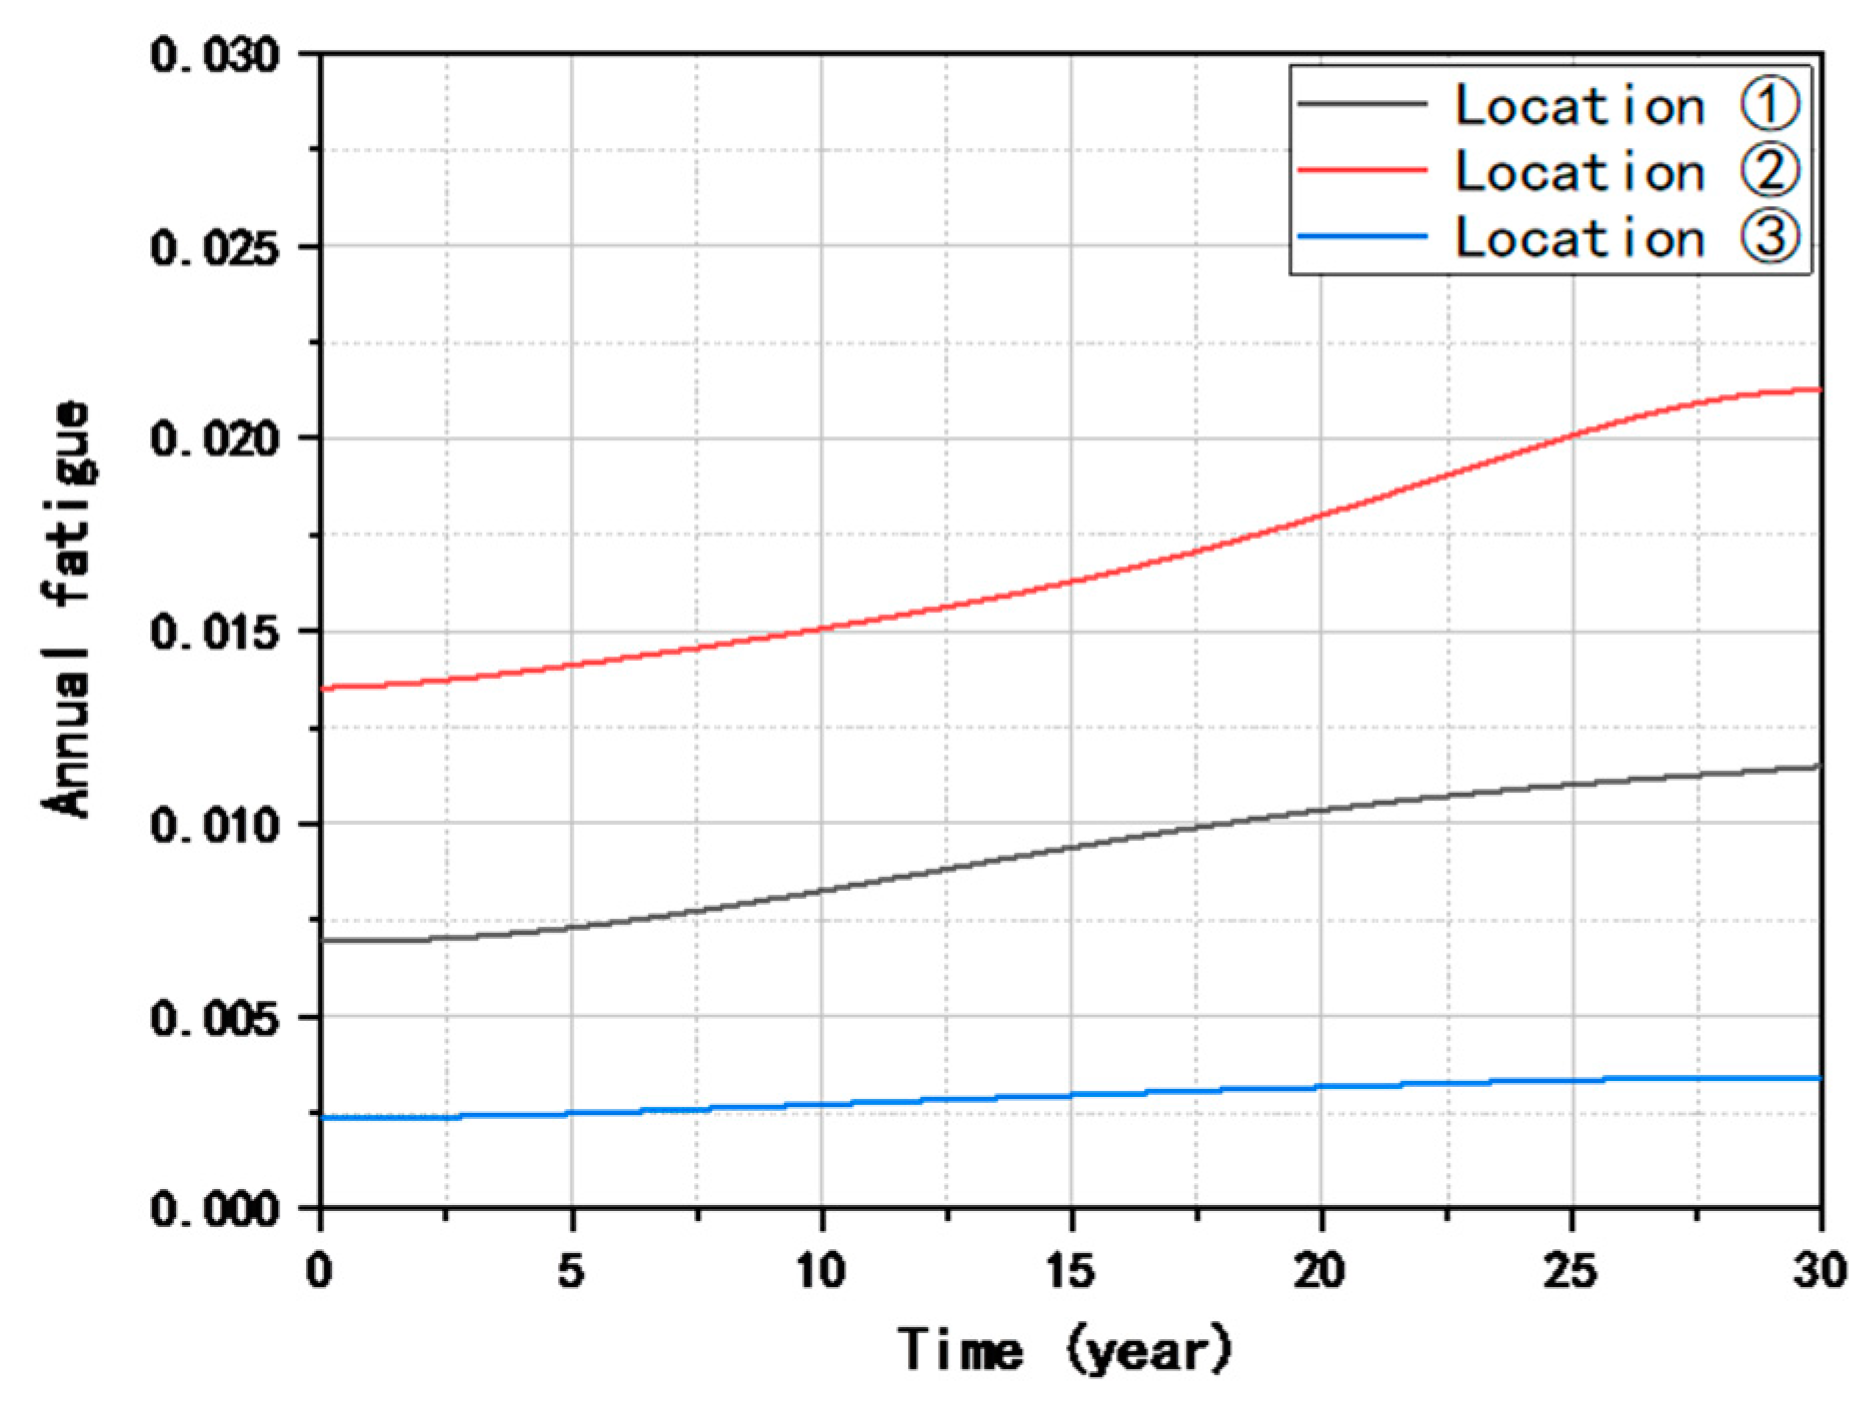
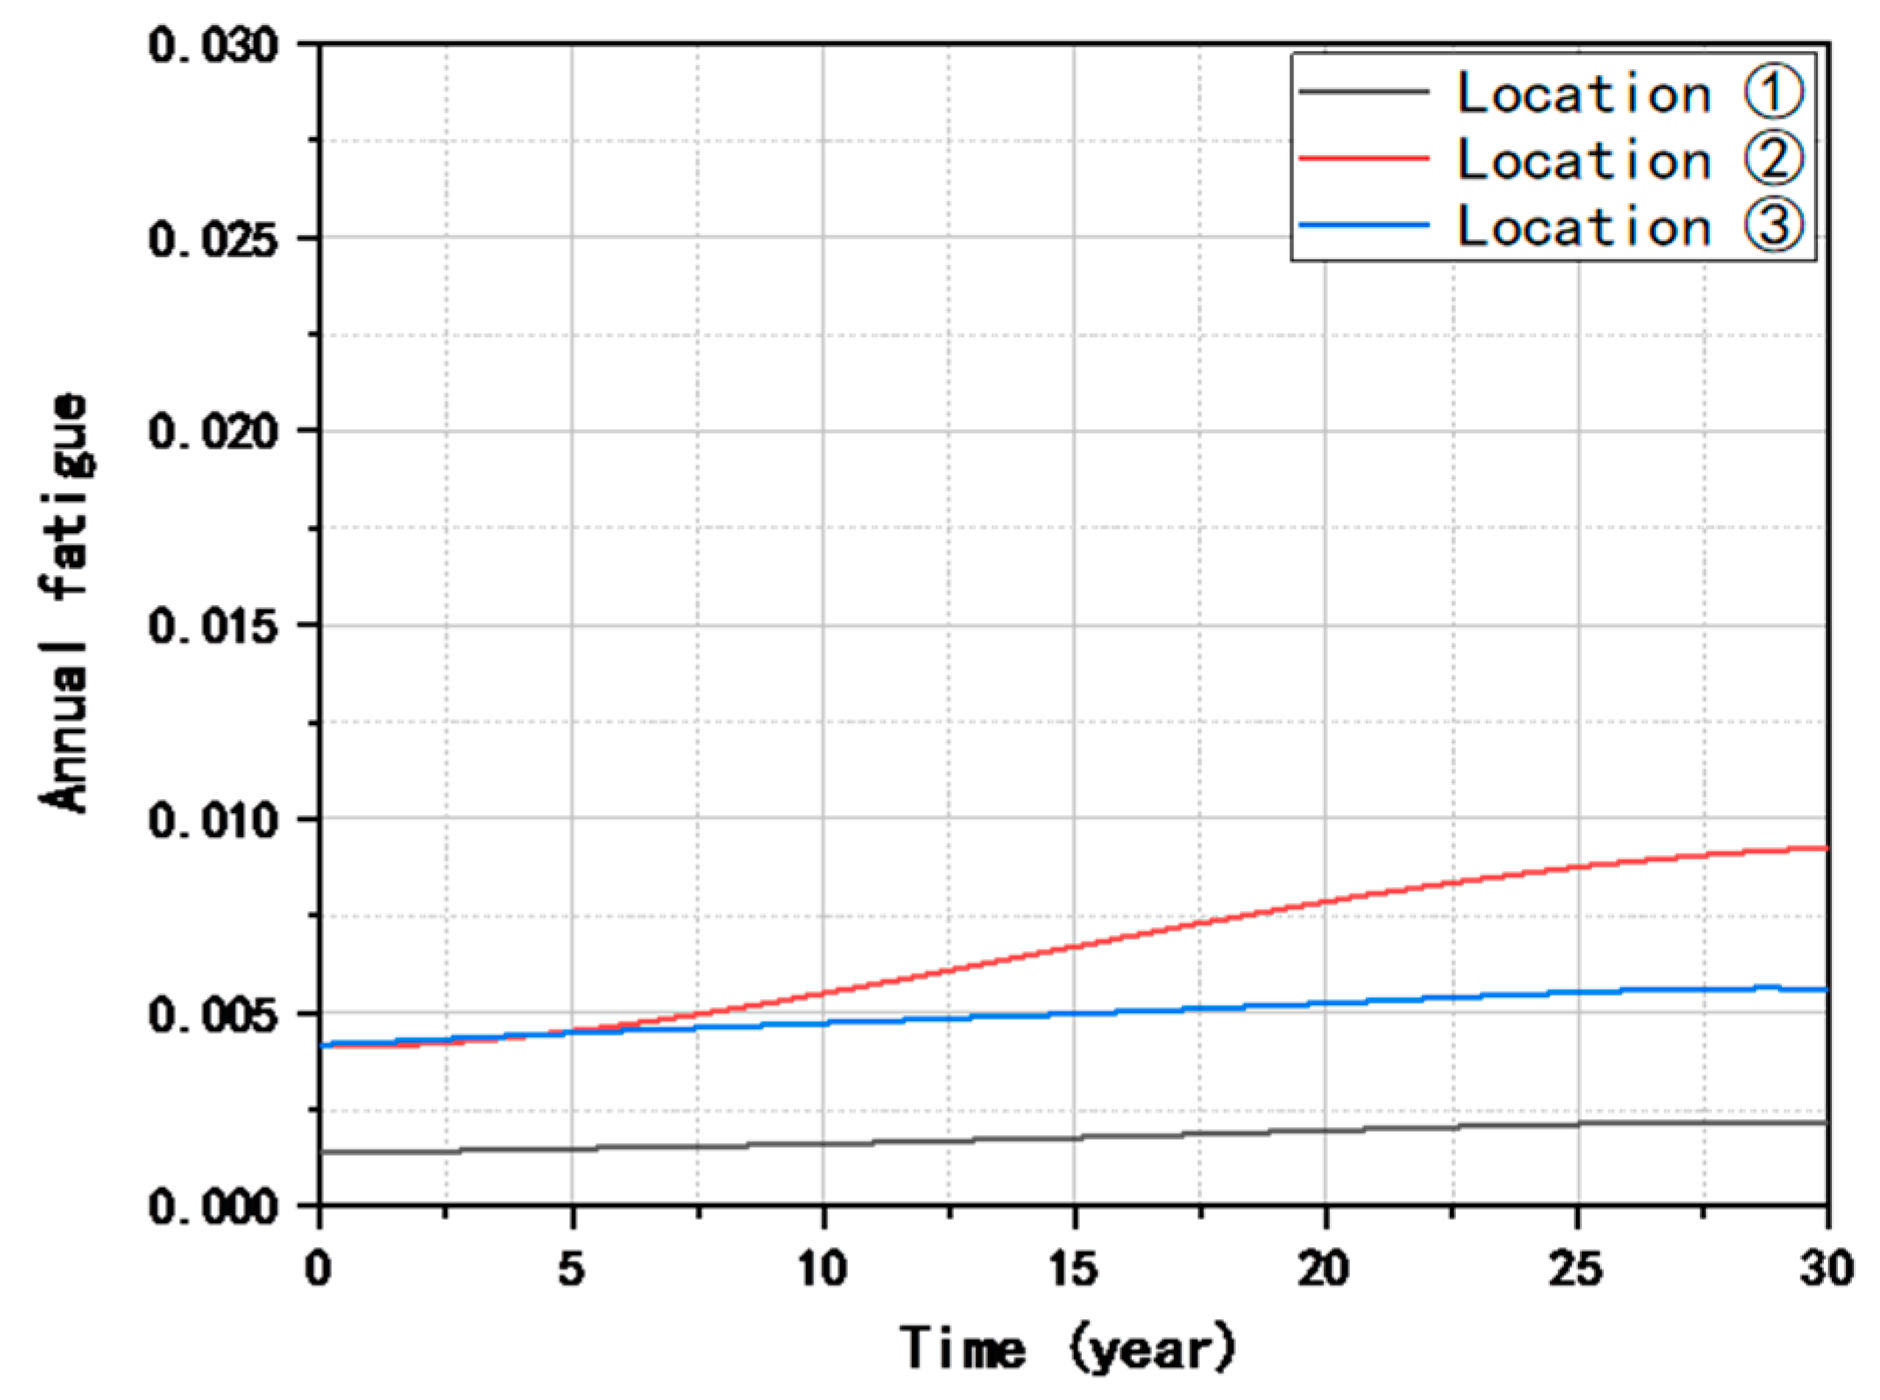
  • The cumulative fatigue damage of tubular joints in the foundation structure under the long-term wind turbine operating load, i.e., the equivalent fatigue wind turbine load, is considerably larger than the effect of the wave load, i.e., the wind turbine operating load is the main load causing the fatigue damage of the OWT structure.
  • Under the joint influence of the long-term wind turbine operating load, wave load, and corrosion factors, the tubular joint damage accumulates continuously during the operation period. Compared with other types of tubular joints, the K-joint at the connection between the pile casing and strut is most significant. This is because it is considered as the control tubular joint for checking the ultimate fatigue-bearing capacity of the foundation structure.
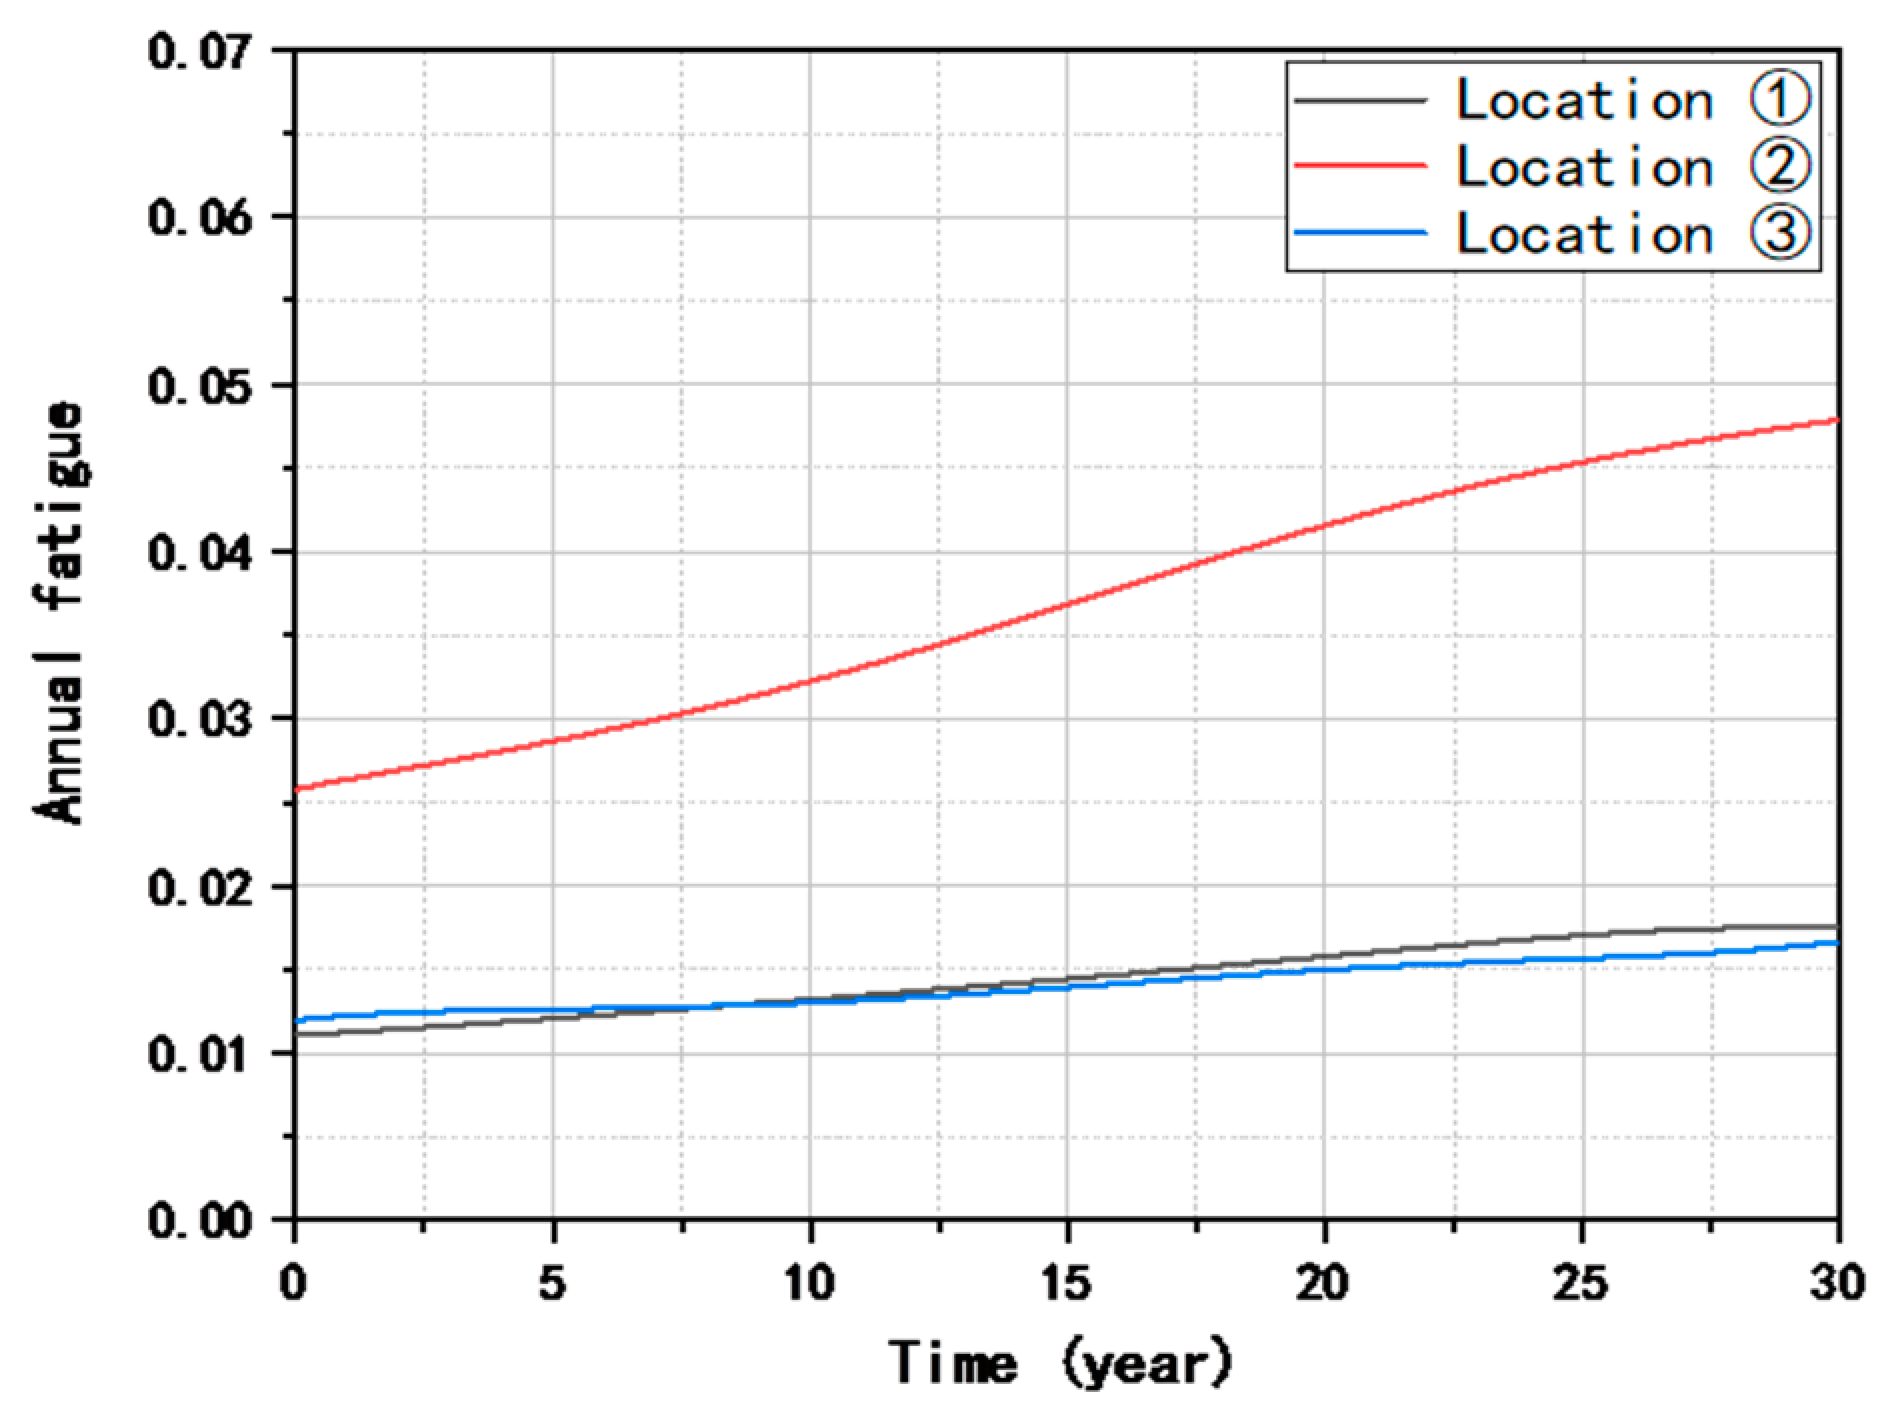
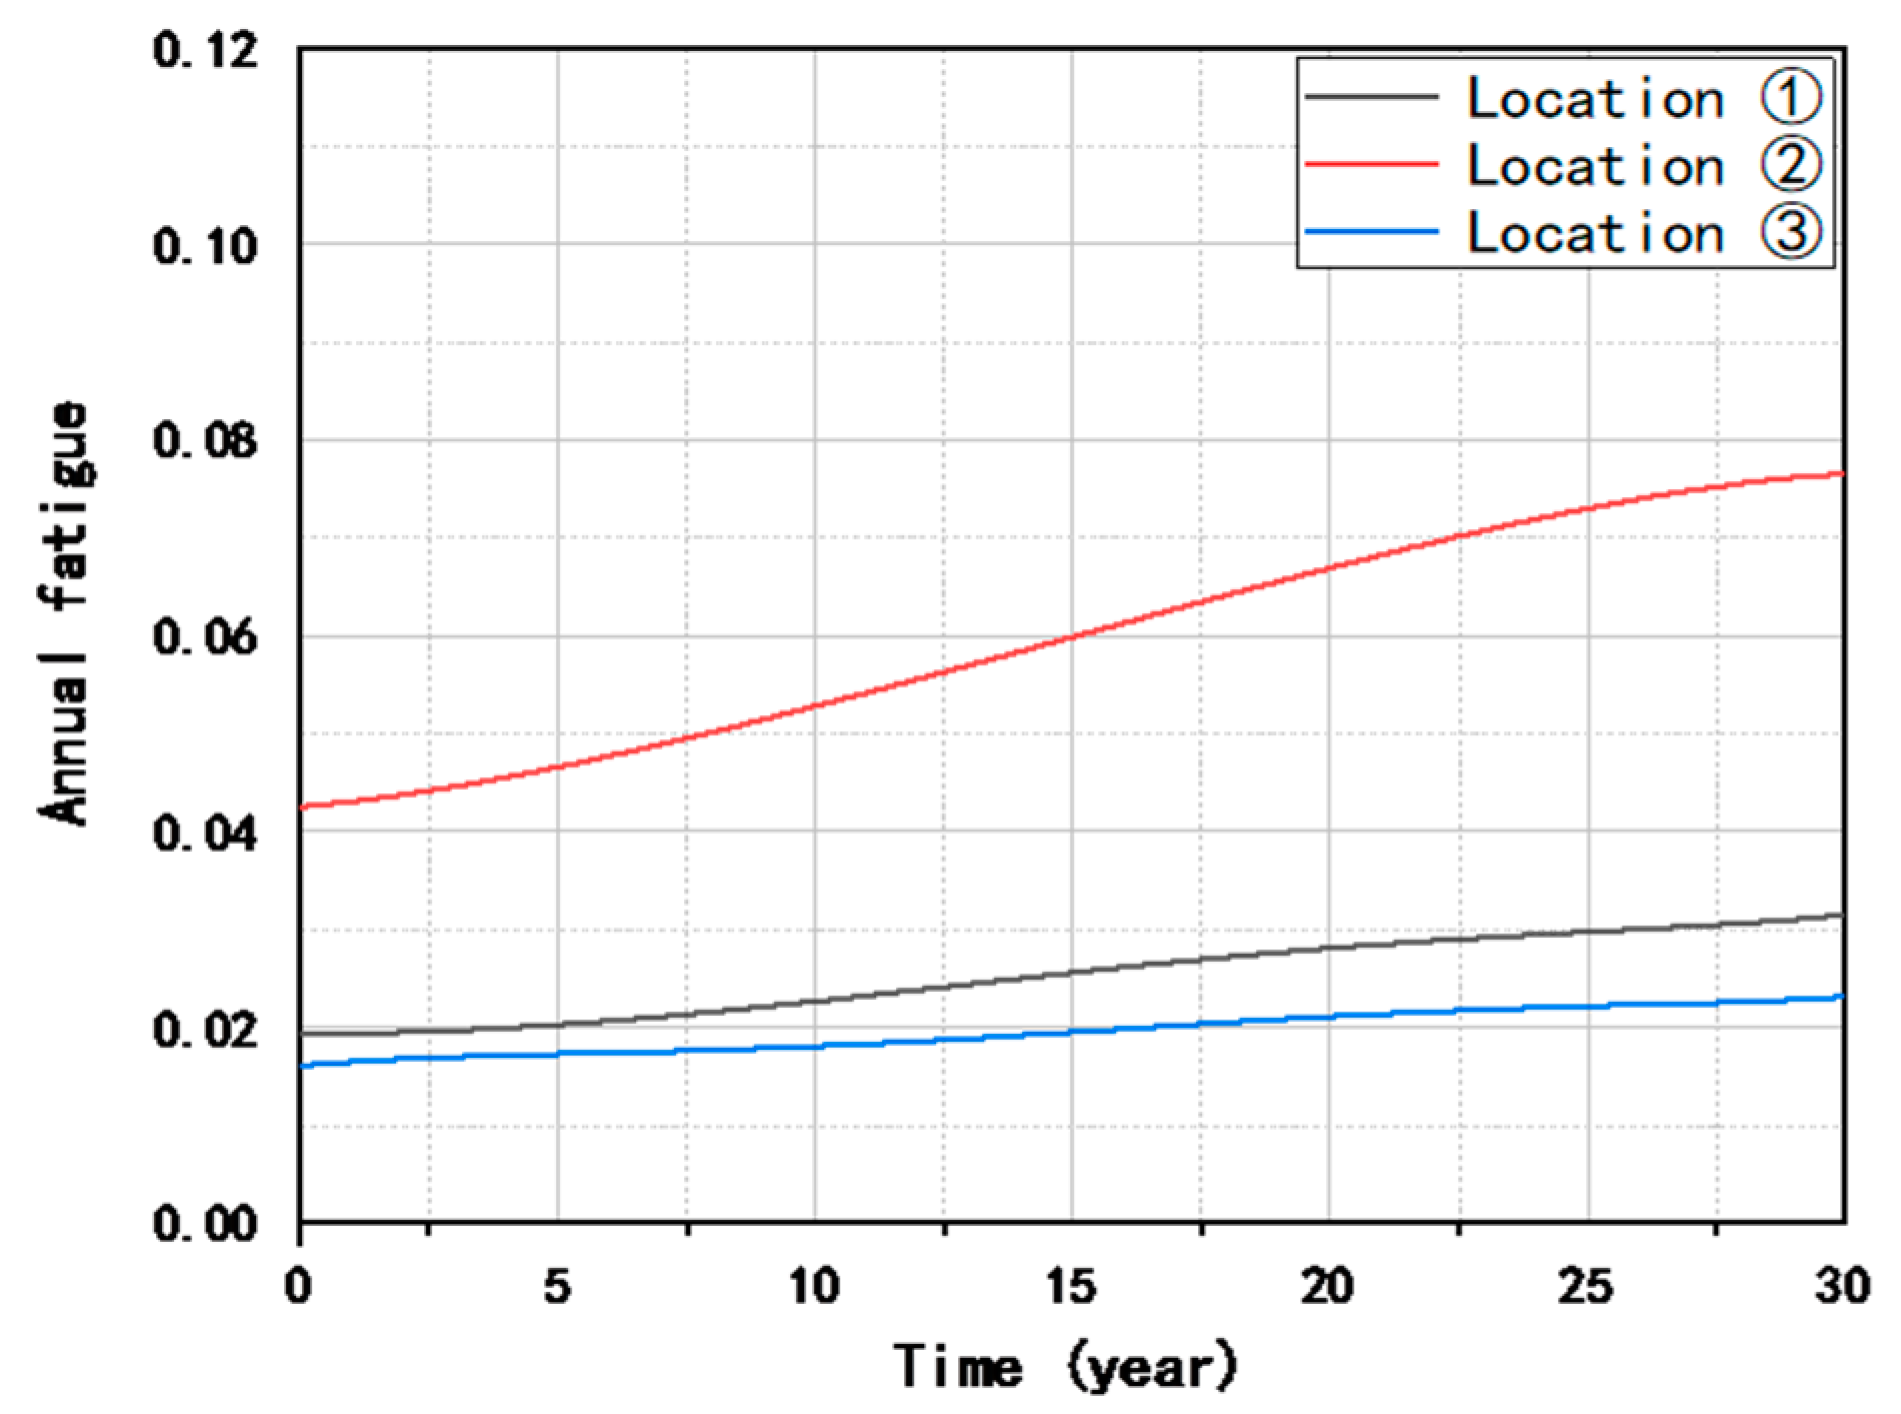
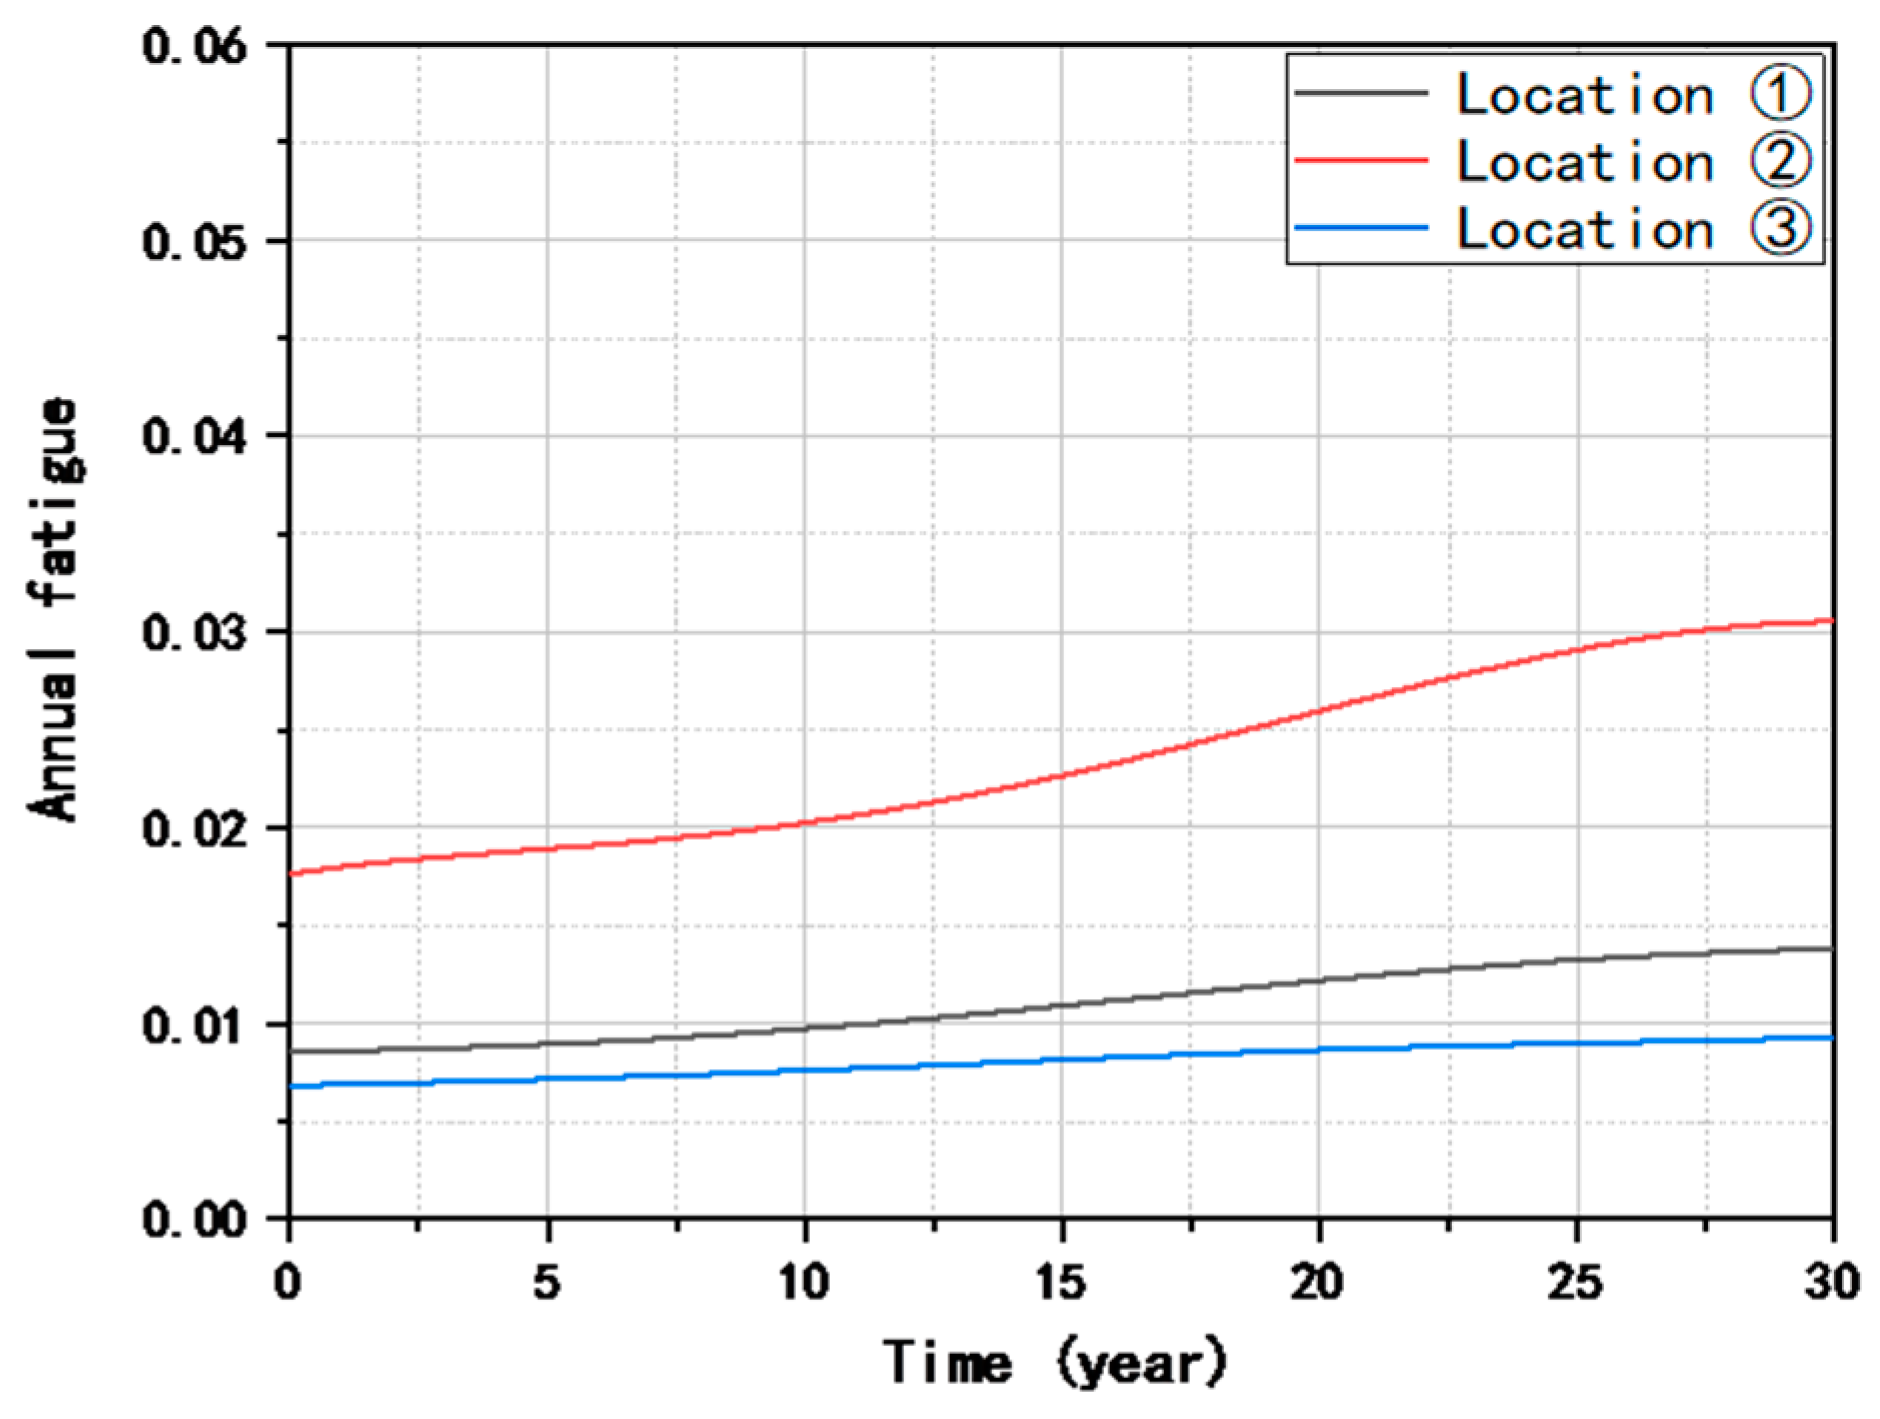
  • The fatigue accumulation results of the OWT foundation structure under the combined action of equivalent wind turbine load and wave load deviate for different calculation methods. The fatigue accumulation results of the OWT foundation structure under the combined action of the equivalent wind turbine load and wave load are largest for the equal-amplitude load method, followed by those obtained by the direct formula method and simple addition method.
  • Considering the corrosion factors affecting the fatigue accumulation of the tubular joints in the basic structure in different operating periods, the three results have the same variation trend. They accumulate and increase with the increase in the wind turbine run-time. Therefore, the selection of the calculation method in the design of the infrastructure should consider the actual engineering situation. It should consider not only the importance of the safety of the OWT infrastructure, in order to avoid the over-estimation of the fatigue performance caused by the calculation result being smaller than the real value, but also the economic cost, in order to avoid economic waste caused by the calculation result being larger than the real value.
  • Under the influence of the above complex environmental factors, the fatigue damage accumulation of the tubular joints of the foundation structure increases significantly. However, when the operation period reaches 30 years, the maximum fatigue damage accumulation of the tubular joints of the foundation structure is only 0.07, which is significantly smaller than the ultimate fatigue-bearing capacity of the tubular joints. The structural fatigue-bearing capacity still has a high degree of safety redundancy. This implies that, in the initial stage of offshore wind farm construction, the OWT infrastructure design method used in China is relatively conservative.
  • At the present and subsequent stages of OWT infrastructure design, it is necessary to employ a more refined design method to reduce the cost of infrastructure design and construction. From the perspective of ultimate fatigue-bearing capacity, the evaluated OWT infrastructure is still in service, and thus, it is necessary to carry out a comprehensive evaluation of the bearing capacity of the foundation structure, propose reasonable safety protection strategies, prolong the service life, and improve the economic benefits of offshore wind farms.

Author Contributions

Conceptualization, Y.L. and X.L.; survey and methodology, W.W.; software, Y.L.; validation, Y.Z. and W.W.; formal analysis, Y.L.; investigation, X.L.; resources, B.W.; data curation, B.W.; writing—original draft preparation, Y.Z. and W.W.; writing—review and editing, Y.L., W.W. and Y.Z.; visualization, Y.L.; supervision, Y.L. and X.L.; project administration, Y.L. and B.W.; funding acquisition, X.L. All authors have read and agreed to the published version of the manuscript.

Funding

The author acknowledges the support from the National Natural Science Foundation of China (Grant No. 51909238, 52071301) and Zhejiang Provincial Natural Science Foundation of China (Grant No. LHY21E090001).

Institutional Review Board Statement

Not applicable.

Informed Consent Statement

Not applicable.

Data Availability Statement

The data presented in this study are available on request from the corresponding author.

Conflicts of Interest

The authors declare no conflict of interest.

References

  1. Shi, Z.; Wang, C.; Li, Q. Key issues in the development of China’s offshore wind power in the 14th Five-year Plan (Chinese). China Electr. Power 2020, 53, 8–11. [Google Scholar]
  2. Ren, Y.; Vengatesan, V.; Shi, W. Dynamic Analysis of a Multi-column TLP Floating Offshore Wind Turbine with Tendon Failure Scenarios. Ocean. Eng. 2022, 245, 110472. [Google Scholar] [CrossRef]
  3. Valamanesh, V.; Myers, T.; Arwade, R. Multivariate analysis of extreme metocean conditions for offshore wind turbines. Struct. Saf. 2015, 55, 60–69. [Google Scholar] [CrossRef]
  4. Peng, Z.; Zhao, H.; Li, X. New ductile fracture model for fracture prediction ranging from negative to high stress triaxiality. Int. J. Plast. 2021, 145, 103057. [Google Scholar] [CrossRef]
  5. Liu, Q.; Wei, K. Structural Reliability Analysis of Offshore Wind Turbine Jacket considering environmental corrosion. Acta Energ. Sol. Sin. 2021, 42, 394–400. [Google Scholar]
  6. Mehmanparast, A.; Vidament, A. An accelerated corrosion-fatigue testing methodology for offshore wind applications. Eng. Struct. 2021, 240, 112414. [Google Scholar] [CrossRef]
  7. Guo, H.; Wei, H.; Yang, D.; Liu, Y.; Wang, Z.; Tian, J. Experimental Study on Fatigue Performance of Q690 High-Strength Steel under Marine Corrosion Environment. China Civ. Eng. J. 2021, 54, 37–45. [Google Scholar]
  8. Han, Q.; Wang, X.; Lu, Y.; Qi, L. Corrosion Fatigue Life Assessment Method of Cast Steel and Butt Weld Based on Three-parameter Weibull Distribution Model. J. Build. Struct. 2021, 42, 213–220. [Google Scholar]
  9. Du, J.; Wang, H.; Wang, S.; Song, X.; Wang, J.; Chang, A. Fatigue damage assessment of mooring lines under the effect of wave climate change and marine corrosion. Ocean. Eng. 2020, 206, 107303. [Google Scholar] [CrossRef]
  10. Xie, M. Corrosion Fatigue Life Analysis of Tower of Offshore Wind Turbine; Lanzhou University of Technology: Lanzhou, China, 2016. [Google Scholar]
  11. Liao, X.; Qiang, B.; Wu, J.; Yao, C.; Wei, X.; Li, Y. An improved life prediction model of corrosion fatigue for T-welded joint. Int. J. Fatigue 2021, 152, 106438. [Google Scholar] [CrossRef]
  12. Wang, Y.; Shi, W.; Michailides, C.; Wan, L.; Kim, H.; Li, X. WEC shape effect on the motion response and power performance of a combined wind-wave energy converter. Ocean. Eng. 2022, 250, 111038. [Google Scholar] [CrossRef]
  13. Zhao, Z.; Shi, W.; Wang, W.; Qi, S.; Li, X. Dynamic analysis of a novel semi-submersible platform for a 10 MW wind turbine in intermediate water depth. Ocean. Eng. 2021, 237, 109688. [Google Scholar] [CrossRef]
  14. DNV. DNVGL-RP-C203; Fatigue Design of Offshore Steel Structures. DNV: Bærum, Norway, 2016.
  15. IEC 61400-1; Wind Turbines. Part 1: Design Requirements. IEC: Geneva, Switzerland, 2009.
  16. Wen, S.; Yu, Z. Wave Theory and Computational Principles (Chinese); Science Press: Beijing, China, 1984; pp. 430–437. [Google Scholar]
  17. IEC 61400-3; Wind Turbines. Part3: Design Requirements for Offshore Wind Turbines. IEC: Geneva, Switzerland, 2009.
  18. Wu, Z.; Jia, Y. Effect analysis of prestress on frequency by Equivalent Load Method. Concrete 2012, 4, 3. [Google Scholar]
  19. Qin, S.; Cui, W.; Shen, K. A Nonlinear Corrosion Model for Time-varying Reliability Analysis of Ship Structures. J. Ship Mech. 2003, 7, 94–103. [Google Scholar]
  20. Hao, Z. Characteristics and Influencing Factors of Marine Carbonate Systems in the Yellow Sea and Bohai Sea; Ocean University of China: Qingdao, China, 2015. [Google Scholar]
  21. Wu, L.; Fan, X.; Zhang, X.; Zhang, Y. Pilot scale study of membrane desalination in Bohai Bay. Water Treat. Technol. 2013, 39, 104–106. [Google Scholar]
  22. Matti, F.; Mashiri, F. Design formular for predicting the stress concentration factors of concrete-filled T-joints under out-of-plane bending. Structures 2020, 28, 2073–2095. [Google Scholar] [CrossRef]
  23. Zavvar, E.; Hectors, K.; De, W. Stress concentration factors of multi-planar tubular KT-joints subjected to in-plane bending moments. Mar. Struct. 2021, 78, 103000. [Google Scholar] [CrossRef]
Figure 1. Double-slope S–N curves of tubular joints under air and sea environments.
Jmse 10 01011 g001
Figure 2. Fatigue analysis procedures of the OWT substructure.
Jmse 10 01011 g002
Figure 3. Selected typical tubular joints of the OWT tripod substructure.
Jmse 10 01011 g003
Figure 4. JONSWAP spectrum at Hs = 0.7 m, Tz = 1.55 s.
Jmse 10 01011 g004
Figure 5. JONSWAP spectrum at Hs = 0.7 m, Tz = 4.55 s.
Jmse 10 01011 g005
Figure 6. Finite-element model of the tripod foundation.
Jmse 10 01011 g006
Figure 7. Accumulated fatigue damage of tubular joints under equivalent fatigue loads.
Jmse 10 01011 g007
Figure 8. Accumulated fatigue damage of tubular joints under wave loads.
Jmse 10 01011 g008
Figure 9. Accumulated fatigue damage of tubular joints under the combined loads obtained by the direct formula method.
Jmse 10 01011 g009
Figure 10. Accumulated fatigue damage of tubular joints under the combined loads obtained by the equal-amplitude load method.
Jmse 10 01011 g010
Figure 11. Accumulated fatigue damage of tubular joints under the combined loads obtained by the simple addition method.
Jmse 10 01011 g011
Table 1. S–N curve parameters of tubular joints in a seawater environment.
lg a ¯ mRange of Valid Cycles Thickness   Index   k
11.7643N < 1060.25
15.6065N > 1060.25
Table 2. Average corrosion rate of the steel structure.
PartAverage Corrosion Rate (mm/Year)
Atmospheric area0.05–0.10
Unprotected splash area0.40–0.50
Water level fluctuation area, underwater area0.12
Under the mud area0.05
Table 3. Corrosion parameters.
PartRange (m)Total Corrosion (mm)
10 years20 years30 years
Atmospheric area>6.3380.931.752.75
Splash area2.12~6.3382.206.2010.2
Tide zone−2.72~2.120.661.863.06
Underwater area−20.50~−2.720.661.863.06
Under the mud area~−20.500.501.001.50
Table 4. Equivalent fatigue loads with respect to the tower base.
Equivalent Fatigue Load AmplitudeAnnual Cycle
Mx(kN·m)My(kN·m)Mz(kN·m)Fx(kN)Fy(kN)Fz(kN)
0000018.9252.50 × 107
00041.68018.9251.82 × 107
00105341.6891.3518.9251.26 × 107
69000105341.6891.3518.9255.30 × 106
69003165.5105341.6891.3518.9254.96 × 106
69003165.5210641.6891.3537.851.84 × 106
69003165.5210683.35182.737.856.90 × 105
13,8006330210683.35182.756.753.30 × 105
13,80063303159125.05182.756.751.64 × 105
13,80094954212125.05274.0556.755.50 × 104
20,70094954212166.7274.0575.73.63 × 104
20,70012,6655265208.4274.0575.71.41 × 104
20,70015,8305265208.4365.494.66.05 × 103
27,60515,8305265250.1365.494.63.33 × 103
34,50518,9956320250.1456.75138.551.14 × 103
41,40518,9957370291.75548132.453.42 × 102
41,40522,1608425333.45548132.451.43 × 102
Table 5. The comparison of fatigue damage obtained by different methods.
MethodLocationFatigue Damage
10 years20 years30 years
the direct
formula method
0.012950.016020.01788
0.031710.041740.04816
0.013440.015390.01649
the equal-amplitude
load method
0.022510.027890.03116
0.051760.066920.07651
0.018350.021120.02267
the simple
addition method
0.009860.012240.01369
0.021180.026960.03062
0.007390.008470.00908
Publisher’s Note: MDPI stays neutral with regard to jurisdictional claims in published maps and institutional affiliations.

