1. Introduction
Offshore wind energy has recently been paid wider attention. The Floating Offshore Wind Turbine (FOWT), equipment for exploiting offshore wind energy, has developed rapidly. By 2050, the energy that offshore wind can provide will be equivalent to that of offshore oil resources, the production of which will shrink by 51% compared to 2019 [
1]. In 2021, new installations of offshore wind turbines accounted for 22.5% of the total new installations of wind turbines. The global installed capacity of offshore wind turbines was 57 gigawatt (GW), accounting for 7% of worldwide total installed capacity in 2021 [
2]. With the continuous utilization of offshore wind energy, offshore wind farms are gradually developing from shallow waters to deep waters in order to fully exploit abundant offshore wind resources [
3]. Floating offshore wind energy is likely to expand rapidly to meet the world’s capacity needs [
2]. Due to the high cost of construction, transportation, installation, and maintenance of the offshore wind turbines, offshore wind turbines are gradually showing a trend towards higher power and larger scale to reduce the cost of wind power.
Chuang et al. [
4] studied the impact of second-order hydrodynamic loads on the dynamic performance of the National Renewable Energy Laboratory (NREL)’s 5 MW FOWT. Their results showed that when affected by the second-order slow-drift wave force, the motion of the offshore wind turbine increased significantly in the wave propagation direction, with a consequent increase in the mooring line’s tension. Zhao et al. [
5] investigated the effect of second-order wave loads on a 10 MW and 5MW floating semi-submersible wind turbines, from aspects of the structure and hydrodynamic performance. The results showed that the low-frequency motions of the wind turbine became more significant and the mooring line tension was noticeable changed when the difference-frequency wave loads were considered. The sum-frequency wave loads markedly affected the structural responses. In addition, the effect of second-order wave loads on the 10 MW floating wind turbine was more prominent than on the 5 MW turbine. Liu et al. [
6] made a coupling analysis of a 15 MW floating wind turbine in multiple severe environmental conditions and considered the effect of difference-frequency wave loads. The results showed that compared with a moderate sea state, the impact of difference-frequency wave forces on the motion responses and mooring line tension was more significant in a typhoon sea state.
Investigating the floating foundations of offshore wind turbines, Zhou et al. [
7] performed a sensitivity analysis on the dimension parameters of four-column and Y-shaped semi-submersible foundations. Based on the results of the sensitivity analysis, the dimension parameter optimization of the two semi-submersible foundations was calculated with the aid of the genetic algorithm. The results of the sensitivity analysis showed that the draft depth, column radius, and column spacing affected the first-order hydrodynamic response of the floating foundation. Ren et al. [
8] studied the dynamic performance of a Tension Leg Platform (TLP) FOWT in the event of tendon rupture. The results show that failure of the tendon affected the heave, pitch, and roll responses of the FOWT. In addition, the intact tendon adjacent to the ruptured tendon was subjected to double the average tensile force. Yi et al. [
9] investigated the configuration parameters of different floating foundations of 5 MW offshore wind turbines and analyzed their dynamic responses. The results showed that for the OC4-DeepCwind semi-submersible foundation, the column diameter and thickness of the base column affected the wave loads on the floating foundation. Wei et al. [
10] designed a new type of semi-submersible foundation for a 5 MW wind turbine, composed of a large circular ballast tank at the bottom and three outer columns connected to the central column by the pontoons at the water plane. The stability and hydrodynamic performance of this new floating foundation were analyzed, and the time-domain responses of the 5 MW offshore with this new foundation were investigated under various environmental conditions. The investigation showed that the 5 MW offshore wind turbine with this new foundation demonstrated good stability and heave motion performance. Li et al. [
11] designed a floating foundation for a 5 MW offshore wind turbine in shallow water. The foundation consists of an upper buoyancy column, an active ballast column, and a concrete ballast column below, connected centrally by truss members and arranged with two heave plates. Wang et al. [
12] proposed a combined system consisting of a semi-submersible offshore wind turbine and a torus-type wave energy converter (WEC). They investigated the effect of different WEC shapes on the motion response and power performance of the combined energy system, and the hydrodynamic performance of the combined wind-wave energy converters was studied. The results showed that the combined energy converter with a concave WEC offered a superior dynamic response and larger power production. Cao et al. [
13] carried out hydrodynamic analysis for a 10 MW offshore wind turbine using their newly designed floating foundation. They investigated the effects of different calculation methods for second-order wave forces on the dynamic responses of the wind turbine. The results showed that the pitch resonance responses calculated by the Newman approximation method and full QTF method were significantly different from the surge resonant response. The Newman approximation method was less accurate for calculating second-order wave loads.
There have been many studies on the performance optimization of the floating foundations for FOWTs. Wei and Zhao [
14] utilized a bidirectional tuned liquid column damper (BTLCD) combined with a tuned mass damper (TMD), referred to as a bidirectional tuned liquid column mass damper (BTLCMD), to reduce the motion responses of a FOWT. The results showed that the BTLCMD can effectively decrease the pitch, roll motion, and tower base loads of the floating wind turbine. Aboutalebi et al. [
15] proposed a square-shaped platform barge with four oscillating water columns (OWCs) and applied a switching control strategy to reduce the oscillations of the FOWT. The results showed that the dynamic performance of the barge foundation could be optimized by controlling the OWCs’ valves for different wave periods. Specifically, based on response amplitude operators (RAOs) analysis, the barge foundation with the OWC valves open had better dynamic performance in the case of the shorter wave periods (<12.35 s), and the performance of the standard barge and the closed-OWCs-based barge foundations were better when the wave period was larger than 12.35 s. Haji et al. [
16] proposed a symbiotic energy-harvesting system combining the FOWT with an OC3 spar platform and a wave energy converter (WEC). The results showed that the motion resistance of the FOWT increased with a larger radius of WECs at larger wave frequencies, leading to reduction of the lateral responses. Accordingly, larger WECs can decrease the tower’s lifetime fatigue stress; the WECs decreased the tower fatigue stress of the FOWT when their radii were larger than 8 m.
The above studies tended to focus on optimization of the foundation for a small-scale (5 MW) offshore wind turbine. Offshore wind turbines have shown a development trend towards a larger scale, but few researchers to date have aimed at improving the floating foundations which currently support large-scale offshore wind turbines. Allen et al. [
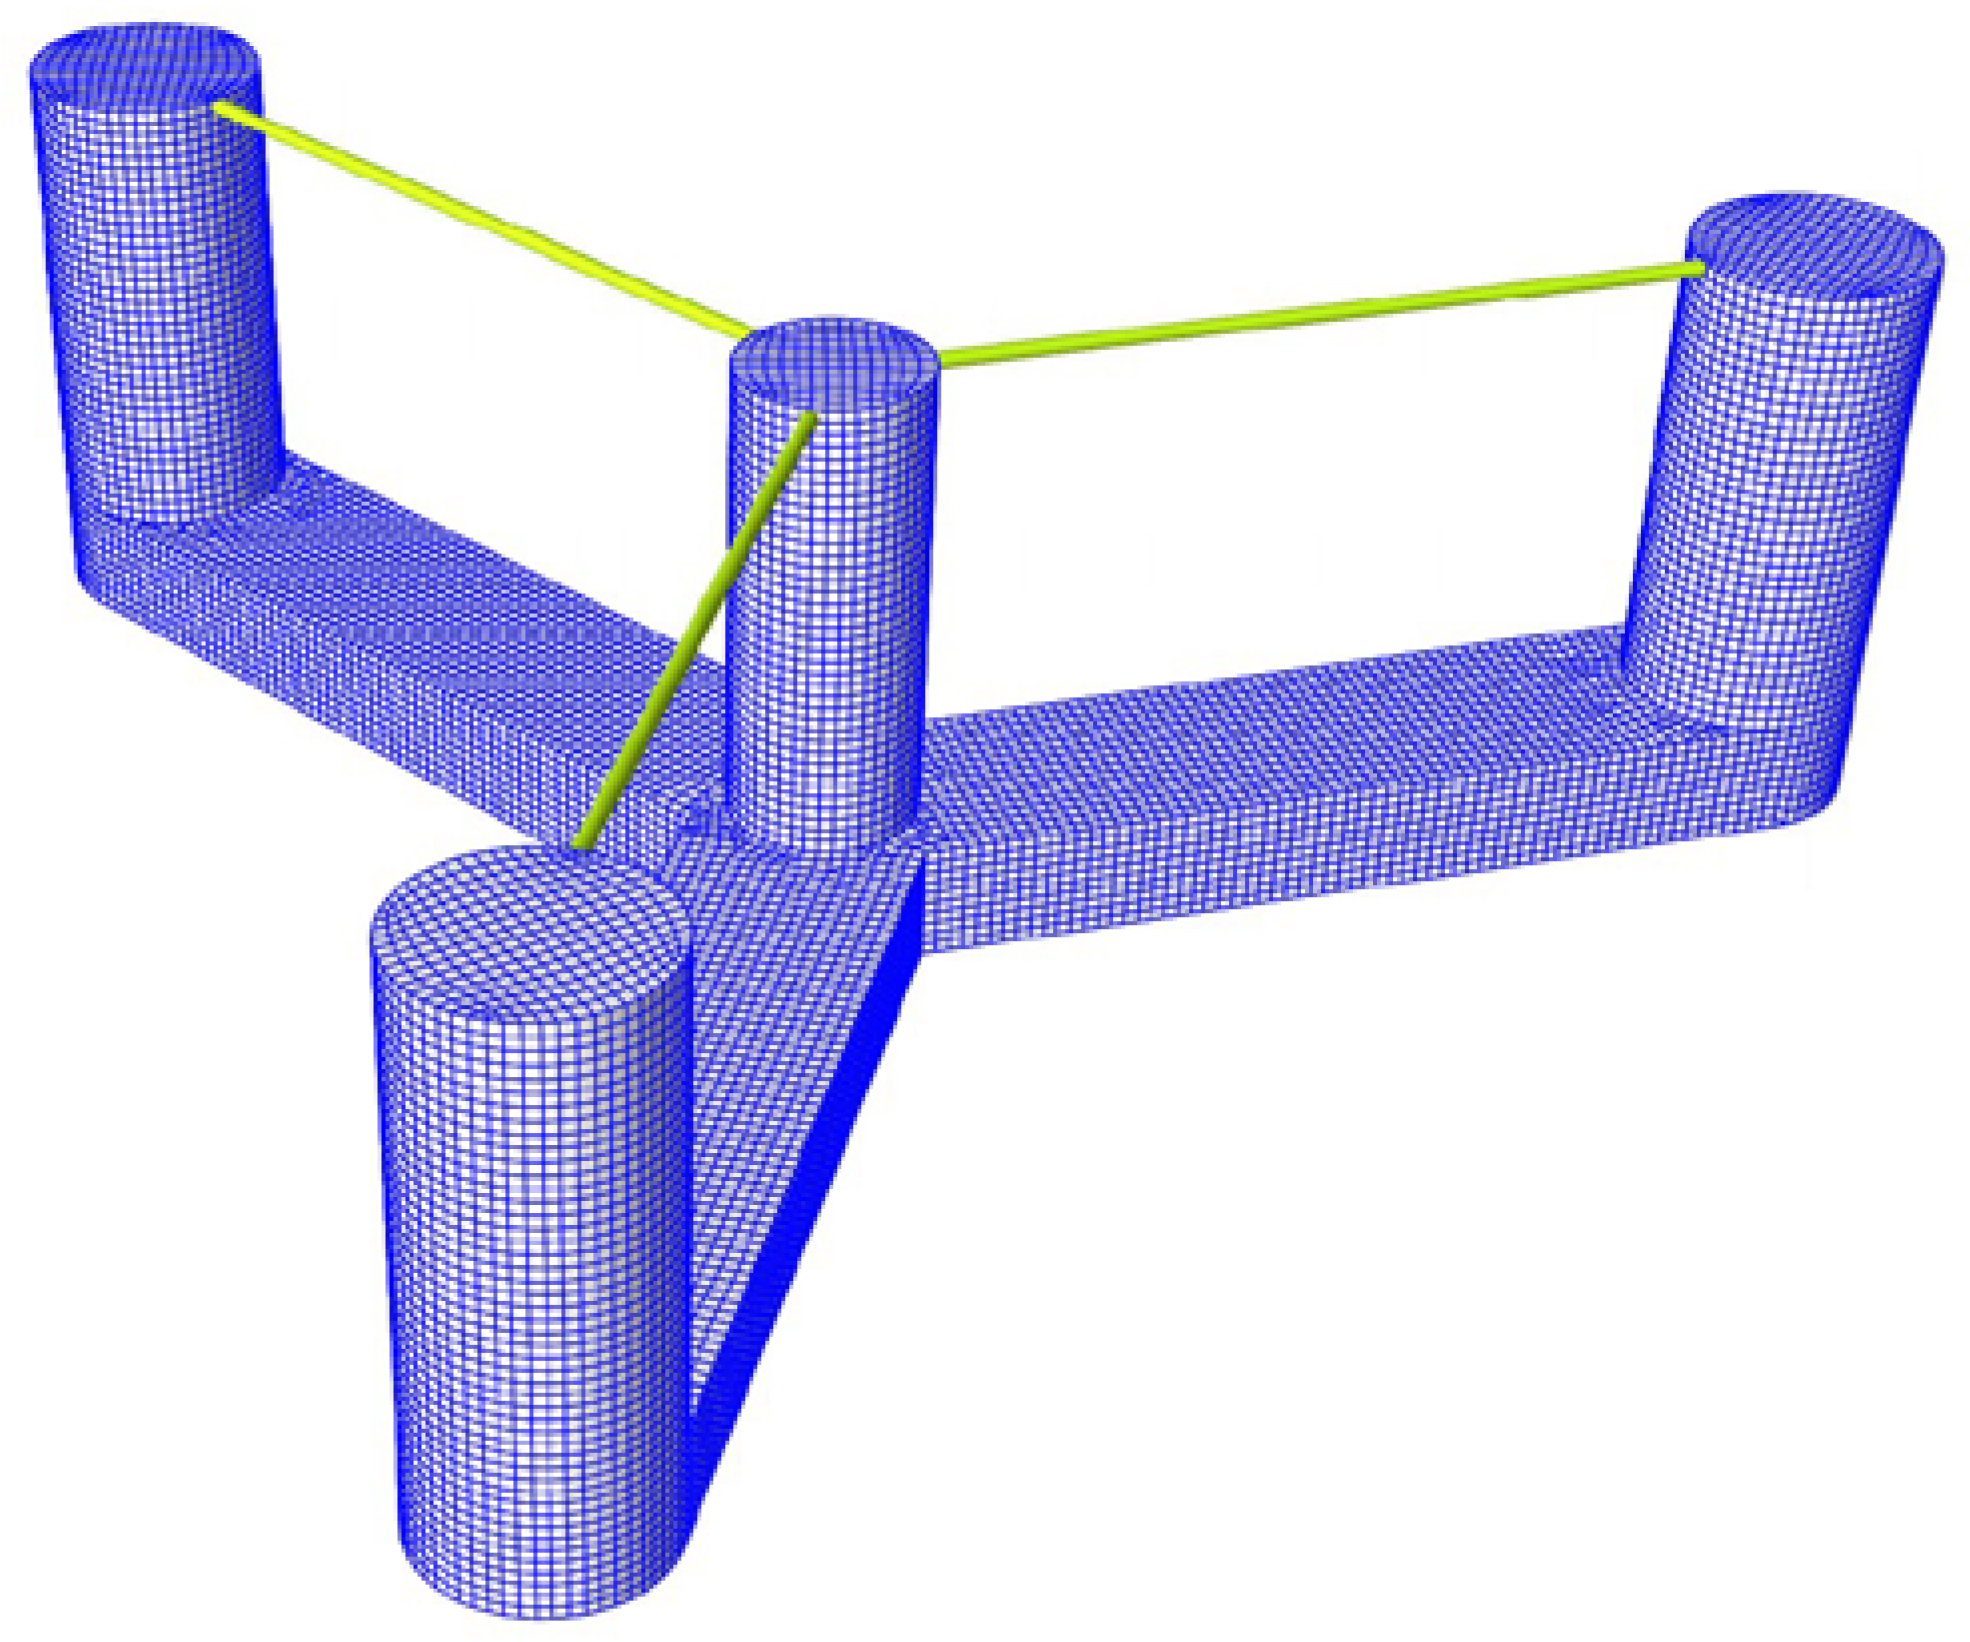
17] described a UMaine VolturnUS-S reference semi-submersible foundation to support the superstructure of a large-scale (15 MW) offshore wind turbine. The VolturnUS-S floating foundation consists of four columns, with bottom pontoons and top cross braces. Niranjan et al. [
18] investigated the dynamic responses of a 15 MW offshore wind turbine using the UMaine VolturnUS-S semi-submersible foundation under different working conditions. Wu et al. [
19] presented a method for upscaling a 5 MW wind turbine with the OC4 DeepCwind floating foundation to a 15 MW wind turbine. They compared it against a 15 MW wind turbine with the VolturnUS-S floating foundation.
The optimization of the VolturnUS-S floating foundation has not yet been realized. In order to achieve superior performance of the 15 MW FOWT, this paper focusses on the structural parameters of the UMaine VolturnUS-S reference foundation. The outer column diameter and the distance from the outer columns to the central column were considered, and their effects on the hydrodynamic performance of the floating foundation were analyzed. Subsequently, the structural parameters of the semi-submersible foundation were optimized. Furthermore, the dynamic performance of the optimized 15 MW FOWT was investigated under normal and extreme environmental conditions. The mean drift forces affecting the wind turbine were analyzed after optimizing the floating foundation. The findings of this study can help to enhance the overall stability and dynamic performance of the 15 MW FOWT and contribute to the its further optimization.
4. Results and Discussion
In order to improve the hydrodynamic performance of the large floating offshore wind turbine (FOWT), this paper investigated the influence on the hydrodynamic performance of the floating foundation of two structural parameters: the distance between the outer columns and the central column, and the diameter of the outer columns. The structure of the floating foundation was optimized based on the findings
4.1. The Effect of the Distance between the Outer Columns and the Central Column
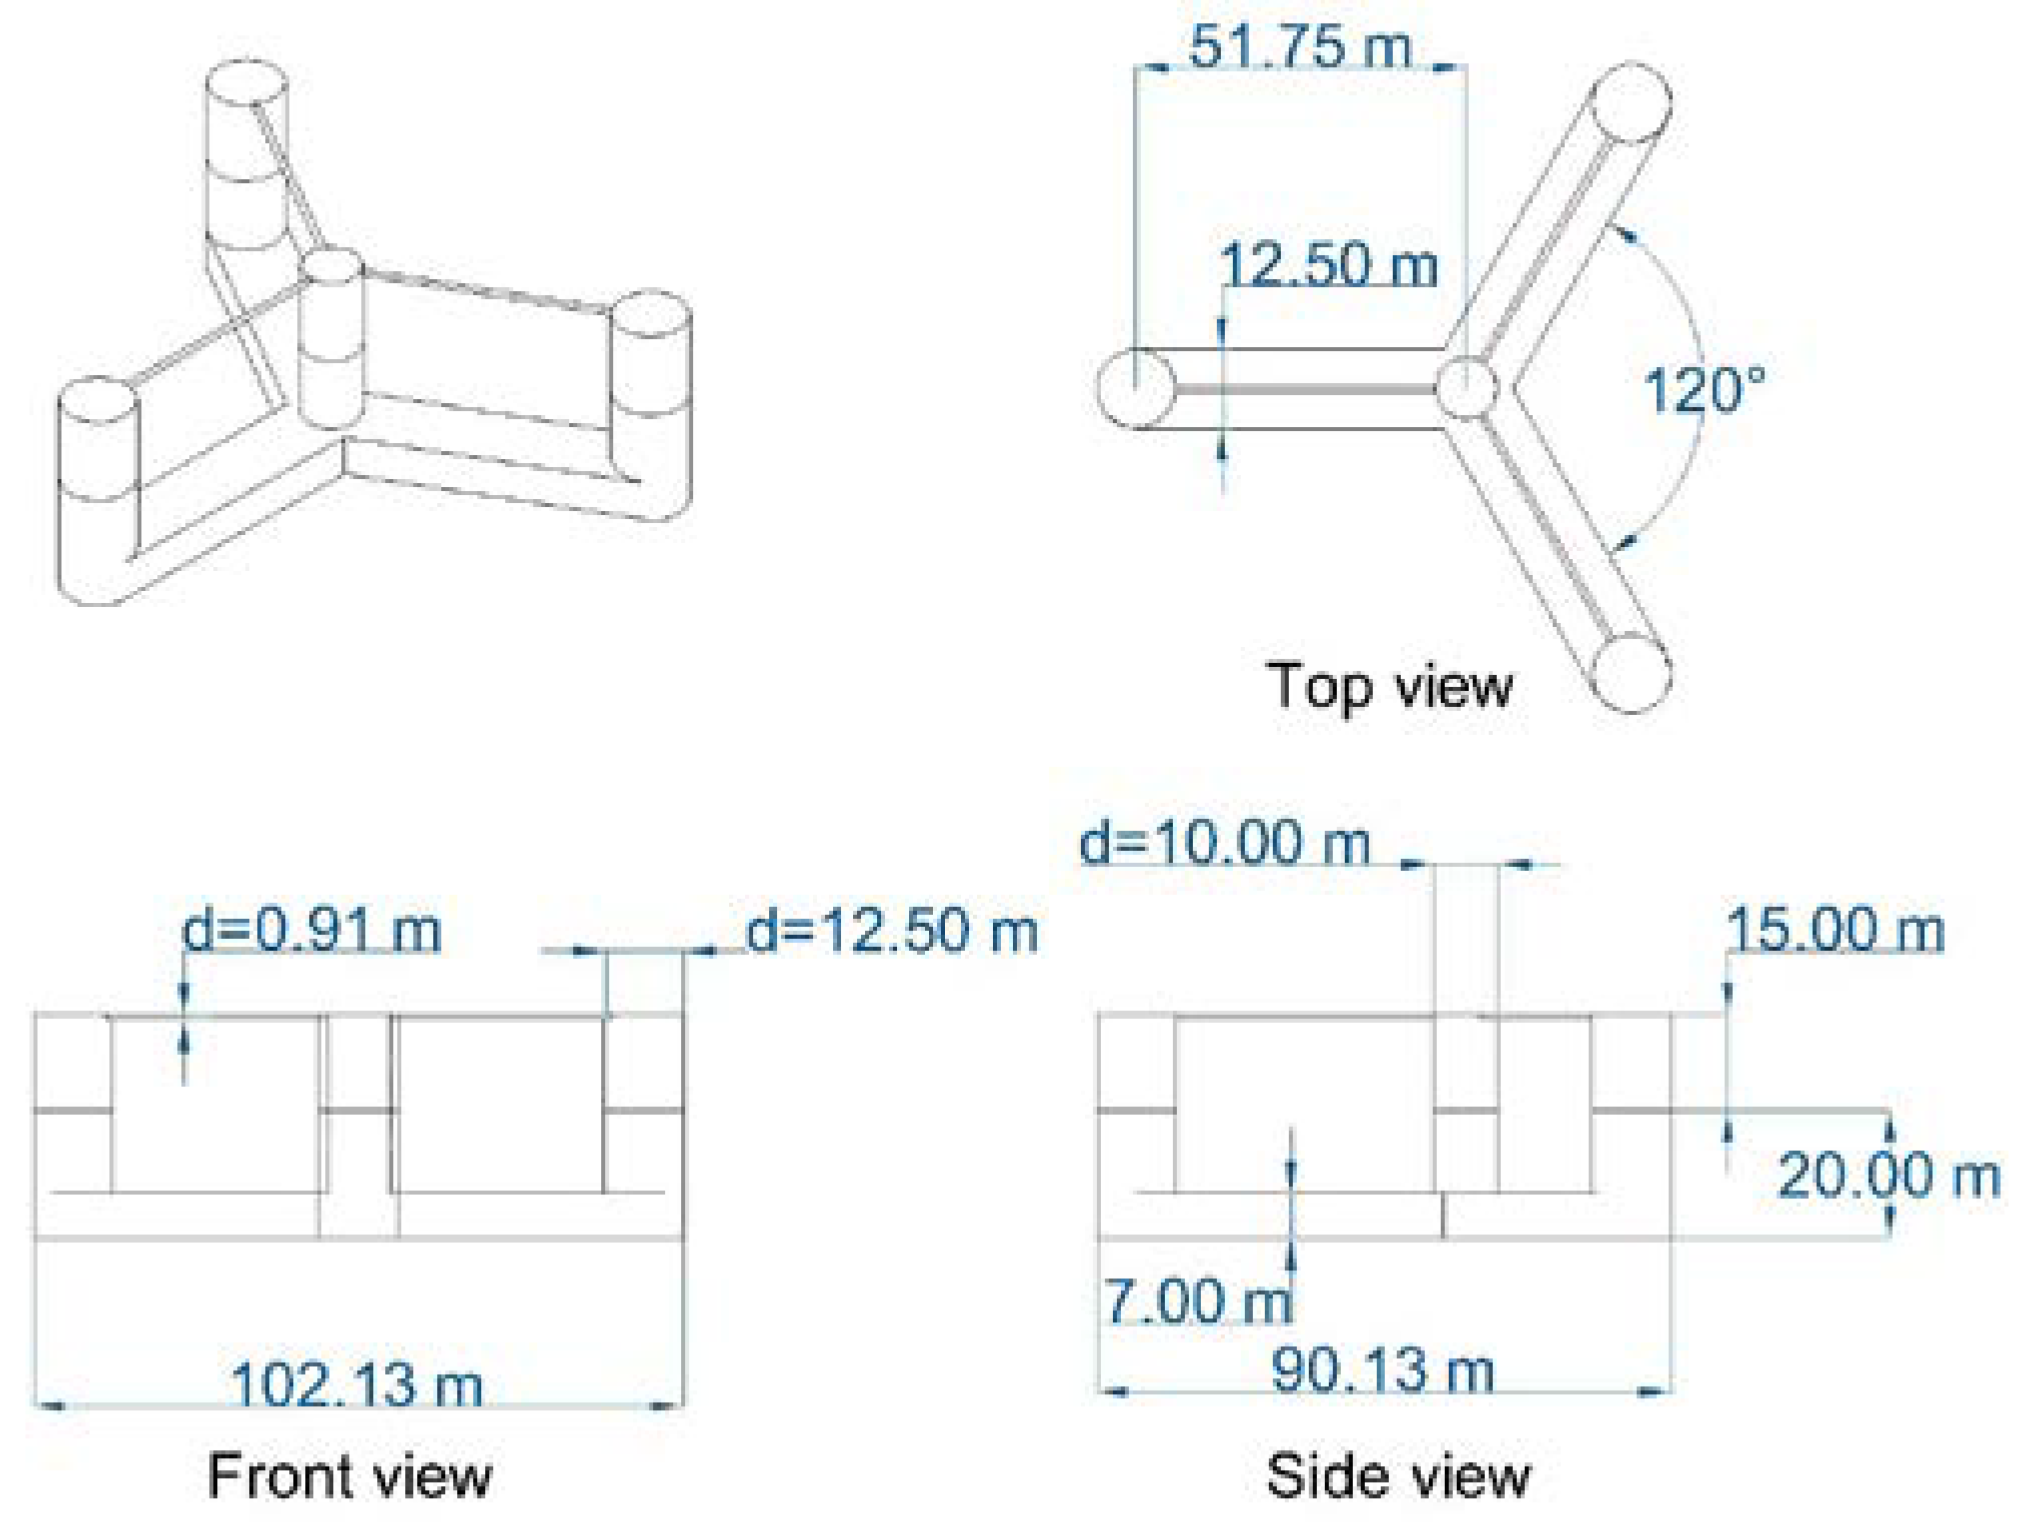
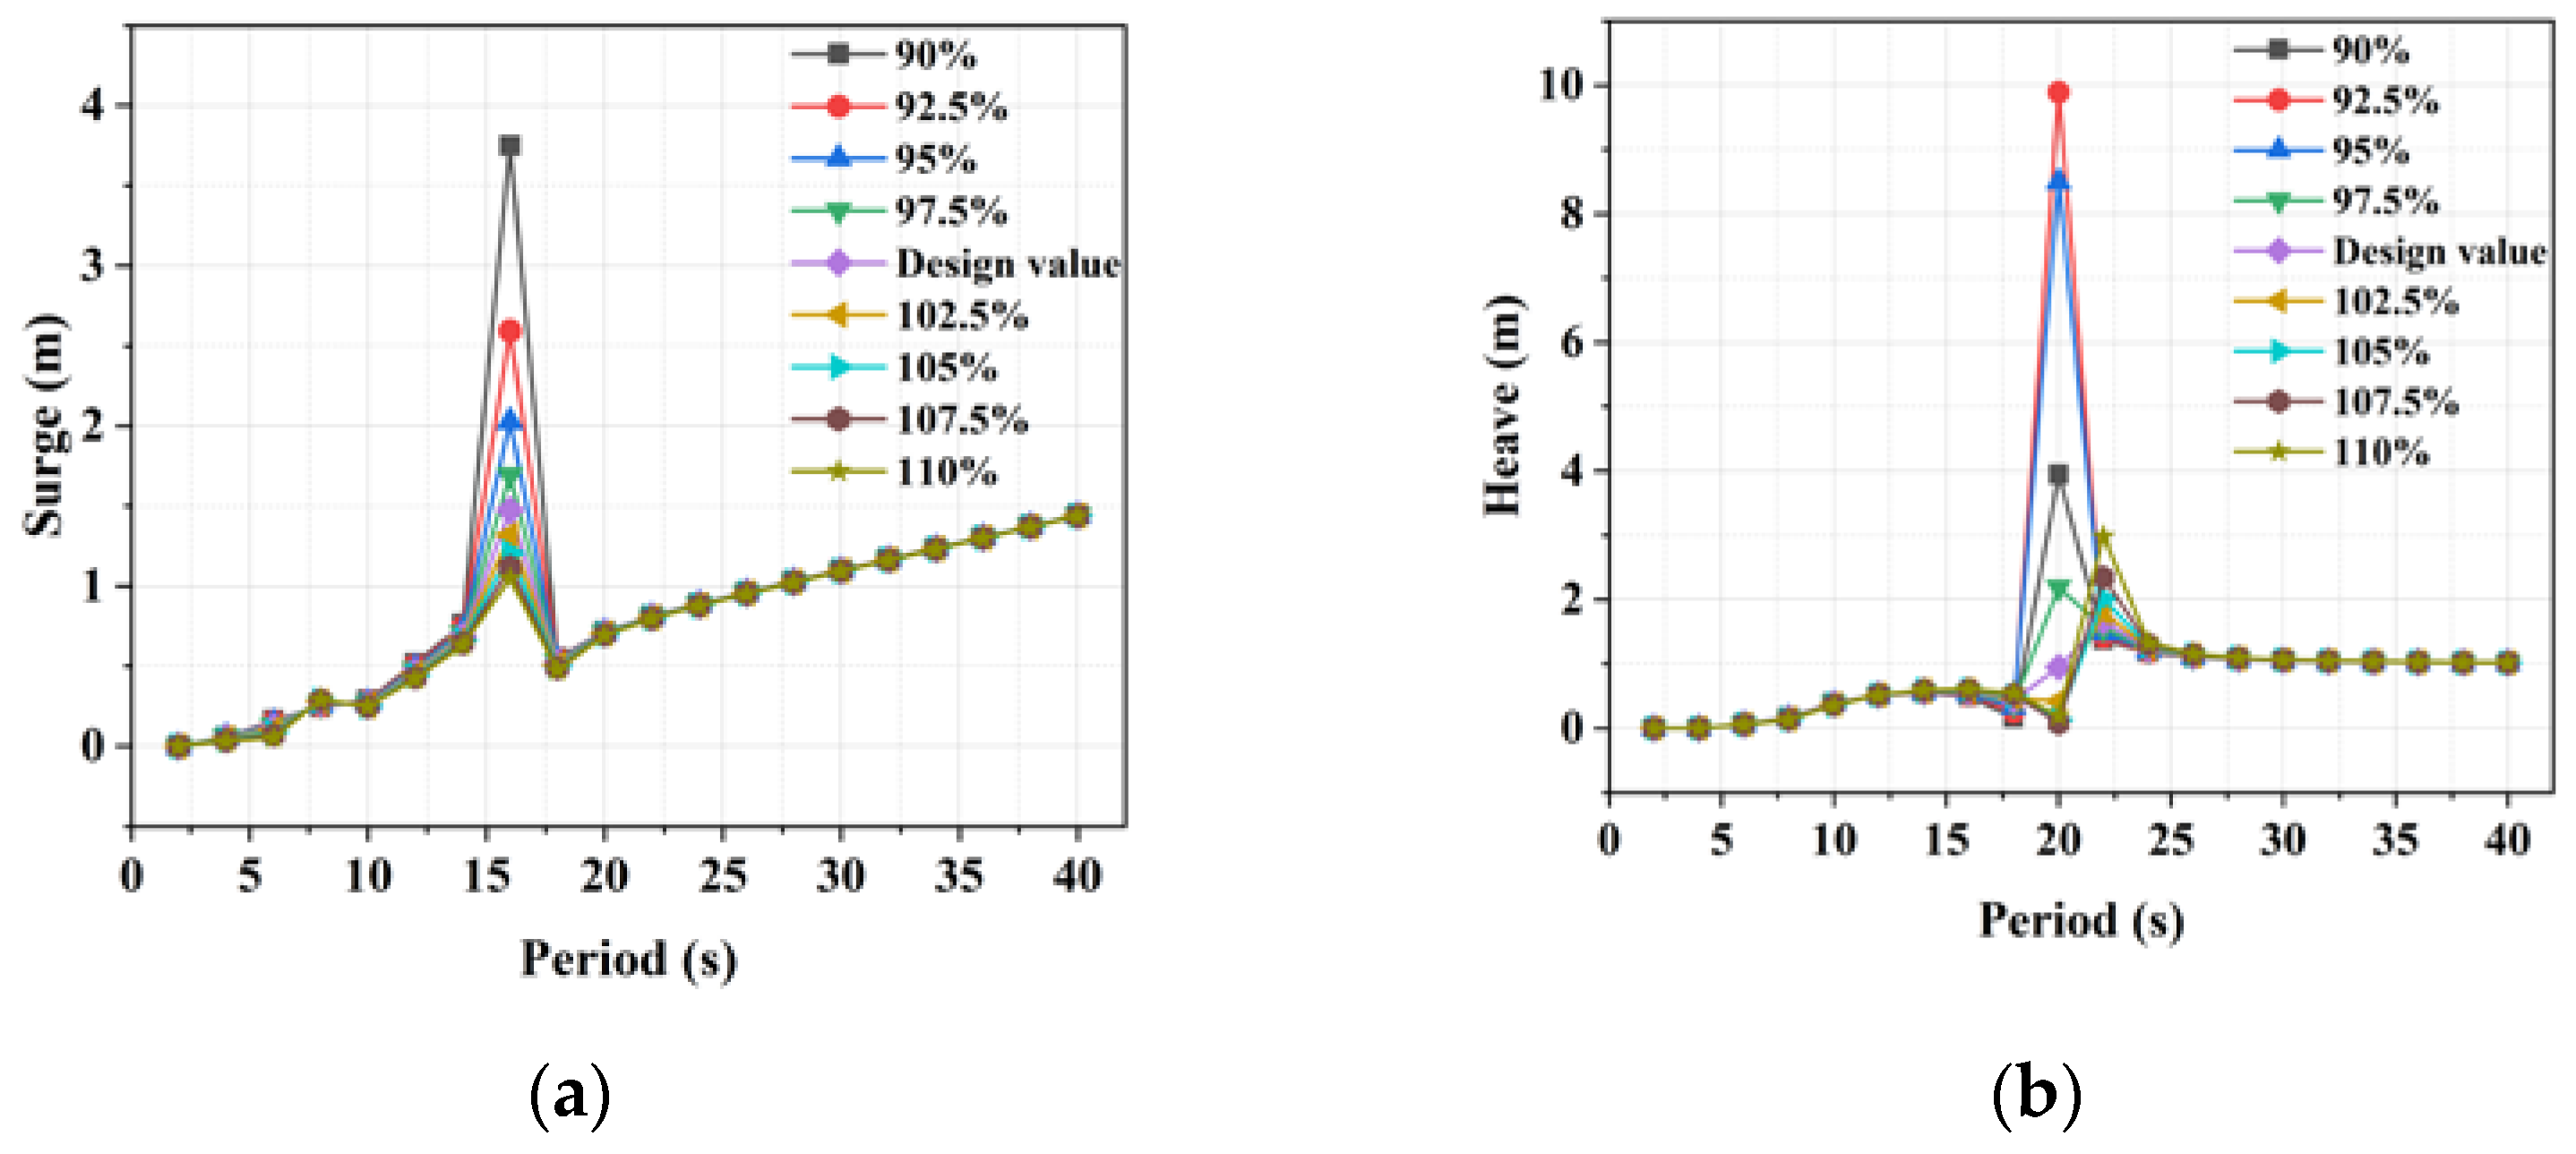
In this study, the distance between the outer columns and the central column of the floating foundation was changed, and the motion and wave excitation force transfer functions of floating foundations with different column spacing were calculated, to investigate the effect of column spacing on the hydrodynamic performance of the foundation. Other structural parameters of the floating foundation remained unchanged, and the original column spacing of the foundation was 51.75 m. The distance between the outer columns and central column was set to vary by every 2.5% within the range of 90% to 110% of its original design value. The motion and wave excitation force transfer functions were calculated for the floating foundations with changed column spacing.
The motion transfer functions of the foundations with different column spacing in the 0-degree wave direction are depicted in
Figure 8. The horizontal axis in
Figure 8 represents the different wave periods, and the vertical axis denotes the motion amplitude of the floating foundation. Curves with different colors and symbols are used in
Figure 8 to represent the motion transfer functions of the floating foundations with different column spacing. For example, the black line with the square symbol in
Figure 8a shows the surge transfer function in the 0-degree wave direction for the foundation with 90% of the original design value for its column spacing.
Due to limited space in this paper, the transfer functions of surge, heave, and pitch motions were selected for analysis.
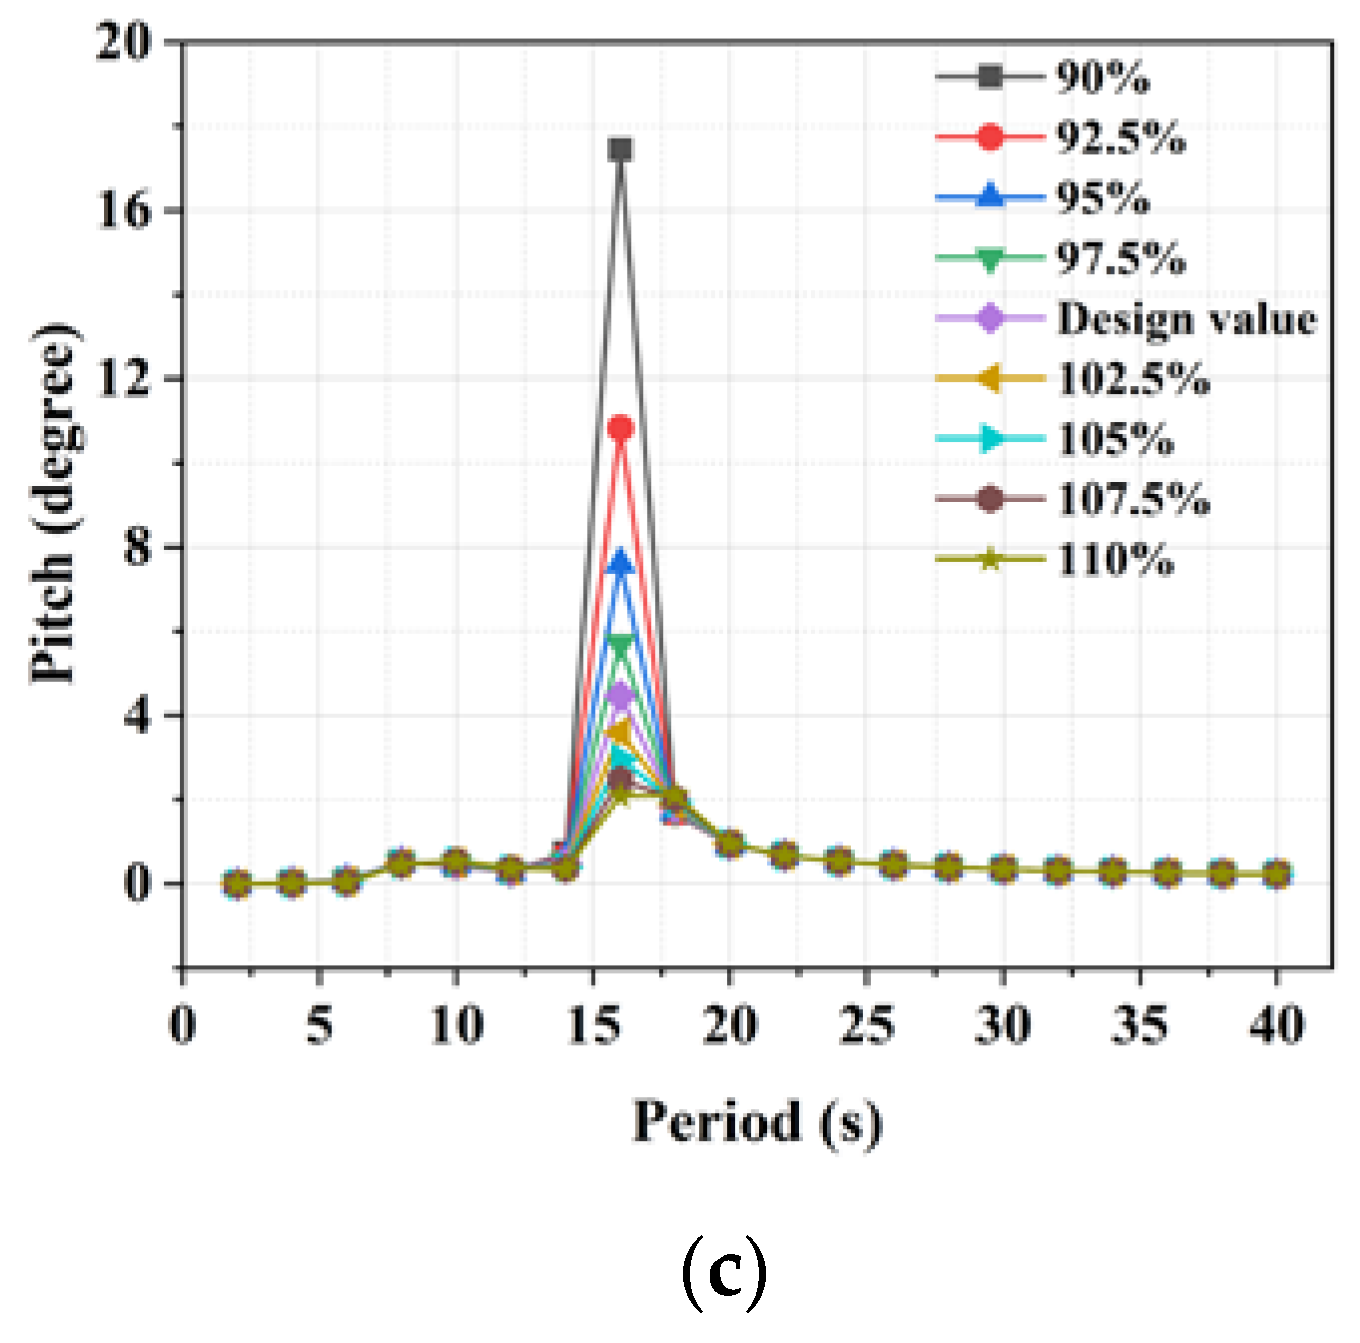
Figure 8 indicates that, for the UMaine VolturnUS-S reference semi-submersible foundation, column spacing had a significant effect on motion transfer functions. The peak values of different surge and pitch transfer functions were all located around the position of the 16 s wave period. However, with the changes to column spacing, the peak values of the surge and pitch transfer functions showed obvious variation, as indicated in
Figure 8a,c. This indicates that the variation of the column spacing can change the amplitudes of the surge and pitch resonance motions. In addition, the wave period corresponding to the peak value of heave transfer function also changed with the continuous increase of column spacing, as shown in
Figure 8b.
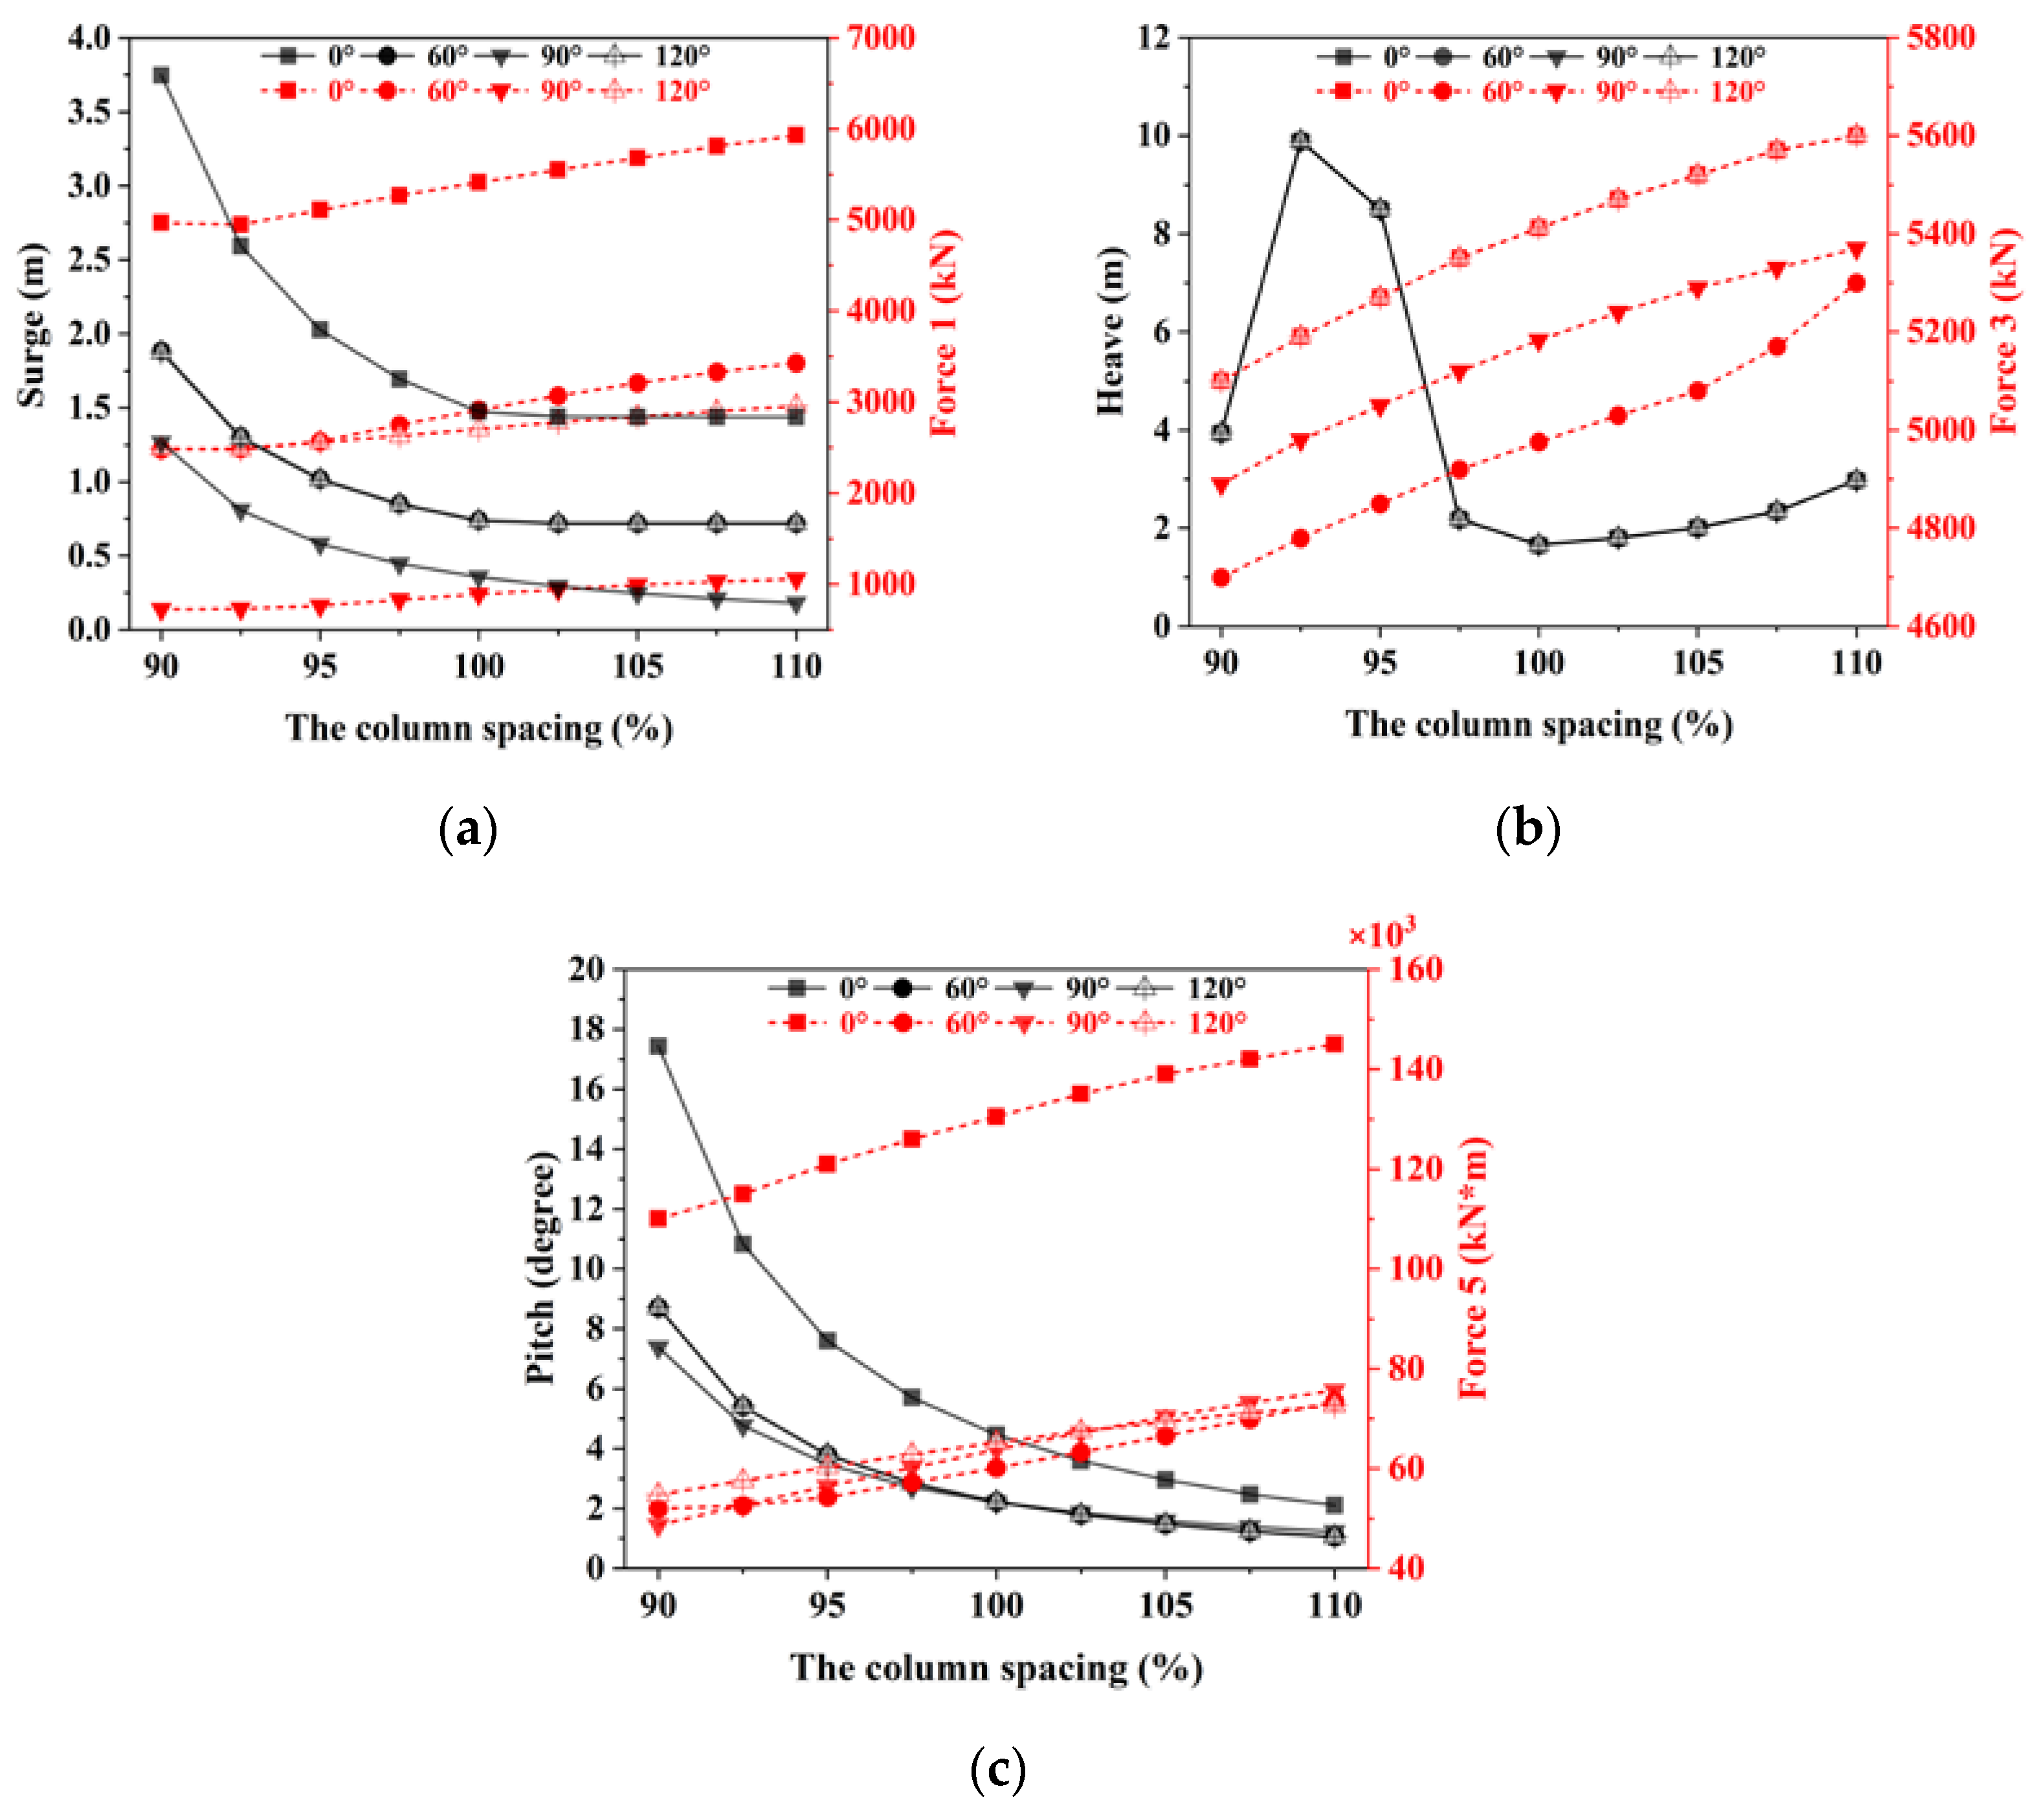
The peak values of those transfer functions were analyzed, and the results are shown in
Figure 9. The horizontal axis of
Figure 9 indicates the different column spacing, and the vertical axis represents the magnitude of the peak values for the transfer functions. The black solid lines in
Figure 9 give the variation curves of the peak motion transfer function values with the change of column spacing, and the magnitude of the peak value is indicated by the black vertical axis on the left side of the plot. The red dotted lines represent the variation curves of the peak values for the wave excitation load transfer functions, and the magnitude of the peak values is shown by the red vertical axis on the right side of the diagram. The curves with different symbols represent the variation curves of the peak values for transfer functions in different wave directions. For example, the black solid line with the square symbol in
Figure 9c represents the variation curve of the peak value for surge transfer function with the change of column spacing in the 0-degree wave direction. The red dotted line with the circular symbol represents the variation curve of the peak value of the longitudinal wave excitation moment transfer function with the change of column spacing in a 60-degree wave direction.
It can be seen from
Figure 9 that the change of column spacing significantly affected the motion and wave excitation loads of the floating foundation. In all four wave directions, the peak values of surge and pitch motion transfer functions decreased with the increase of column spacing, and the wave excitation force and moment on the foundation in the longitudinal direction increased gradually, as shown in
Figure 9a,c. This is because the increase of the distance between the columns caused a rise in the longitudinal inertia moment of the floating foundation, which increased the restoring moment of the foundation and strengthened the ability to return to its equilibrium position under the action of the wave. On the other hand, the pontoons of the floating foundation were longer due to the larger column spacing, which prompted an increase in the displacement of the foundation. These two factors reduced the peak value of the motion transfer function for the same wave action. In other words, within a certain range, increased column spacing can reduce the amplitude of resonant motion that occurs when the wave frequency is close to the natural frequencies of the surge and pitch motions of the floating foundation. However, owing to increased column spacing, the dimensions of the floating foundation were larger, making the wave excitation force on the foundation more significant.
Furthermore, the influence of column spacing on the peak value of the heave motion transfer function was also found to be significant. Within the variation range of the column spacing selected in this paper, when the distance between the outer columns and the central column was 92.5% of the original design value, the peak value of the heave motion transfer function was the largest. Moreover, the wave excitation force experienced by the floating foundation in the vertical direction can also be increased by the larger column spacing.
The peak value curves of surge and pitch transfer functions varied within a similar trend for different wave directions, as can be seen in
Figure 9a,c. However, for the surge and pitch transfer functions, the peak value curves at the 0-degree wave direction were higher overall than those under other wave directions. With the change of wave direction from 0 to 90 degrees, the surge and pitch motions of the foundation become smaller, and the peak value curves under 90-degree wave direction were lower overall than the others. This shows that the floating foundation will generate the largest motion when the wave direction is close to the direction of motion. In addition, the difference in the peak values of the heave transfer functions was small under different wave directions, as shown in
Figure 9b, indicating that the change of wave direction had little effect on heave motion.
Based on the above research results on the influence of column spacing on hydrodynamic performance, the structural parameters of the floating foundation were optimized. To reduce the motion responses under the action of the wave and to improve the hydrodynamic performance of the foundation, its column spacing was increased by 5% of the original design value, i.e., 54.3375 m. In the case of the 90-degree wave direction, for the optimized floating foundation, the peak value of the surge transfer function was reduced by 30.85% of the original. Under the condition of the 0-degree wave direction, the peak value of the pitch transfer function of the optimized floating foundation was reduced by 33.61% compared with the original. For the roll transfer function, the peak value of the optimized foundation for a 90-degree wave direction was 35.45% lower than that of the original model.
4.2. The Effect of the Diameter of the Outer Columns
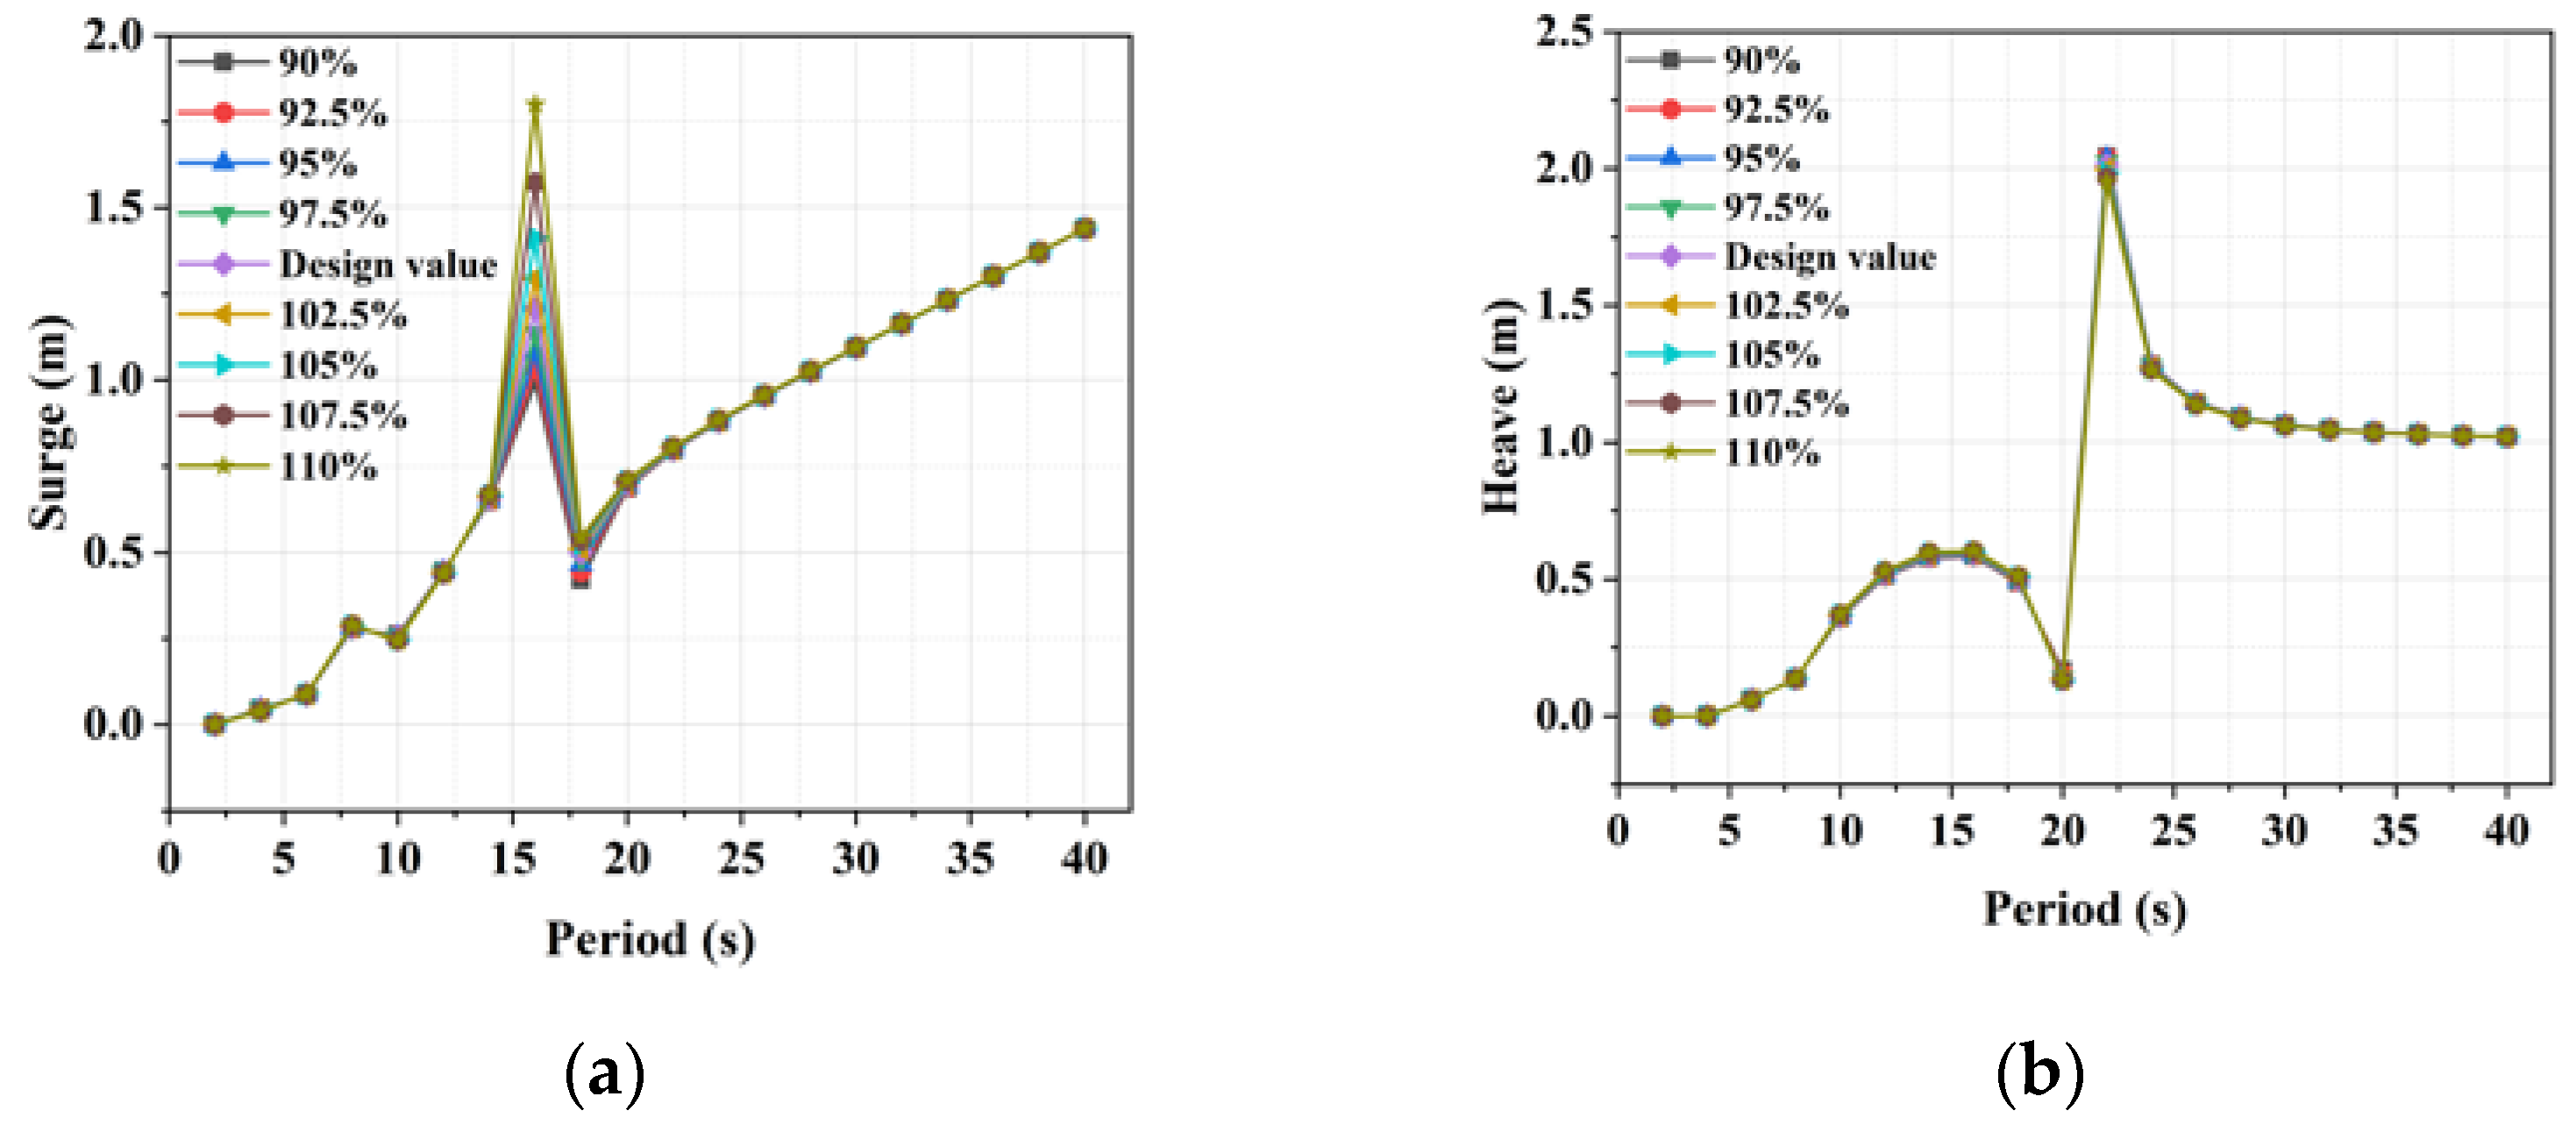
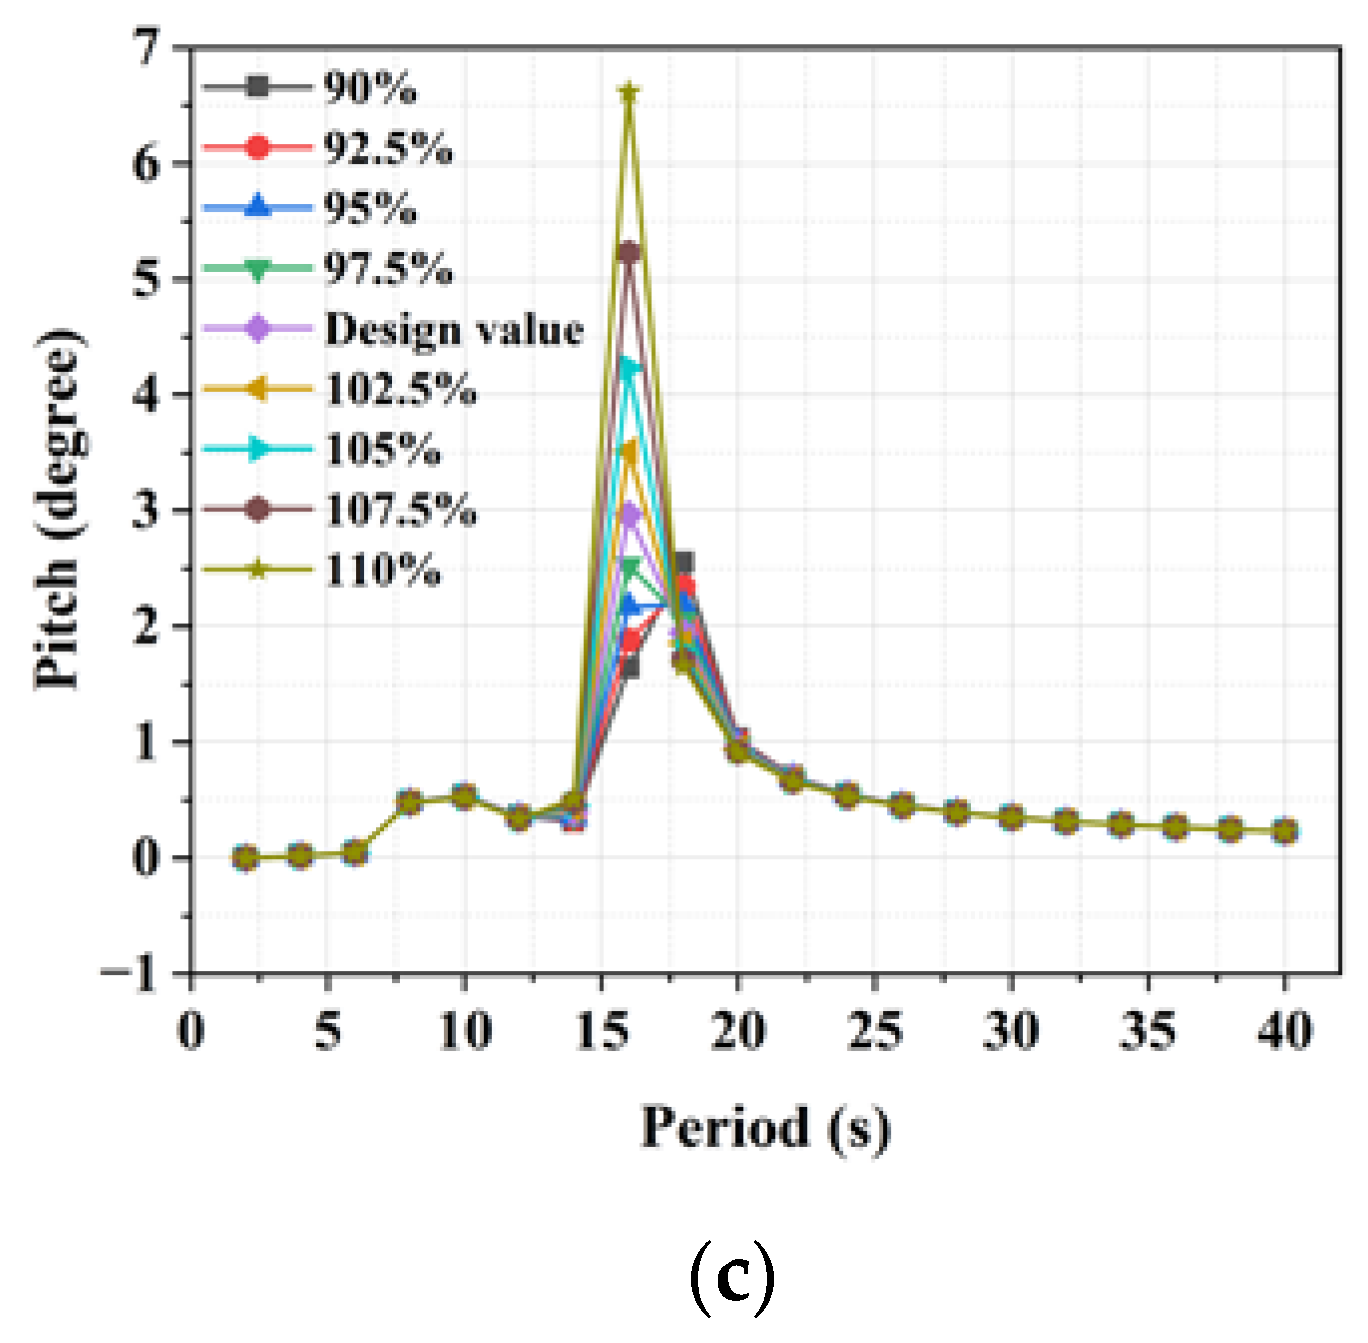
According to the above results, the effect of the column diameter on the hydrodynamic performance was studied, based on the above optimized floating foundation, to facilitate the further performance optimization of the foundation. The investigation into the influence of the column diameter on the hydrodynamic performance adopted the same method as above. Other structural parameters of the foundation were kept unchanged, and the column diameter was changed with a step size of 2.5% within the range of 90% to 110% of the design value of the outer column diameter. The hydrodynamic data were calculated for the floating foundation with different outer column diameters. The transfer functions of the motion and wave excitation forces were analyzed, as shown in
Figure 10. Curves with different colors and symbols are used in
Figure 10 to represent the motion transfer functions for the floating foundations with different outer column diameters.
From
Figure 10, it can be seen that the peak value of the surge transfer function was significantly affected by the change of the outer column diameter, and the change of the outer column diameter had little effect on the heave transfer function, as shown in
Figure 10a,b. This indicates that the change of the outer column diameter to some extent helped to reduce the surge resonance of the floating foundation when the wave frequency was close to the natural surge frequency. The heave motion was apparently not altered by the change of column spacing. In addition, the peak value of the pitch transfer function was significantly affected by the variation of the outer column diameter. When the diameter of the outer column was changed to a specific value, a new peak value was generated in the pitch transfer function. In other words, the variation of the outer column diameter not only influenced the amplitude of the pitch resonance, but may also change the natural pitch frequency of the floating foundation.
On the basis of the above analysis of the RAOs, it can be seen that waves in the period of 14–24 s caused severe resonance motion in the floating foundation. Therefore, the most frequent wave period occurring in the sea where the FOWT is located should be outside this range. Moreover, waves with a period of about 16 s can easily cause surge and pitch resonance motion within the foundation, resulting in very large longitudinal displacement and pitch angle. The amplitude of surge and pitch resonance motion can be reduced by changing the column spacing and the diameter of the outer column appropriately.
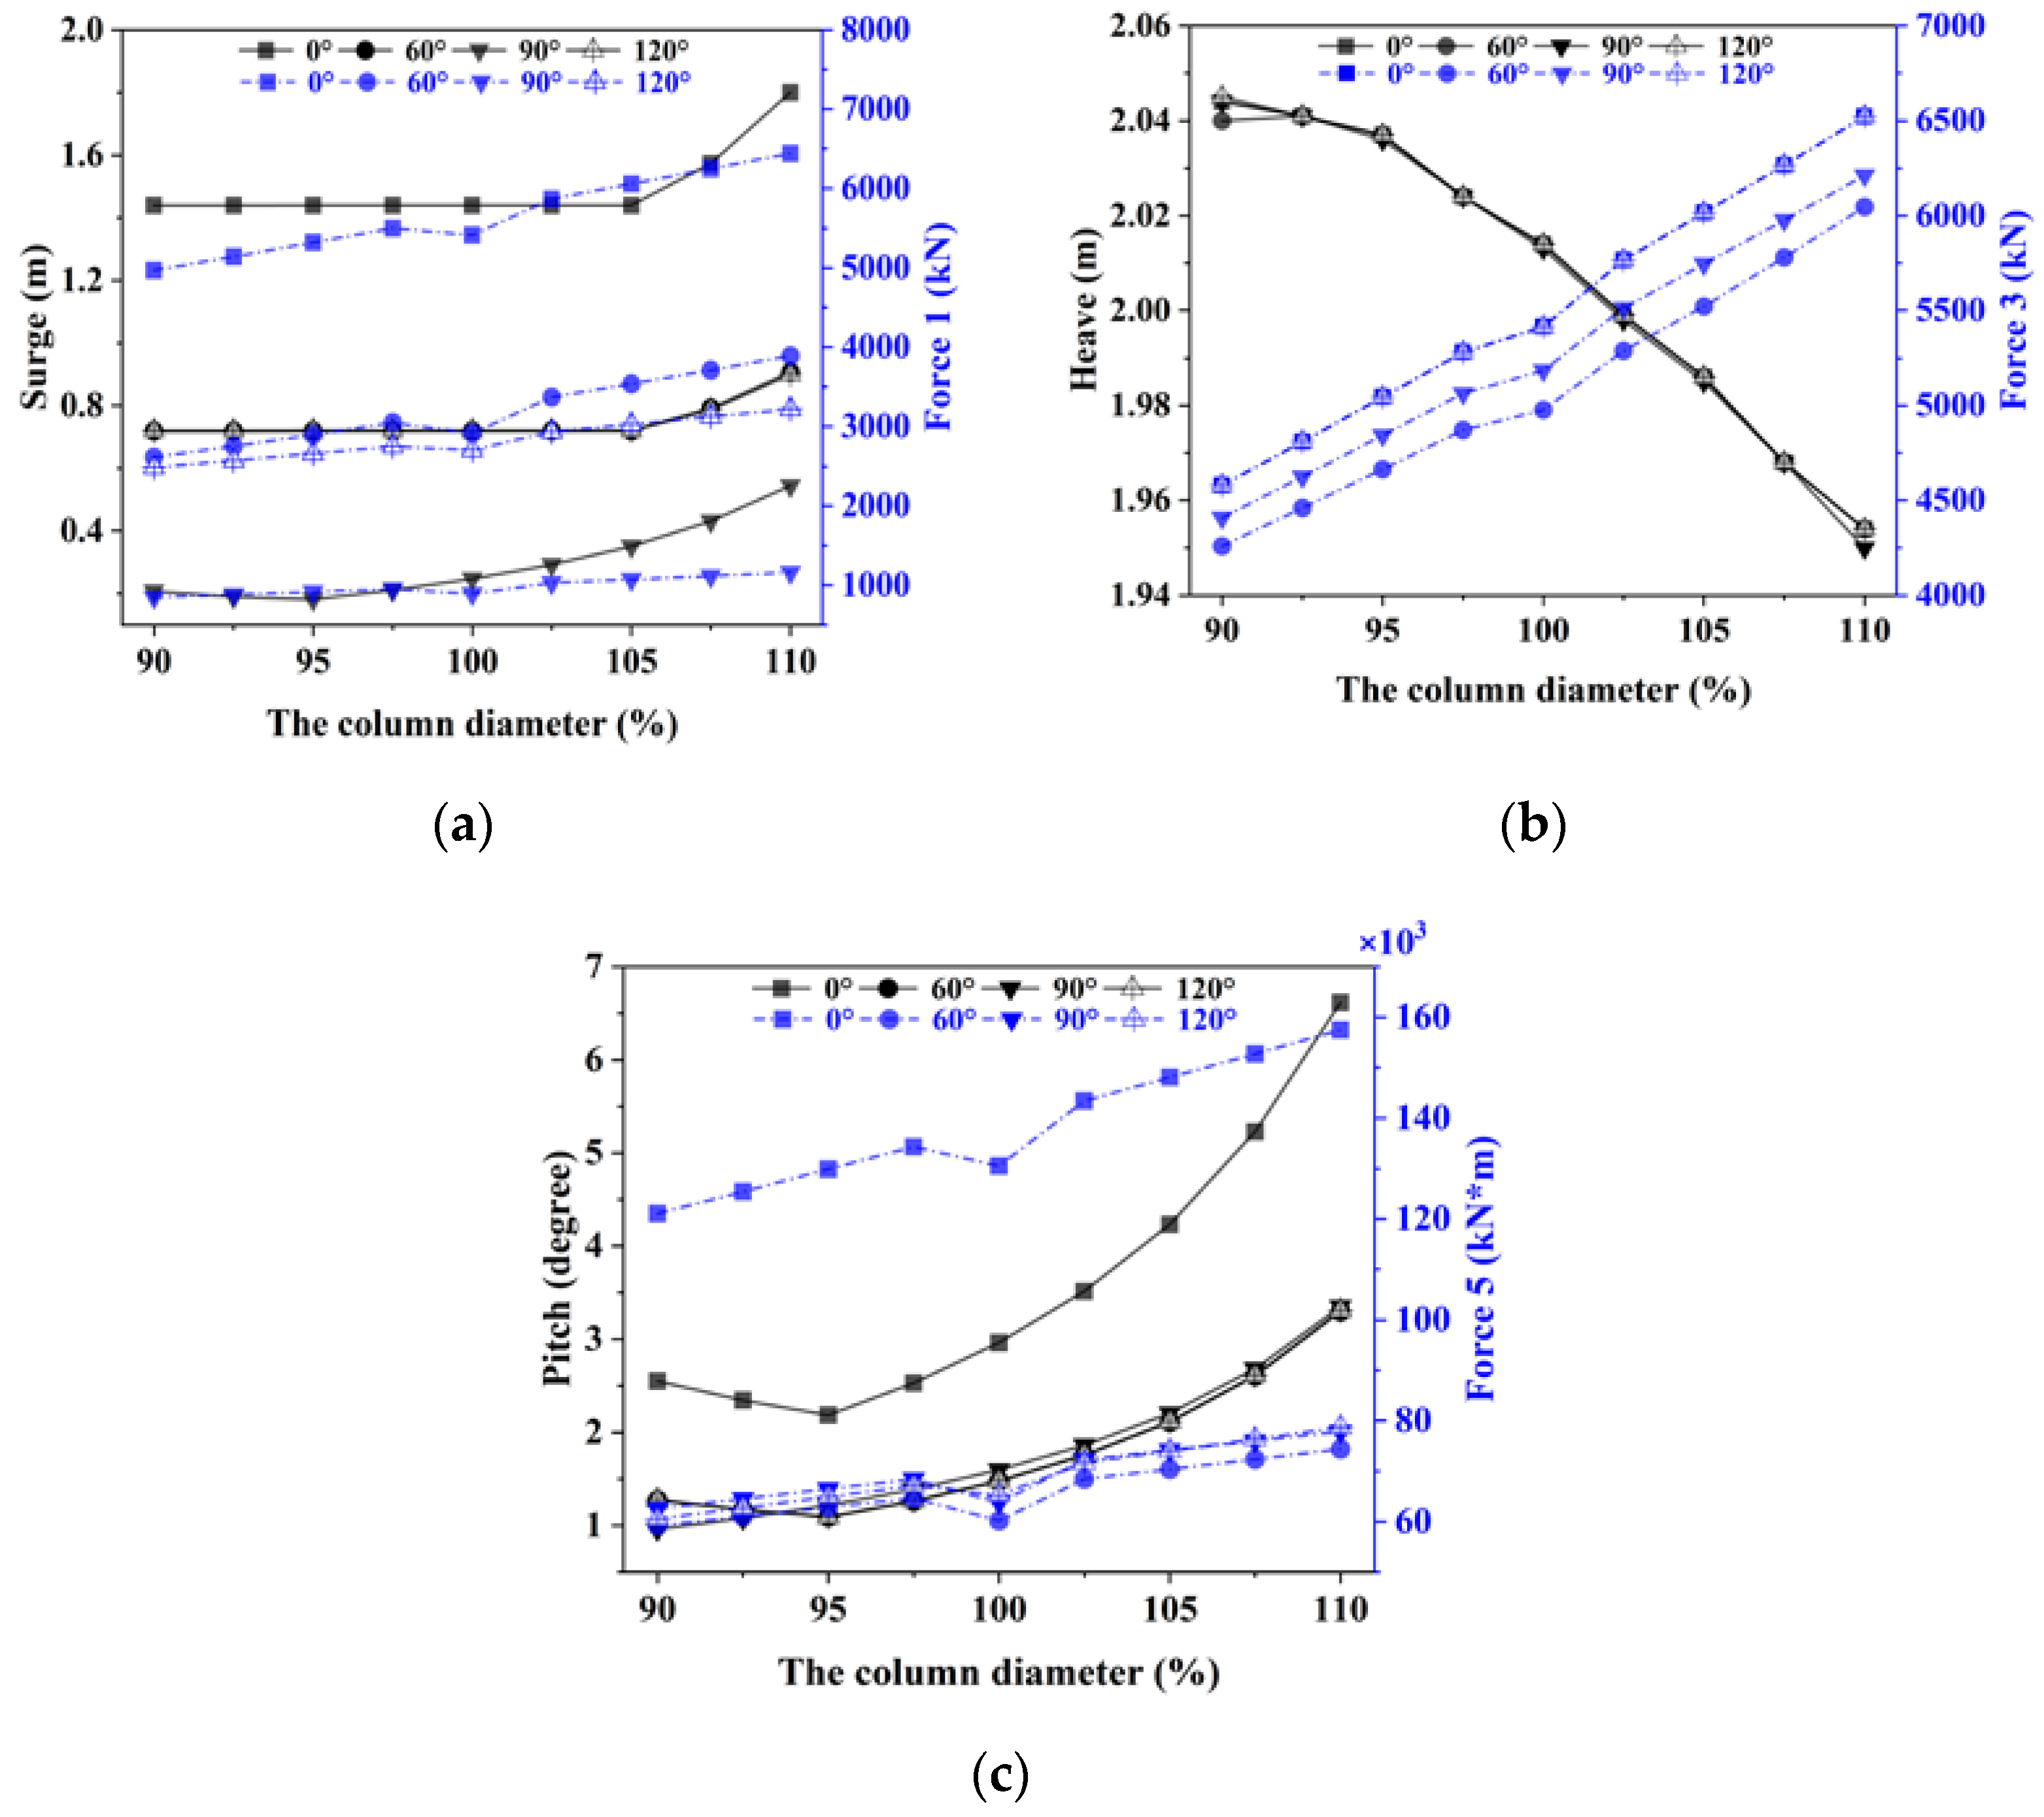
Figure 11 presents the peak values of the motion and wave excitation force transfer functions of the floating foundation with different column diameters in different wave directions. The black solid lines in
Figure 11 are the variation curves of the peak values for the motion transfer functions with the change of outer column diameter, and the magnitude of the peak value shown by the black vertical axis on the left side of the plot. The blue dotted lines represent the variation curves of the peak values for the wave excitation load transfer functions, and the magnitude of the peak values is indicated by the blue vertical axis on the right side of the diagram. The curves with different symbols represent the variation curves of the peak values for the transfer functions in different wave directions.
It can be seen from
Figure 11 that the peak values of the wave excitation force transfer functions were larger with the increase of the column diameter. Variation of the outer column diameter can lead to changes in the water-plane area and the displacement volume of the foundation; the smaller the column diameter, the smaller the water-plane area and the displacement volume become. The restoring moment of the floating foundation was affected by the change of the water-plane area and the displacement volume. From the results in
Figure 11c, it can be seen that with the increase of column diameter, the peak values of the pitch transfer function became gradually larger. This indicates that the reduction of the column diameter increased the longitudinal restoring moment of the floating foundation, thereby decreasing the amplitude of the pitch resonance motion. In this study, for the case of 0-degree wave direction, the amplitude of the pitch resonance motion was smallest when the outer column diameter was 95% of the original design value. Under the effect of change in column diameter, the variation trend of the peak value of the roll transfer function was similar to that of the pitch transfer function. In contrast, for the heave transfer functions of the foundations, the peak value in all four wave directions decreased with the increase of column diameter. However, the magnitude of the change was small, reflecting that the change of the column diameter had limited influence on the heave motion.
In addition, within the variation range of the column diameter studied in this paper, the effect of the diameter change on the peak value of the surge transfer function was also limited. However, with the continuous increase of the column diameter, the peak value showed an apparent upward trend. Specifically, for the variation range of the column diameter smaller than the original design value, the change had little effect on the peak value of the surge transfer function. However, within the range of column diameter larger than the original design value, the increase made the peak value of the surge transfer function more significant. The influence of column diameter variation on the peak value of the sway transfer function was similar to that for the surge transfer function.
Based on the above results, the floating foundation was further optimized. The outer column diameter of the final optimized foundation was reduced by 5% of the original design value. The initial design value of the outer column diameter was 12.5 m, and the outer column diameter of the final optimized foundation was 11.875 m. The hydrodynamic performance of the final optimized foundation was greatly improved in pitch and roll motion. In the 90-degree wave direction, for the final optimized floating foundation, the peak value of the surge transfer function was reduced by 26.58% compared with the previous optimized foundation. For the pitch transfer function of the final optimized foundation, the peak value in the 0-degree wave direction was 26.27% lower than that of the previous optimized foundation. As for the roll transfer function of the final optimized foundation, compared with the previous optimized foundation, the peak value was reduced by 26.12% in the 60-degree wave direction.
4.3. The Performance Analysis of the Final Optimized Floating Foundation in the Time Domain
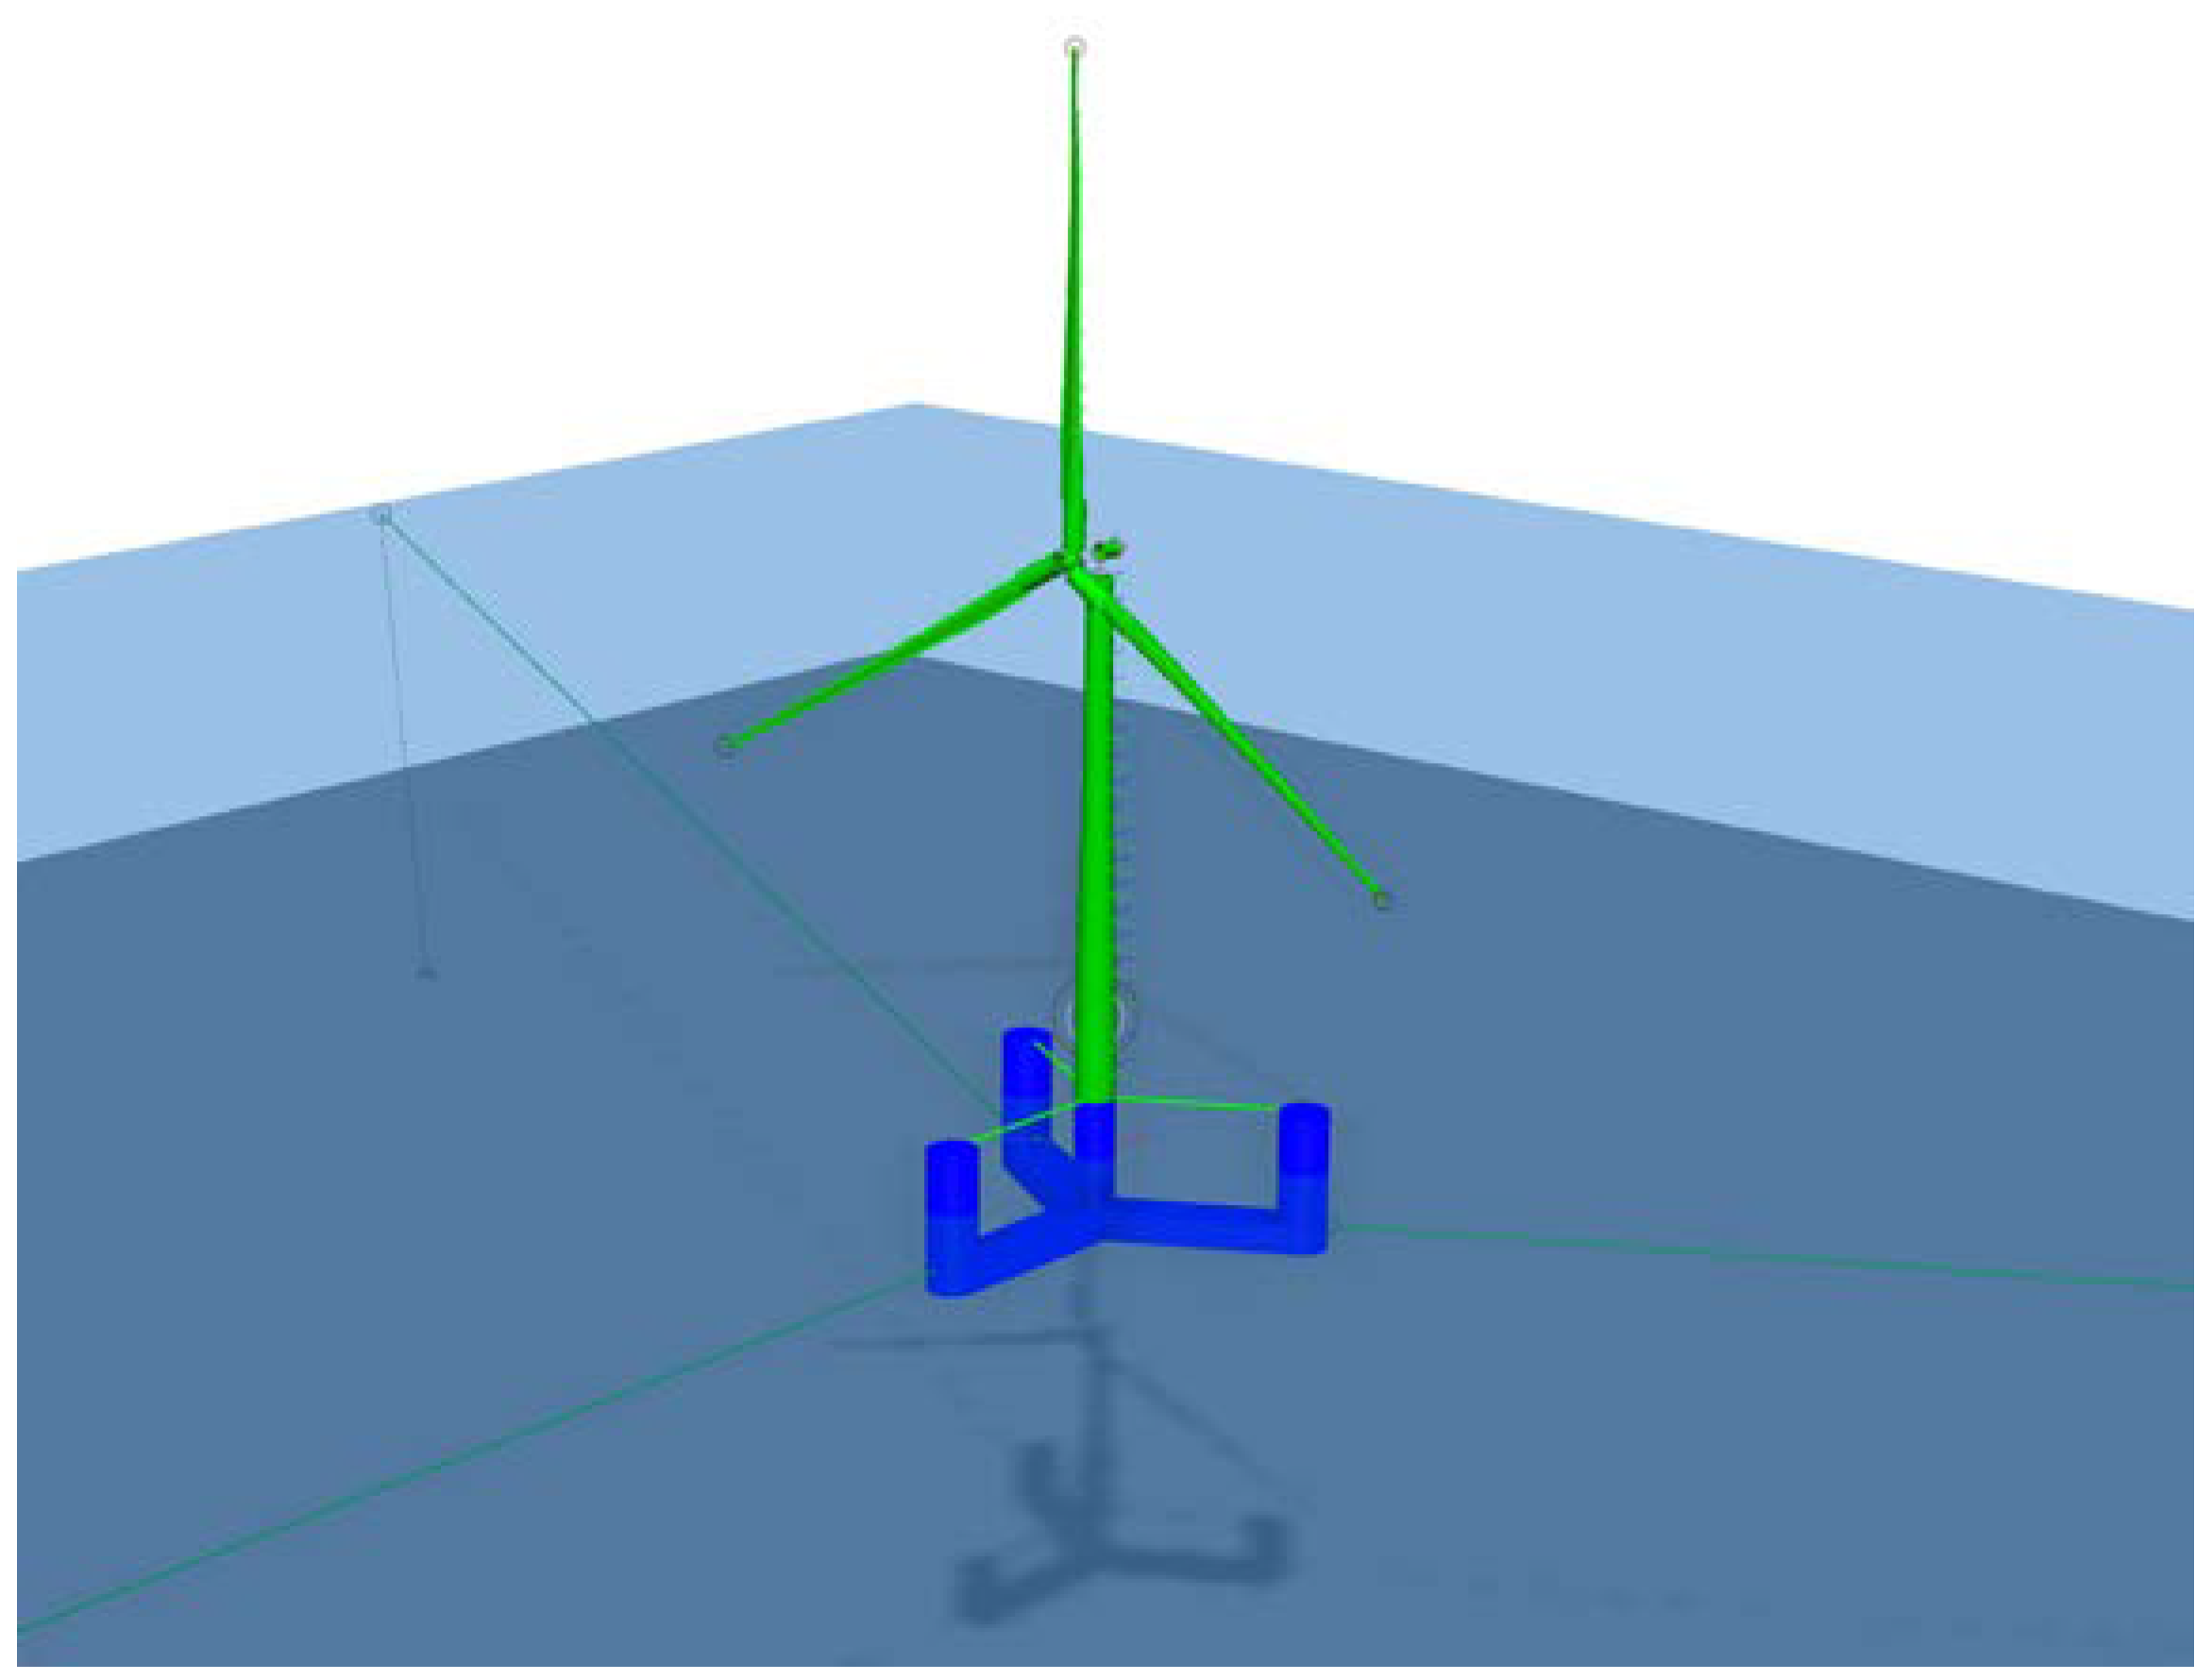
In this study, the final optimized floating foundation model was combined with the superstructure of a 15 MW wind turbine, and the time-domain dynamic performance of the integrated wind turbine was analyzed for two sea states. The total duration of the time-domain simulation was 2000 s. For the purpose of eliminating unstable numerical simulations, the results of the first 500 s were not considered. The analysis investigated the motion of the wind turbine with the optimized foundation in different sea conditions, the tension of the windward mooring line, and the mean drift forces on the foundation. Then, the results were compared with those of the wind turbine with the original UMaine VolturnUS-S reference foundation.
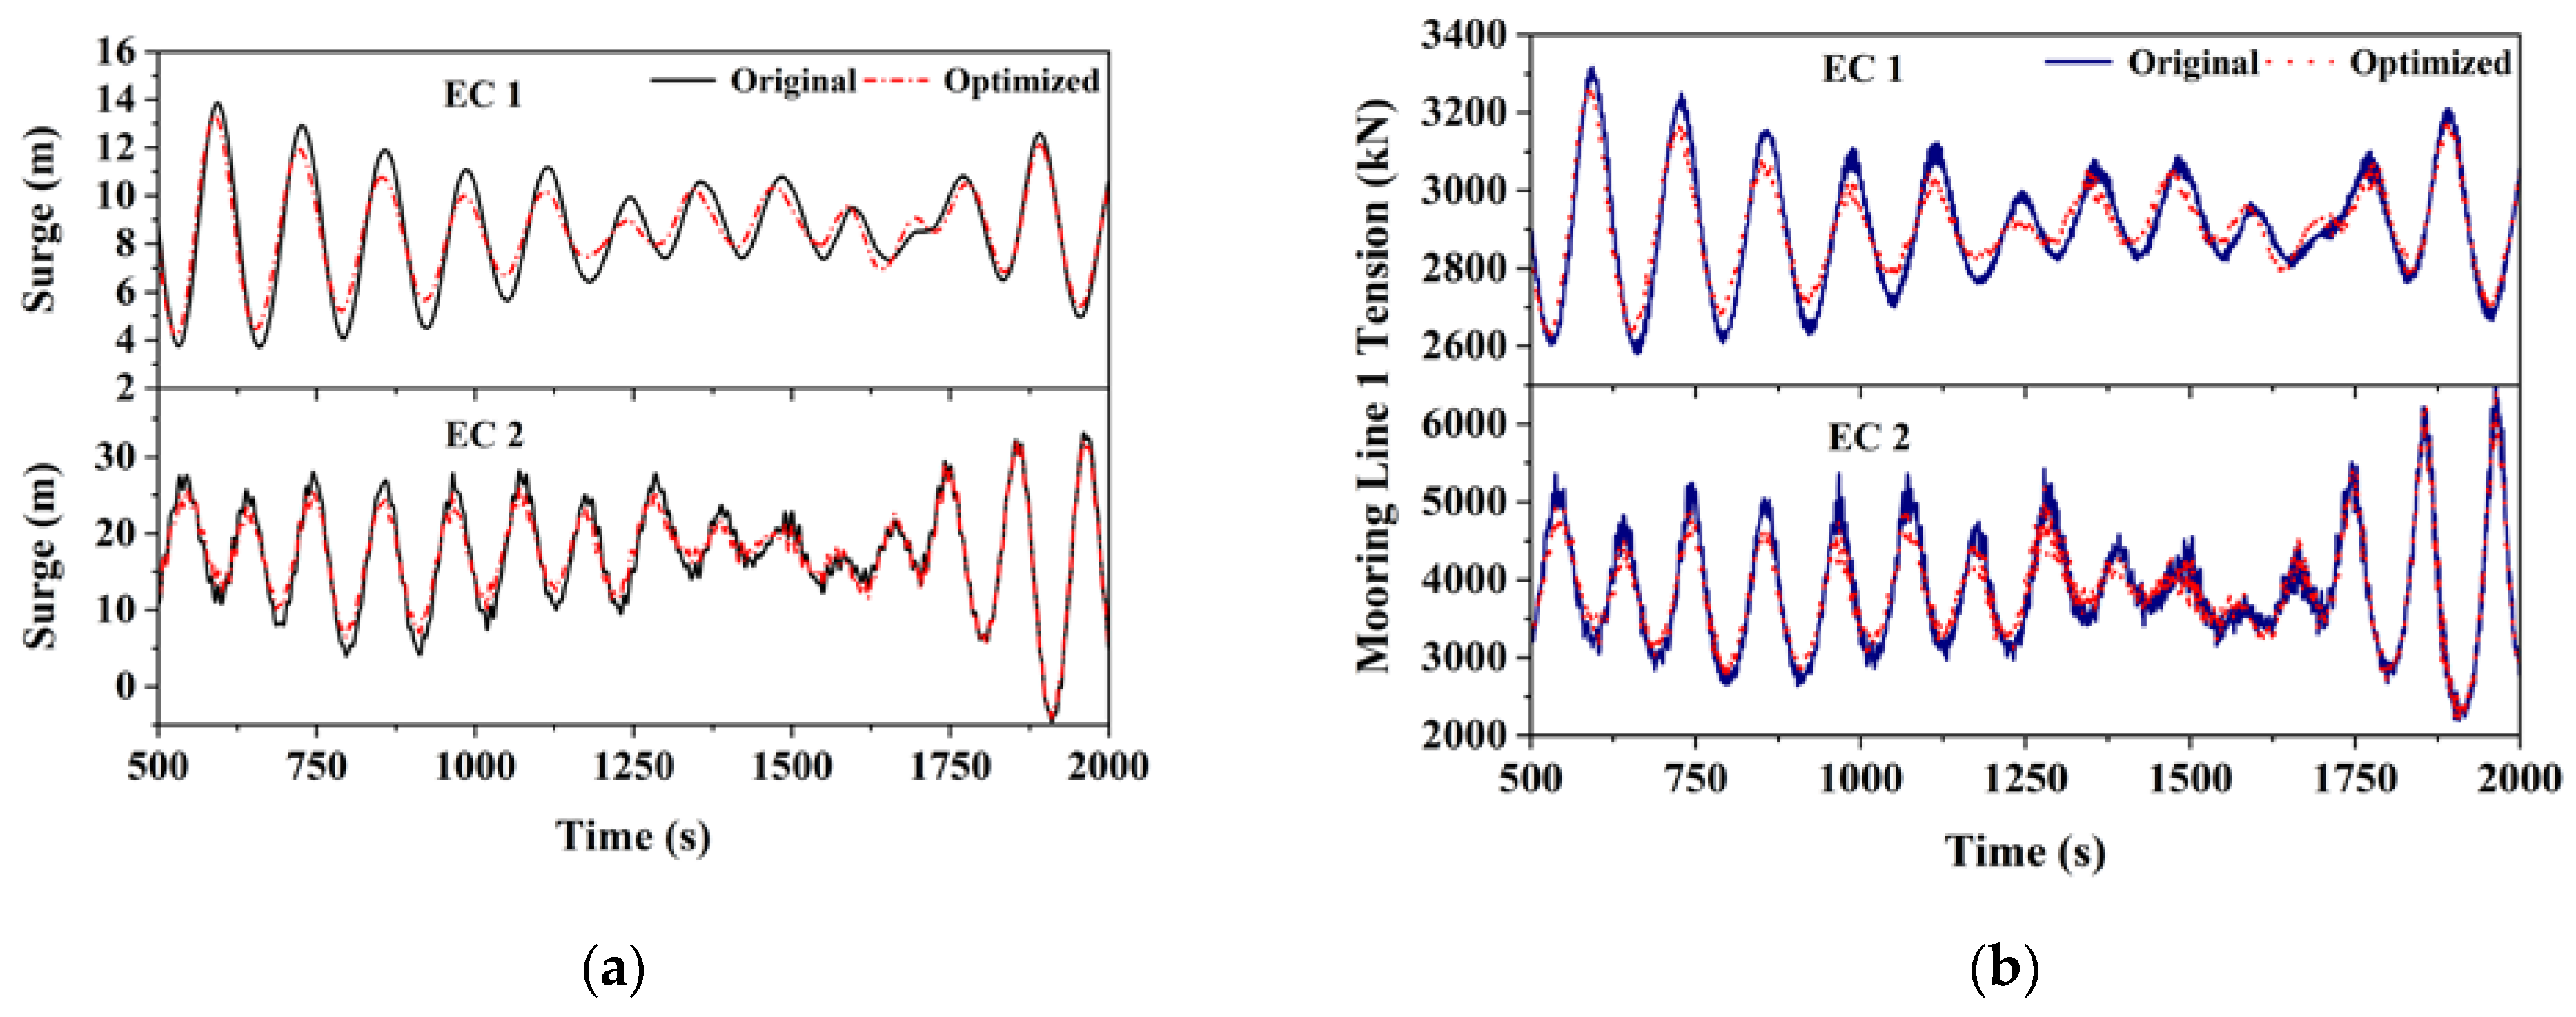
Figure 12 presents the surge response of the wind turbine in the time domain for the two sea states before and after optimization of the floating foundation. Under EC1 conditions, when the wind turbine was operating normally, the extreme values of the surge response of the wind turbine were significantly reduced after the floating foundation was optimized. In the time-domain simulation for the wind turbine with the optimized foundation, the maximum surge motion was 3.80% lower than that of the wind turbine with the original foundation, and the standard deviation of the surge response was reduced by 19.78%. This demonstrates that the surge motion of the optimized wind turbine was more moderate.
The 15 MW wind turbine was shut down due to the high wind speed under EC2 conditions. Due to the high wind speed in extreme sea conditions, the aerodynamic load on the wind turbine was much larger than the wave load, and the optimization of the floating foundation had a relatively weak effect on the motion response of the integrated wind turbine. After the floating foundation was optimized, the maximum value of the surge response of the wind turbine was reduced by 2.78%, and its standard deviation was reduced by 13.31%.
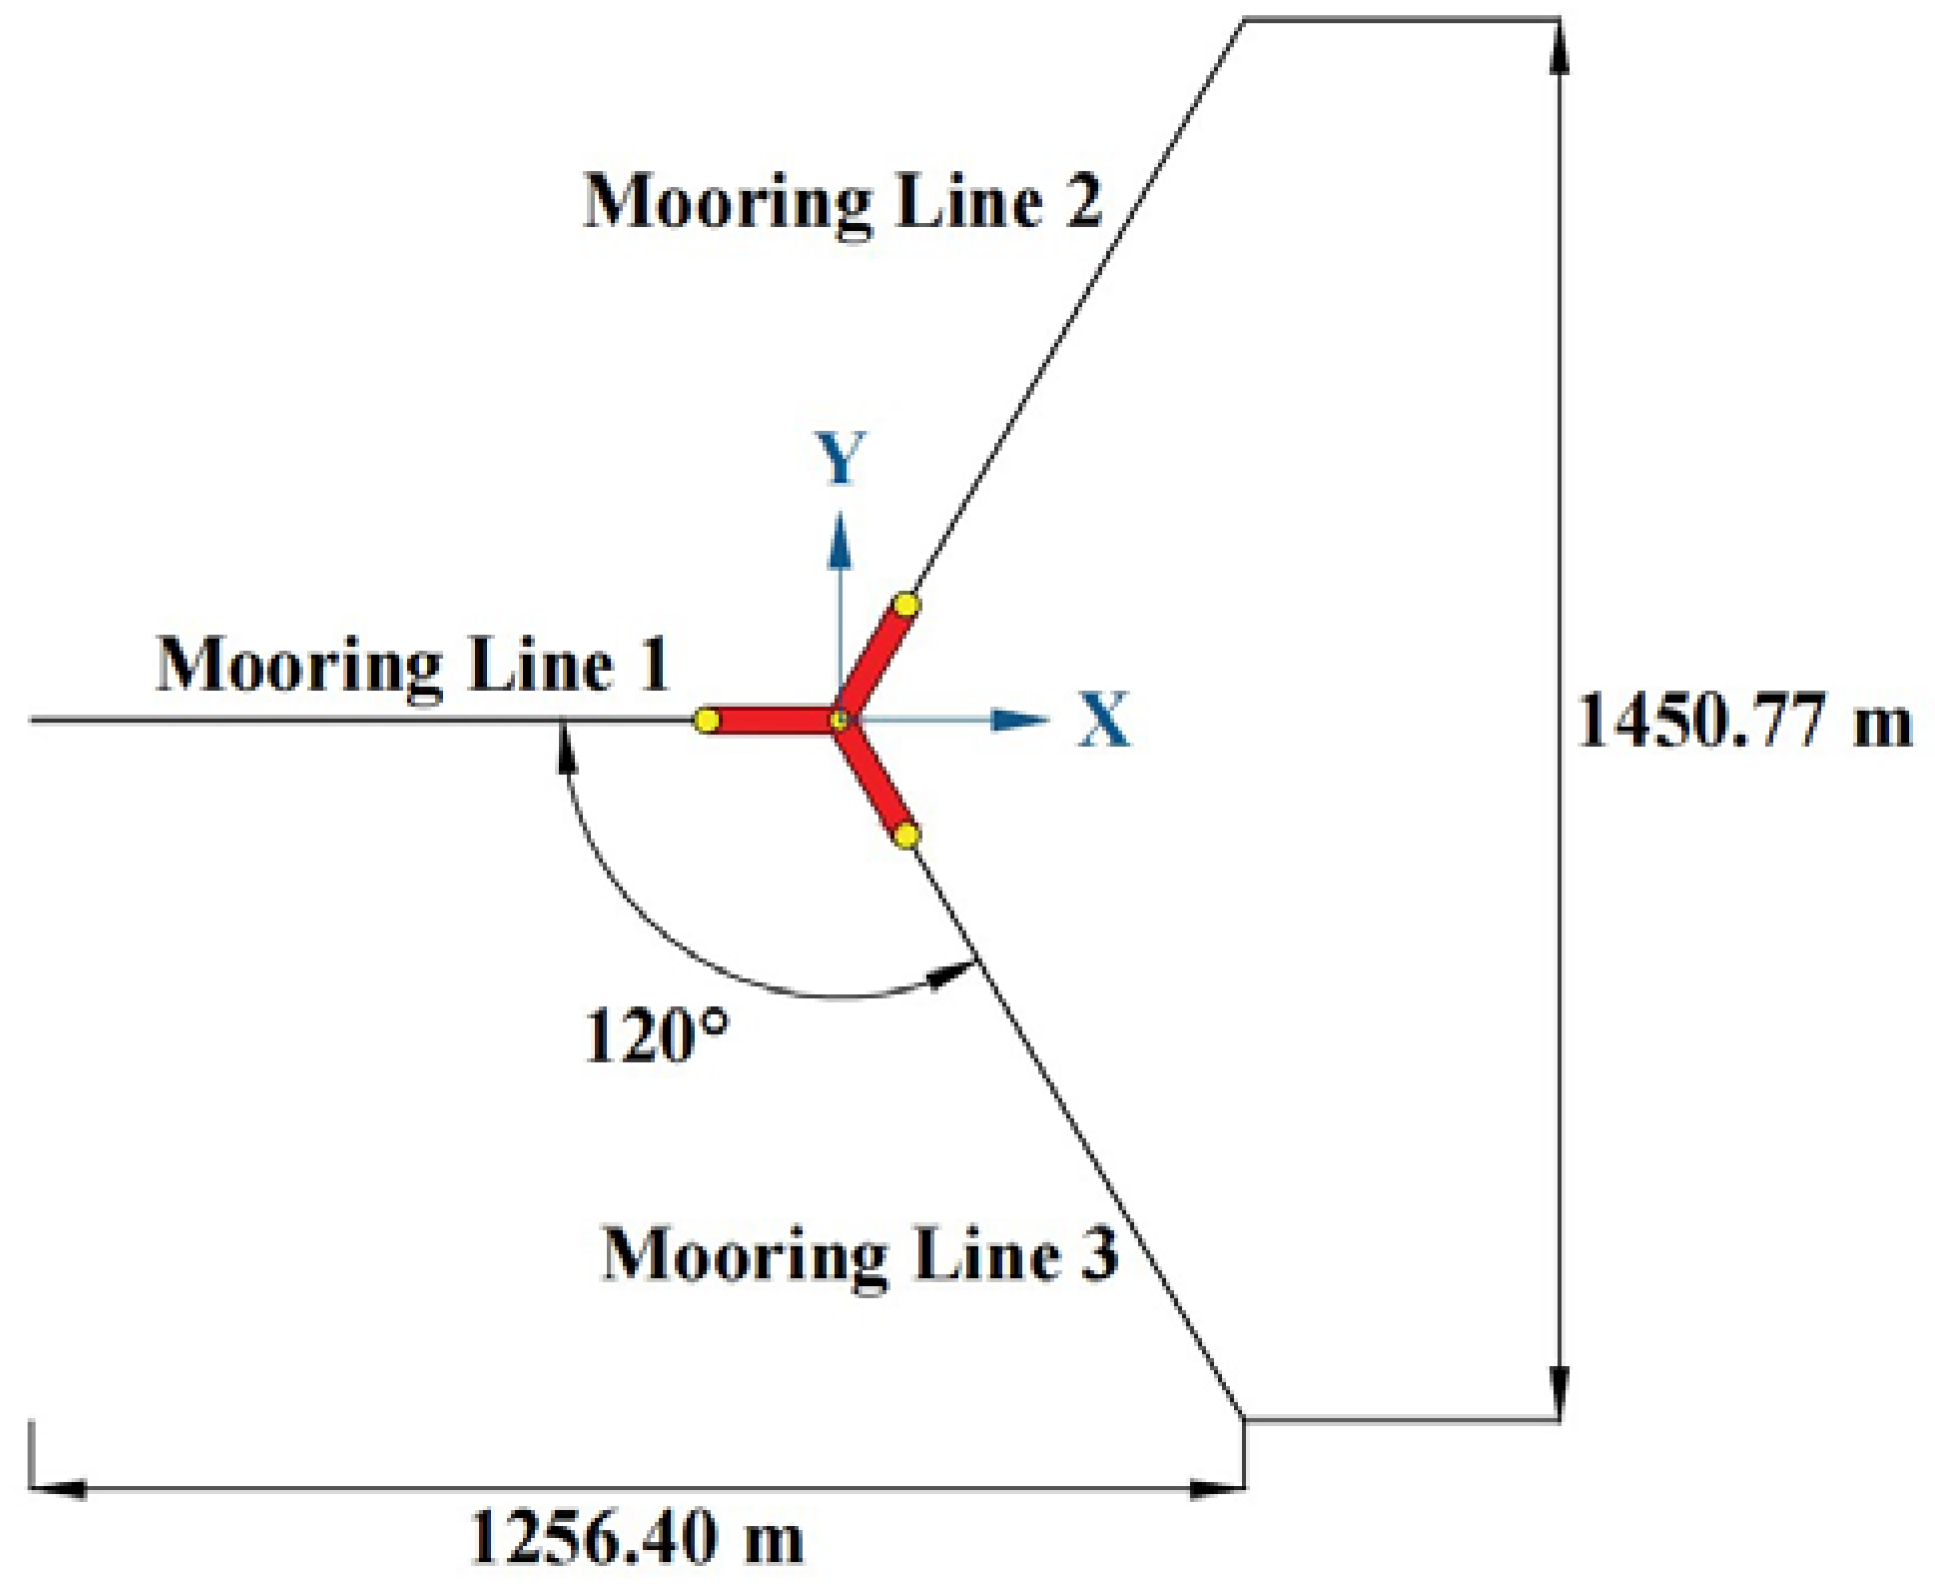
In this study, under the combined action of wind and wave, the first mooring line (ML1) played a significant role in restricting the movement of the floating wind turbine and ensuring its stability. For the optimized floating wind turbine, the tension of the ML1 reduced with the decrease in the surge response, as shown in
Figure 12b. Under EC1 conditions, the maximal tension of the ML1 of the wind turbine with the optimized foundation was reduced by 13.55%, and the standard deviation was reduced by 19.92% compared with the wind turbine with the original floating foundation. Under EC2 conditions, the maximum ML1 tension of the optimized wind turbine was reduced by 5.08%, and the standard deviation was reduced by 14.25%. This shows that the optimization of the floating foundation had a significant effect on decreasing the tension of the mooring line.
In addition, the optimization of the floating foundation also mitigated the sway, pitch, roll, and yaw motions of the wind turbine in the time-domain simulation. UnderEC1 conditions, the standard deviation of the sway response of the optimized wind turbine was reduced by 12.61%. For the pitch response, after optimization of the foundation, the maximum value of the wind turbine in the time domain decreased by 2.08% under EC1 conditions. For the optimized floating wind turbine, the standard deviation of the roll response decreased by 20.95% under EC2 conditions, and the mean value of the yaw response was reduced by 4.74% under EC1 conditions.
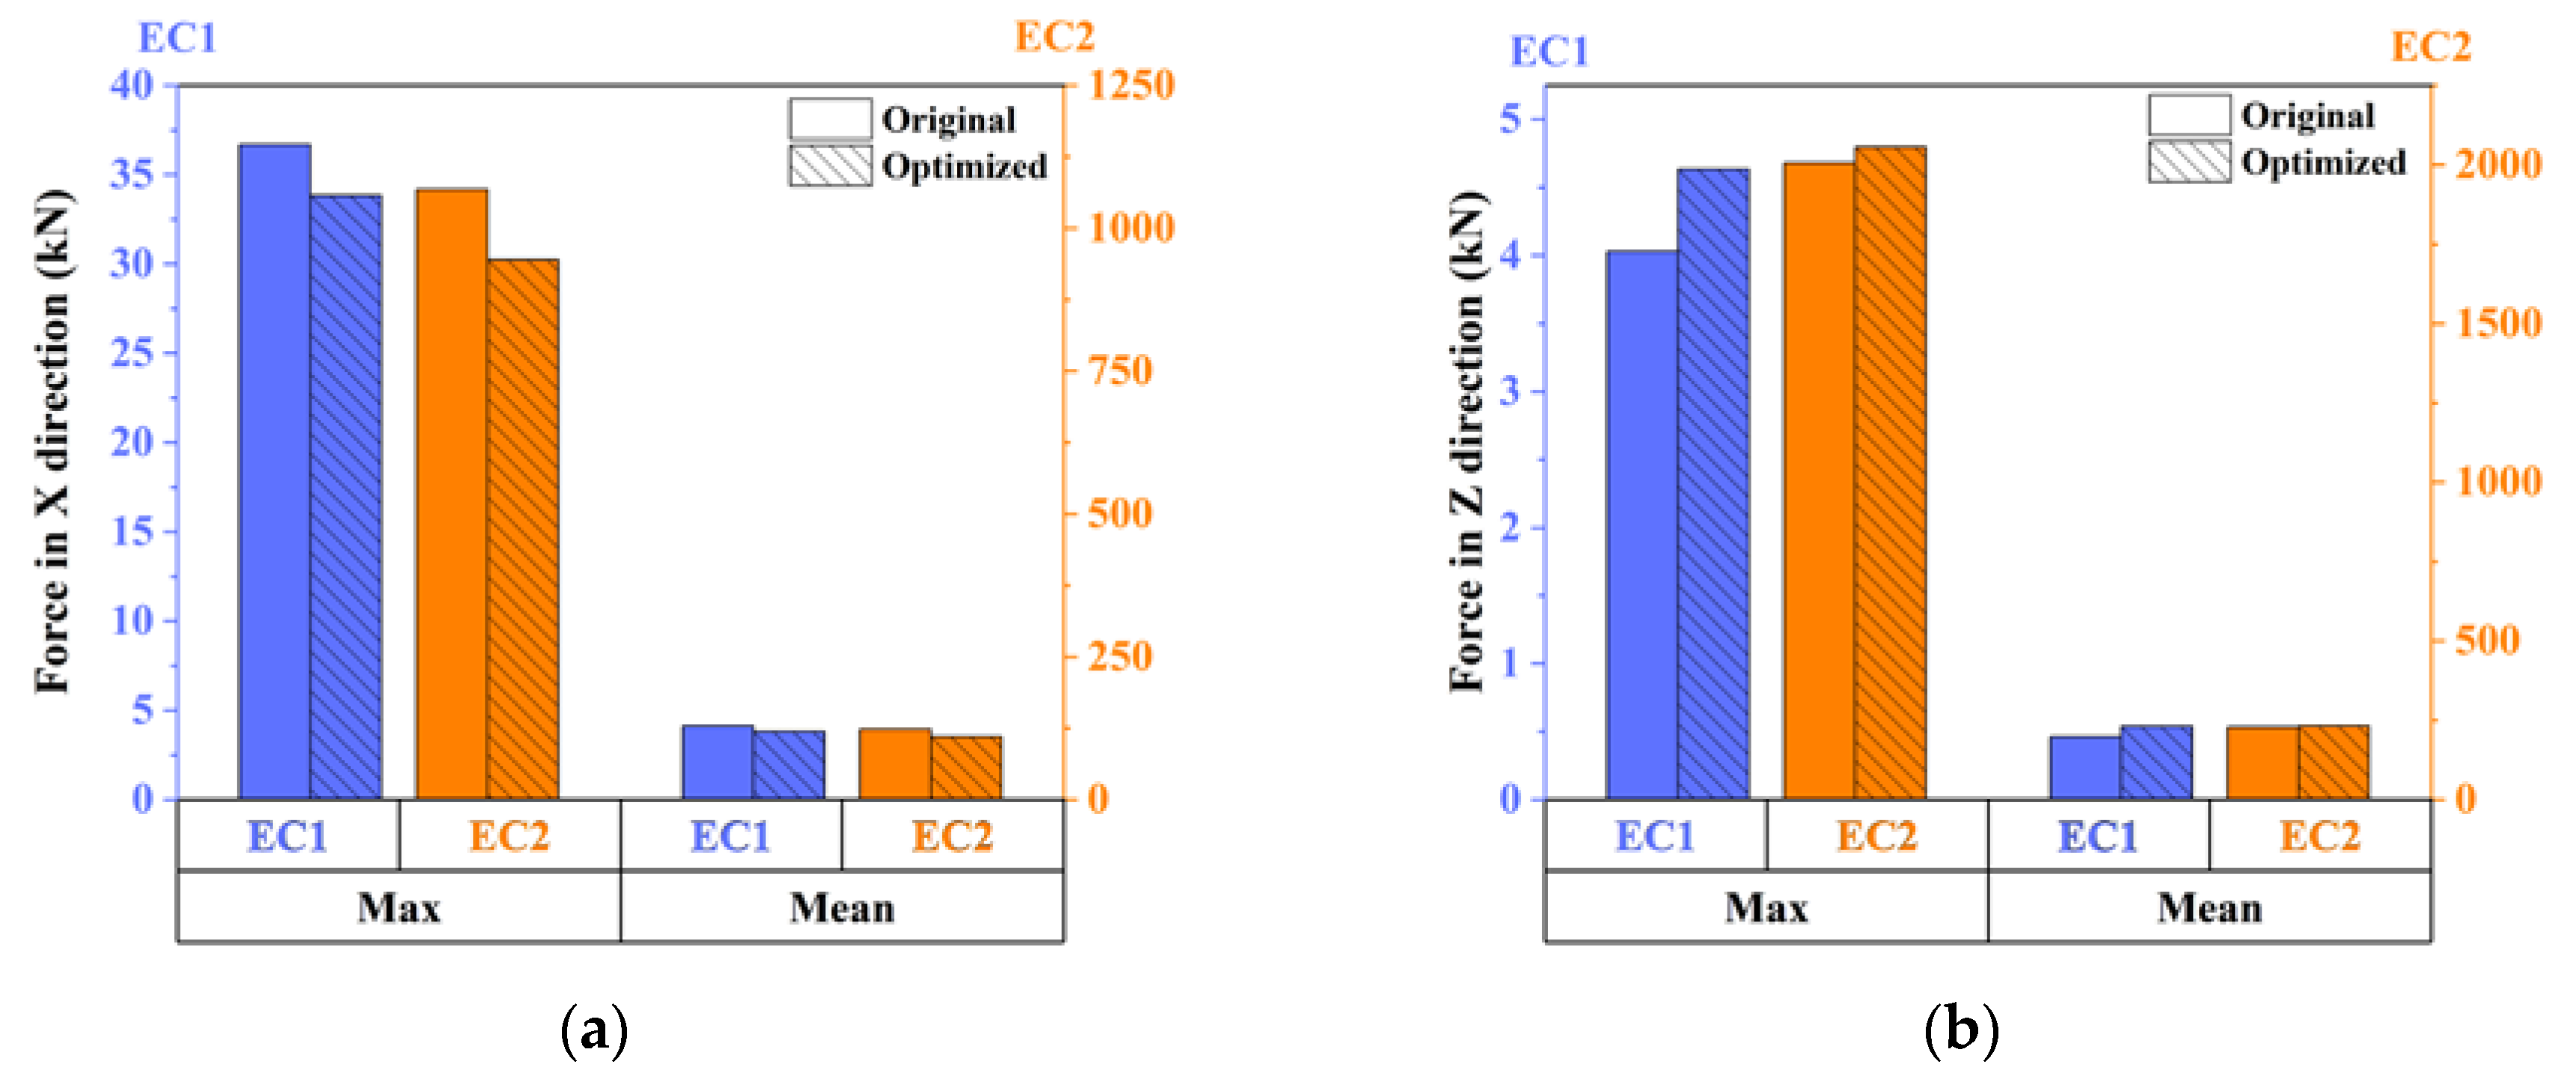
The mean-drift force of the optimized floating wind turbine was also studied.
Figure 13 shows the mean value and maximum value of the mean-drift force experienced by the wind turbines with the original and optimized floating foundations in different sea conditions. In
Figure 13, the horizontal axis represents the maximum and mean values of the mean-drift forces on the FOWT under the two environmental conditions in the time domain simulation. The bar with diagonal lines in the legend indicates the statistical values of the mean-drift forces generated by the optimized FOWT, and the bar without patterns inside indicates the statistical value of the mean-drift forces on the original FOWT before optimization. The orange bars represent the statistical values of the mean-drift forces to which the two FOWTs were subjected under EC2 conditions, the magnitude of which is indicated by the orange vertical axis on the right side of the figure. The blue bars represent the statistical values of the mean-drift forces on the two FOWTs under EC1 conditions, the magnitude of which shown in the blue vertical axis on the left side of the figure. For example, in
Figure 13a, the leftmost blue bar without patterns inside shows the maximum value of the mean-drift forces on the original FOWT under EC1 conditions in the time domain simulation; the rightmost orange bar with diagonal lines represents the mean value of the mean-drift forces on the optimized FOWT under EC2 conditions.
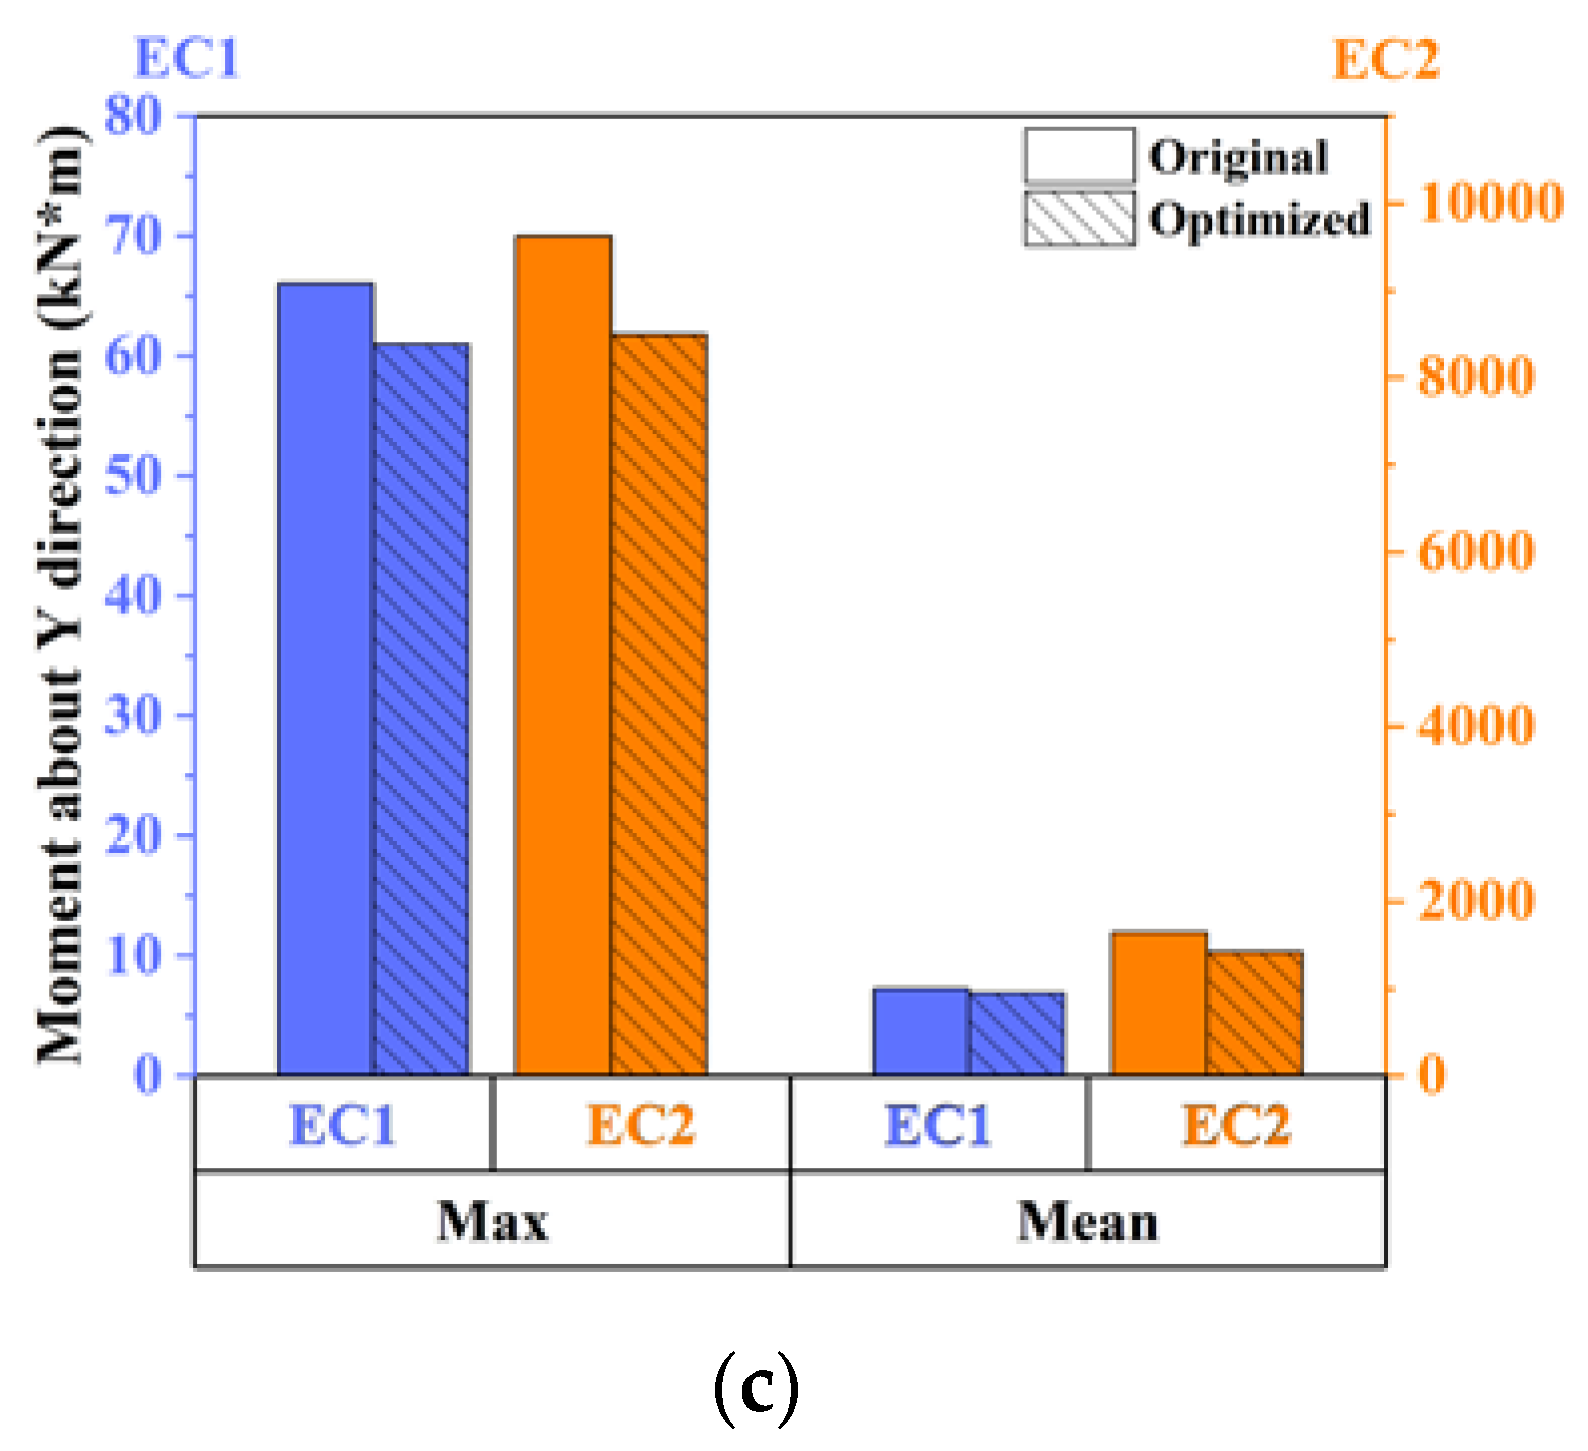
Compared with the wind turbine on the original foundations, it can be observed that the mean and maximum values of the longitudinal force and moment on the wind turbine were each reduced after optimization of the foundation, as shown in
Figure 13a,c. After the floating foundation was optimized, the maximum and mean values of the longitudinal force decreased by about 7.75% under EC1 conditions. For the 15 MW wind turbine with the optimized foundation under the EC2 conditions, the maximum value of the longitudinal moment was reduced by 11.68%, and the mean value was 13.43% lower than that of the wind turbine with the original foundation. However, in both EC1 and EC2 conditions, the vertical force on the wind turbine using the optimized foundation showed little increase compared with that on the original foundation, as shown in
Figure 13b.
5. Conclusions
The structural parameters of the UMaine VolturnUS-S reference floating foundation are studied in this paper. The structural parameters of the floating foundation were considered in changes with a step size of 2.5% within the range of 90% to 110% of the design value. This study investigated the effects of the distance between the central column and the outer columns, as well as the diameter of the outer column, on the hydrodynamic performance of the floating foundation. Based on those results, the UMaine floating foundation was optimized and coupled with the 15 MW wind turbine. The dynamic performance of the optimized integrated FOWT was analyzed under normal and extreme conditions in the time domain, and compared with the FOWT using the original floating foundation model. The meaningful conclusions are as follows:
Within the variation range of column spacing studied in this paper, the change in column spacing had a significant influence on the hydrodynamic performance of the floating foundation. For the motion of the foundation, the increase of column spacing decreased the peak value of the surge transfer function. Since the inertia moment of the foundation became larger with the increase of column spacing, the restoring moment of the foundation also increased. At the same time, due to the increase of the column spacing, the pontoons of the foundation became longer, leading to an increase of the displacement volume of the foundation. These two factors eventually reduced the peak value of the pitch transfer function. In other words, the increase of column spacing can effectively mitigate the amplitude of the resonance motion when the wave frequency approaches the natural surge and pitch frequencies. The heave motion can also be affected by the change in column spacing. In the variation range of the column spacing, the peak value of the heave transfer function was the largest when the column spacing was 92.5% of the original design value. In addition, the peak value of the transfer function for the wave excitation force on the floating foundation increased with the increase of column spacing;
The change in the outer column diameter also significantly affected the hydrodynamic performance of the foundation. For the range of column diameters studied in this paper, with the continuous increase of the outer column diameter, the peak value of the surge transfer function appeared to demonstrate an obvious upward trend. The peak value of the heave transfer function decreased with the increase of the column diameter, but the overall variation of amplitude was small. The change of column diameter had a great impact on the pitch response of the foundation. A larger column diameter enlarged the water-plane area and the displacement volume of the floating foundation, which affected the restoring moment of the floating foundation. From the results of this paper, it appears that the increase of column diameter resulted in a relative decrease of the longitudinal restoring moment for the floating foundation, thereby increasing the peak value of the pitch transfer function. It can be seen that the reduction of the column diameter can moderate the pitch resonance motion of the floating foundation;
Based on the results of the investigation into the structural parameters of the floating foundation, this study selected an optimization scheme for the foundation, with the column spacing increasing to 105% of the original design value and the diameter of the outer column decreasing by 5% compared with the original design value. After combining the optimized foundation with the 15 MW wind turbine, and comparing it with the wind turbine on the original foundation, it was found that the surge motion of the optimized wind turbine can be mitigated under normal conditions. In extreme conditions, the optimization of the foundation played a relatively weak role due to the tremendous aerodynamic load. After the optimization of the foundation, the sway, pitch, roll, and yaw motions of the floating wind turbine were also reduced to varying degrees. In particular, for surge responses under normal operating conditions, the standard deviation was reduced by 19.78% after optimization of the foundation. The tension of the mooring line on the optimized wind turbine was also reduced, as a result of the more moderate surge motion. In addition, the longitudinal mean-drift force and moment suffered by the wind turbine were also decreased owing to the optimization of the floating foundation.
This paper aimed to study the influence of structural parameters on the hydrodynamic performance of the UMaine VolturnUS-S reference floating foundation. Other parameters (including draft) remained unchanged while the column spacing and the outer column diameters were changed during the investigation. The variation of column spacing and the outer column diameter changed the water-plane area, the inertia moment, and the displacement volume, which affected the draft and stability of the floating foundation. Therefore, further research should be carried out in future to consider other structural parameters and the stability of the floating foundation, and to further the optimization of the FOWT.


