
Optimisation of Control Strategies for Power Shift Gearboxes
 ,
,
Abstract
:1. Introduction
2. Materials and Methods
2.1. Power Shift Control Theory
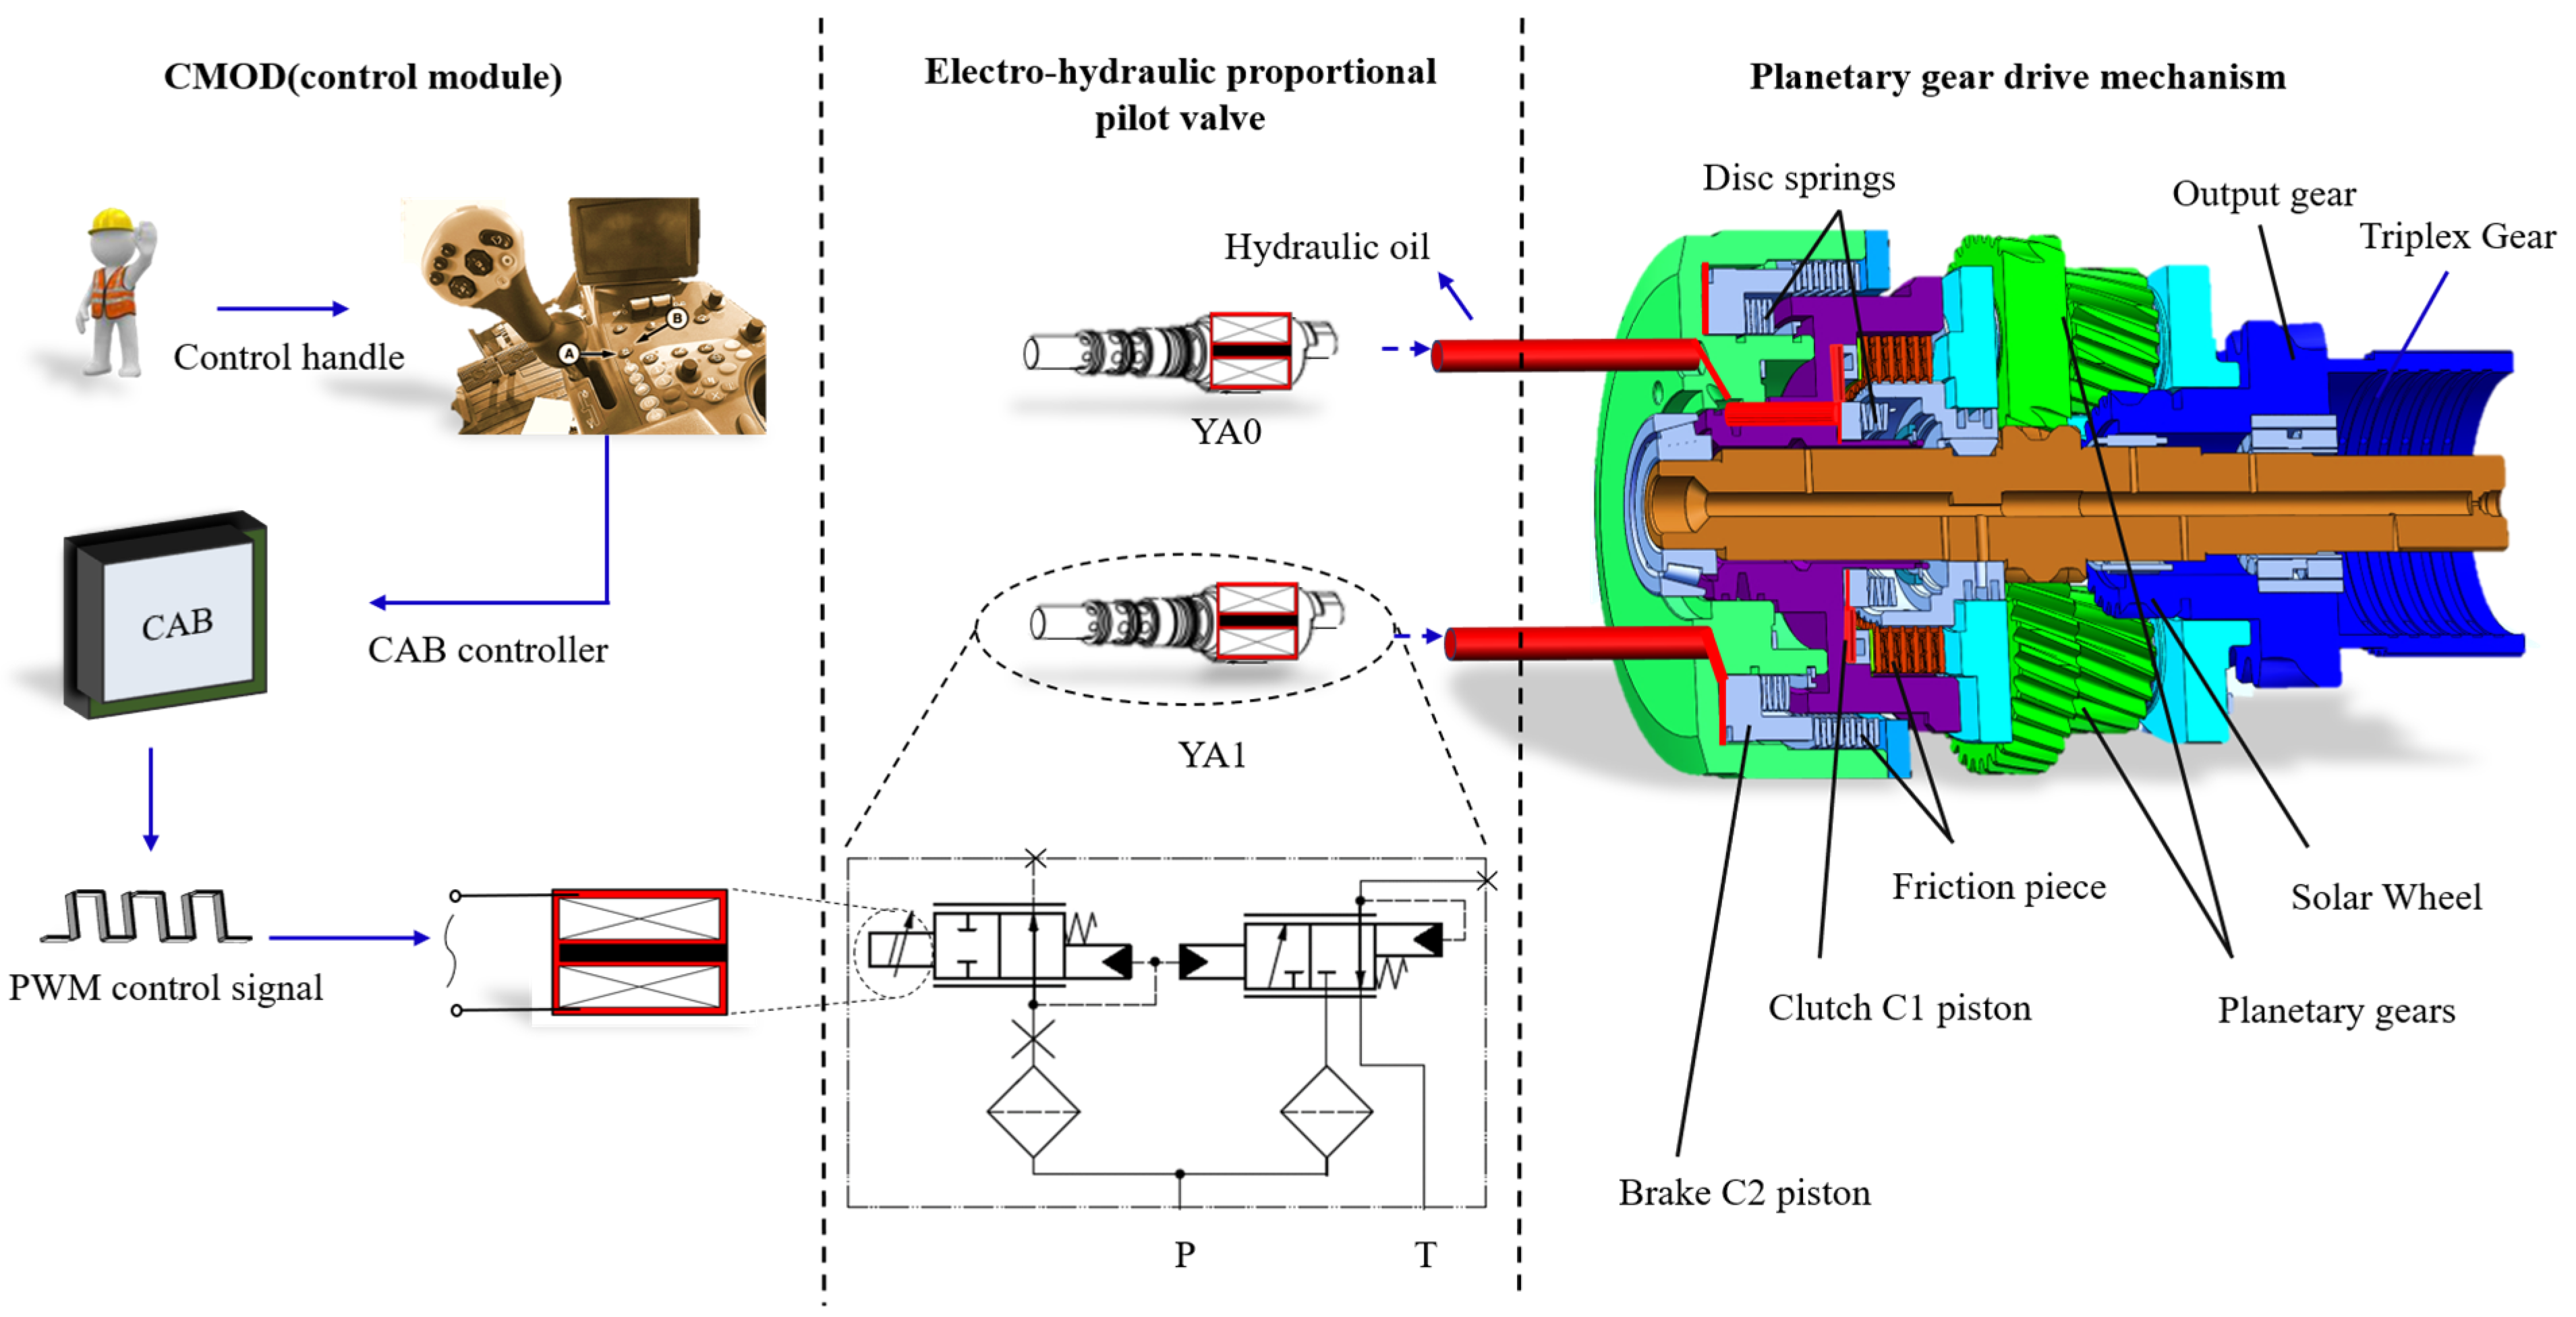
2.1.1. Power shift Control Module
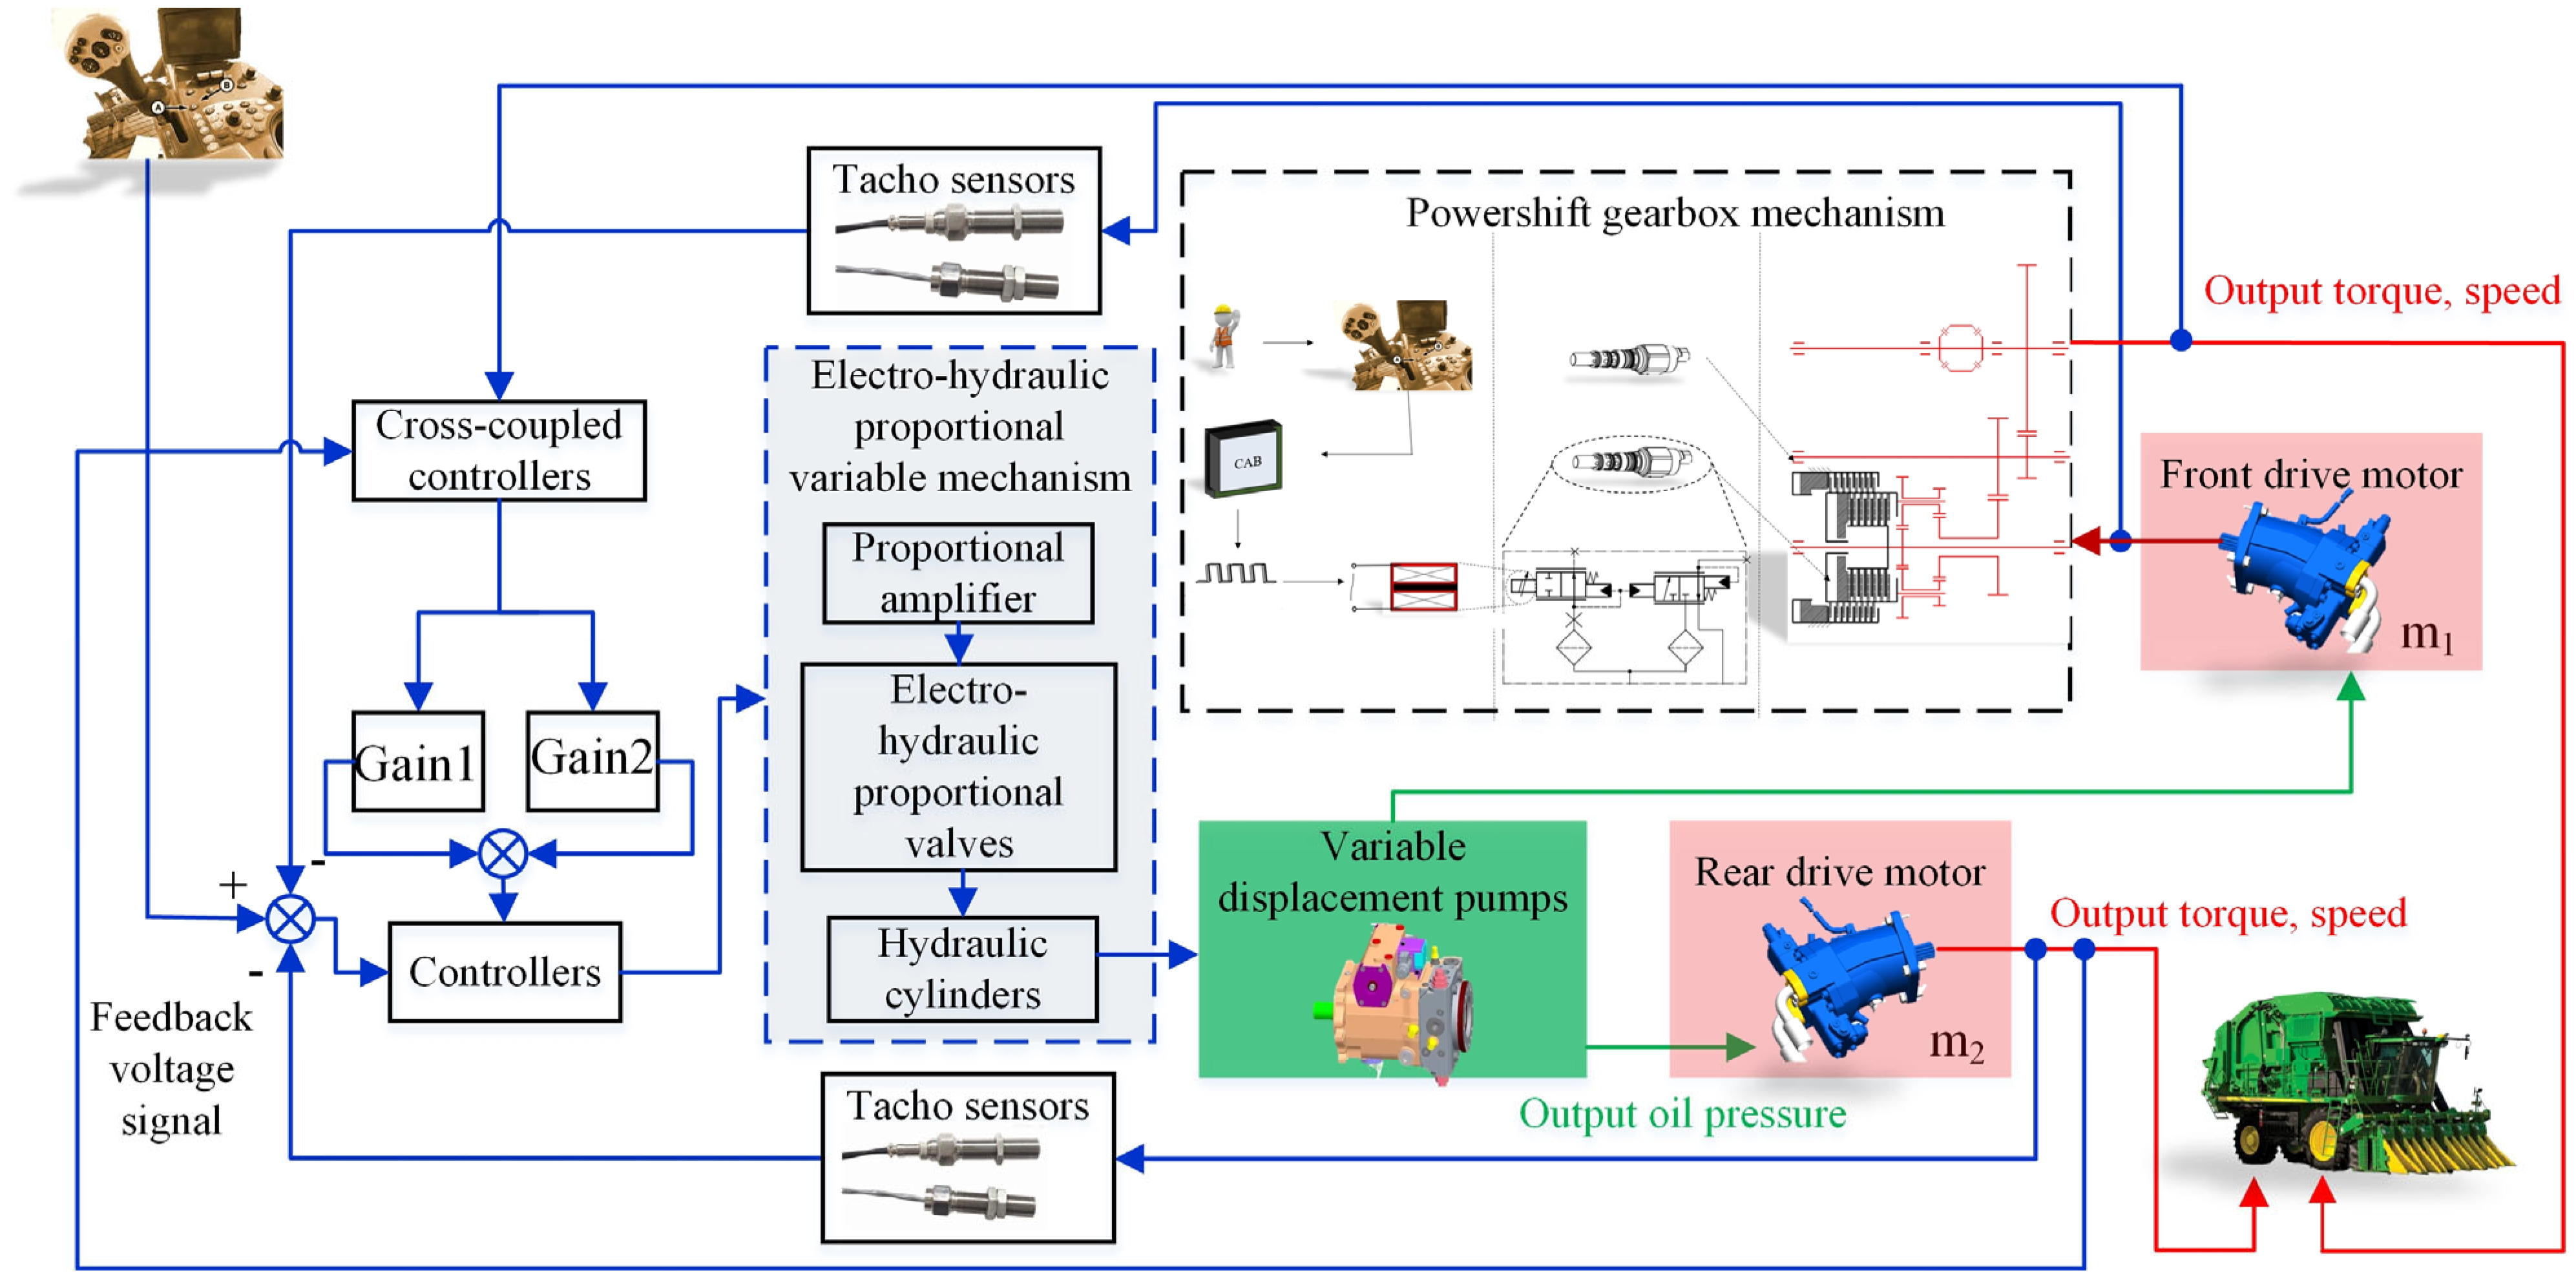
2.1.2. Hydraulic Travel System Module
2.2. Control Strategy and Whole-Vehicle Model Building
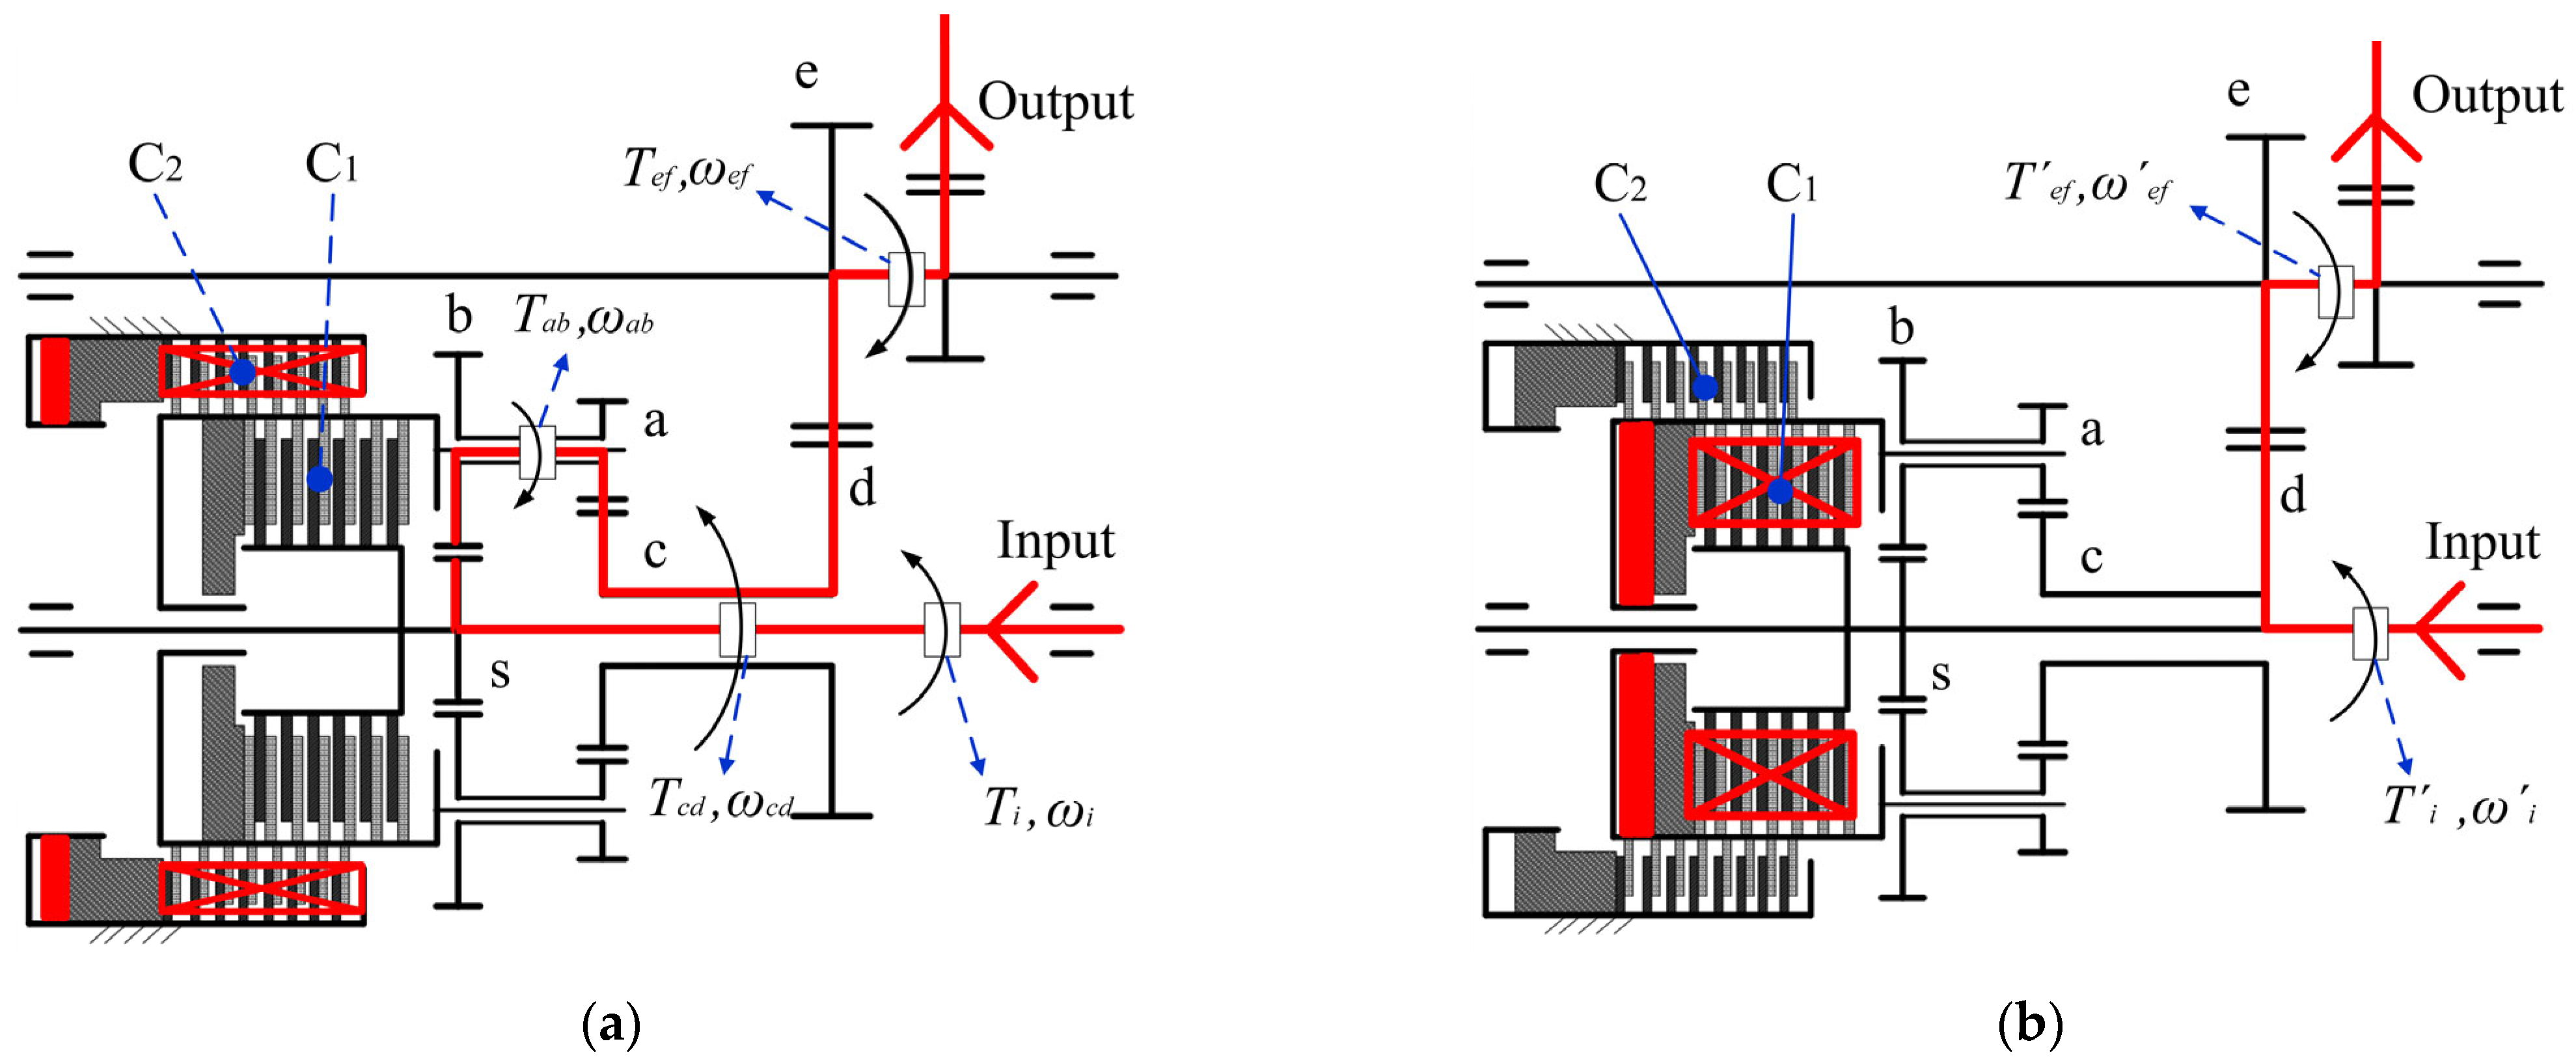
2.2.1. Structure Design of Gearshift Mechanism
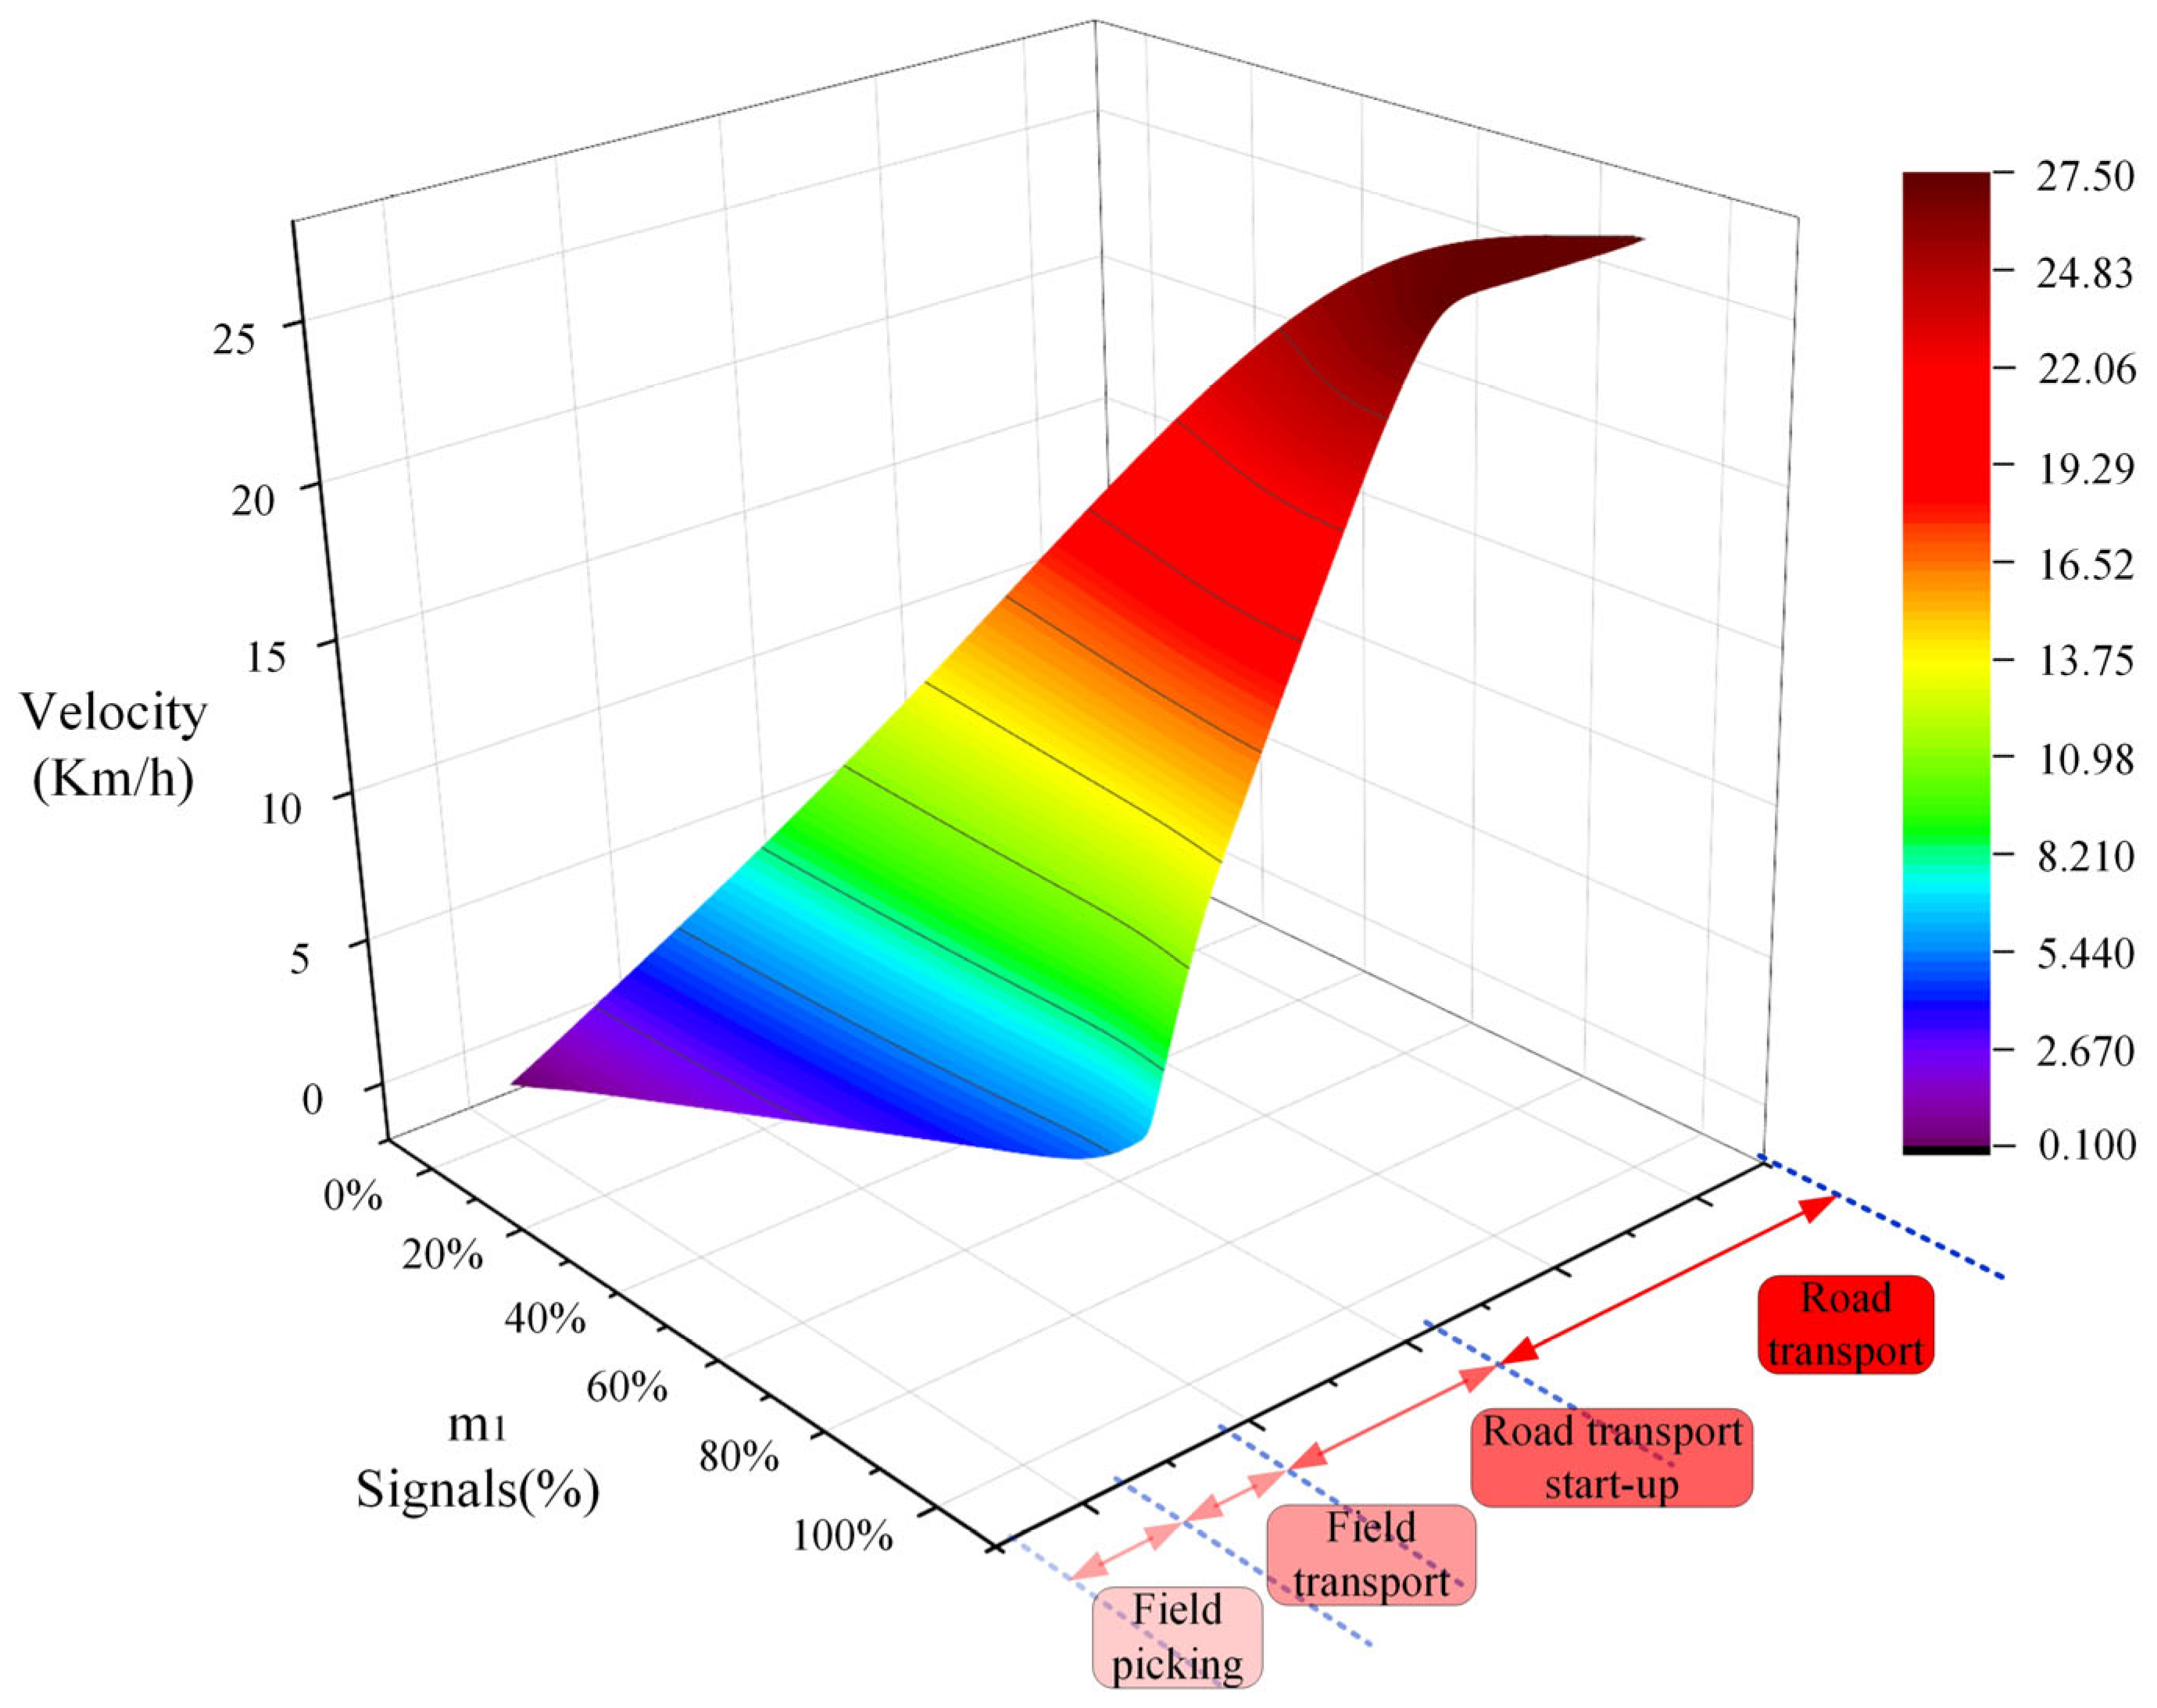
2.2.2. Power Shift Speed Ratio Matching
2.2.3. Shift Smoothness Rating Index
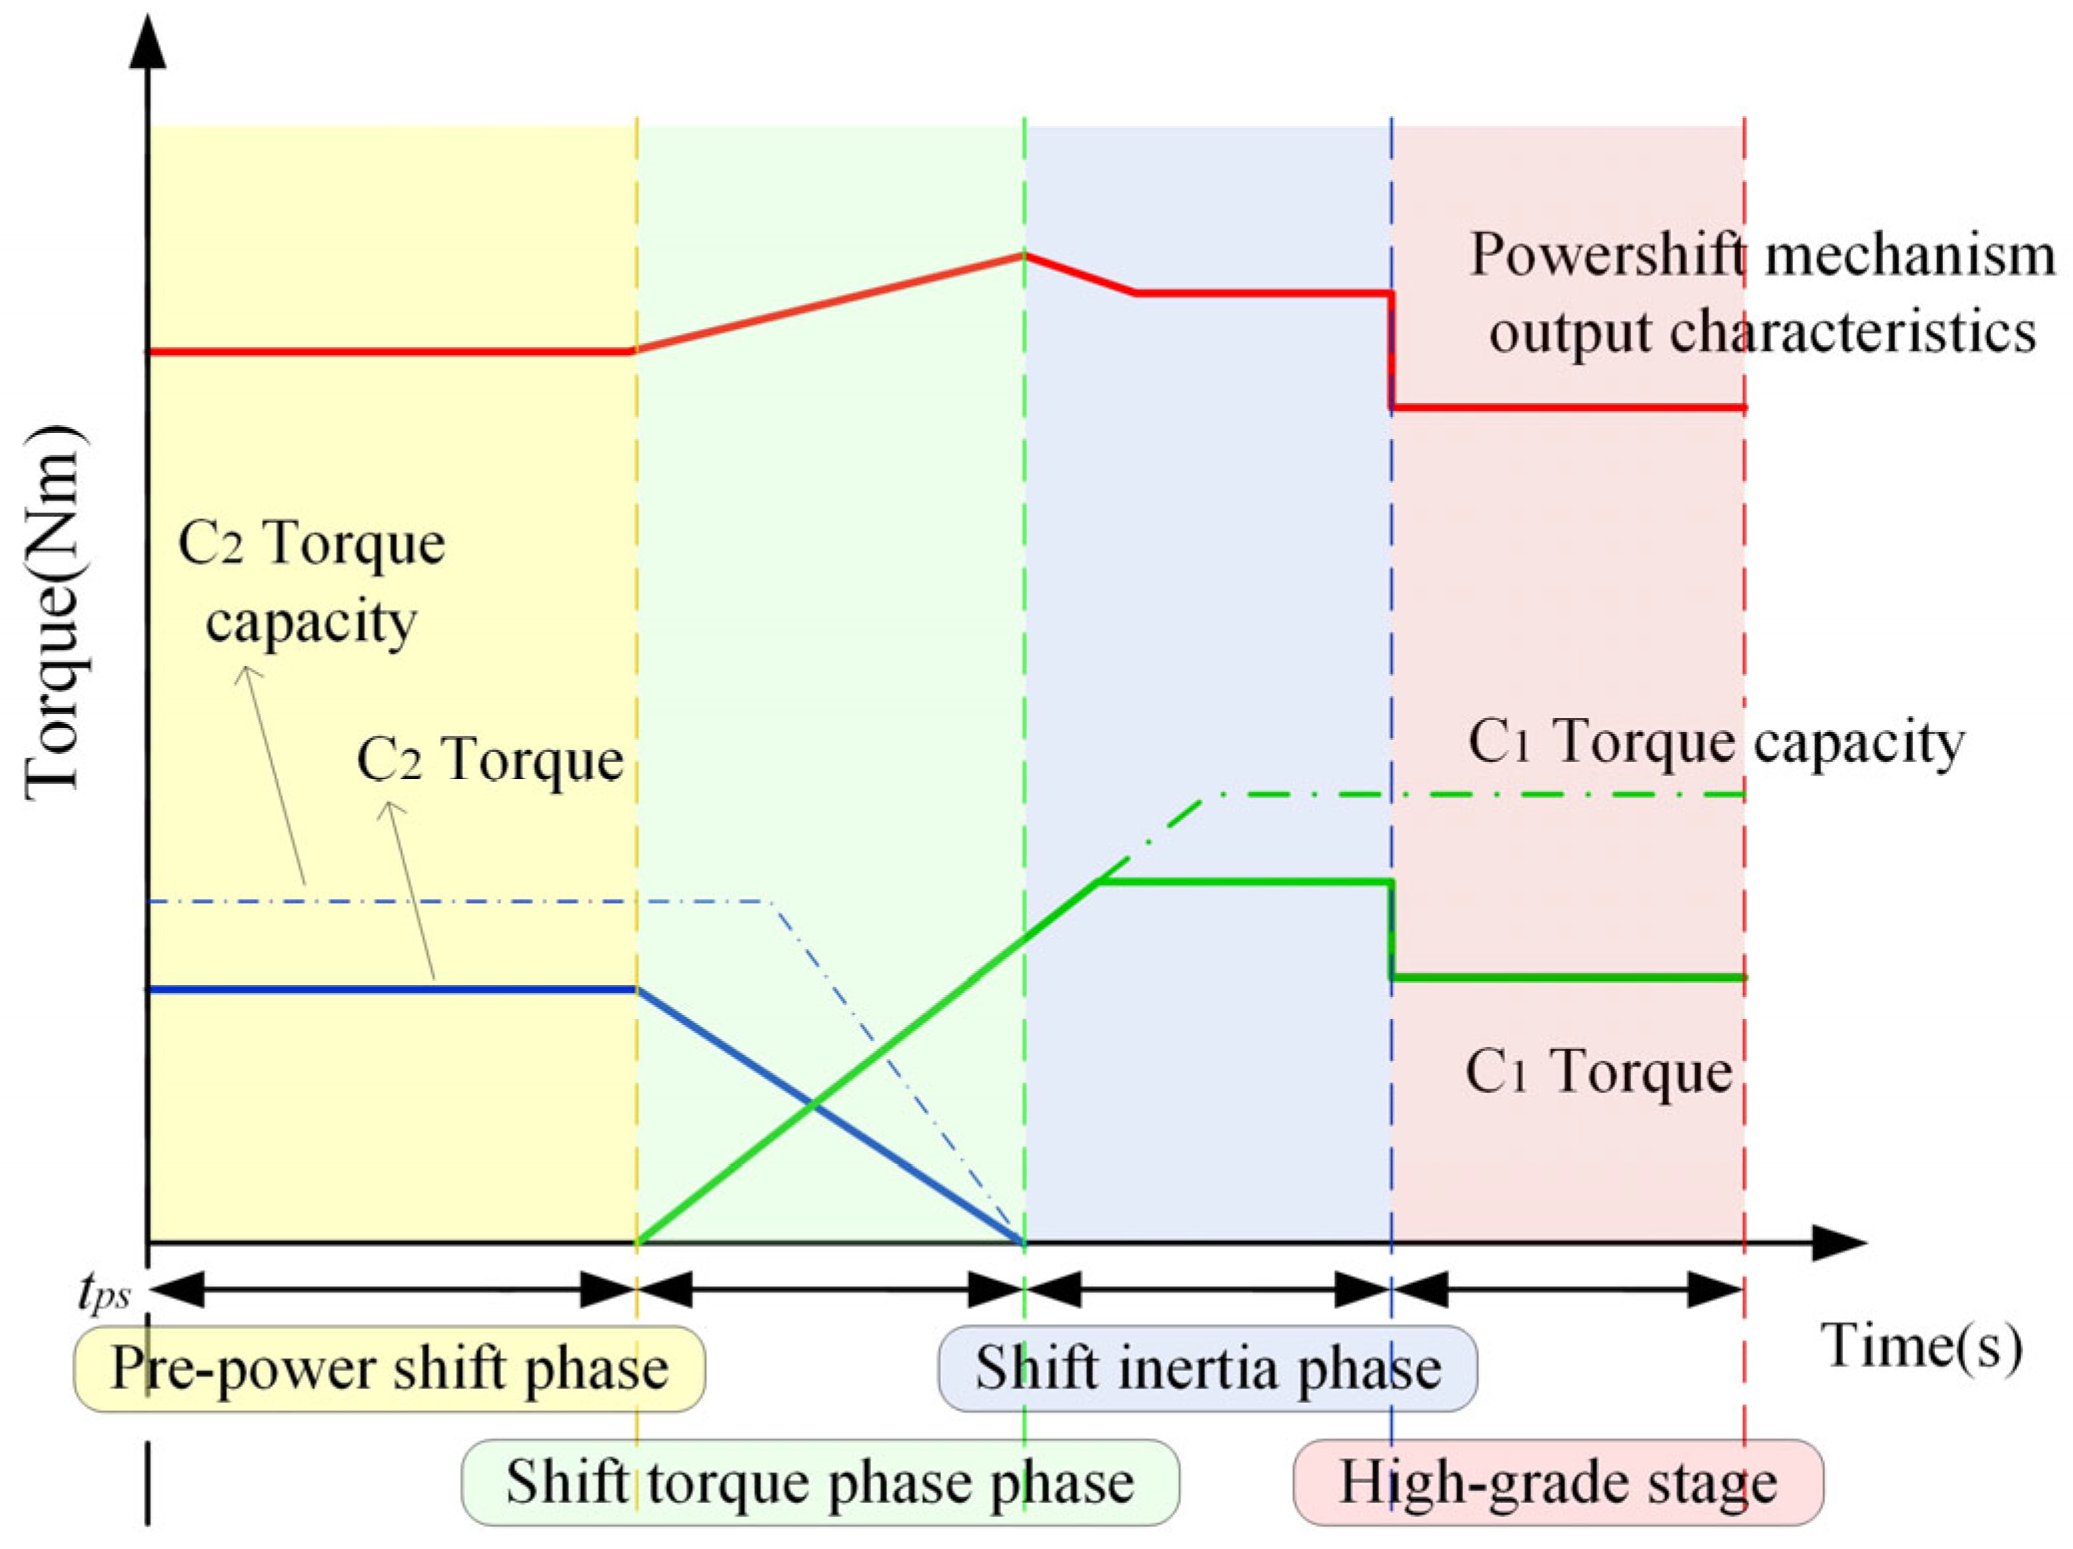
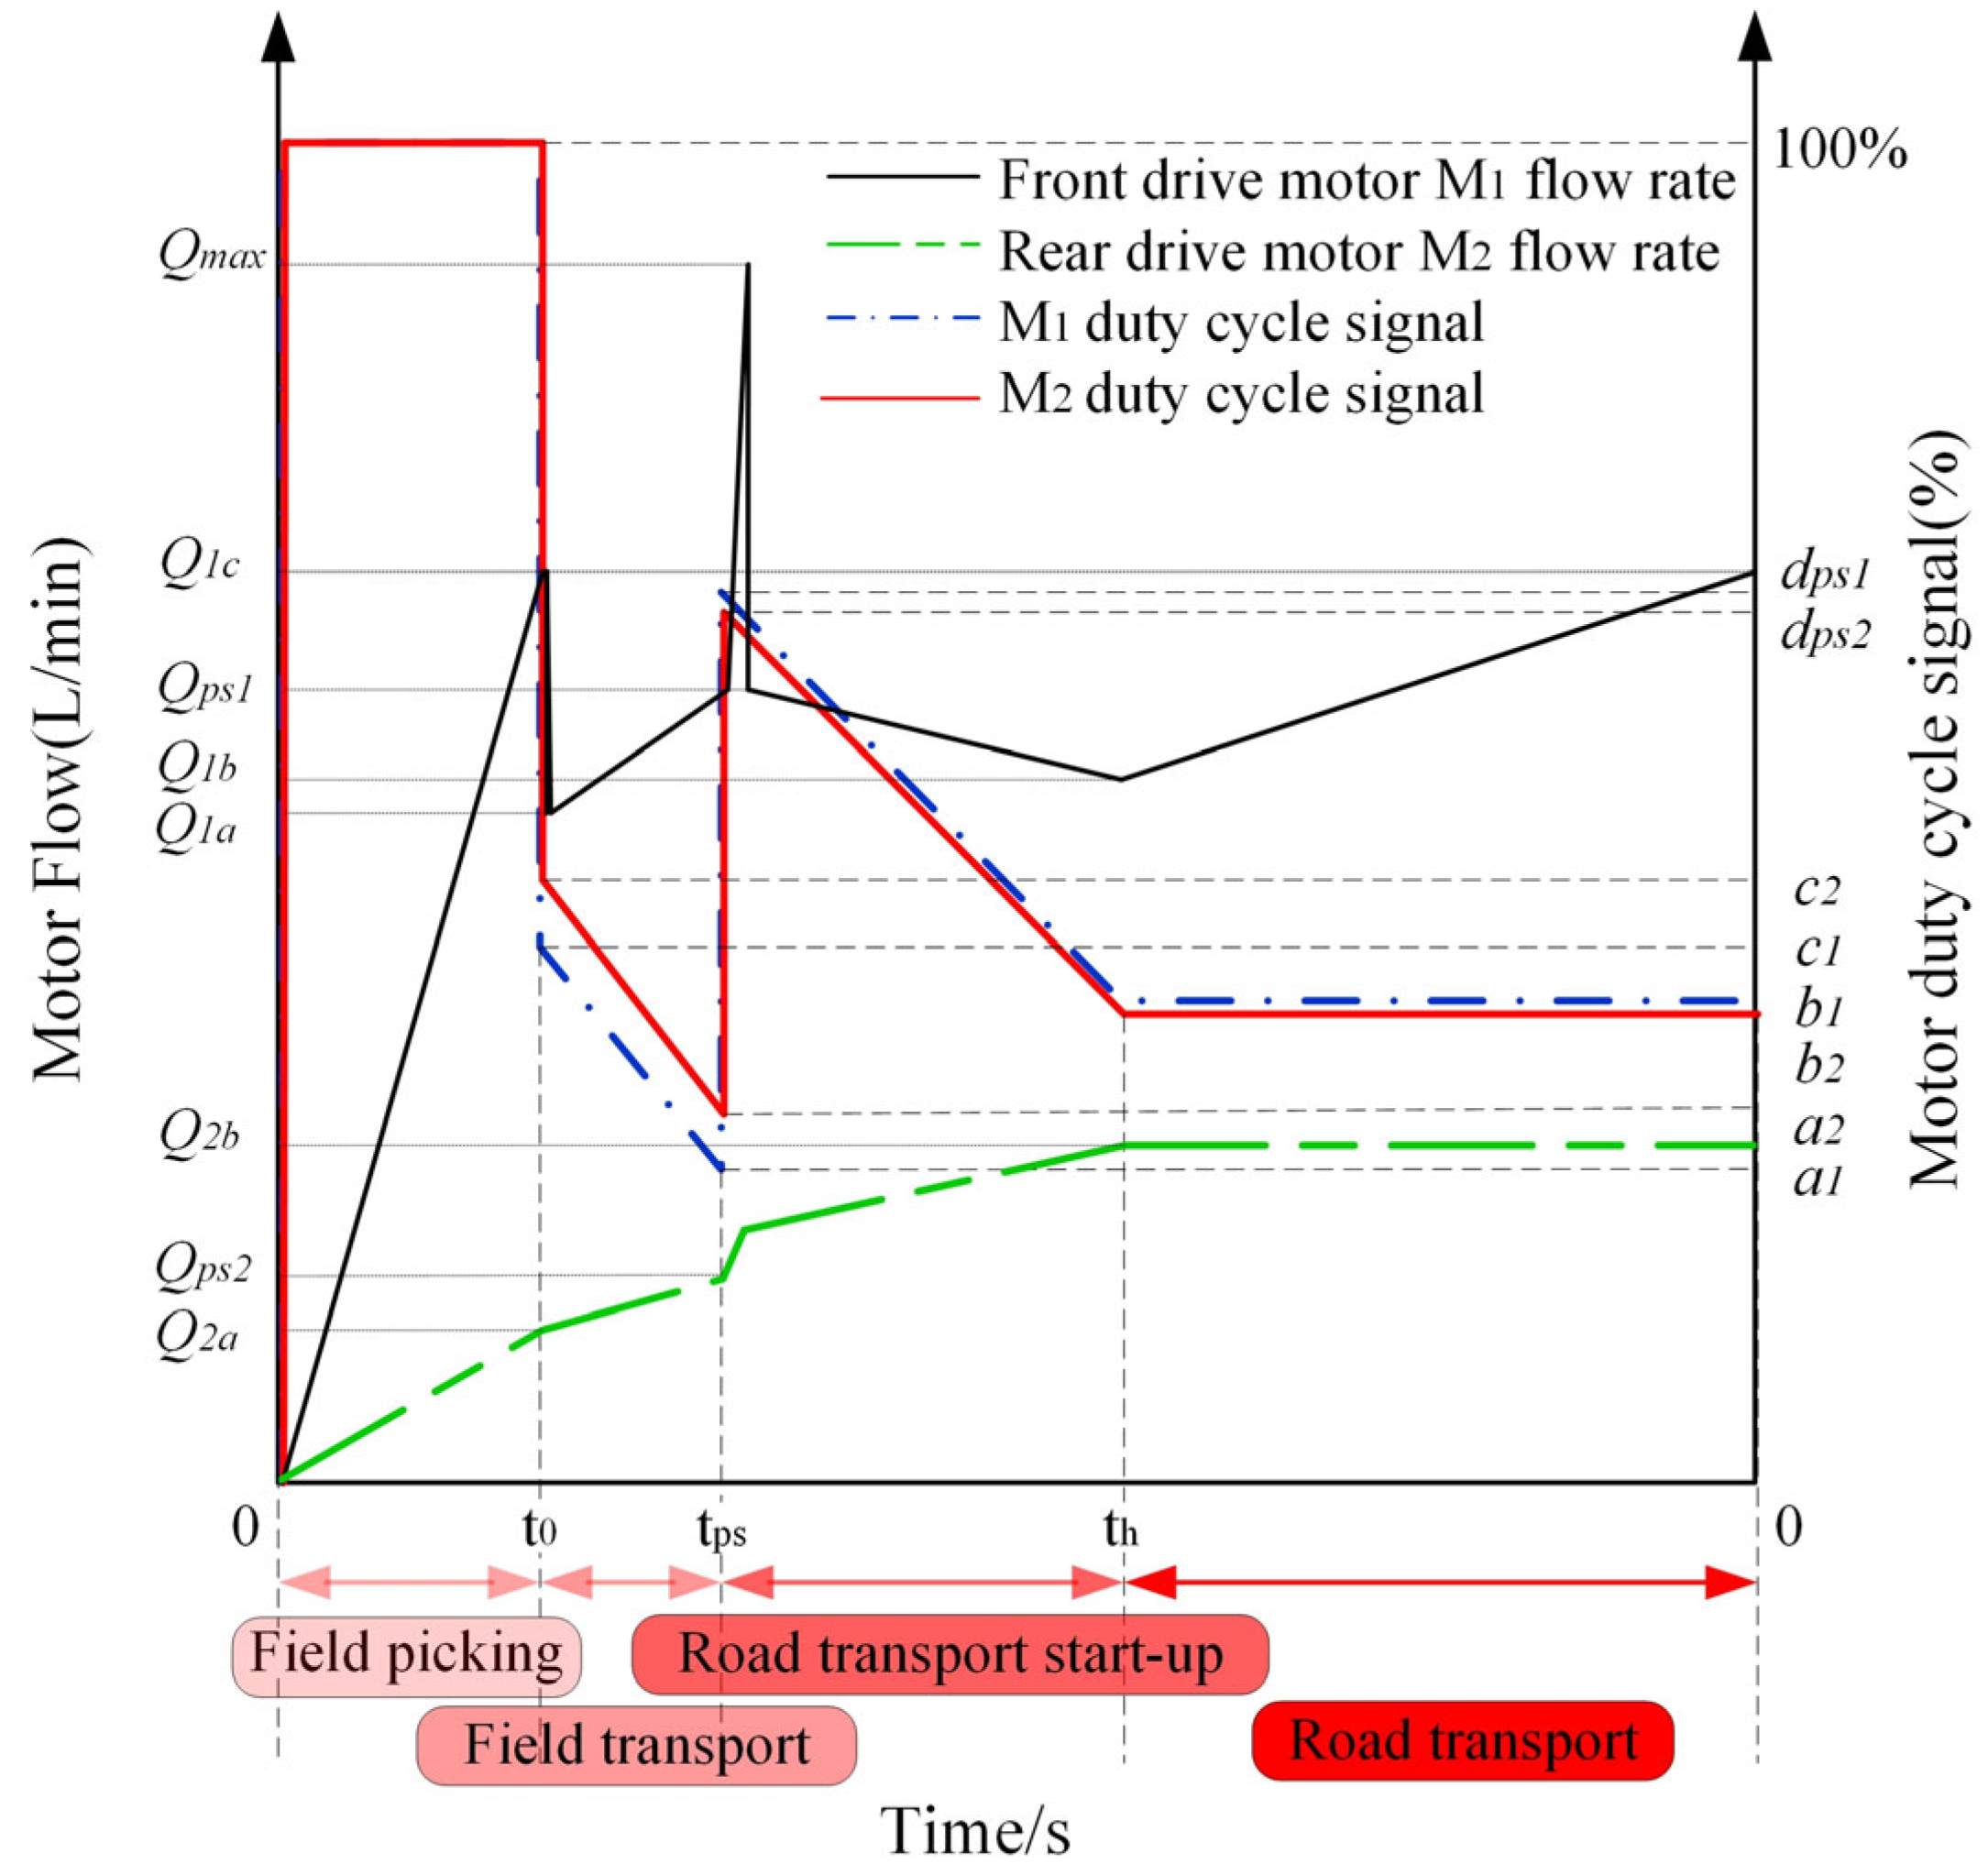
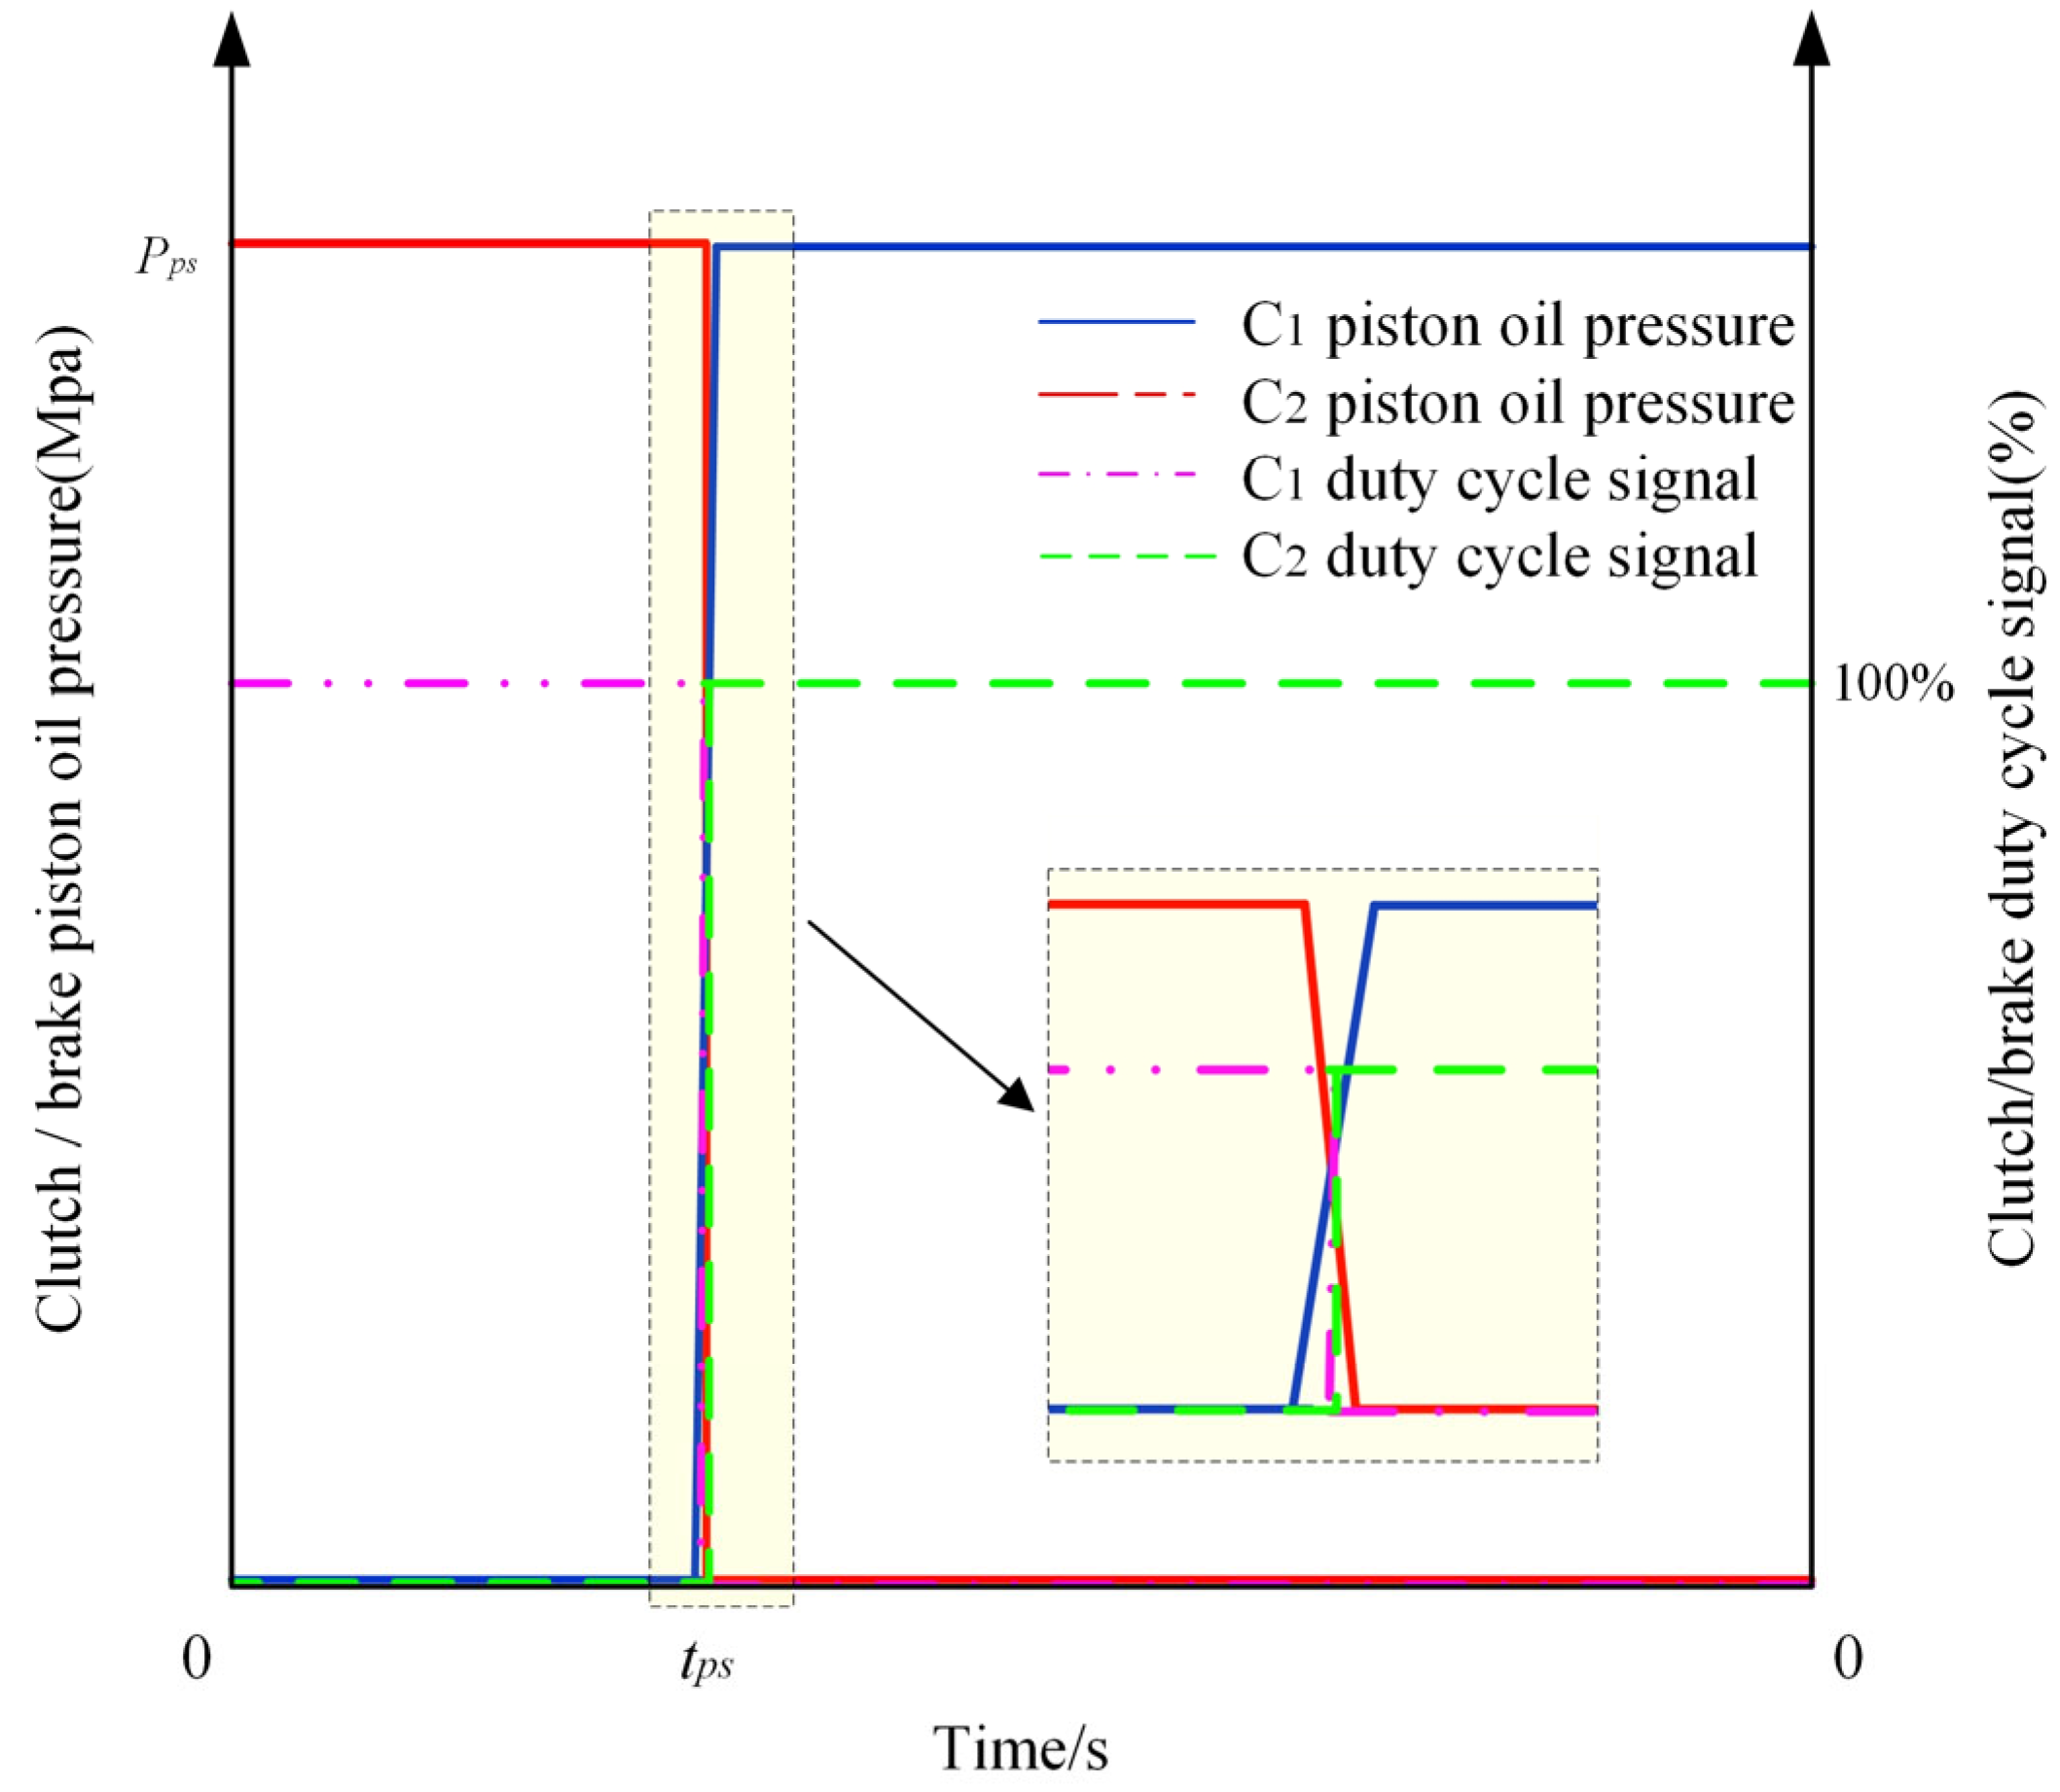
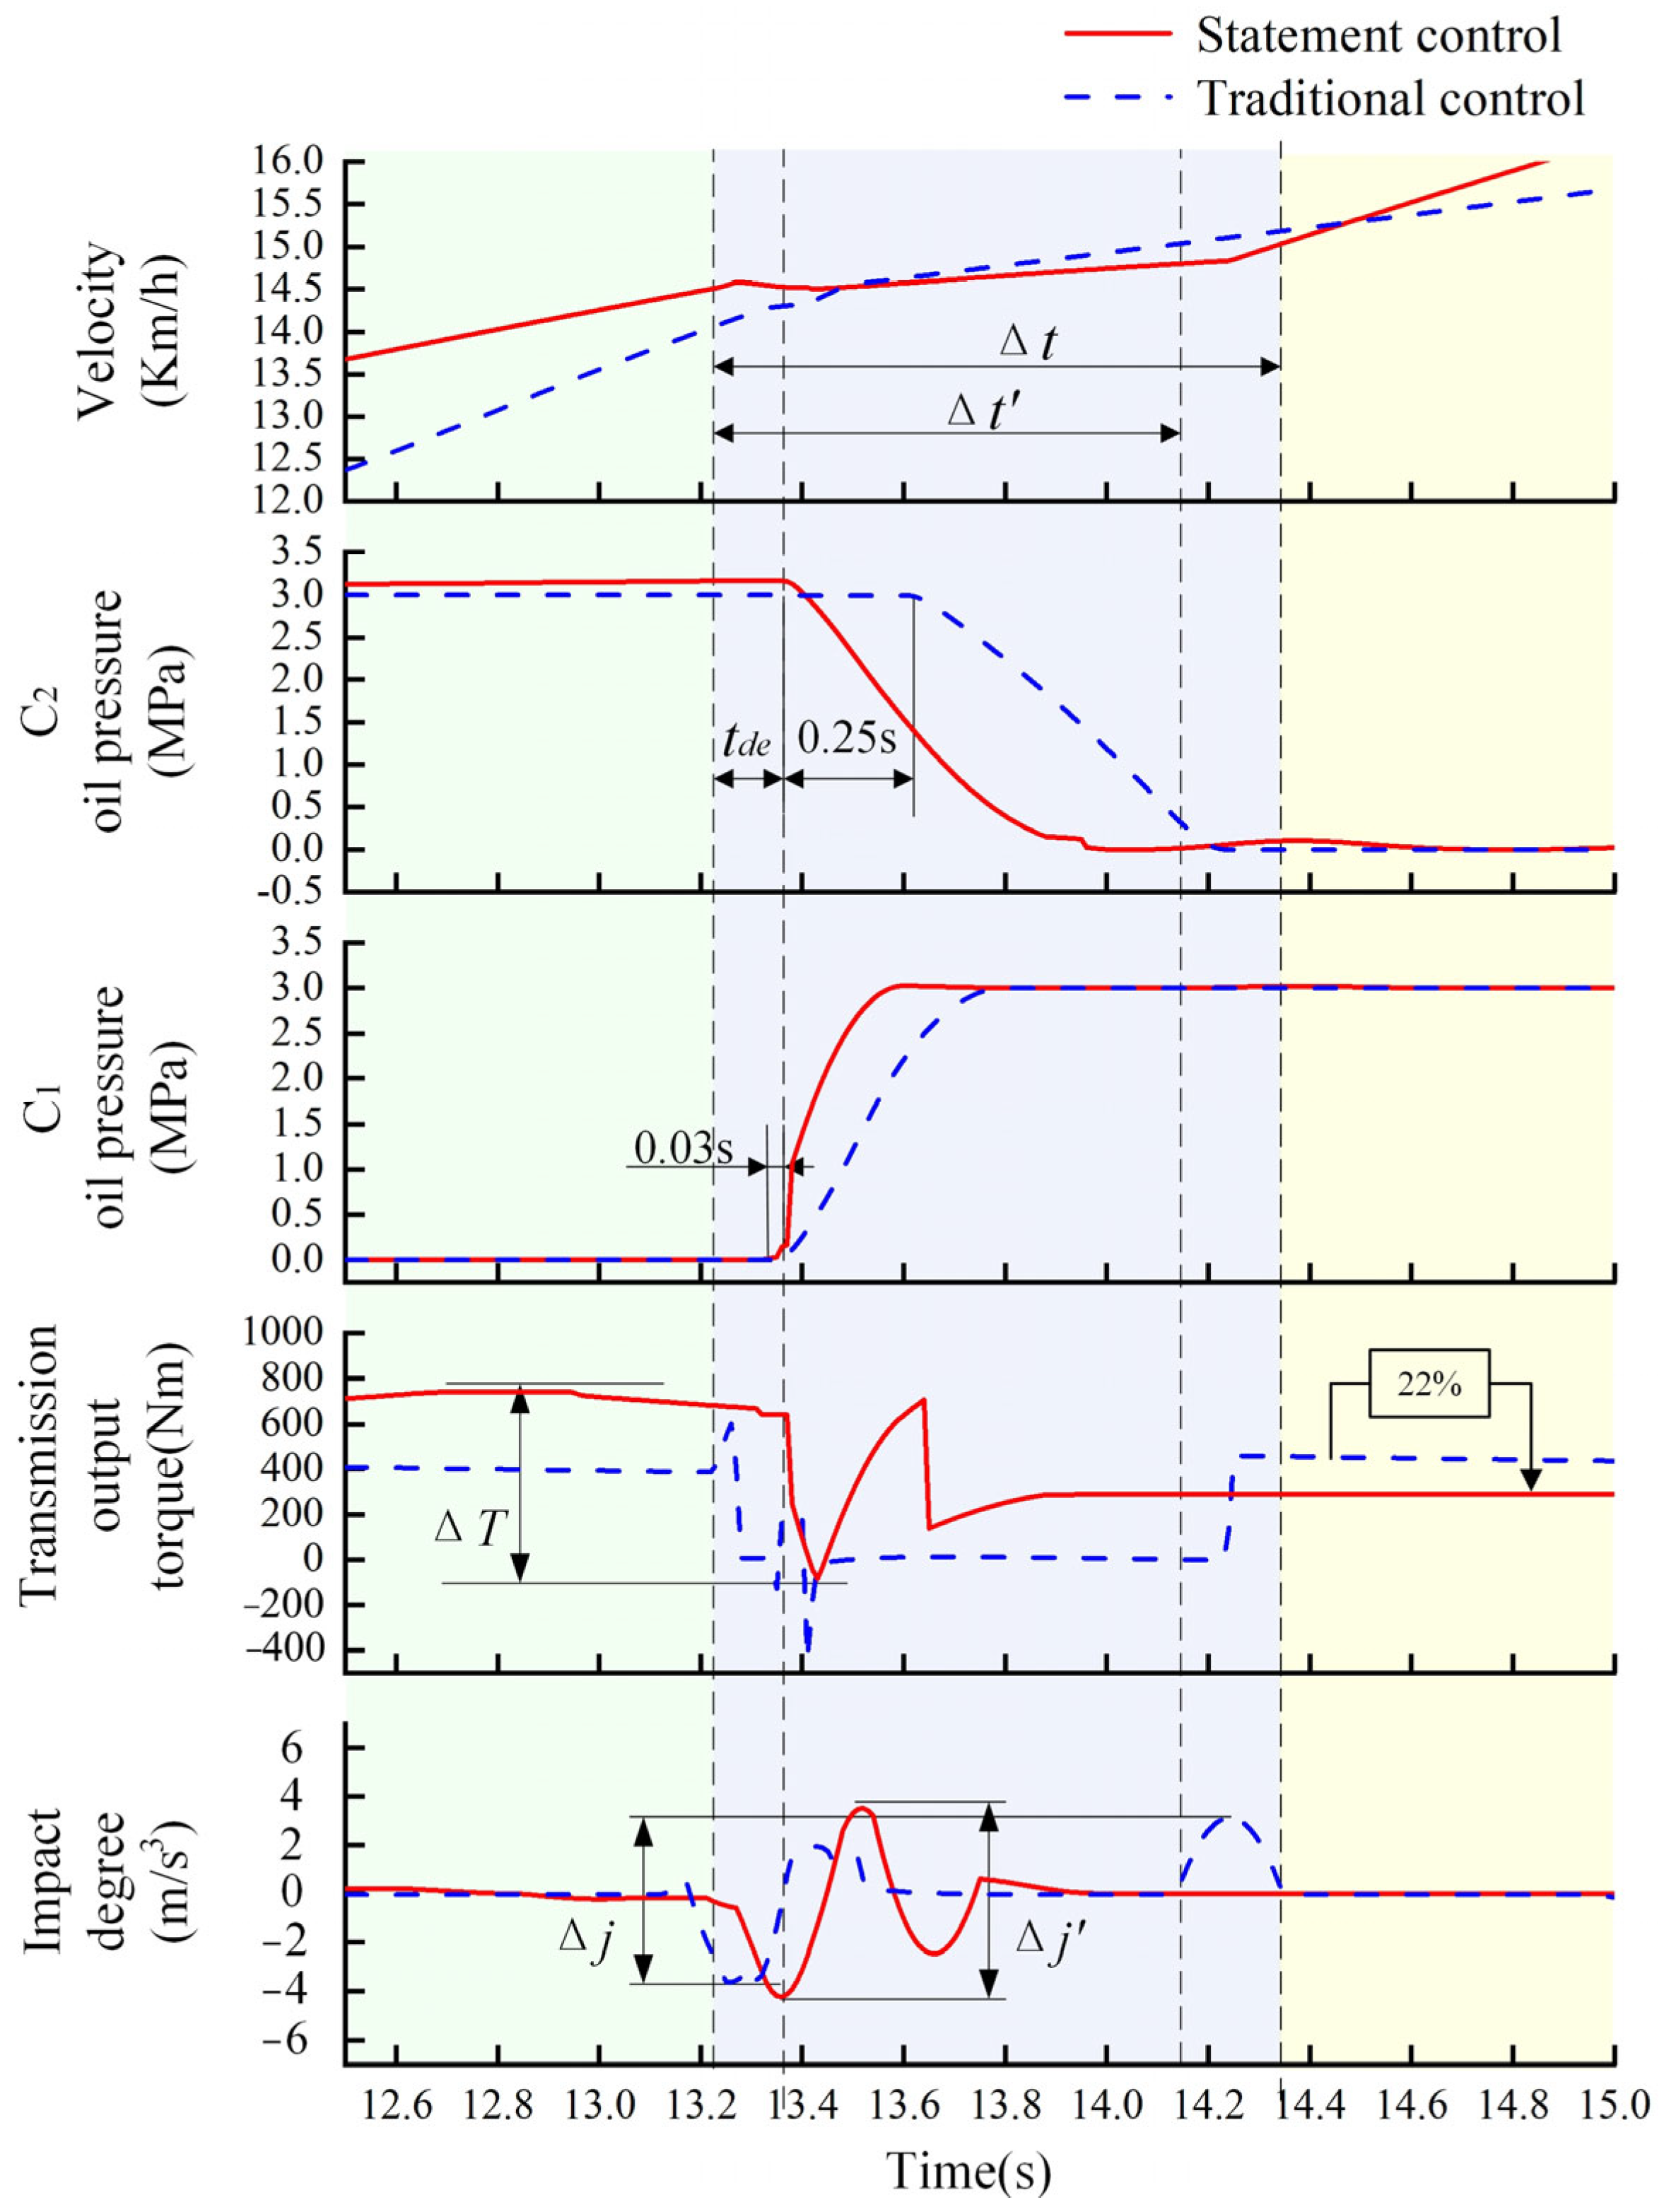
2.2.4. Power Upshift Process Analysis
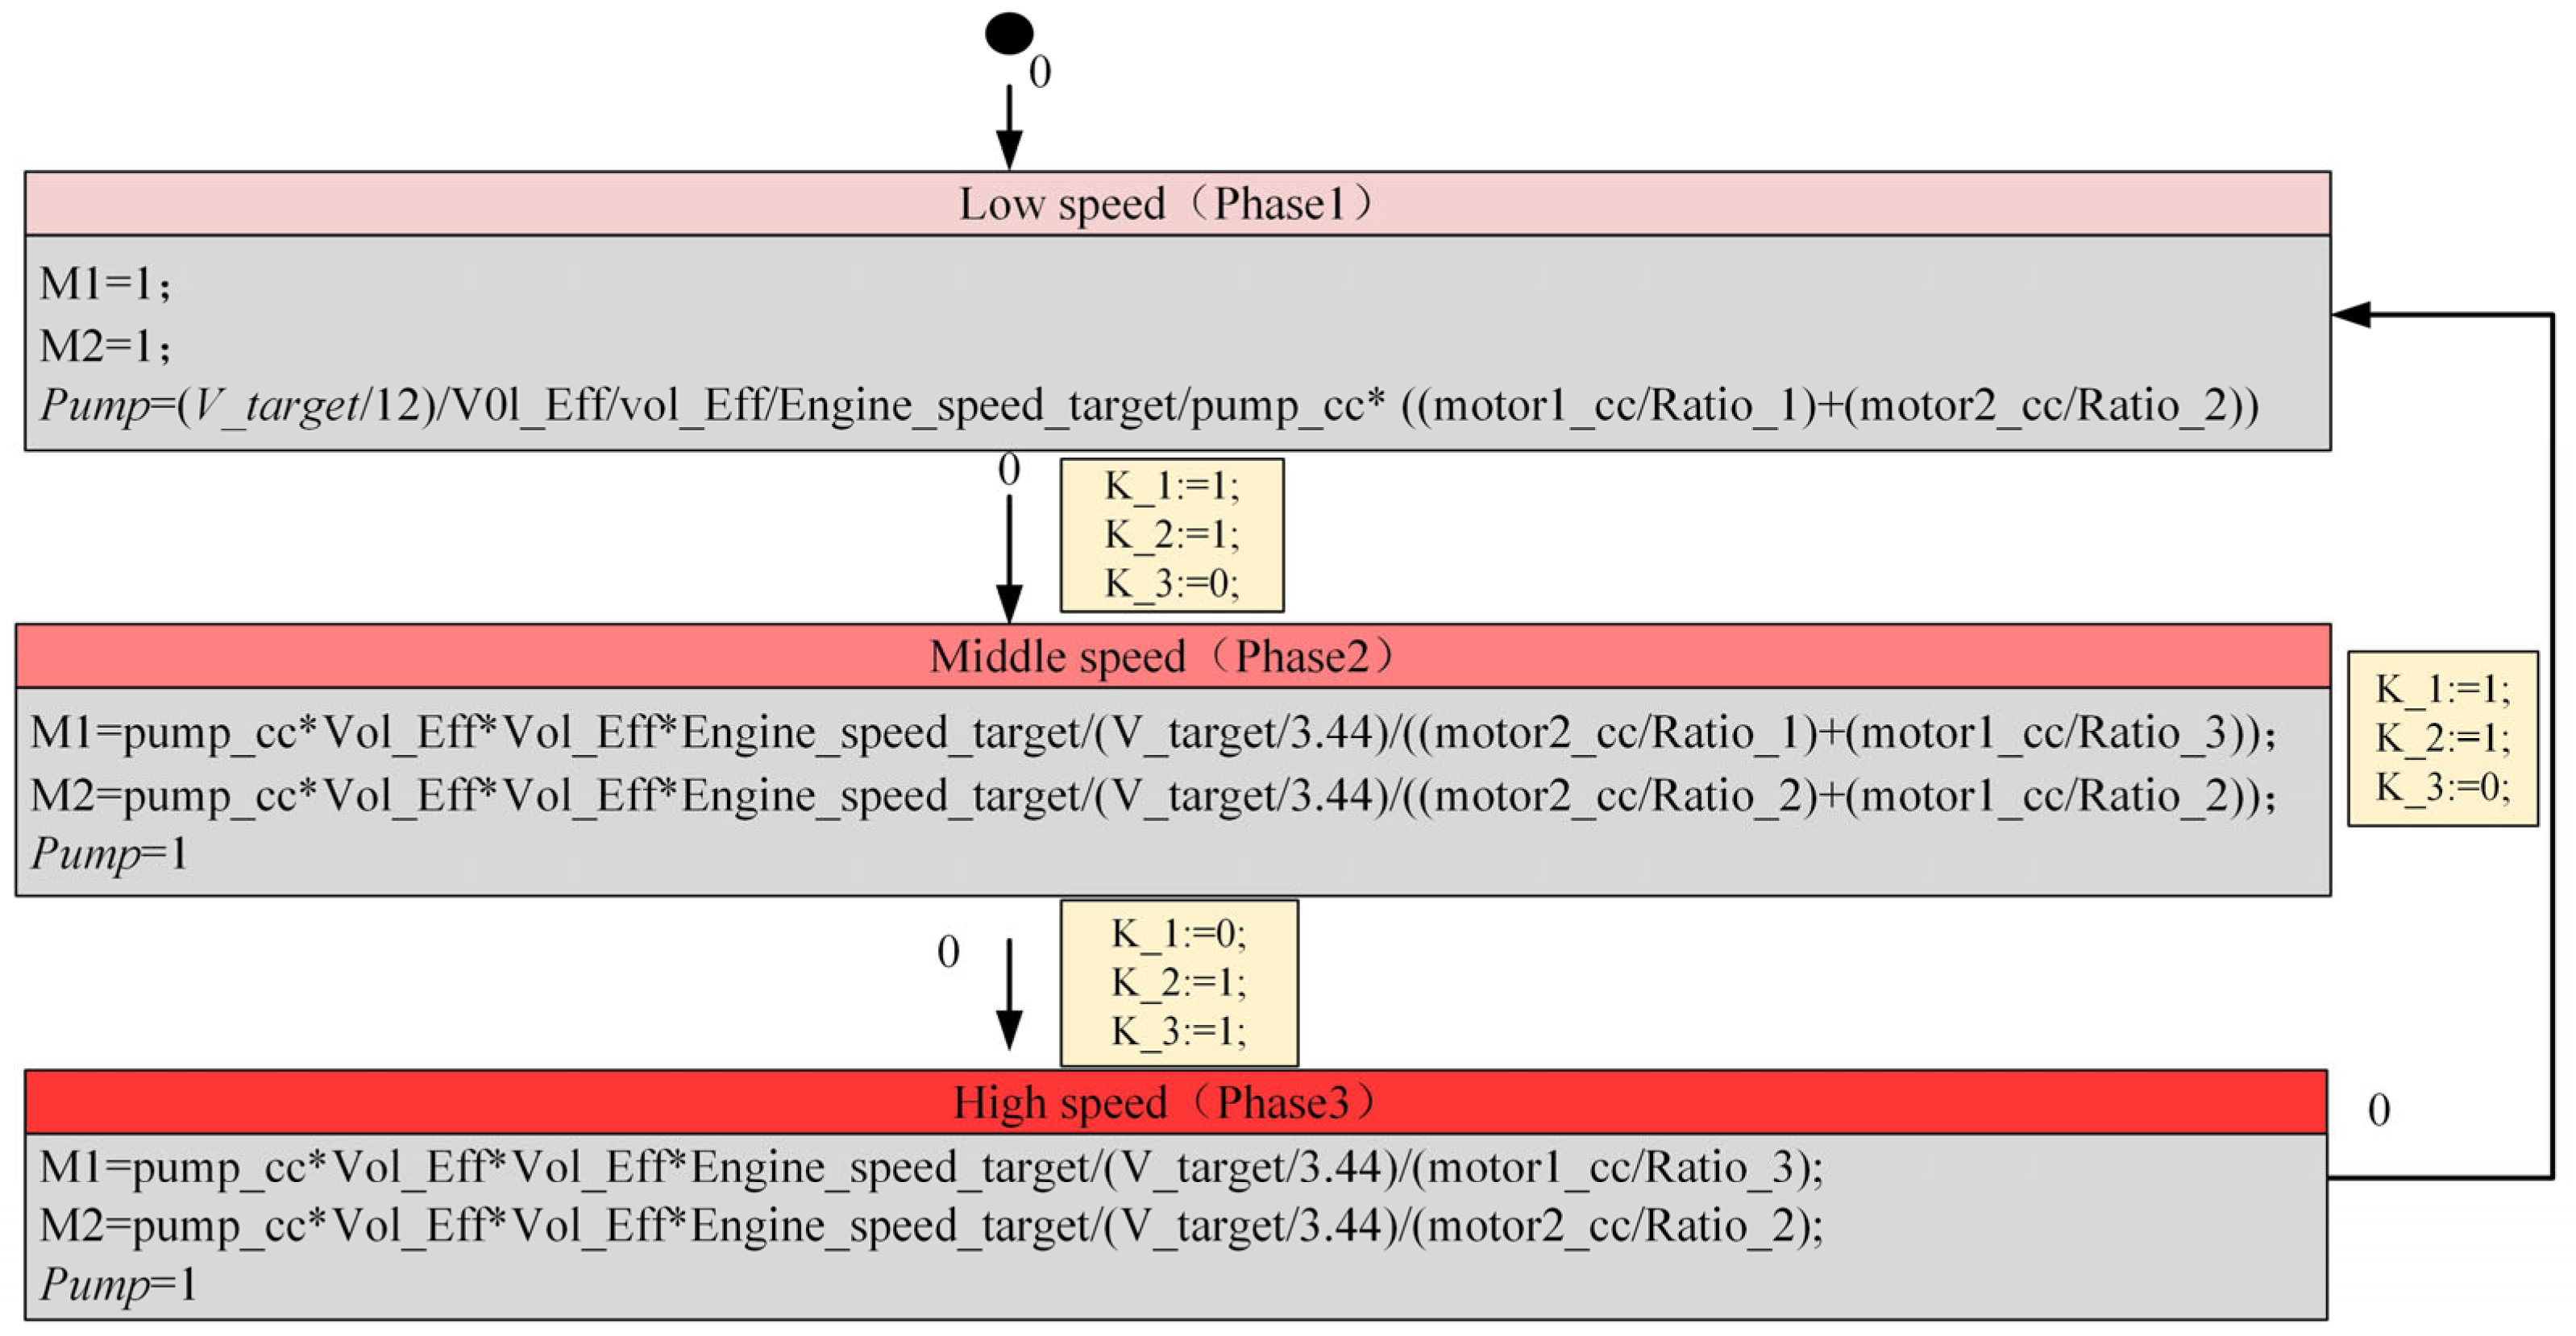
2.2.5. Shift Control Strategy
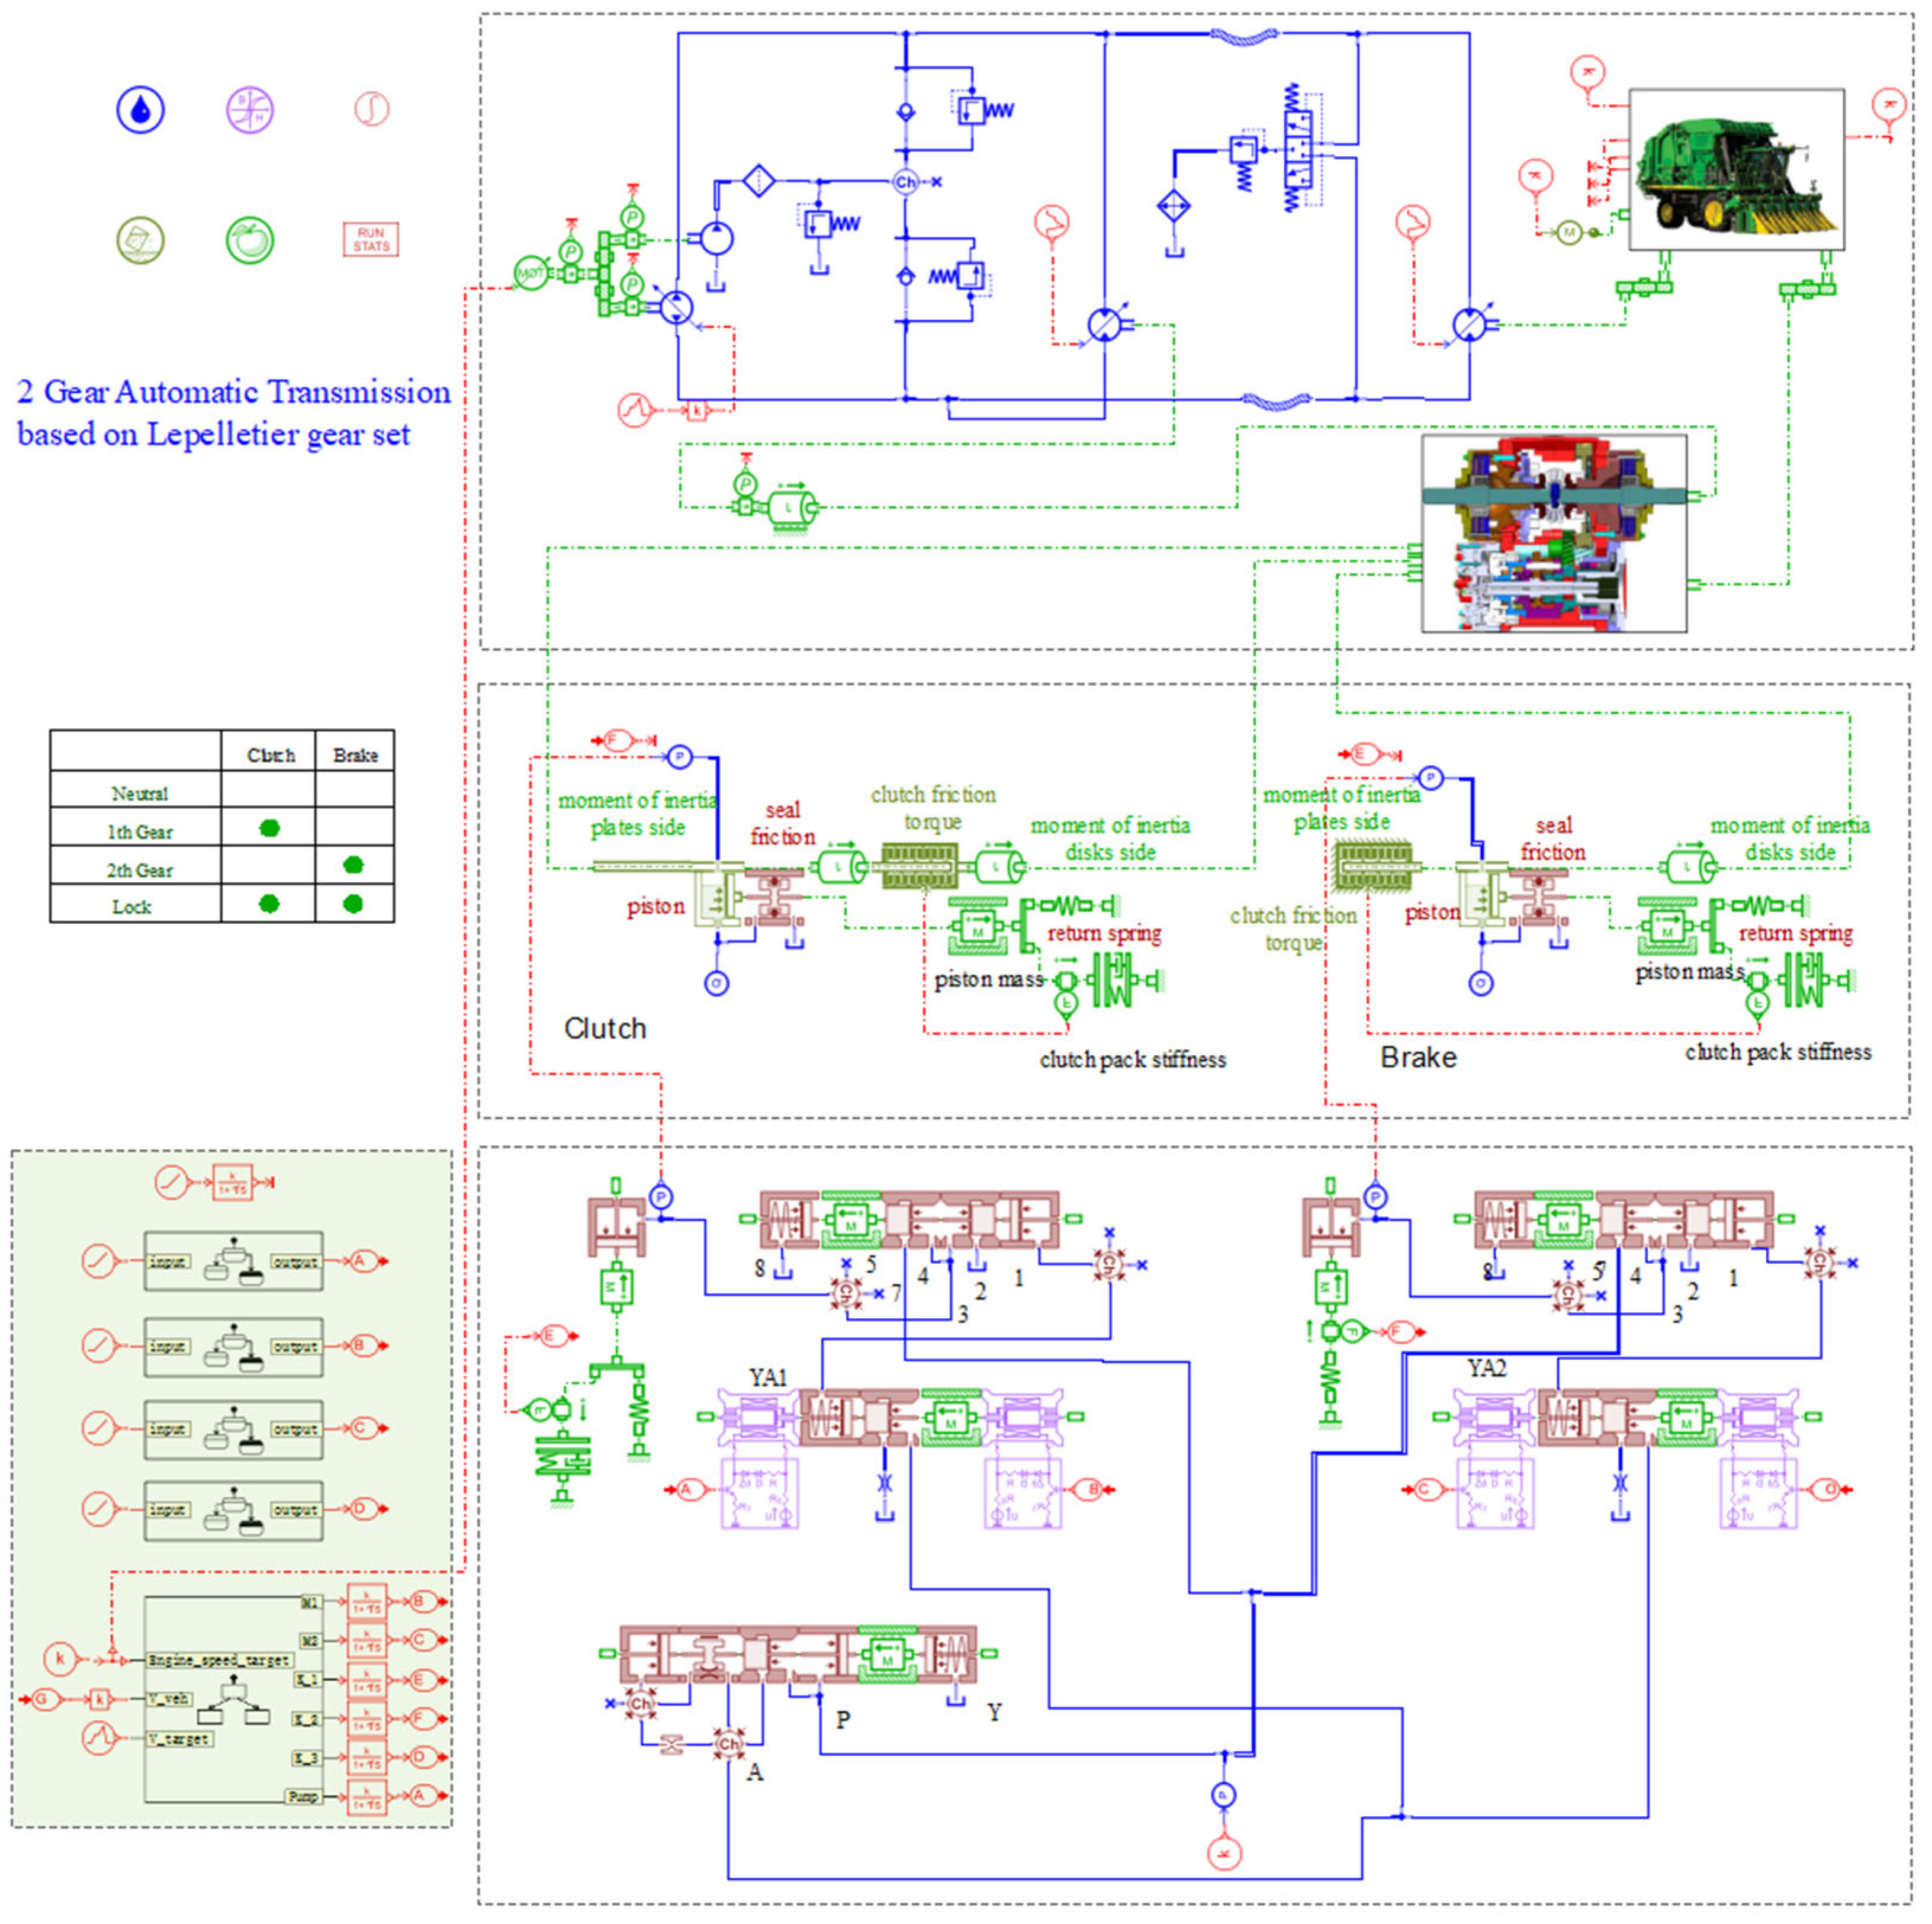
2.3. AMESim Model Building
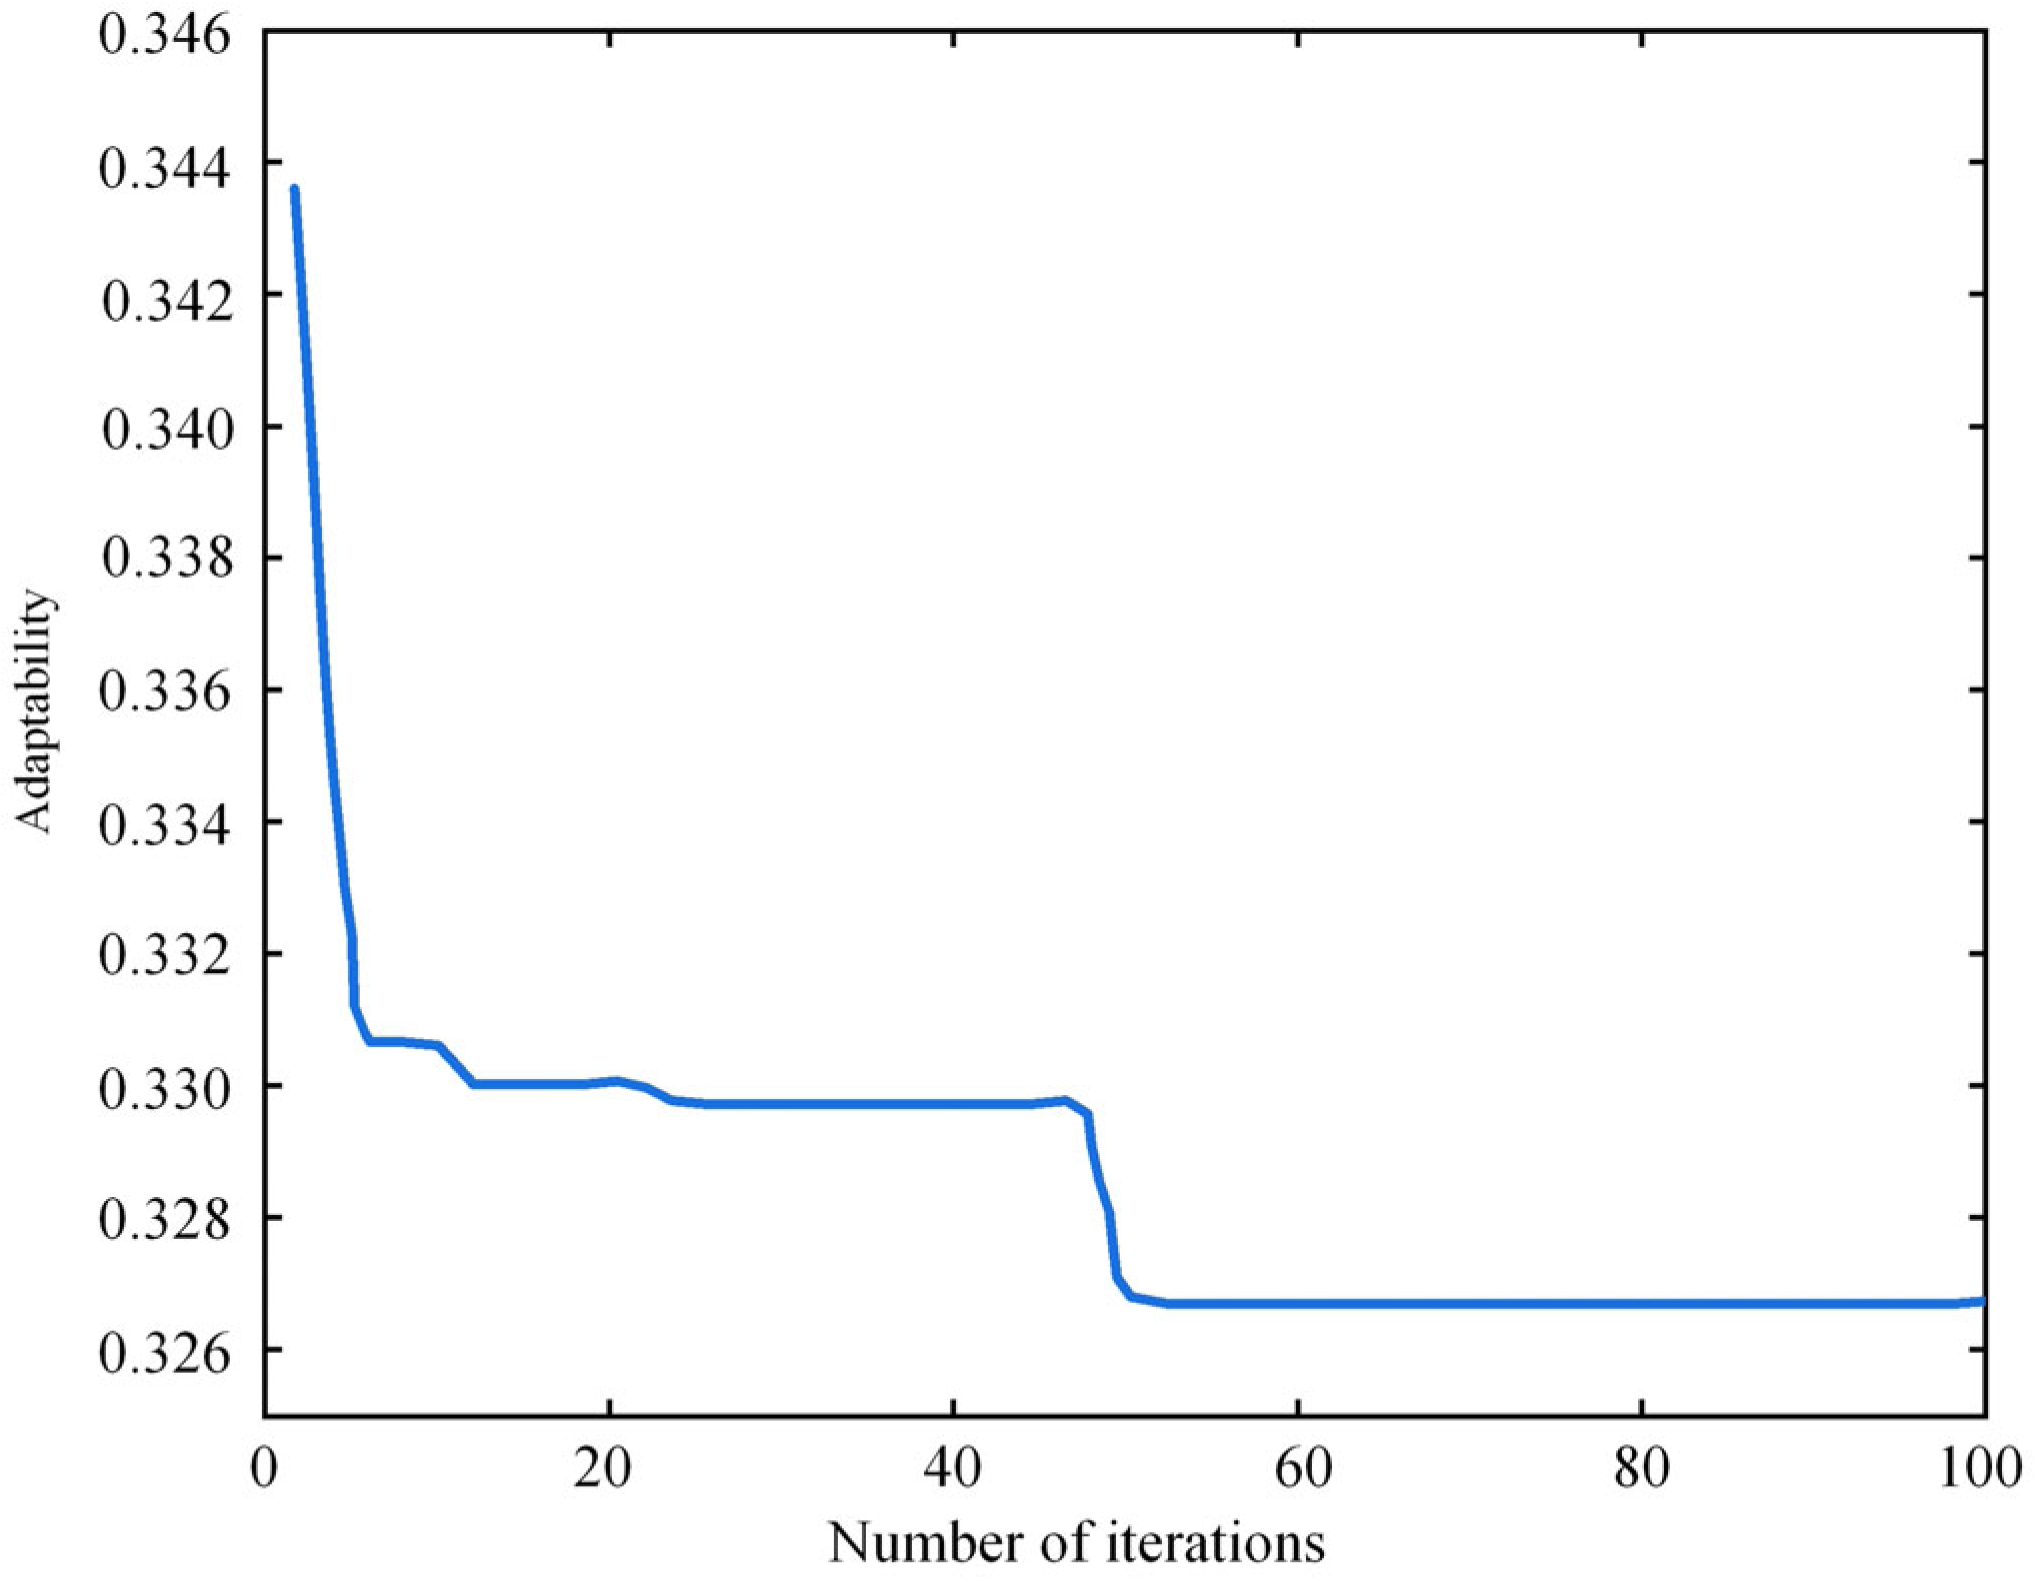
2.4. Model Parameter Optimization and Analysis
2.4.1. Optimization Variable Selection
2.4.2. Constraint Establishment
2.4.3. Objective Function Establishment
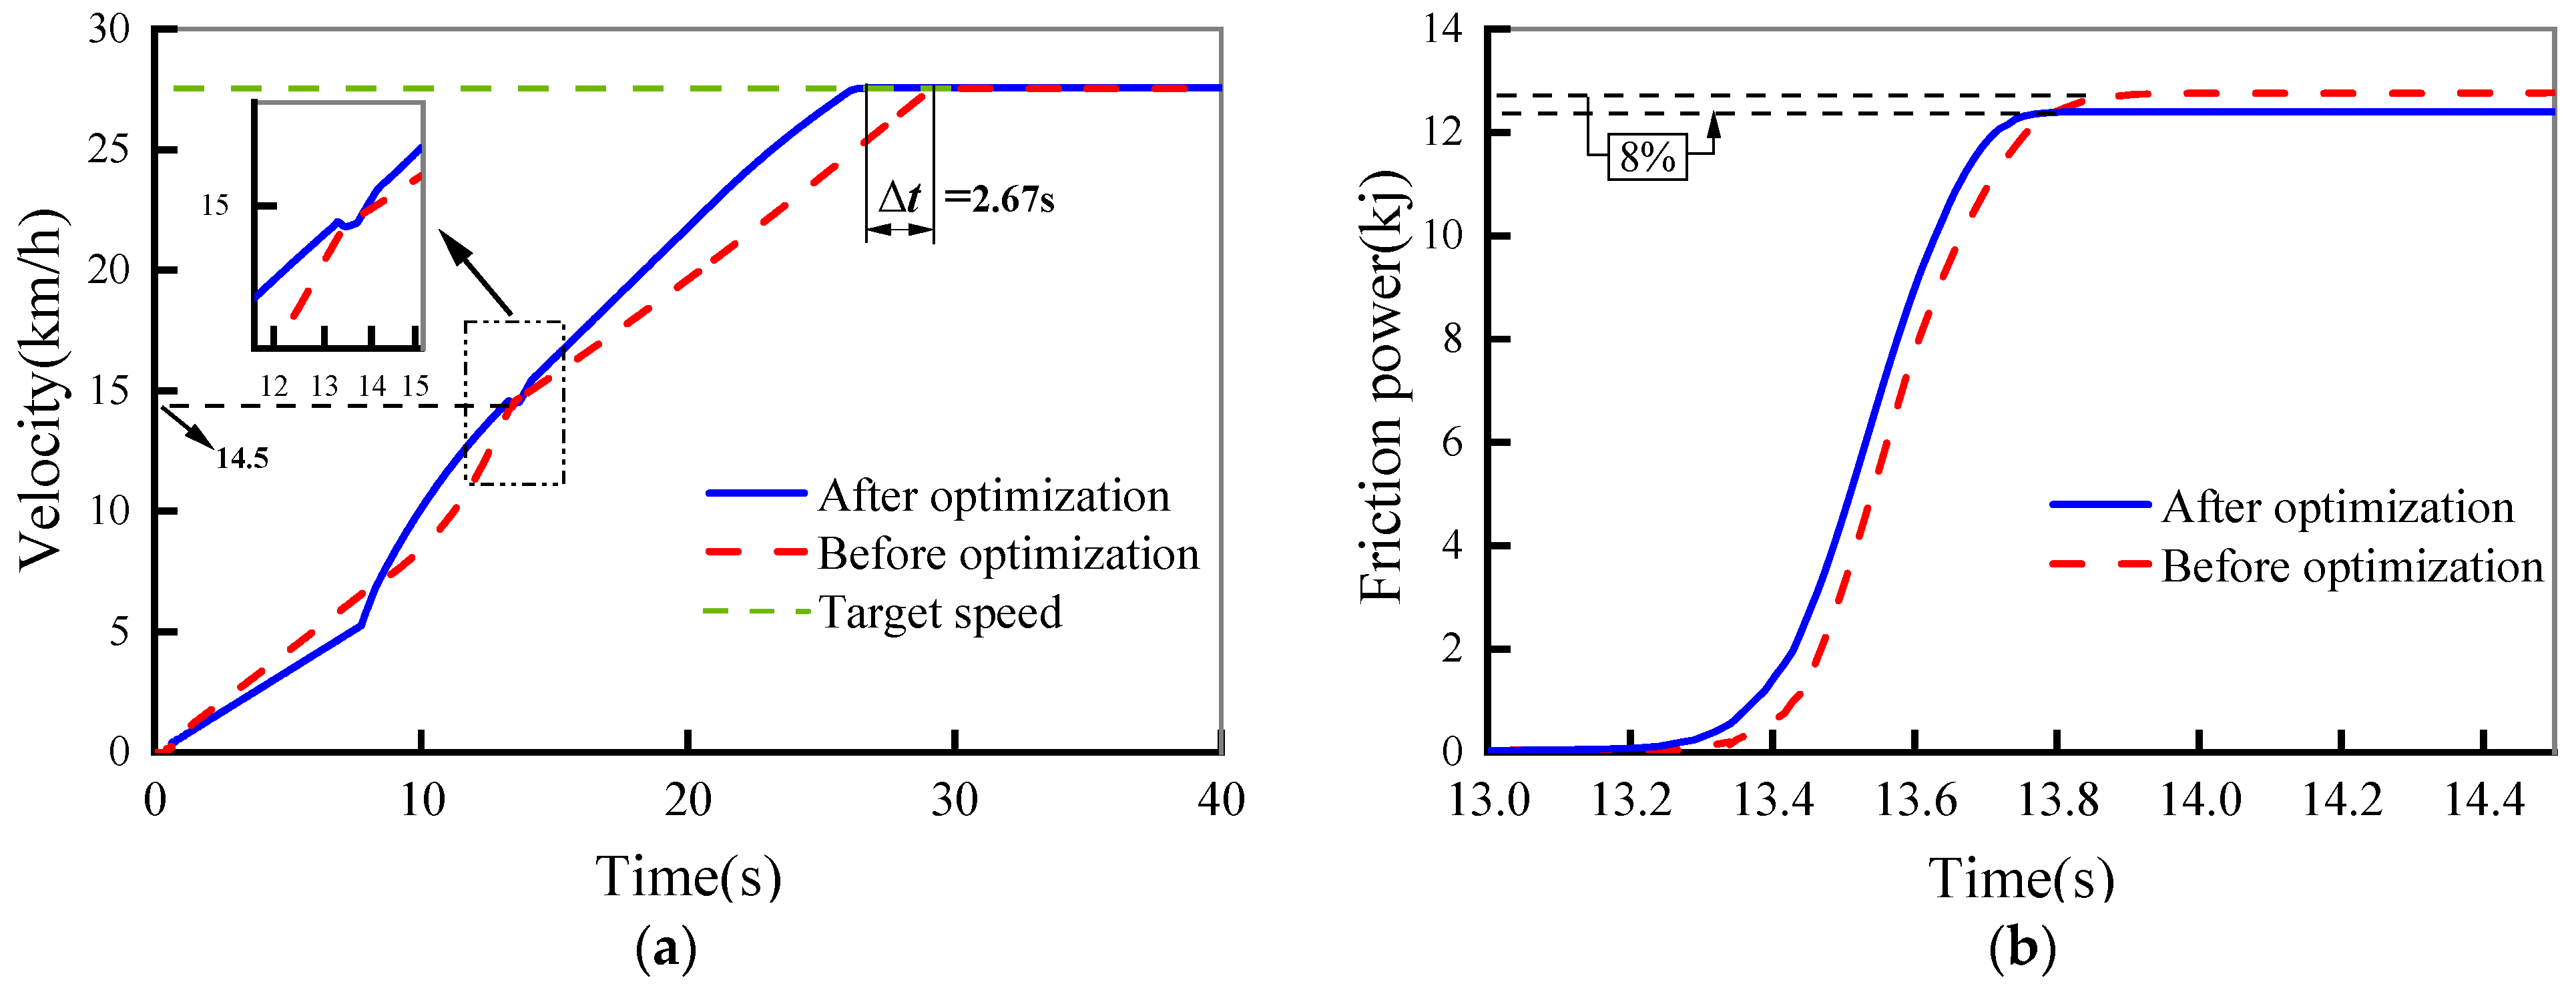
2.4.4. Analysis of Simulation Results
3. Bench Test Verification
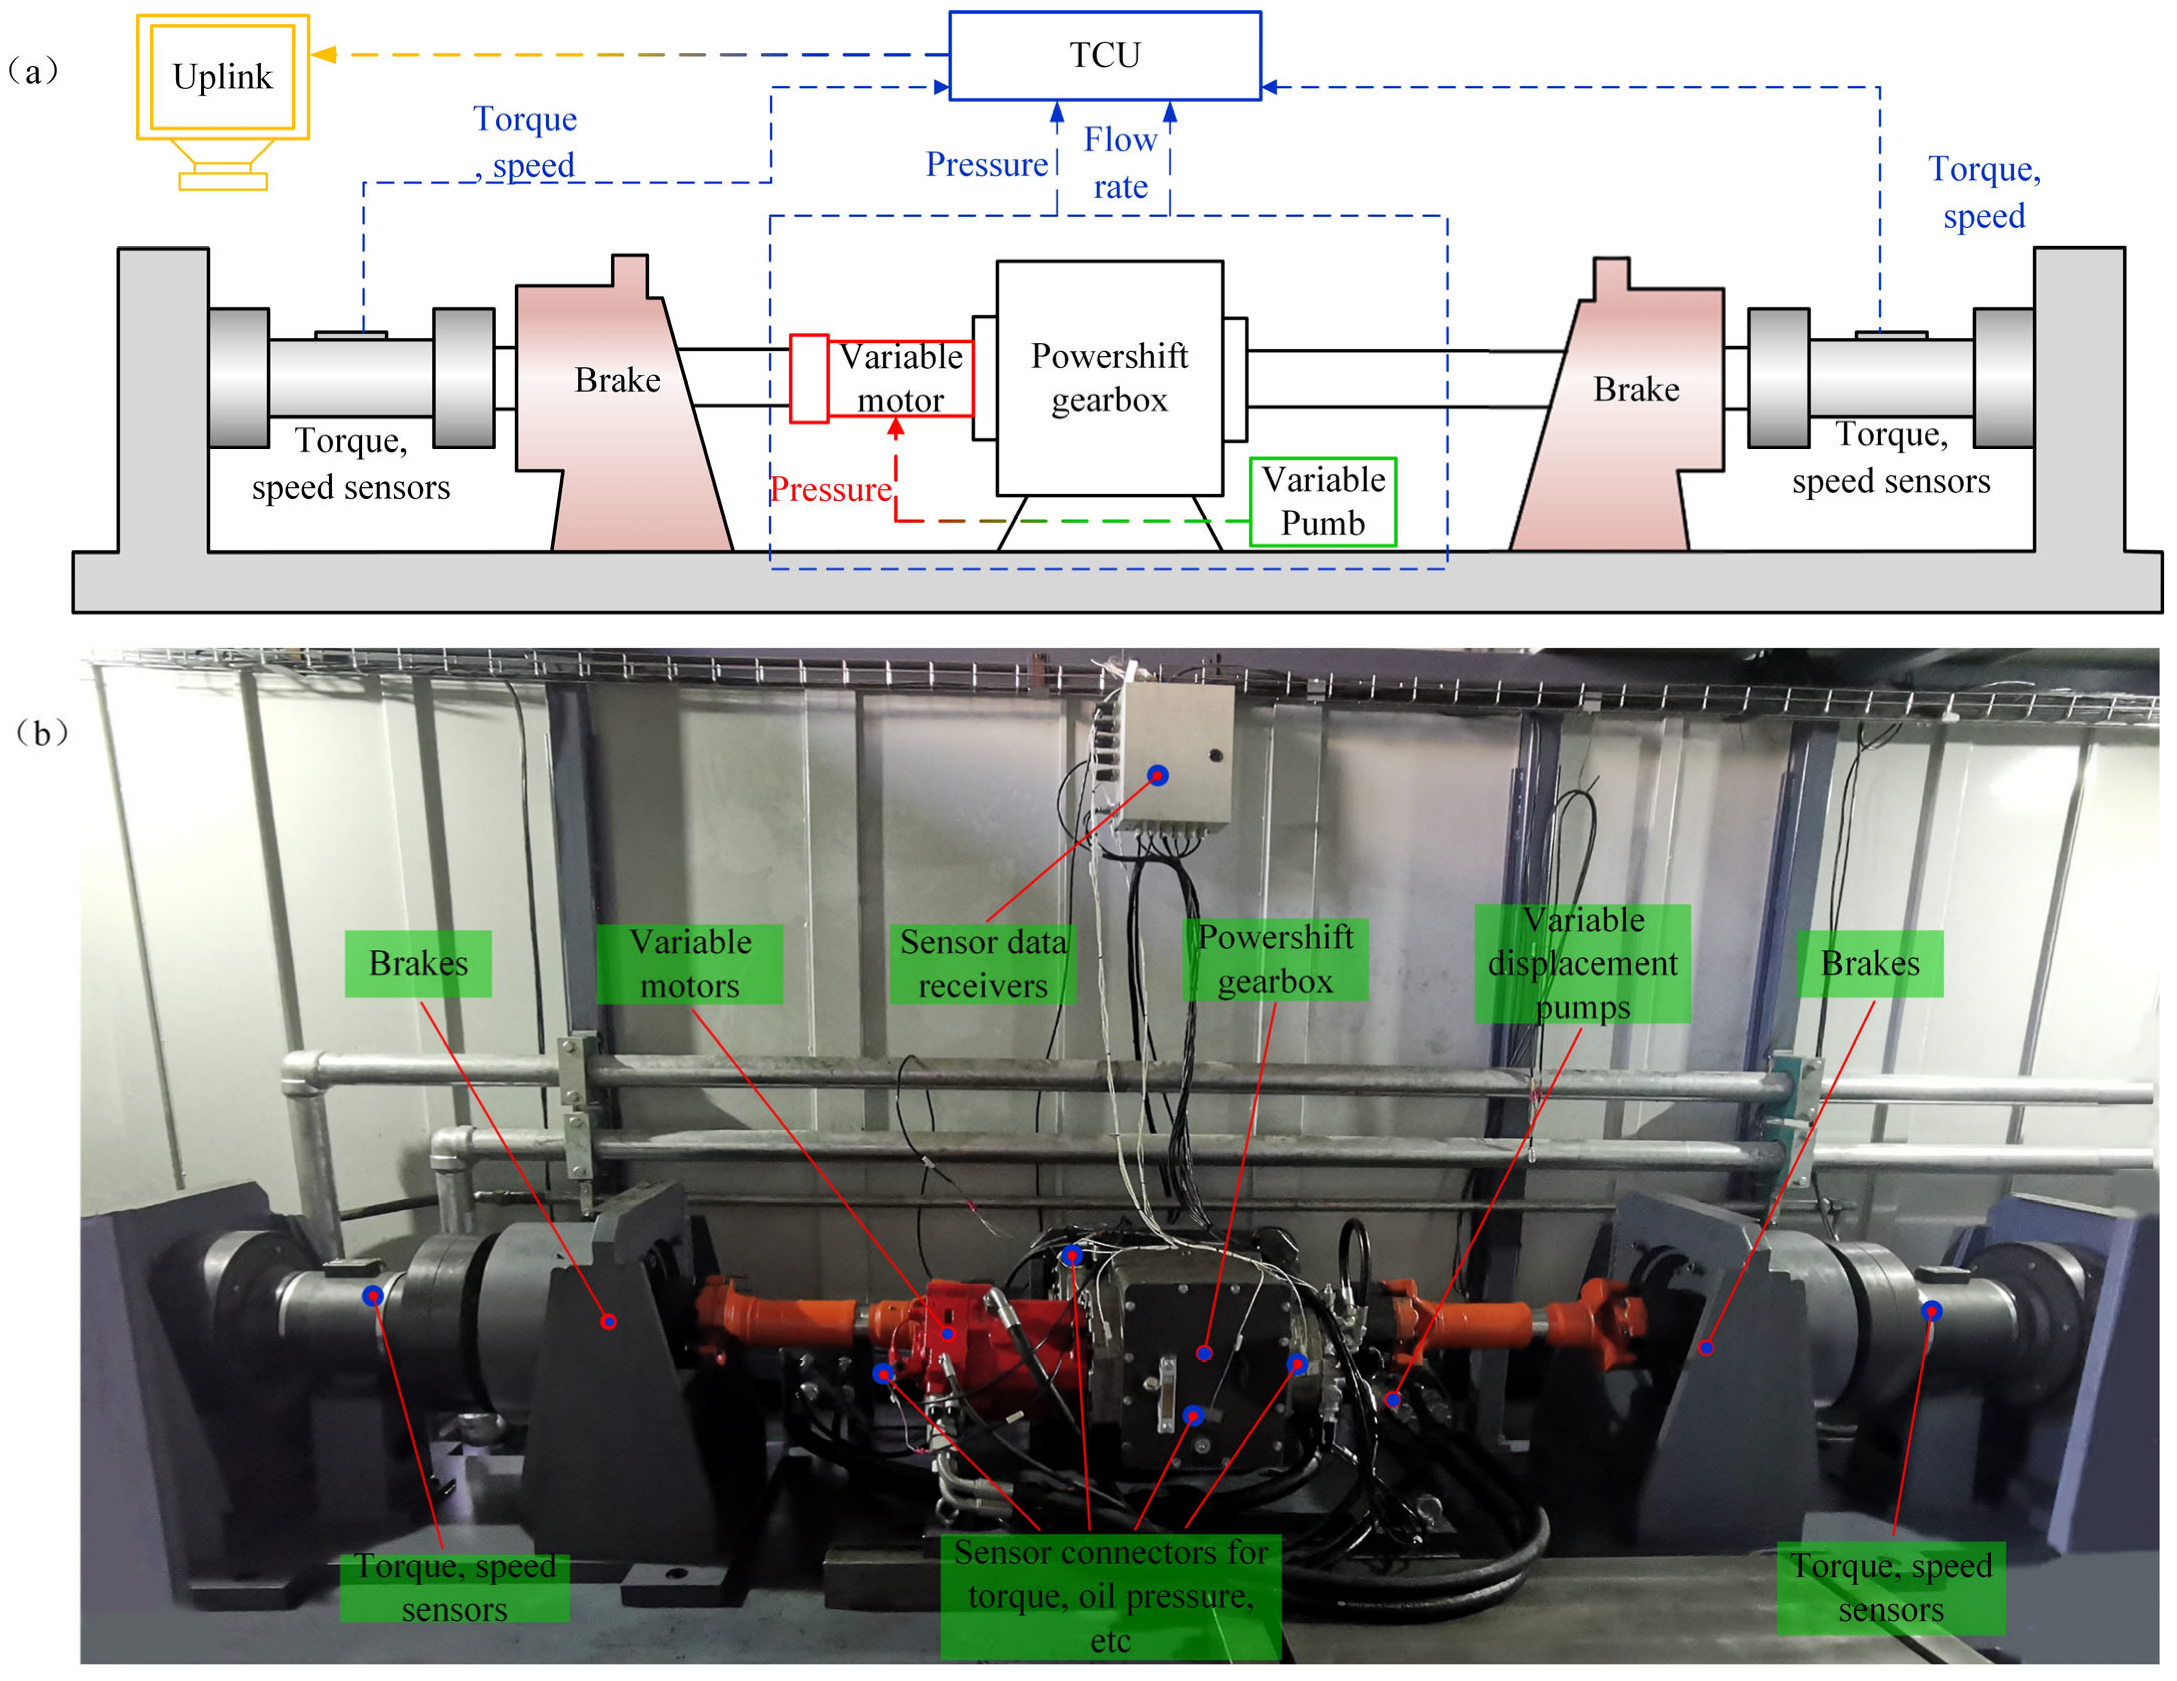
3.1. Test Stands
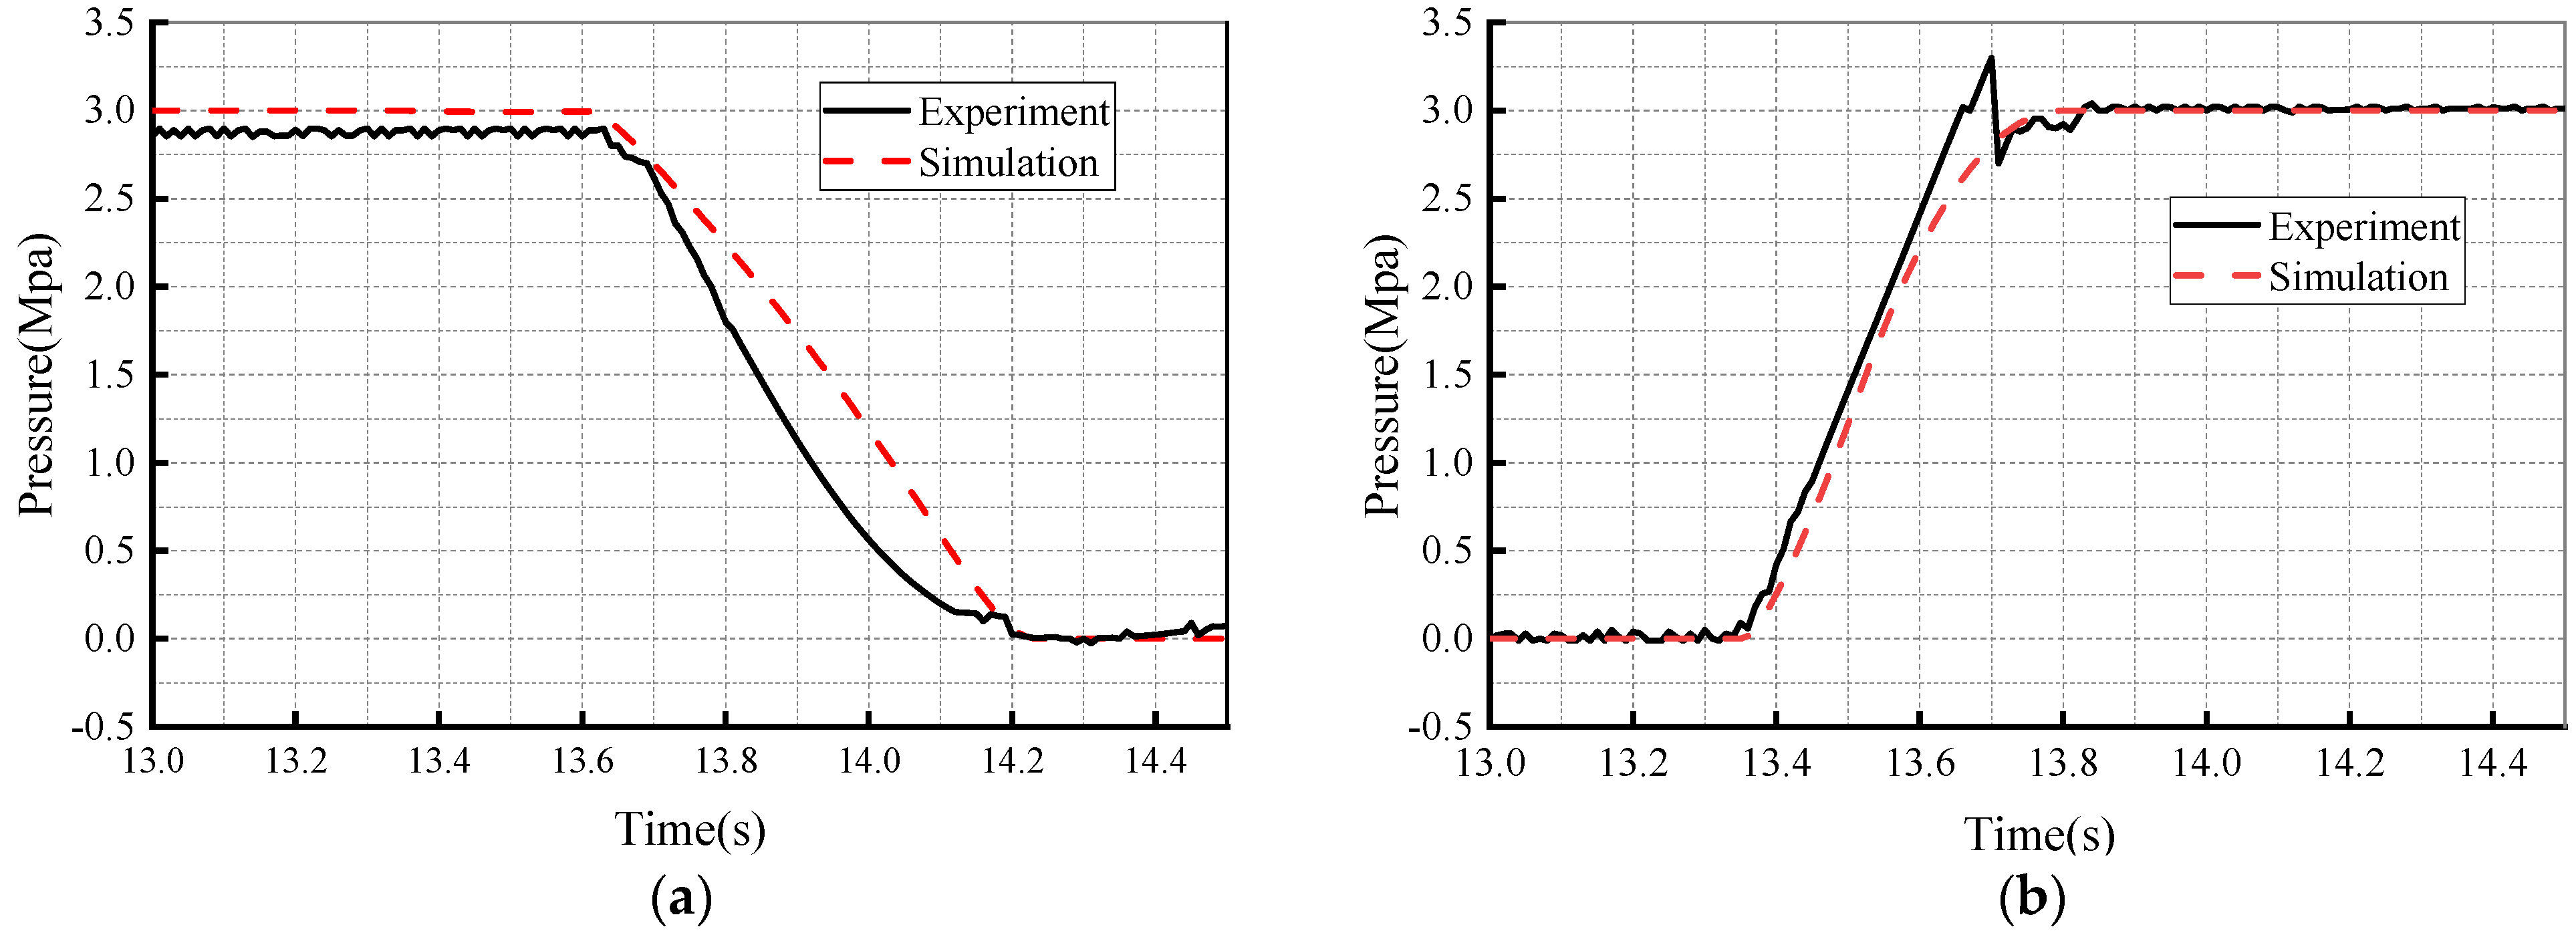
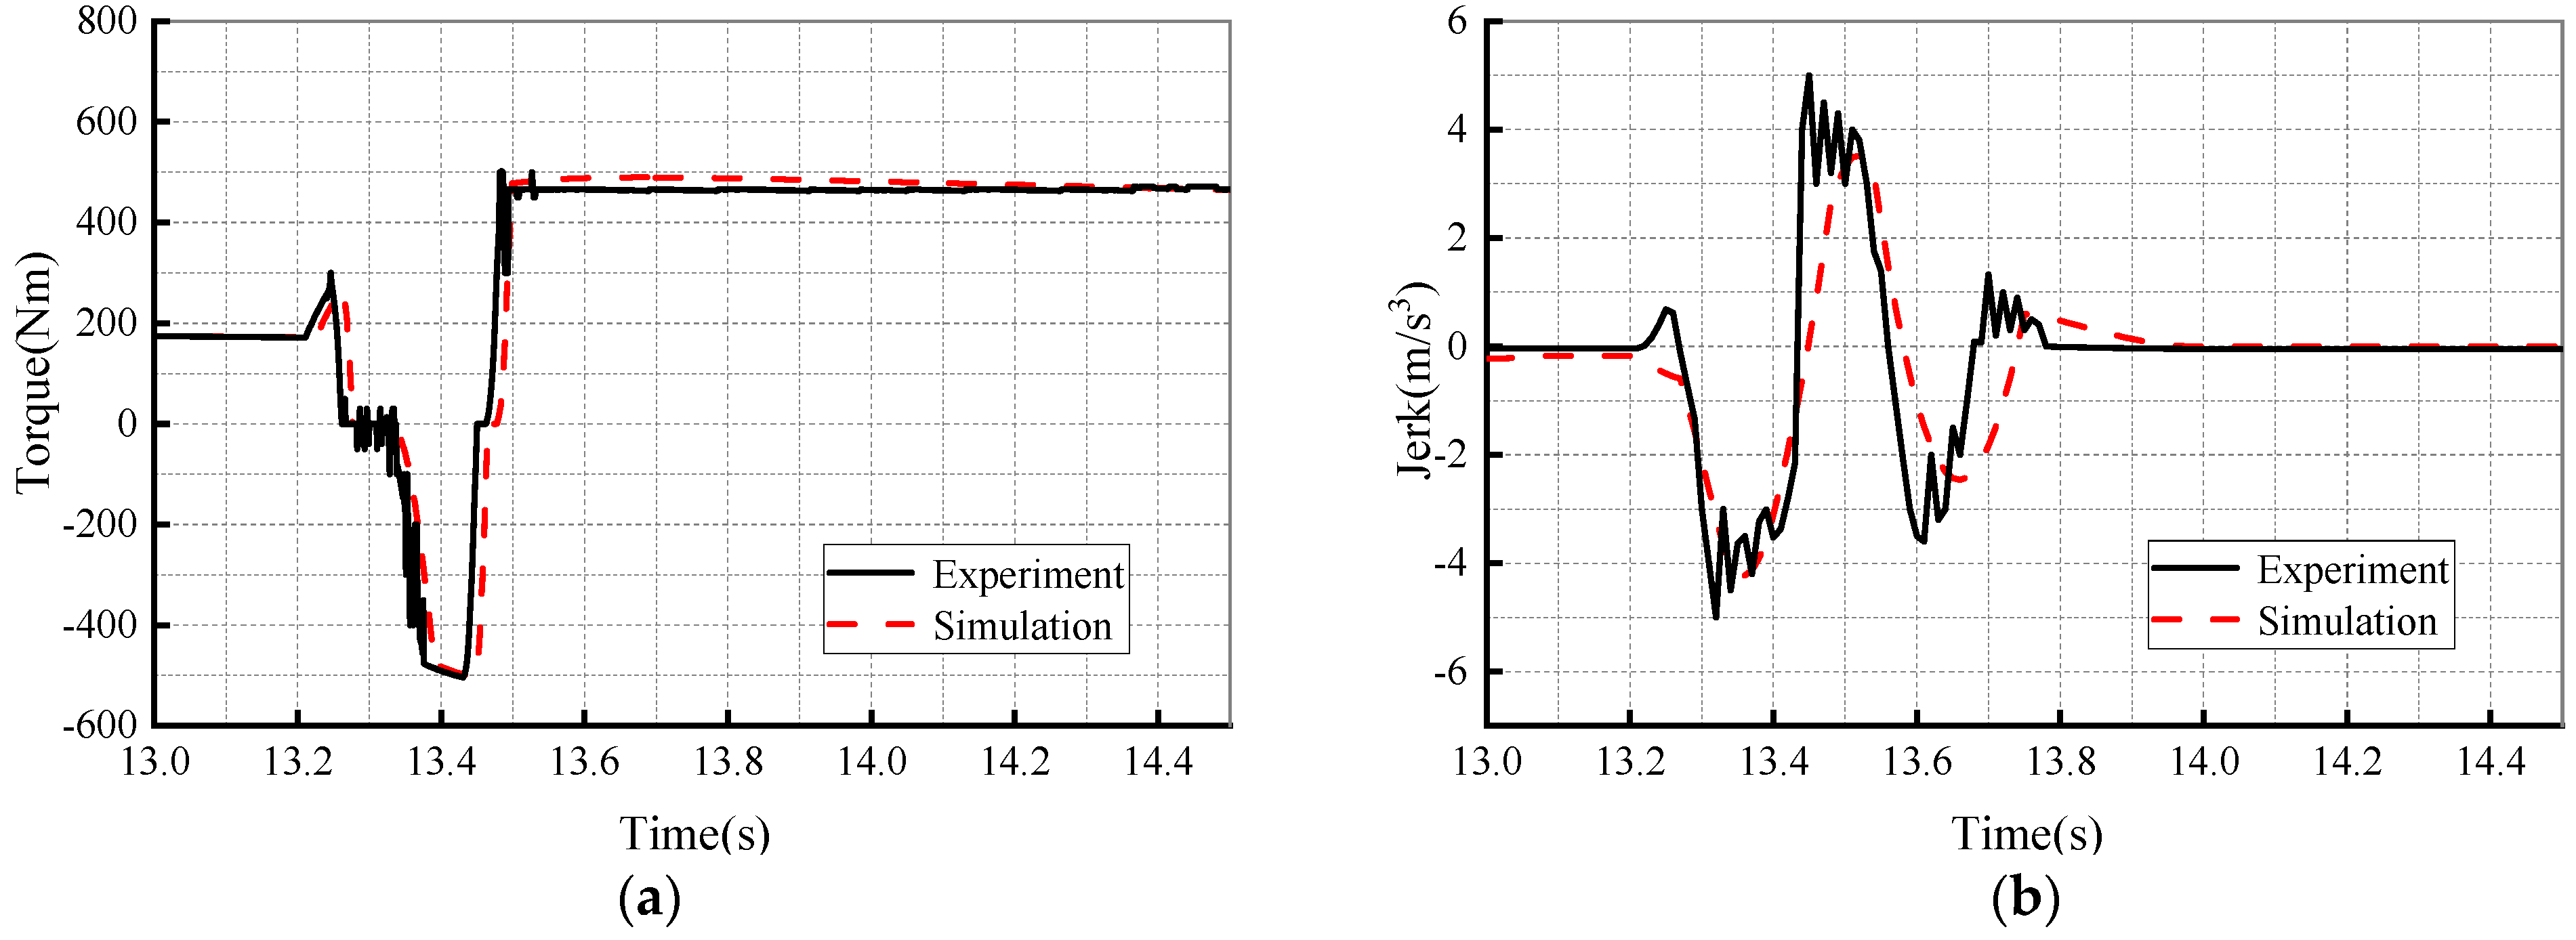
3.2. Test Results
4. Conclusions
Author Contributions
Funding
Institutional Review Board Statement
Data Availability Statement
Conflicts of Interest
References
- Kulkarni, M.; Shim, T.; Zhang, Y. Shift dynamics and control of dual-clutch transmissions. Mech. Mach. Theory 2007, 42, 168–182. [Google Scholar] [CrossRef]
- Dua, R.; White, K.J.; Lindland, R. Understanding Potential for Battery Electric Vehicle Adoption Using Large-Scale Consumer Profile Data. In Proceedings of the Transportation Research Board 96th Annual Meeting, Washington, DC, USA, 8–12 January 2017. [Google Scholar]
- Boulanger, A.G.; Chu, A.C.; Maxx, S.; Waltz, D.L. Vehicle Electrification: Status and Issues. Proc. IEEE 2011, 99, 1116–1138. [Google Scholar] [CrossRef] [Green Version]
- Hu, X.; Martinez, C.M.; Yang, Y. Charging, power management, and battery degradation mitigation in plug-in hybrid electric vehicles: A unified cost-optimal approach. Mech. Syst. Signal Process. 2017, 87, 4–16. [Google Scholar] [CrossRef]
- Liu, Y.; Li, J.; Chen, Z.; Qin, D.; Zhang, Y. Research on a multi-objective hierarchical prediction energy management strategy for range extended fuel cell vehicles. J. Power Sources 2019, 429, 55–66. [Google Scholar] [CrossRef]
- Ye, J.; Huang, X.; Zhao, K.; Liu, Y. Optimal coordinating control for the overlapping shift of a seamless 2-speed transmission equipped in an electric vehicle. Proc. Inst. Mech. Eng. Part I J. Syst. Control Eng. 2017, 231, 095965181773017. [Google Scholar] [CrossRef]
- Xu, G.; Xu, K.; Zheng, C.; Zhang, X.; Zahid, T. Fully Electrified Regenerative Braking Control for Deep Energy Recovery and Maintaining Safety of Electric Vehicles. IEEE Trans. Veh. Technol. 2015, 65, 1186–1198. [Google Scholar] [CrossRef]
- Linares, P.; Méndez, V.; Catalán, H. Design parameters for continuously variable power-split transmissions using planetaries with 3 active shafts. J. Terramech. 2010, 47, 323–335. [Google Scholar] [CrossRef] [Green Version]
- Gupta, A.K.; Ramanarayanan, C.P. Analysis of circulating power within hybrid electric vehicle transmissions. Mech. Mach. Theory 2013, 64, 131–143. [Google Scholar] [CrossRef]
- Ramdan, M.I. Optimal Design of a Hydro-Mechanical Transmission Power Split Hybrid Hydraulic Bus. Ph.D. Thesis, University of Minnesota, Minneapolis, MN, USA, 2013. [Google Scholar]
- Macor, A.; Rossetti, A. Optimization of hydro-mechanical power split transmissions. Mech. Mach. Theory 2011, 46, 1901–1919. [Google Scholar] [CrossRef]
- Wang, F.W.Y.; Han, J.; Yao, J. Experimental-wAG-shiftttransmission. J. Cent. South Univ. Engl. Ed. 2017, 24, 7. [Google Scholar]
- Jian, H.; Wei, W.; Li, H.; Yan, Q. Optimization of a pressure control valve for high power automatic transmission considering stability. Mech. Syst. Signal Process. 2018, 101, 182–196. [Google Scholar] [CrossRef]
- Cong, T.; Pdw, A.; Nong, Z. Optimization and coordinated control of gear shift and mode transition for a dual-motor electric vehicle—ScienceDirect. Mech. Syst. Signal Process. 2021, 158, 107731. [Google Scholar]
- Meng, F.; Tao, G.; Chen, H. Smooth shift control of an automatic transmission for heavy-duty vehicles. Neurocomputing 2015, 159, 197–206. [Google Scholar] [CrossRef]
- Zhu, Z.; Gao, X.; Cao, L.; Cai, Y.; Pan, D. Research on the shift strategy of HMCVT based on the physical parameters and shift time. Appl. Math. Model. 2016, 40, 6889–6907. [Google Scholar] [CrossRef]
- You, Y.; Sun, D.; Qin, D.; Wu, B.; Feng, J. A new continuously variable transmission system parameters matching and optimization based on wheel loader. Mech. Mach. Theory 2020, 150, 103876. [Google Scholar] [CrossRef]
- He, B.C.; Chen, Y.; Wei, Q.; Wang, C.; Wei, C.; Li, X. Performance Comparison of Pure Electric Vehicles with Two-Speed Transmission and Adaptive Gear Shifting Strategy Design. Energies 2023, 16, 3007. [Google Scholar] [CrossRef]
- Cao, X.; Du, C.; Yan, F.; Xu, H.; Sui, Y. Parameter Optimization of Dual Clutch Transmission for an Axle-split Hybrid Electric Vehicle. IFAC Pap. 2019, 52, 423–430. [Google Scholar] [CrossRef]
- Yu, C.Y.C.Z.Q. Research on wet clutch switching quality in the shifting stage of an agricultural tractor transmission system. Agriculture 2022, 12, 1174. [Google Scholar]
- Qi, X.; Yang, Y.; Wang, X.; Zhu, Z. Analysis and optimization of the gear-shifting process for automated manual transmissions in electric vehicles. Proc. Inst. Mech. Eng. Part D J. Automob. Eng. 2017, 231, 095440701668546. [Google Scholar] [CrossRef]
- Gao, B.; Lei, Y.; Ge, A.; Chen, H.; Sanada, K. Observer-based clutch disengagement control during gear shift process of automated manual transmission. Veh. Syst. Dyn. 2011, 49, 685–701. [Google Scholar] [CrossRef]
- Li, G.; Grges, D. Optimal control of the gear shifting process for shift smoothness in dual-clutch transmissions. Mech. Syst. Signal Process. 2018, 103, 23–38. [Google Scholar] [CrossRef]
- Jie, Y.; Zhu, G.G. Model predictive control of a power split hybrid powertrain. In Proceedings of the American Control Conference, Boston, MA, USA, 6–8 July 2016. [Google Scholar]
- Xia, G.; Chen, J.; Tang, X.; Zhao, L.; Sun, B. Shift quality optimization control of power shift transmission based on particle swarm optimization–genetic algorithm. Proc. Inst. Mech. Eng. Part D J. Automob. Eng. 2022, 236, 872–892. [Google Scholar] [CrossRef]
- Ghovvati, M.; Khayati, G.; Attar, H.; Vaziri, A. Comparison across growth kinetic models of alkaline protease production in batch and fed-batch fermentation using hybrid genetic algorithm and particle swarm optimization. Biotechnol. Biotechnol. Equip. 2015, 29, 1216–1225. [Google Scholar] [CrossRef] [Green Version]
- Raquel, C.R.; Naval, P.C., Jr. An effective use of crowding distance in multiobjective particle swarm optimization. In Proceedings of the Genetic and Evolutionary Computation Conference, GECCO 2005, Washington, DC, USA, 25–29 June 2005. [Google Scholar]
- Shi, X.H.; Wan, L.M.; Lee, H.P.; Yang, X.W.; Wang, L.M.; Liang, Y.C. An improved genetic algorithm with variable population-size and a PSO-GA based hybrid evolutionary algorithm. In Proceedings of the International Conference on Machine Learning & Cybernetics, Xi’an, China, 5 November 2003. [Google Scholar]
- Hongchao, J. Shift Quality Control of Automatic Transmission for Off-Road Vehicle. Ph.D. Thesis, Beijing Institute of Technology, Beijing, China, 2018. [Google Scholar] [CrossRef]
- Zhang, K.; Shen, C.; Liu, X.; Yen, G.G. Multi-Objective Evolution Strategy for Dynamic Multi-objective Optimization. IEEE Trans. Evol. Comput. 2020, 24, 974–988. [Google Scholar] [CrossRef]
- Cheng, R.; Jin, Y.; Olhofer, M.; Sendhoff, B. Test Problems for Large-Scale Multiobjective and Many-Objective Optimization. IEEE Trans. Cybern. 2017, 47, 4108–4121. [Google Scholar] [CrossRef] [PubMed] [Green Version]
- Xia, G.; Zong, H.; Tang, X.; Zhao, L.; Sun, B. Integrated control strategy of tractor hydromechanical continuously variable transmission. Proc. Inst. Mech. Eng. Part D J. Automob. Eng. 2021, 235, 649–671. [Google Scholar] [CrossRef]
- Huang, L.Y.; Guan, K.S.; Xu, T.; Zhang, J.M.; Wang, Q.Q. Investigation of the mechanical properties of steel using instrumented indentation test with simulated annealing particle swarm optimization. Theor. Appl. Fract. Mech. 2019, 102, 116–121. [Google Scholar] [CrossRef]


| Work Conditions | C2 | C1 | YA0 | YA1 |
|---|---|---|---|---|
| Neutral gear | △ | △ | △ | △ |
| Field Picking | ● | △ | ● | △ |
| Field transportation | ● | △ | ● | △ |
| Road Transportation | △ | ● | △ | ● |
| Braking | ● | ● | ● | ● |
| Name | Value | Name | Value |
|---|---|---|---|
| a1 | 23.3% | b2 | 35% |
| a2 | 27.1% | dps1 | 66.6% |
| b1 | 36% | dps2 | 64.8% |
| Parameters | Maximum Number of Iterations | Number of Initial Particle Groups | w1 | w2 | w3 |
|---|---|---|---|---|---|
| Value | 100 | 100 | 2 | 2 | 2 |
| Objectives | Traditional | Statechart Component | Particle Swarm Genetic Optimization | Target Changes |
|---|---|---|---|---|
| W (J) | 1423.2 | 1321.5 | 1215.9 | |
| J (m/s3) | 5.8 | 7.6 | 5.21 | |
| (Nm) | 1033 | 954.2 | 893.3 |
Disclaimer/Publisher’s Note: The statements, opinions and data contained in all publications are solely those of the individual author(s) and contributor(s) and not of MDPI and/or the editor(s). MDPI and/or the editor(s) disclaim responsibility for any injury to people or property resulting from any ideas, methods, instructions or products referred to in the content. |
© 2023 by the authors. Licensee MDPI, Basel, Switzerland. This article is an open access article distributed under the terms and conditions of the Creative Commons Attribution (CC BY) license (https://creativecommons.org/licenses/by/4.0/).
Share and Cite
Pan, W.; Wang, L.; Ni, X.; Cai, W.; Zhao, Y.; Chen, H.; Lin, Y.; Zhou, Y. Optimisation of Control Strategies for Power Shift Gearboxes. Agriculture 2023, 13, 1266. https://doi.org/10.3390/agriculture13061266
Pan W, Wang L, Ni X, Cai W, Zhao Y, Chen H, Lin Y, Zhou Y. Optimisation of Control Strategies for Power Shift Gearboxes. Agriculture. 2023; 13(6):1266. https://doi.org/10.3390/agriculture13061266
Chicago/Turabian StylePan, Wenlong, Lei Wang, Xiangdong Ni, Wenqing Cai, Yongqiang Zhao, Huajun Chen, Yuangang Lin, and Yuhan Zhou. 2023. "Optimisation of Control Strategies for Power Shift Gearboxes" Agriculture 13, no. 6: 1266. https://doi.org/10.3390/agriculture13061266