1. Introduction
As one of the world’s most important food crops, rice is of great significance to global food security and agricultural sustainability. Rice is a major food source in countries around the world, and it also supports the livelihoods and economic development of millions of people. Especially in many developing countries, rice as a major food crop not only provides the food and energy needed for human life but also plays a positive role in promoting employment and economic growth in rural areas.
However, rice diseases pose a serious threat to rice yield and quality, thereby affecting the economic benefits and food security of farmers. Various types of rice diseases, such as blast disease, sheath blight, brown spot, and bacterial leaf blight, have a significant impact on rice yield and quality. Leaf blast (
Magnaporthe oryzae) is a serious fungal disease in rice caused by
Pyricaria oryzae Cavara. It can infect any aboveground tissue of the rice plant at any stage of its growth, causing lesions on leaves, leaf collars, stems, nodes, neck nodes, and panicles [
1]. Leaf blast has a negative impact on the physical properties of rice. Rice grains infected by this disease dry out 10% [
2] more than normal rice grains, and the thickness of the rice grains decreases by 10%. The impact of leaf blast on rice yield is enormous [
3], as studies show that leaf blast can reduce rice yield by an average of 35% [
4].
Brown spot (
Bipolaris oryzae) is also a fungal disease, and it infects coleoptiles, leaves, leaf sheaths, panicle branches, glumes, and spikelets. Brown spot, caused by
Bipolaris zeicola, is a major fatal disease in rice that can cause qualitative and quantitative crop damage [
5,
6,
7]. Research indicates that bacterial brown spot in rice can reduce rice yields by up to 52% [
8]. Due to the widespread presence and serious threat of rice diseases, the detection of rice diseases is particularly important. Early and accurate detection of rice diseases can help farmers take timely prevention and control measures and reduce the impact of diseases on rice yield and quality. Therefore, the development of efficient and accurate rice disease-detection methods is urgently needed.
To date, there have been many studies on the detection of rice diseases involving various methods applied in rice disease detection. Among them, many scholars have utilized deep learning techniques [
9,
10]. Wang et al. [
11] proposed the ADSNN-BO model, which is a method based on attention neural networks and Bayesian optimization for rice disease detection and classification, using the MobileNet structure and enhanced attention mechanism. This model can effectively learn feature information and achieve an accuracy of 94.65%. Daniya et al. [
12] proposed the RideSpider water-wave algorithm based on deep recurrent neural network and achieved a maximum accuracy of 90.5% in detecting rice plant diseases. These studies extracted more distinctive features such as texture and color for feature extraction. In addition to algorithmic recognition research, there has also been research on rice disease detection. These methods typically use the YOLO object-detection algorithm to achieve automation. Kim et al. [
13] proposed a system for predicting and automatically detecting the infection rate of rice bakanae disease (RBD) through drone images, using the YOLOv3 and RestNETV2 101 models for detecting infected bundles and classifying infected panicles, with average accuracies of 90.49% and 80.36%, respectively. Haque et al. [
14] achieved 90% accuracy in rice disease detection using the YOLOv5 deep learning method. It is worth noting that several significant studies have begun to explore the use of deep learning techniques for the detection of diseases in other crops, such as the fusarium head blight in wheat [
15], the Alternaria leaf blotch disease in apple trees [
16], as well as broader grain-crop phenotyping [
17]. These studies demonstrated the potential and feasibility of utilizing deep learning for the detection of diseases in rice [
18]. Despite the many applied rice disease-detection methods, the accuracy of these methods still needs further improvement. Some methods also need to improve their applicability, especially in dealing with complex rice diseases, and adaptability in different environments. Finally, some detection methods such as fluorescence quantitative PCR and digital PCR are limited by equipment and technical requirements, making it difficult to deploy them in the areas with limited sources. Future research needs to address these issues to better support the prevention and control of rice diseases.
In order to develop a more accurate and efficient method for detecting rice diseases, this study proposes a deep learning model to improve the accuracy and efficiency of rice disease detection. The model utilizes image processing and machine learning techniques for training and optimization using similar images of different categories of rice diseases, with stronger representation and learning capabilities. Specifically, this study proposes a novel hybrid model called ResViT-Rice, which combines the convolutional neural network and transformer architecture. The model is specifically designed for detecting rice diseases. The contribution of this article can be summarized by the following three main points:
The incorporation of the ResNet [
19] model as the backbone network of our structure enabled effective extraction of image features. The employment of residual blocks paved the way for efficient information transfer, mitigating the gradient vanishing issue and thereby enhancing the stability during the training phase, all the while reducing the overall parameters;
We incorporated the transformer architecture into our model, aiming to leverage its powerful self-attention mechanism, which demonstrated exceptional performance in image-processing tasks. Our approach adopted a hybrid structure that combined CNNs and transformer encoder. The CNN component provided spatial inductive bias and accelerated network convergence, thereby enhancing the stability of the training process;
The convolutional block attention module (CBAM) attention mechanism was integrated into the ResViT-Rice block, allowing the model to adjust adaptively to the significance of different regions within the input feature map. This was especially beneficial for rice disease-detection tasks where disease localization within the image might be random. By deploying attention mechanisms, we ensured that the model prioritized disease-afflicted areas, thereby boosting the model’s accuracy.
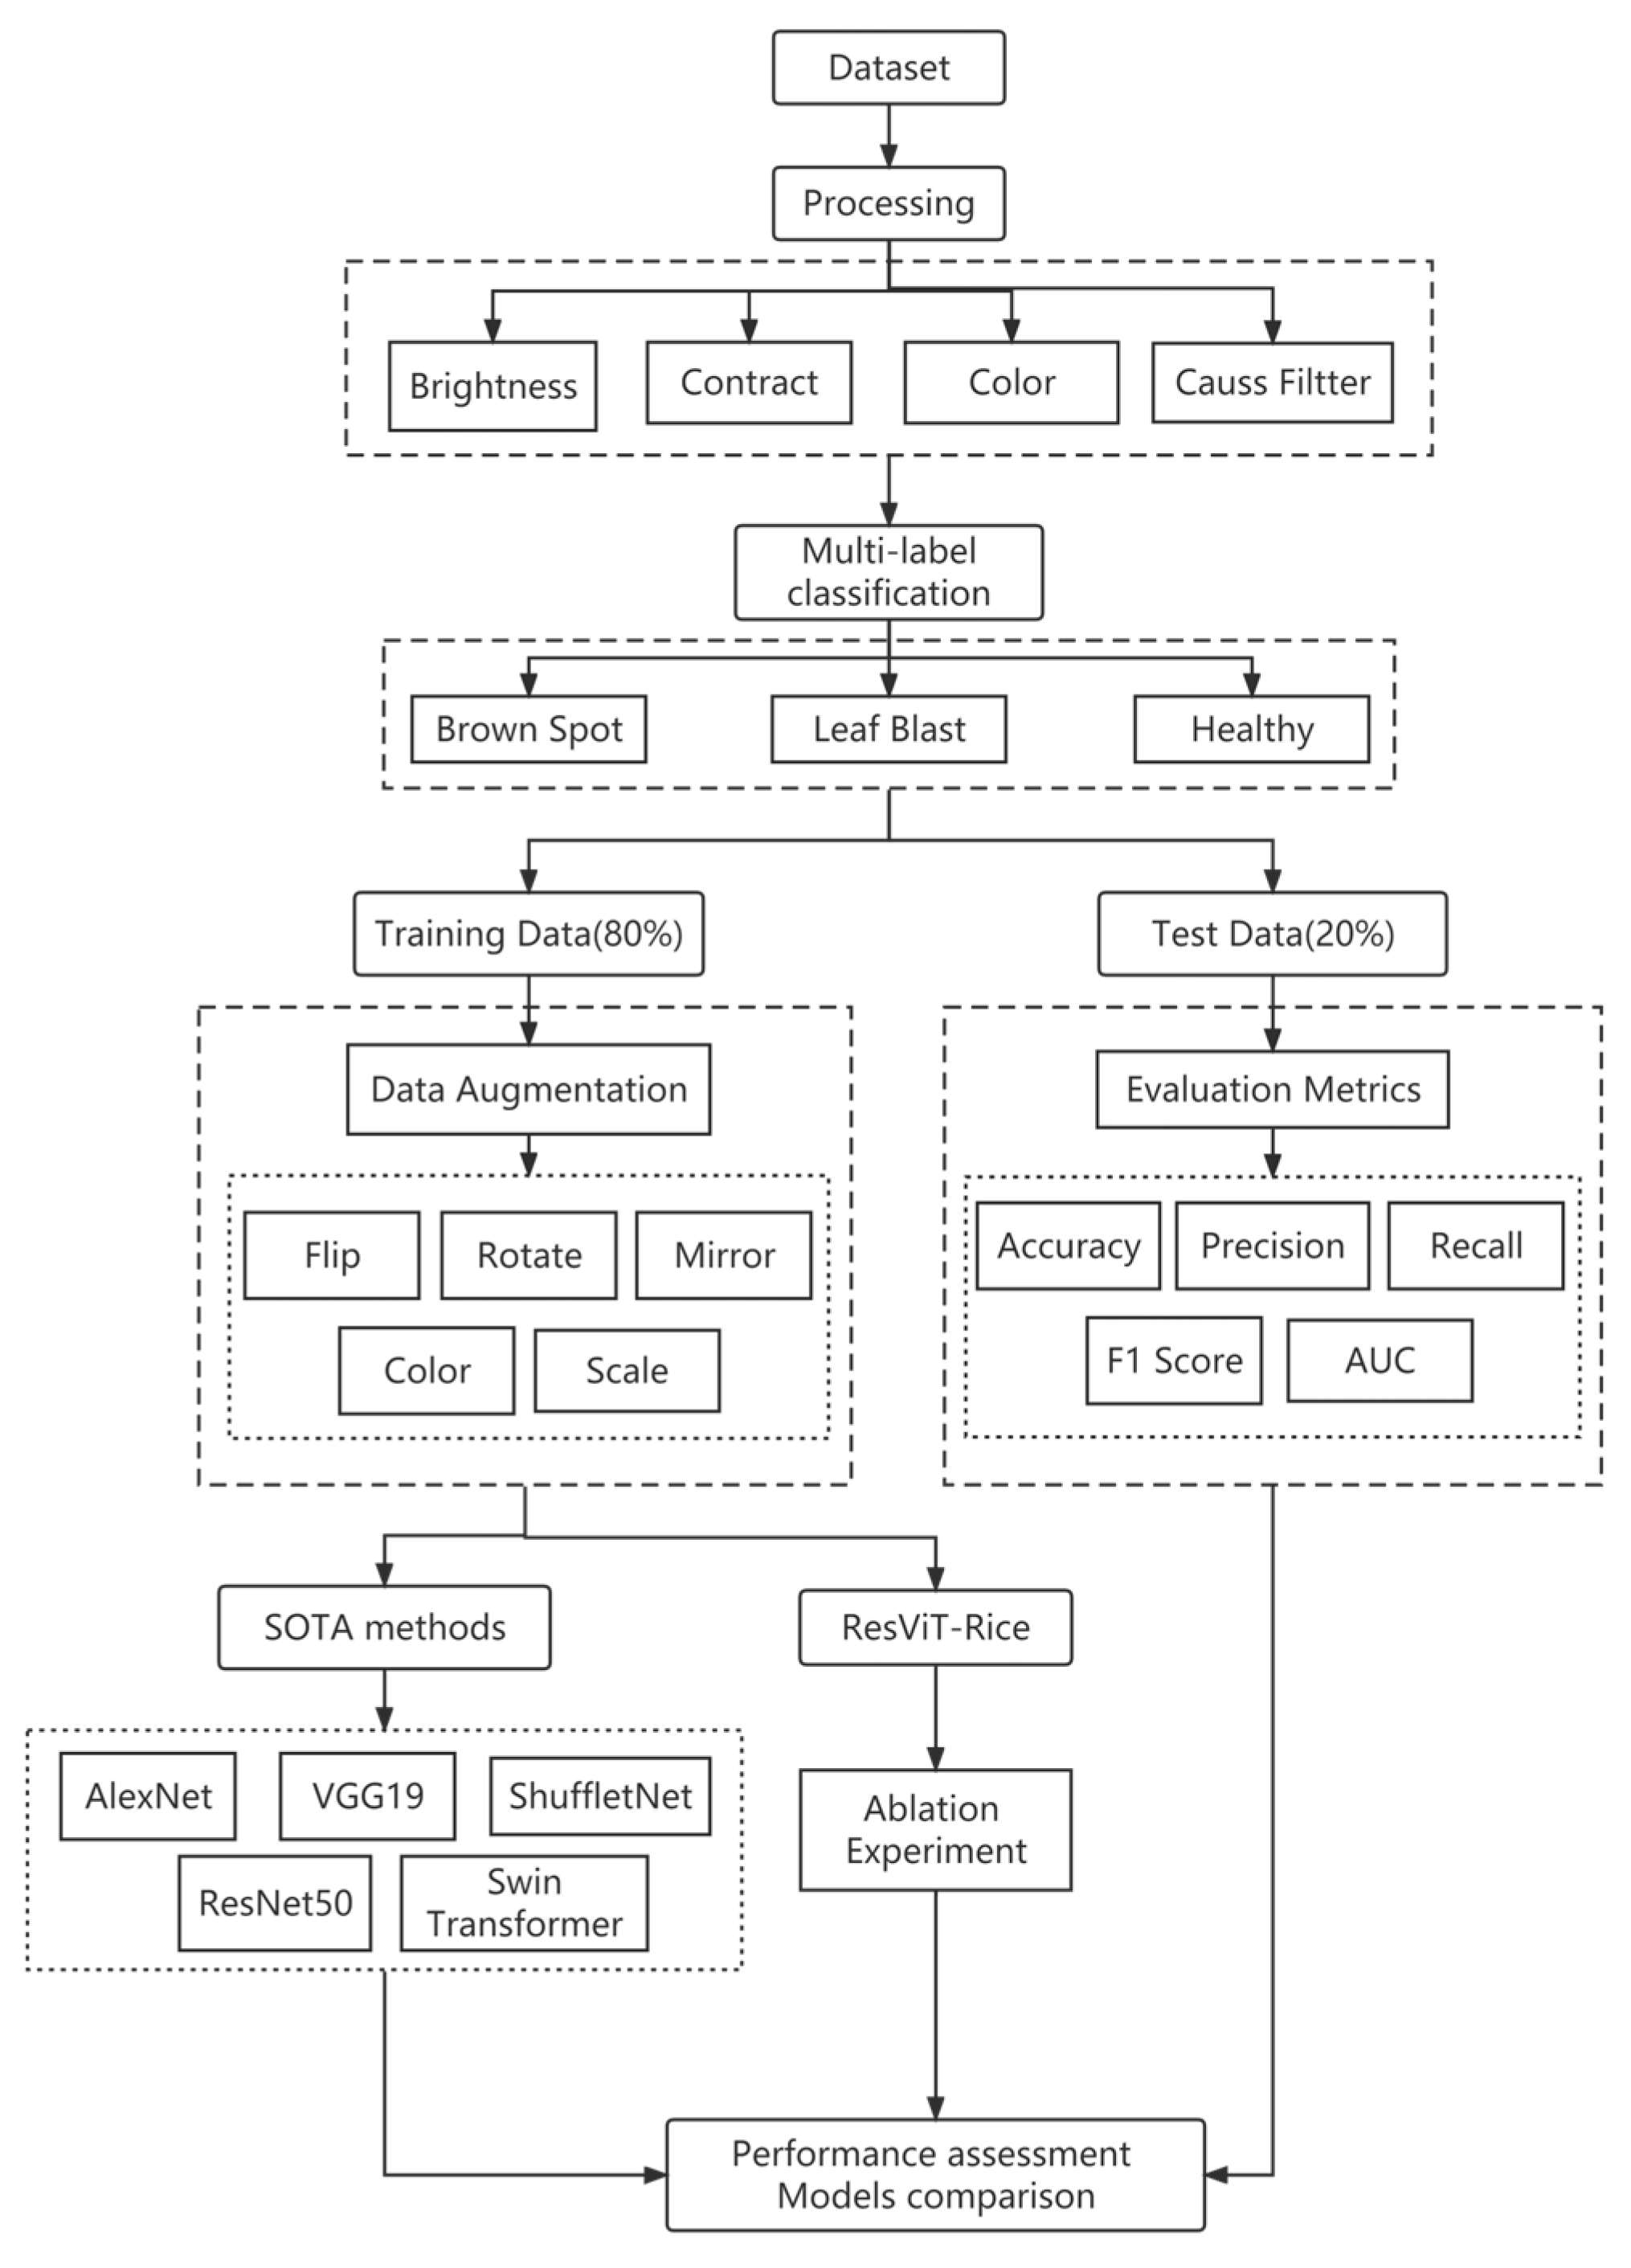
To evaluate the performance of the model, we conducted comparative experiments with traditional rice disease-detection methods and mainstream CNN models. Meanwhile, to further underscore the superiority of our ResViT block, we also carried out ablation experiments. These investigations served to underline the integral role that the ResViT block played in the overall performance of the model, thereby solidifying its place in our future efforts in the field of rice disease detection. The workflow of this study is shown in
Figure 1. The results showed that ResViT-Rice obtained better accuracy in complex disease situations and can provide strong support for early warning and precise control of rice diseases. Therefore, ResViT-Rice is expected to be widely used in future rice disease detection.
2. Materials and Methods
2.1. Data Source
The data used in this study were obtained from Kaggle (
https://www.kaggle.com/datasets/tiffanyjade/rice-disease-image-dataset, accessed on 1 March 2023), a well-known open data science community that provides a large number of public datasets for researchers and data scientists. We obtained a dataset from Kaggle that includes images of two types of rice diseases, brown spot and leaf blast, as well as a category of healthy rice leaves. Each category consists of 516 images. This dataset covers different types of rice diseases and has a rich sample size, providing ample data resources for training and validating our deep learning model in this study.
2.2. Data Preprocessing
Data preprocessing plays a crucial role in deep learning, as it can greatly improve the performance and robustness of the model. In this study, we performed data preprocessing on the rice disease images obtained from Kaggle. The preprocessing included adjusting the contrast, brightness, and color of the images as well as applying Gaussian filtering to remove noise. Adjusting the contrast, brightness, and color can enhance the details in the images, while Gaussian filtering is a commonly used image-filtering method that can effectively reduce noise and smooth the image. These processes helped improve the image quality and make subsequent feature extraction and model training more accurate.
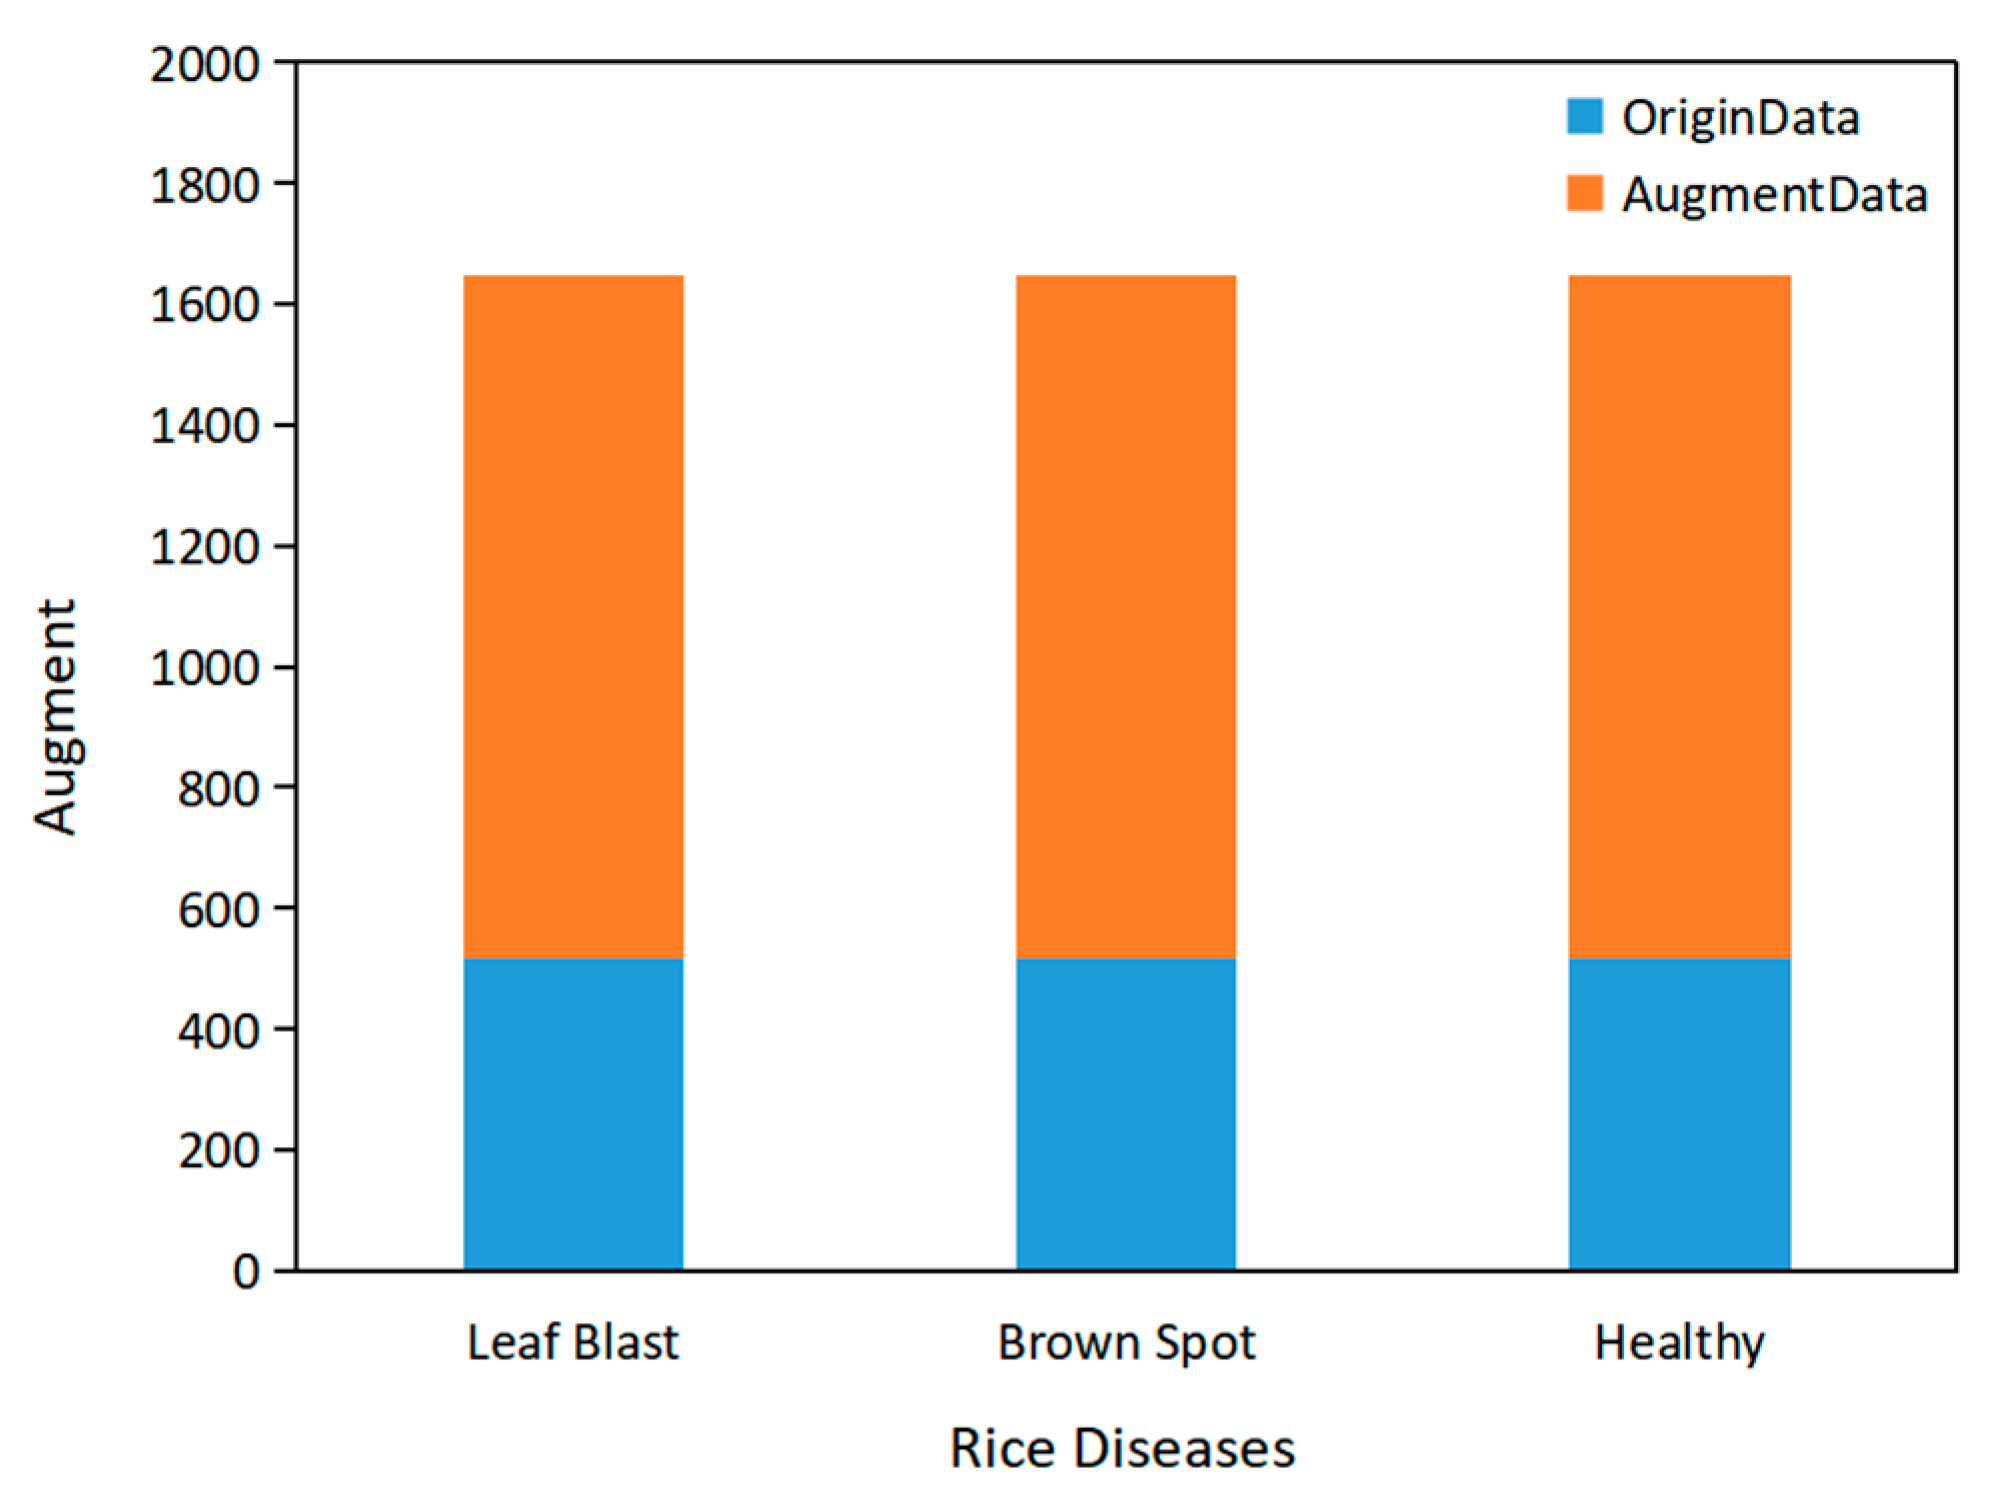
To ensure the stability of the model and the convergence of the training, we performed the normalization operation over the original dataset. Normalization can scale the pixel values of the images to a fixed range (e.g., 0 to 1), while the size of original images was resized to 224 × 224 to better fit the input requirements of the deep learning model. Meanwhile, the original dataset was split into training and testing sets in an 8:2 ratio. In addition, to increase the diversity and richness of the training set, we also performed data augmentation on the images in the dataset, including random rotation, translation, scaling, and flipping. Data augmentation can increase the size of the training set and reduce the risk of overfitting. Through normalization and data augmentation, we can enhance the model’s ability to process and detect rice disease images. The final dataset size is shown in
Figure 2, with each category processed from the original 516 images into 1648 training images and 104 test images.
2.3. Proposal of ResViT-Rice
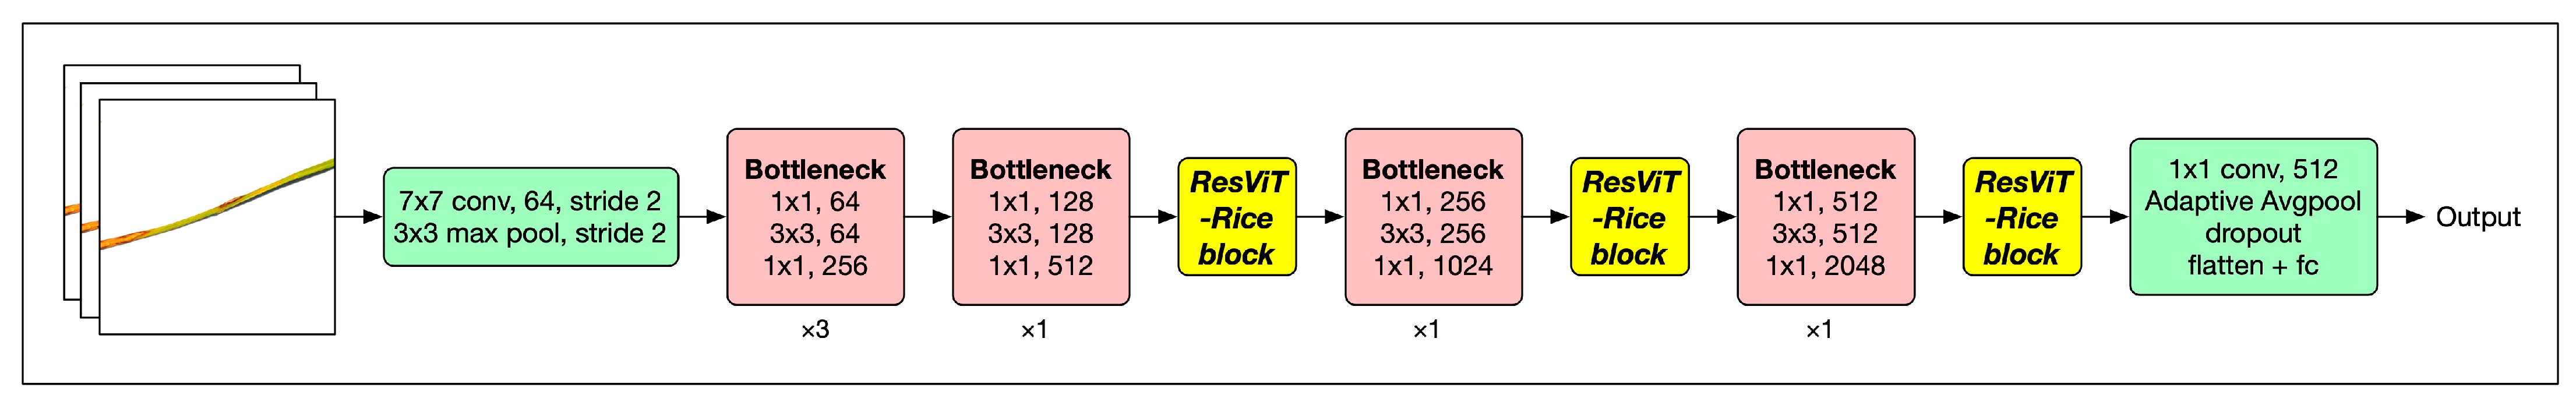
In this study, ResViT-Rice was proposed based on the architecture of deep convolutional neural networks and vision transformers. A newly designed module, ResViT-Rice block, was added to ResNet [
19] to introduce the self-attention mechanism and global view on the basis of CNN to improve the performance of the model.
Figure 3 shows the proposed model architecture, which is mainly composed of ordinary convolution, bottleneck, ResViT-Rice block, adaptive pooling, and fully connected layers.
For the general ResNet [
19] architecture, it used residual connections to alleviate the gradient-vanishing problem and make the network more easily trained. As the core structure of ResNet, the bottleneck is mainly composed of three convolutional layers, which were the 1 × 1 convolutional layer, 3 × 3 convolutional layer, and 1 × 1 convolutional layer, respectively. The output channels of these convolutional layers were 1/4 of the original input channel, 1/4 of the original input channel, and 4 times the original input channel, respectively. This setting allowed the bottleneck module to reduce computational complexity, increase network depth, and improve feature-extraction ability. The main idea of the bottleneck module was to introduce a bottleneck structure that mapped the input features to a low-dimensional space through a low-dimensional bottleneck layer and then mapped the features back to the original dimension through a high-dimensional expansion layer. This structure can reduce the number of parameters and computational complexity. It can also improve the feature-extraction ability, thus achieving better performance. Given the aforementioned reasons, coupled with its impressive capabilities in the visual domain, we chose ResNet as our backbone network.
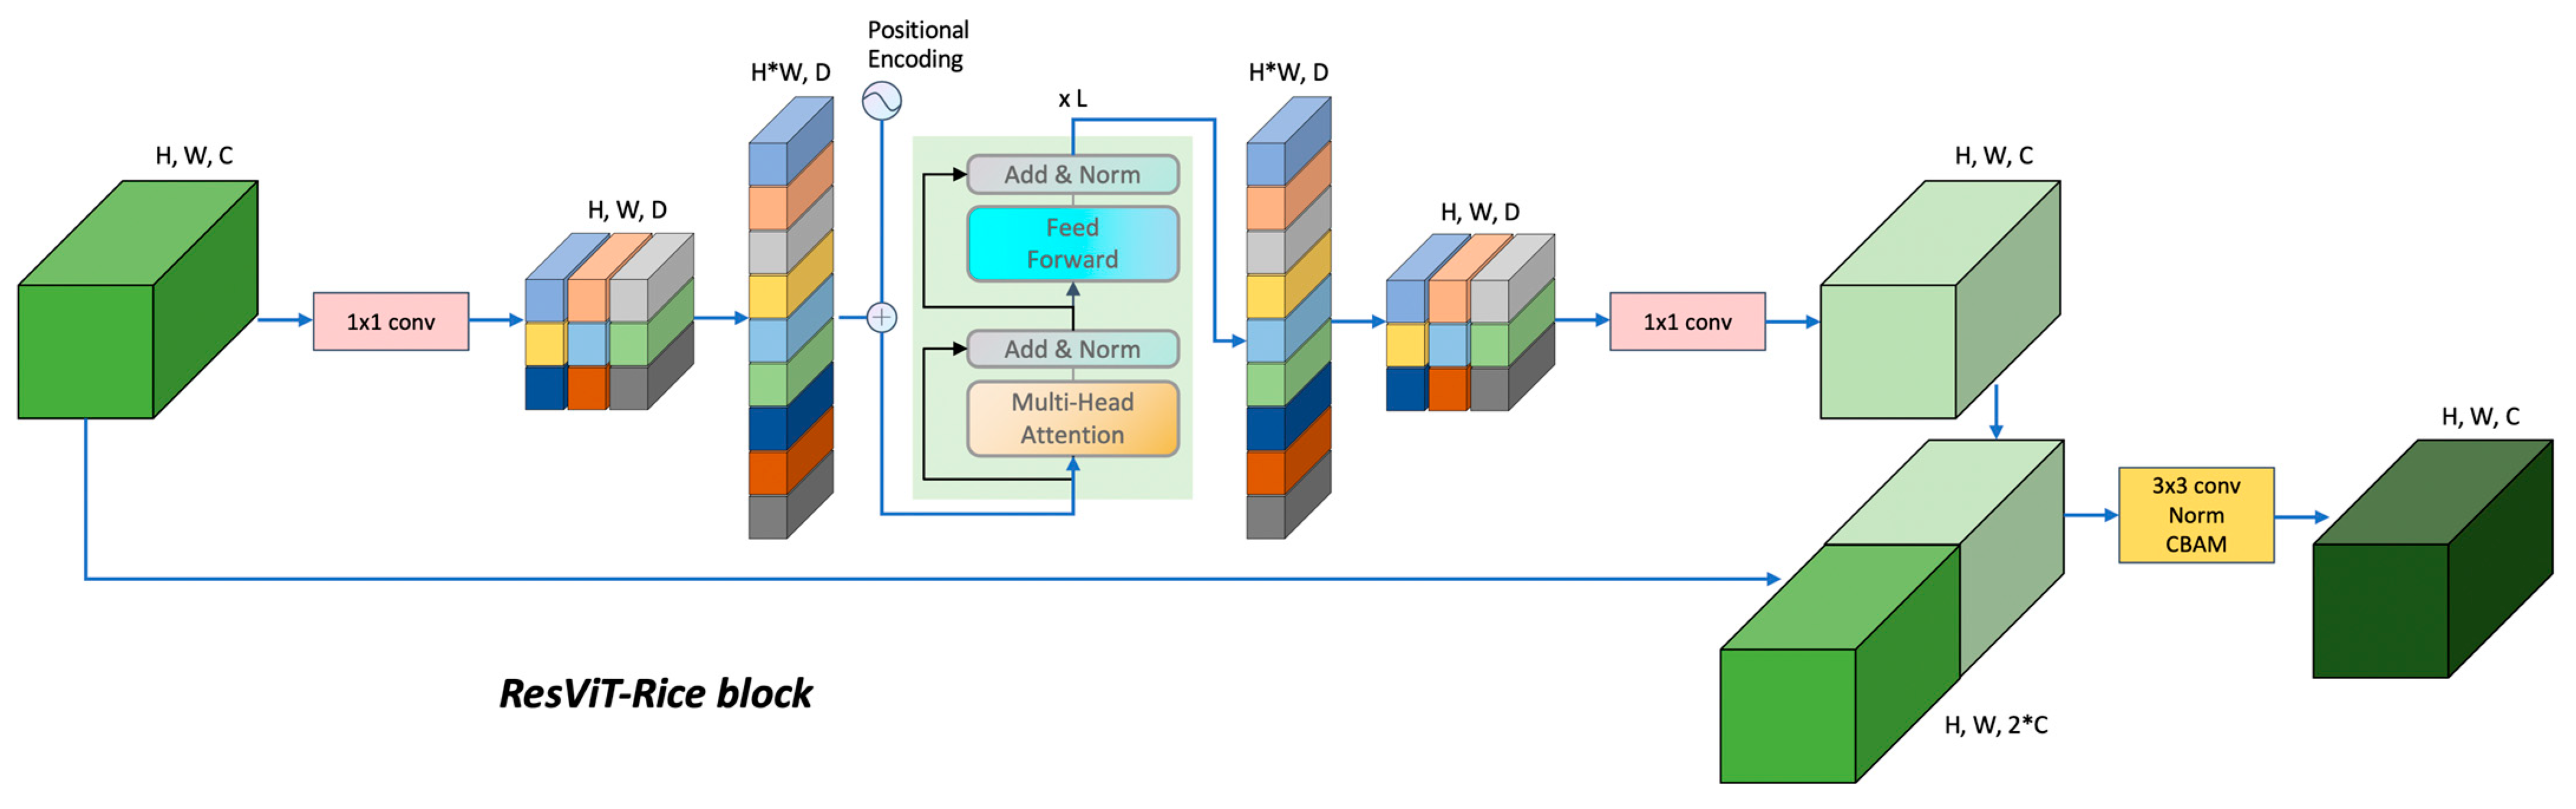
The most novel contribution, the ResViT-Rice block in ResViT-Rice, is shown in
Figure 4. It mainly consists of four components. First is the input channel transformation, which reduces the dimension of the input channel using a 1 × 1 convolutional layer. This can reduce computational complexity and the number of parameters and keep the feature dimensionality consistent when inputting into the transformer encoder each time. Next are the transformers with global views. Assuming that the feature map after the input channel transformation is (H, W, D), the feature map can be unfolded on the surface of H and W axis to obtain a word vector of (HW, D). After adding the positional encoding to this word vector, it was sent to the encoder component. The formula of positional encoding can be written in Equations (1) and (2) as follows:
where
represents the position in the input sequence,
represents the dimension index in the PE vector, and
represents the embedding dimension in the transformer model.
The PE vector has a dimension of
, so each position has a
-dimensional PE vector. This formula uses sine and cosine functions, which have different periods in different dimensions. Therefore, for different dimensions, the values in the PE vector vary according to different periods, providing unique encoding for different positions. By adding the PE vector to the word-embedding vector, the transformer model can capture the positional information in the input sequence. Additionally, the formula for the multi-head attention mechanism in transformer encoder is given in Equation (3):
where
,
, and
represent the query, key, and value vectors, respectively.
represents the number of heads,
refers to concatenating the heads together, and
is the weight matrix for the output. The calculation for each head follows Equation (4):
where
,
, and
are the weight matrices used to perform linear transformations on the query, key, and value vectors, respectively.
refers to the attention function used in the calculation. The attention function is calculated by Equation (5):
where
represents the dimensionality of the query or key vectors.
After obtaining the output, it can be transformed to the original feature map size (H, W, D) based on the processing method used for the original input. Finally, the fusion and output part first use a 1 × 1 convolution to transform the feature channel number to the original size and then perform residual concatenation with the input feature map along the channel direction. Then, a 3 × 3 convolutional kernel is used for feature fusion and dimension reduction, and after batch normalization, the CBAM attention mechanism is used again for global feature fusion and extraction. The CBAM attention module used here includes a channel attention module and a spatial attention module. The channel attention module adjusts the feature representation of different channels by learning channel weights, thereby enhancing the model’s attention to different channel features. The spatial attention module adjusts the feature representation of different spatial positions by learning spatial weights, thereby enhancing the model’s attention to different spatial positions. The CBAM attention module can adaptively adjust the weights of channel and spatial features to better fuse and extract features. Finally, in
Table 1, specific values for H, W, C, and D are provided. The serial number corresponds to the three ResViT-Rice blocks in
Figure 3, respectively (the three blocks marked in bright yellow from left to right).
As illustrated in
Table 2, we aimed at reducing the training cost of the ResViT-Rice model. To this end, we cataloged in the table the quantity of parameters contained within each layer of the model while simultaneously tracing the evolution of image feature maps at every stage. Through this comprehensive presentation of data, we can effectively demonstrate the resource consumption involved during the training process of our model.
2.4. Other Mainstream Models
In this study, we also compared ResViT-Rice with other mainstream models, including AlexNet, ResNet50, VGG19, ShuffleNet, and Swin transformer. ResNet50 uses a special type of cross-layer connection [
19], and this design allowed for smoother information flow and avoiding the problem of gradient vanishing, making the training process more stable. VGG19 uses small (3 × 3) convolutional kernels and a large number of convolutional layers to extract richer features [
20] and employs max pooling layers to reduce the size of feature maps, followed by three fully connected layers for classification. ShuffleNet employs group convolution and channel shuffling to achieve efficient feature extraction and computation [
21]. AlexNet is a deep convolutional neural network model proposed by Alex Krizhevsky in 2012 [
22]. The Swin transformer is a hierarchical transformer model that achieves high efficiency and better performance through layered attention mechanisms [
23].
These five network models all use the Adam optimizer and cosine annealing, with a learning rate of 0.0001 and a batch size of 32. The Adam optimizer can adaptively adjust the learning rate for each parameter, and the cosine annealing algorithm can dynamically adjust the learning rate to improve the model’s generalization ability. The specific parameters of the cosine annealing algorithm are T_0 = 10 and T_mul = 2.
2.5. Model Evaluation
In this manuscript, we evaluated the deep learning models using various evaluation metrics, including accuracy, precision, recall, F1-score, AUC, confusion matrix, and ROC curve. Among them, accuracy is the most commonly used evaluation metric for classification models; precision and recall are used to measure the prediction accuracy and coverage of the model; and F1-score is a harmonic mean that takes both precision and recall into consideration. The confusion matrix can be used to visualize the classification model’s prediction results, providing more detailed performance analysis. The ROC curve is used to evaluate the performance of binary classification models, where the larger the area under the curve (AUC value), the better the model’s performance.
Table 3 shows the formulas and explanations of the various evaluation metrics used in this study, which can comprehensively evaluate the model’s performance and provide strong support for model selection and improvement.
In addition, to demonstrate the generalization capability of our model, namely its excellent performance under changes in environmental conditions and plant diseases, we conducted a set of experiments on a dataset [
24] with a complex background and a wider range of rice disease categories. The corresponding results were added to the
Supplementary Materials.
2.6. Ablation Experiments
Ablation experiments are a vital approach in machine learning, and they are used to understand the contribution of individual components to the overall performance of a model. By systematically ablating parts of the model, the effect on performance can be observed, providing a way to evaluate the importance of these components.
In this research, we conducted three groups of comparison experiments. We applied the ResViT-Rice model to two detection tasks, namely leaf blast and brown spot. For each task, we performed ablation experiments on different elements of the model: block3, a combination of block2 and block3, and the convolutional block attention module (CBAM), respectively. These ablation experiments allowed us to measure the contribution of each individual block and the CBAM attention mechanism to the overall performance of the ResViT-Rice model.
3. Result
3.1. Experimental Setup
In this study, the dataset was divided into training and validation sets at an 8:2 ratio. The experiments were conducted on a computer equipped with an NVIDIA RTX 3090 GPU and 11th generation Intel Core i7 CPU, providing sufficient computing power to support deep learning model training and evaluation. We used PyTorch 2.0 with CUDA 11.7 as the deep learning framework and Python 3.9.16 as the programming language. To assist in implementing deep learning models and model evaluation, we also utilized several commonly used Python libraries, such as scikit-learn 1.2.2, numpy 1.23.5, and pandas 1.5.3.
3.2. Results of Data Preprocessing
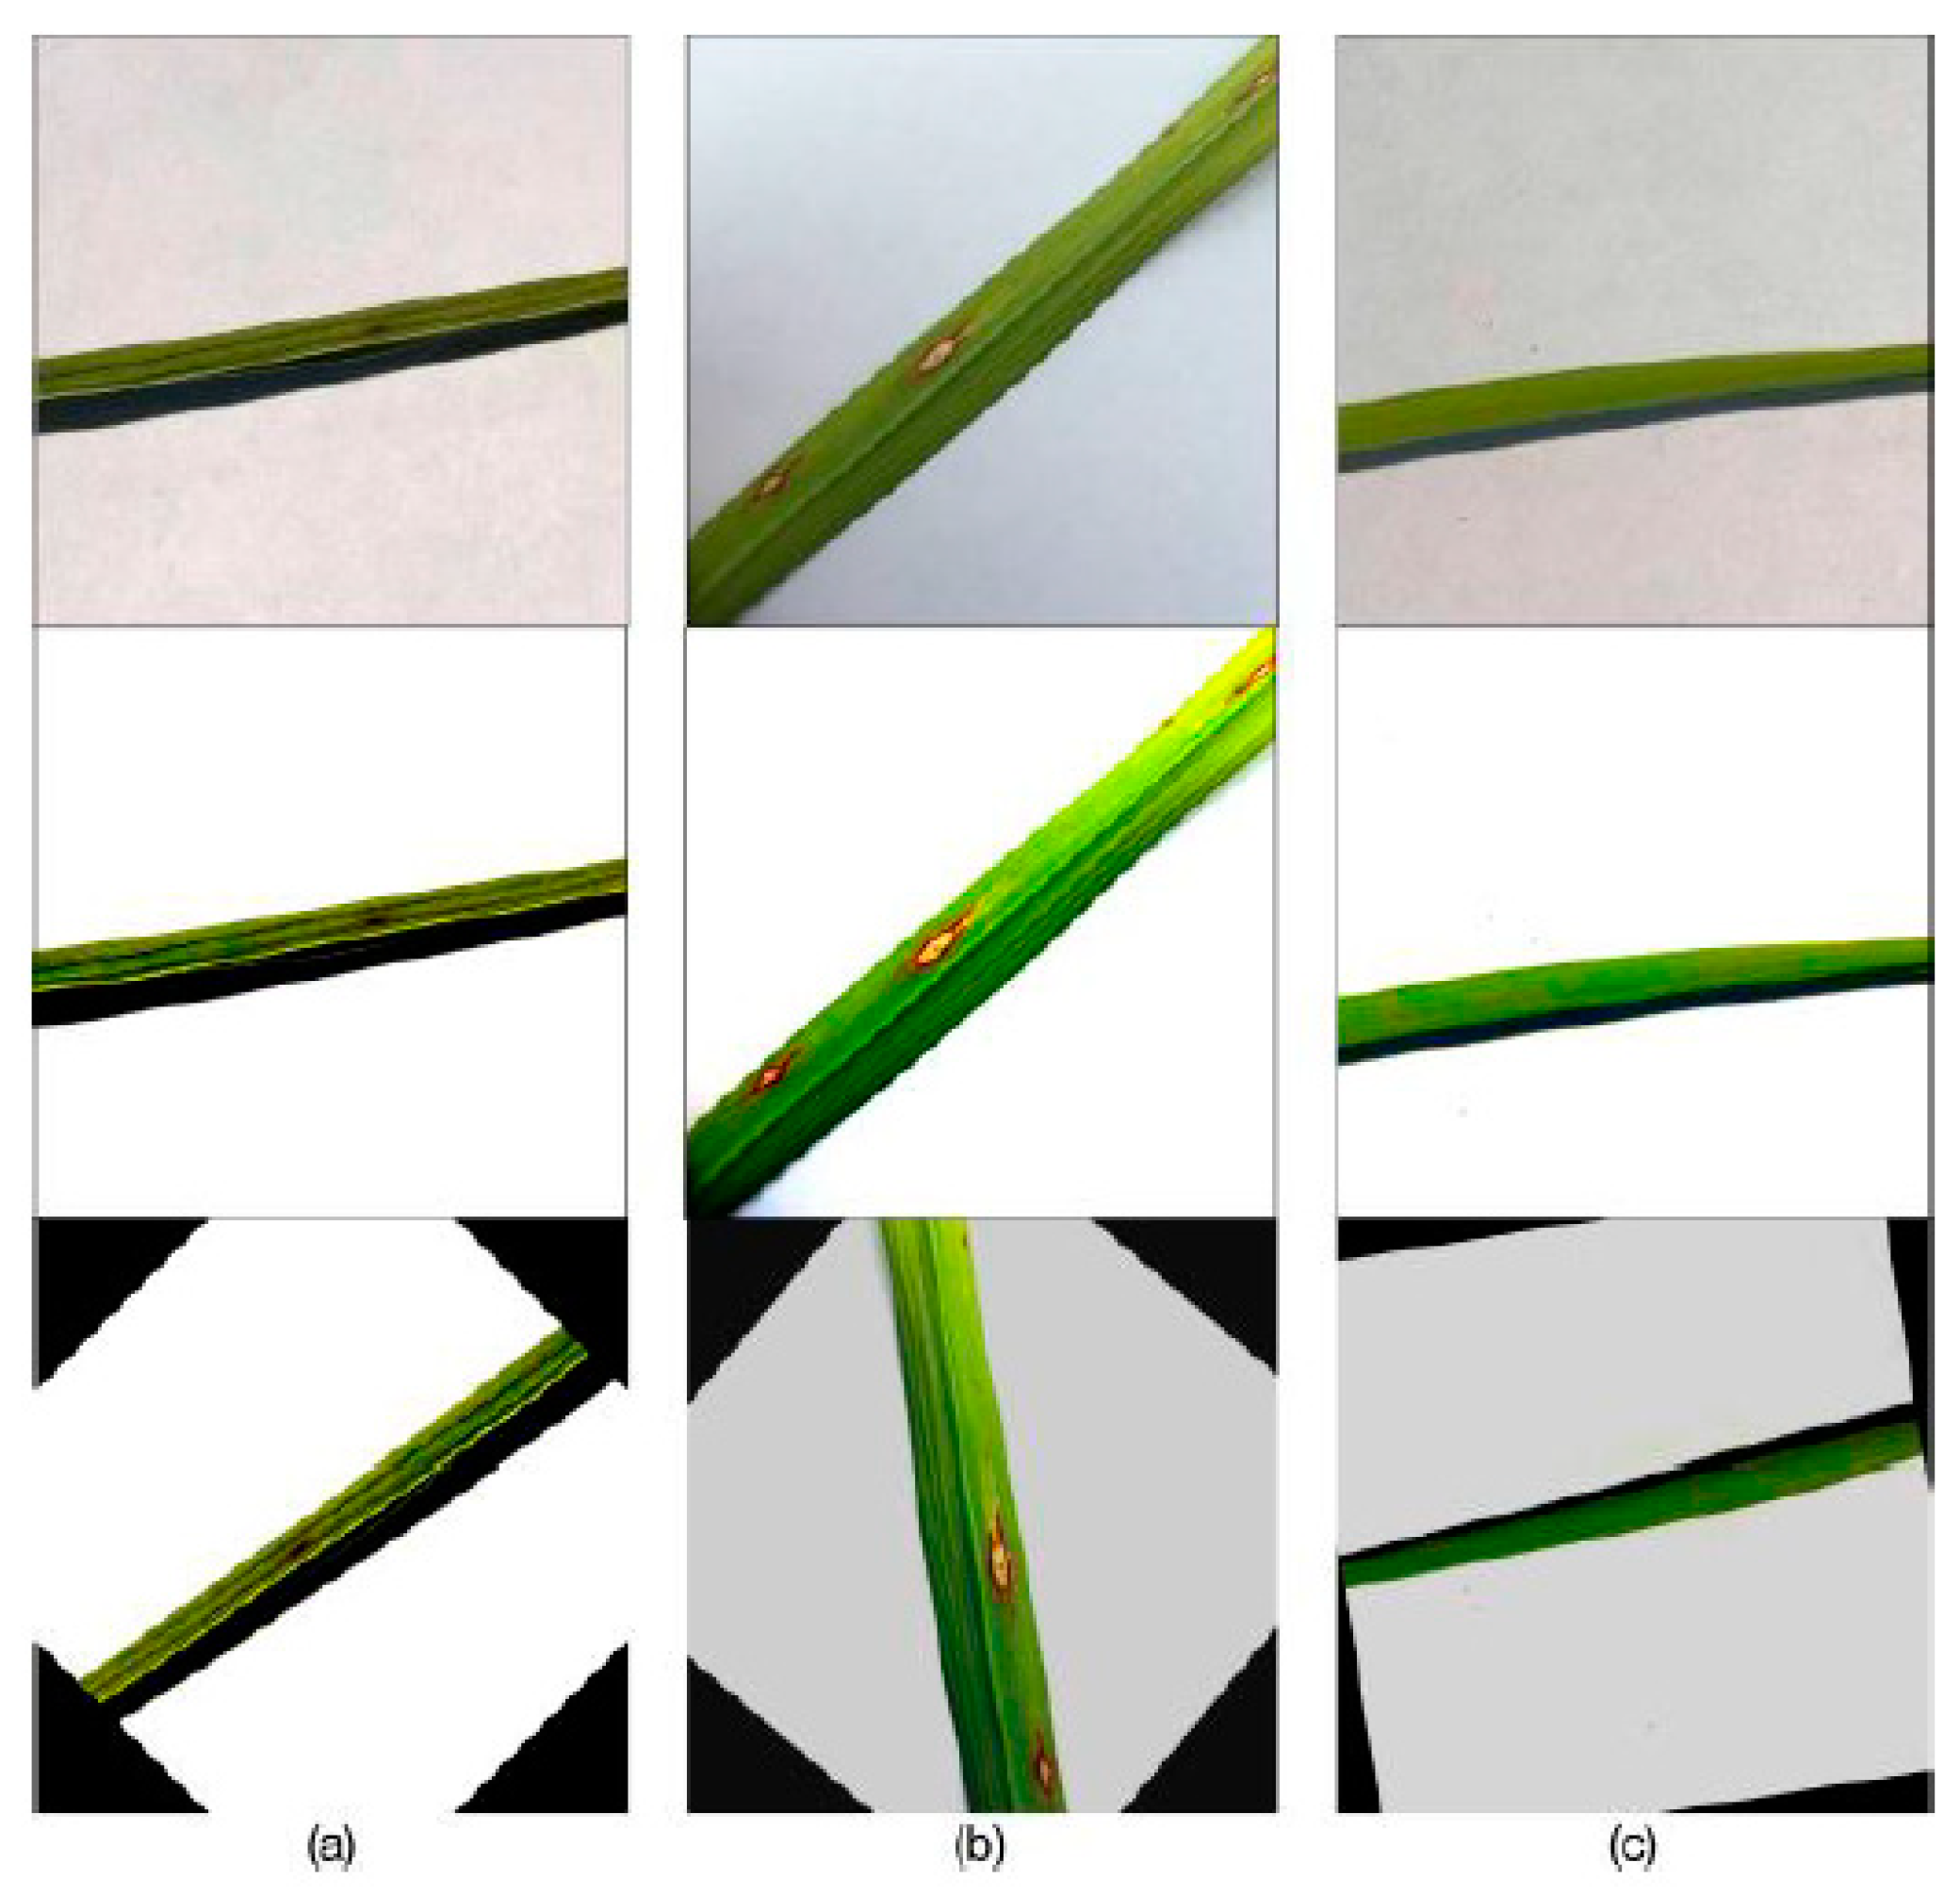
In order to enhance the diversity of the dataset and improve the generalization ability of the model, we first preprocessed the data. As shown in
Figure 5a–c, from top to bottom, comparisons of brown spot, leaf blast, and healthy images before and after data preprocessing and augmentation are presented. It can be observed that after image preprocessing, the characteristics of each category became more distinct, while the semantic information was preserved well, which is beneficial for the model to learn and classify effectively.
3.3. Results of ResViT-Rice
The results suggested that ResViT-Rice achieved excellent performance. As shown in
Table 4, it achieved a recognition accuracy of 99.04% and 96.63% for the two types of rice diseases, respectively, which were the highest among all the models evaluated, with an average accuracy of 97.84%. Compared with AlexNet, ResNet50, VGG19, ShuffleNet, and Swin transformer, the ResViT-Rice model outperformed the best-performing ResNet50 model by 4.81% in terms of accuracy. In addition, when evaluated with precision, recall, F1-score, and AUC value, the ResViT-Rice model consistently outperformed the other four classic CNN models by at least 4% across all evaluation metrics.
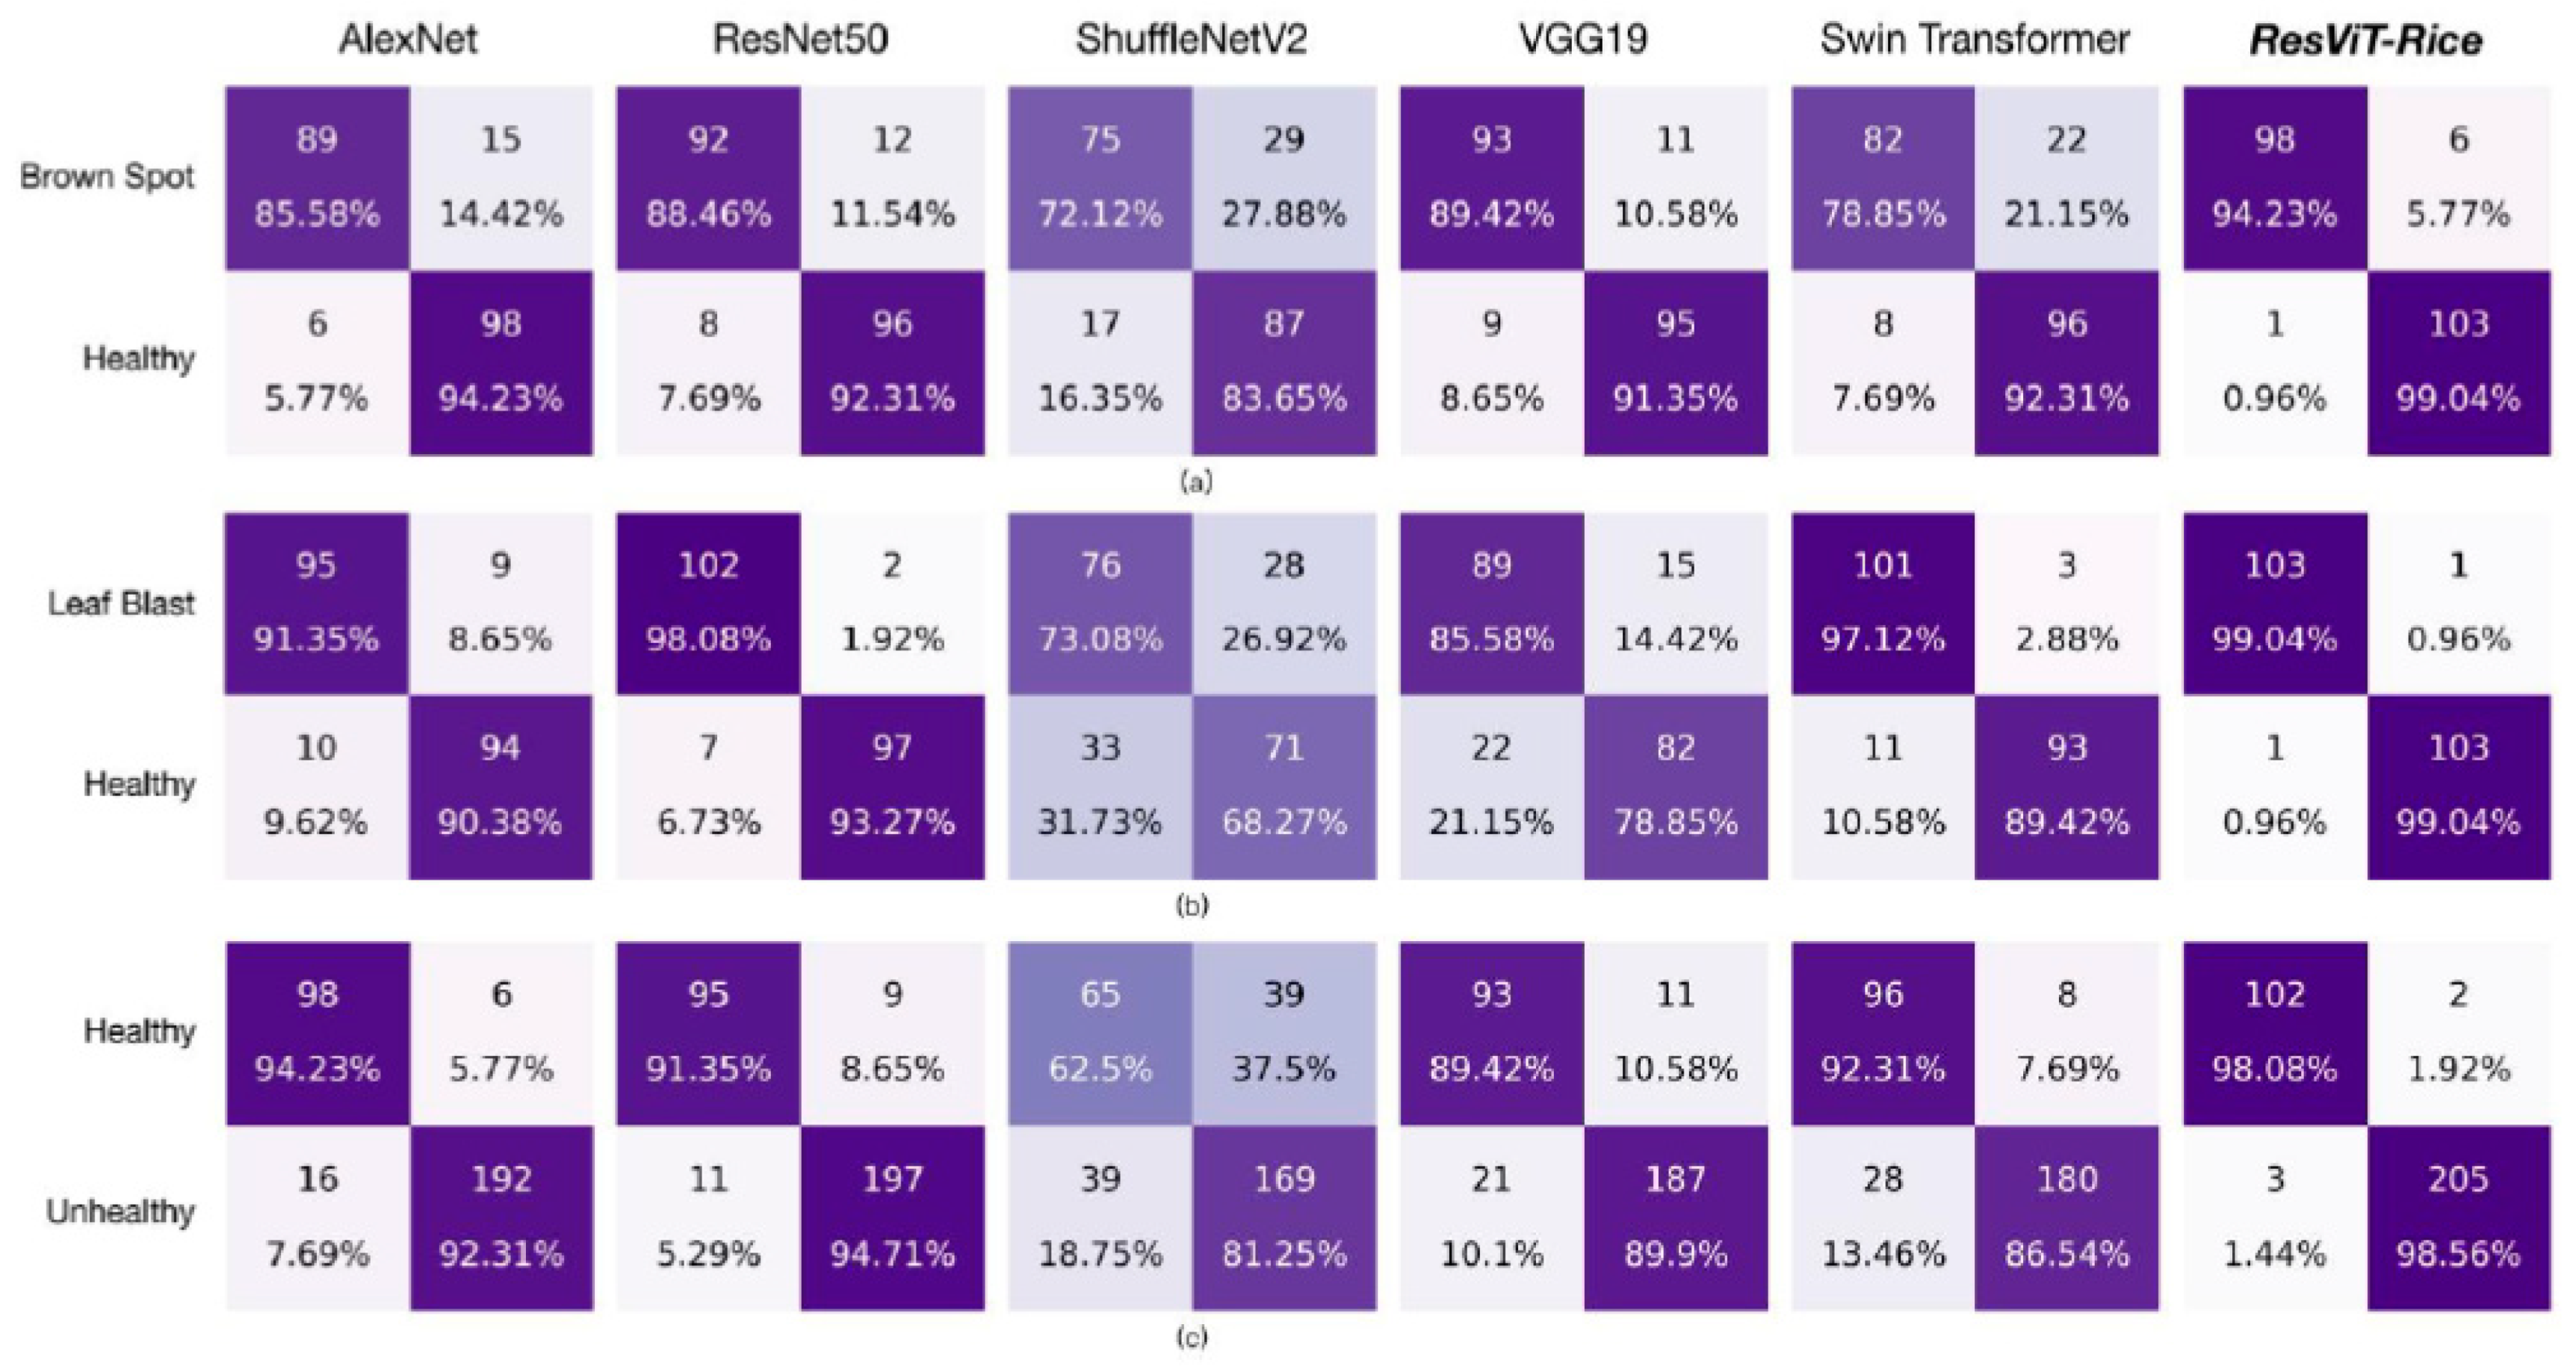
From another perspective,
Figure 6a,b depict the confusion matrix of the five classic models and ResViT-Rice on the brown spot and leaf blast tasks, respectively. By comparing the confusion matrix, it was evident that the ResViT-Rice model achieved the best classification performance, as indicated by the darkest colors on the main diagonal. As shown in
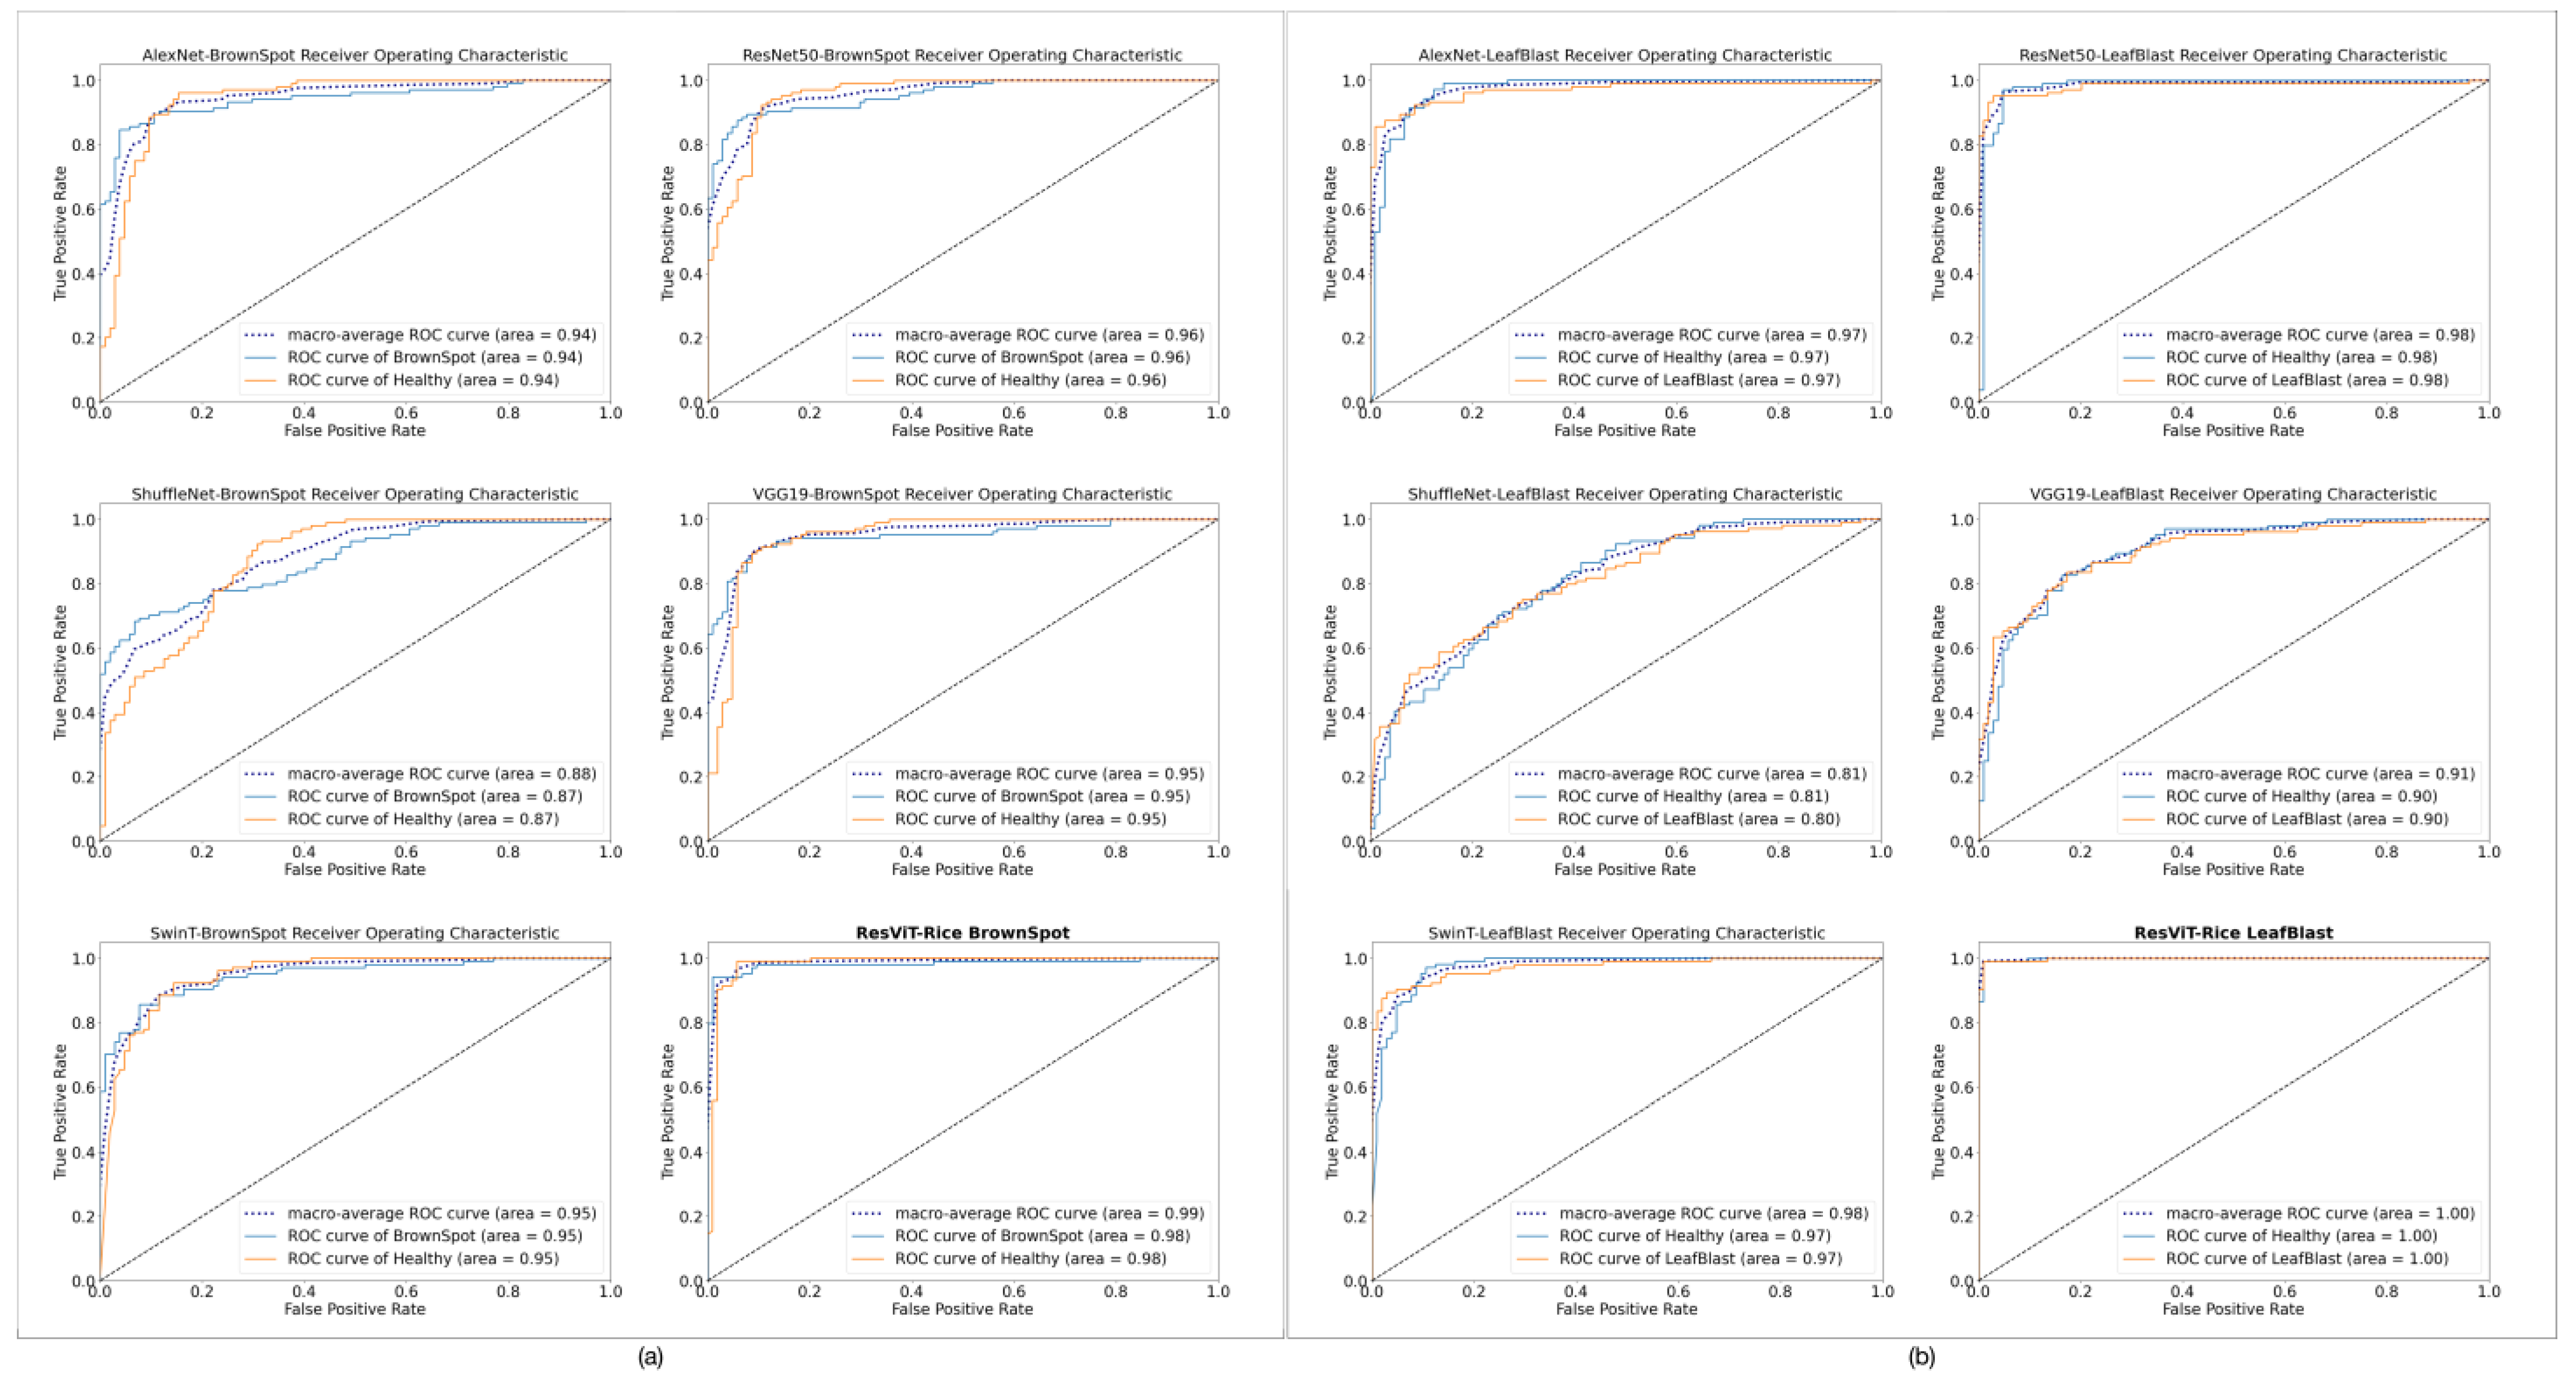
Figure 7, the ROC curves further illustrate the significant differences in performance among the models. In
Figure 7b, the ResViT-Rice curve almost entirely overlaps with the top-left corner, indicating the largest area under the curve (AUC). The AUC values of ResViT-Rice for both rice diseases reached 0.99, demonstrating its strong generalization ability and superior performance in disease detection.
As shown in
Table 4, ShuffleNet performed the worst, with an accuracy of less than 0.8 in the rice disease-detection task. This may be due to the fact that lightweight networks were limited to extracted features. ResNet50 had the best classification performance among the all models, achieving an accuracy of over 0.9. The use of residual modules allowed ResNet50 to better extract features, which greatly improved network performance, so residual neural networks often performed well in various classification tasks. However, there was still a considerable gap between ResNet50 and ResViT-Rice.
The Swin transformer demonstrated an acceptable performance, achieving 0.9326 accuracy in the leaf-blast-classification task. However, its performance in the brown-spot-classification task was mediocre, indicating both the potential and limitations of the Swin transformer. In this classification task, the performance of AlexNet ranked second to ResNet50, with an average accuracy above 0.9038 in both rice disease-detection tasks. VGG19, as the most complex and parameter-heavy model among these networks, had accuracy of 0.8221 and 0.9038 in the two classification tasks, respectively. However, its overall accuracy was less than 0.9.
3.4. Results of SOTA Models
Table 5 summarizes the latest research on rice disease classification and the corresponding accuracy. Various methods were used to complete the rice disease classification task. For instance, Wang et al. [
11] applied both the attention mechanism and Bayesian optimization to a depth-wise separable neural network. Kim et al. [
13] and Haque et al. [
14] adopted the YOLO serious model to classify different classes of rice diseases. It is also noted that various backbones were used, including ResNet, GoogLeNet, VGG, ShuffleNet, and so on. Although the dataset used in each study varied in sample sizes, the disease categories in these remained almost the same. Judging from the evaluation metrics (accuracy, precision, recall, etc.), it can be concluded that ResViT-Rice achieved the optimal performance among all.
3.5. Feature-Visualization Process
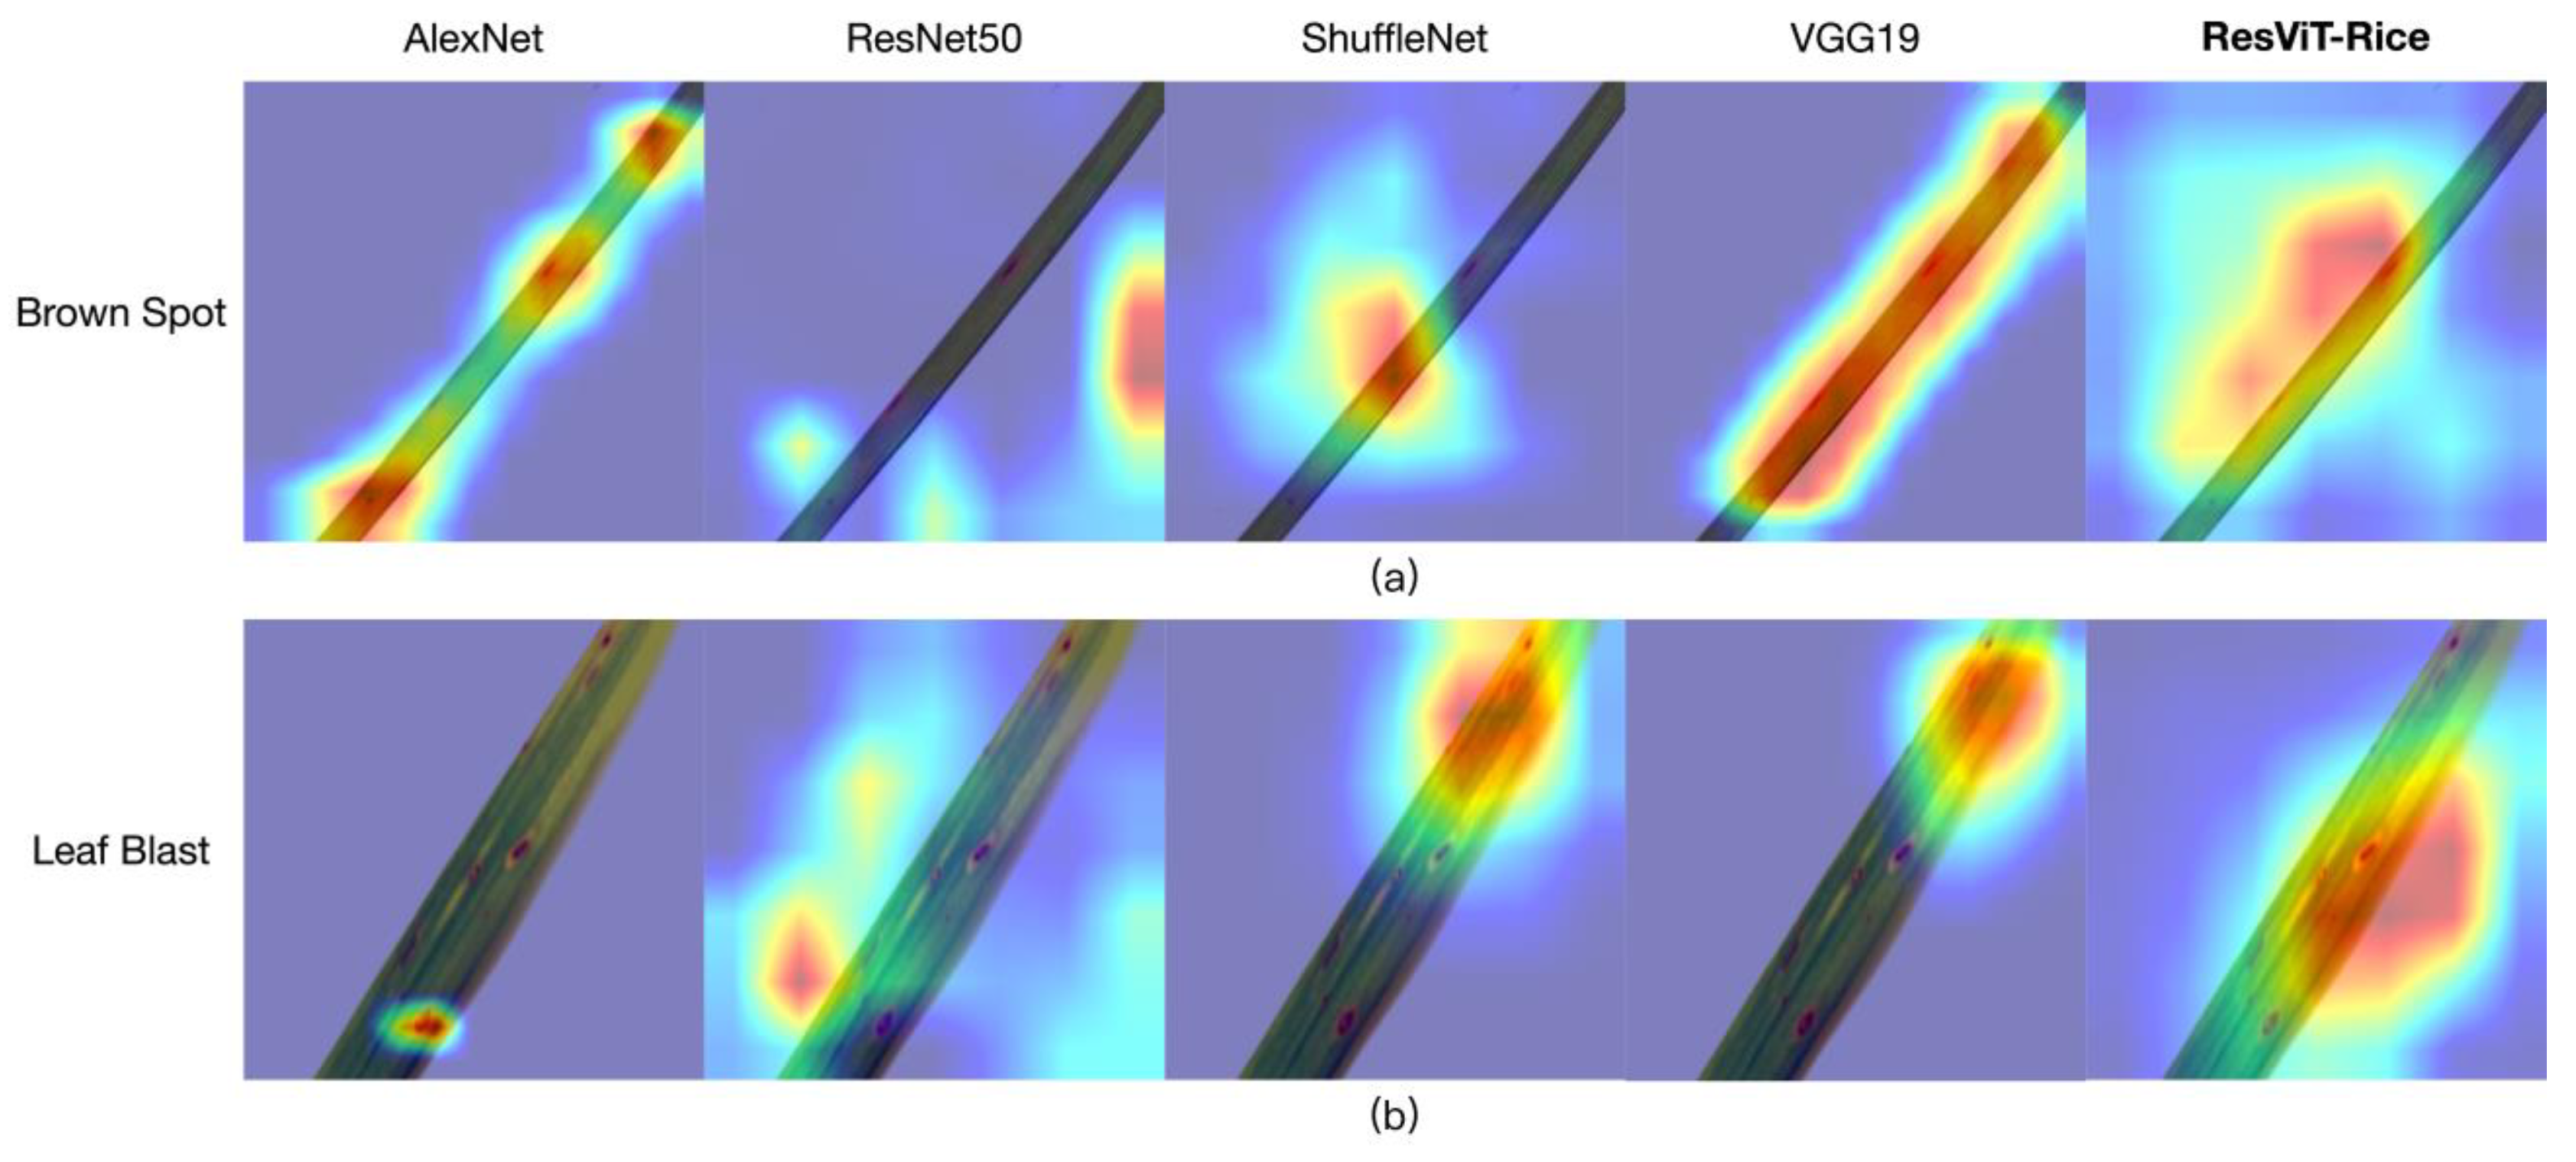
Deep learning models have shown remarkable performance in tasks such as image classification and object detection. However, due to their black-box nature, explaining the decision-making process behind their predictions remains a challenge. Visualizing the feature maps of neural networks has been widely used to gain further insights into the model. Grad-CAM is a gradient-based explainability technique that generates heatmaps and highlights the areas (pixels) of a given image that the model focuses on, thereby aiding in understanding the model’s decision-making process and inference basis. To better understand the differences between feature maps extracted from different rice leaf disease images and evaluate the model’s attention regions, this experiment used Grad-CAM for visualization. The experimental results, shown in
Figure 8, help further elucidate the model’s decision-making process and feature-extraction process.
From the results of ResViT-Rice shown in
Figure 8a, it can be observed that the model exhibited deeper colors and textures in the vicinity of the disease spots, indicating that the model can accurately capture the features of these disease spots. In comparison, AlexNet, ShuffleNet, and VGG also highlighted the colors and textures in the regions where the disease spots were located to varying degrees. However, AlexNet additionally highlighted an area that should not be focused on, mistaking it for a disease spot, while ShuffleNet failed to cover all the disease spots comprehensively. VGG19 almost focused on the entire leaf, failing to better highlight the prominent features. Although ResNet50 achieved the highest accuracy compared with other mainstream models, it can be observed from both
Figure 8a,b that the features were not related to the disease spots. For the leaf-blast-diseased leaves shown in
Figure 8b, ResViT-Rice also generated correct colors and textures in the most densely concentrated disease spots, obtaining the best features in comparison.
3.6. Results of Ablation Experiments
The results of the ablation experiments for the ResViT-Rice model are presented in
Table 6. These outcomes offer a detailed insight into the relative significance of each module/block in the model.
For the leaf-blast-detection task, the removal of block 3 resulted in an accuracy, precision, recall, and F1-score of 0.8605, 0.8704, 0.8605, and 0.8596, respectively, with an AUC of 0.9581. This reflected a decrease in performance compared to the intact ResViT-Rice model, thereby indicating the importance of block 3 to the model’s functioning. When both blocks 2 and 3 were ablated, the metrics showed a further slight decline. However, the most considerable reduction in model performance was observed when the CBAM was removed, with a drop in all metrics, signifying the CBAM’s crucial role in the model’s effectiveness.
Similarly, the ablation experiments for the brown-spot-detection task revealed the value of each module. The removal of block 3 led to a decrease in all performance metrics, indicating its importance. However, unlike in the leaf blast task, the ablation of blocks 2 and 3 in the brown spot task resulted in more considerable performance degradation, signifying the potentially greater role of the ResViT block in this task. The removal of the CBAM also led to lower performance, underscoring its essential role across tasks.
In both tasks, the highest performance across all metrics was achieved with the full ResViT-Rice model, which suggests that each component of the model contributes significantly to its overall performance. The results from these ablation experiments demonstrate the model’s robustness and the importance of its individual blocks as well as the CBAM’s attention mechanism.


