Article

Energy Efficiency of LEDs during Micropropagation of Helleborus ‘Molly’s White’

by
Karolina Nowakowska
1,*,
Katarzyna Kowalczyk
2,
Anna Pawełczak
2 and
Janina Gajc-Wolska
2
1
Section of Ornamental Plants, Institute of Horticultural Sciences, Warsaw University of Life Sciences (SGGW), Nowoursynowska 159, 02-776 Warsaw, Poland
2
Department of Vegetable and Medicinal Plants, Institute of Horticulture Sciences, Warsaw University of Life Sciences (SGGW), Nowoursynowska 159, 02-776 Warsaw, Poland
*
Author to whom correspondence should be addressed.
Agriculture 2023, 13(6), 1265; https://doi.org/10.3390/agriculture13061265
Submission received: 22 May 2023 / Revised: 8 June 2023 / Accepted: 12 June 2023 / Published: 19 June 2023
(This article belongs to the Section Agricultural Systems and Management)

Abstract

:
For many years, there has been a growing trend toward producing plants using tissue culture, the most efficient method at present. Every year, more and more protocols for micropropagation of economically valuable species are appearing. Many factors influence the regenerating explants under sterile laboratory conditions. One of the most important is light. The aim of the present study was to increase the efficiency of micropropagation of hellebore ‘Molly’s White’ using energy-efficient light-emitting diodes (LEDs), which were compared to traditionally used fluorescent lamps (FLs). To choose the best light and reduce production costs, white, blue or red LEDs with two levels of photosynthetic photon flux density (PPFD), 40 and 70 μmol/m2/s, were used at the multiplication and rooting stages. LED light color has been shown to affect regeneration rate and plant growth in length during micropropagation, while both light parameters (color as well as intensity) affect the length of regenerating shoots and the content of assimilation pigments in plants. The use of white LED light, which gives the highest multiplication rate, at an intensity of 70 μmol/m2/s saves more than 57 kWh during an 8-week micropropagation cycle compared to conventional fluorescent lamps with the same parameters.

Graphical Abstract

1. Introduction

Hellebores have remained of interest to humans for years. They belong to the Ranunculaceae family, and their natural habitat is Europe and Asia. The majority of Helleborus species are concentrated in the Balkan region. Poland is inhabited by H. purpurescens, which is under legal protection due to the threat of extinction [1]. In addition to its decorative value, hellebore is also a medicinal plant. In its composition, it includes heleborin, which exhibits narcotic and hemolytic effects, and heleborein, which exhibits cardiac effects similar to digitalis. Depending on dosage and treatment, the extract, as well as individual fractions of hellebore rhizomes and roots, exhibits multiple bioactive effects and can act in several directions. In most cases, the mechanisms of action are not sufficiently studied and described or are unknown [2].
As has been repeatedly shown, micropropagation is currently the most modern and promising method of vegetative propagation of both ornamental [3,4] and endangered plant species [5,6,7]. Due to the different requirements of individual species, and even their varieties, as well as the problems that arise at different stages of conducting in vitro cultures, protocols should be developed for each specific plant. It is also necessary to keep looking for new solutions to make the method as cost-effective as possible and the regenerating plants of the best possible quality [8]. Many factors affect plant regeneration under sterile, practically fully controlled in vitro conditions. Among the most important are the type of explant; the composition of the medium, including the concentration and type of plant growth regulators; and of course, light [9,10]. Light, including its source and quality, is a fundamental factor in the proper growth and development of plants [11,12]. Plants use light in a number of vital processes, including the primary one of photosynthesis, which affects their nutrition and appearance, and hence the quality of the material. Depending on the parameters of the light available during growth, plants can respond in completely different ways. With excessively strong lighting, overly intense, elongated growth is usually observed. On the other hand, in response to too little light, growth is often reduced. This ability of plants and chloroplasts to adapt to light is the main basic form of photomorphogenetic response, which is associated with specific changes in plant morphology, physiology and biochemistry [13,14].
Due to the significant impact of light on plant development, people began to improve its source and quality in horticultural production, wanting to obtain high-quality propagation material. Lamp producers began to market products tailored specifically to the needs of plants. Fluorescent lamps (FLs) are the traditional light source used in phytotrons for micropropagation. Nevertheless, their disadvantages, such as high power consumption and the production of a wide range of wavelengths (350–750 nm) unnecessary in plant development, have been reported for years [15]. Light-emitting diodes (LEDs) have emerged as an alternative and were quickly accepted positively in commercial production. LEDs have many advantages over fluorescent lamps—lower heat emission, monochromatic spectrum, longer life and low energy consumption—which contributes to their pro-environmental nature. LED lighting systems for in vitro cultures make it possible to control this important parameter and provide light in the spectral range that is used in photosynthesis and positively affects photomorphogenic reactions in plants [16,17]. The colors or combinations of LEDs commonly used in in vitro cultures are white (W), red (R), blue (B) and a mix of blue and red (B+R). It has been reported that red light is important for elongation growth of shoots and stems, phytochrome reactions and changes in plant anatomy [18], while blue light is important in chlorophyll biosynthesis, opening of stomata, chloroplast maturation and photosynthesis. Together, blue and red have been used in different combinations of LEDs in many studies on photosynthesis and chlorophyll synthesis [19]. In experiments conducted for 8 weeks under LED light (white, red, blue, R+B combination) on three different ornamental plant species, Cordyline australis, Ficus benjamina and Sinningia speciosa, authors showed that blue and R+B resulted in higher maximum quantum yield in all species and higher plant biomass in this light combination [20]. During micropropagation of Zantedeschia, it was found that blue light affected plant height and chlorophyll [21]. LED light affected potted chrysanthemum production differently. Plants under R+B light had the highest leaf greenness index (SPAD) value and the shortest cuttings with the longest roots, while the W+B LED combination significantly affected most growth parameters, with the exception of plant height and number of leaves [22].
Therefore, the response to LED lighting depends on the wavelength to which plants are exposed and varies from species to species [
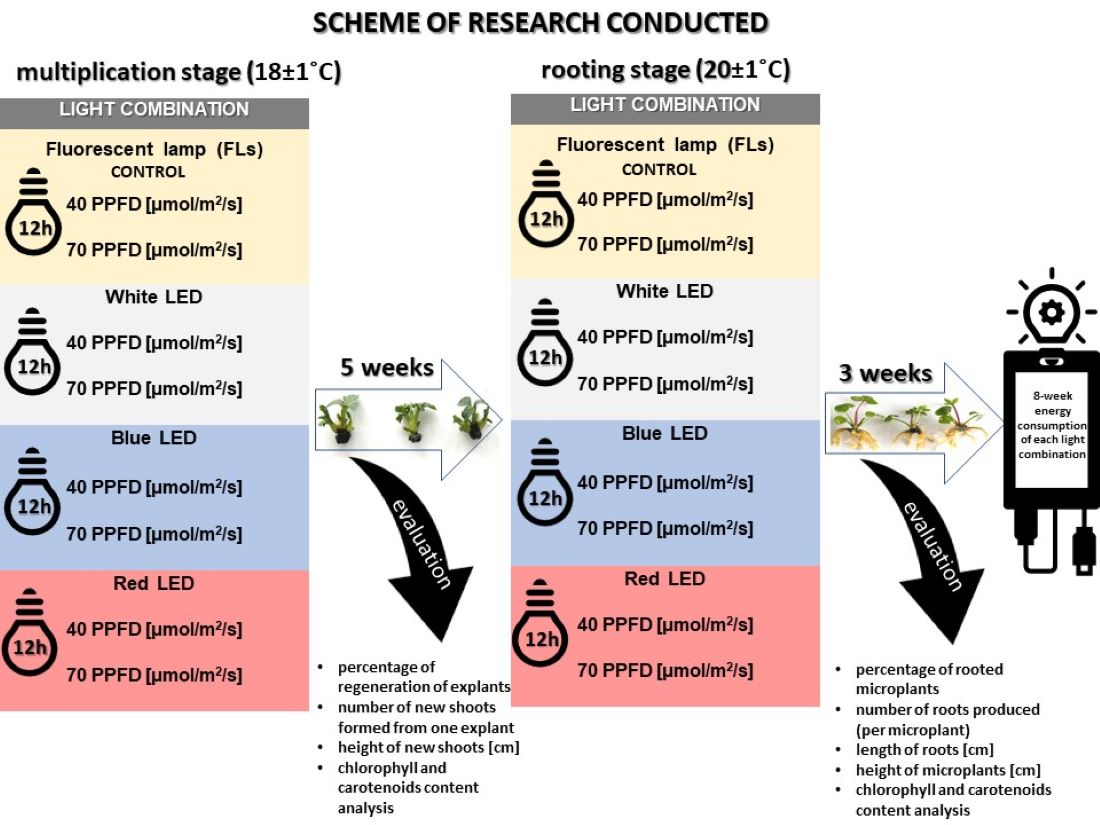
23]. Therefore, there is a need for research to learn more about the response of important species, such as hellebores, to LED lighting, which will replace fluorescent light sources entirely in the near future. We hypothesized that LED light would produce comparable or even better effects on hellebore micropropagation than traditional fluorescent lighting (FLs) at a significant reduction in production costs. Thus, the aim of the study was to increase the micropropagation efficiency of the hellebore ‘Molly’s White’ using energy-efficient light-emitting diodes (LEDs) in white, blue and red, which were compared with traditionally used fluorescent lights (FLs).

2. Materials and Methods

The subject of the conducted study was Helleborus ‘Molly’s White’. Stabilized 6-week-old cultures, regenerated on the medium described in the next section, were used to set up the experiments.

2.1. Multiplication Stage

Axillary buds were cultured on agar-solidified Murashige and Skoog medium (MS) [24] (Duchefa Biochemie B.V, Haarlem, The Netherlands) supplemented with 0.2 mg/L of benzyladenine (BA) (Duchefa Biochemie B.V, Haarlem, The Netherlands) and 30 g of sucrose (Diamant, Pfeifer & Langen Polska S.A., Gostyń, Poland) as a carbon source. For the solidification of the medium agar, 8.0 g/L of Bacto™ (Becton, Dickinson and Company, Sparks, MD, USA) was used. Agar and pH were adjusted to 5.4 with either 1.0 M sodium hydroxide (NaOH) or 1.0 M hydrochloric acid (HCl) (both from Chempur®, Piekary Śląskie, Poland). Jars with medium were then autoclaved for 20 min at 121 °C and 110 kPa. Subsequently, jars were placed in the phytotron at 18 ± 1 °C, 12 h photoperiod, with light from LEDs (white, blue, red) at two different intensities (photosynthetic photon flux density—PPFD), as shown in the combinations in Table 1. The control combination was traditional fluorescent lighting (FLs). The combination was 5 jars (repeats) with 5 explants in each.

2.2. Rooting Stage

The explants regenerated in the first experiment were divided into individual plants and placed on rooting medium. Rooting proceeded on ½ MS medium with 2 mg/L of IBA (Duchefa Biochemie B.V, Haarlem, The Netherlands). Other components and parameters of the medium were the same as during multiplication. Subsequently, jars were placed in the phytotron at 20 ± 1 °C, 12 h photoperiod, with the same light source as during multiplication (plants regenerating under white LED light were rooted under white LED, etc.). The light combinations for the rooting stage were the same as during multiplication (Table 1). The combination was 5 jars (repeats) with 5 explants in each.

2.3. Evaluation of the Explants

Five weeks after the beginning of the hellebore multiplication experiment, and after three weeks of rooting, the basic parameters were evaluated. After the multiplication stage, the percentage of regeneration of explants, the number of new shoots formed from one explant, and their height (cm) were evaluated. The percentage of rooted microplants, the number of roots produced (per microplant), and the length of roots (cm) and microplants (cm) were selected for rooting evaluation. In addition, the growth of plants during the experiment (the difference in height between multiplied and rooted plants) was calculated, which allowed us to determine the dynamics of growth under the influence of a specific light combination.

2.4. Chlorophyll and Carotenoid Content Analysis

After conducting the study evaluation (after 5 weeks of multiplication and 3 weeks of rooting), samples for biochemical analysis of chemical components were collected. They were finely chopped, mixed, and 0.25 g samples were used for the measurements. Triplicate extracts were prepared for each analysis, and three measurements were made for each extract. The total chlorophyll (chlorophyll a+b) and carotenoid content was analyzed according to the spectrophotometric method of Lichtenthaler and Wellburn [25].
The dry mass used for final conversions was obtained by drying 0.25 g samples of plant material in open aluminum containers in a NUVE FN 500 dryer at 105 °C for 24 h, after which the first weighing was performed. The material was then redried twice to obtain a constant weight (i.e., as long as after each drying, the difference in weight did not exceed 0.001 g). The result of the third consecutive weighing was taken as the final one.

2.5. Energy Consumption of Selected Light Sources and Combinations

During the entire experiment (5 weeks of multiplication and 3 of rooting) energy consumption was measured for each shelf with a particular light combination, with meters installed for this purpose.

2.6. Statistical Analysis

The study of the effects of LED light on hellebore micropropagation was checked with two-way variance analysis conducted with the use of Statgraphics Centurion XVI, (version 16.2.04 64-bit) first subjecting all the analyzed results to the Shapiro–Wilk test. Then, based on the multiple comparison test (LSD test), individual homogeneous groups were identified (at significance level α = 0.05), to which the respective average values from individual combinations were assigned by Wójcik and Laudański [26].

3. Results

3.1. In Vitro Propagation and Rooting Parameters of Hellebore

As for the percentage of regeneration, the results obtained were not statistically different from each other. Regardless of the light color or its intensity, practically all hellebore explants regenerated, with 98–100% of explants initiating shoot regeneration.
However, the analysis showed a significant effect of light color on the number of regenerating shoots of hellebore ‘Molly’s White’. This parameter was not affected by light intensity. The smallest number of new shoots was obtained in cultures placed on shelves with blue LED under phytotron conditions. In fact, a practically 1:1 effect was obtained here (explant: new shoots obtained). Other light combinations more than doubled regeneration rates (Table 2, Figure 1). By far the best effect (three times more new shoots) together with the highest micropropagation rate was obtained using white LED light.
The situation was a little more interesting for the next parameter—the length of regenerated shoots. A two-factor analysis of variance showed the effect of both color and light intensity on the elongation of new shoots. Significantly higher light intensity (70) promoted obtaining longer shoots. For color, again, the weakest effects were obtained for blue LED (short, up to 1 cm shoots). Once again, the tallest plants (about 1.4 cm) were obtained with white LED on par with red. The correlation of these light colors with the highest intensity gives the best results, making the plants look better and grow even taller than 1.5 cm in height (Table 3, Figure 1).
Regardless of the color or intensity of the light, hellebore rooted at a high percentage of 93% in the F12/70, N12/40 and R12/40 combinations to 100% in the other combinations. Statistical analysis showed no significant differences.
With another rooting parameter, the number of roots formed, statistical analysis again showed no effect of any of the light factors tested (color or intensity). However, when analyzing the individual results in combinations, significant differences in the number of roots formed may be observed. The greatest number of roots—an average of more than seven—was produced by rooting explants under white LED light conditions at an intensity of 40. Combinations of FLs, blue LED, red LED light of lower intensity and white LED light of higher intensity performed the weakest. In these combinations, an average of 4.23–5.73 roots was obtained (Table 4, Figure 2).
As for length, a two-factor analysis of variance showed a significant effect of the applied light intensity on the elongational growth of the resulting roots. Significantly longer roots (about 0.5 cm) regenerated at lower light intensity. Looking in more detail at the results in combinations, the shortest roots regenerated under blue LED 70 (only 0.27 cm), while the longest were obtained under white LED at lower intensities (almost 0.6 cm) (Table 5, Figure 2).
The height of rooted hellebore microplants was dependent on light color. Statistical analysis showed no effect of light intensity on this parameter. The tallest plants were obtained when rooted under red LED and reached over 2.2 cm. The other light colors had a similar effect on the elongation growth of hellebore microplants, which grew to almost 2 cm (Table 6).
Analyzing the growth dynamics of hellebore explants at each stage (the difference between rooted and multiplied), it was observed that the highest increase in the growth height of microplants occurred under the influence of blue and red LEDs. The intensity of the light sources used had no effect on this parameter. Compared to the control FLs, blue and red LEDs enabled more than 40% plant growth during rooting (Table 7).

3.2. Chlorophyll and Carotenoid Content Analysis

For the content of assimilatory pigments, chlorophyll and carotenoids, in hellebore microcuttings during shoot proliferation as well as rooting, a significant effect of both LED light intensity and color is evident.
During proliferation, analysis of variance showed a positive effect on chlorophyll content in explants regenerated under higher light intensity. Light intensity of 70 μmol·m−2·s−1 resulted in an approximate 40% increase in the content of this pigment. In the case of light color, red LED light had the best effect on this parameter. The lowest chlorophyll content was found in shoots regenerated under conventional fluorescent light (FLs), especially at its lower intensity. This content was more than 2.5 times lower than in the red LED combination at higher intensity. In addition to red LED light, chlorophyll content was also positively influenced by white LED (Table 8).
A similar situation can be observed in the results of analysis of carotenoid content in regenerated hellebore shoots. At higher light intensities, the carotenoid content of the shoots was 50% higher compared to weaker intensities. Light color also significantly influenced the content of the analyzed pigment, as shoots regenerating under red LED light had 75.6% more of it than the control combination (FLs) and 88% more than shoots from the blue LED combination (Table 9).
The chlorophyll content of rooted shoots was mostly higher than during multiplication. However, similarly to during multiplication, the content of this pigment was higher in shoots rooted at higher light intensity. For light color, the results were quite different. The highest chlorophyll content was found in plants rooted under traditional FLs or blue LED light. Red LED influenced synthesis the least, followed by the content of this pigment (Table 10).
The higher content of carotenoids in the rooted plants was influenced by higher light intensity and the use of conventional fluorescent lamps. White and red LED light reduced the content of this pigment (Table 11).

3.3. Energy Consumption of Selected Light Sources and Combinations

Established electricity consumption meters showed definite differences between the energy consumption of fluorescent lamps and LEDs. Over the period of 8 weeks (5 weeks of multiplication and 3 weeks of rooting), normal lighting (FLs) consumed nearly 70 kWh at higher intensities, and half as much at lower intensities. Any LEDs consumed only 14.5–27.4% of what fluorescent lamps did at 70 and 40 μmol·m−2·s−1, respectively (Figure 3).

4. Discussion

Light is one of the most important external factors affecting all plant development, due to its regulatory role in photosynthetic, biochemical and molecular processes. Choosing the optimal light intensity to support plant proliferation and growth in vitro is particularly important. Explants in vitro are exposed to much lower light intensities compared to plants grown in the field. Artificial, poor and often poor-quality lighting in in vitro cultures has been recognized as a limiting factor for photosynthesis, so sucrose is added to the medium as a standard carbohydrate source. In vitro plants are also very sensitive to high light conditions and susceptible to photoinhibition [27,28,29].
In the presented study, it was shown that during micropropagation of hellebore, better rates of most of the parameters studied were obtained with more intense light. Similar results, especially when increasing the intensity to 94 μmol·m−2·s−1, were previously obtained by Lazzarini et al. [30] for Lippia gracilis, Eun-A et al. [31] at 30 μmol/m2/s for Alocasia amazonica and Chen et al. [32] for Haworthia. Light intensity and quality are the most critical environmental factors for plant physiology and biochemistry. According to available research, many basic parameters of plant production, including dry weight of roots, leaves and the whole plant, as well as the rate of photosynthesis, transpiration and stomatal conductance, were reduced under conditions of insufficient light [33,34].
In addition to increased plant height during multiplication, higher intensity (70 μmol/m2/s) light increased the content of assimilation pigments in regenerating and rooting hellebore plants. Lazzarini et al. [30] reported that an increase in carotenoid synthesis was observed in plants grown in high light intensities and was related to the photoprotection exerted by these pigments within photosystems. Carotenoids are synthesized in the plastids of all photosynthesizing organisms, hence their important function in photosynthesis [35]; however, it should not be forgotten that they play important roles in the non-enzymatic protection of plants against oxidative stress and are the basic molecules that protect against photo-oxidative damage [
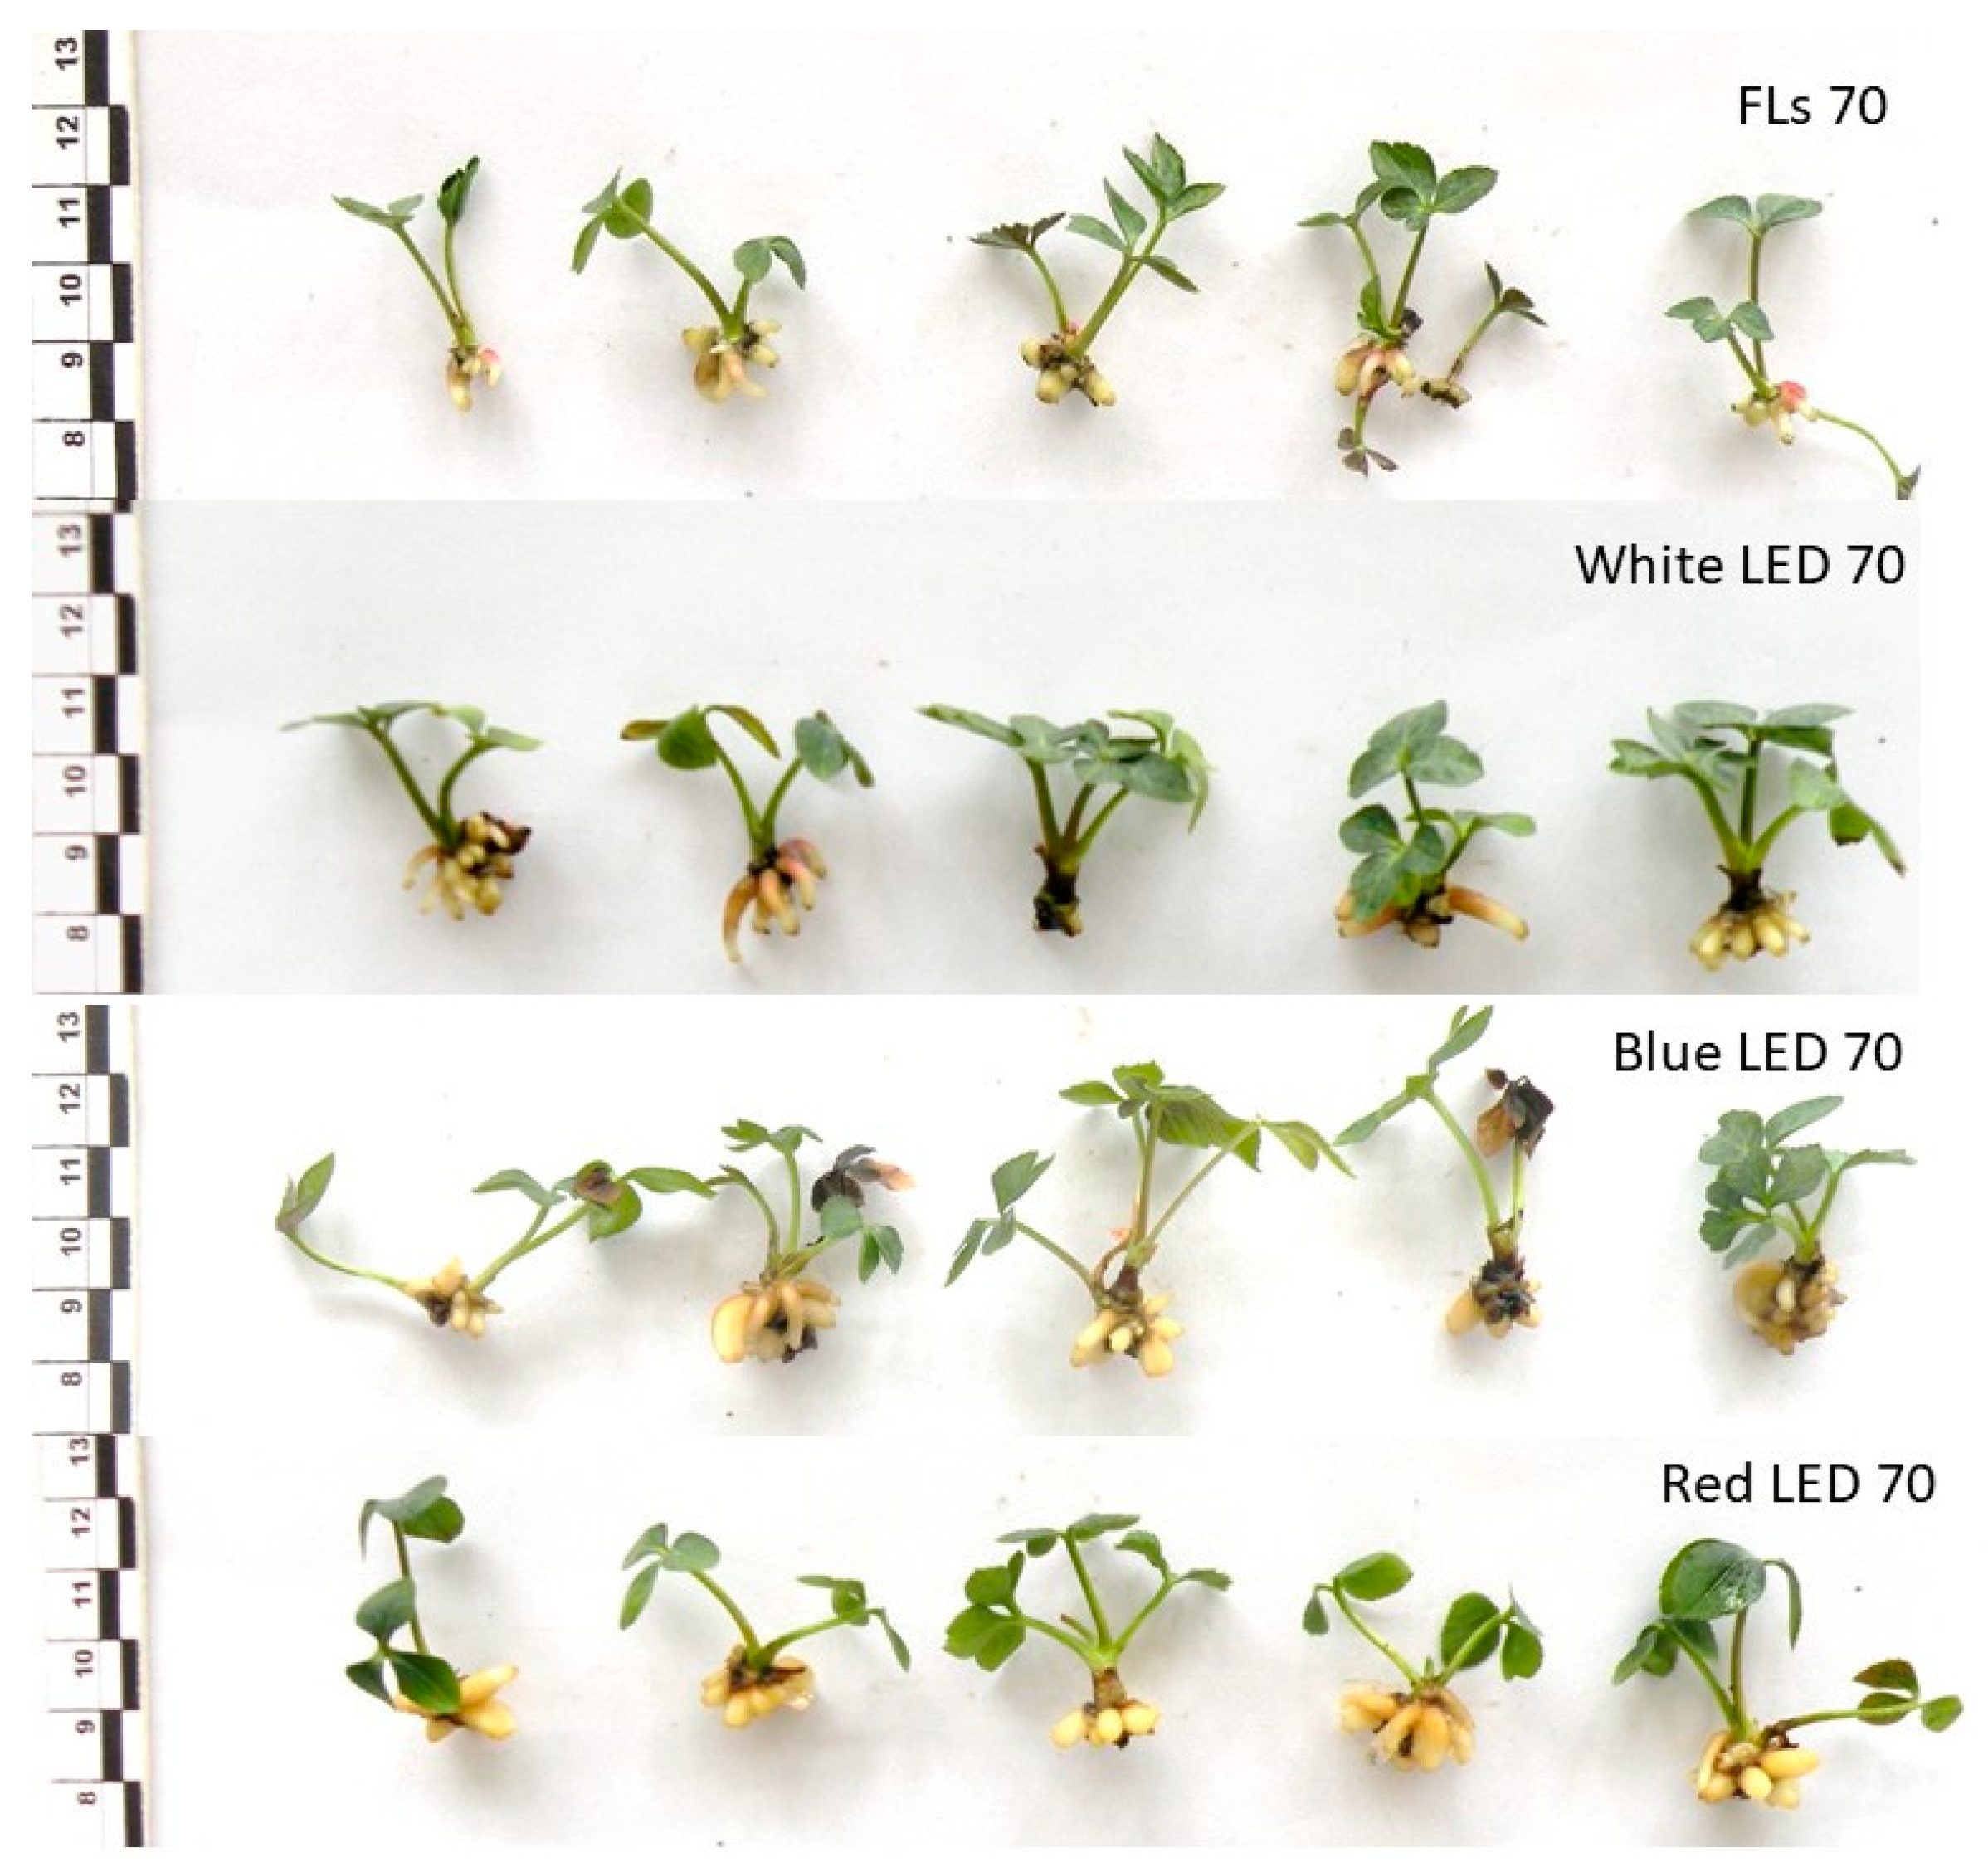
36]. In accordance with this, it is worth noting that the carotenoid content of hellebore tissues was highest during rooting under fluorescent light, which led to the weakest rooting (the fewest roots), but, above all, the least plant growth during the whole cycle. This may indicate that the plants are adversely affected by this light source, which, with higher concentrations of carotenoids, may be perceived as a stress factor. This theory seems to be correct insofar as white LED light, which allowed plants to achieve the best multiplication and produce the highest number of roots (above seven) at the rooting stage, resulted in the lowest synthesis of carotenoids compared to traditional FL light. In a study on Lippia filifolia, white LED light provided higher content of both chlorophylls and carotenoids [37]. The white LED was least effective in inducing hellebore plant growth rate compared to other light types, in spite of its positive influence in generating the highest shoot and root numbers. Often, faster elongation growth, or gain, is a plant response to a stress factor. For example, the leaf elongation rate of cereals is one of the most expressive plant responses to stress. Other plants may show increased root growth during mild drought or increased stem growth in response to low light. In such cases, the stress-induced growth is usually achieved by sacrificing the growth of other parts of that plant [
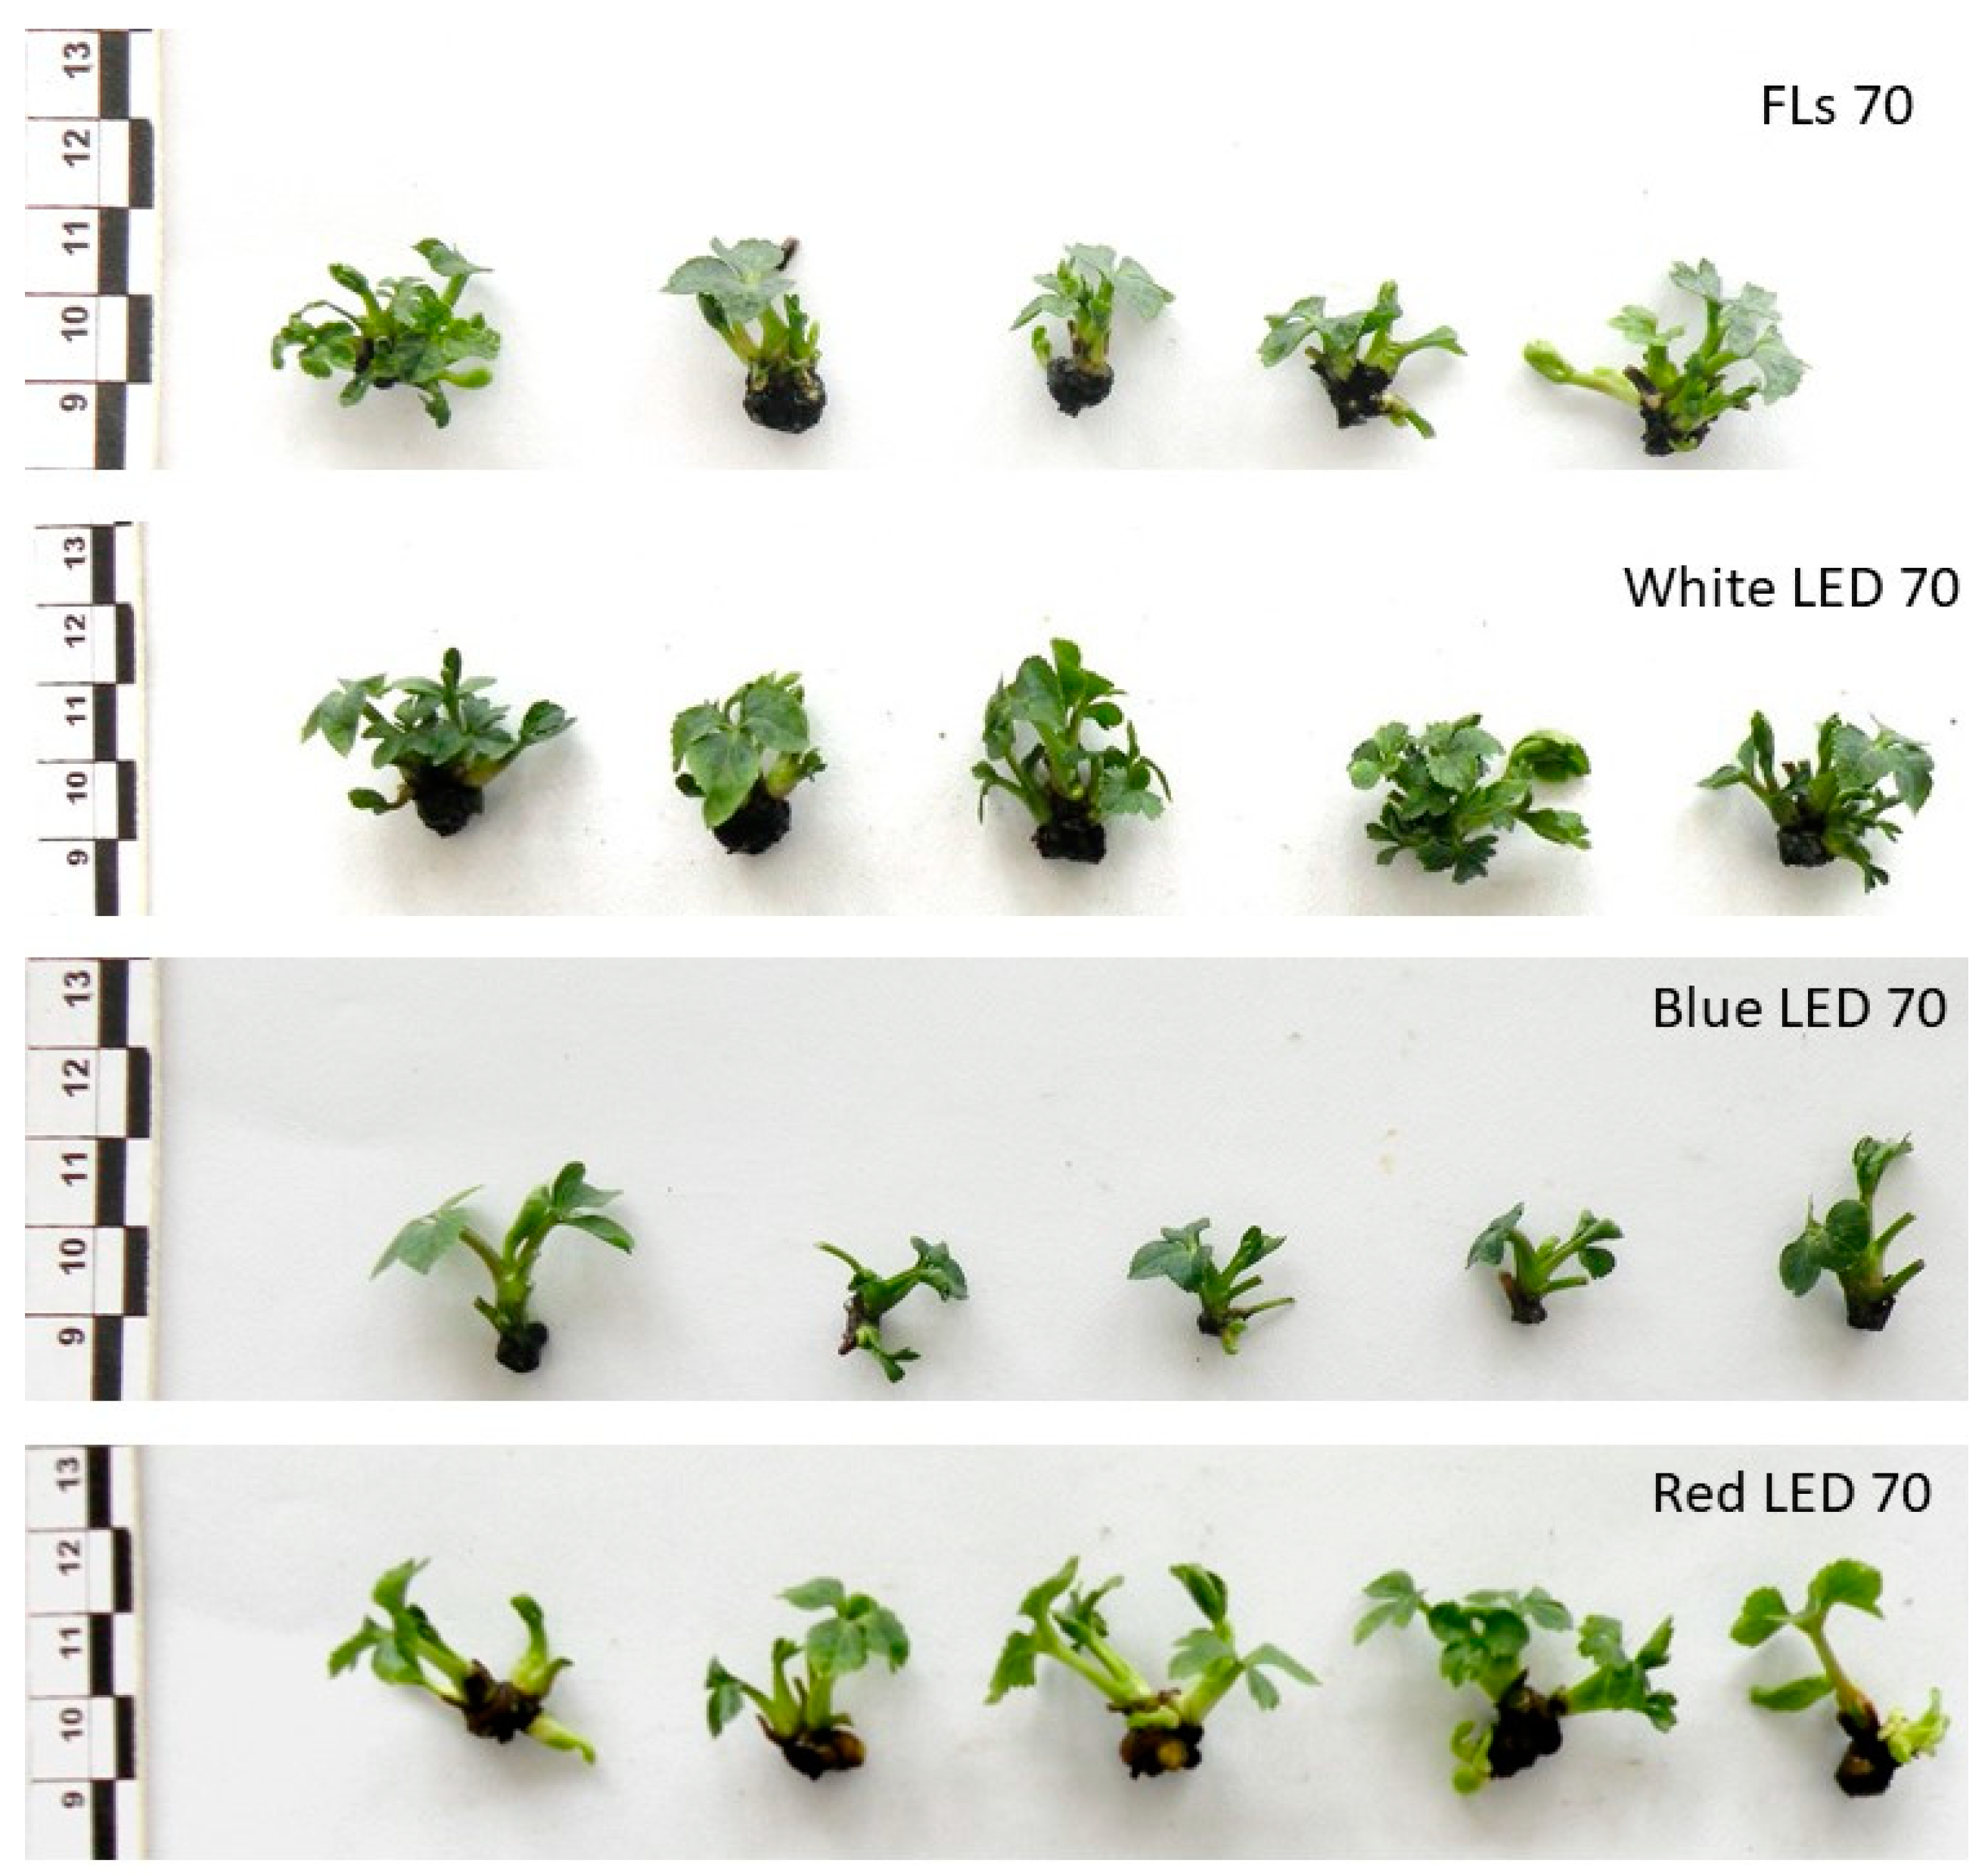
38]. Hence, there are probably more regenerated shoots and roots under white LED light, with weaker hellebore growth during micropropagation, compared to the other colors.
It is easy to see that most of the parameters studied during hellebore micropropagation are more significantly influenced by the source or color of the light used than by its intensity. The colors or LED combinations commonly used in in vitro cultures are white, red, blue and a mixture of blue and red [17], hence the choice of these three basic LED colors in this research. Many studies find that blue LEDs are a good light source for inducing chlorophyll synthesis, while red LEDs reduce chlorophyll content. This is confirmed, for example, by Jao et al. [21], who found that blue LEDs promote growth and increase chlorophyll content in Zantedeschia jucunda, or by Verma et al. [39] on Digitalis purpurea, where chlorophyll a content was higher under blue light. In the present study, in hellebore, the effect of light color on chlorophyll content was significant, but it should be noted that there were definite differences depending on the stage of micropropagation. During multiplication, the highest content of pigments (both chlorophyll and carotenoids) was characterized by plants regenerating under red LED light, while during rooting, such an effect was achieved by traditional FL light or blue LED as indicated by other publications. This may be related to the condition of the plants, which have a different need for particular light spectrums during the intensive shoot proliferation phase than during rooting or as complete plants. Zheng et al. [20] indicated that both red and blue light significantly increased the chlorophyll a/b ratio. However, more detailed studies using electron microscopy showed that blue light caused severe damage to the fine structure of chloroplasts in the early stages of leaf aging, while the degradation of chloroplast ultrastructure was apparently delayed in red light throughout the experiment compared to other treatments. LED red light perhaps sufficiently protects aging leaves from photoinhibition so that leaf aging can be effectively delayed. Perhaps during the intensive multiplication of hellebore, a higher content of pigments, including chlorophyll, was observed under red light. The positive effect of red light on chlorophyll b content compared to blue LED (more than three times greater) was noted in Digitalis [39], and twice as much chlorophyll a+b content was observed in the micropropagation of Vanilla planifolia [40]. Red LED light also influenced the elongation growth of micropropagated hellebores, both during propagation and rooting. Similarly, Lippia filifolia plants reached greater height under red and white LED light conditions and achieved higher biomass accumulation [37]. Neither the color of the light nor its intensity affected the percentage of rooting or the number of roots, which is an adaptive mechanism of the underground parts of the plant. This indicates that light has no effect on hellebore rhizogenesis, although the more intense elongation growth of roots at lower intensities suggests that they receive light stimuli and stronger light weakens their elongation.
White LED light is the most favorable in terms of obtaining hellebore ‘Molly’s White’ in in vitro culture, giving the highest multiplication rate of longer shoots and, at a lower concentration, affecting the regeneration of the largest number of roots. Thus, it is the best alternative to traditional fluorescent lights, which showed a much weaker effect on hellebore micropropagation. Similarly, the growth of shoots and leaves of Pyrus communis was more affected by LED lamps compared to fluorescent lamps (control) [23]. This is probably due to the fact that fluorescent lamps produce a wide range of wavelengths (350–750 nm) that are unnecessary for plant development [17]. Light-emitting diodes (LEDs) have recently emerged as an alternative to commercial micropropagation because they have a monochromatic spectrum, less thermal radiation and, most importantly for in vitro cultures, they provide light in the spectral region that is involved in photosynthesis and photomorphogenic reactions in plants [17]. In addition to increasing the efficiency of in vitro hellebore multiplication, LED lighting is more environmentally friendly and allows significant electricity savings, as the electricity requirements of LED lamps are 10–100 times lower than conventional light sources [41]. Despite the high setup costs, with daily, long-term use of this lighting, these costs are recouped [16,41,
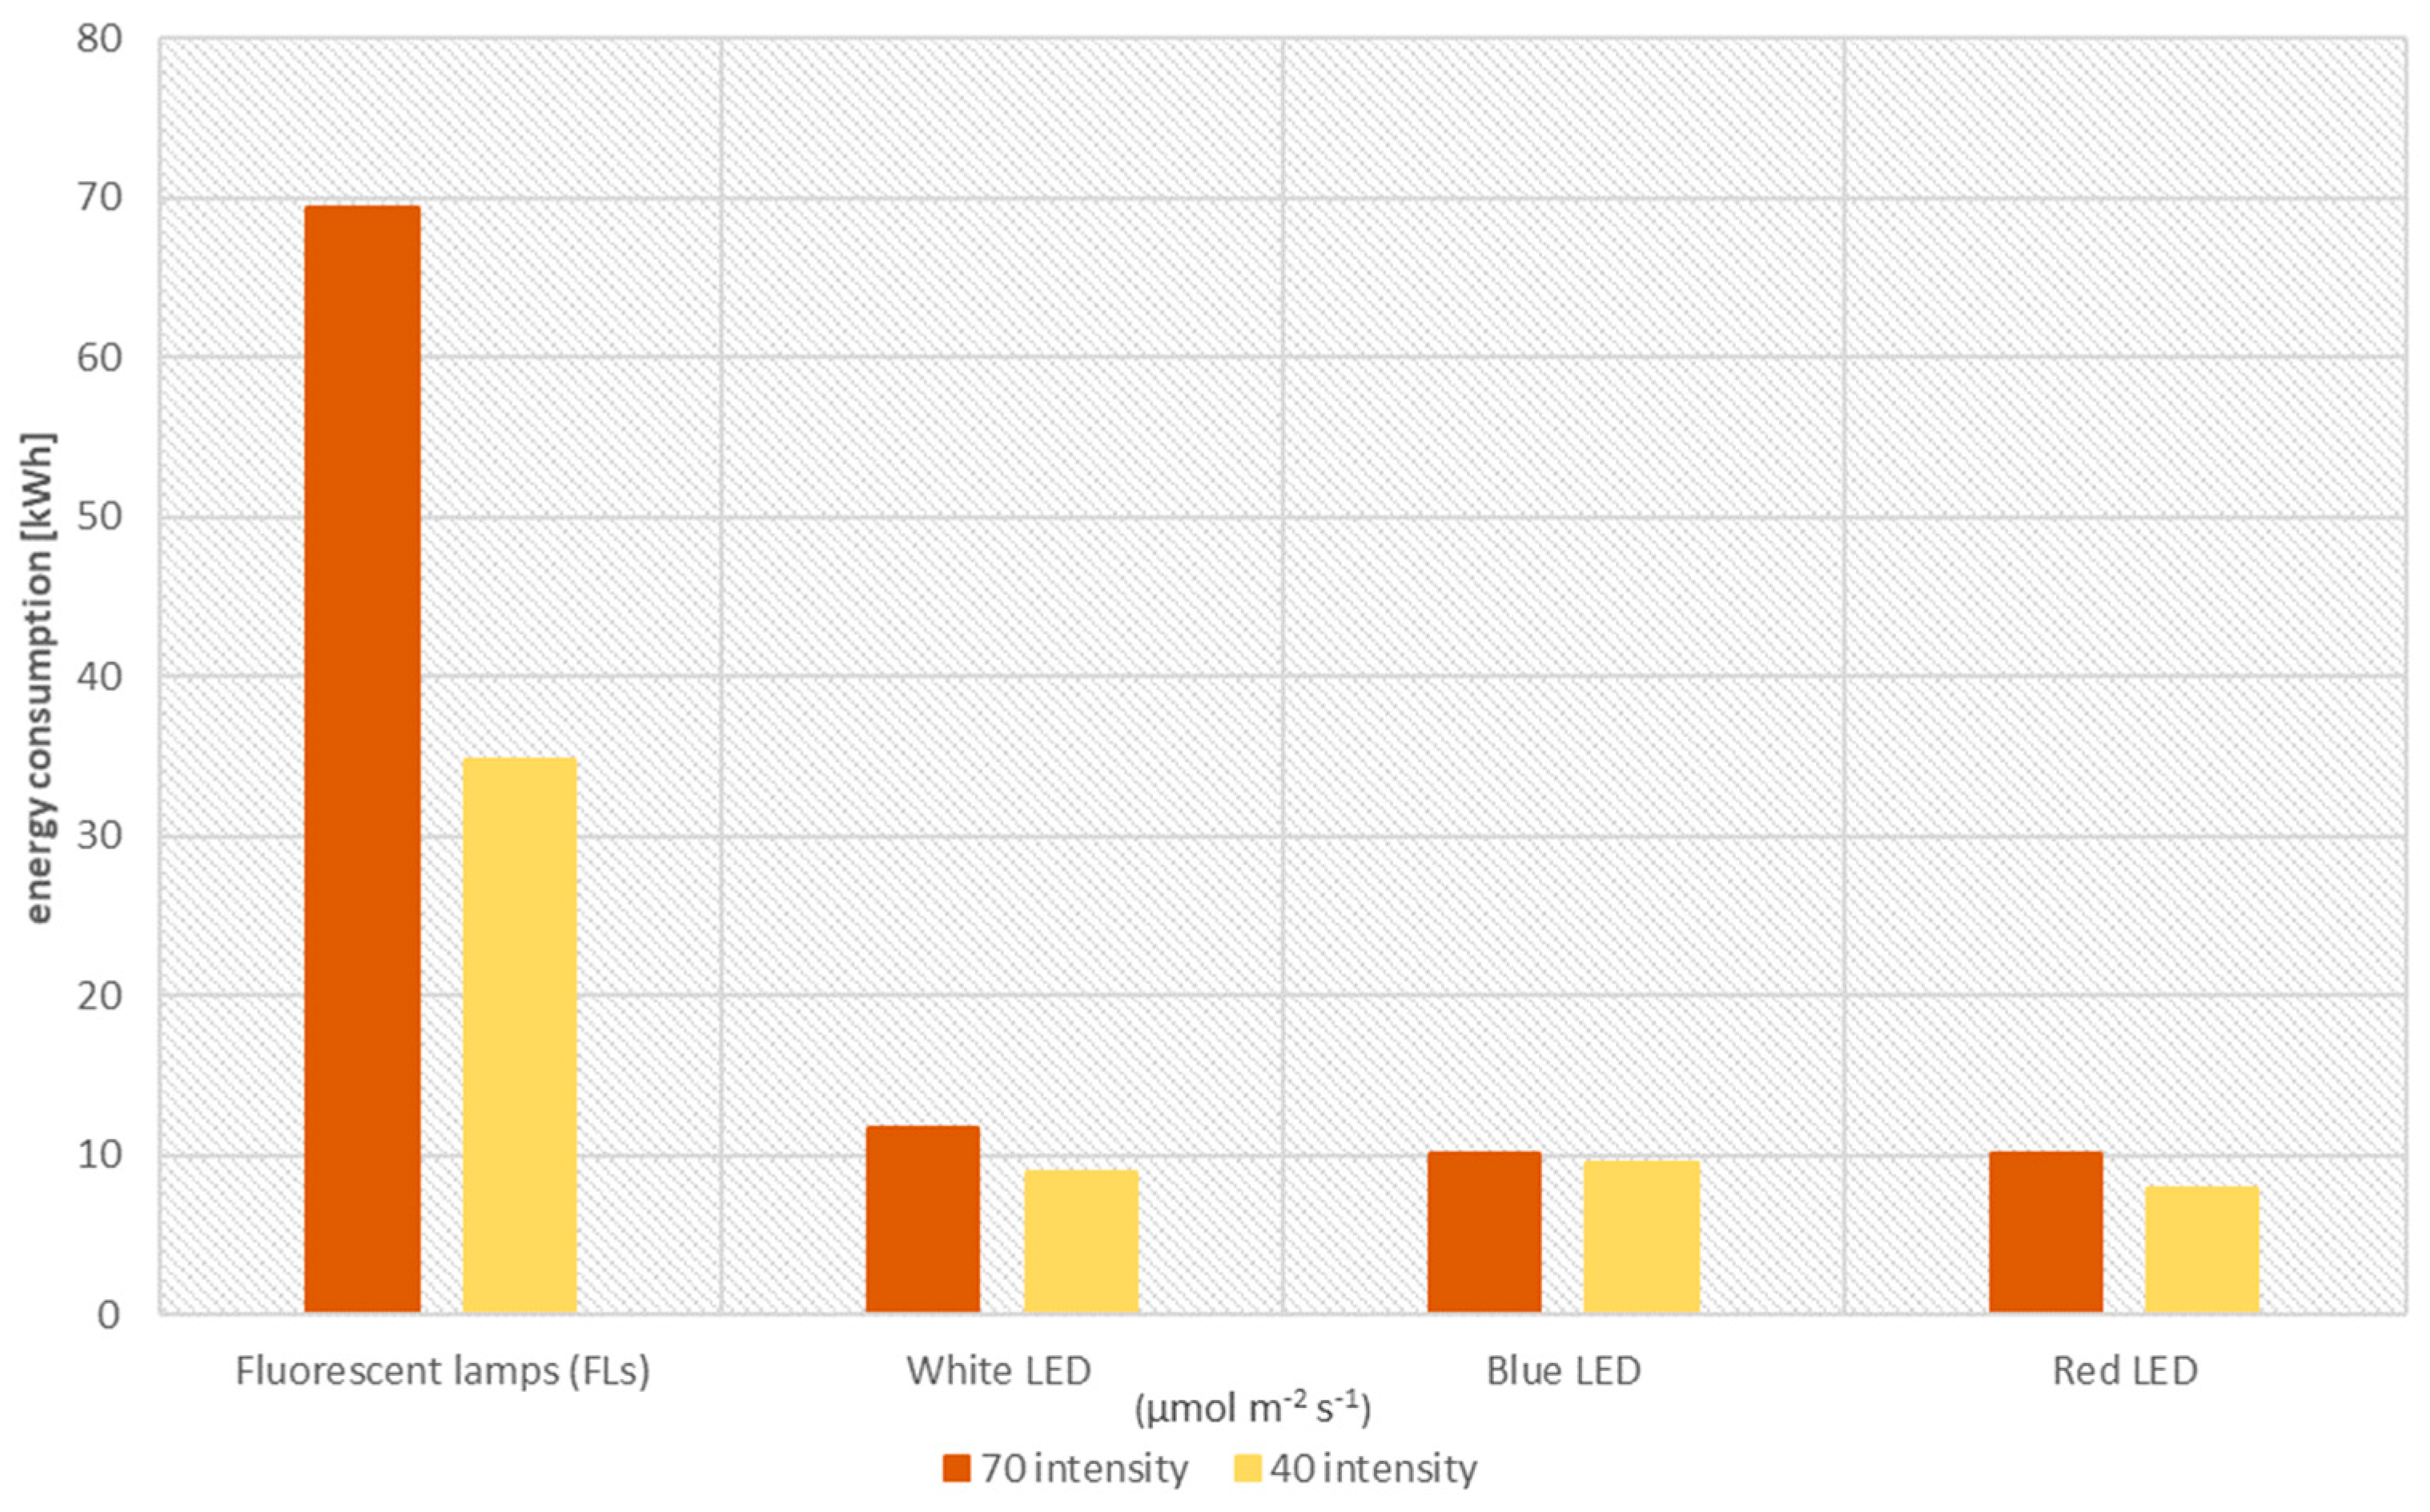
42]. As shown in our study, the differences between the higher and lower intensities of the LEDs used are not large. However, a huge difference is found when comparing any combination of LED light color with fluorescent lamps. LEDs used in our experiments consumed only 14.5–27.4% of what fluorescent lamps do in an 8-week hellebore production cycle (5 weeks of multiplication and 3 weeks of rooting). Even the highest intensity of 70 μmol·m−2·s−1 saved more than 57 kWh.
Due to the different responses of plants to the various light parameters and the significant impact of LED light on crop production, further research into its use is recommended. It is also extremely important from the point of view of environmental policies and the use of the latest developments in sustainable economic development.

5. Conclusions

The aim of the presented research was to compare the effects of traditional fluorescent lamps to LED lighting on the micropropagation of a valuable plant such as hellebore. In addition, the actual energy consumption of the different light combinations used during the whole in vitro production cycle of this plant was analyzed. Our studies showed that most of the parameters studied are more influenced by the source or color of the light used during micropropagation than its intensity. However, the higher intensity (70 μmol/m2/s) has a significant effect on increasing the content of assimilation pigments in regenerating and rooting plants. We have shown that red LED light impacts the elongation growth of micropropagated hellebores, but we generally recommend the use of white LED light in laboratories. It is most favorable in terms of obtaining hellebore ‘Molly’s White’ in in vitro cultures, giving the highest rate of propagation of longer shoots and also, at a lower intensity, influencing the regeneration of the largest number of roots. An economically significant result is the demonstration that LED lighting at 70 μmol·m−2·s−1, regardless of color, requires seven times less energy during hellebore micropropagation than fluorescent lamps (FLs).
In vitro cultures are producing more and more plants every year, as the obtained material is of high quality and disease-free. Therefore, it is a good planting material for establishing crops and plantations. Due to new agro-environmental policies, the results presented are extremely important for plant production. Regardless of the plants produced in in vitro culture (whether ornamental species, crops or vegetables), the goal is to reduce the cost of this production, especially its significant component in the form of electricity, while maintaining high-quality material. Importantly, the results of our research show that LED lighting is not only beneficial to the environment, as it is several times more energy-efficient, but also allows a high micropropagation coefficient to be obtained while maintaining the analyzed parameters at a good level. The obtained results allow us to conclude that LEDs are the future of plant production, both those in in vitro culture and in other types of production under cover where plant lighting is required.

Author Contributions

Conceptualization, K.K. and J.G.-W.; formal analysis, K.N. and A.P.; methodology, K.N., K.K. and A.P.; project administration, J.G.-W.; supervision, K.K., A.P. and J.G.-W.; visualization, K.N. and A.P.; writing—original draft, K.N.; writing—review and editing, K.N., K.K. and J.G.-W. All authors have read and agreed to the published version of the manuscript.

Funding

This research was funded by the National Centre for Research and Development (NCBR) under the “Ścieżka dla Mazowsza” program, no. MAZOWSZE/0030/19.

Institutional Review Board Statement

Not applicable.

Data Availability Statement

No new data were created or analyzed in this study. Data sharing is not applicable to this article.

Conflicts of Interest

The authors declare no conflict of interest. The funders had no role in the design of the study; in the collection, analyses or interpretation of data; in the writing of the manuscript; or in the decision to publish the results.

References

  1. Piękoś-Mirkowa, H.; Mirek, Z. Rośliny Chronione. In Flora Polski [Polish Flora. Protected Plants]; Multico: Warszawa, Poland, 2006; ISBN 978-83-7763-453-0. [Google Scholar]
  2. Brajanovska, A.; Bauer, B. Helleborus sp. an ethnopharmacological and toxicological review. Maced. Pharm. Bull. 2018, 64, 3–9. [Google Scholar] [CrossRef]
  3. Nowakowska, K.; Bodych, A.; Latkowska, M.; Pacholczak, A. The use of tissue cultures in the mass production of Heuchera ‘Silver Scrolls’. Ann. Wars. Univ. Life Sci. SGGW Hortic. Landsc. Arch. 2020, 16, 5–16. [Google Scholar] [CrossRef]
  4. Rout, G.R.; Mohapatra, A.; Jain, S.M. Tissue culture of ornamental pot plant: A critical review on present scenario and future prospects. Biotechnol. Adv. 2006, 24, 531–560. [Google Scholar] [CrossRef] [PubMed]
  5. Nowakowska, K.; Marciniak, P.; Pacholczak, A. A protocol for efficient micropropagation of rare orchid Vanda brunnea Rchb.f. South Afr. J. Bot. 2022, 150, 233–239. [Google Scholar] [CrossRef]
  6. Pacholczak, A.; Nowakowska, K. Micropropagation of february daphne (Daphne mezereum L.). Propag. Ornam. Plants 2019, 19, 106–112. [Google Scholar]
  7. Pence, V.C. Evaluating costs for the in vitro propagation and preservation of endangered plants. Vitr. Cell. Dev. Biol. Plant 2011, 47, 176–187. [Google Scholar] [CrossRef]
  8. Iliev, I.; Gajdoov, A.; Libiakov, G.; Jain, S.M. Plant Micropropagation. In Plant Cell Culture; Davey, M., Anthony, P., Eds.; John Wiley & Sons, Ltd: Chichester, UK, 2010; pp. 1–23. [Google Scholar]
  9. Farhadi, N.; Panahandeh, J.; Azar, A.M.; Salte, S.A. Effects of explant type, growth regulators and light intensity on callus induction and plant regeneration in four ecotypes of Persian shallot (Allium hirtifolium). Sci. Hortic. 2017, 218, 80–86. [Google Scholar] [CrossRef]
  10. Adams, S.R.; Langton, F.A. Photoperiod and plant growth: A review. J. Hortic. Sci. Biotechnol. 2005, 80, 2–10. [Google Scholar] [CrossRef]
  11. Paradiso, R.; Proietti, S. Light-Quality Manipulation to Control Plant Growth and Photomorphogenesis in Greenhouse Horticulture: The State of the Art and the Opportunities of Modern LED Systems. J. Plant Growth Regul. 2022, 41, 742–780. [Google Scholar] [CrossRef]
  12. Dierck, R.; Dhooghe, E.; Van Huylenbroeck, J.; Van Der Straeten, D.; De Keyser, E. Light quality regulates plant architecture in different genotypes of Chrysanthemum morifolium Ramat. Sci. Hortic. 2017, 218, 177–186. [Google Scholar] [CrossRef]
  13. Lichtenthaler, H.K.; Buschmann, C.; Döll, M.; Fietz, H.J.; Bach, T.; Kozel, U.; Meier, D.; Rahmsdorf, U. Photosynthetic activity, chloroplast ultrastructure, and leaf characteristics of high-light and low-light plants and of sun and shade leaves. Photosynth. Res. 1981, 2, 115–141. [Google Scholar] [CrossRef] [PubMed]
  14. Hanba, Y.T.; Kogami, H.; Terashima, I. The effect of growth irradiance on leaf anatomy and photosynthesis in Acer species differing in light demand. Plant Cell Environ. 2002, 25, 1021–1030. [Google Scholar] [CrossRef]
  15. Gupta, S.D. Light Emitting Diodes for Agriculture; Gupta, S.D., Ed.; Springer: Singapore, 2017; ISBN 978-981-10-5806-6. [Google Scholar]
  16. Morrow, R.C. LED lighting in horticulture. Hortscience 2008, 43, 1947–1950. [Google Scholar] [CrossRef] [Green Version]
  17. Bello-Bello, J.J.; Pérez-Sato, J.A.; Cruz-Cruz, C.A.; Martínez-Estrada, E. Light-Emitting Diodes: Progress in Plant Micropropagation. In Chlorophyll; Jacob-Lopes, E., Zepka, L.Q., Queiroz, M.I., Eds.; InTech: London, UK, 2017; pp. 93–104. [Google Scholar]
  18. Schuerger, A.C.; Brown, C.S.; Stryjewski, A. Anatomical Features of Pepper Plants (Capsicum annuum L.) Grown under Red Light-emitting Diodes Supplemented with Blue or Far-red Light. Ann. Bot. 1997, 79, 273–282. [Google Scholar] [CrossRef] [PubMed]
  19. Tennessen, D.J.; Singsaas, E.L.; Sharkey, T.D.; Drive, L.; Drive, J. Light-emitting diodes as a light source for photosynthesis research. Photosynth. Res. 1994, 39, 85–92. [Google Scholar] [CrossRef]
  20. Zheng, L.; Van Labeke, M.-C. Long-Term Effects of Red- and Blue-Light Emitting Diodes on Leaf Anatomy and Photosynthetic Efficiency of Three Ornamental Pot Plants. Front. Plant Sci. 2017, 8, 917. [Google Scholar] [CrossRef] [PubMed] [Green Version]
  21. Jao, R.-C.; Lai, C.-C.; Fang, W.; Chang, S.-F. Effects of Red light on the Growth of Zantedeschia Plantlets in vitro and Tuber Formation Using Light-emitting Diodes. Hortscience 2005, 40, 436–438. [Google Scholar] [CrossRef] [Green Version]
  22. Schroeter-Zakrzewska, A.; Pradita, F.A. Effect of Colour of Light on Rooting Cuttings and Subsequent Growth of Chrysanthemum (Chrysanthemum × grandiflorum Ramat./Kitam.). Agriculture 2021, 11, 671. [Google Scholar] [CrossRef]
  23. Lupo, M.; Bashir, M.A.; Silvestri, C.; Brunori, E.; Pica, A.L.; Cristofori, V. LED Lighting Effects on Plant Growth and Quality of Pyrus communis L. Propagated In Vitro. Agronomy 2022, 12, 2531. [Google Scholar] [CrossRef]
  24. Murashige, T.; Skoog, F. A revised medium for rapid growth and bio assays with tobacco tissue cultures. Physiol. Plant. 1962, 15, 473–497. [Google Scholar] [CrossRef]
  25. Lichtenthaler, H.K.; Wellburn, A.R. Determinations of total carotenoids and chlorophylls a and b of leaf extracts in different solvents. Biochem. Soc. Trans. 1983, 11, 591–592. [Google Scholar] [CrossRef] [Green Version]
  26. Wójcik, A.R.; Laudański, Z. Planowanie i Wnioskowanie Statystyczne w Doświadczalnictwie [Statistical Planning and Concluding in Experimental Works]; Państwowe Wydawnictwo Naukowe: Warszawa, Poland, 1989; ISBN 83-01-08994. [Google Scholar]
  27. Cavallaro, V.; Pellegrino, A.; Muleo, R.; Forgione, I. Light and Plant Growth Regulators on In Vitro Proliferation. Plants 2022, 11, 844. [Google Scholar] [CrossRef] [PubMed]
  28. Gago, J.; Martínez-Núñez, L.; Landín, M.; Flexas, J.; Gallego, P.P. Modeling the Effects of Light and Sucrose on In Vitro Propagated Plants: A Multiscale System Analysis Using Artificial Intelligence Technology. PLoS ONE 2014, 9, e85989. [Google Scholar] [CrossRef]
  29. Batista, D.S.; Felipe, S.H.S.; Silva, T.D.; de Castro, K.M.; Mamedes-Rodrigues, T.C.; Miranda, N.A.; Ríos-Ríos, A.M.; Faria, D.V.; Fortini, E.A.; Chagas, K.; et al. Light quality in plant tissue culture: Does it matter? Vitr. Cell. Dev. Biol. Plant 2018, 54, 195–215. [Google Scholar] [CrossRef]
  30. Lazzarini, L.E.S.; Bertolucci, S.K.V.; Pacheco, F.V.; dos Santos, J.; Silva, S.T.; de Carvalho, A.A.; Pinto, J.E.B.P. Quality and intensity of light affect Lippia gracilis Schauer plant growth and volatile compounds in vitro. Plant Cell Tissue Organ Cult. 2018, 135, 367–379. [Google Scholar] [CrossRef]
  31. Jo, E.-A.; Tewari, R.K.; Hahn, E.-J.; Paek, K.-Y. Effect of photoperiod and light intensity on in vitro propagation of Alocasia amazonica. Plant Biotechnol. Rep. 2008, 2, 207–212. [Google Scholar] [CrossRef]
  32. Chen, Y.-M.; Huang, J.-Z.; Hou, T.-W.; Pan, I.-C. Effects of light intensity and plant growth regulators on callus proliferation and shoot regeneration in the ornamental succulent Haworthia. Bot. Stud. 2019, 60, 10. [Google Scholar] [CrossRef] [PubMed] [Green Version]
  33. Yang, F.; Feng, L.; Liu, Q.; Wu, X.; Fan, Y.; Raza, M.A.; Cheng, Y.; Chen, J.; Wang, X.; Yong, T.; et al. Effect of interactions between light intensity and red-to- far-red ratio on the photosynthesis of soybean leaves under shade condition. Environ. Exp. Bot. 2018, 150, 79–87. [Google Scholar] [CrossRef]
  34. Feng, L.; Raza, M.A.; Li, Z.; Chen, Y.; Bin Khalid, M.H.; Du, J.; Liu, W.; Wu, X.; Song, C.; Yu, L.; et al. The Influence of Light Intensity and Leaf Movement on Photosynthesis Characteristics and Carbon Balance of Soybean. Front. Plant Sci. 2019, 9, 1–16. [Google Scholar] [CrossRef] [PubMed]
  35. Cuttriss, A.J.; Cazzonelli, C.I.; Wurtzel, E.T.; Pogson, B.J. Carotenoids. In Advances in Botanical Research; Elsevier Ltd.: Amsterdam, The Netherlands, 2011; Volume 58, pp. 1–36. ISBN 9780123864796. [Google Scholar]
  36. Rosas-Saavedra, C.; Stange, C. Biosynthesis of carotenoids in plants: Enzymes and color. In Carotenoids in Nature; Subcellular Biochemistry; Springer: Cham, Switzerland, 2016; Volume 79, pp. 35–69. [Google Scholar] [CrossRef]
  37. Chaves, M.C.; Freitas, J.C.E.; Nery, F.C.; Paiva, R.; Prudente, D.d.O.; Costa, B.G.P.; Daubermann, A.G.; Bernardes, M.M.; Grazul, R.M. Influence of colorful light-emitting diodes on growth, biochemistry, and production of volatile organic compounds in vitro of Lippia filifolia (Verbenaceae). J. Photochem. Photobiol. B Biol. 2020, 212, 112040. [Google Scholar] [CrossRef]
  38. Zhang, H.; Zhao, Y.; Zhu, J.-K. Thriving under Stress: How Plants Balance Growth and the Stress Response. Dev. Cell 2020, 55, 529–543. [Google Scholar] [CrossRef] [PubMed]
  39. Verma, S.K.; Gantait, S.; Jeong, B.R.; Hwang, S.J. Enhanced growth and cardenolides production in Digitalis purpurea under the influence of different LED exposures in the plant factory. Sci. Rep. 2018, 8, 18009. [Google Scholar] [CrossRef] [PubMed] [Green Version]
  40. Ramírez-Mosqueda, M.A.; Iglesias-Andreu, L.G.; Luna-Sánchez, I.J. Light quality affects growth and development of in vitro plantlet of Vanilla planifolia Jacks. S. Afr. J. Bot. 2017, 109, 288–293. [Google Scholar] [CrossRef]
  41. Bugbee, B. Economics of LED lighting. In Light Emitting Diodes for Agriculture; Springer: Singapore, 2017; pp. 81–99. [Google Scholar] [CrossRef]
  42. Gupta, S.D.; Agarwal, A. Influence of LED lighting on in vitro plant regeneration and associated cellular redox balance. In Light Emitting Diodes for Agriculture; Springer: Singapore, 2017; pp. 273–303. [Google Scholar] [CrossRef]
Figure 1. Effect of LED light at an intensity of 70 μmol·m−2·s−1 on the proliferation of hellebore ‘Molly’s White’ shoots.
Agriculture 13 01265 g001
Figure 2. Effect of LED light at an intensity of 70 μmol·m−2·s−1 on the rooting of hellebore ‘Molly’s White’.
Agriculture 13 01265 g002
Figure 3. Comparison of energy consumption (kWh) of light combination during 8 weeks of hellebore micropropagation.
Agriculture 13 01265 g003
Table 1. Combinations of light used in the experiment during the multiplication and rooting of hellebore.
Number of CombinationSource and Color of LightLight Intensity PPFD (μmol·m−2·s−1)Photoperiod (h)
1Fluorescent lamp (FLs)—control4012
270
3White LED40
470
5Blue LED40
670
7Red LED40
870
Table 2. The effect of LED light color and intensity (μmol·m−2·s−1) on the number of in vitro regenerating hellebore shoots.
Type and ColorFLsWhite LEDBlue LEDRed LEDMeans (Intensity)
Light Intensity
402.53 ± 0.5 cd*2.93 ± 0.9 d1.00 ± 0.0 a1.87 ± 0.6 bc2.08 ± 0.1 a
702.07 ± 0.2 bc3.23 ± 0.3 d1.47 ± 0.3 ab2.50 ± 0.5 cd2.32 ± 0.1 a
Means (color)2.30 ± 0.2 bc3.08 ± 0.2 c1.23 ± 0.2 a2.18 ± 0.2 b
* There is no significant difference (at α = 0.05) among the means in the column and row marked with the same letter and the means for the growth parameter marked with the same letter.
Table 3. The effect of LED light color and intensity (μmol m−2 s−1) on the length (cm) of in vitro regenerating hellebore shoots.
Type and ColorFLsWhite LEDBlue LEDRed LEDMeans (Intensity)
Light Intensity
401.26 ± 0.1 c*1.37 ± 0.1 cd0.80 ± 0.1 a1.23 ± 0.1 c1.16 ± 0.0 a
701.20 ± 0.1 c1.50 ± 0.2 d1.00 ± 0.0 b1.53 ± 0.2 d1.31 ± 0.0 b
Means (color)1.23 ± 0.1 b1.43 ± 0.1 c0.9 ± 0.1 a1.38 ± 0.1 c
* There is no significant difference (at α = 0.05) among the means in the column and row marked with the same letter and the means for the growth parameter marked with the same letter.
Table 4. The effect of LED light color and intensity (μmol·m−2·s−1) on the number of hellebore roots.
Type and ColorFLsWhite LEDBlue LEDRed LEDMeans (Intensity)
Light Intensity
405.73 ± 0.5 ab*7.27 ± 0.7 c4.33 ± 0.8 a5.20 ± 1.3 a5.63 ± 0.3 a
704.23 ± 0.9 a4.73 ± 0.8 a5.00 ± 1.0 a6.87 ± 0.6 bc5.63 ± 0.3 a
Means (color)4.98 ± 0.4 a6.00 ± 0.4 a4.67 ± 0.4 a6.03 ± 0.4 a
* There is no significant difference (at α = 0.05) among the means in the column and row marked with the same letter and the means for the growth parameter marked with the same letter.
Table 5. The effect of LED light color and intensity (μmol·m−2·s−1) on root length (cm) of hellebore rooted in vitro.
Type and ColorFLsWhite LEDBlue LEDRed LEDMeans (Intensity)
Light Intensity
400.50 ± 0.1 bc*0.57 ± 0.3 c0.46 ± 0.1 abc0.43 ± 0.1 abc0.49 ± 0.0 b
700.33 ± 0.1 ab0.40 ± 0.1 abc0.27 ± 0.1 a0.37 ± 0.1 abc0.34 ± 0.0 a
Means (color)0.42 ± 0.1 a0.48 ± 0.1 a0.37 ± 0.1 a0.40 ± 0.1 a
* There is no significant difference (at α = 0.05) among the means in the column and row marked with the same letter and the means for the growth parameter marked with the same letter.
Table 6. The effect of LED light color and intensity (μmol·m−2·s−1) on the height (cm) of hellebore rooted in vitro.
Type and ColorFLsWhite LEDBlue LEDRed LEDMeans (Intensity)
Light Intensity
401.73 ± 0.1 ab*1.87 ± 0.2 abc1.53 ± 0.3 a2.17 ± 0.1 cd1.85 ± 0.1 a
701.73 ± 0.2 ab1.97 ± 0.2 bcd1.97 ± 0.1 bcd2.27 ± 0.2 d1.96 ± 0.1 a
Means (color)1.73 ± 0.1 a1.92 ± 0.1 ab1.75 ± 0.1 a2.22 ± 0.1 b
* There is no significant difference (at α = 0.05) among the means in the column and row marked with the same letter and the means for the growth parameter marked with the same letter.
Table 7. The effect of LED light color and intensity (μmol·m−2·s−1) on hellebore height increase during micropropagation.
Type and ColorFLsWhite LEDBlue LEDRed LEDMeans (Intensity)
Light Intensity
400.47 ± 0.3 a*0.50 ± 0.2 a0.73 ± 0.3 ab1.03 ± 0.2 b0.68 ± 0.1 a
700.53 ± 0.4 a0.47 ± 0.3 a0.97 ± 0.1 b0.63 ± 0.3 ab0.65 ± 0.1 a
Means (color)0.50 ± 0.1 a0.48 ± 0.1 a0.85 ± 0.1 b0.83 ± 0.1 b
* There is no significant difference (at α = 0.05) among the means in the column and row marked with the same letter and the means for the growth parameter marked with the same letter.
Table 8. The effect of LED light color and intensity (μmol·m−2·s−1) on the content of chlorophyll a+b (mg·g−1 DW) in regenerated hellebore microcuttings.
Type and ColorFLsWhite LEDBlue LEDRed LEDMeans (Intensity)
Light Intensity
400.47 ± 0.0 a*0.73 ± 0.0 b0.39 ± 0.0 a0.73 ± 0.1 b0.58 ± 0.1 a
700.81 ± 0.1 bc0.91 ± 0.0 c0.81 ± 0.0 bc1.20 ± 0.3 c0.93 ± 0.1 b
Means (color)0.64 ± 0.1 a0.82 ± 0.1 b0.60 ± 0.1 a0.96 ± 0.1 c
* There is no significant difference (at α = 0.05) among the means in the column and row marked with the same letter and the means for the growth parameter marked with the same letter.
Table 9. The effect of LED light color and intensity (μmol·m−2·s−1) on the content of carotenoids (mg·g−1 DW) in regenerated hellebore microcuttings.
Type and ColorFLsWhite LEDBlue LEDRed LEDMeans (Intensity)
Light Intensity
400.33 ± 0.0 a*0.46 ± 0.0 b0.29 ± 0.0 a0.68 ± 0.0 e0.44 ± 0.0 a
700.57 ± 0.0 cd0.61 ± 0.0 d0.55 ± 0.0 c0.90 ± 0.0 f0.66 ± 0.0 b
Means (color)0.45 ± 0.0 a0.53 ± 0.0 b0.42 ± 0.0 a0.79 ± 0.0 c
* There is no significant difference (at α = 0.05) among the means in the column and row marked with the same letter and the means for the growth parameter marked with the same letter.
Table 10. The effect of LED light color and intensity (μmol·m−2·s−1) on the content of chlorophyll a+b (mg·g−1 DW) in rooted hellebore microcuttings.
Type and ColorFLsWhite LEDBlue LEDRed LEDMeans (Intensity)
Light Intensity
400.92 ± 0.1 bc*0.91 ± 0.1 bc0.98 ± 0.1 c0.71 ± 0.0 a0.89 ± 0.1 a
701.16 ± 0.1 d0.86 ± 0.1 b1.15 ± 0.1 d0.67 ± 0.1 a0.96 ± 0.1 b
Means (color)1.04 ± 0.1 c0.89 ± 0.1 b1.07 ± 0.1 c0.70 ± 0.1 a
* There is no significant difference (at α = 0.05) among the means in the column and row marked with the same letter and the means for the growth parameter marked with the same letter.
Table 11. The effect of LED light color and intensity (μmol·m−2·s−1) on the content of carotenoids (mg·g−1 DW) in rooted hellebore microcuttings.
Type and ColorFLsWhite LEDBlue LEDRed LEDMeans (Intensity)
Light Intensity
400.08 ± 0.0 c*0.06 ± 0.0 a0.08 ± 0.0 c0.07 ± 0.0 b0.07 ± 0.0 a
700.09 ± 0.0 d0.07 ± 0.0 b0.09 ± 0.0 d0.07 ± 0.0 b0.08 ± 0.0 b
Means (color)0.09 ± 0.0 c0.06 ± 0.0 a0.08 ± 0.0 b0.07 ± 0.0 a
* There is no significant difference (at α = 0.05) among the means in the column and row marked with the same letter and the means for the growth parameter marked with the same letter.
Disclaimer/Publisher’s Note: The statements, opinions and data contained in all publications are solely those of the individual author(s) and contributor(s) and not of MDPI and/or the editor(s). MDPI and/or the editor(s) disclaim responsibility for any injury to people or property resulting from any ideas, methods, instructions or products referred to in the content.

