
Multi-Tooth Cutting Method and Bionic Cutter Design for Broccoli Xylem (Brassica oleracea L. var. Italica Plenck)

Abstract
:1. Introduction
2. Materials and Methods
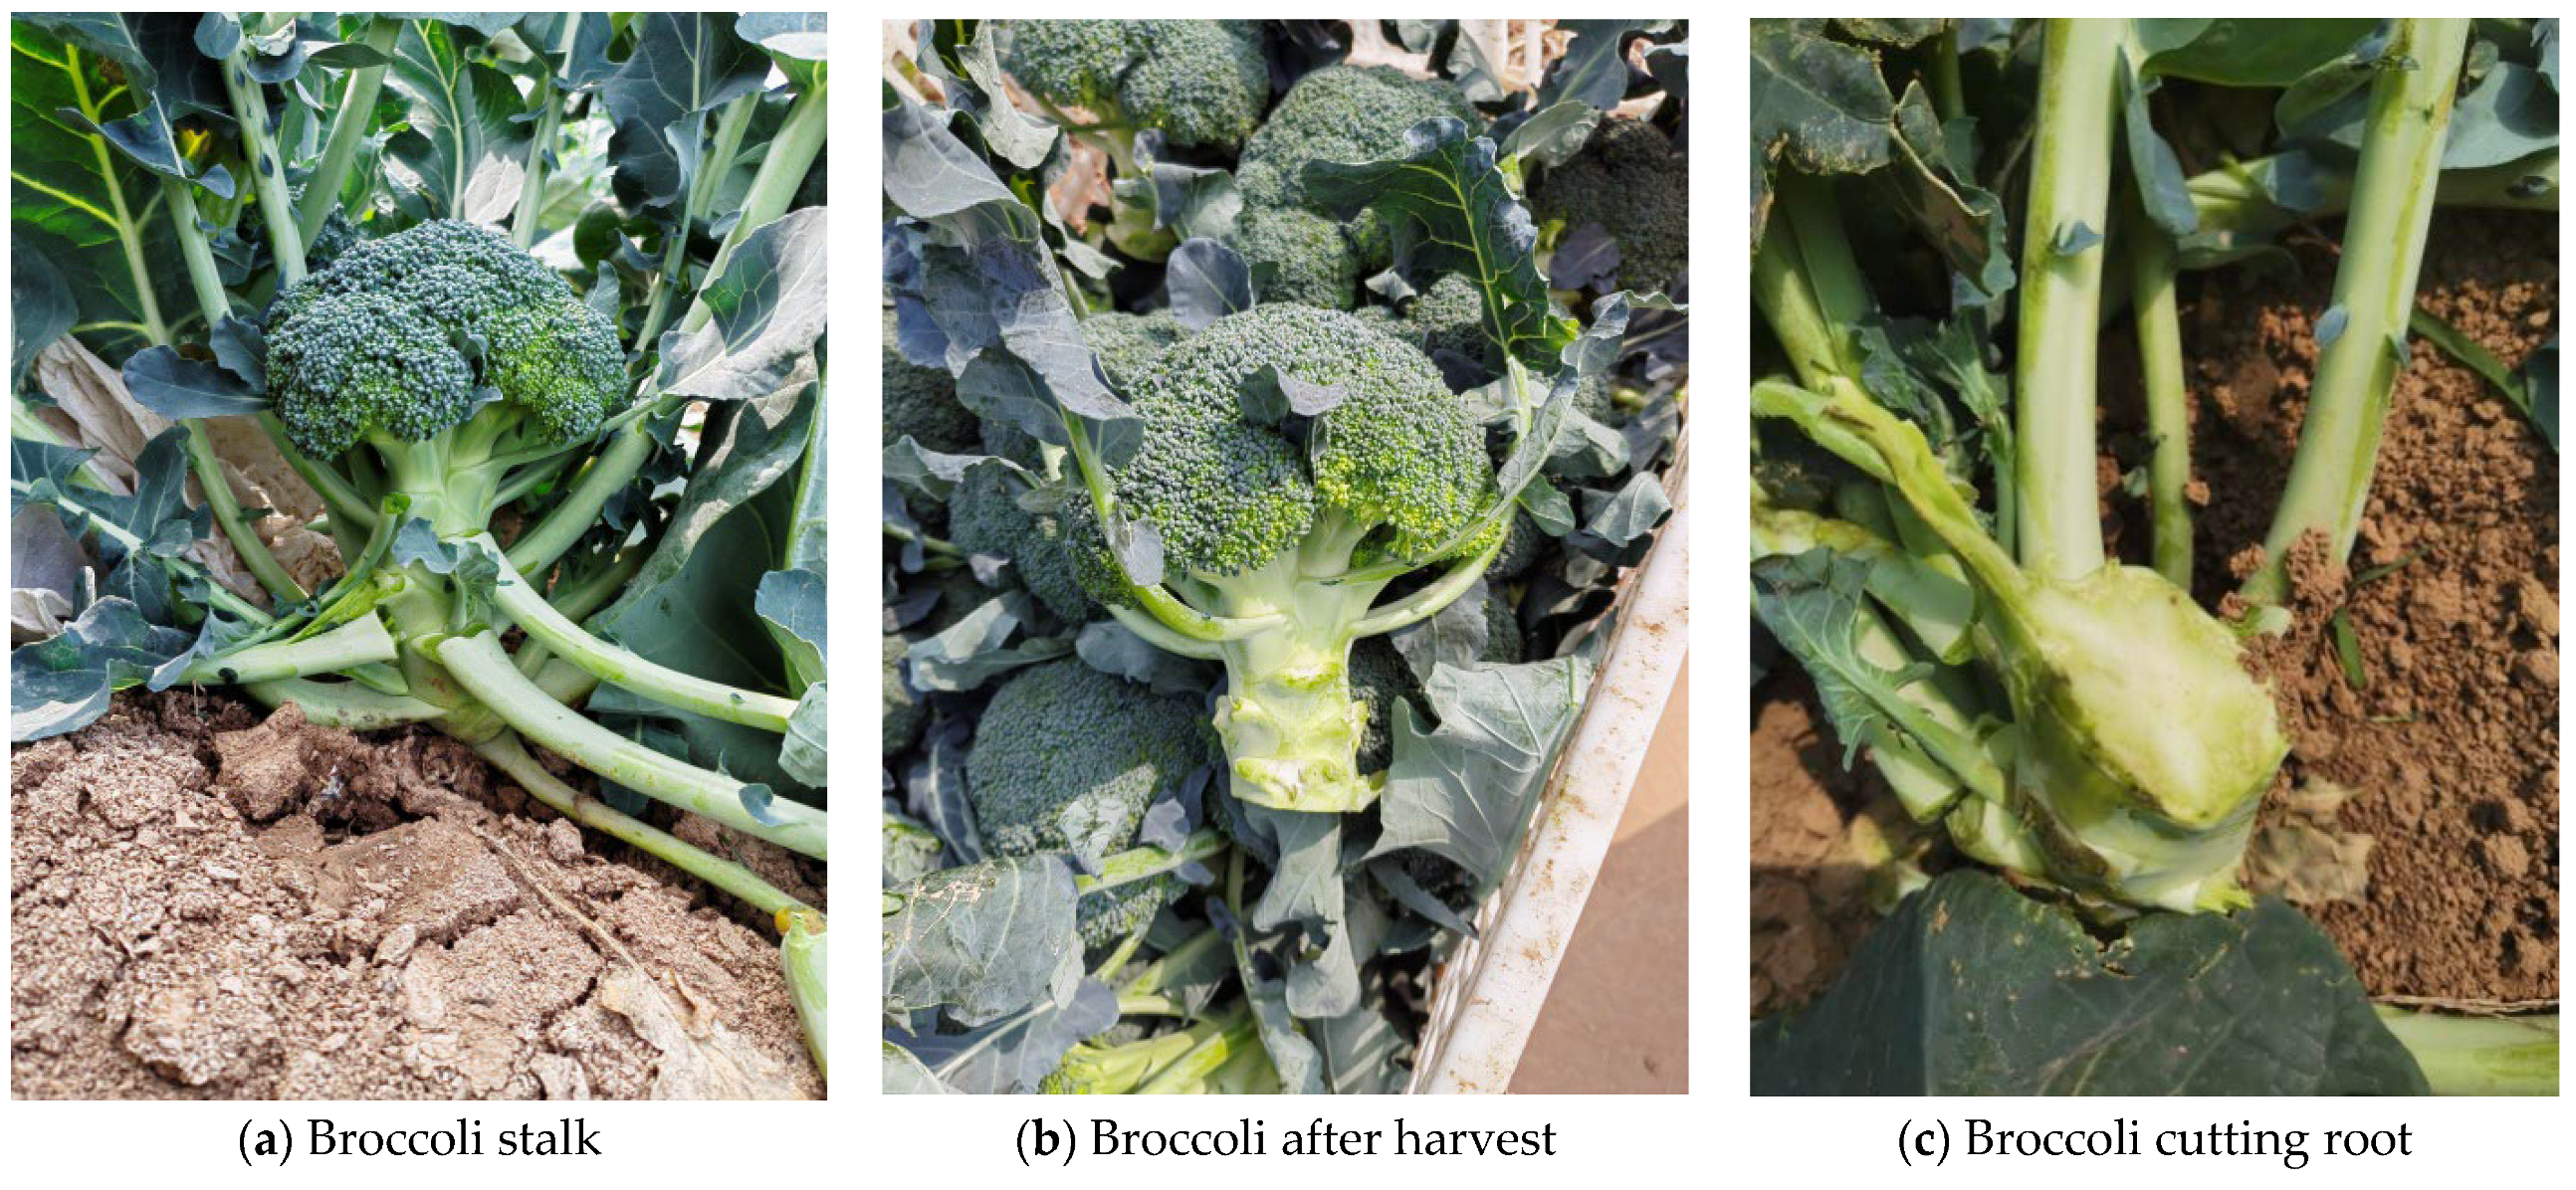
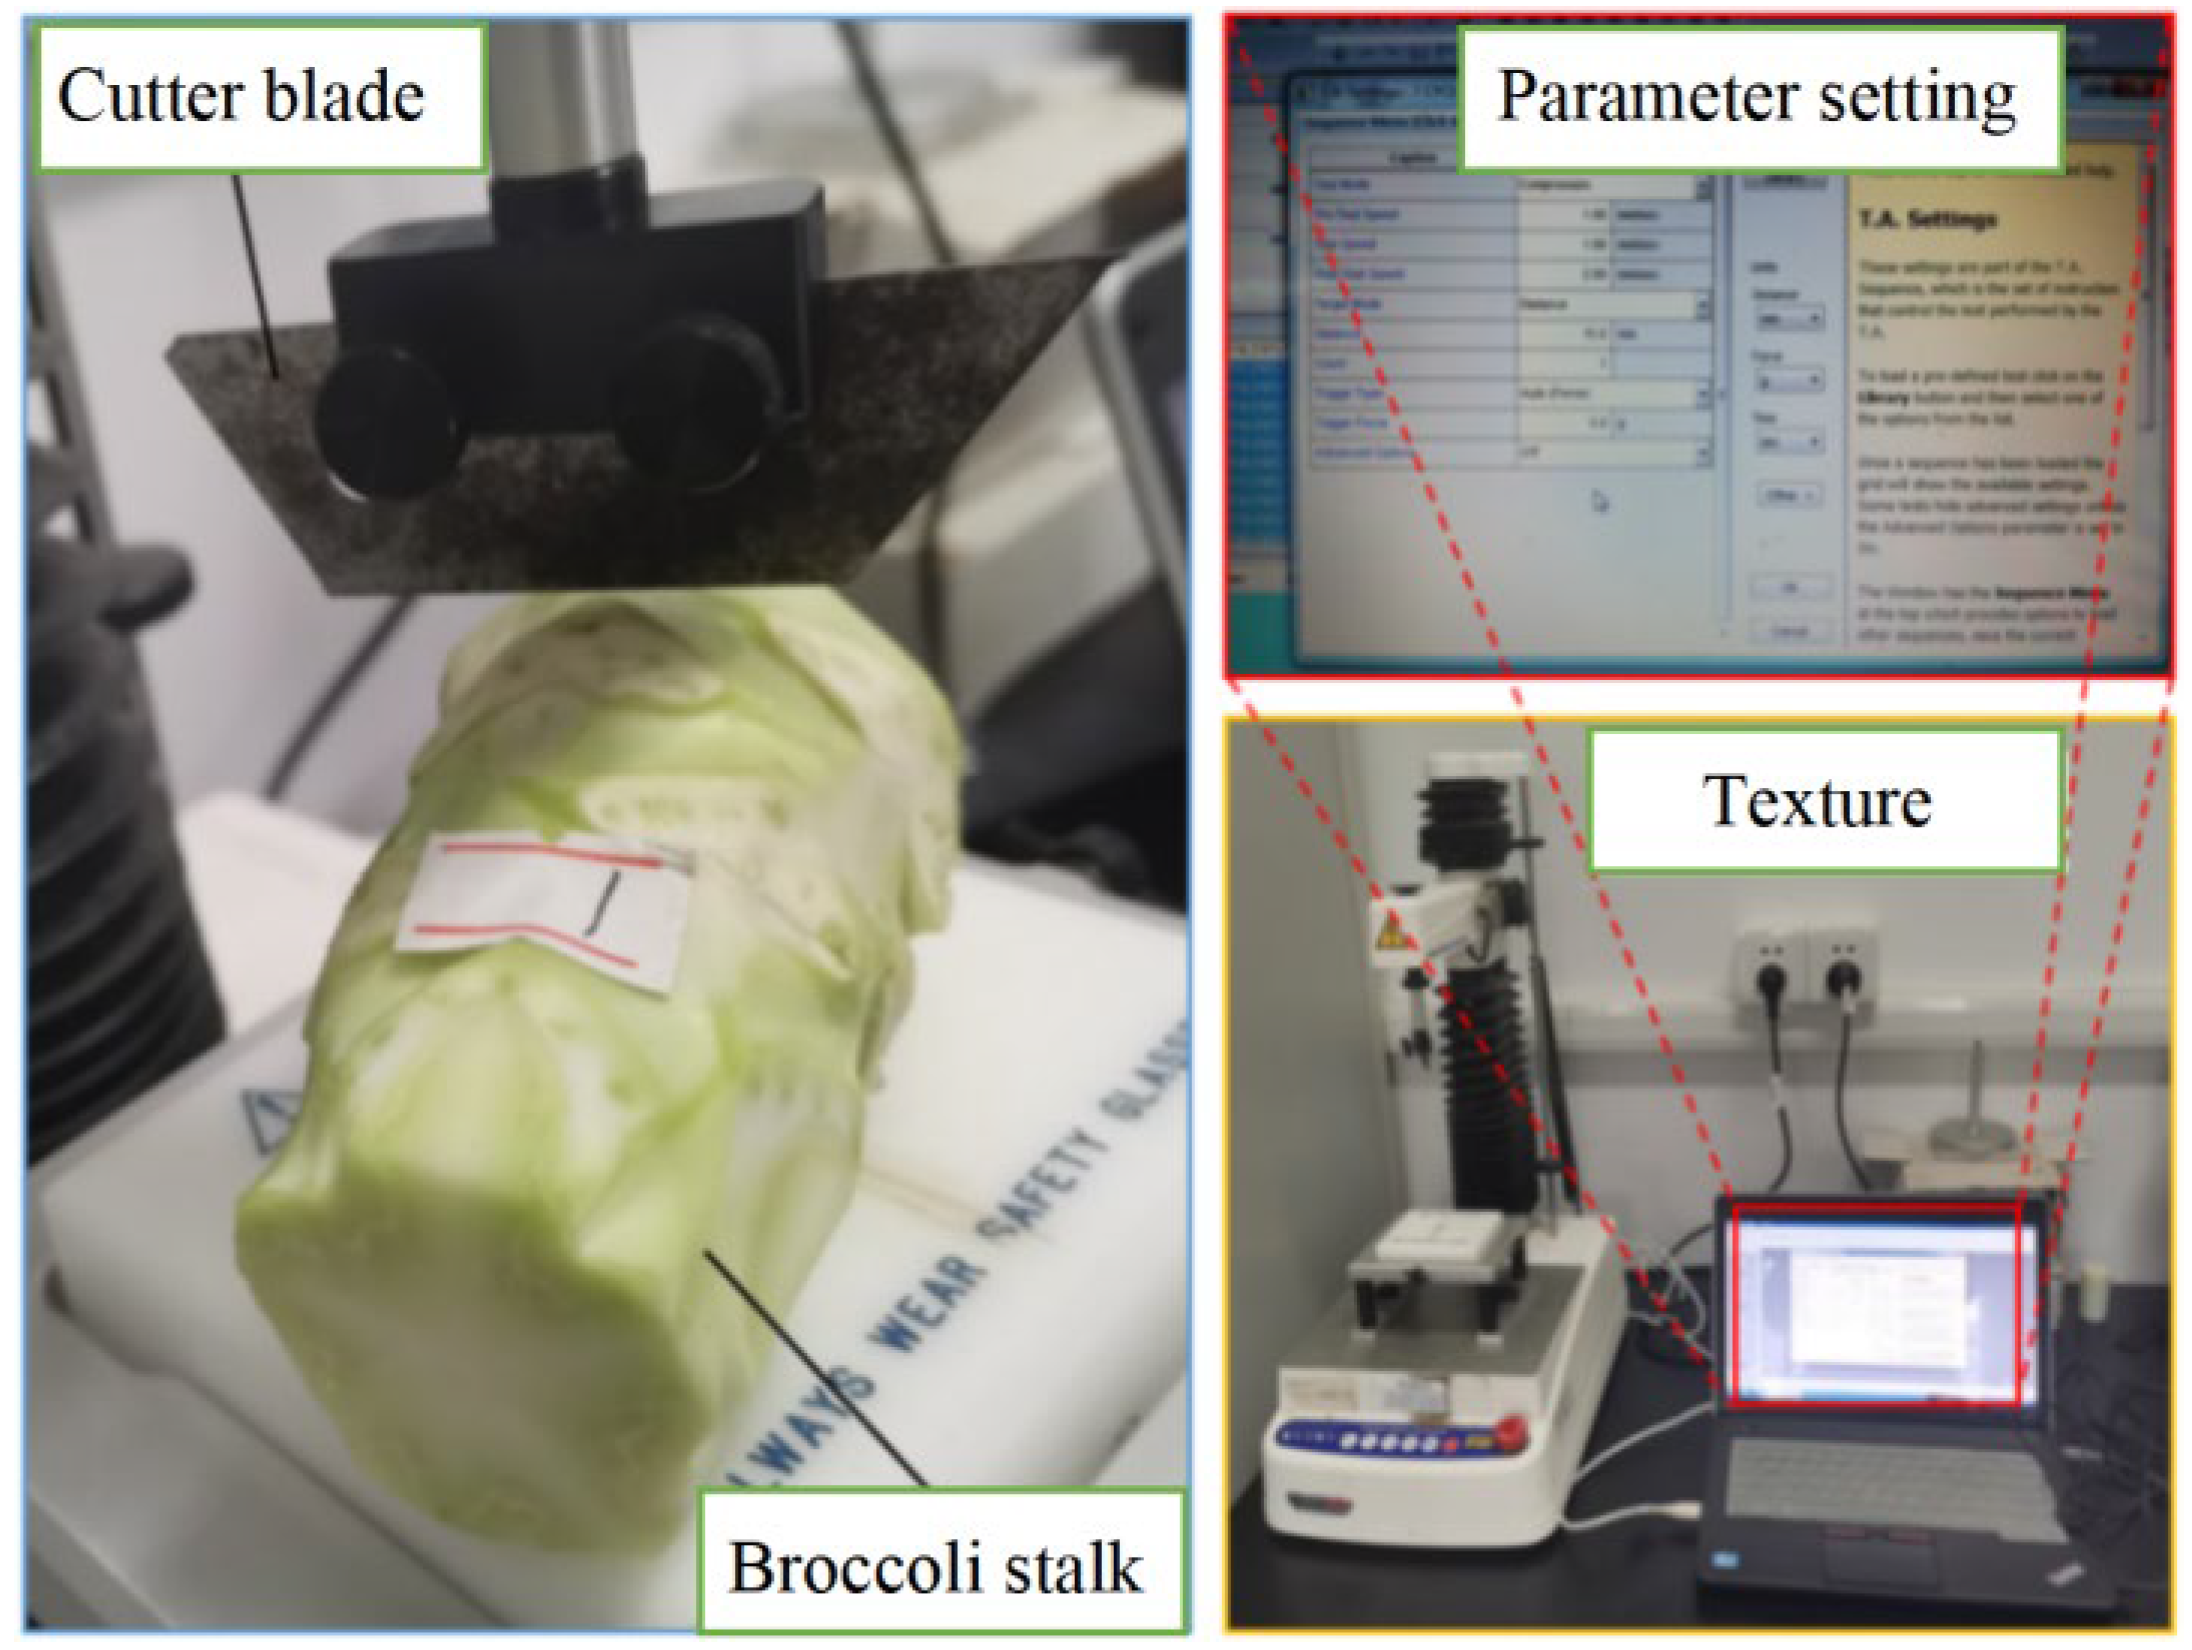
2.1. Mechanical Test of Broccoli Xylem
2.2. Exploration of Cutting Theory and Creation of Cutting Models
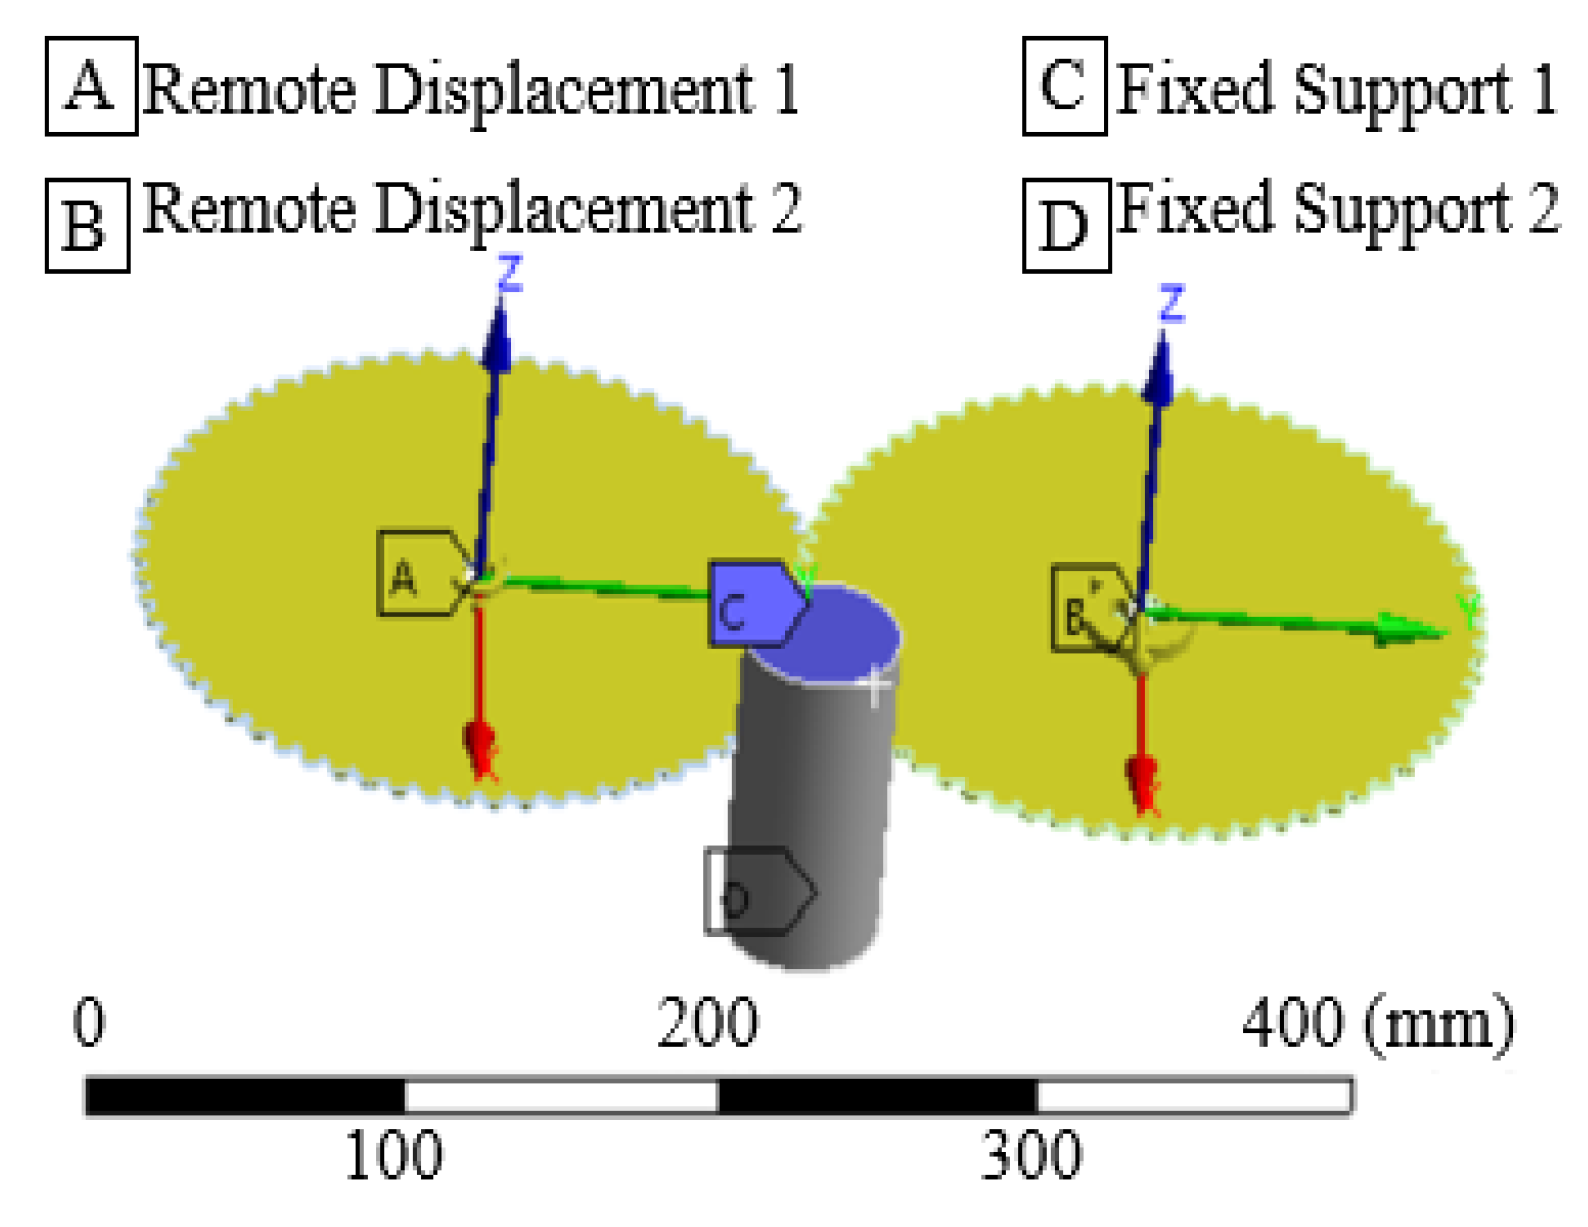
2.3. Cutting Simulation Design
2.3.1. Single Factor Cutting Simulation Design
2.3.2. Multi-Factor Cutting Simulation Design
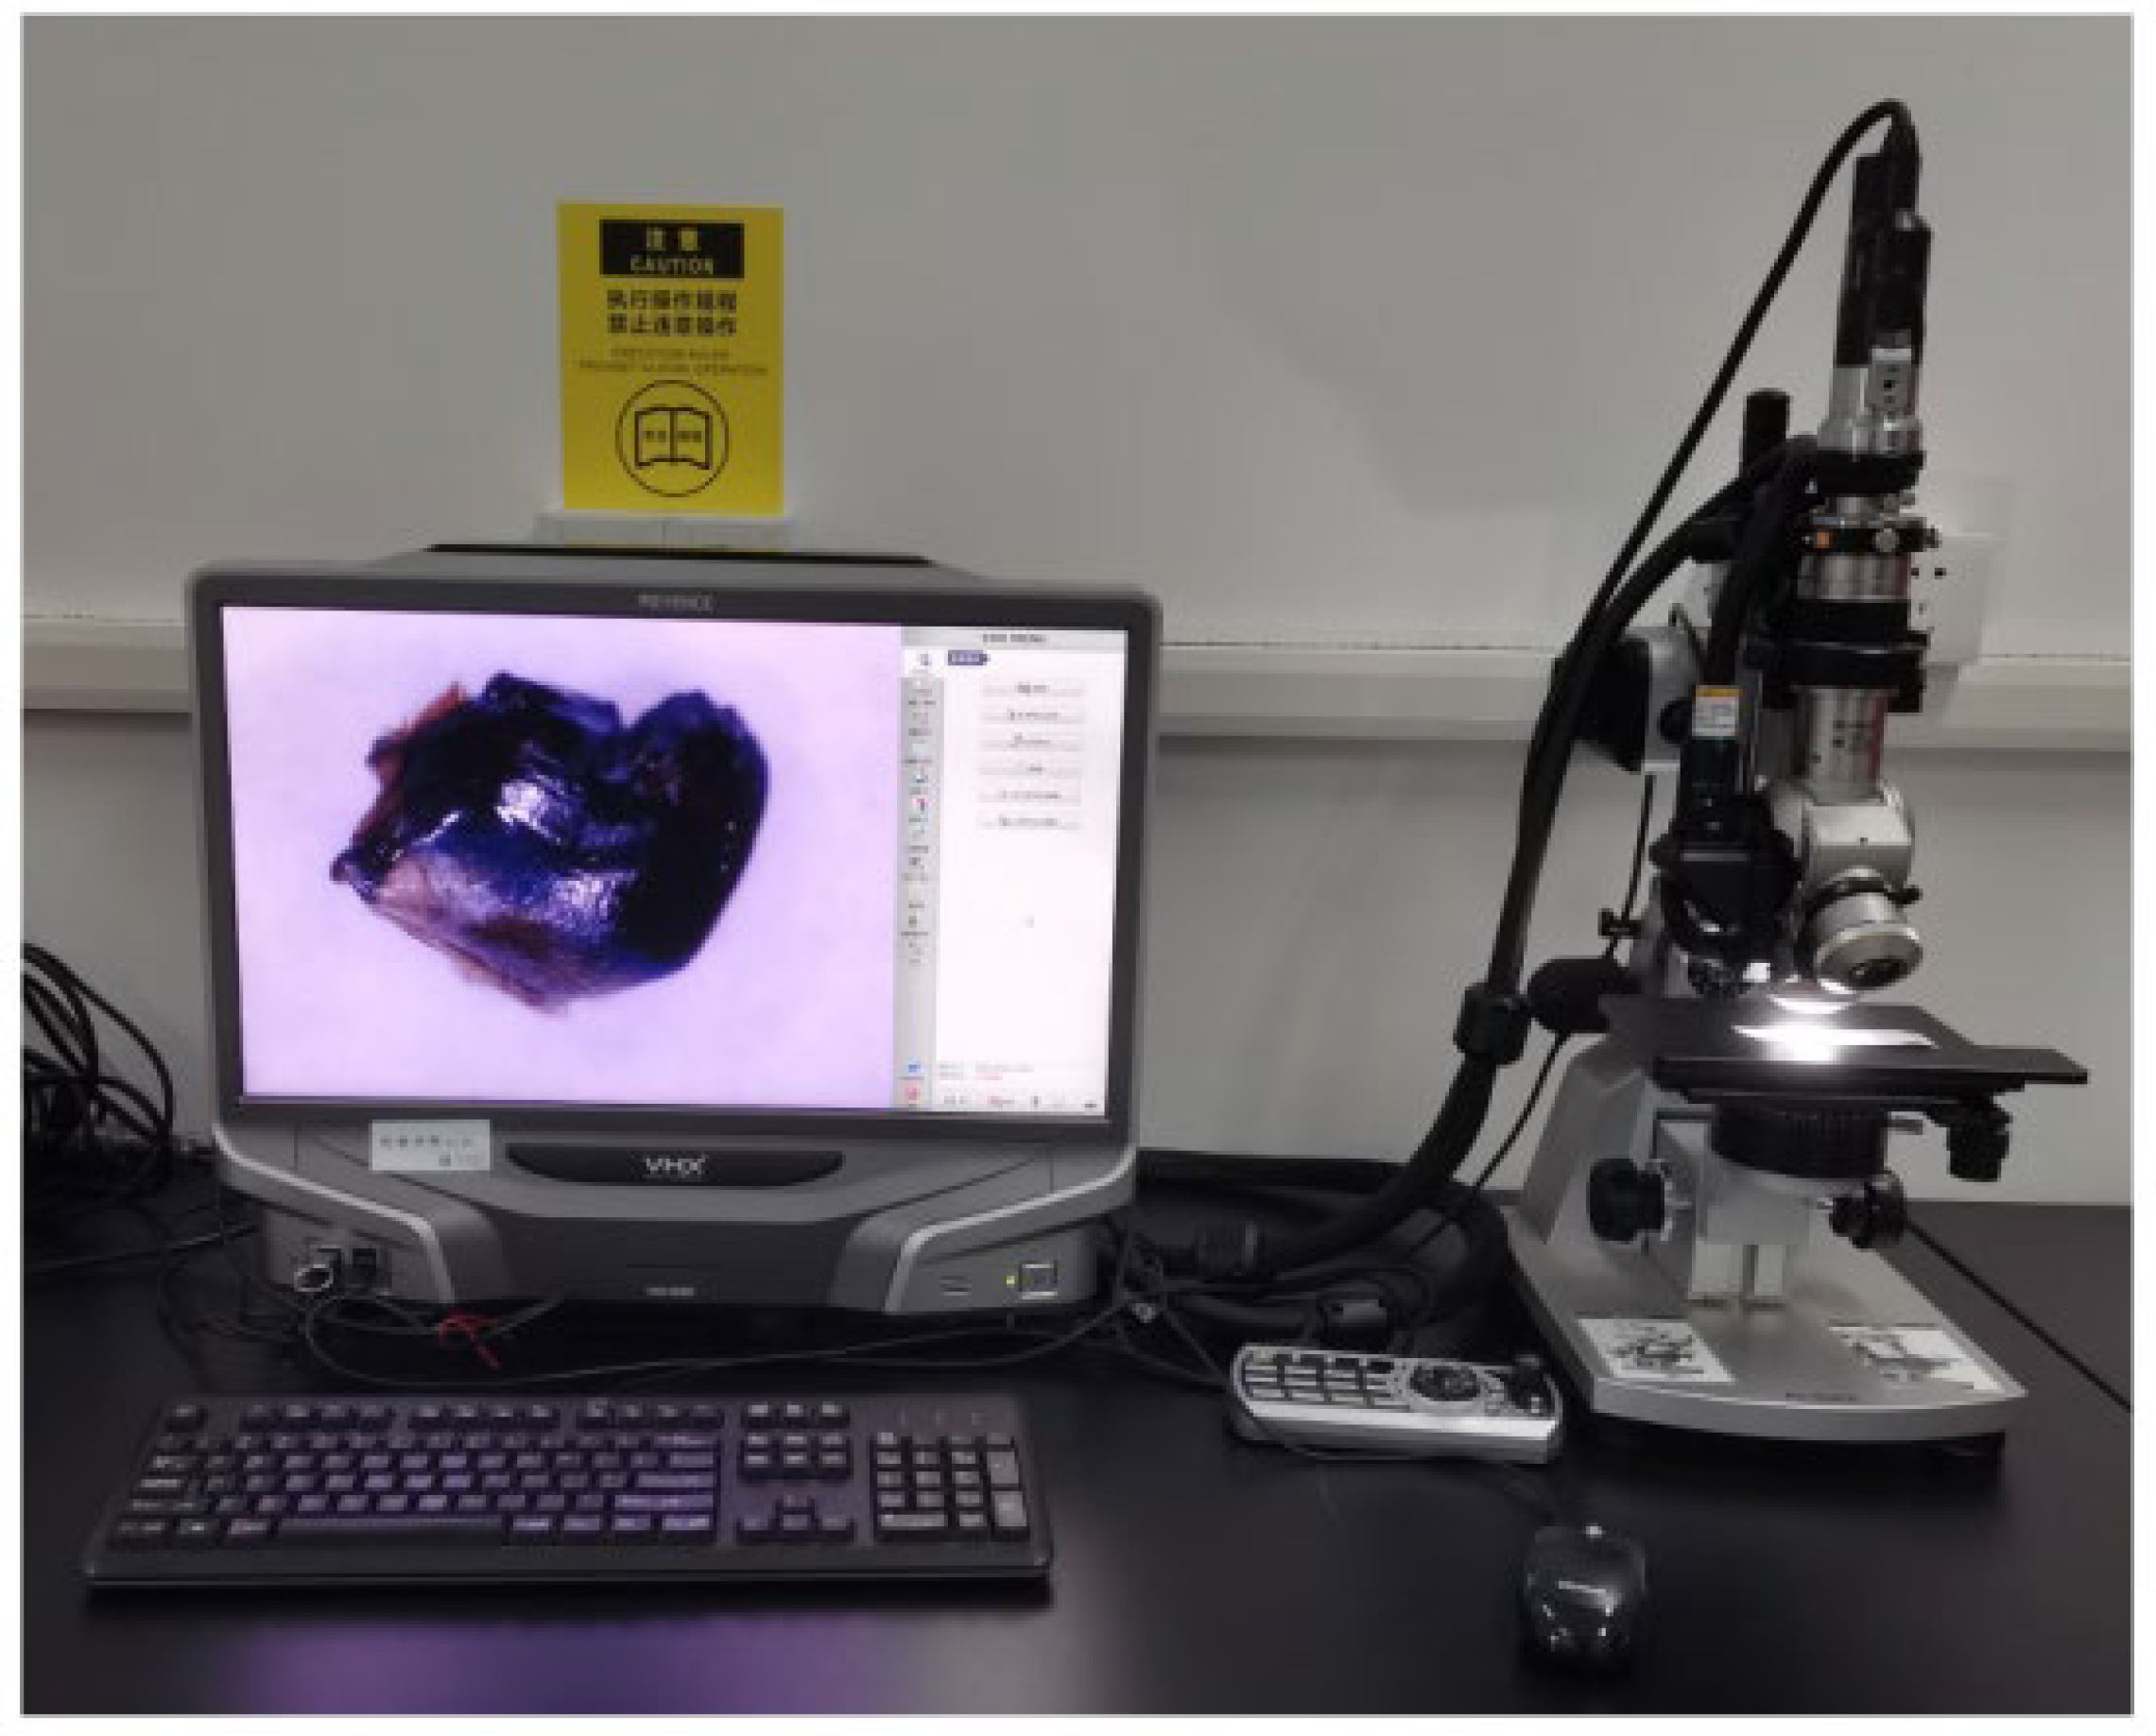
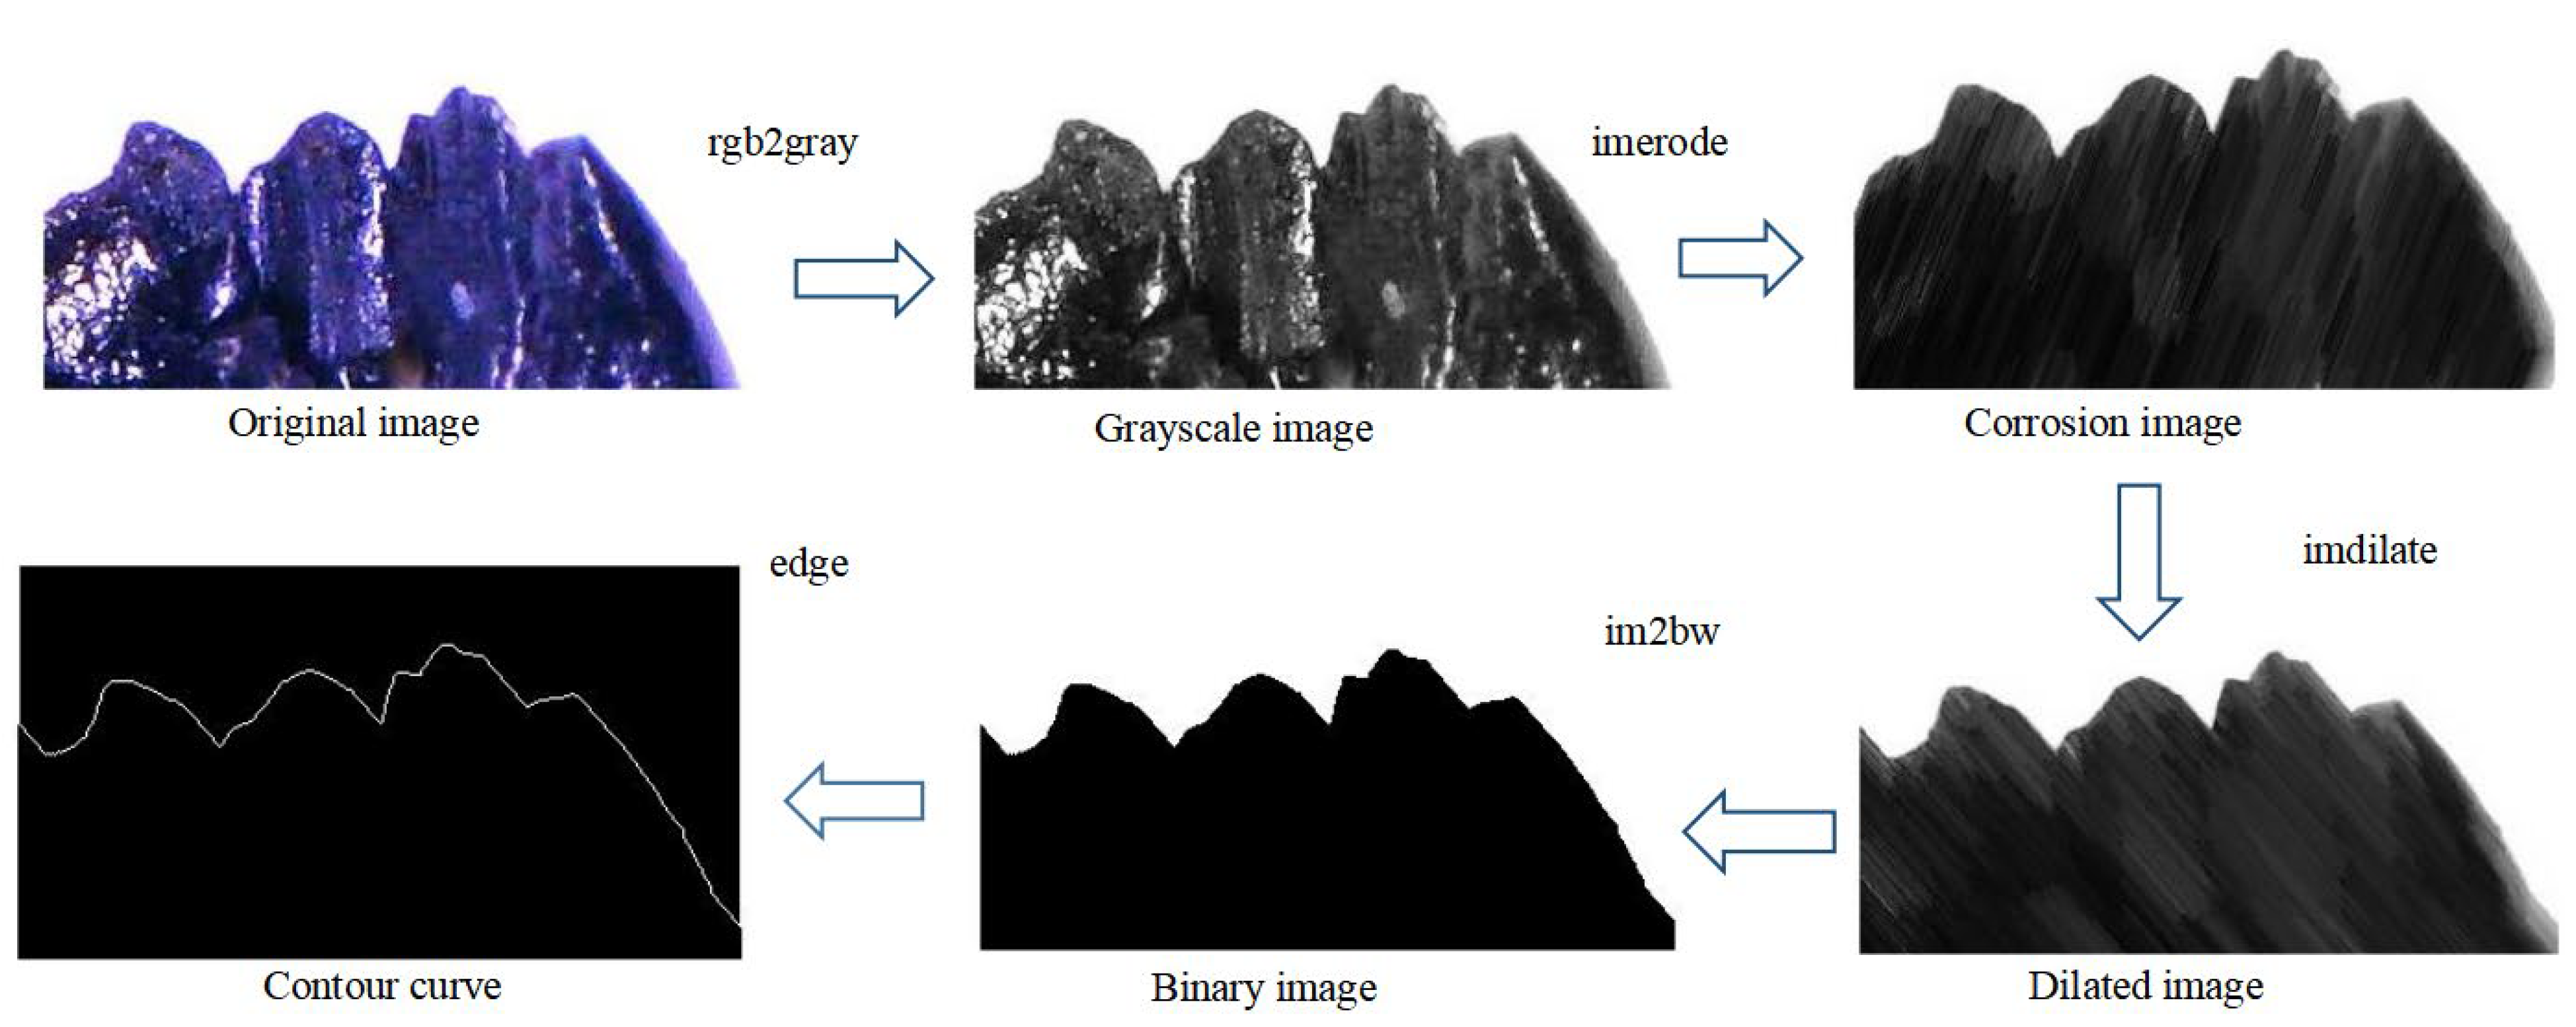
2.4. Bionic Object Morphological Model Theory
2.5. Bench Comparison Test
3. Results and Discussion
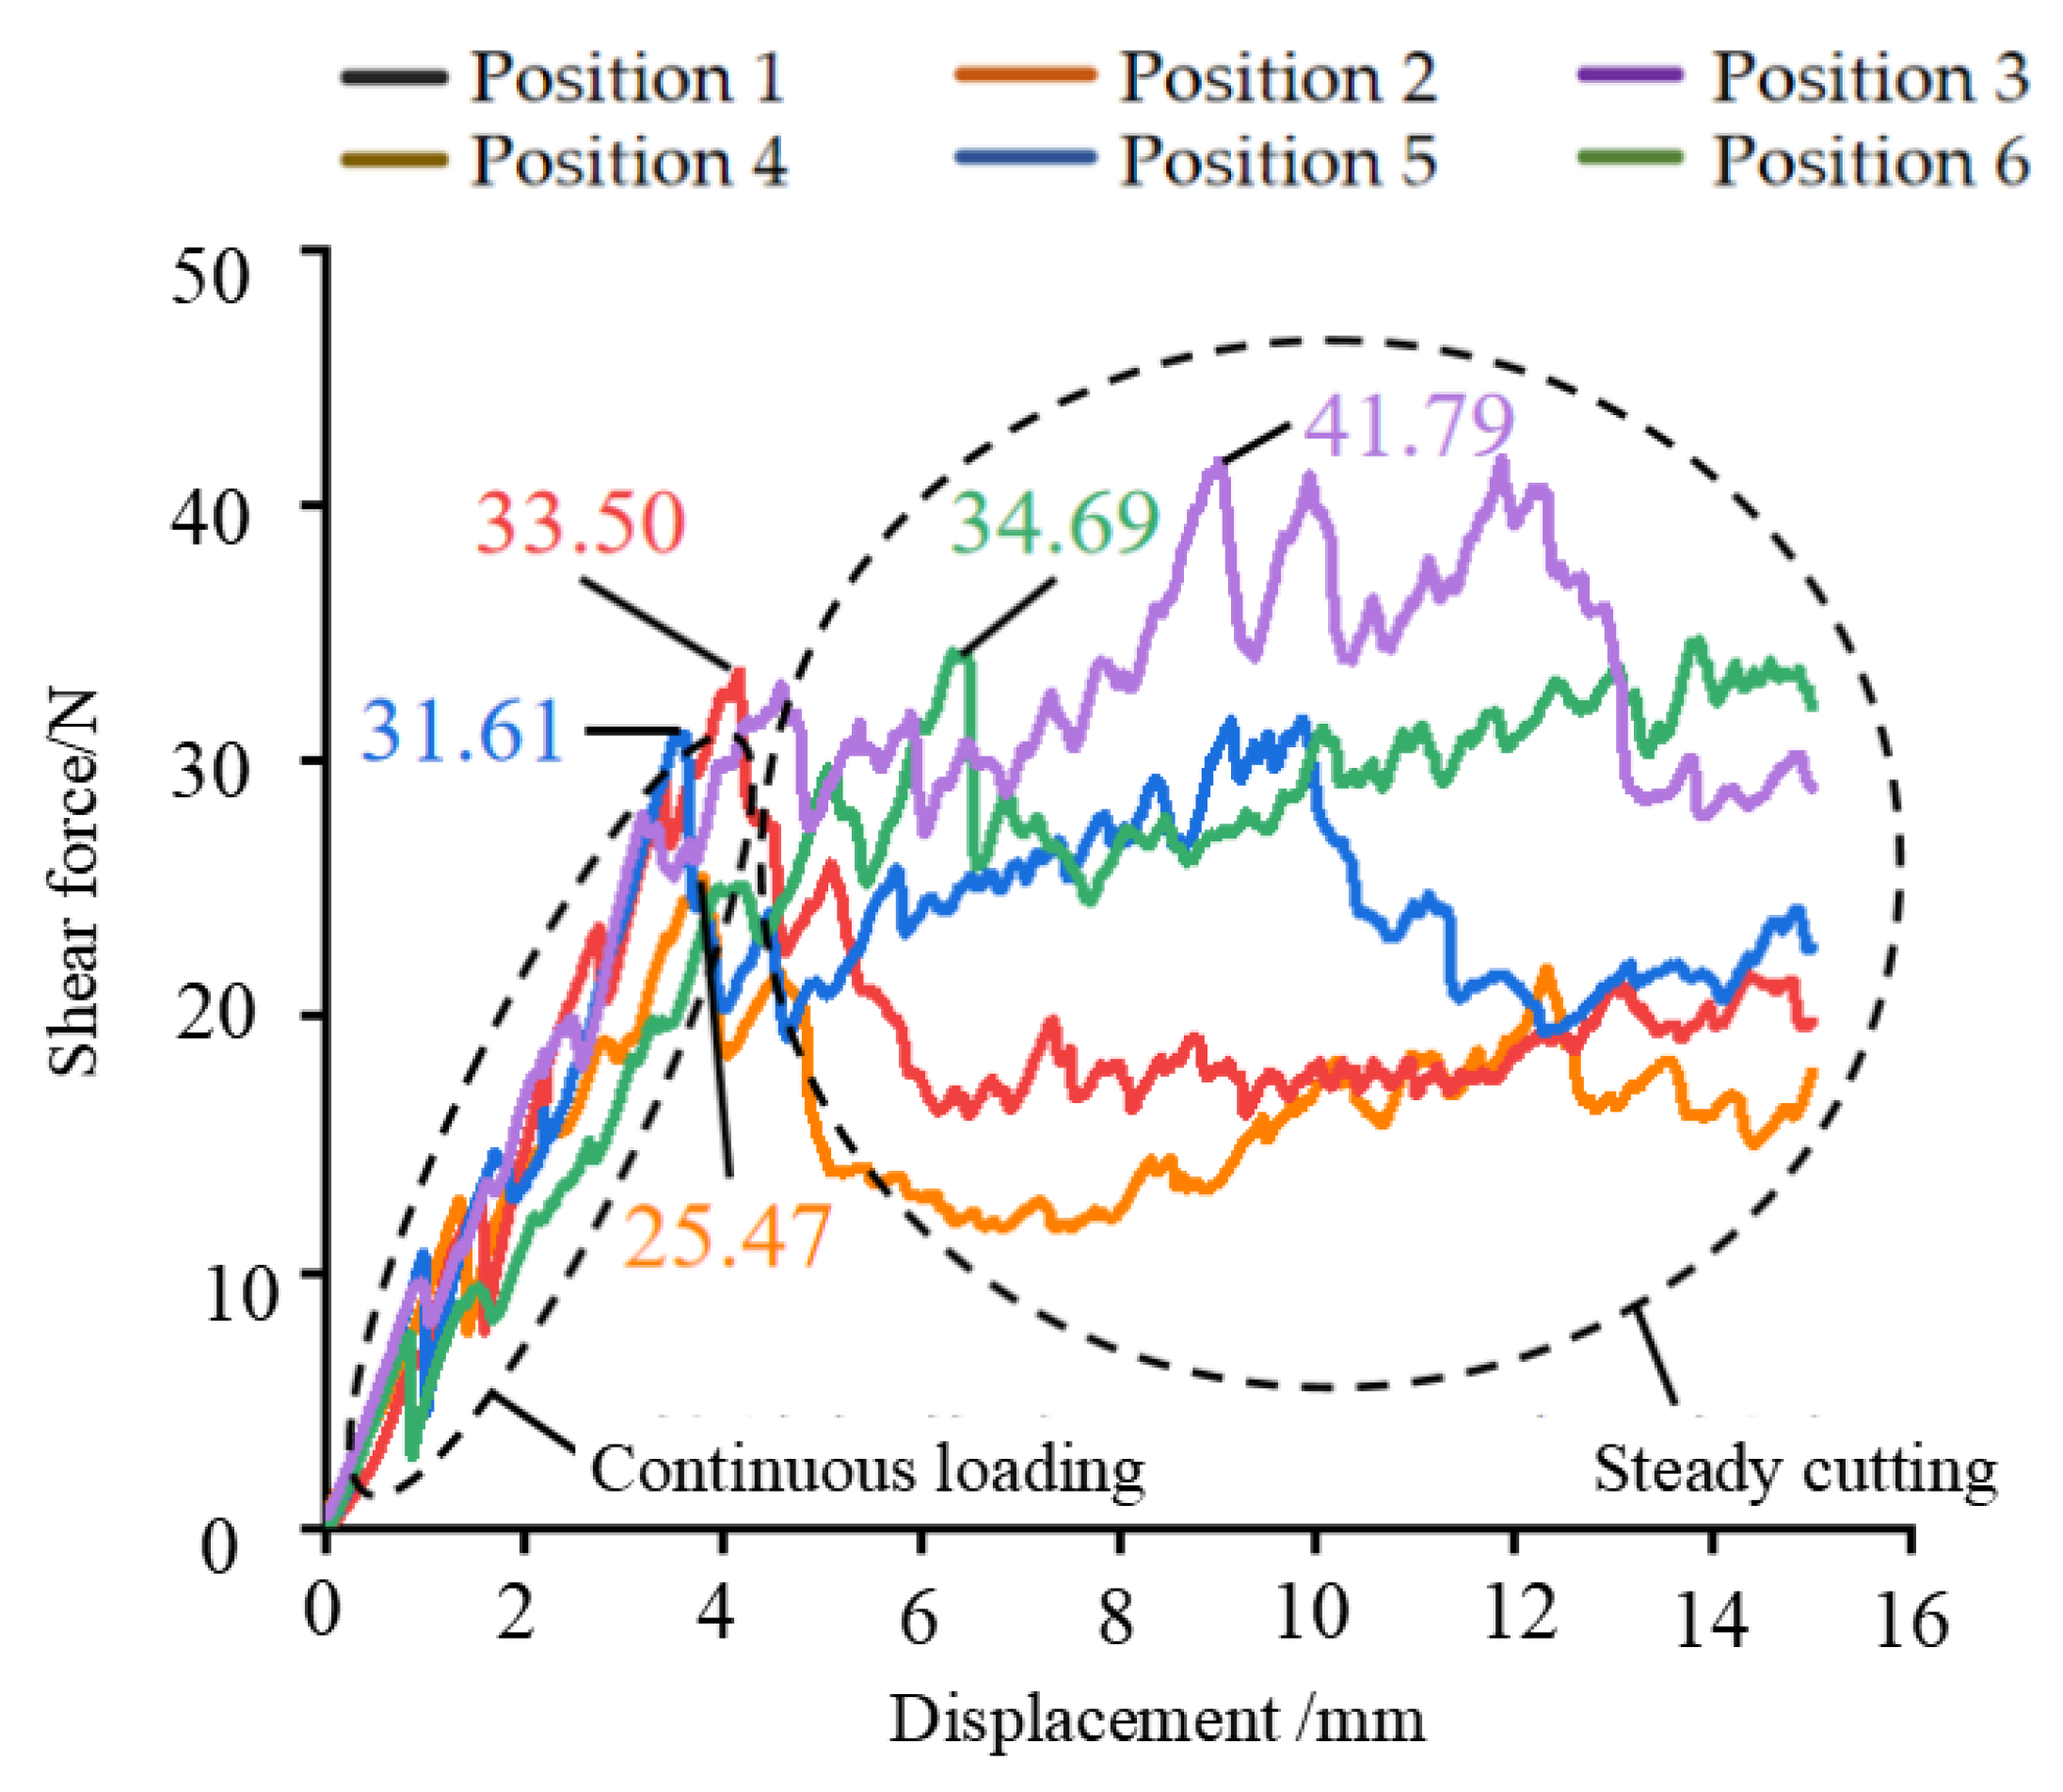
3.1. Analysis of Mechanical Properties of Broccoli Xylem
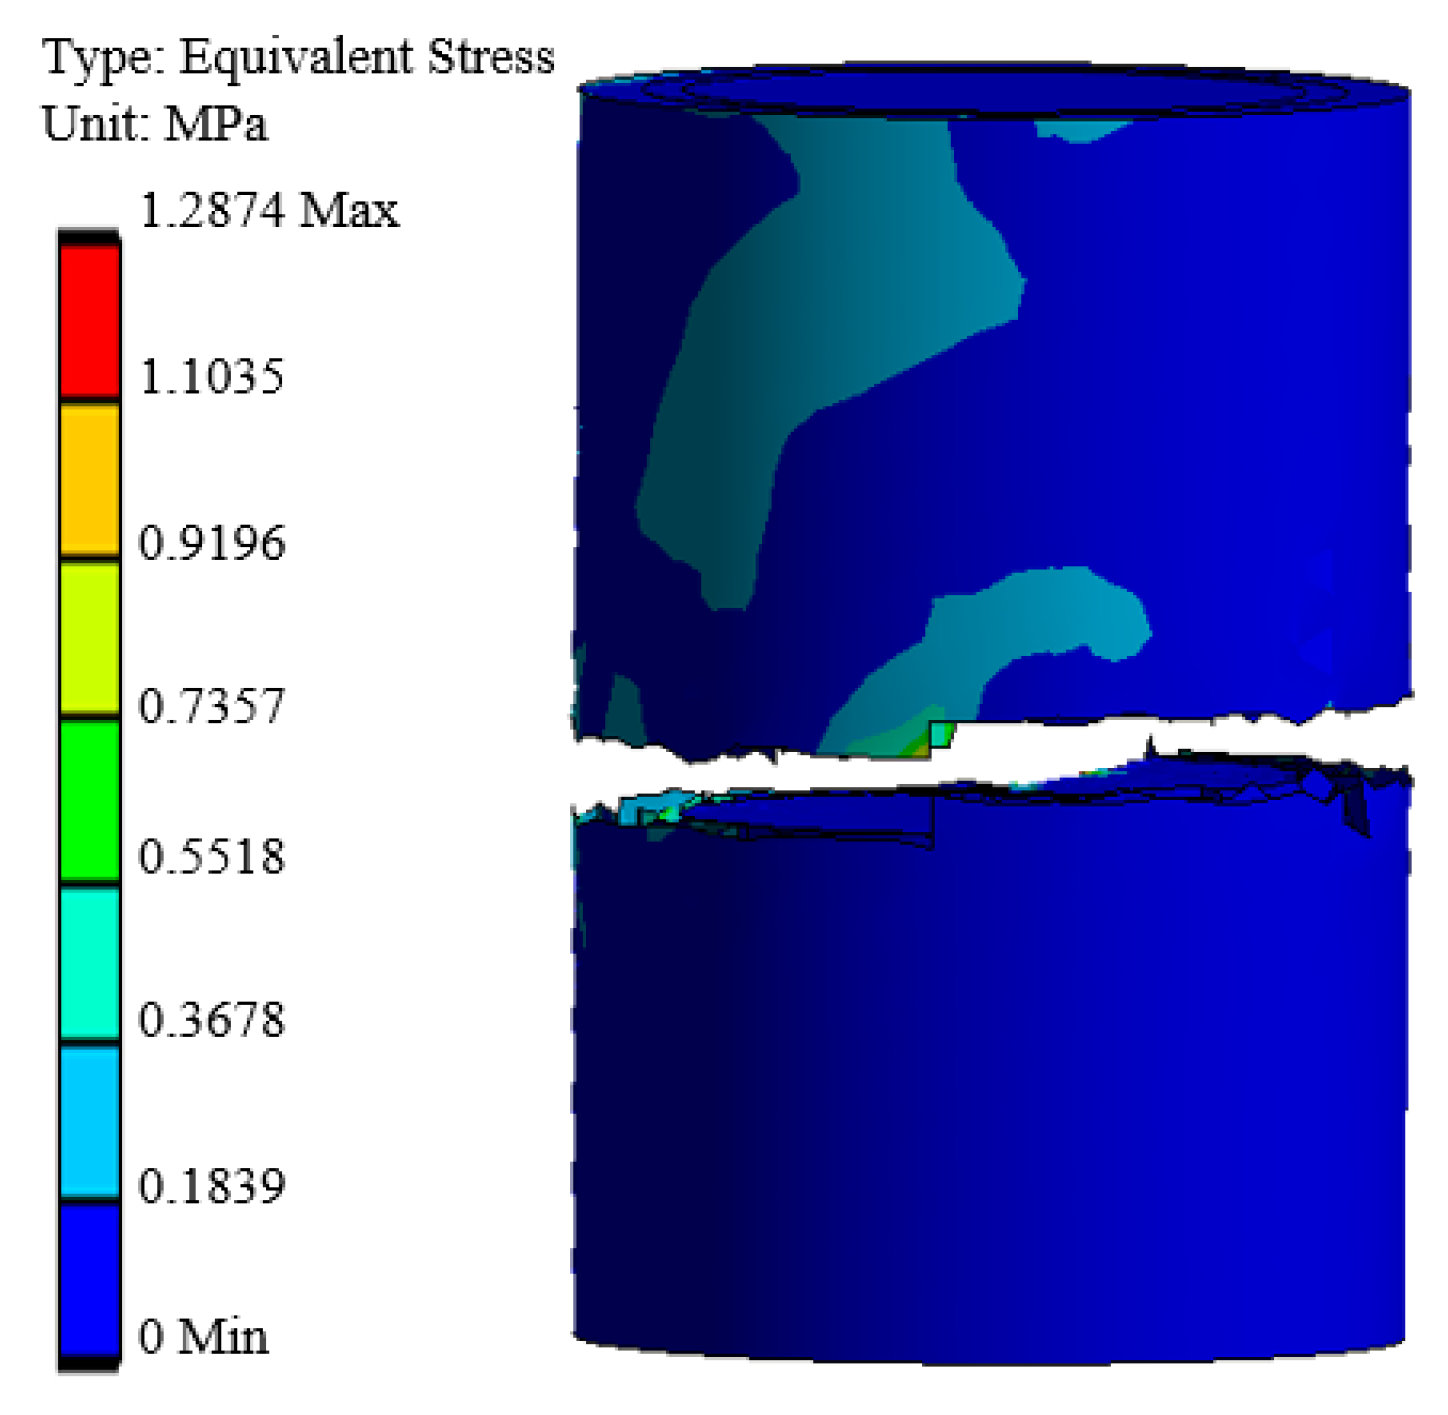
3.2. Simulation Analysis of the Cutting Mechanism of the Xylem Stem
3.2.1. Single Factor Simulation Analysis
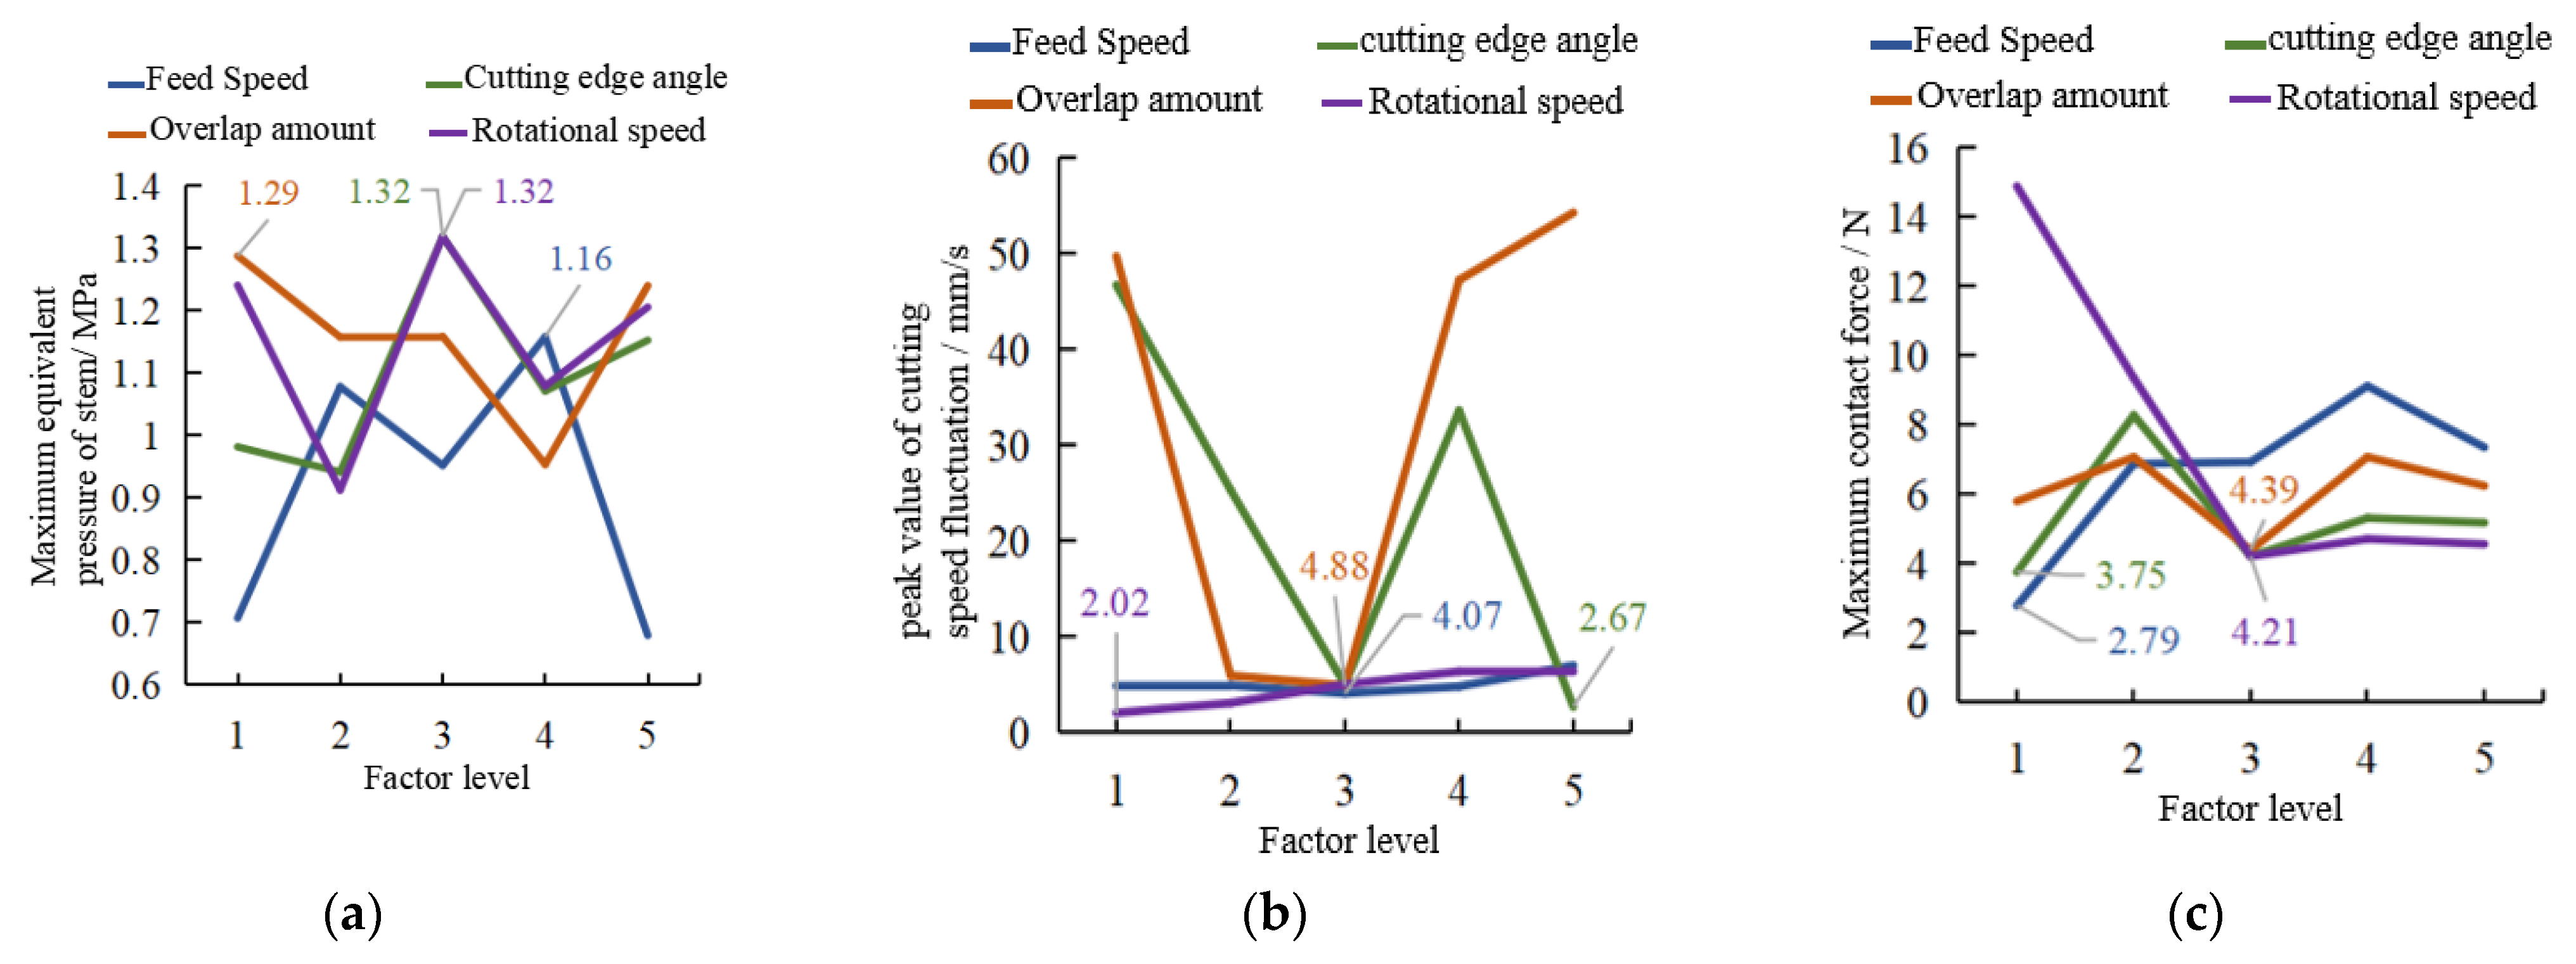
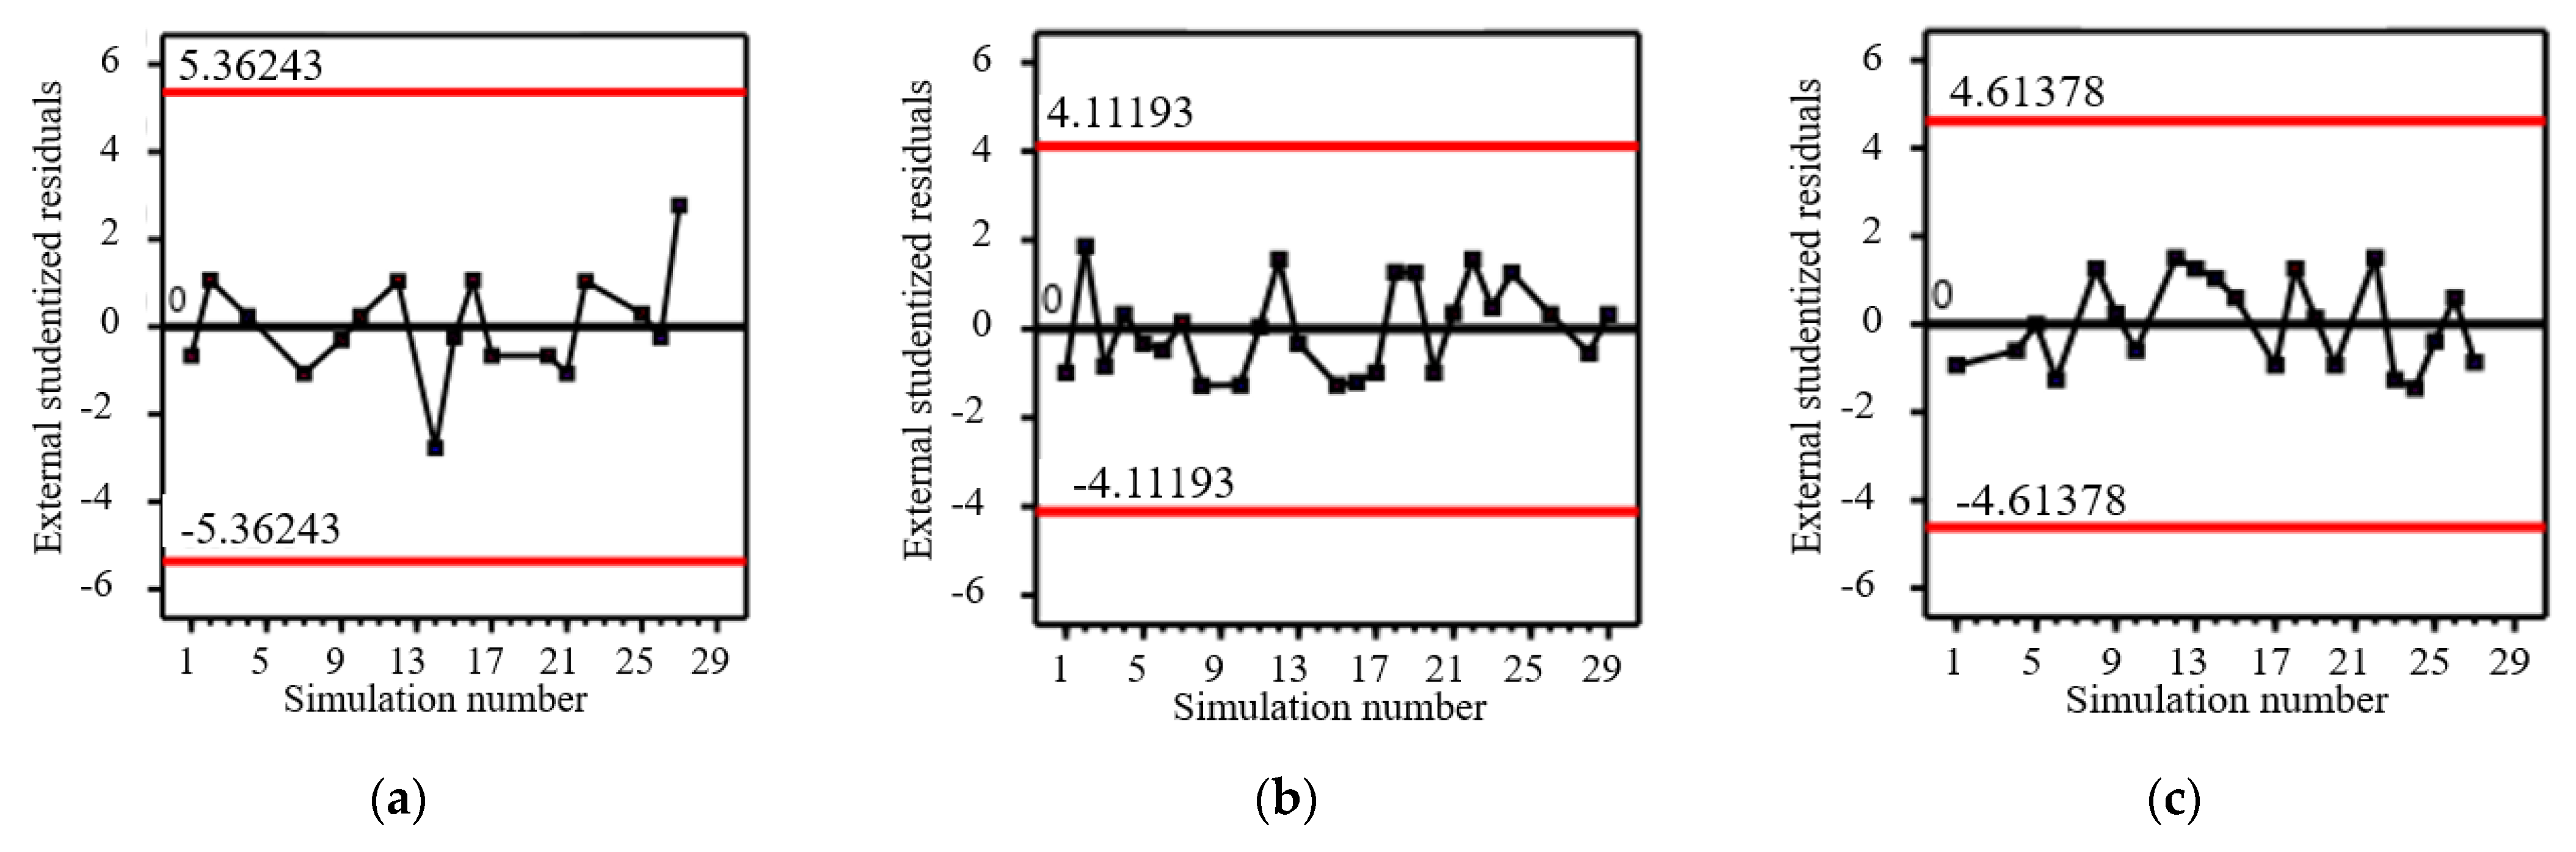
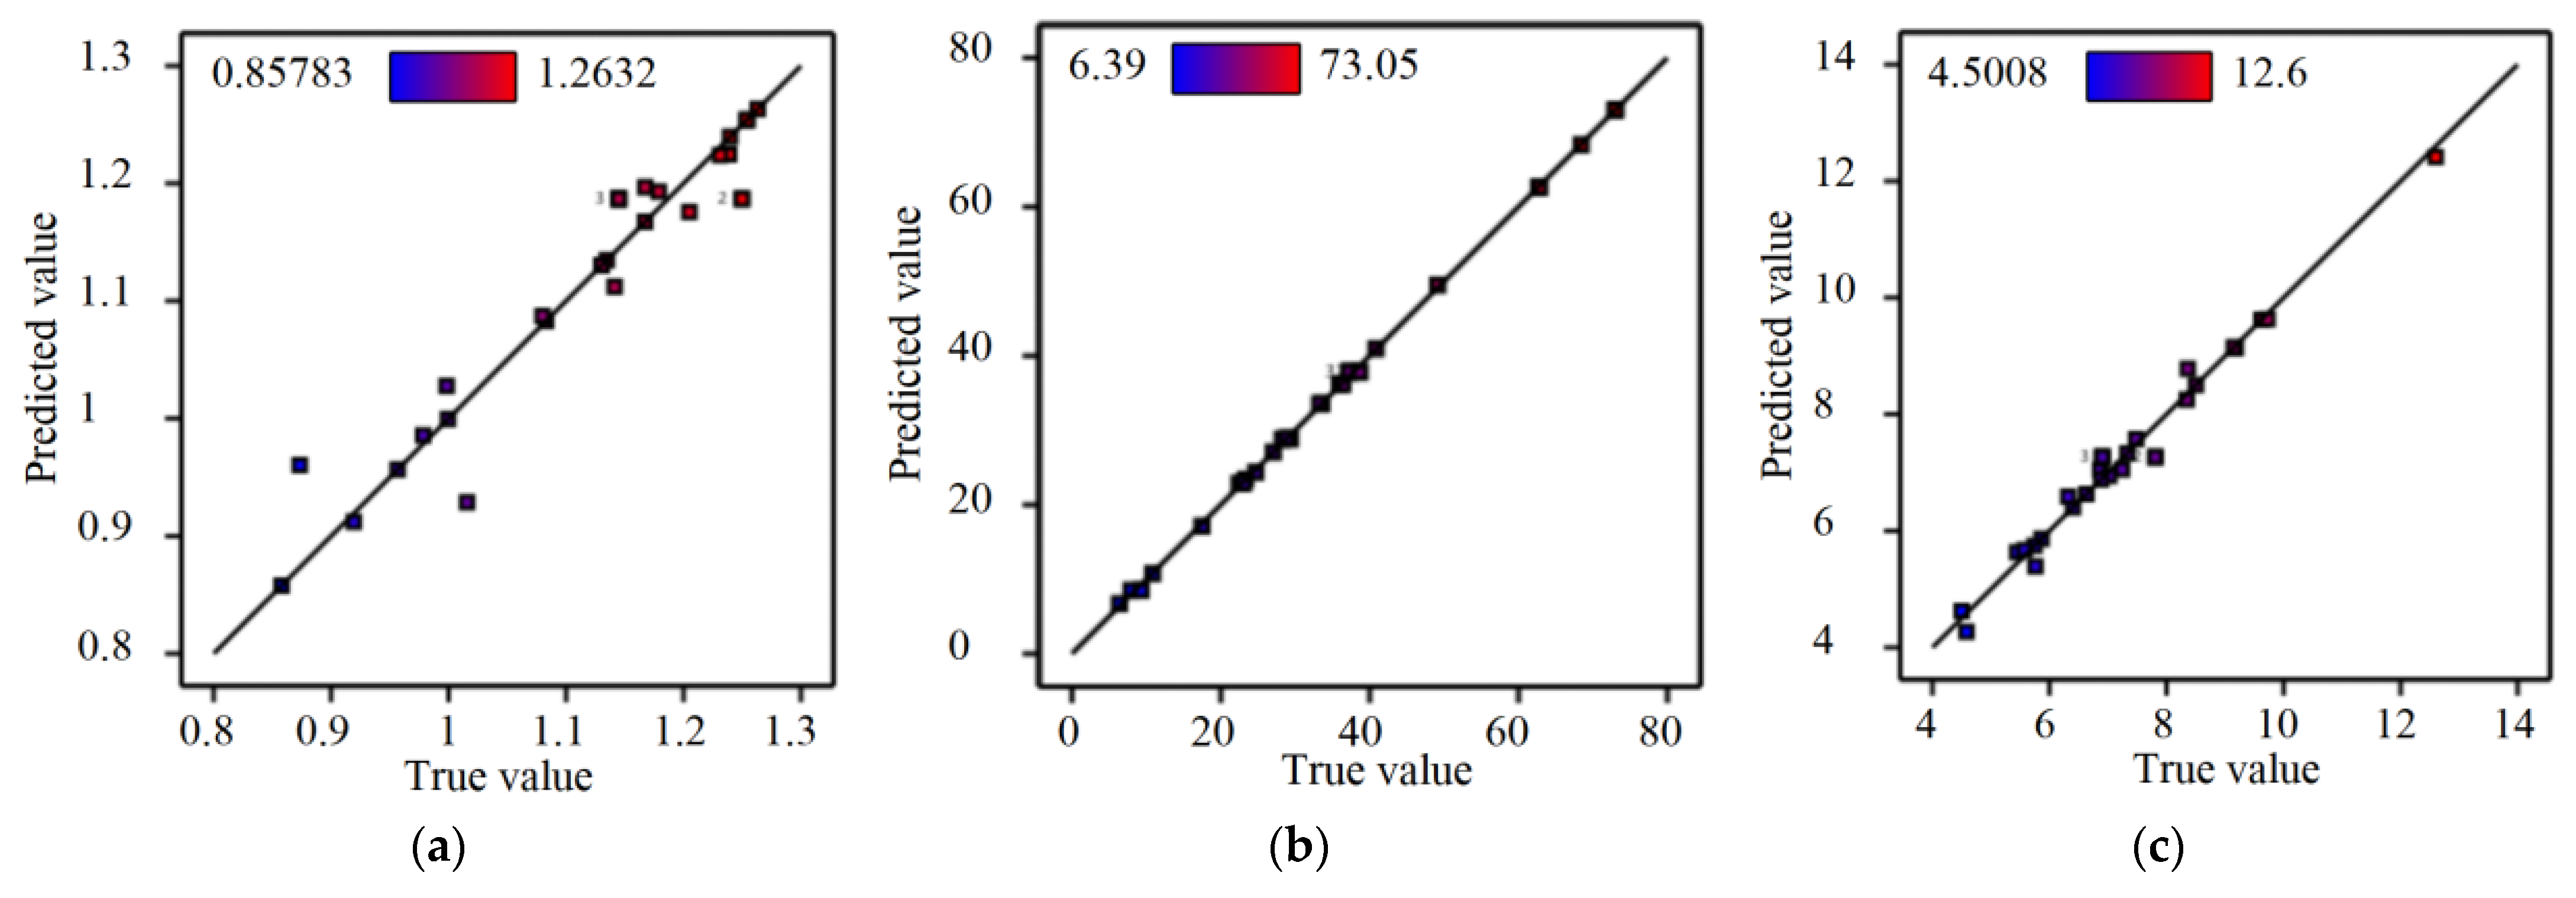
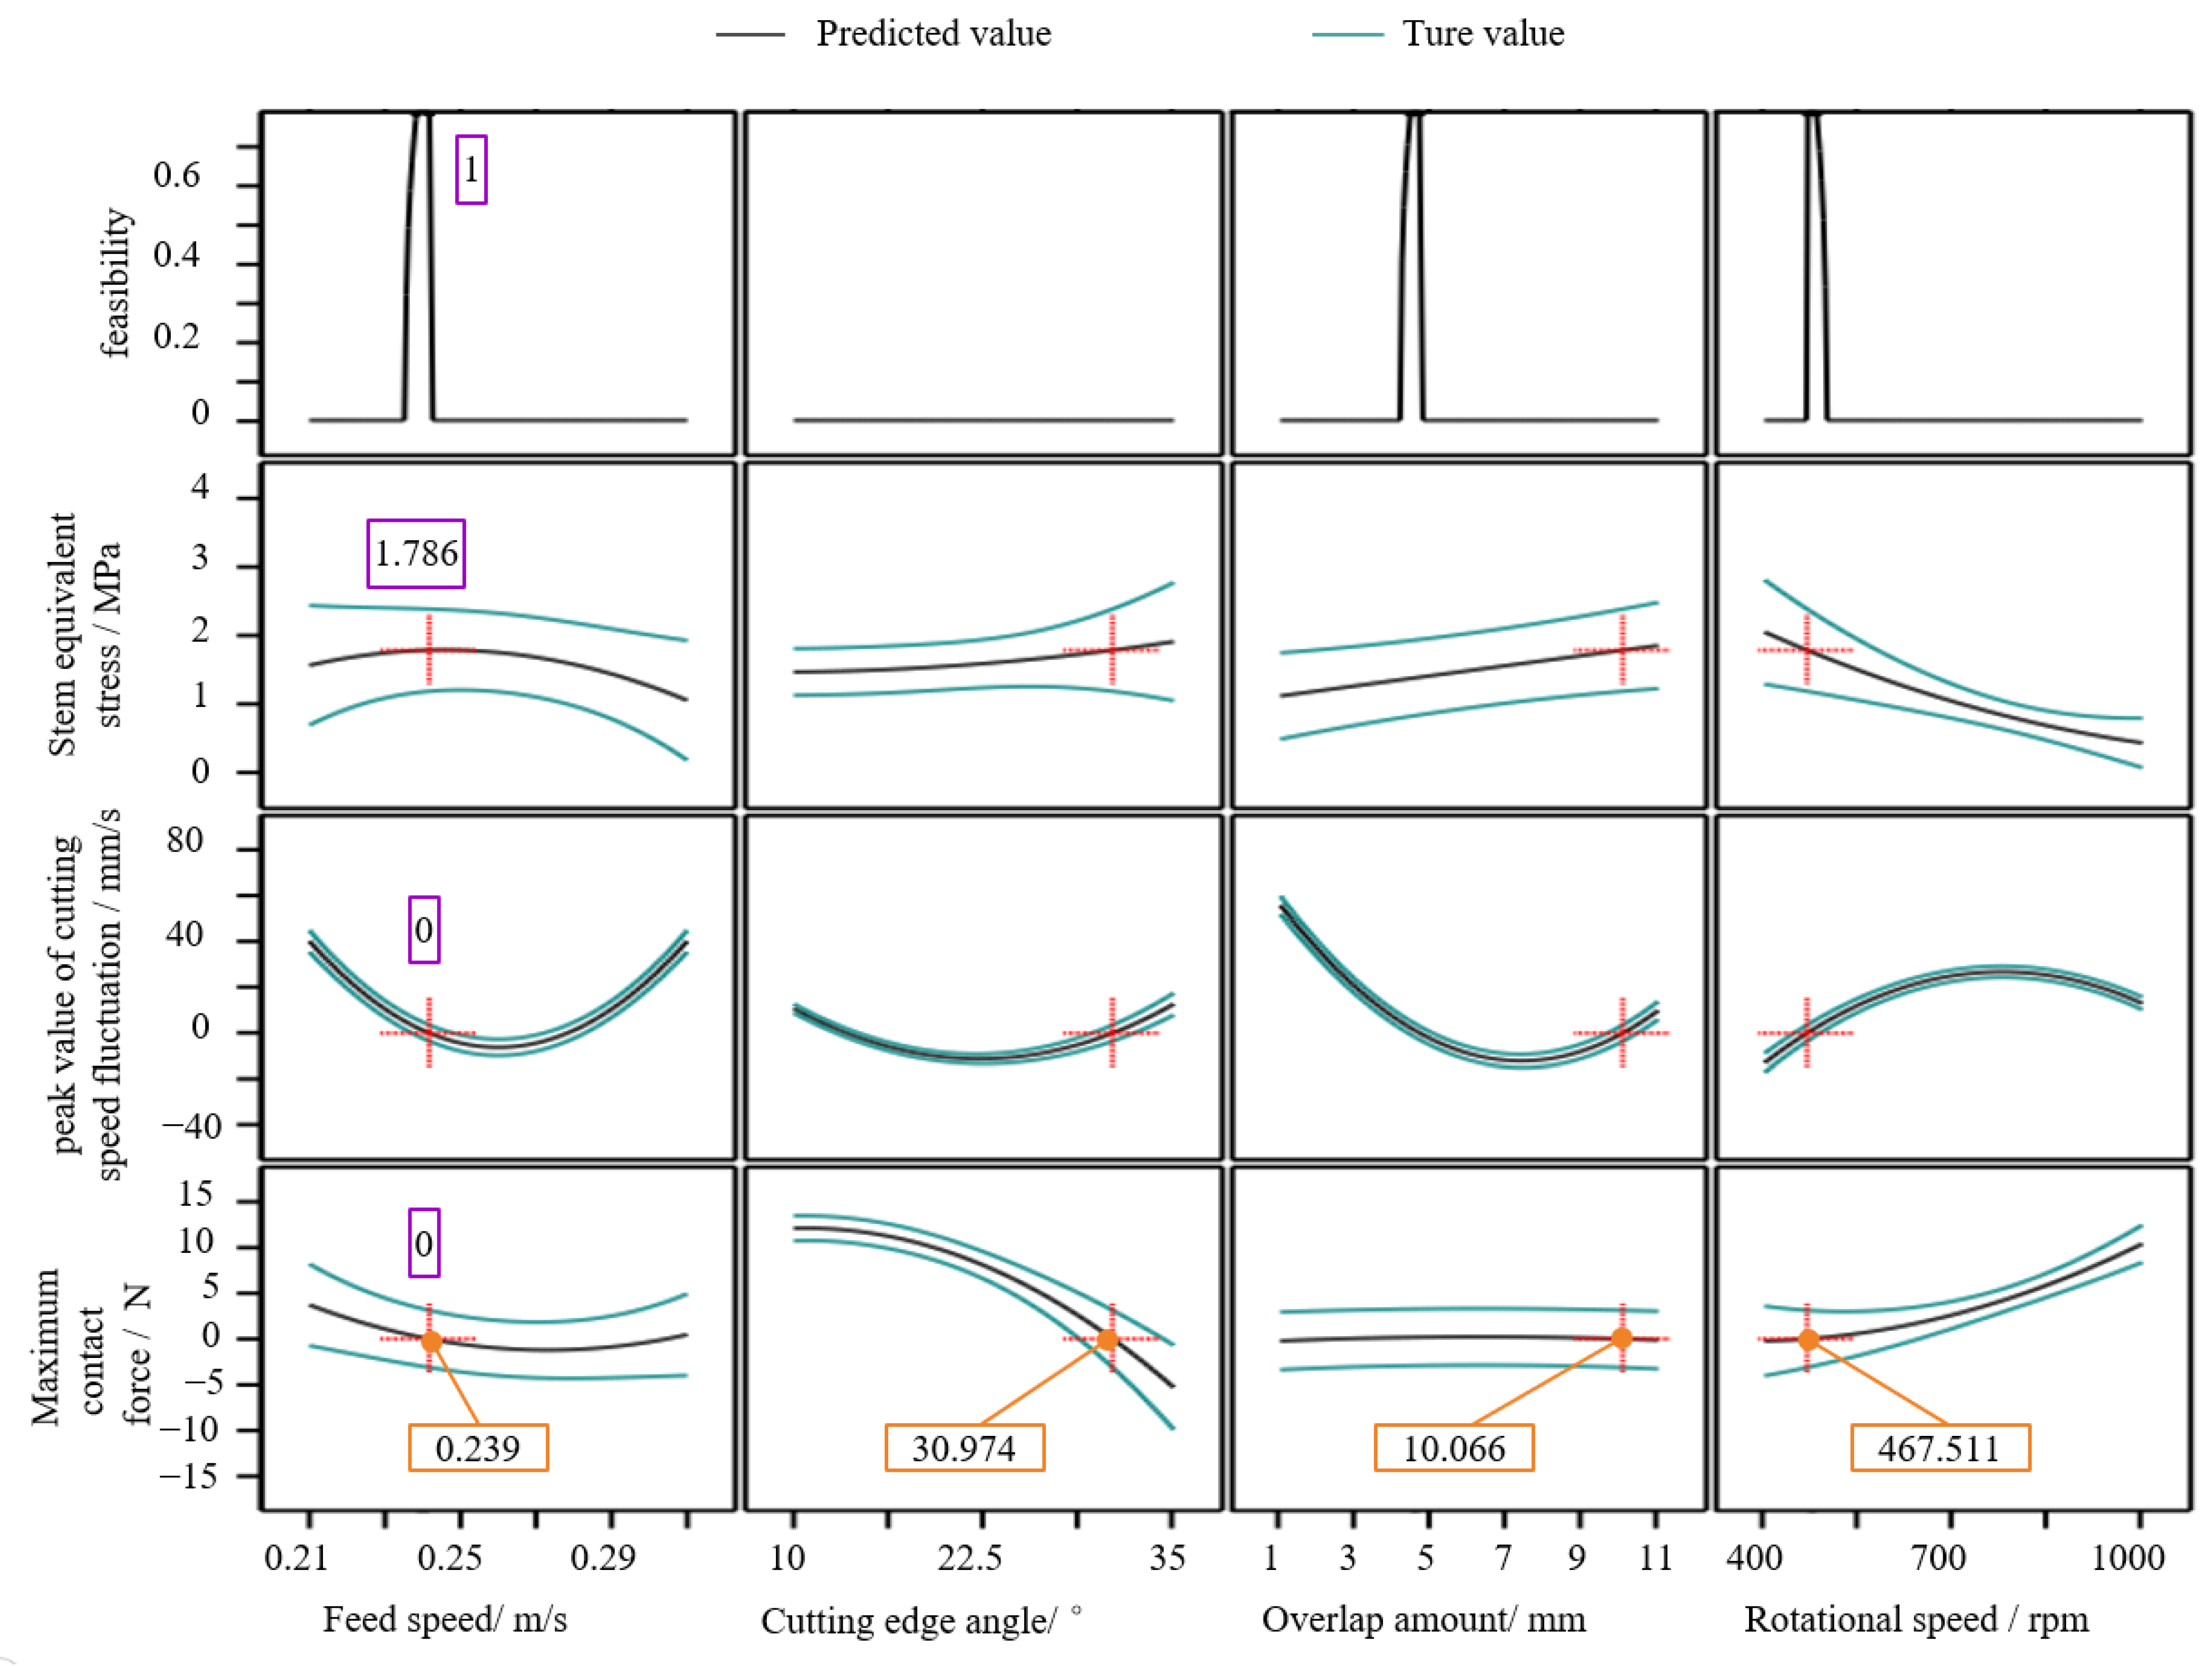
3.2.2. Multi-Factor Simulation Analysis
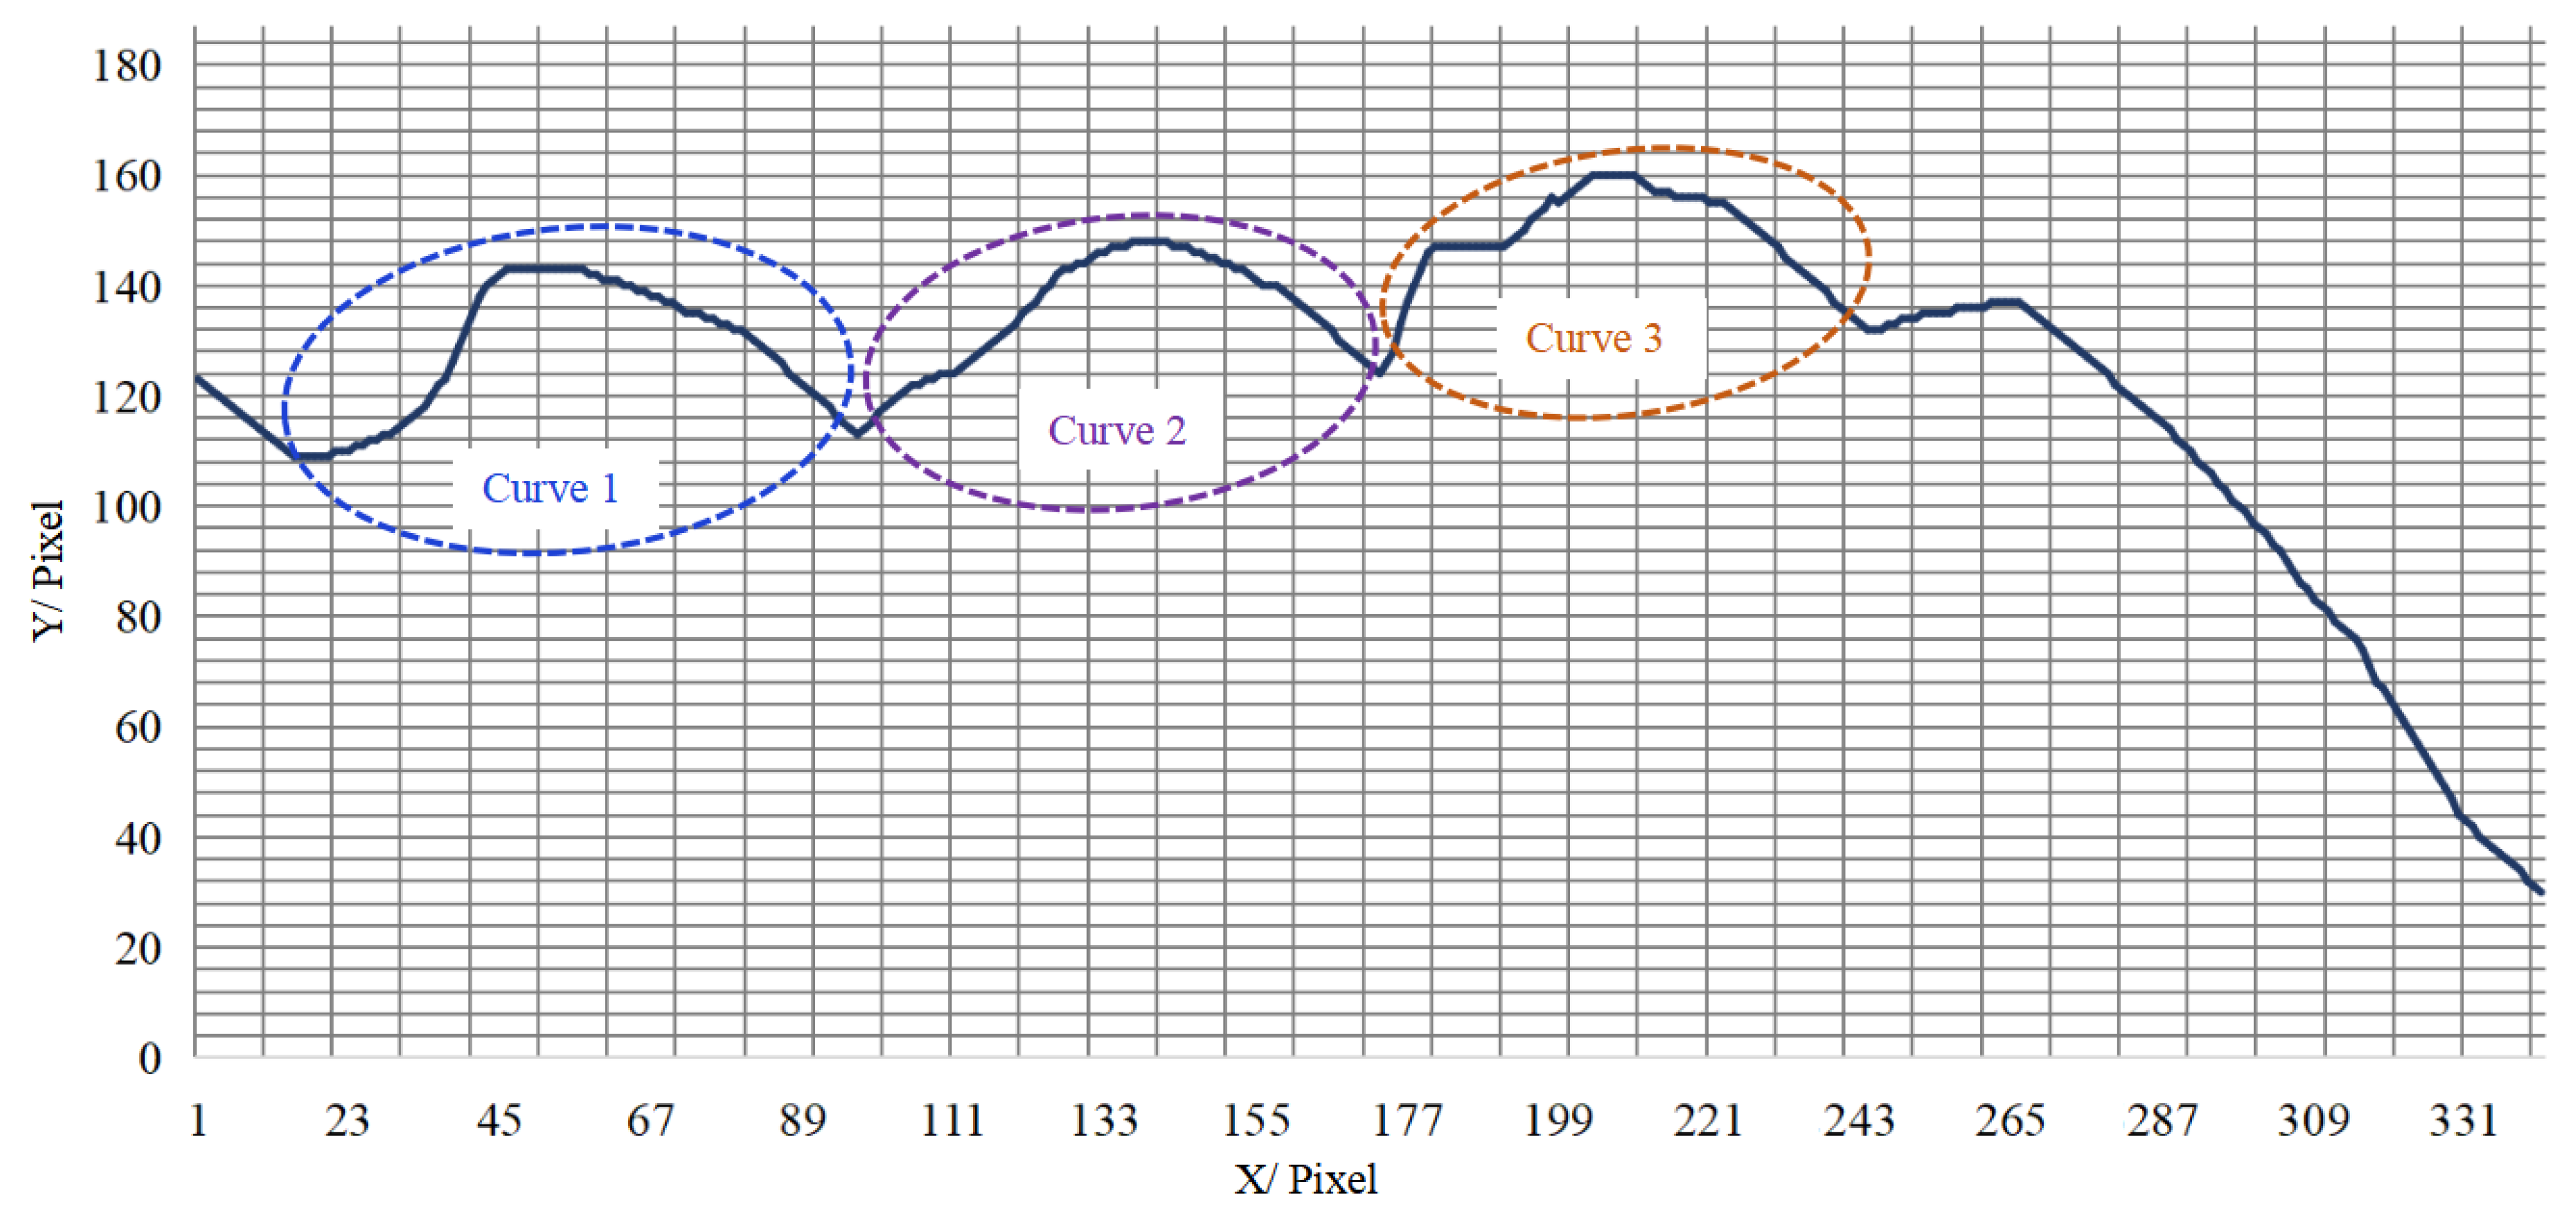
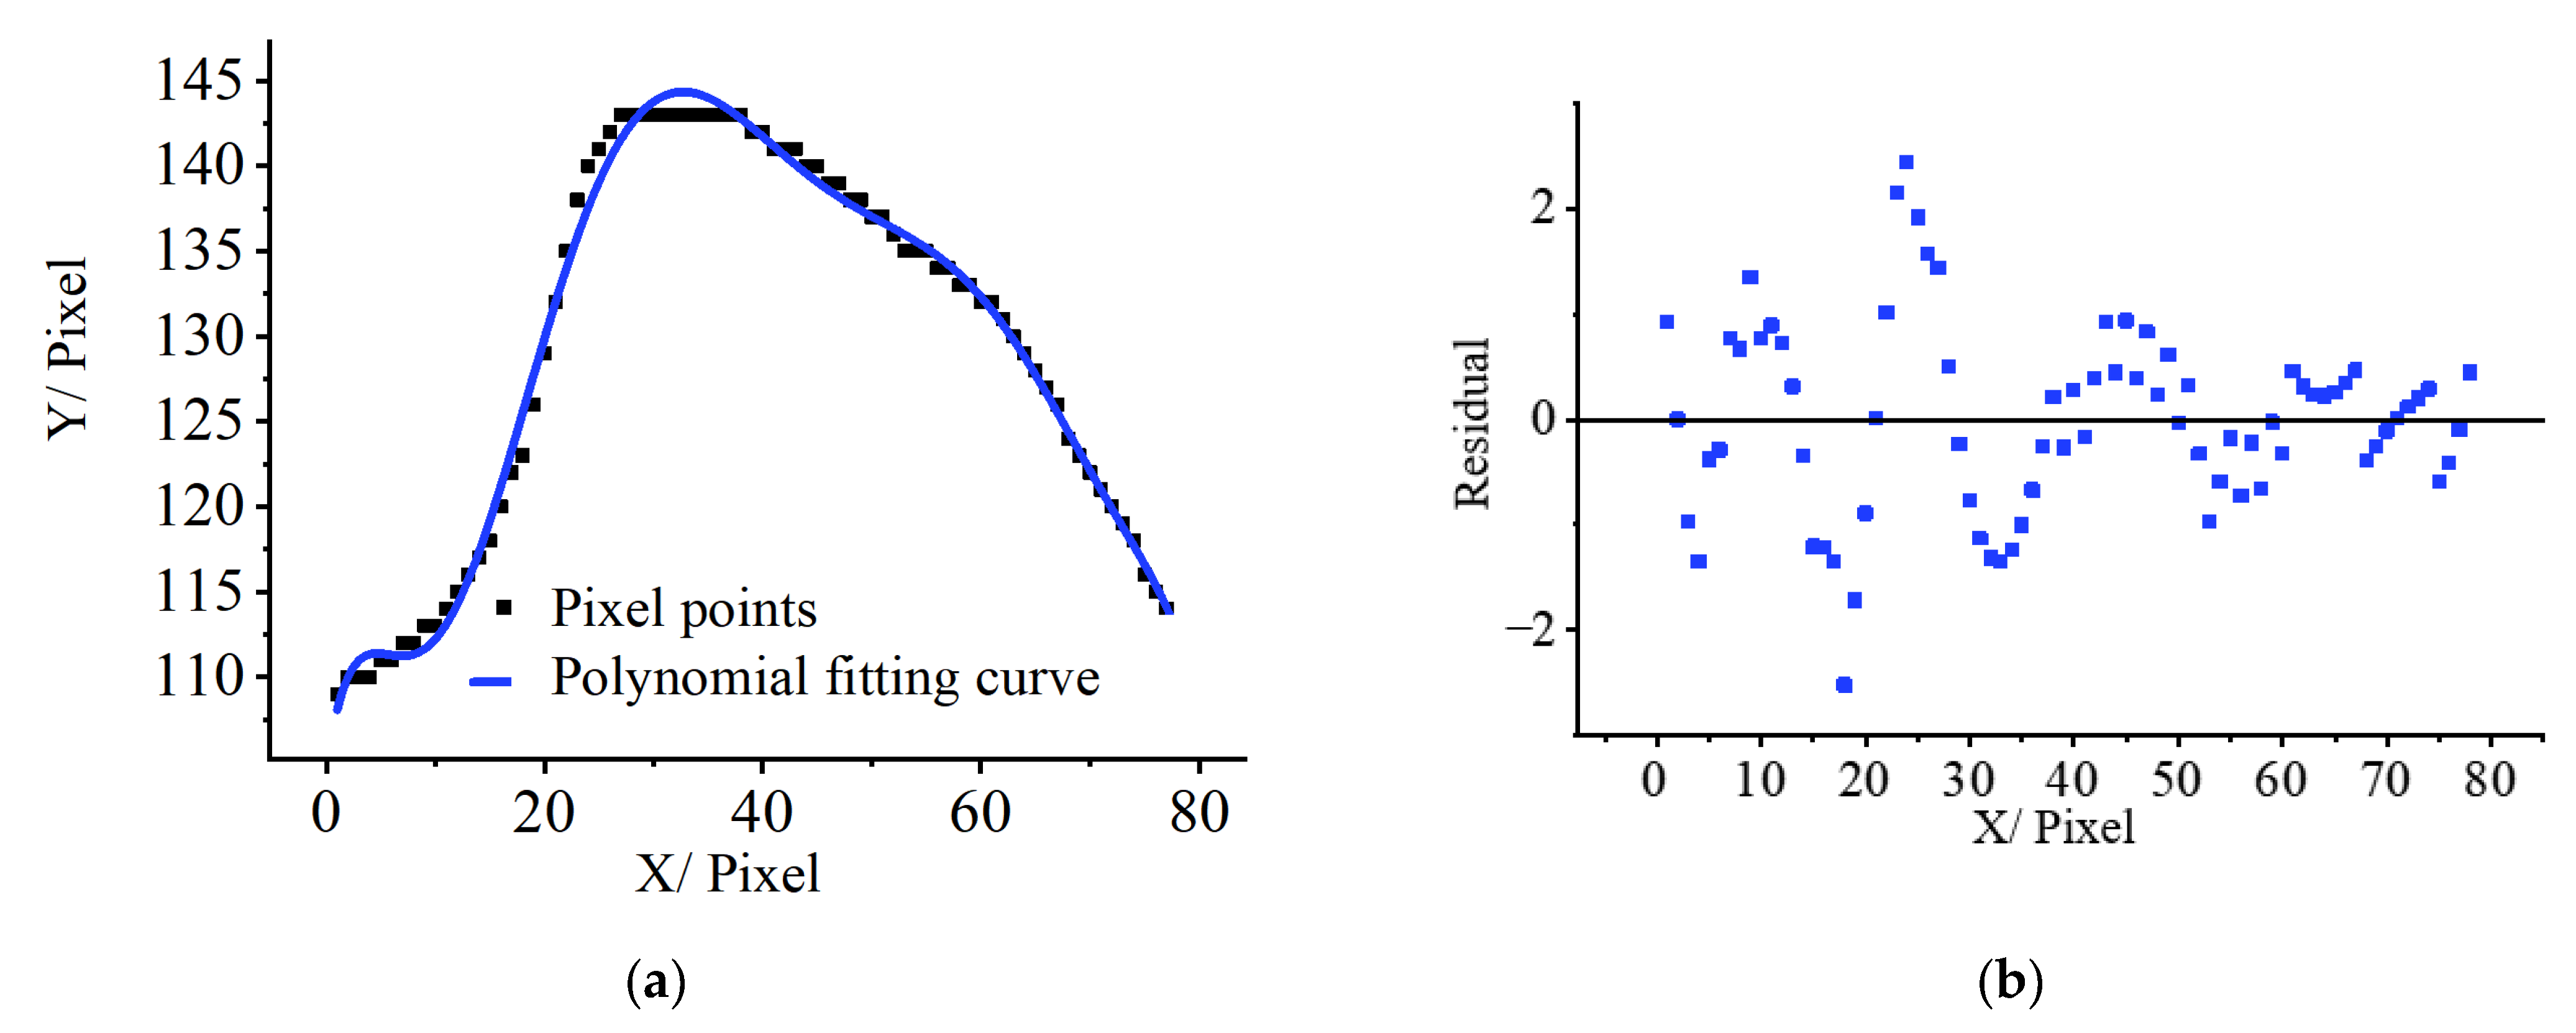
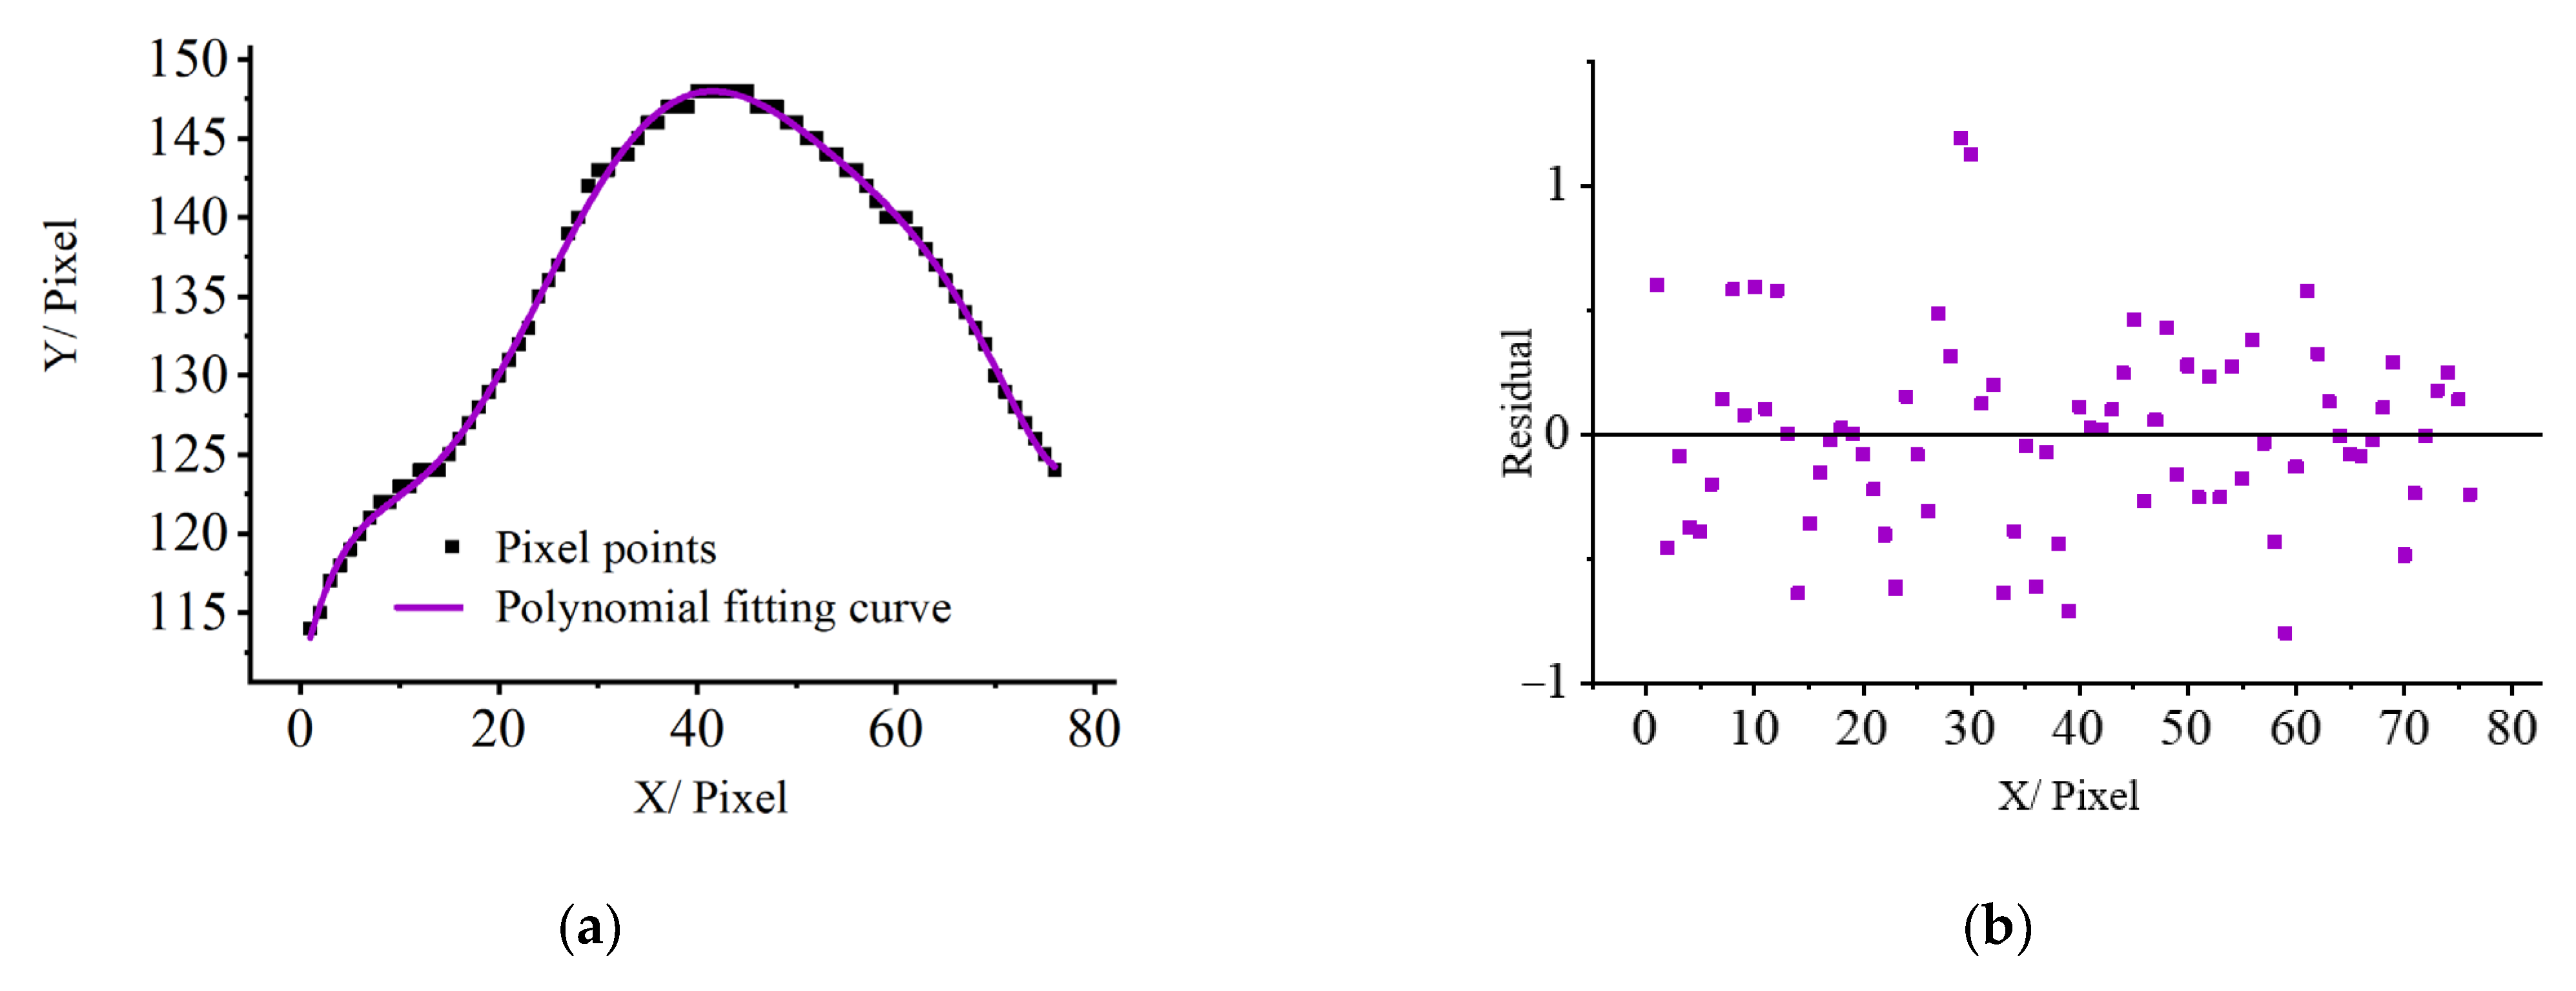
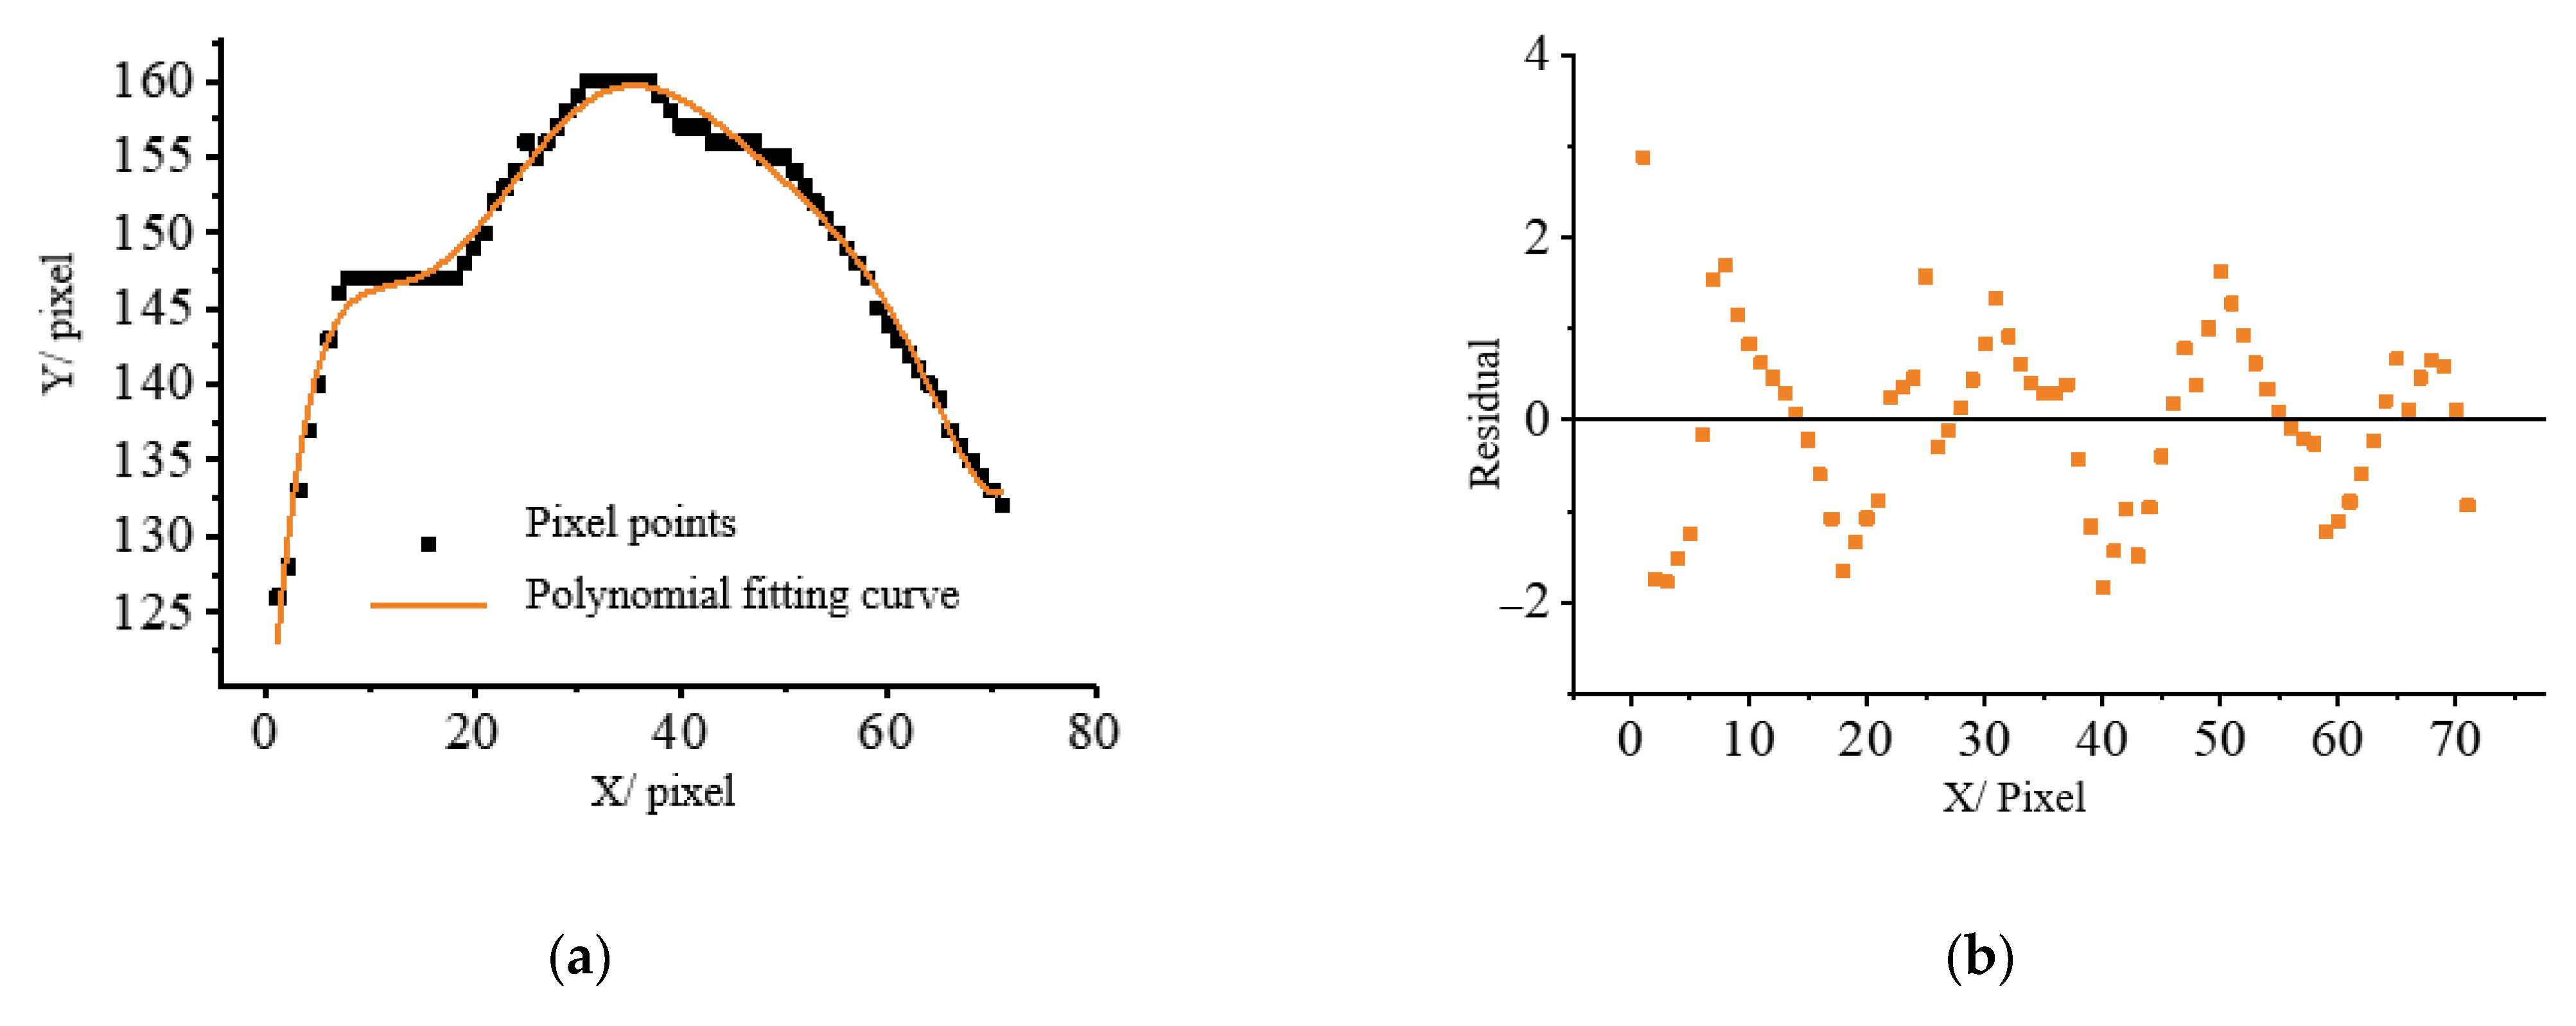
3.3. Analysis of the Bionic Cutter Blade Cutting Teeth Profile Curve
3.4. Design and Testing of Biomimetic Cutter
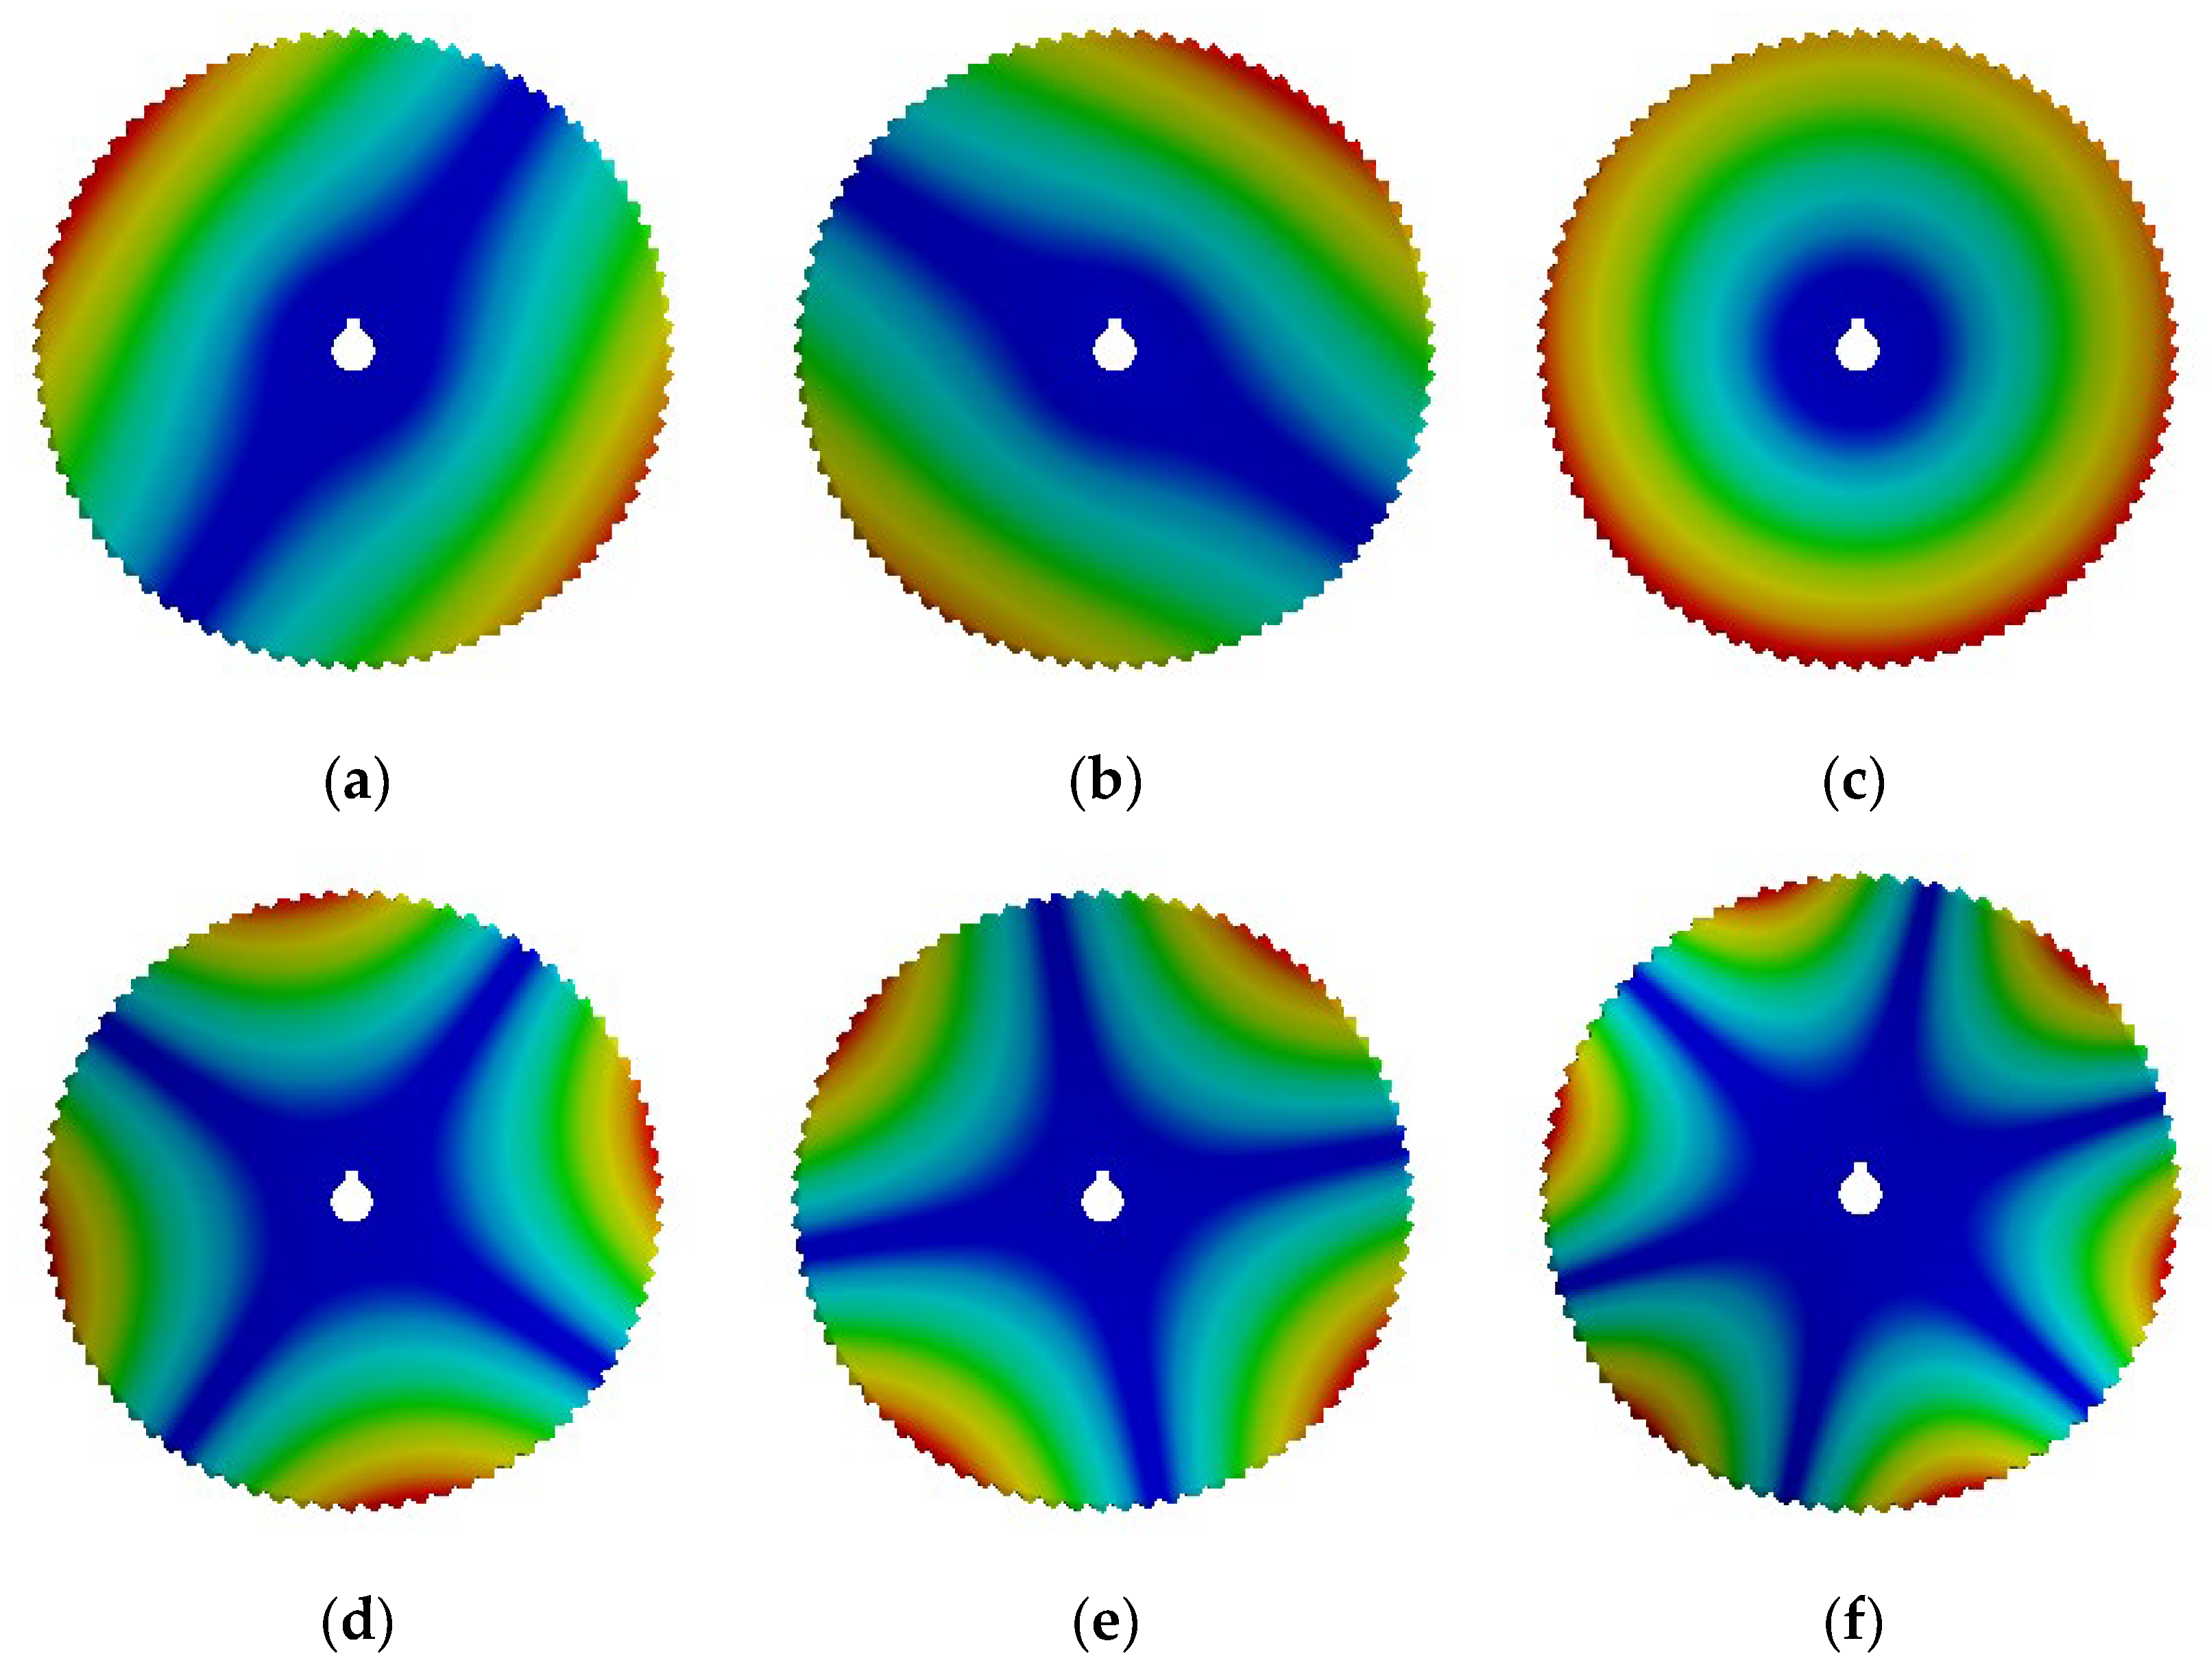
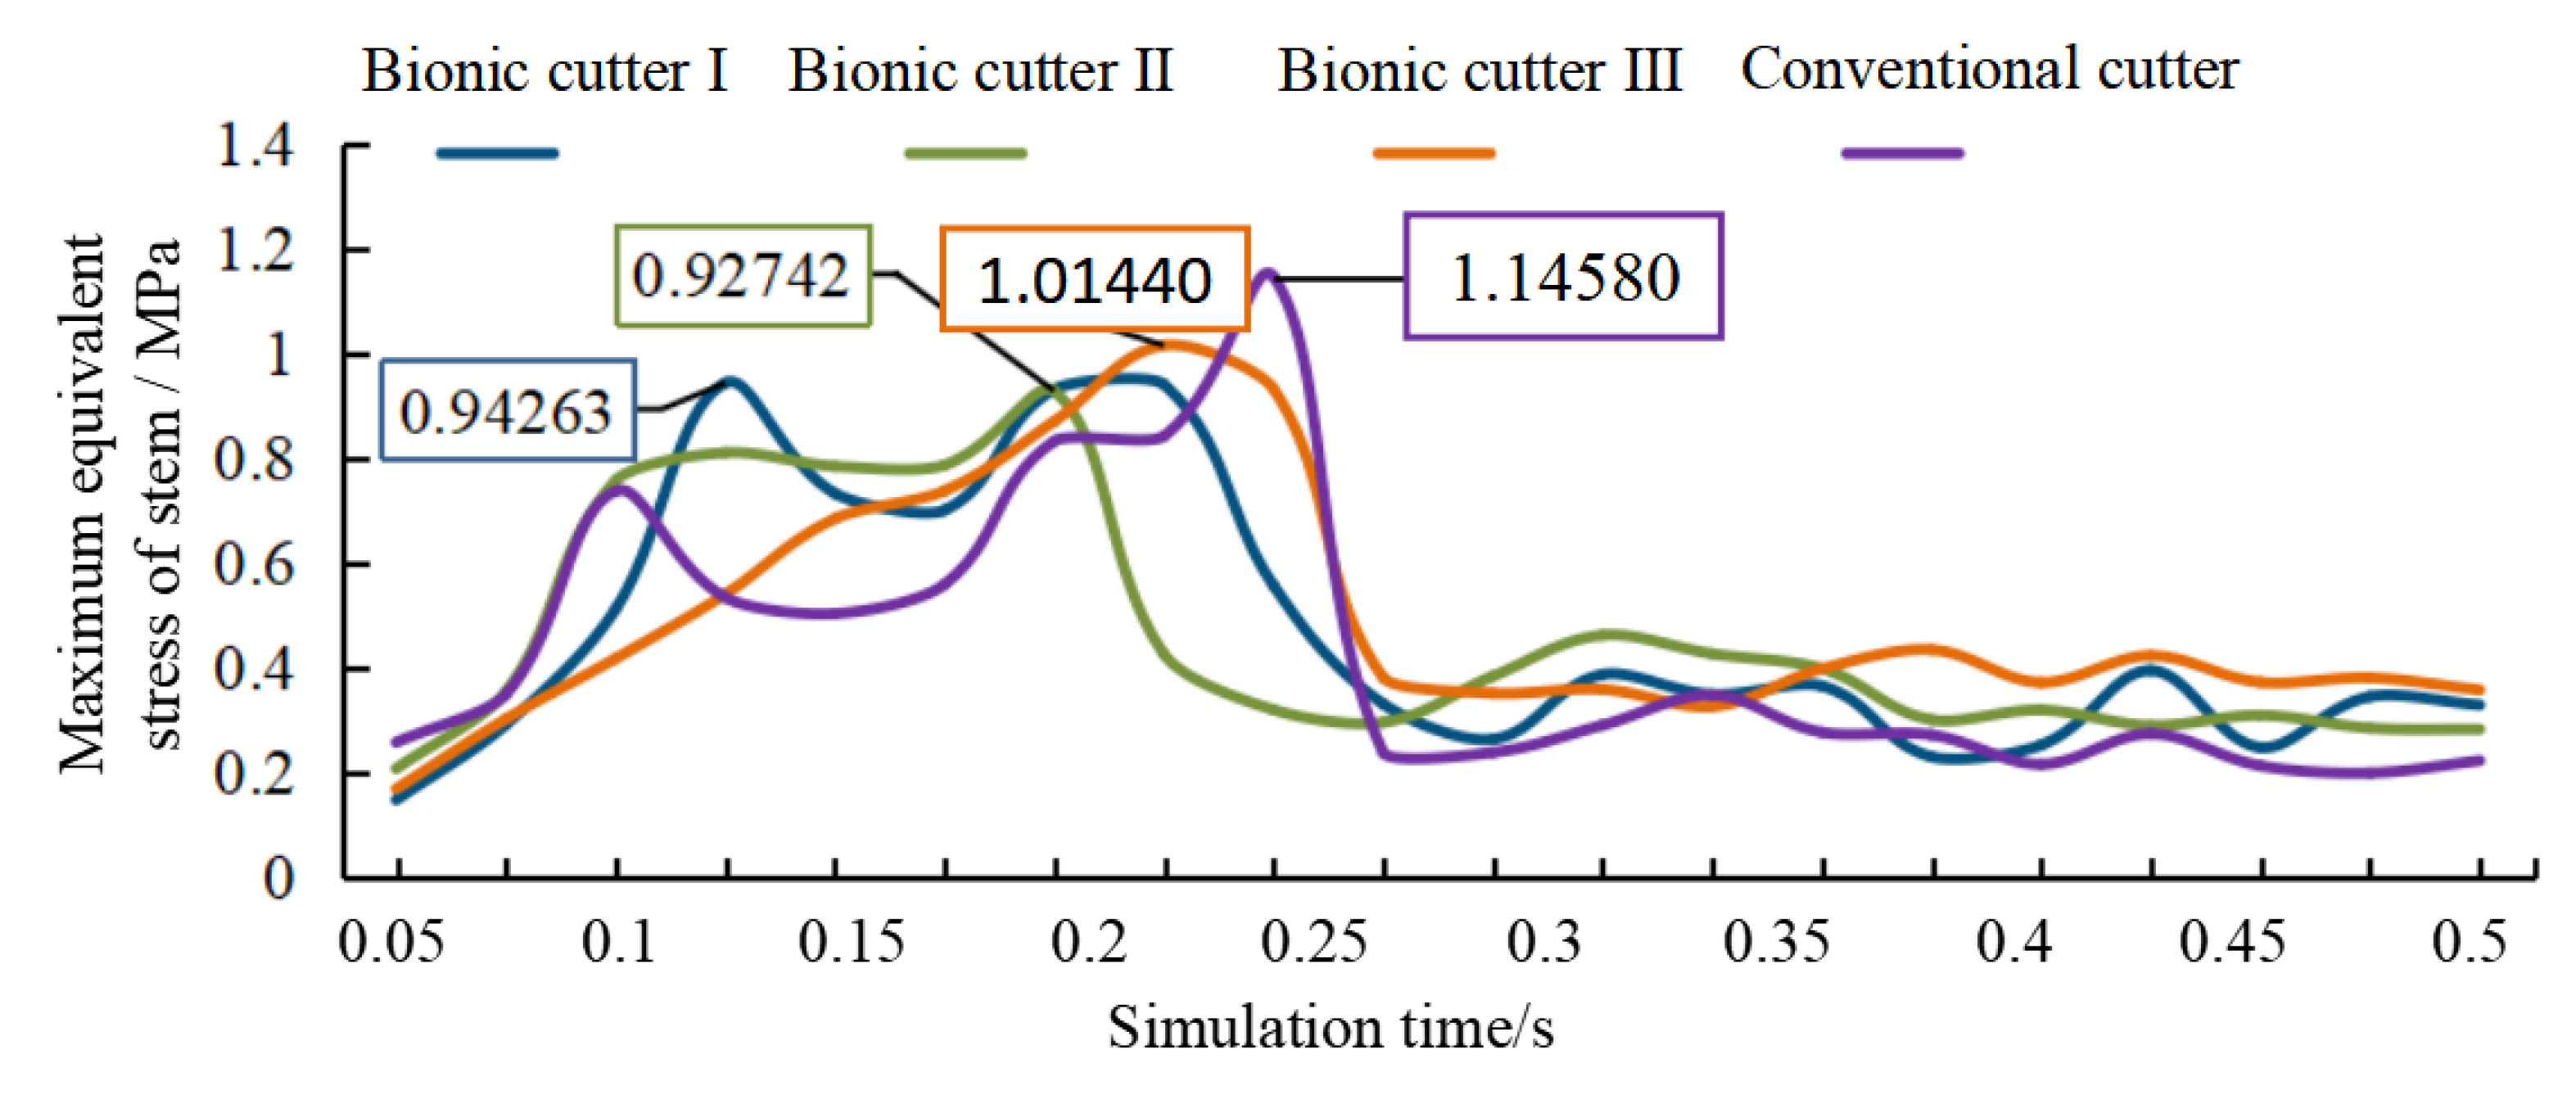
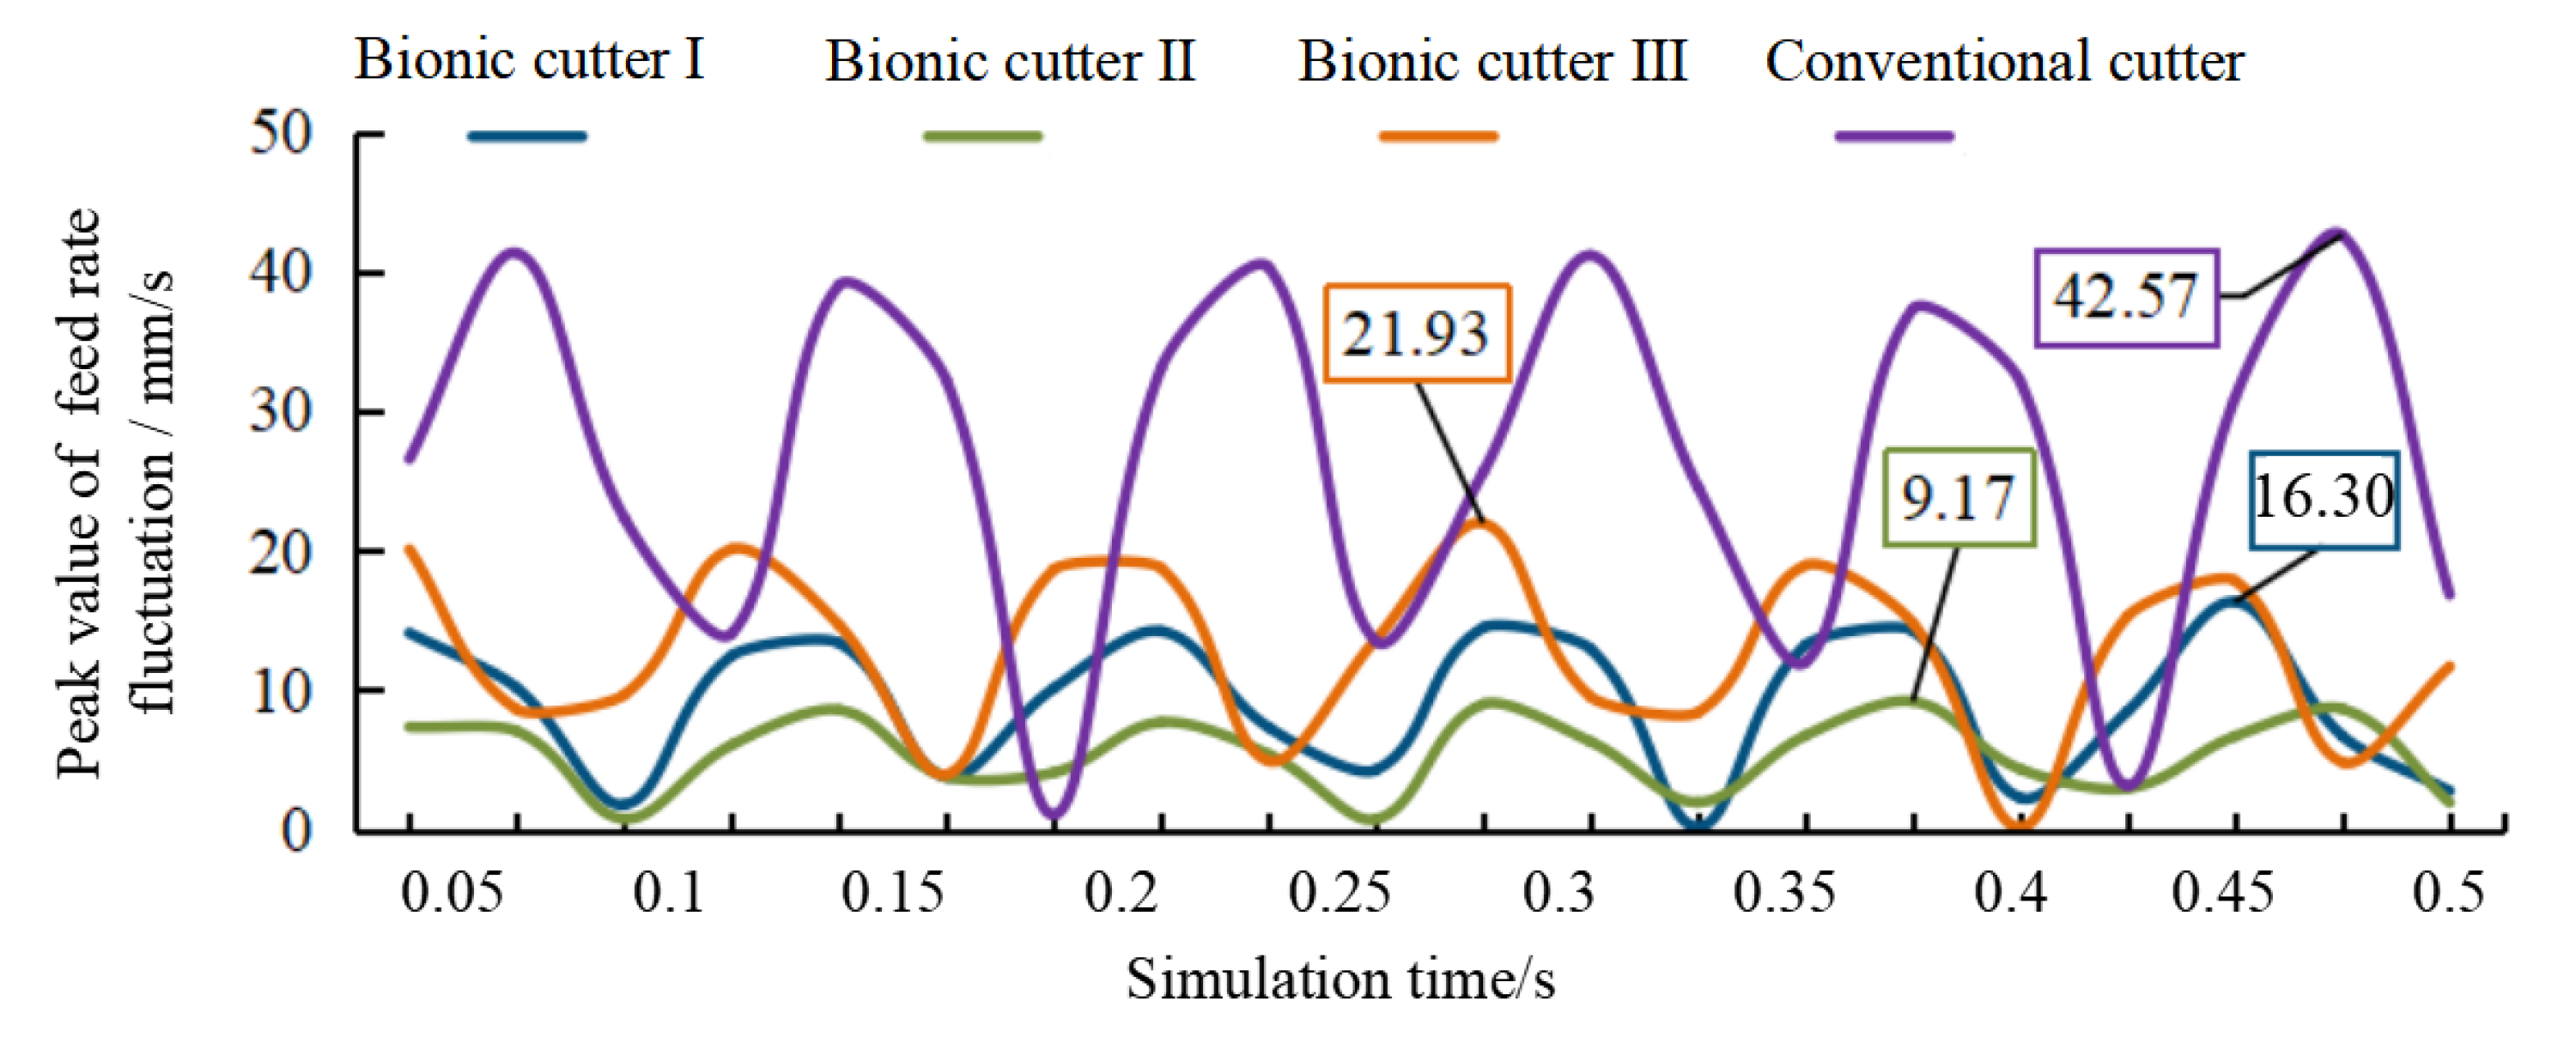
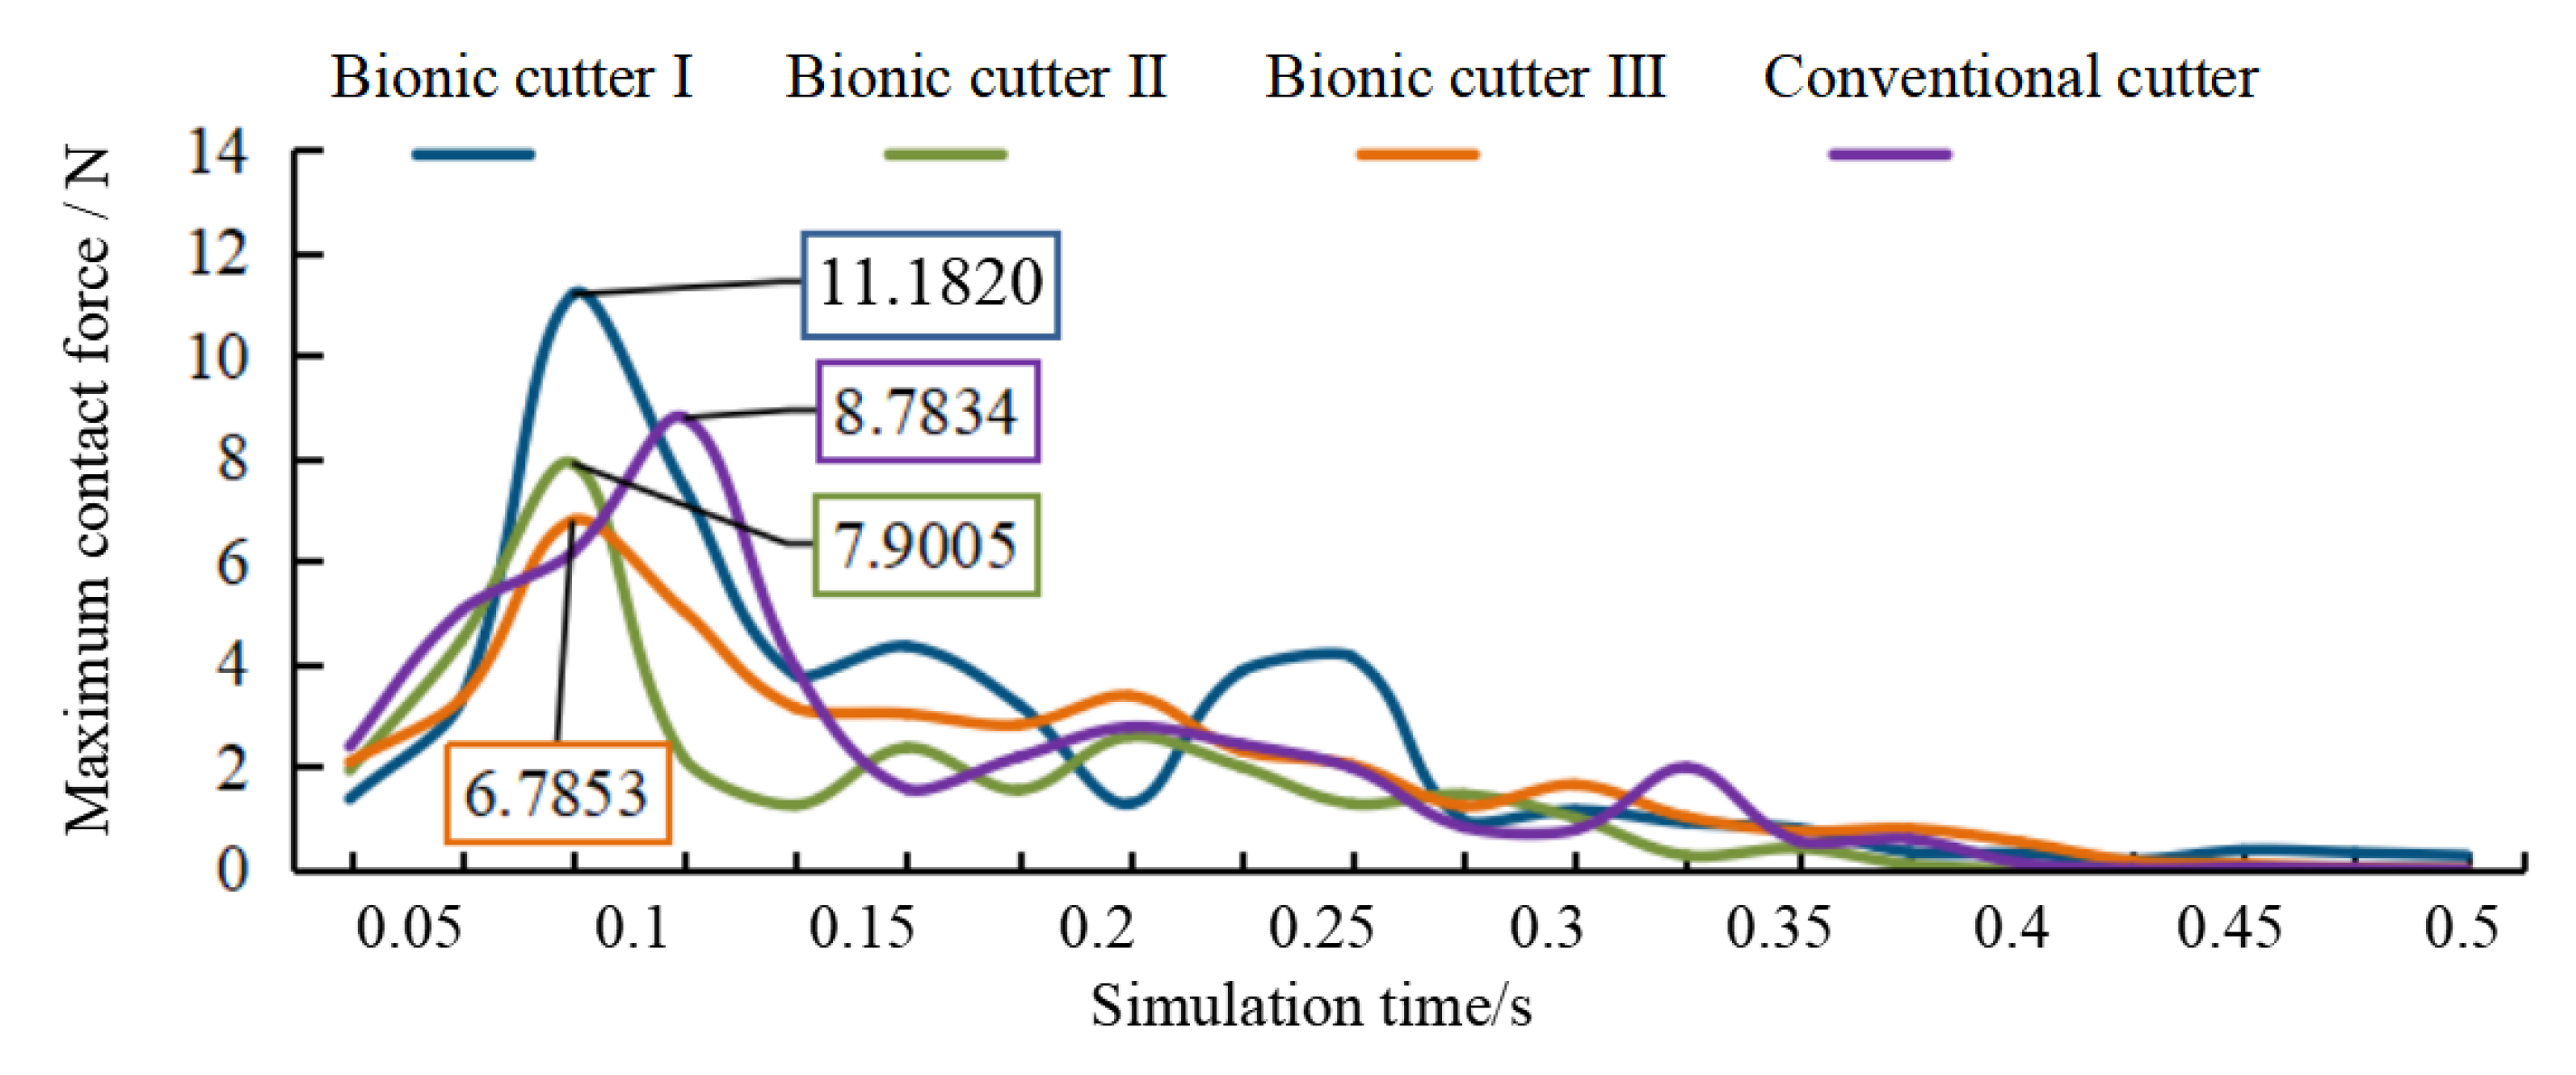
3.5. Biomimetic Cutter Cutting Simulation Analysis
3.6. Comparative Experimental Analysis of Test Benches
4. Conclusions
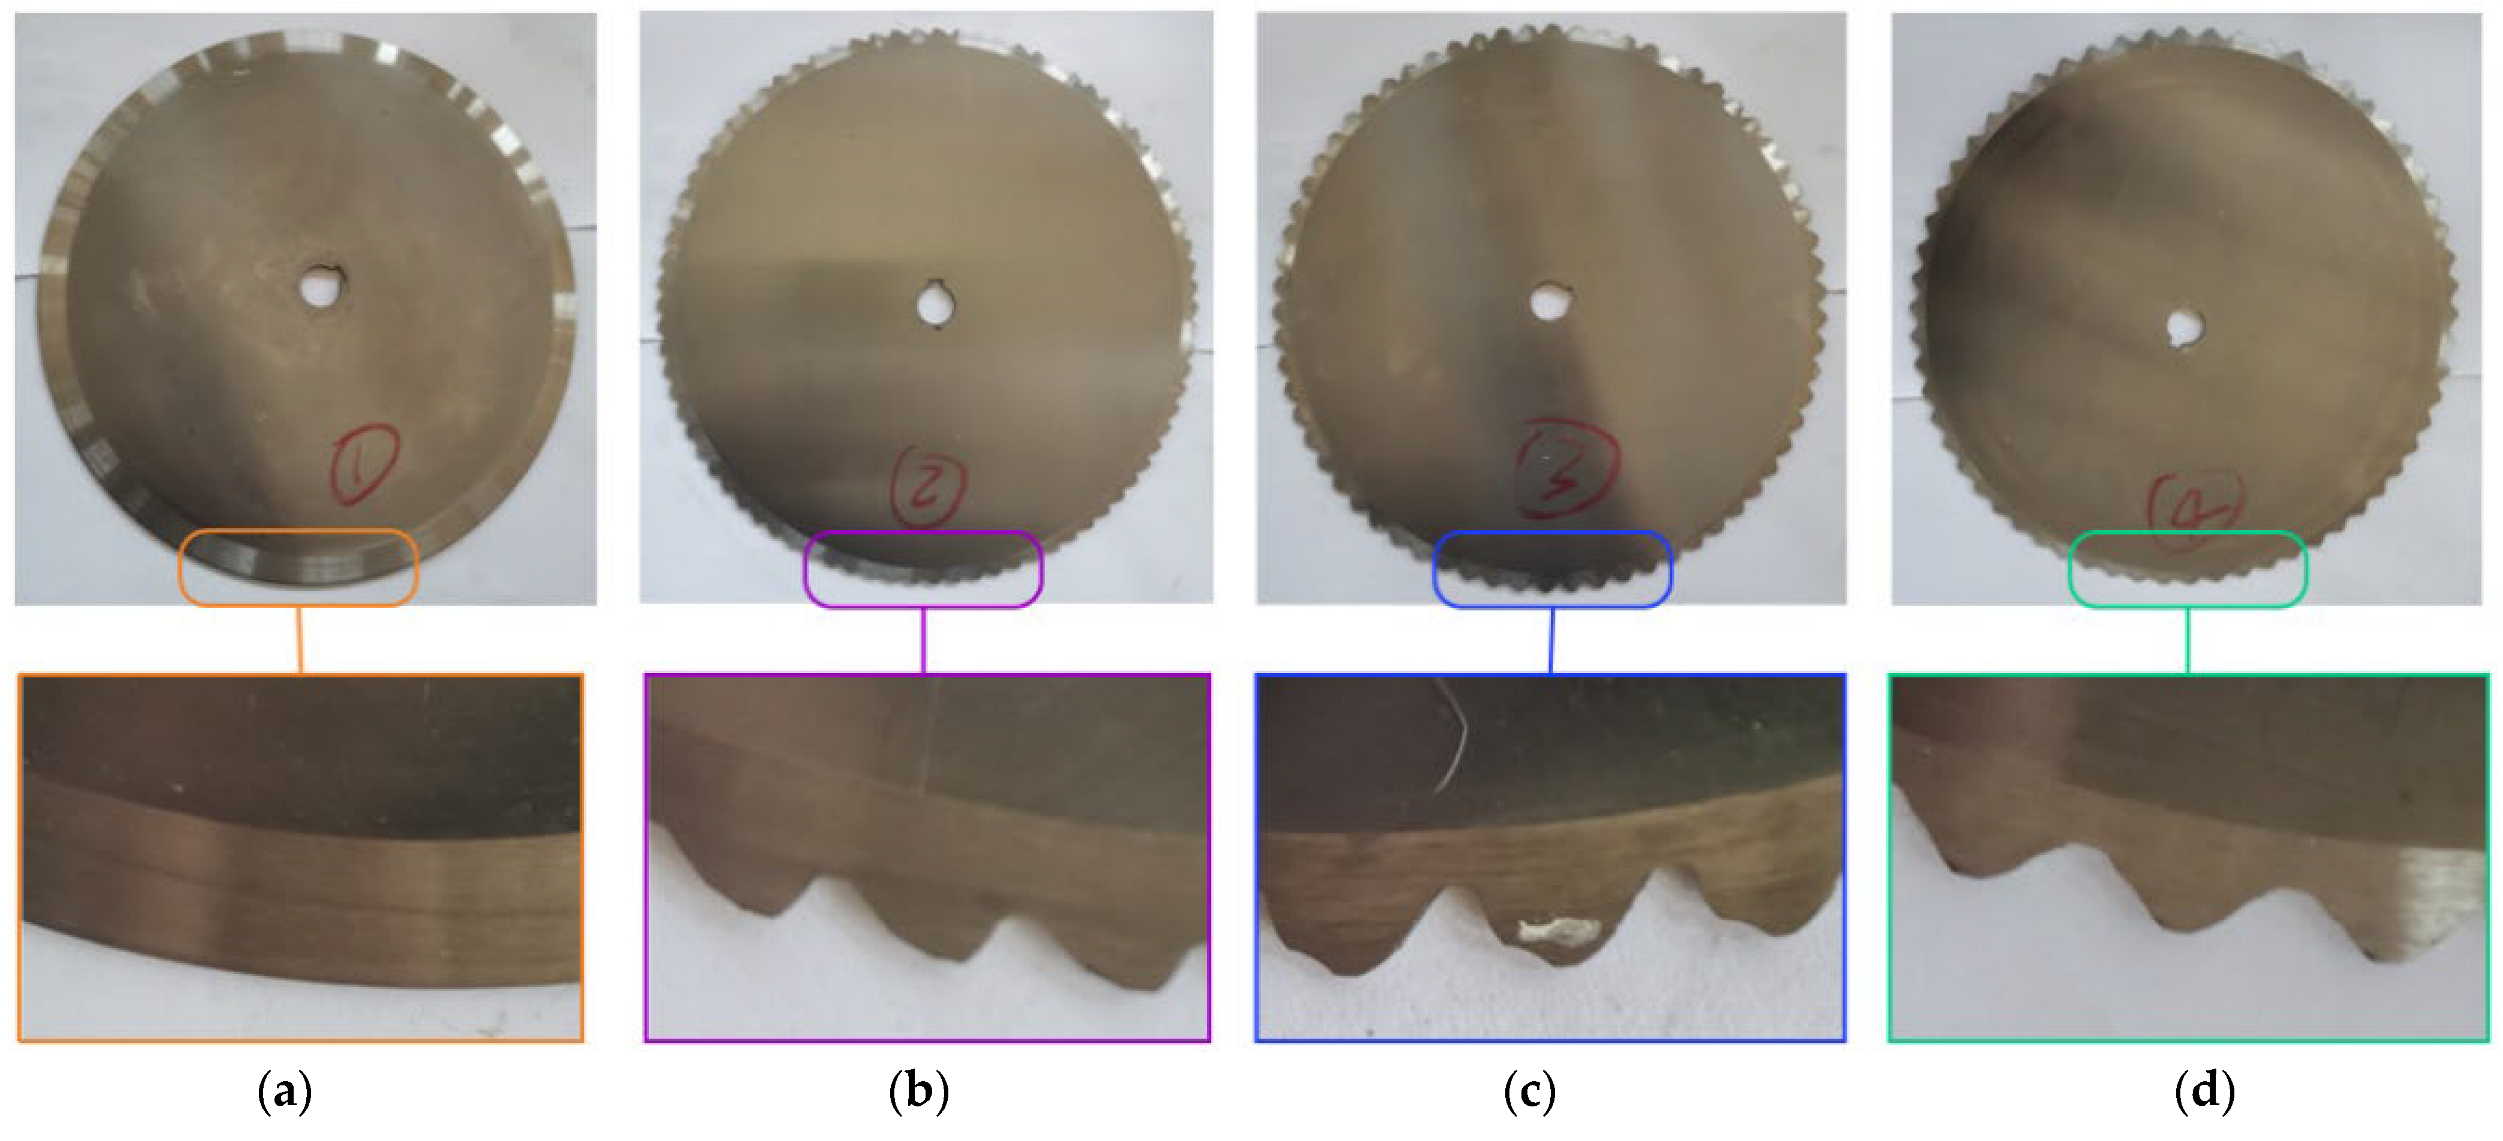
- Broccoli stalks and xylem contain strips of wood fibers in the xylem layer, which provide a higher degree of tensile and shear resistance than the other components; thus, the cutting of stalks with the xylem often creates problems of constant cutting or unequal cuts. In contrast, in nature, the serrated teeth of many animals have a good cutting effect on cellulose-rich crop stalks. Therefore, inspired by the shaped teeth of locust serrated edges, to optimize the cutting effect of broccoli stalks, this paper designs a bionic disc cutter with serrated edges to cut broccoli stalks.
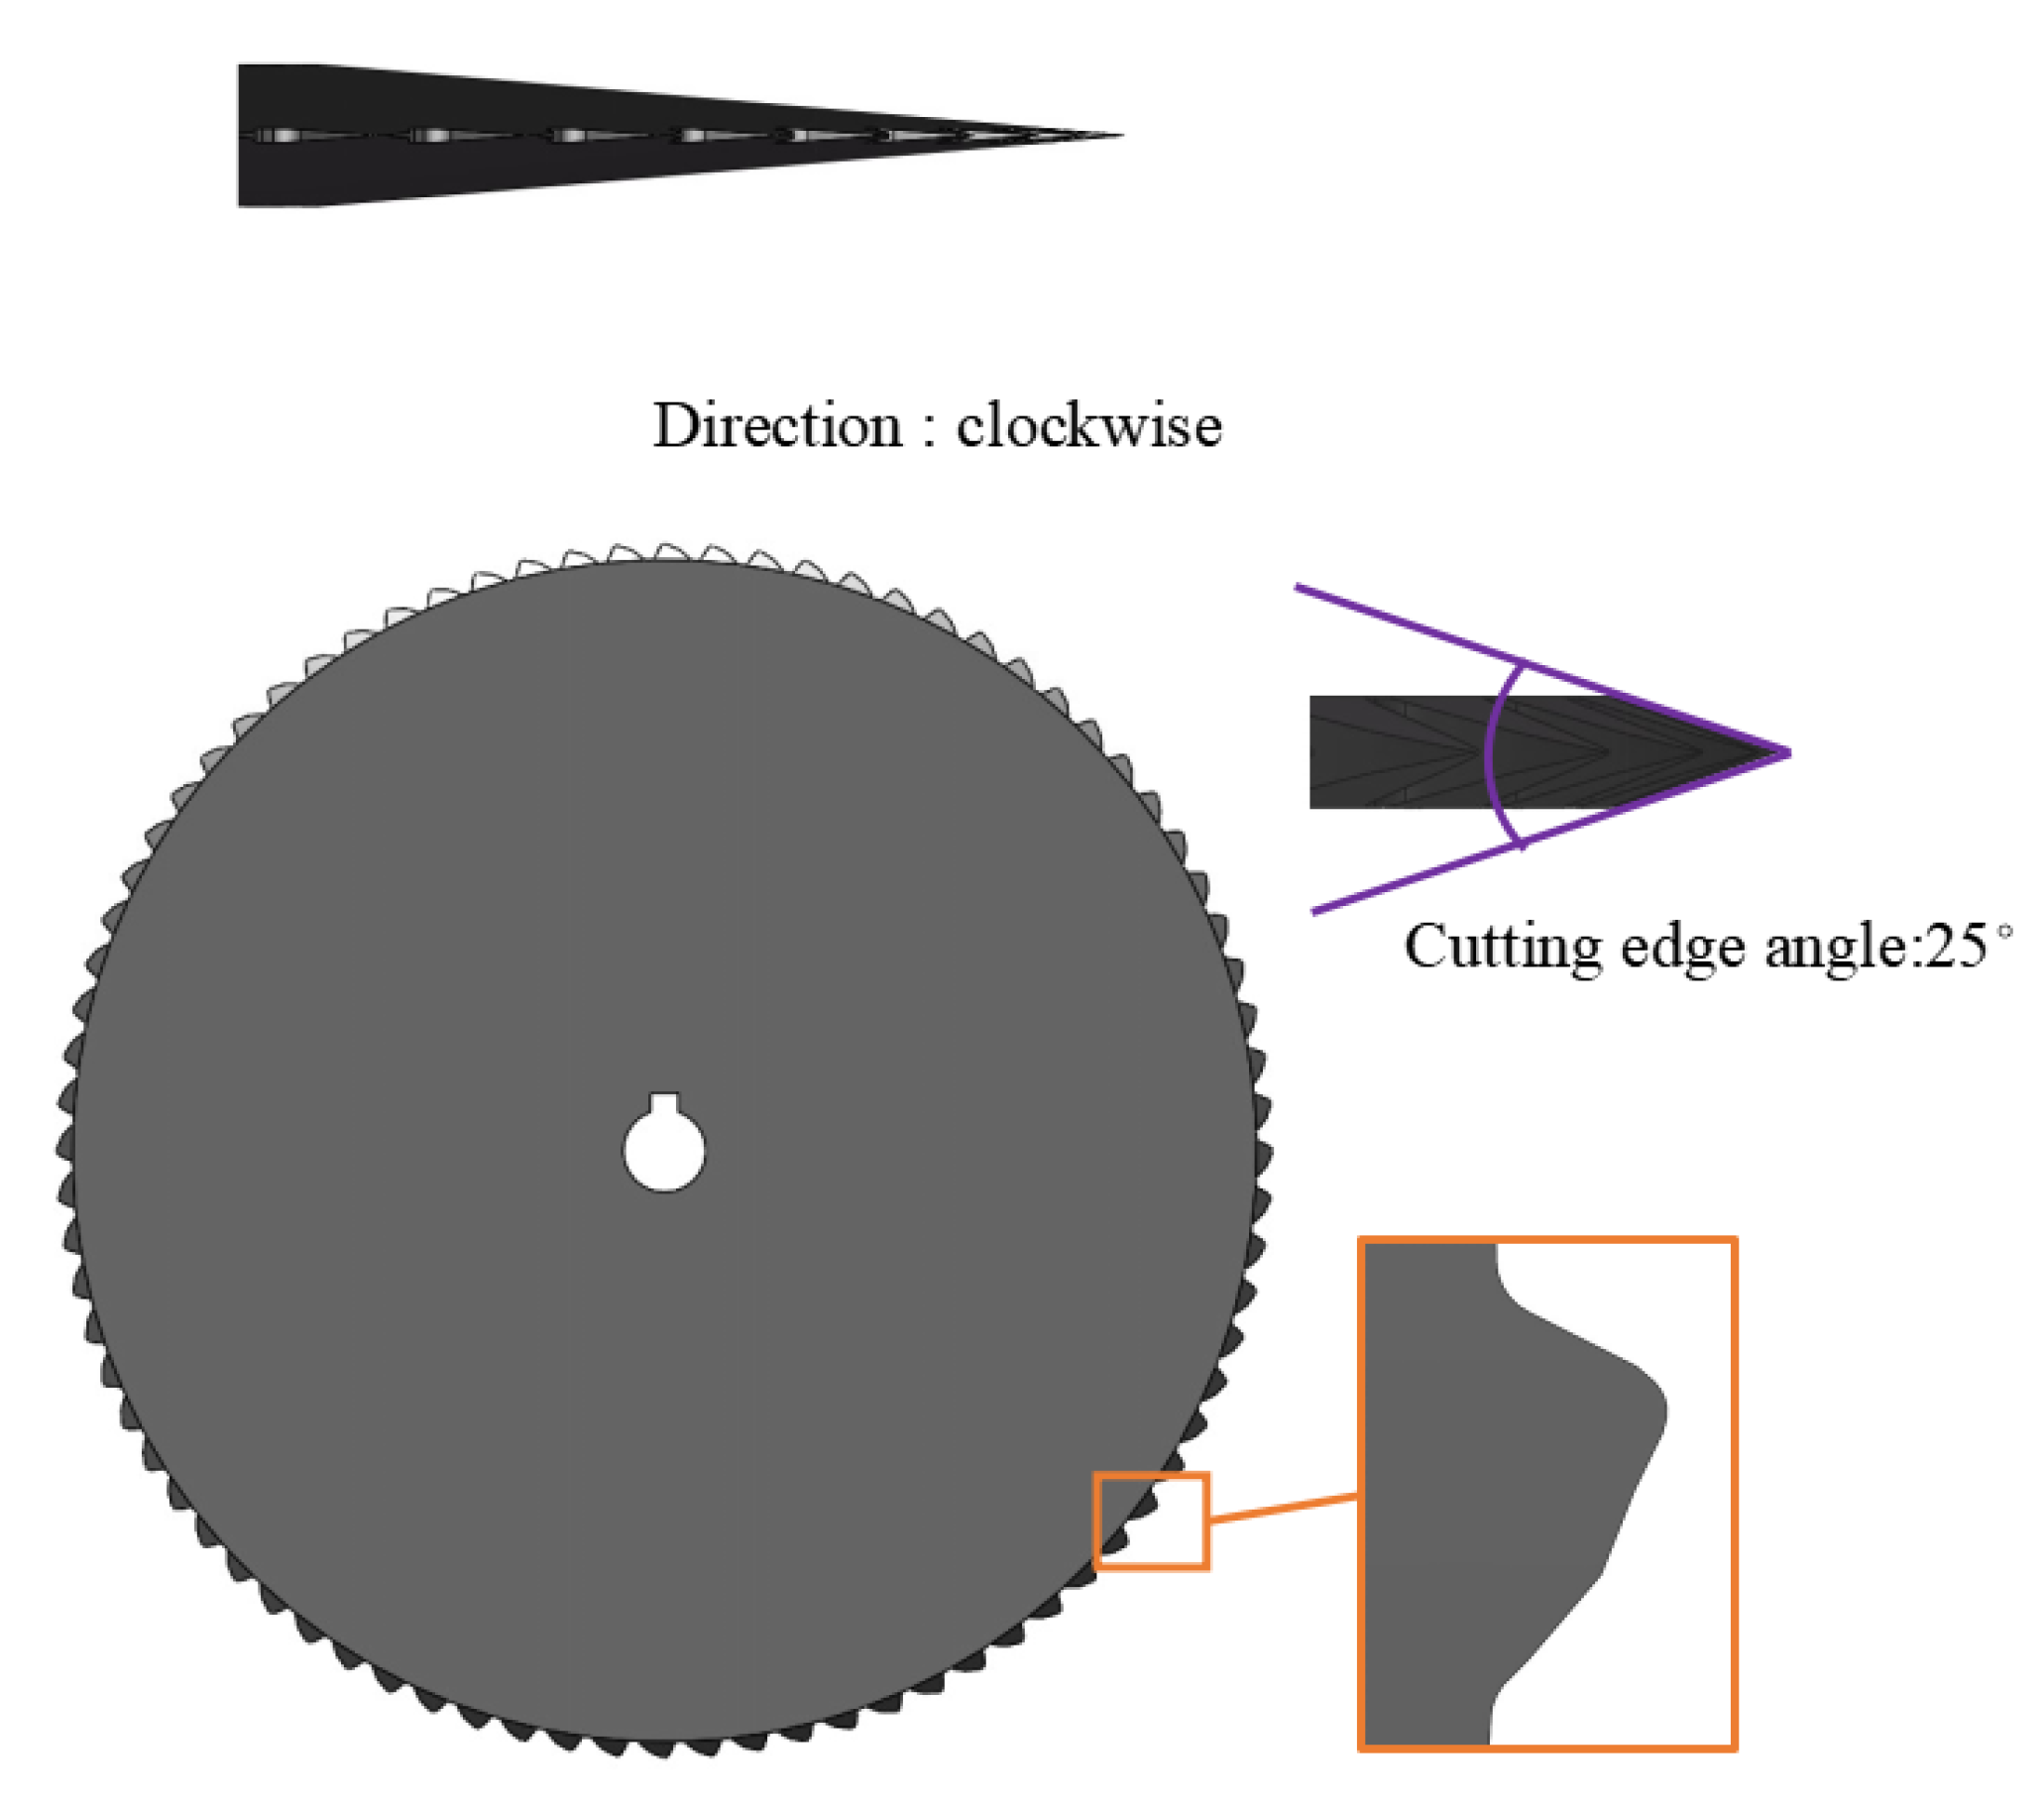
- The structure of the cutter edge that imitates the grasshopper-type upper jaw cutting teeth of the East Asian flying locust is an improvement on the original toothless cutter, and based on the contour curve of the locust’s upper jaw cutting teeth leaf, a regression equation is established to accurately fit the contour curve of the cutting teeth for designing the bionic cutter. The designed bionic cutter can provide a larger and more stable cutting force than the conventional toothless cutter, as well as a smoother operation of the cutting device and reduced wear and tear on the cutter.
- The results of the stalk-cutting tests indicated that the speed fluctuation of the conventional toothless disc knife cutting broccoli stalks was greater than that of the bionic knife: the conventional toothless knife repeatedly failed to cut the stalks several times, while the Bionic Cutter III had the best cutting effect and could be effectively used in the actual harvest.
Author Contributions
Funding
Data Availability Statement
Conflicts of Interest
References
- Paśko, P.; Zagrodzki, P.; Okoń, K.; Prochownik, E.; Krośniak, M.; Galanty, A. Broccoli Sprouts and Their Influence on Thyroid Function in Different In Vitro and In Vivo Models. Plants 2022, 11, 2750. [Google Scholar] [CrossRef]
- Li, Z.; Zheng, S.; Liu, Y.; Fang, Z.; Xu, D. Characterization of glucosinolates in 80 broccoli genotypes and different organs using uhplc-triple-tof-ms method. Food Chem. 2020, 334, 127519. [Google Scholar] [CrossRef] [PubMed]
- Loredana, L.; Francesca, M.; Florinda, F.; Filomena, N.; Paola, O.; Donatella, A. Effect of argon-enriched modified atmosphere on the over quality and bioactive compounds of ready-to-use broccoli rabe (Brassica rapa sylvestris L. var. esculenta) during the storage. Food Sci. Technol. Int. 2023, 29, 84–94. [Google Scholar] [CrossRef]
- Huang, J.; Liu, Y.; Han, F.; Ji, J. Genetic diversity and population structure analysis of 161 broccoli cultivars based on snp markers. Hortic. Plant J. 2021, 7, 423–433. [Google Scholar] [CrossRef]
- Antonio, C.; Moreno, D.A.; Periago, P.M.; Cristina, G.; Raúl, D. A new food ingredient rich in bioaccessible (poly)phenols (and glucosinolates) obtained from stabilized broccoli stalks. Foods 2022, 11, 1734. [Google Scholar]
- Du, Z.; Sheng, M. Determination of shearing force by measuring NDF and ADF in tea stems with hyperspectral imaging technique. IFAC Pap. 2018, 51, 849–854. [Google Scholar]
- Zhao, Y.F.; Tang, Z.; Chen, S.R. Loading Model and Mechanical Properties of Mature Broccoli (Brassica oleracea L. Var. Italica Plenck) Stems at Harvest. Agriculture 2022, 12, 1519. [Google Scholar] [CrossRef]
- Oliveira, M.; Abadias, M.; Vinas, I.; Usall, J.; Torres, R.; Teixido, N. Application of modified atmosphere packaging as a safety approach to fresh-cut fruits and vegetables—A review. Trends Food Sci. Technol. 2015, 46, 13–26. [Google Scholar] [CrossRef]
- Cui, S.Q.; Yu, X.L.; Chen, Y.; Zhang, J.L.; Liu, G.M. Bacterial Diversity and Dominant Spoilage Microorganisms in Fresh-Cut Broccoli. Appl. Sci. 2022, 12, 3370. [Google Scholar] [CrossRef]
- Guan, Y.; Hu, W.; Jiang, A.; Xu, Y.; Yu, J.; Zhao, M.; Ji, Y.; Feng, K.; Sarengaowa; Yang, X. Influence of cut type on quality, antioxidant substances and antioxidant activity of fresh-cut broccoli. Int. J. Food Sci. Technol. 2020, 55, 3019–3030. [Google Scholar] [CrossRef]
- Taghinezhad, J.; Alimardani, R.; Jafary, A. Models of mechanical cutting parameters in terms of moisture content and cross section area of sugarcane stalks. Agric. Eng. Int. CIGR J. 2014, 16, 280–288. [Google Scholar]
- Yinggang, O.; Wegener, M.; Dantong, Y.; Qingting, L.; Dingke, Z.; Meimei, W.; Haochun, L. Mechanization technology: The key to sugarcane production in china. Int. J. Agric. Biol. Eng. 2013, 6, 1–27. [Google Scholar]
- Xu, L.; Yao, H. Research on shear characteristics of chinese cabbage rootstalk. Agric. Mech. Asia Afr. Lat. Am. 2009, 40, 30–34. [Google Scholar]
- Du, D.D.; Wang, J.; Qiu, S.S. Analysis and test of splitting failure in the cutting process of cabbage root. Int. J. Agric. Biol. Eng. 2015, 8, 27–34. [Google Scholar]
- Igathinathane, C.; Womac, A.R.; Sokhansanj, S. Corn stalk orientation effect on mechanical cutting. Biosyst. Eng. 2010, 107, 97–106. [Google Scholar] [CrossRef]
- Tian, K.P.; Li, X.; Zhang, B.; Chen, Q.M.; Shen, C.; Huang, J.C. Design and Test Research on Cutting Blade of Corn Harvester Based on Bionic Principle. Appl. Bionics Biomech. 2017, 2017, 6953786. [Google Scholar] [CrossRef] [Green Version]
- Meyers, M.; Lin, A.; Lin, Y. The cutting edge: Sharp biological materials. JOM 2008, 60, 19–24. [Google Scholar] [CrossRef]
- Wang, J.W.; Guan, R.; Gao, P.X.; Zhou, W.Q.; Tang, H. Design and Experiment of Single Disc to Top Cutting Device for Carrot Combine Harvester. Nongye Jixie Xuebao/Trans. Chin. Soc. Agric. Mach. 2020, 51, 73–81. [Google Scholar]
- Tang, H.; Jiang, Y.; Wang, J.; Guan, R.; Zhou, W. Bionic design and parameter optimization of rotating and fixed stem- and leaf-cutting devices for carrot combine harvesters. Math. Probl. Eng. 2021, 2021, 8873965. [Google Scholar] [CrossRef]
- Guan, C.S.; Fu, J.J.; Xu, L.; Jiang, X.Z.; Wang, S.L.; Cui, Z.C. Study on the reduction of soil adhesion and tillage force of bionic cutter teeth in secondary soil crushing. Biosyst. Eng. 2022, 213, 133–147. [Google Scholar] [CrossRef]
- Zhao, J.; Guo, M.; Lu, Y.; Huang, D.; Zhuang, J. Design of bionic locust mouthparts stubble cutting device. Int. J. Agric. Biol. Eng. 2020, 13, 20–28. [Google Scholar] [CrossRef]
- Wang, M.; Yan, B.; Zhang, S.; Fan, P.; Zeng, P.; Shi, S.; Yang, F. Development of a Novel Biomimetic Mechanical Hand Based on Physical Characteristics of Apples. Agriculture 2022, 12, 1871. [Google Scholar] [CrossRef]
- Du, Z.; Li, D.; Ji, J.; Zhang, L.; Li, X.; Wang, H. Bionic Optimization Design and Experiment of Reciprocating Cutting System on Single-Row Tea Harvester. Agronomy 2013, 12, 1309. [Google Scholar] [CrossRef]
- Du, Z.; Hu, Y.; Lu, Y.; Pang, J.; Li, X. Design of structural parameters of cutters for tea harvest based on biomimetic methodology. Appl. Bionics Biomech. 2021, 2021, 8798299. [Google Scholar] [CrossRef] [PubMed]
- Luo, K.; Wu, Z.M.; Cao, C.M.; Qin, K.; Zhang, X.C.; An, M.H. Biomechanical Characterization of Bionic Mechanical Harvesting of Tea Buds. Agriculture 2022, 12, 1361. [Google Scholar] [CrossRef]
- Wang, Q.; Liu, Y.S.; Yin, X.C. Comparison of Gut Bacterial Communities of Locusta migratoria manilensis (Meyen) Reared on Different Food Plants. Biology 2022, 11, 1347. [Google Scholar] [CrossRef]
- Li, C.Y.; Jia, H.L.; Zhang, Z.H.; Wang, G.; Wang, H.C. Grasshopper [chondracris rosea rosea (de geer)] incisors cutting edge contour data extraction and quantitative analysis. Appl. Mech. Mater. 2014, 461, 144–151. [Google Scholar] [CrossRef]


| Level | Factor | |||
|---|---|---|---|---|
| Feed Speed/m/s | Cutting Edge Angle/Degrees | Overlap Amount/mm | Rotational Speed/rpm | |
| 1 | 0.01 | 5 | 1 | 200 |
| 2 | 0.11 | 15 | 6 | 400 |
| 3 | 0.21 | 25 | 11 | 600 |
| 4 | 0.31 | 35 | 16 | 800 |
| 5 | 0.41 | 45 | 21 | 1000 |
| Factor | Units | Level | Response | Units | ||
|---|---|---|---|---|---|---|
| A: Feed speed | m/s | 0.21 | 0.26 | 0.31 | Y1: stem maximum equivalent stress | MPa |
| B: Cutting edge angle | degrees | 5 | 15 | 25 | Y2: advance speed fluctuation peak value | mm/s |
| C: Overlap amount | mm | 1 | 6 | 11 | Y3: Maximum contact force | N |
| D: Rotational speed | rpm | 600 | 800 | 1000 | ||
| Factor | Response | ||||||
|---|---|---|---|---|---|---|---|
| Run | A/m/s | B/Degrees | C/mm | D/rpm | Y1/MPa | Y2/mm/s | Y3/N |
| 1 | 0.26 | 15 | 6 | 800 | 1.1449 | 37.28 | 6.9046 |
| 2 | 0.31 | 25 | 6 | 800 | 1.205 | 9.31 | 6.4028 |
| 3 | 0.21 | 15 | 11 | 800 | 1.1303 | 22.47 | 7.3324 |
| 4 | 0.26 | 25 | 6 | 1000 | 0.91934 | 10.86 | 7.4814 |
| 5 | 0.26 | 15 | 1 | 1000 | 1.2541 | 40.86 | 5.7459 |
| 6 | 0.21 | 15 | 6 | 1000 | 0.99954 | 35.96 | 5.4476 |
| 7 | 0.21 | 5 | 6 | 800 | 1.1675 | 62.7 | 8.5025 |
| 8 | 0.21 | 15 | 6 | 600 | 1.254 | 28.27 | 7.2396 |
| 9 | 0.26 | 5 | 1 | 800 | 1.1789 | 28.92 | 7.0209 |
| 10 | 0.26 | 25 | 6 | 600 | 1.2312 | 6.39 | 5.5769 |
| 11 | 0.21 | 15 | 1 | 800 | 1.1304 | 33.58 | 6.8834 |
| 12 | 0.26 | 15 | 6 | 800 | 1.2498 | 38.66 | 7.8081 |
| 13 | 0.26 | 15 | 11 | 1000 | 1.1674 | 23.33 | 5.7599 |
| 14 | 0.26 | 25 | 11 | 800 | 0.8733 | 27.07 | 4.5833 |
| 15 | 0.26 | 5 | 6 | 600 | 1.08 | 49.16 | 9.7256 |
| 16 | 0.21 | 25 | 6 | 800 | 1.1414 | 7.96 | 5.8652 |
| 17 | 0.26 | 15 | 6 | 800 | 1.1449 | 37.28 | 6.9046 |
| 18 | 0.31 | 15 | 6 | 600 | 0.95669 | 29.37 | 12.6 |
| 19 | 0.26 | 15 | 1 | 600 | 1.1348 | 24.7 | 9.184 |
| 20 | 0.26 | 15 | 6 | 800 | 1.1449 | 37.28 | 6.9046 |
| 21 | 0.31 | 5 | 6 | 800 | 0.99839 | 62.8 | 9.6223 |
| 22 | 0.26 | 15 | 6 | 800 | 1.2498 | 38.66 | 7.8081 |
| 23 | 0.31 | 15 | 6 | 1000 | 1.083 | 36.4 | 6.8667 |
| 24 | 0.26 | 15 | 11 | 600 | 1.2397 | 17.47 | 8.3645 |
| 25 | 0.26 | 25 | 1 | 800 | 1.2388 | 72.98 | 4.5008 |
| 26 | 0.26 | 5 | 6 | 1000 | 0.97838 | 68.42 | 8.346 |
| 27 | 0.26 | 5 | 11 | 800 | 1.0158 | 73.05 | 6.3209 |
| 28 | 0.31 | 15 | 1 | 800 | 1.2632 | 33.29 | 9.1501 |
| 29 | 0.31 | 15 | 11 | 800 | 0.85783 | 23.03 | 6.6314 |
| Model | Standard Deviation | Average Value | Coefficient of Variation/% | Coefficient of Determination | Signal-to-Noise Ratio |
|---|---|---|---|---|---|
| Stem maximum equivalent stress (Y1) | 0.068 | 1.12 | 6.08 | 0.9207 | 6.8398 |
| Advance speed fluctuation peak value (Y2) | 0.626 | 35.09 | 1.79 | 0.9995 | 138.4123 |
| Maximum contact force (Y3) | 0.429 | 7.29 | 5.88 | 0.9798 | 22.8585 |
| Name | Units | Lower Limit | Upper Limit | Solution Objective | Upper Weight | Lower Weight | Significance | |
|---|---|---|---|---|---|---|---|---|
| Factor | A: Feed rate | m/s | 0.21 | 0.31 | Within range | 1 | 1 | 3 |
| B: Cutting edge angle | degree | 10 | 35 | Within range | 1 | 1 | 3 | |
| C: Overlap amount | mm | 1 | 11 | Within range | 1 | 1 | 3 | |
| D: Rotational speed | rpm | 400 | 1000 | Within range | 1 | 1 | 3 | |
| Response | Y1: Stem maximum equivalent stress | MPa | 0 | 1.5 | maximize | 1 | 1 | 3 |
| Y2: Advance speed fluctuation peak value | mm/s | 0 | 5 | It goes to 0 | 1 | 1 | 3 | |
| Y3: Maximum contact force | N | 0 | 10 | It goes to 0 | 1 | 1 | 3 |
| Curve 1 | Curve 2 | Curve 3 | ||||
|---|---|---|---|---|---|---|
| Result | Standard Error | Result | Standard Error | Result | Standard Error | |
| Intercept | 104.77 | 1.2600 | 110.83 | 0.55521 | 114.58 | 1.5087 |
| B1 | 4.1579 | 0.69271 | 2.8605 | 0.31264 | 9.6237 | 0.90430 |
| B2 | −0.94490 | 0.12506 | −0.30522 | 0.057840 | −1.1505 | 0.17834 |
| B3 | 0.095042 | 0.010438 | 0.016811 | 0.0049495 | 0.067894 | 0.016290 |
| B4 | −0.0044191 | 4.6658 × 10⁻⁴ | −3.3242 × 10⁻⁴ | 2.2690 × 10⁻⁴ | −0.0020354 | 7.9777 × 10⁻⁴ |
| B5 | 1.0906 × 10⁻⁴ | 1.1869 × 10⁻⁵ | −1.0201 × 10⁻⁶ | 5.9204 × 10⁻⁶ | 3.0457 × 10⁻⁵ | 2.2247 × 10⁻⁵ |
| B6 | −1.4862 × 10⁻⁶ | 1.7200 × 10⁻⁷ | 1.2500 × 10⁻⁷ | 8.8017 × 10⁻⁸ | −1.7666 × 10⁻⁷ | 3.5359 × 10⁻⁷ |
| B7 | 1.0587 × 10⁻⁸ | 1.3214 × 10⁻⁹ | −1.6221 × 10⁻⁹ | 6.9372 × 10⁻¹⁰ | −4.4679 × 10⁻¹⁰ | 2.9800 × 10⁻⁹ |
| B8 | −3.0831 × 10⁻¹¹ | 4.1737 × 10⁻¹² | 6.7599 × 10⁻¹² | 2.2481 × 10⁻¹² | 6.6607 × 10⁻¹² | 1.0328 × 10⁻¹¹ |
| R2 | 0.99411 | 0.99854 | 0.98729 | |||
| Serial Number | X1: Rotational Speed/rpm | X2: Overlap Amount/mm | X3: Putter Speed/m/s | Y: Fluctuation Value of Cutter Rotational Speed/rpm | Z: Cutting Quality Rating | ||||||
|---|---|---|---|---|---|---|---|---|---|---|---|
| Bionic Cutter I | Bionic Cutter II | Bionic Cutter III | Conventional Cutter | Bionic Cutter I | Bionic Cutter II | Bionic Cutter III | Conventional Cutter | ||||
| 1 | 300 | 7.5 | 0.1 | 14.2 | 9.3 | 8.5 | 17.7 | 6 | 4 | 7 | 6 |
| 2 | 600 | 0 | 0.2 | 11.2 | 14.9 | 12.2 | 13.7 | 3 | 2 | 5 | 6 |
| 3 | 450 | 0 | 0.3 | 11.6 | 10.2 | 4.7 | 12.2 | 1 | 1 | 6 | 1 |
| 4 | 600 | 7.5 | 0.1 | 10.5 | 8.9 | 16.2 | 11.6 | 5 | 7 | 9 | 7 |
| 5 | 450 | 7.5 | 0.2 | 10.1 | 6.5 | 4.6 | 2.8 | 8 | 6 | 6 | 8 |
| 6 | 300 | 0 | 0.2 | 11.3 | 16.1 | 11.5 | 14 | 1 | 4 | 2 | 1 |
| 7 | 600 | 15 | 0.2 | 23.6 | 5 | 16.4 | 11.4 | 6 | 6 | 8 | 10 |
| 8 | 450 | 7.5 | 0.2 | 8.8 | 6.3 | 1.9 | 7.9 | 8 | 8 | 8 | 8 |
| 9 | 600 | 7.5 | 0.3 | 8.4 | 7.4 | 8.8 | 9.6 | 5 | 5 | 9 | 7 |
| 10 | 450 | 7.5 | 0.2 | 3.9 | 2.5 | 1.5 | 0.3 | 7 | 5 | 7 | 6 |
| 11 | 300 | 15 | 0.2 | 10.8 | 9.4 | 9.3 | 8.1 | 6 | 9 | 8 | 7 |
| 12 | 450 | 7.5 | 0.2 | 4.9 | 0.5 | 4.3 | 6.1 | 9 | 7 | 9 | 7 |
| 13 | 300 | 7.5 | 0.3 | 5.3 | 14.4 | 10.9 | 11.3 | 7 | 6 | 6 | 8 |
| 14 | 450 | 7.5 | 0.2 | 7.1 | 8.1 | 6.7 | 6.2 | 7 | 7 | 8 | 8 |
| 15 | 450 | 15 | 0.3 | 14.4 | 7.5 | 8 | 5.6 | 4 | 8 | 9 | 7 |
| 16 | 450 | 0 | 0.1 | 10.9 | 11.2 | 11.5 | 15.7 | 3 | 1 | 3 | 1 |
| 17 | 450 | 15 | 0.1 | 16.9 | 4.7 | 15.9 | 14.8 | 7 | 8 | 8 | 7 |
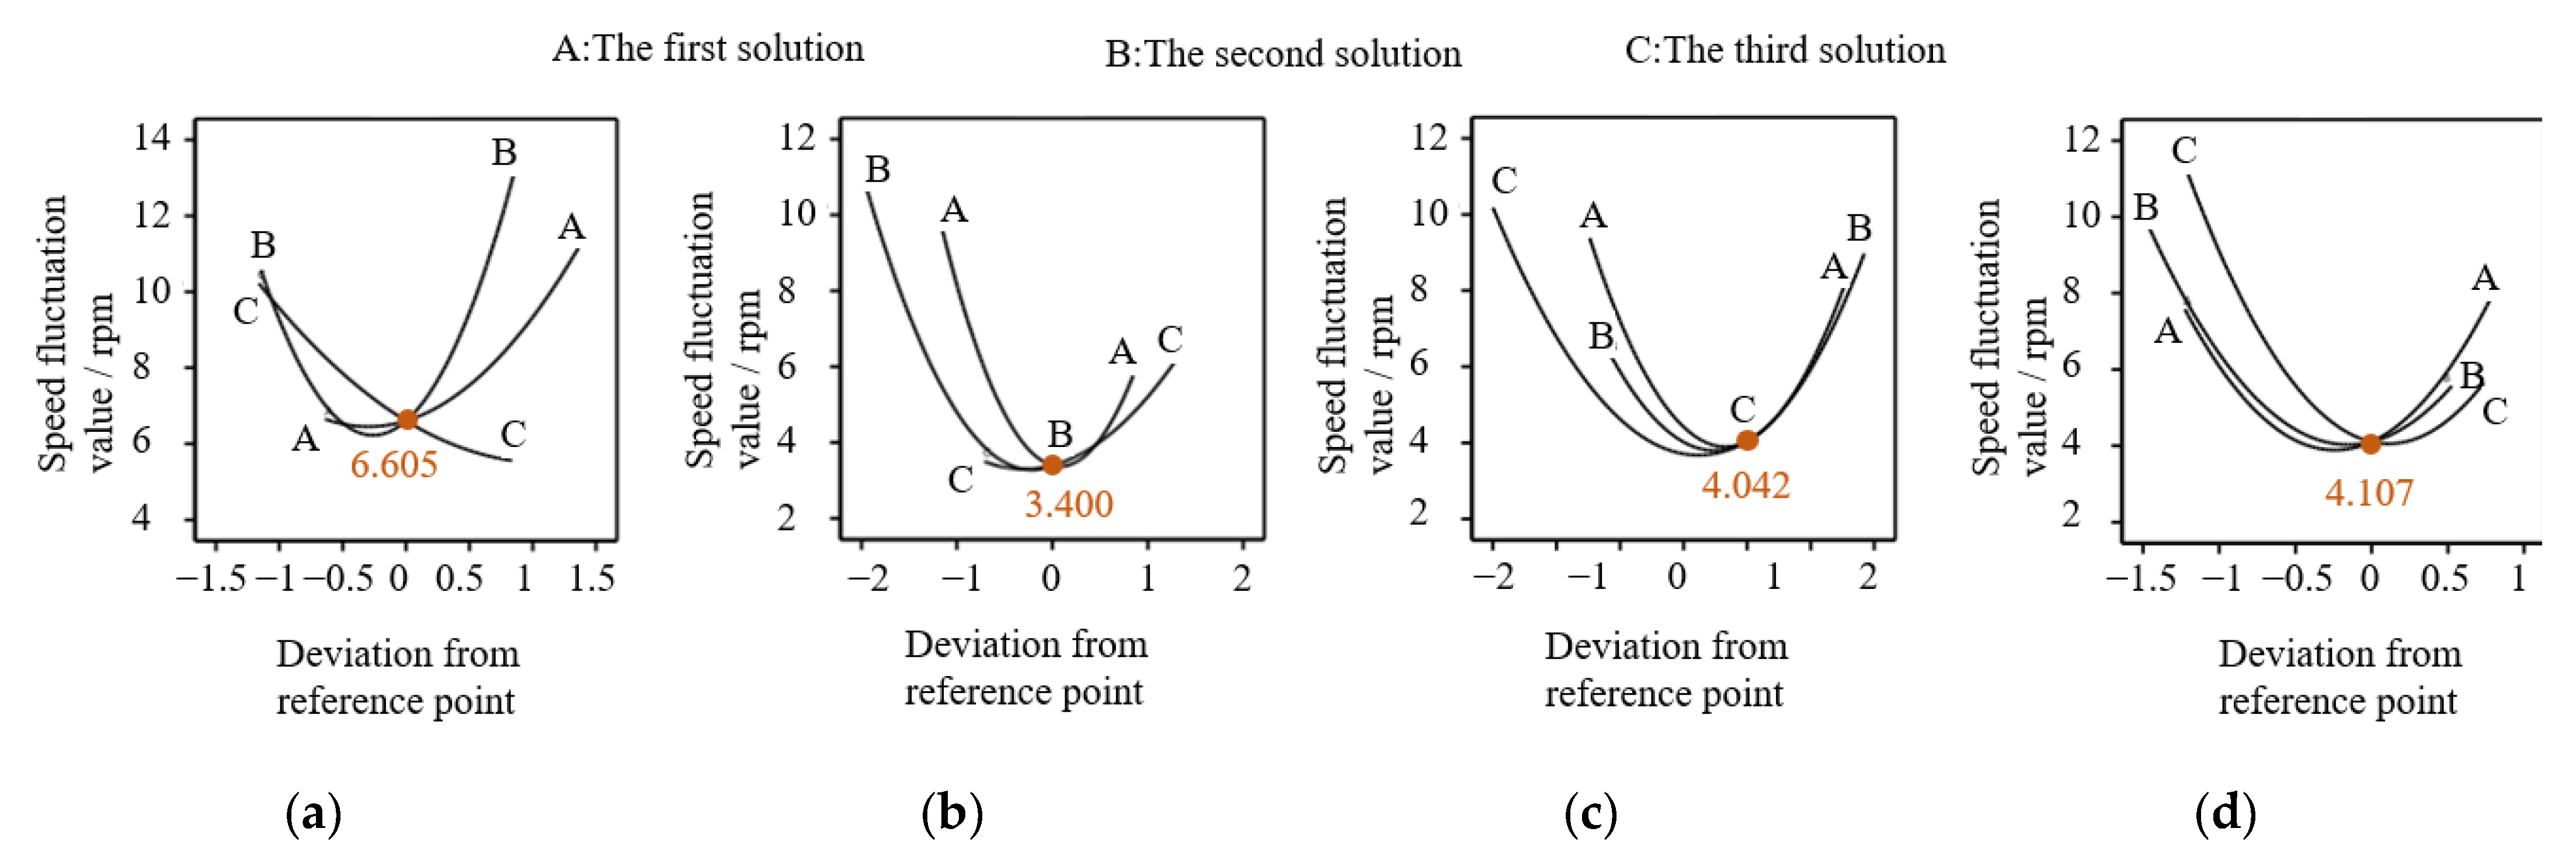
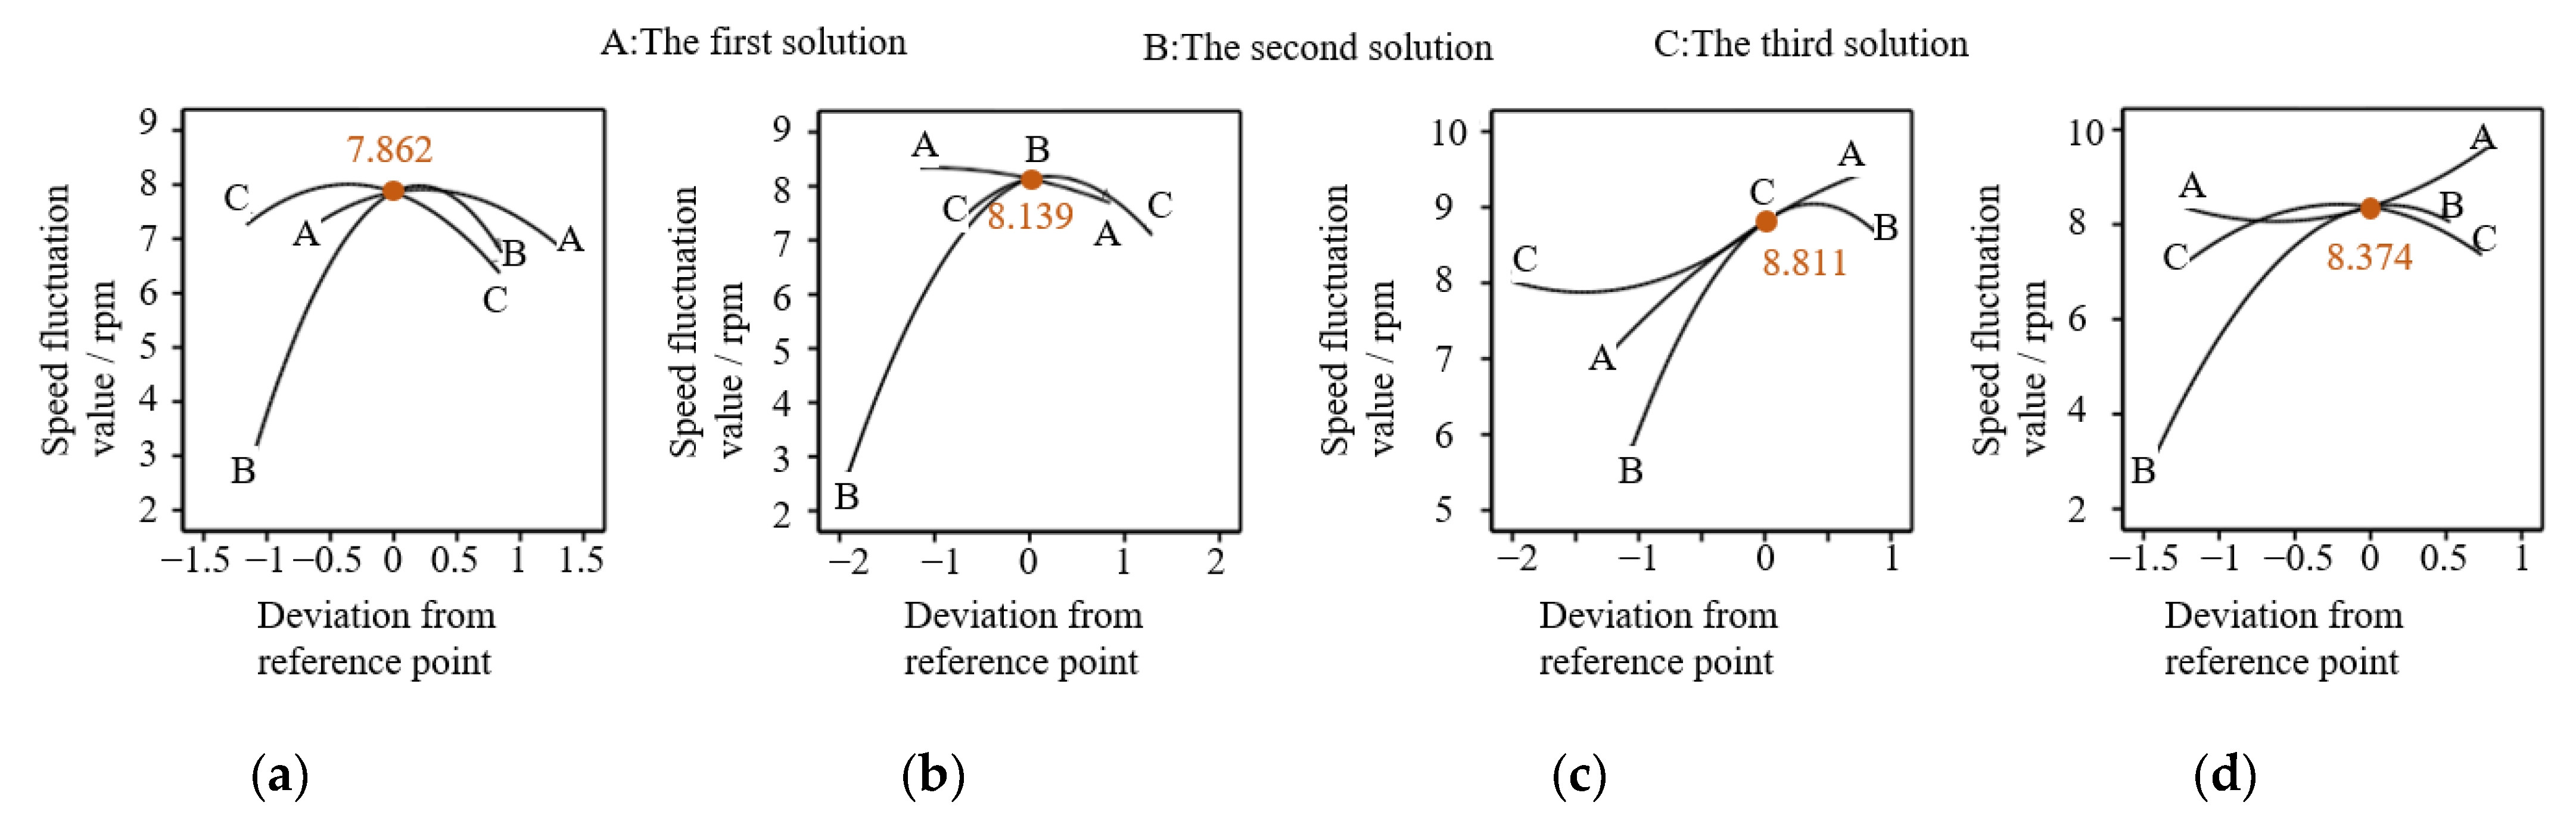
| Cutter | Rotational Speed/rpm | Overlap Amount/mm | Feed Rate/m/s | Minimum Fluctuation of Speed/rpm | Optimal Value of the Cutting Effect | Desirability |
|---|---|---|---|---|---|---|
| Bionic Cutter I | 395.905 | 8.586 | 0.216 | 6.606 | 7.863 | 0.741 |
| Bionic Cutter II | 472.591 | 14.6 | 0.171 | 3.401 | 8.14 | 0.791 |
| Bionic Cutter III | 485.855 | 8.09 | 0.3 | 4.042 | 8.811 | 0.809 |
| Conventional cutter | 483.666 | 11.054 | 0.226 | 4.107 | 8.374 | 0.793 |
Disclaimer/Publisher’s Note: The statements, opinions and data contained in all publications are solely those of the individual author(s) and contributor(s) and not of MDPI and/or the editor(s). MDPI and/or the editor(s) disclaim responsibility for any injury to people or property resulting from any ideas, methods, instructions or products referred to in the content. |
© 2023 by the authors. Licensee MDPI, Basel, Switzerland. This article is an open access article distributed under the terms and conditions of the Creative Commons Attribution (CC BY) license (https://creativecommons.org/licenses/by/4.0/).
Share and Cite
Cao, Y.; Yu, Y.; Tang, Z.; Zhao, Y.; Gu, X.; Liu, S.; Chen, S. Multi-Tooth Cutting Method and Bionic Cutter Design for Broccoli Xylem (Brassica oleracea L. var. Italica Plenck). Agriculture 2023, 13, 1267. https://doi.org/10.3390/agriculture13061267
Cao Y, Yu Y, Tang Z, Zhao Y, Gu X, Liu S, Chen S. Multi-Tooth Cutting Method and Bionic Cutter Design for Broccoli Xylem (Brassica oleracea L. var. Italica Plenck). Agriculture. 2023; 13(6):1267. https://doi.org/10.3390/agriculture13061267
Chicago/Turabian StyleCao, Yunlong, Yao Yu, Zhong Tang, Yunfei Zhao, Xinyang Gu, Sifan Liu, and Shuren Chen. 2023. "Multi-Tooth Cutting Method and Bionic Cutter Design for Broccoli Xylem (Brassica oleracea L. var. Italica Plenck)" Agriculture 13, no. 6: 1267. https://doi.org/10.3390/agriculture13061267