Review

State of Major Vegetation Indices in Precision Agriculture Studies Indexed in Web of Science: A Review

1
Faculty of Agrobiotechnical Sciences Osijek, Josip Juraj Strossmayer University of Osijek, Vladimira Preloga 1, 31000 Osijek, Croatia
2
Department of Geography, University of Zadar, Trg kneza Višeslava 9, 23000 Zadar, Croatia
3
Centre for Projects, Science and Technology Transfer, University of Zadar, Trg kneza Višeslava 9, 23000 Zadar, Croatia
*
Author to whom correspondence should be addressed.
Agriculture 2023, 13(3), 707; https://doi.org/10.3390/agriculture13030707
Submission received: 21 February 2023 / Revised: 8 March 2023 / Accepted: 18 March 2023 / Published: 18 March 2023
(This article belongs to the Special Issue Recent Advances in Agro-Geoinformatics)

Abstract

:
Vegetation indices provide information for various precision-agriculture practices, by providing quantitative data about crop growth and health. To provide a concise and up-to-date review of vegetation indices in precision agriculture, this study focused on the major vegetation indices with the criterion of their frequency in scientific papers indexed in the Web of Science Core Collection (WoSCC) since 2000. Based on the scientific papers with the topic of “precision agriculture” combined with “vegetation index”, this study found that the United States and China are global leaders in total precision-agriculture research and the application of vegetation indices, while the analysis adjusted for the country area showed much more homogenous global development of vegetation indices in precision agriculture. Among these studies, vegetation indices based on the multispectral sensor are much more frequently adopted in scientific studies than their low-cost alternatives based on the RGB sensor. The normalized difference vegetation index (NDVI) was determined as the dominant vegetation index, with a total of 2200 studies since the year 2000. With the existence of vegetation indices that improved the shortcomings of NDVI, such as enhanced vegetation index (EVI) and soil-adjusted vegetation index (SAVI), this study recognized their potential for enabling superior results to those of NDVI in future studies.

1. Introduction

Remote sensing can assist in various precision-agriculture practices, including seeding, fertilization, protection, and cultivation, by providing data-driven information about crop growth and health, soil conditions, and environmental factors [1,2,3]. This leads to improved crop management, higher yields, and increased profitability [4]. Additionally, by monitoring agricultural land using multitemporal remote-sensing imagery, farmers and agricultural researchers can gain insights into the effectiveness of various farming practices, such as irrigation and fertilization, and make decisions to optimize crop yield and reduce waste [5]. This approach is also invaluable for agricultural land management on a larger scale, ensuring cropland suitability prediction [6,7] and control of agricultural subsidies [8].
Vegetation indices have a crucial role in precision agriculture and crop monitoring by providing a straightforward and reliable assessment of the condition and health of crops [9,10,11]. Depending on the vegetation index, information on various aspects of plant growth and development can be monitored, such as chlorophyll content, leaf area, canopy structure, and water status [12,13,14]. This information can then be used to optimize prescription rates in precision agriculture, such as variable fertilizer application, irrigation, and pesticide application [15]. This is generally performed by identifying intra-field zones that are underperforming or experiencing stress, and target inputs to those areas to improve crop productivity and yield [16]. Vegetation indices also provide a cost-effective and non-destructive way of crop monitoring, ensuring a widely available and environmentally sustainable approach for assessing crop health [17,18]. The development of remote-sensing sensors for crop monitoring in both broadband and narrowband bands opens immense possibilities for their combination into novel vegetation indices [19]. To date, this has led to the development of 519 total vegetation indices, per Index DataBase [20]. While the majority of these indices serve a different purpose and have unique advantages and limitations according to sensor type and field conditions, the difficulty of objective assessment of their performance in crop-health monitoring arose [21]. Among the previous studies, Kobayashi et al. [22] analyzed 91 spectral indices for crop classification from Sentinel-2 images, but the vast majority of these indices are underrepresented in recent Web of Science Core Collection studies. Giovos et al. [23] reviewed a total of 97 vegetation indices in precision viticulture, including those based on hyperspectral sensors, noting normalized difference vegetation index (NDVI) as the most frequently applied index. As the availability of these numerous vegetation indices is dependent on the remote-sensing sensors, Shen et al. [24] highlighted multispectral and RGB sensors as the most available solutions for the calculation of vegetation indices presently.
Scientists and farmers have many alternatives to choose from in the selection of vegetation indices in precision agriculture, but their large quantity might aggravate the selection of the most effective ones due to the potential presence of redundant indices. Therefore, this study focused on the major vegetation indices with the criterion of their frequency in scientific papers indexed in the Web of Science Core Collection since 2000. The main aim of this review is to provide the most recent overview of vegetation indices according to the selection of remote-sensing sensors and to identify the most potent options in precision agriculture, aiding study-planning in precision agriculture. In contrast to previous reviews on the topic, this study analyzed the broader topic of the importance of vegetation indices in general aspects of precision agriculture, with an increased focus on determining the major vegetation indices and their in-depth state of the application in scientific studies.

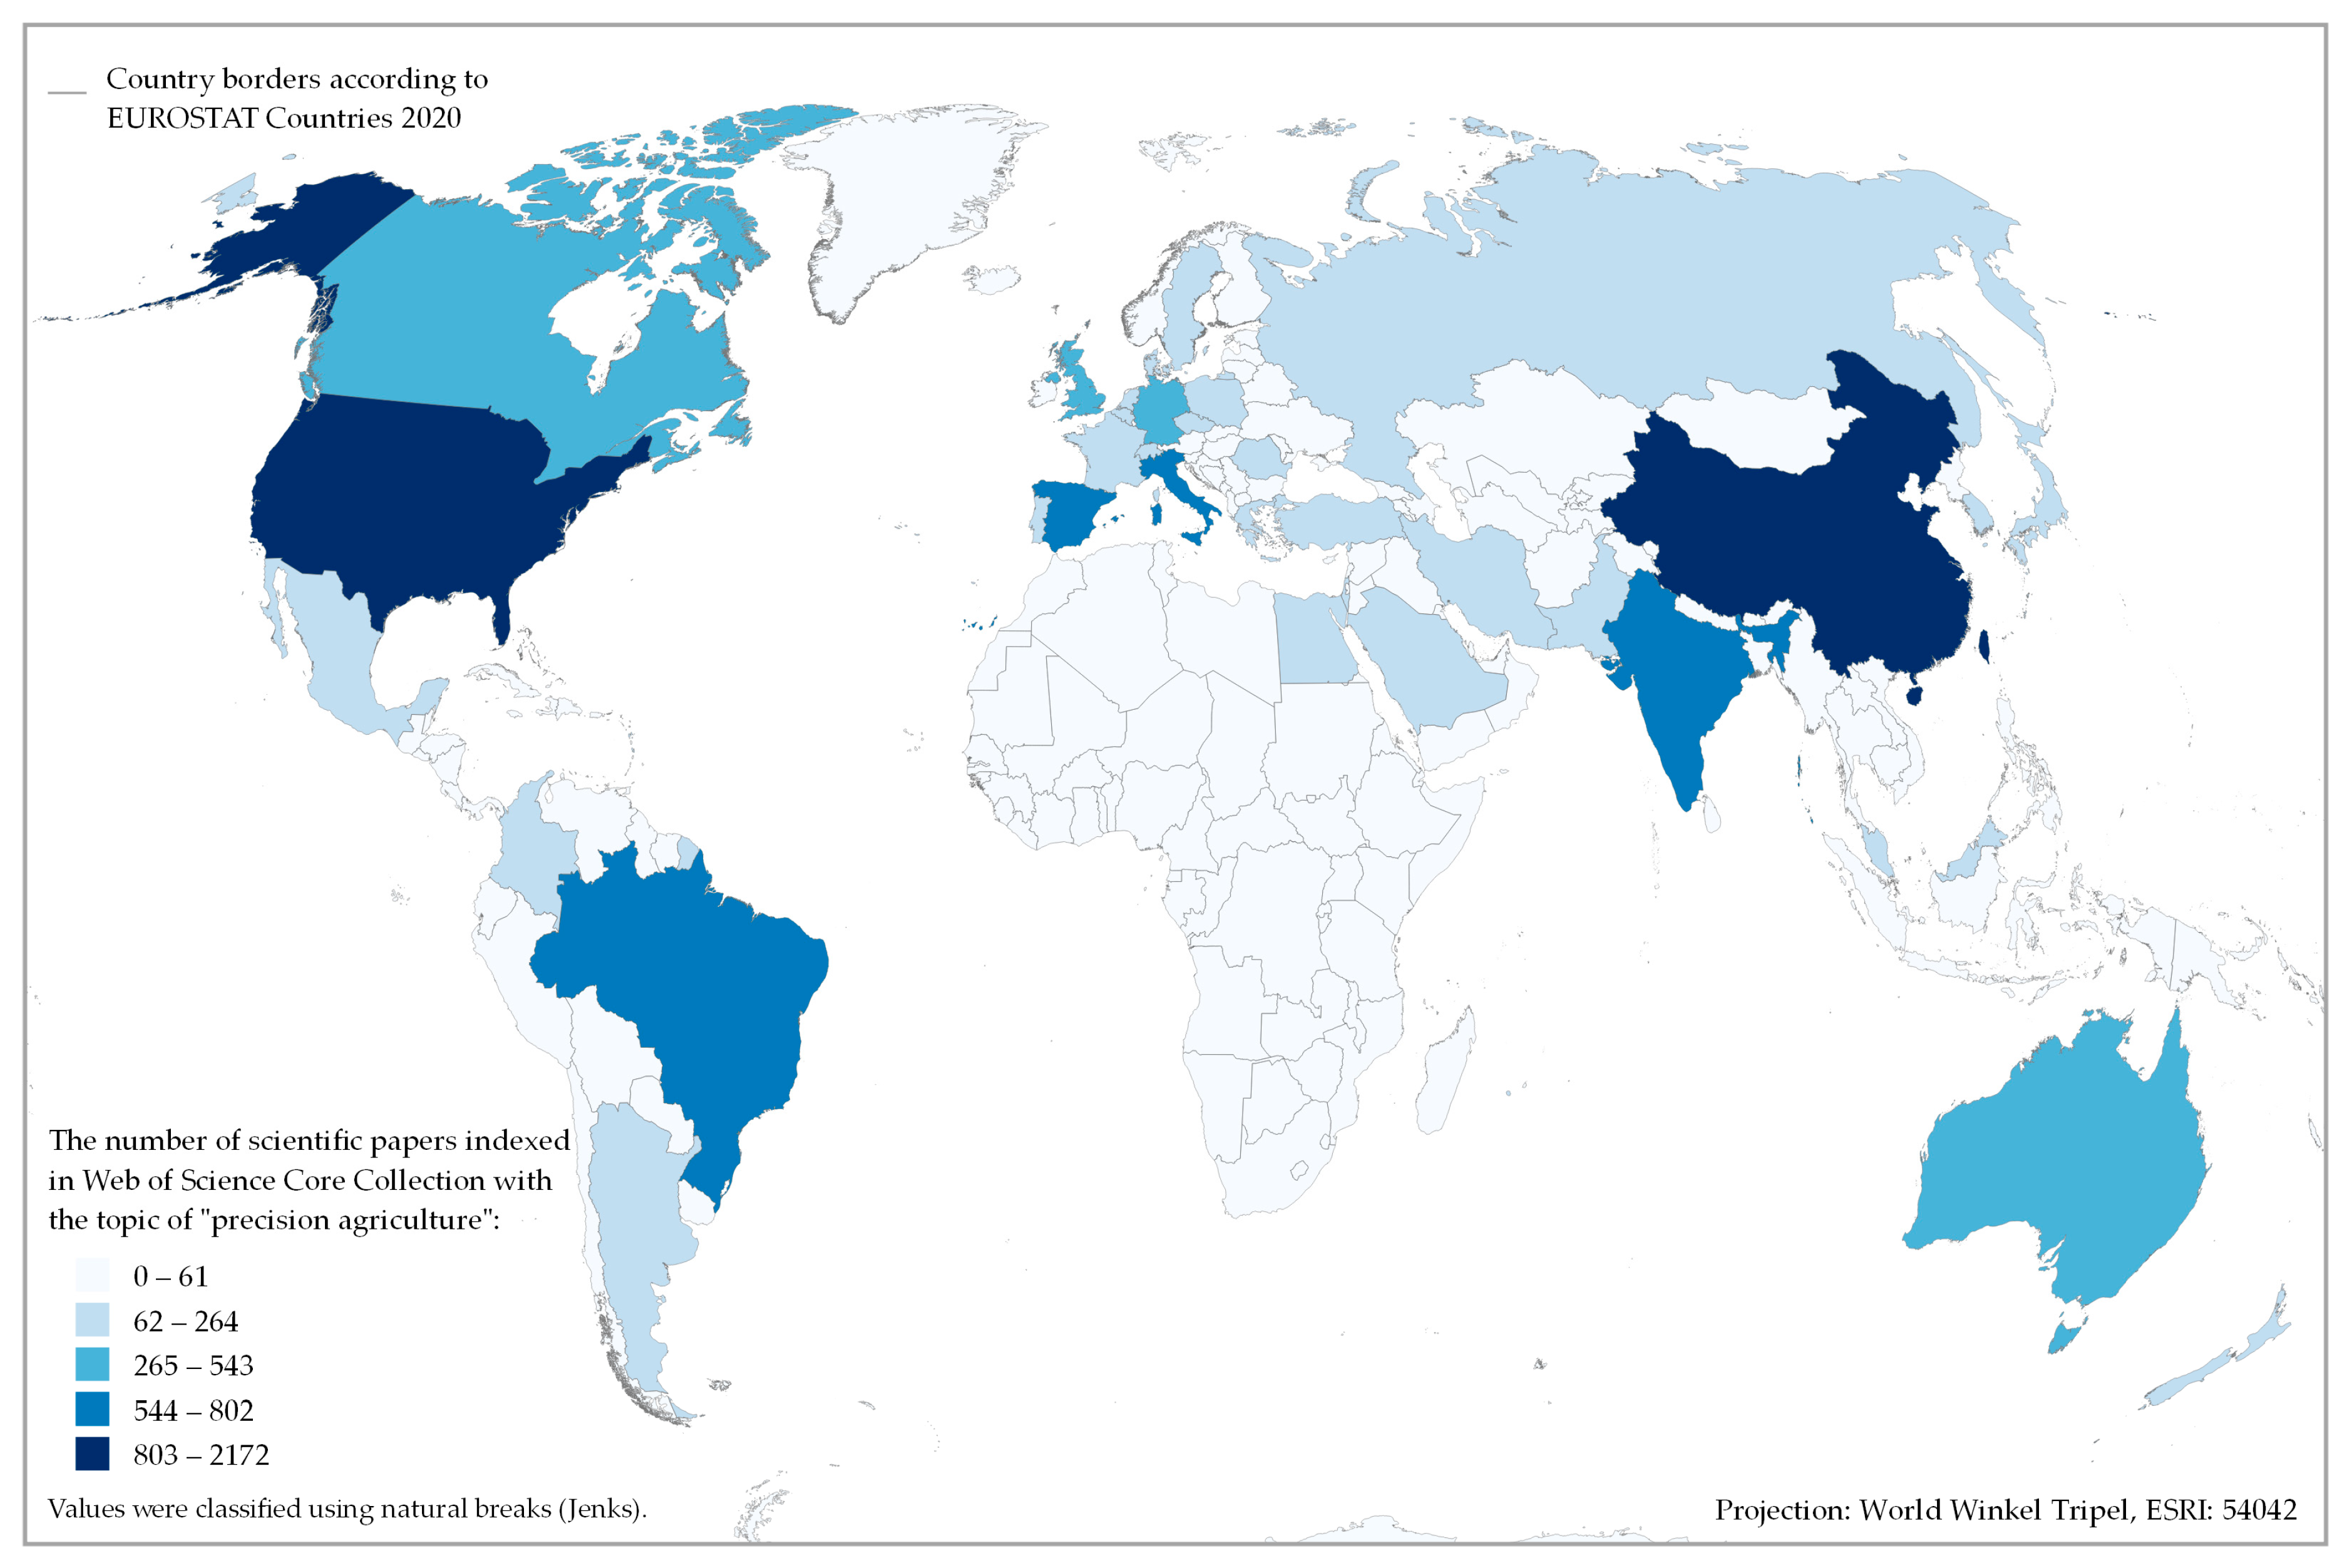
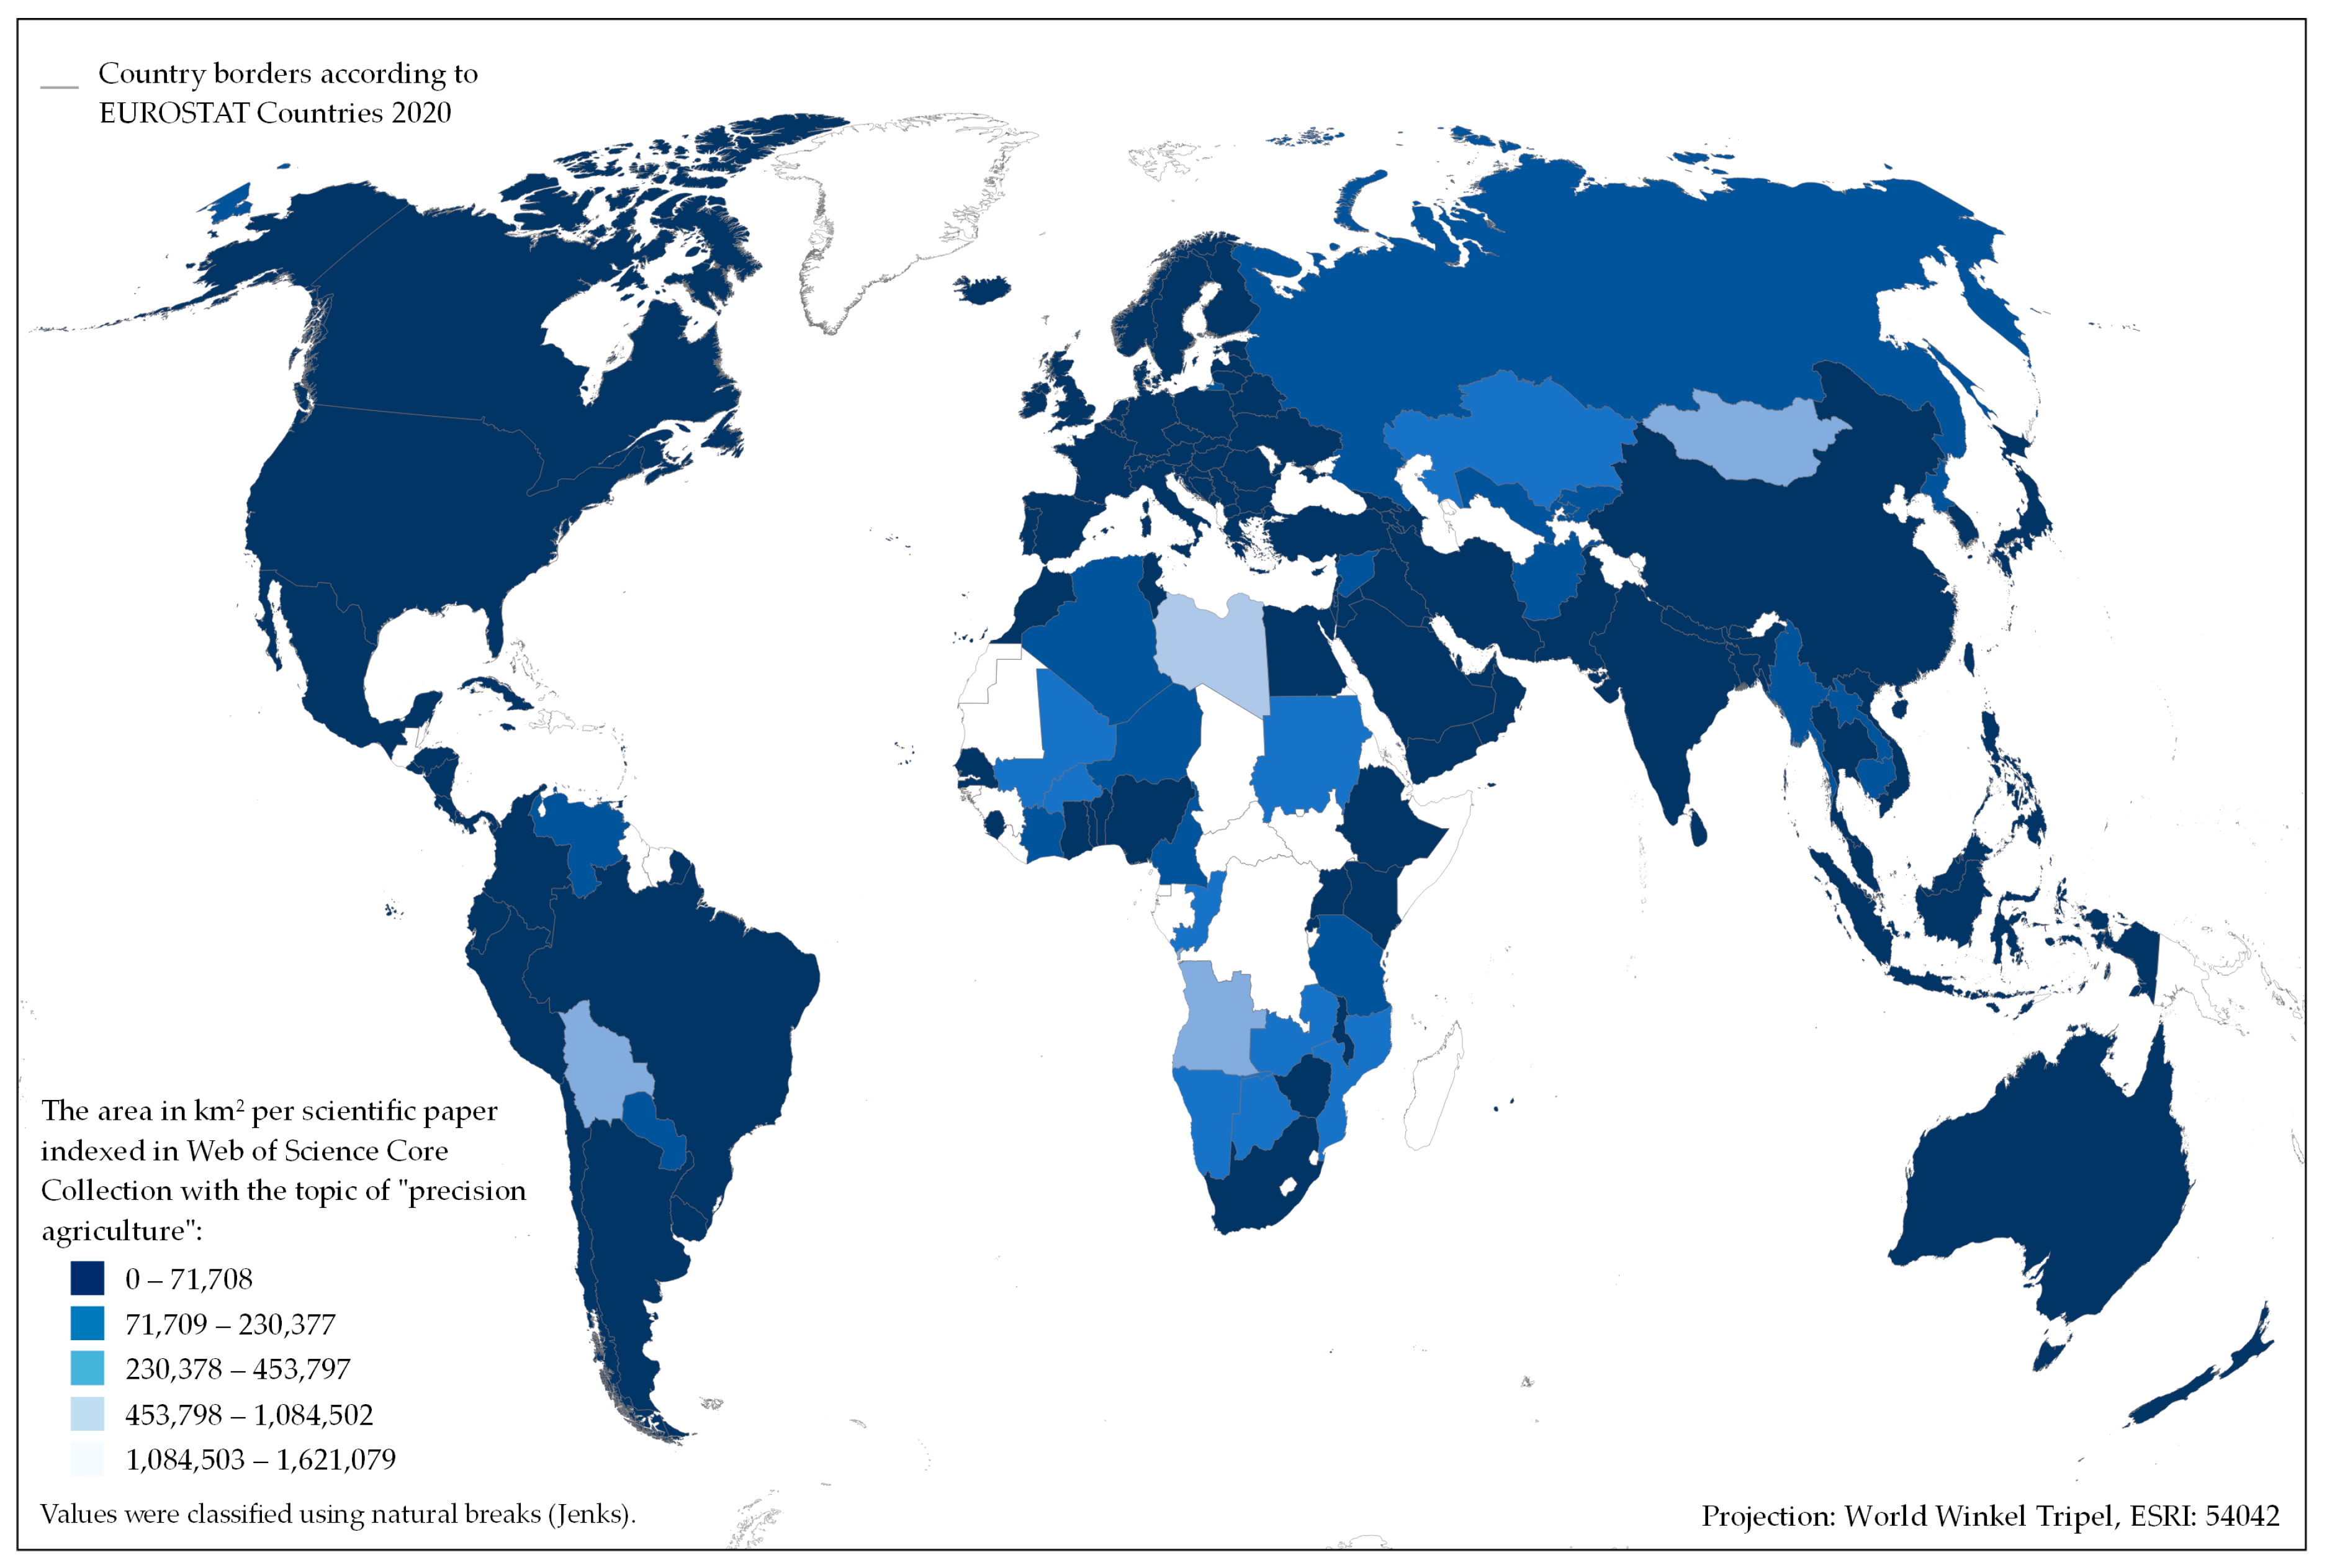
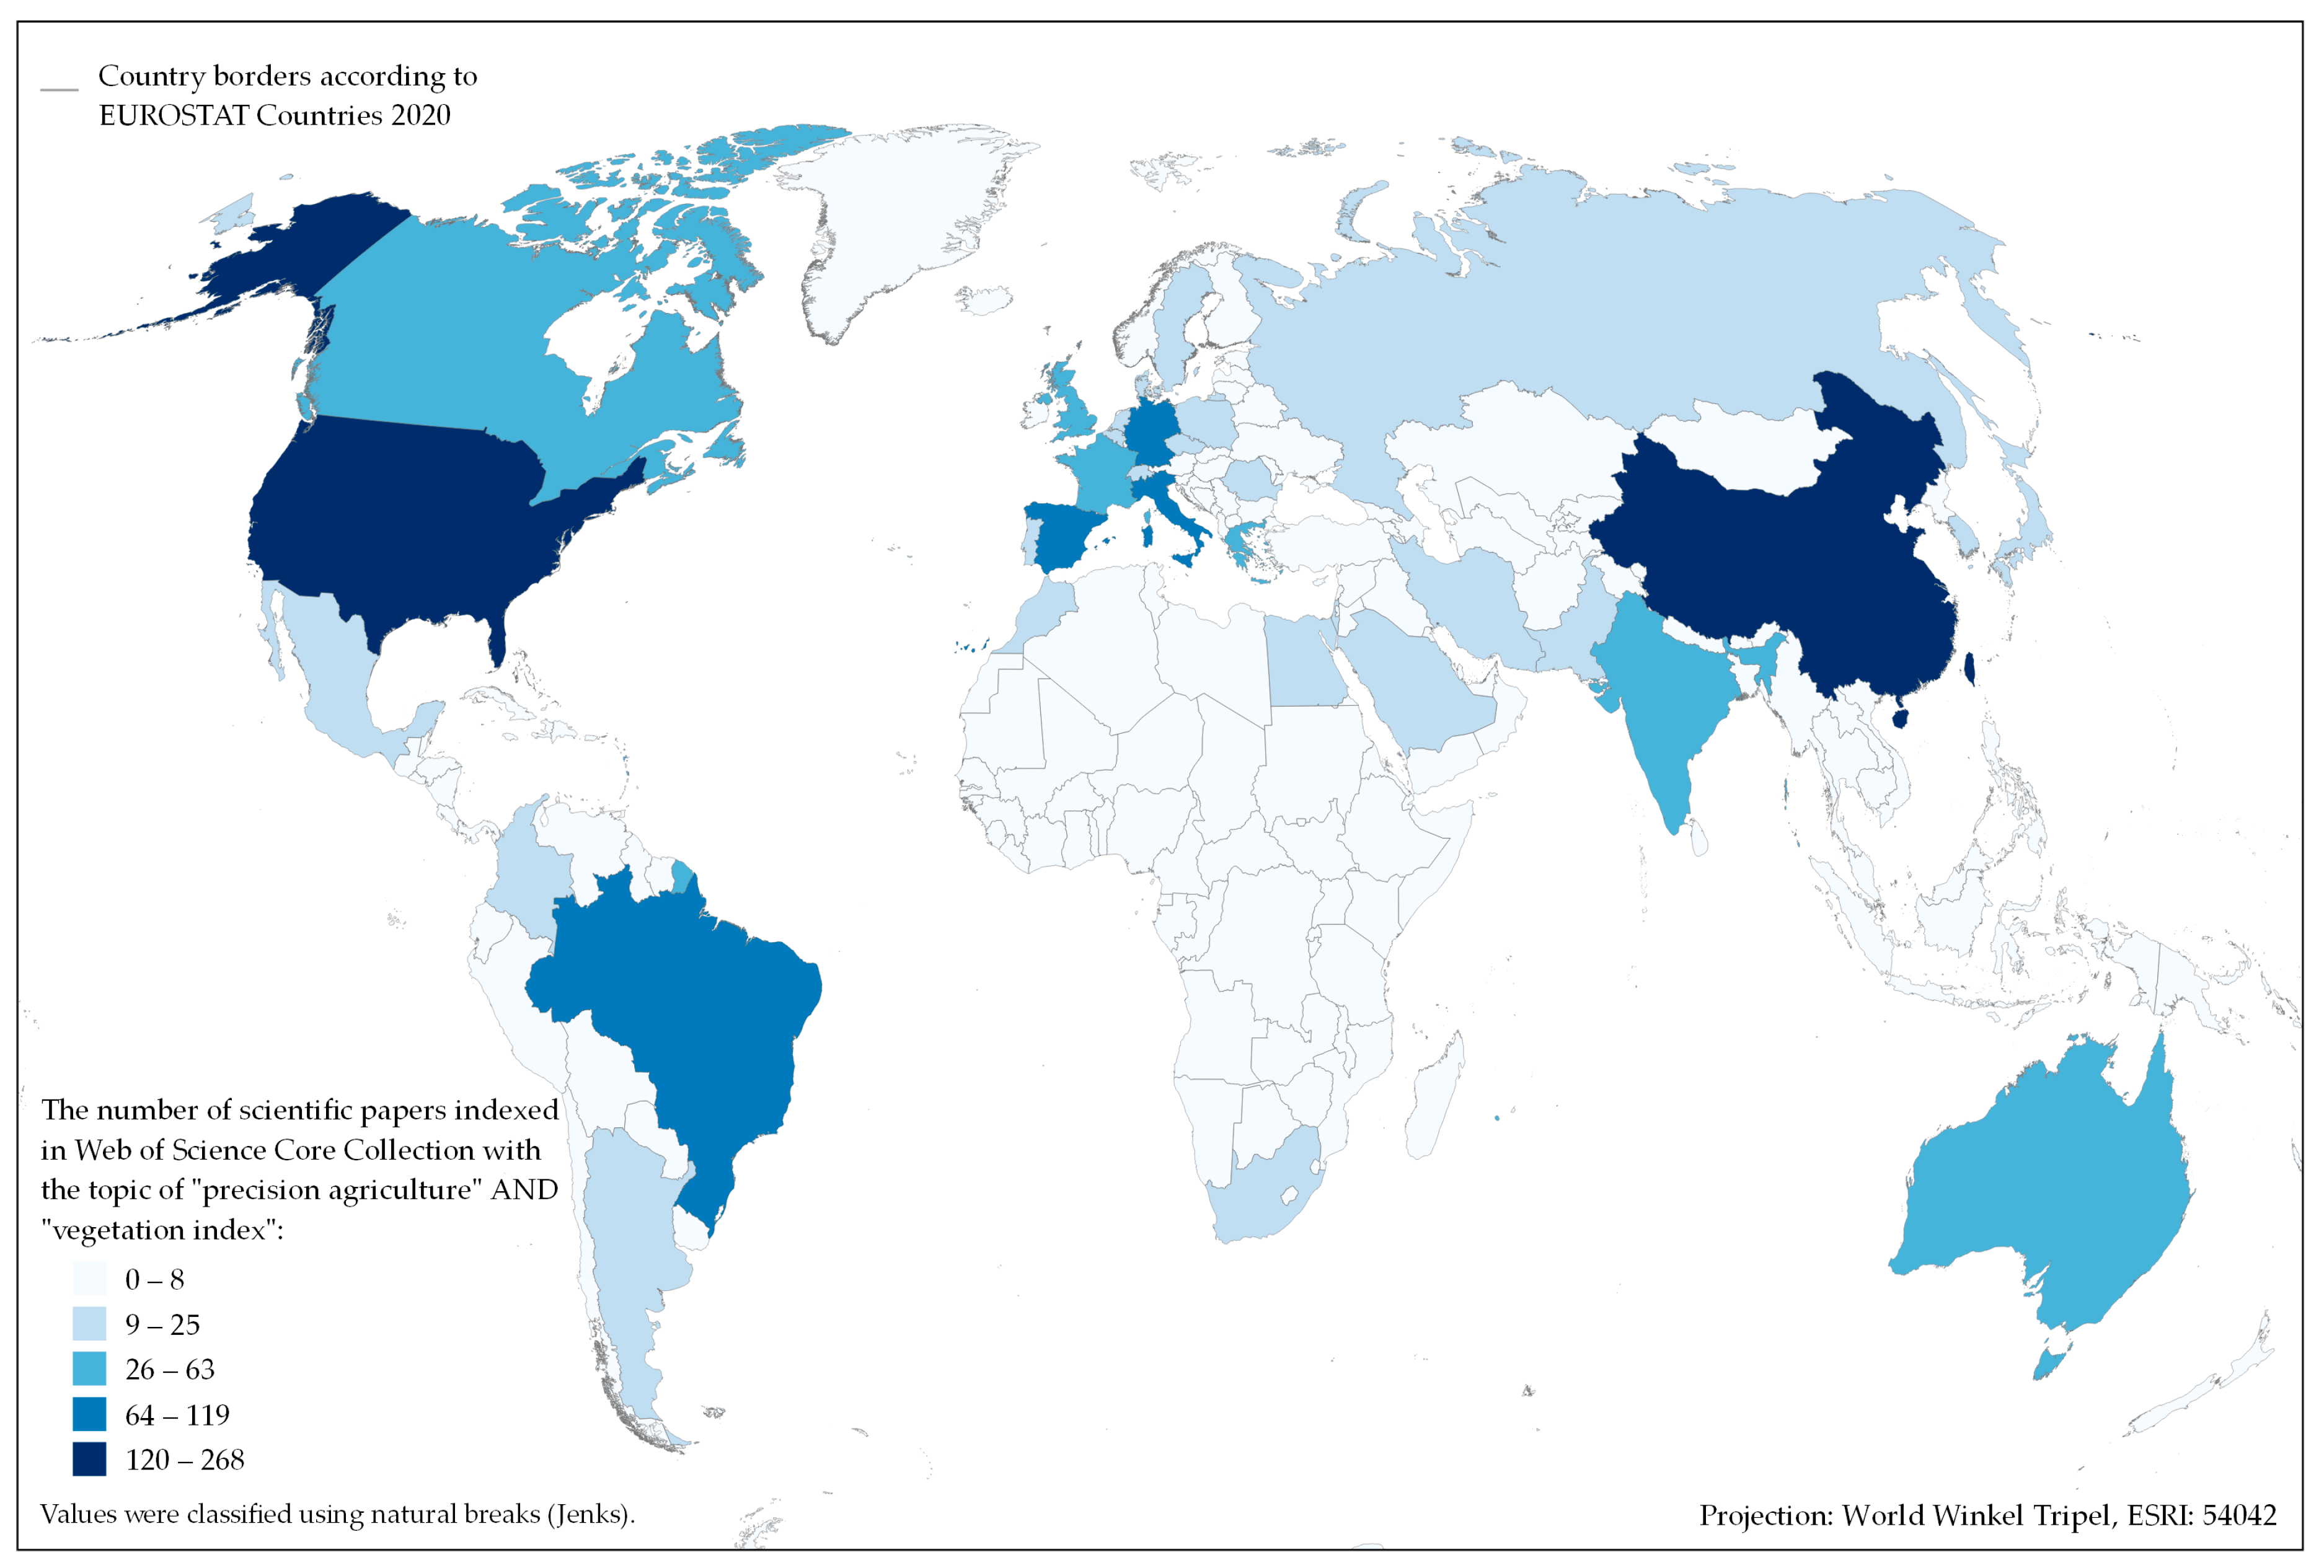
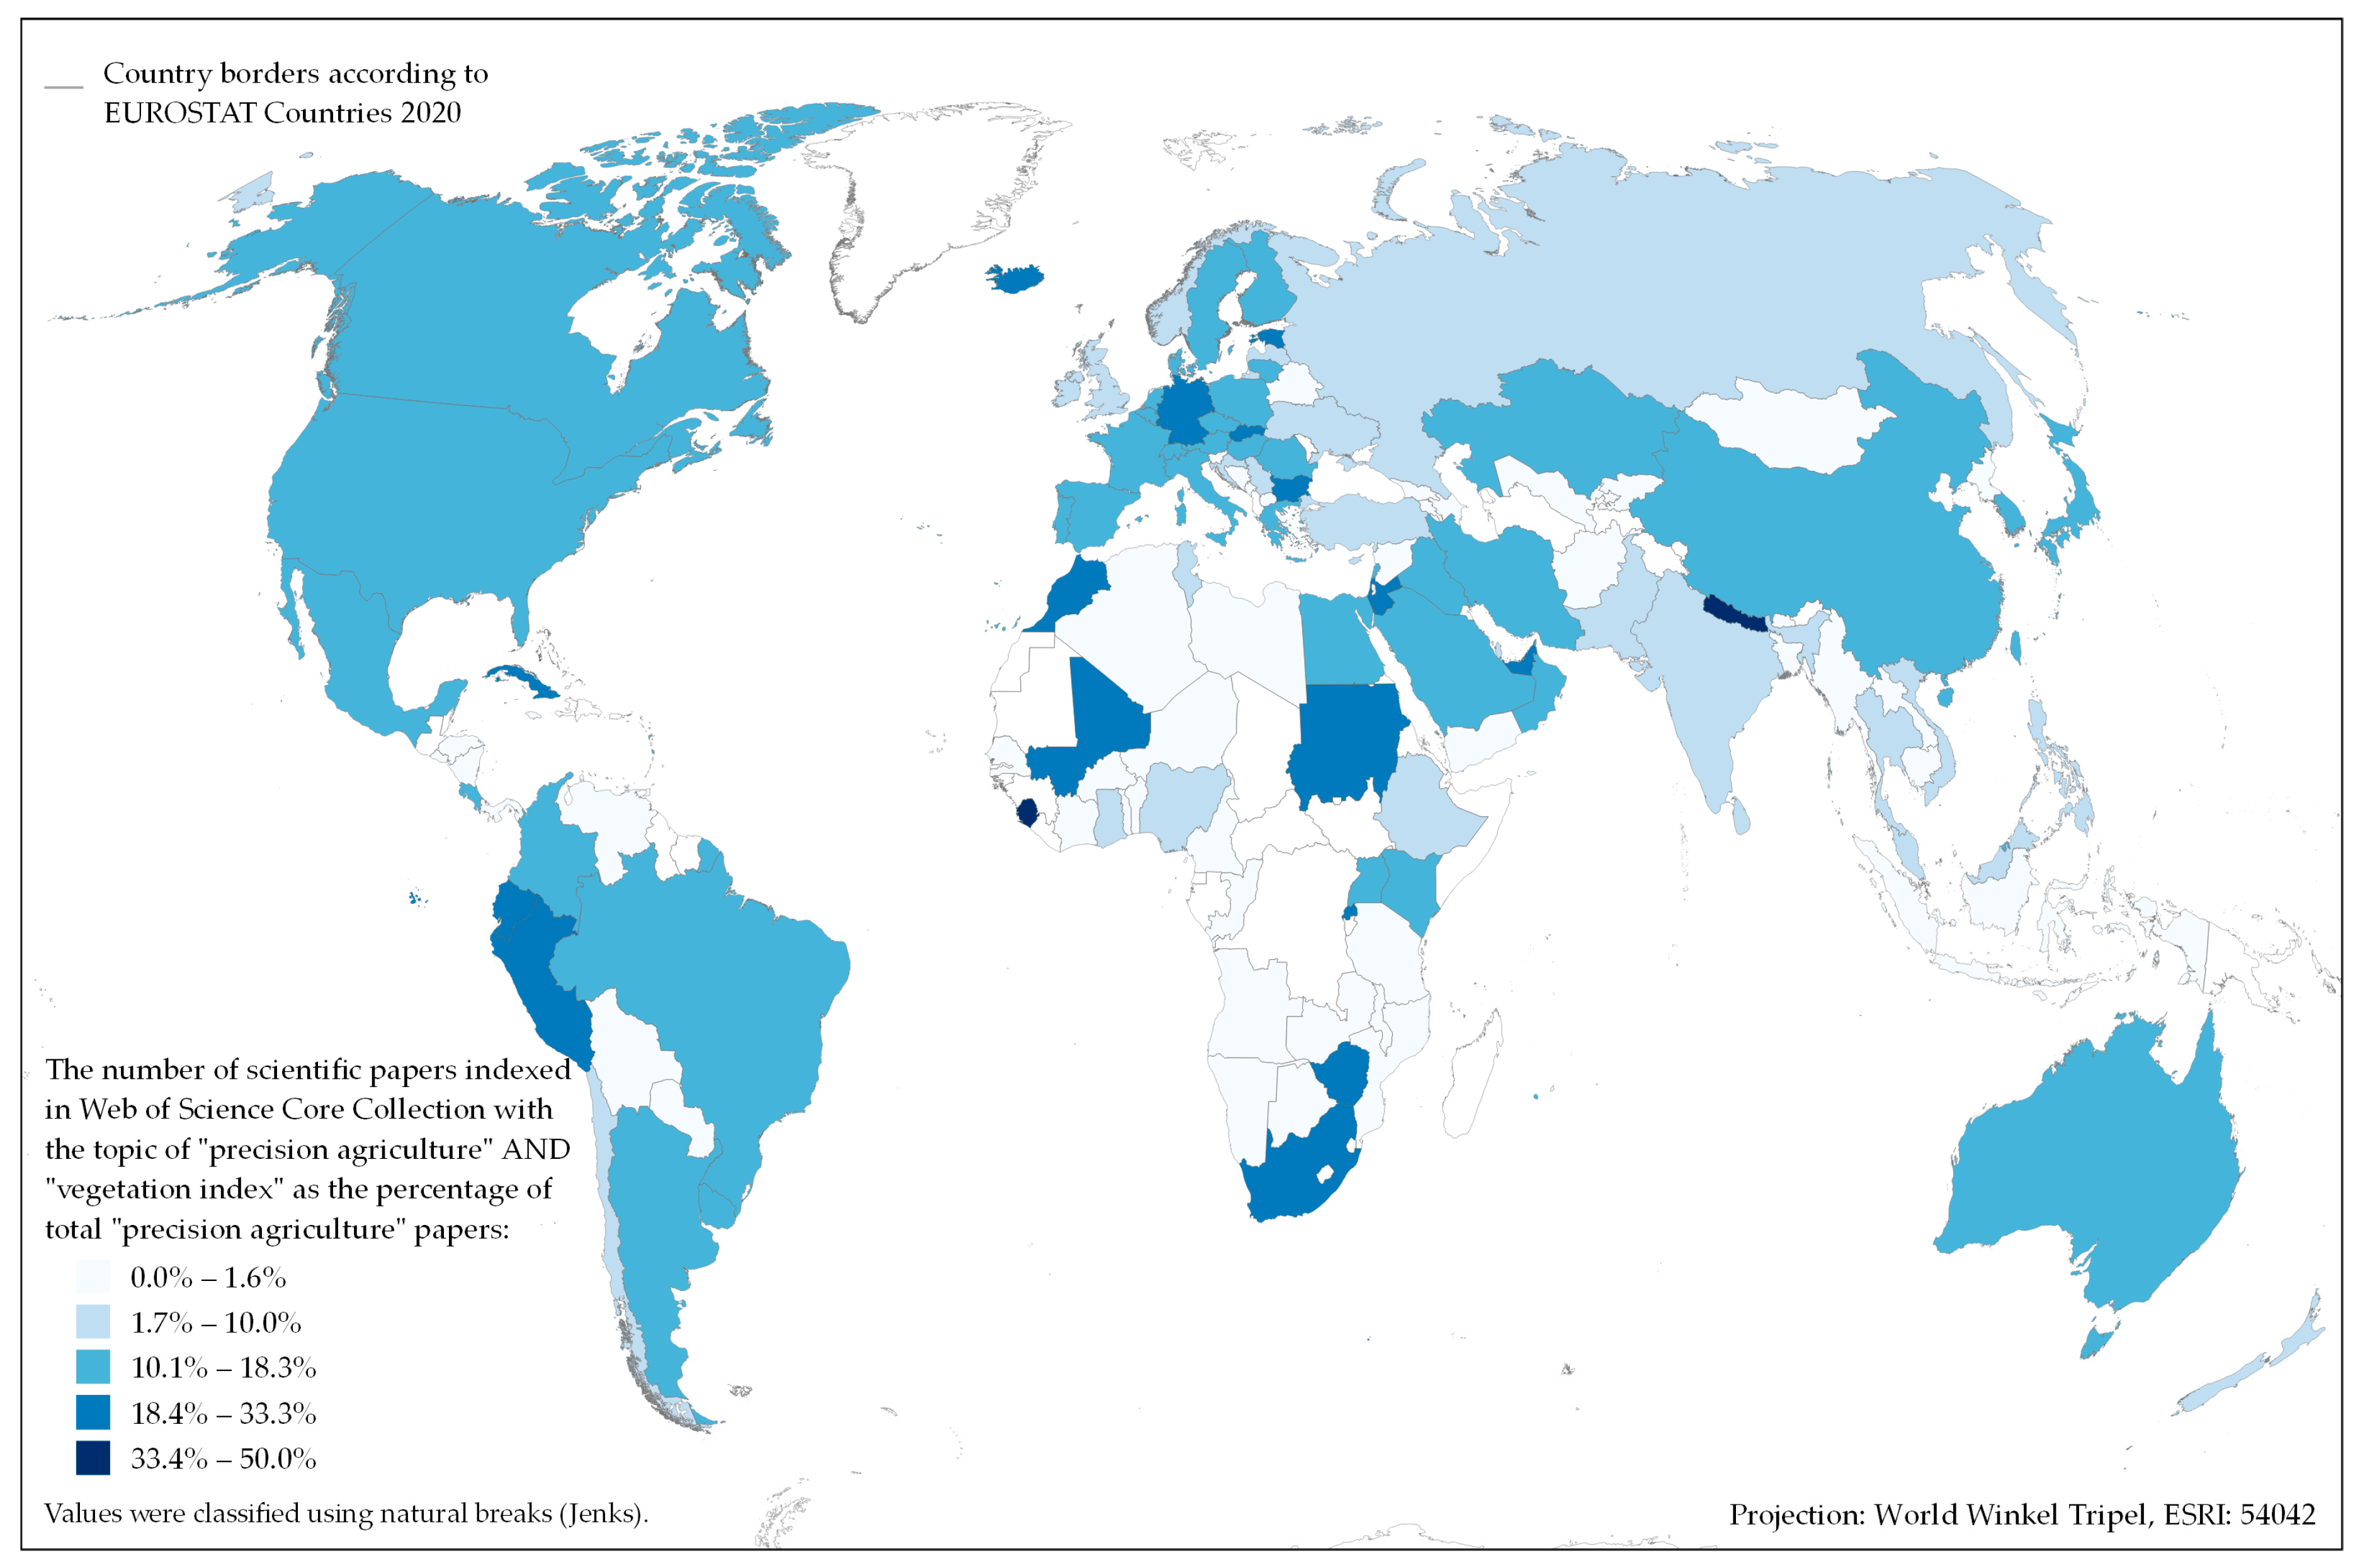
2. Global State of Vegetation-Index Application in Scientific Studies in Precision Agriculture

According to the number of scientific studies indexed in the Web of Science Core Collection (WoSCC), four independent analyses on a global scale were made, including: (1) the overall number of scientific papers with the topic of “precision agriculture”; (2) the country area in km2 per scientific paper with the topic of “precision agriculture” to provide a normalized state of scientific development per country according to the total area; (3) the number of scientific papers with the topic of “precision agriculture” AND “vegetation index”, narrowing the state of scientific studies specifically to observe reliance on vegetation indices; and (4) a percentage of scientific papers with the topic of “precision agriculture” AND “vegetation index” from overall precision-agriculture studies to provide a relative measure of the adoption of vegetation indices in research. Out of the total 9937 scientific papers that matched the search criteria, 98.7% (9811) of the papers were indexed in the year 2000 and after, indicating rapid development in the research during the past two decades.
The United States is the leading country in precision-agriculture research with 2172 papers, followed by China (1557 papers), India (802 papers), and Brazil (791 papers) (Figure 1). Farmers in the United States have been especially reported to rapidly adopt precision-agriculture technologies, such as Global Navigation Satellite System (GNSS)-enabled tractors, and unmanned aerial vehicles (UAVs) to optimize planting, fertilization, and other management practices [25]. While all countries generally follow this trend, specific countries such as China have focused on sustainability goals, including the reduced use of fertilizers and pesticides, optimizing water use, and reducing waste following their historical issues with environmental pollution [26,27]. While several larger countries dominate with regard to the total number of scientific studies based on precision agriculture, the ratio of country area per scientific paper indicates a relatively uniform global development of precision agriculture, with the exclusion of Africa (Figure 2).
The predominance in precision-agriculture research of countries with a large populations and those that are global economic leaders is an expected consequence of the long-term funding for research and development, as well as programs to help farmers adopt these technologies [28]. With access to advanced technology, such countries have developed strong technology industries and many companies that specialize in developing agricultural technologies [29]. Moreover, these countries have a high demand for food due to their large populations, and as a result, they have developed large-scale farming operations [30]. Precision-agriculture technologies are particularly well-suited to large-scale operations, as they allow farmers to gather data on their crops quickly and easily, and make informed decisions about how to manage their fields [31].
The scientific studies which explicitly included vegetation indices in precision-agriculture topics have noticeably lower absolute numbers, while their global distribution is very similar to the overall number of precision-agriculture studies (Figure 3). Behind China (262 papers) and the United States (239 papers), European countries adopted vegetation indices the most in published studies, with Spain (119 papers), Italy (115 papers), and Germany (108 papers) as the leading European countries. Meanwhile, the ratio of studies on a national level that utilized vegetation indices with overall precision-agriculture studies is more globally balanced (Figure 4). Of the countries with at least ten overall precision-agriculture studies, several African countries (South Africa, Zimbabwe, Mali, and Morocco) were among the top-ranked in this category and will likely benefit from the further advancement of the utilization of vegetation indices in precision agriculture [32,33]. The state of precision agriculture in African countries is still in its early stages, but there is growing interest and investment in this area [34]. The main restrictions of financial resources for the initial investment caused inadequate access to required agricultural machinery and sensors, as well as the infrastructural lack of reliable internet connection [35].

3. Present and Future Vegetation-Index-Based Applications in Precision Agriculture Using Artificial Intelligence

Various vegetation indices are sensitive to different aspects of plant physiology, such as chlorophyll content, leaf area, and water stress, and can be used to identify areas of the field that require attention or treatment [36]. To efficiently manage large spectral data and vegetation indices, there has been a growing interest in research using artificial intelligence (AI) to extract valuable information about crop health and yield. While AI in precision agriculture encompasses a broad range of technologies, especially the Internet of Things (IoT) [37], the classification and regression using machine learning and deep learning are primary technologies for processing vegetation index data [38,39]. However, it is important to note that these techniques require significant data and computational resources, as well as careful calibration and validation to ensure accuracy and reliability [40]. As such, their use must be balanced with other tools and knowledge to make informed decisions about crop management in a dynamic and complex environment.
By determining the changes in vegetation indices based on multitemporal images, previous studies detected intra-field zones that are experiencing crop stress, caused by either water or nutrient deficiency [16]. On a larger scale, machine learning and deep learning algorithms were successfully adopted to classify different crops and identify areas of the field where crop rotation or intercropping may be beneficial [41,42]. Another frequent application of vegetation indices in recent research is crop-yield prediction, which is often based on machine-learning regression, using multitemporal vegetation indices as covariates [43]. This information can be used to make informed decisions about harvesting and marketing the crop, ensuring the optimization of agricultural inputs in future growing seasons. To determine low potential intra-field areas, it is possible to avoid low yield by adjusting input-use as a part of variable-rate technology (VRT), especially crop disease detection and management, enabling the development of algorithms to prevent the spread of disease and minimize crop loss [44]. Moreover, they are also being increasingly used for precision fertilization with the aim of determining the optimal amount and timing of fertilizer application [45]. This allows minimization of fertilizer use, which can be expensive and harmful to the environment, while maximizing crop yield. If a selected vegetation index indicates that a particular area of the field is experiencing a nutrient deficiency, the fertilizer specifically can be applied to that area to address the deficiency without overapplying fertilizer to other areas of the field.
While their application is presently widespread, there are several potential future applications of vegetation indices in precision agriculture that are not presently utilized. One such application is the use of high-resolution imagery and machine-learning algorithms to map soil properties and variability across a field. By combining soil data with vegetation indices, the present studies can be additionally enriched in the scope of fertilization, irrigation, and planting, leading to improved crop health and yield [46]. Another potential application is the use of vegetation indices to detect and monitor the presence of invasive plant species. Invasive species can cause significant crop damage, and early detection is crucial for effective management [47]. There is also untapped potential for vegetation indices to be more exploited in precision harvesting, especially in determining the optimal time to harvest the crops for maximum yield and quality [48]. This could be particularly useful for crops such as fruits and vegetables, where harvest timing is critical for maintaining freshness and flavor. Precision agriculture has also rapidly evolved to be an essential aspect of modern agricultural management, relying on vegetation indices for input data. The implementation of Agricultural Health and Safety (AHR) practices in precision agriculture has yielded promising results in achieving sustainable agriculture management [49]. The application of AHR techniques in precision agriculture has resulted in transferable and applicable results for agricultural managers in several ways. Firstly, AHR practices have provided a framework for precision-agriculture managers to operate with minimal negative impacts on the environment and human health, as well as improving soil quality and productivity, resulting in increased crop yields and farm profitability [50]. The benefits of AHR applications in precision agriculture are therefore transferable and applicable to agricultural managers seeking to improve the overall sustainability of their agricultural practices.

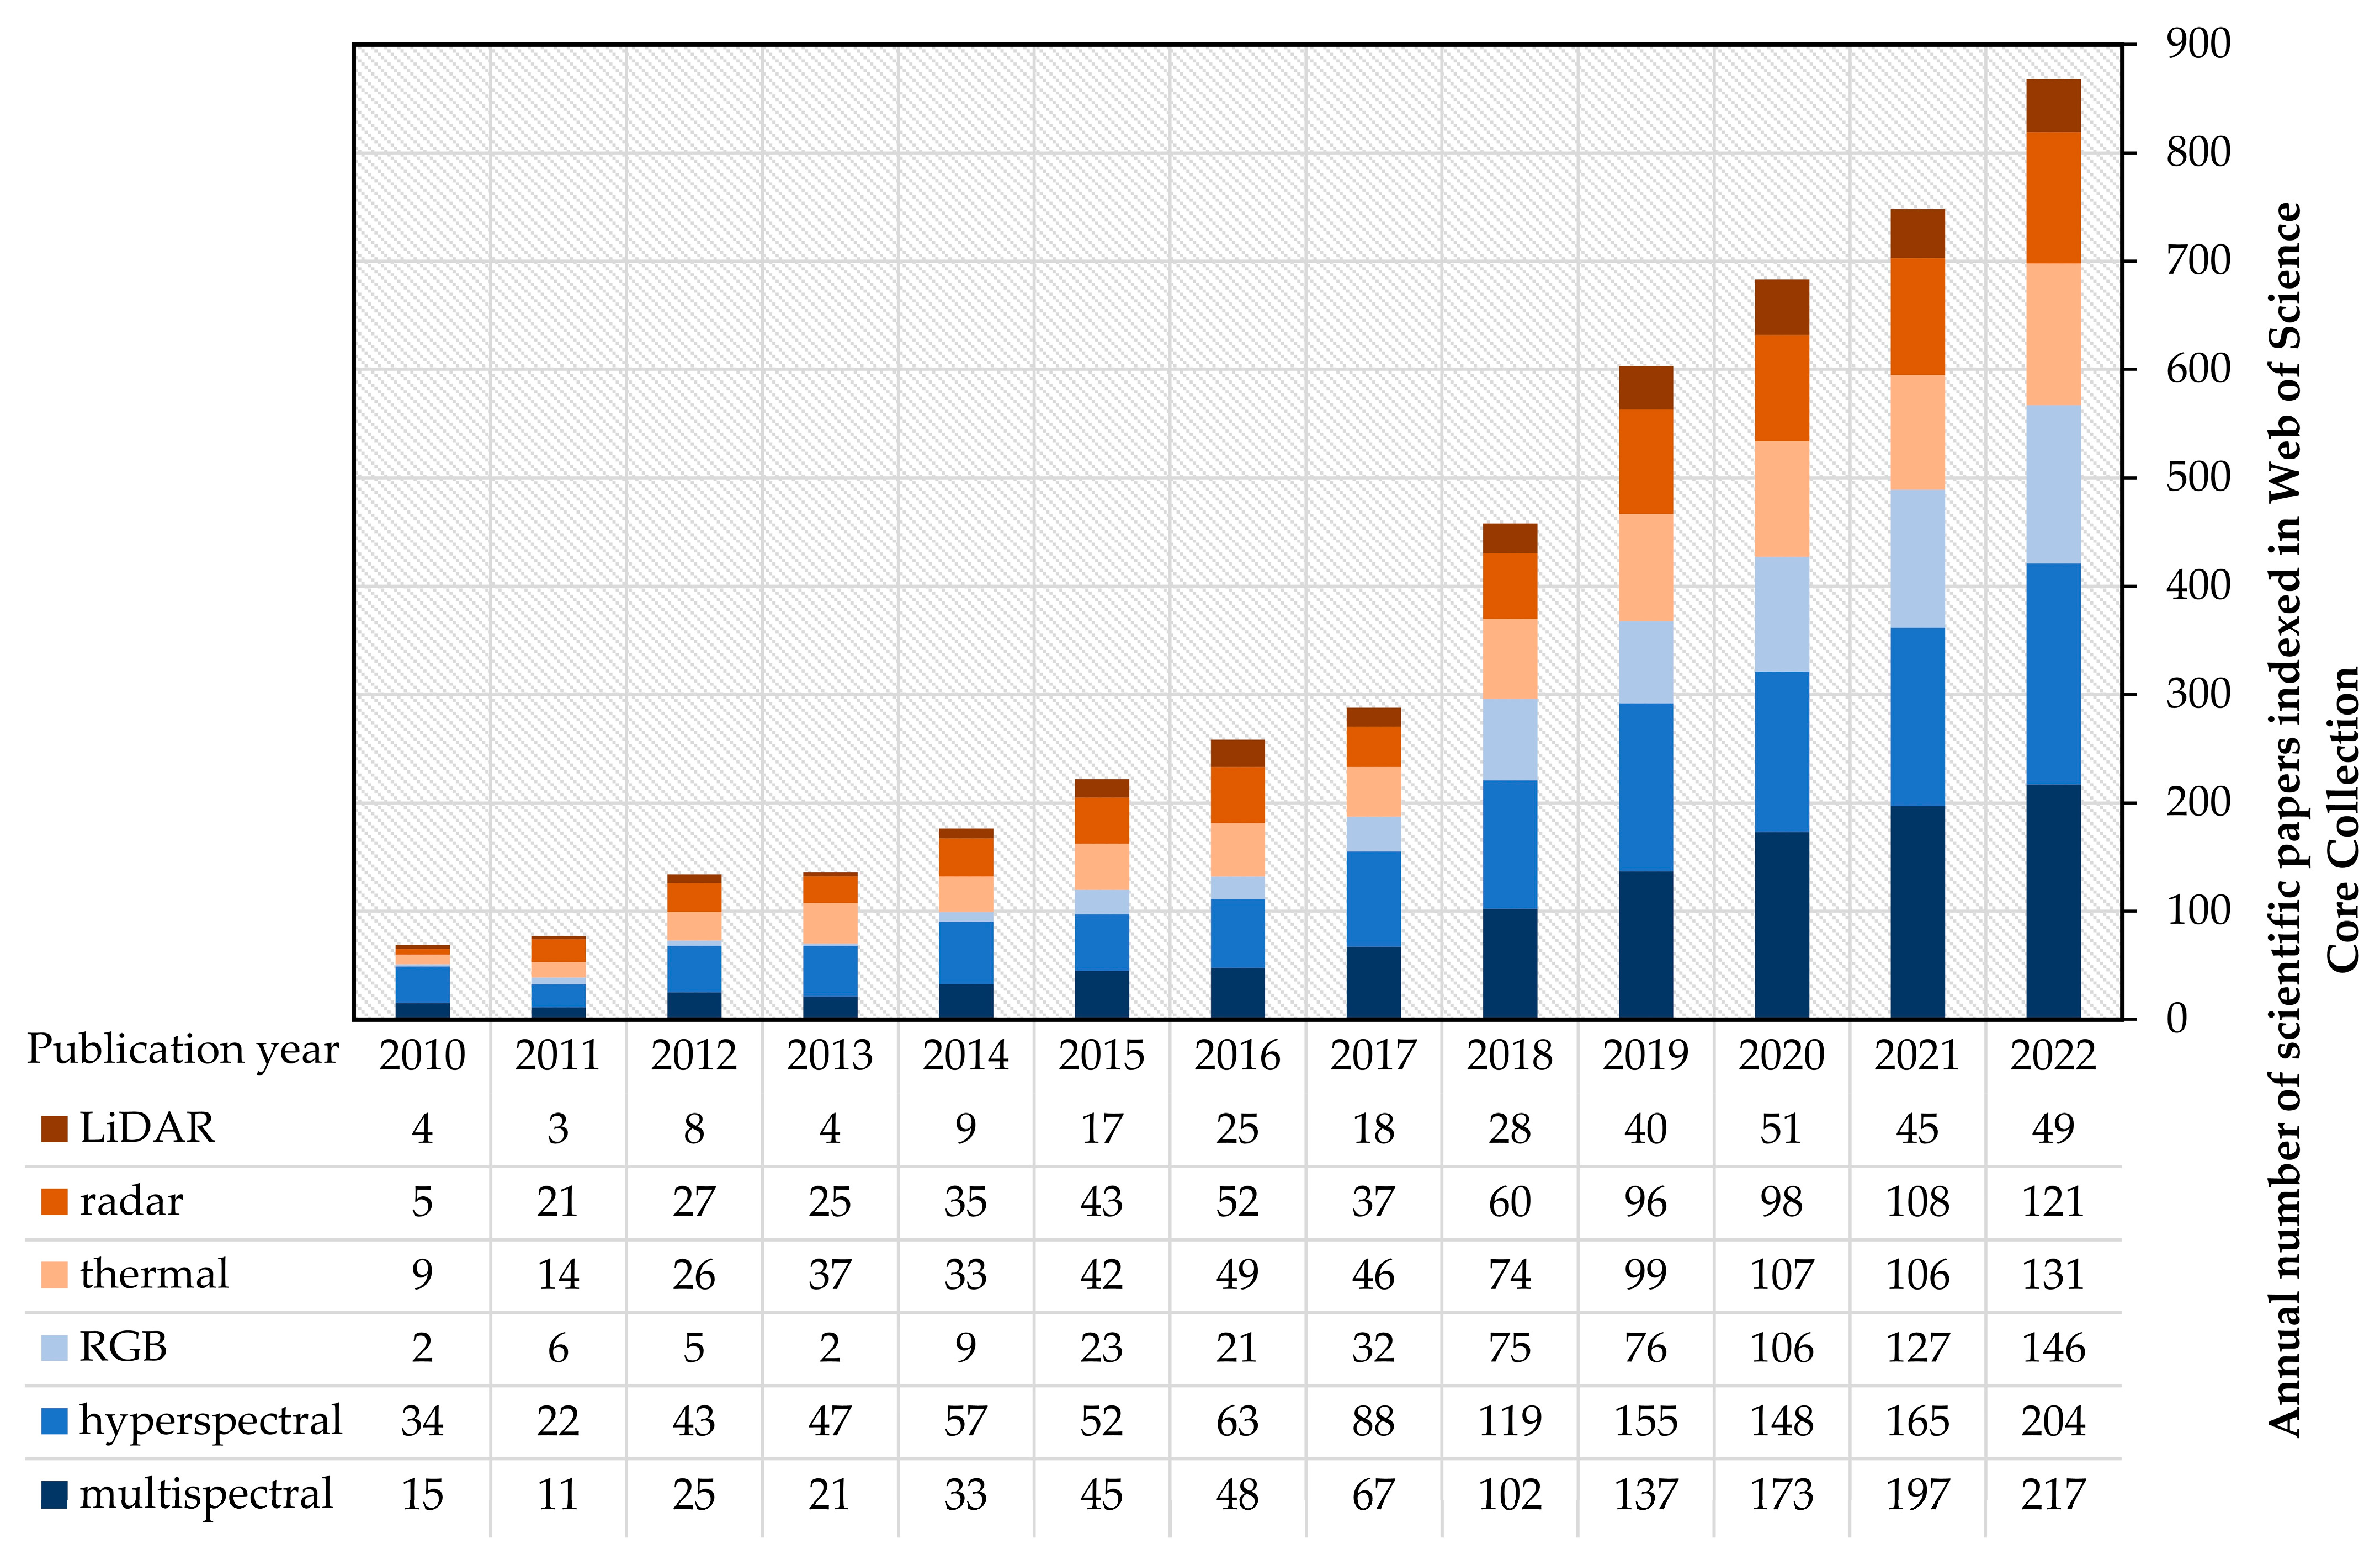
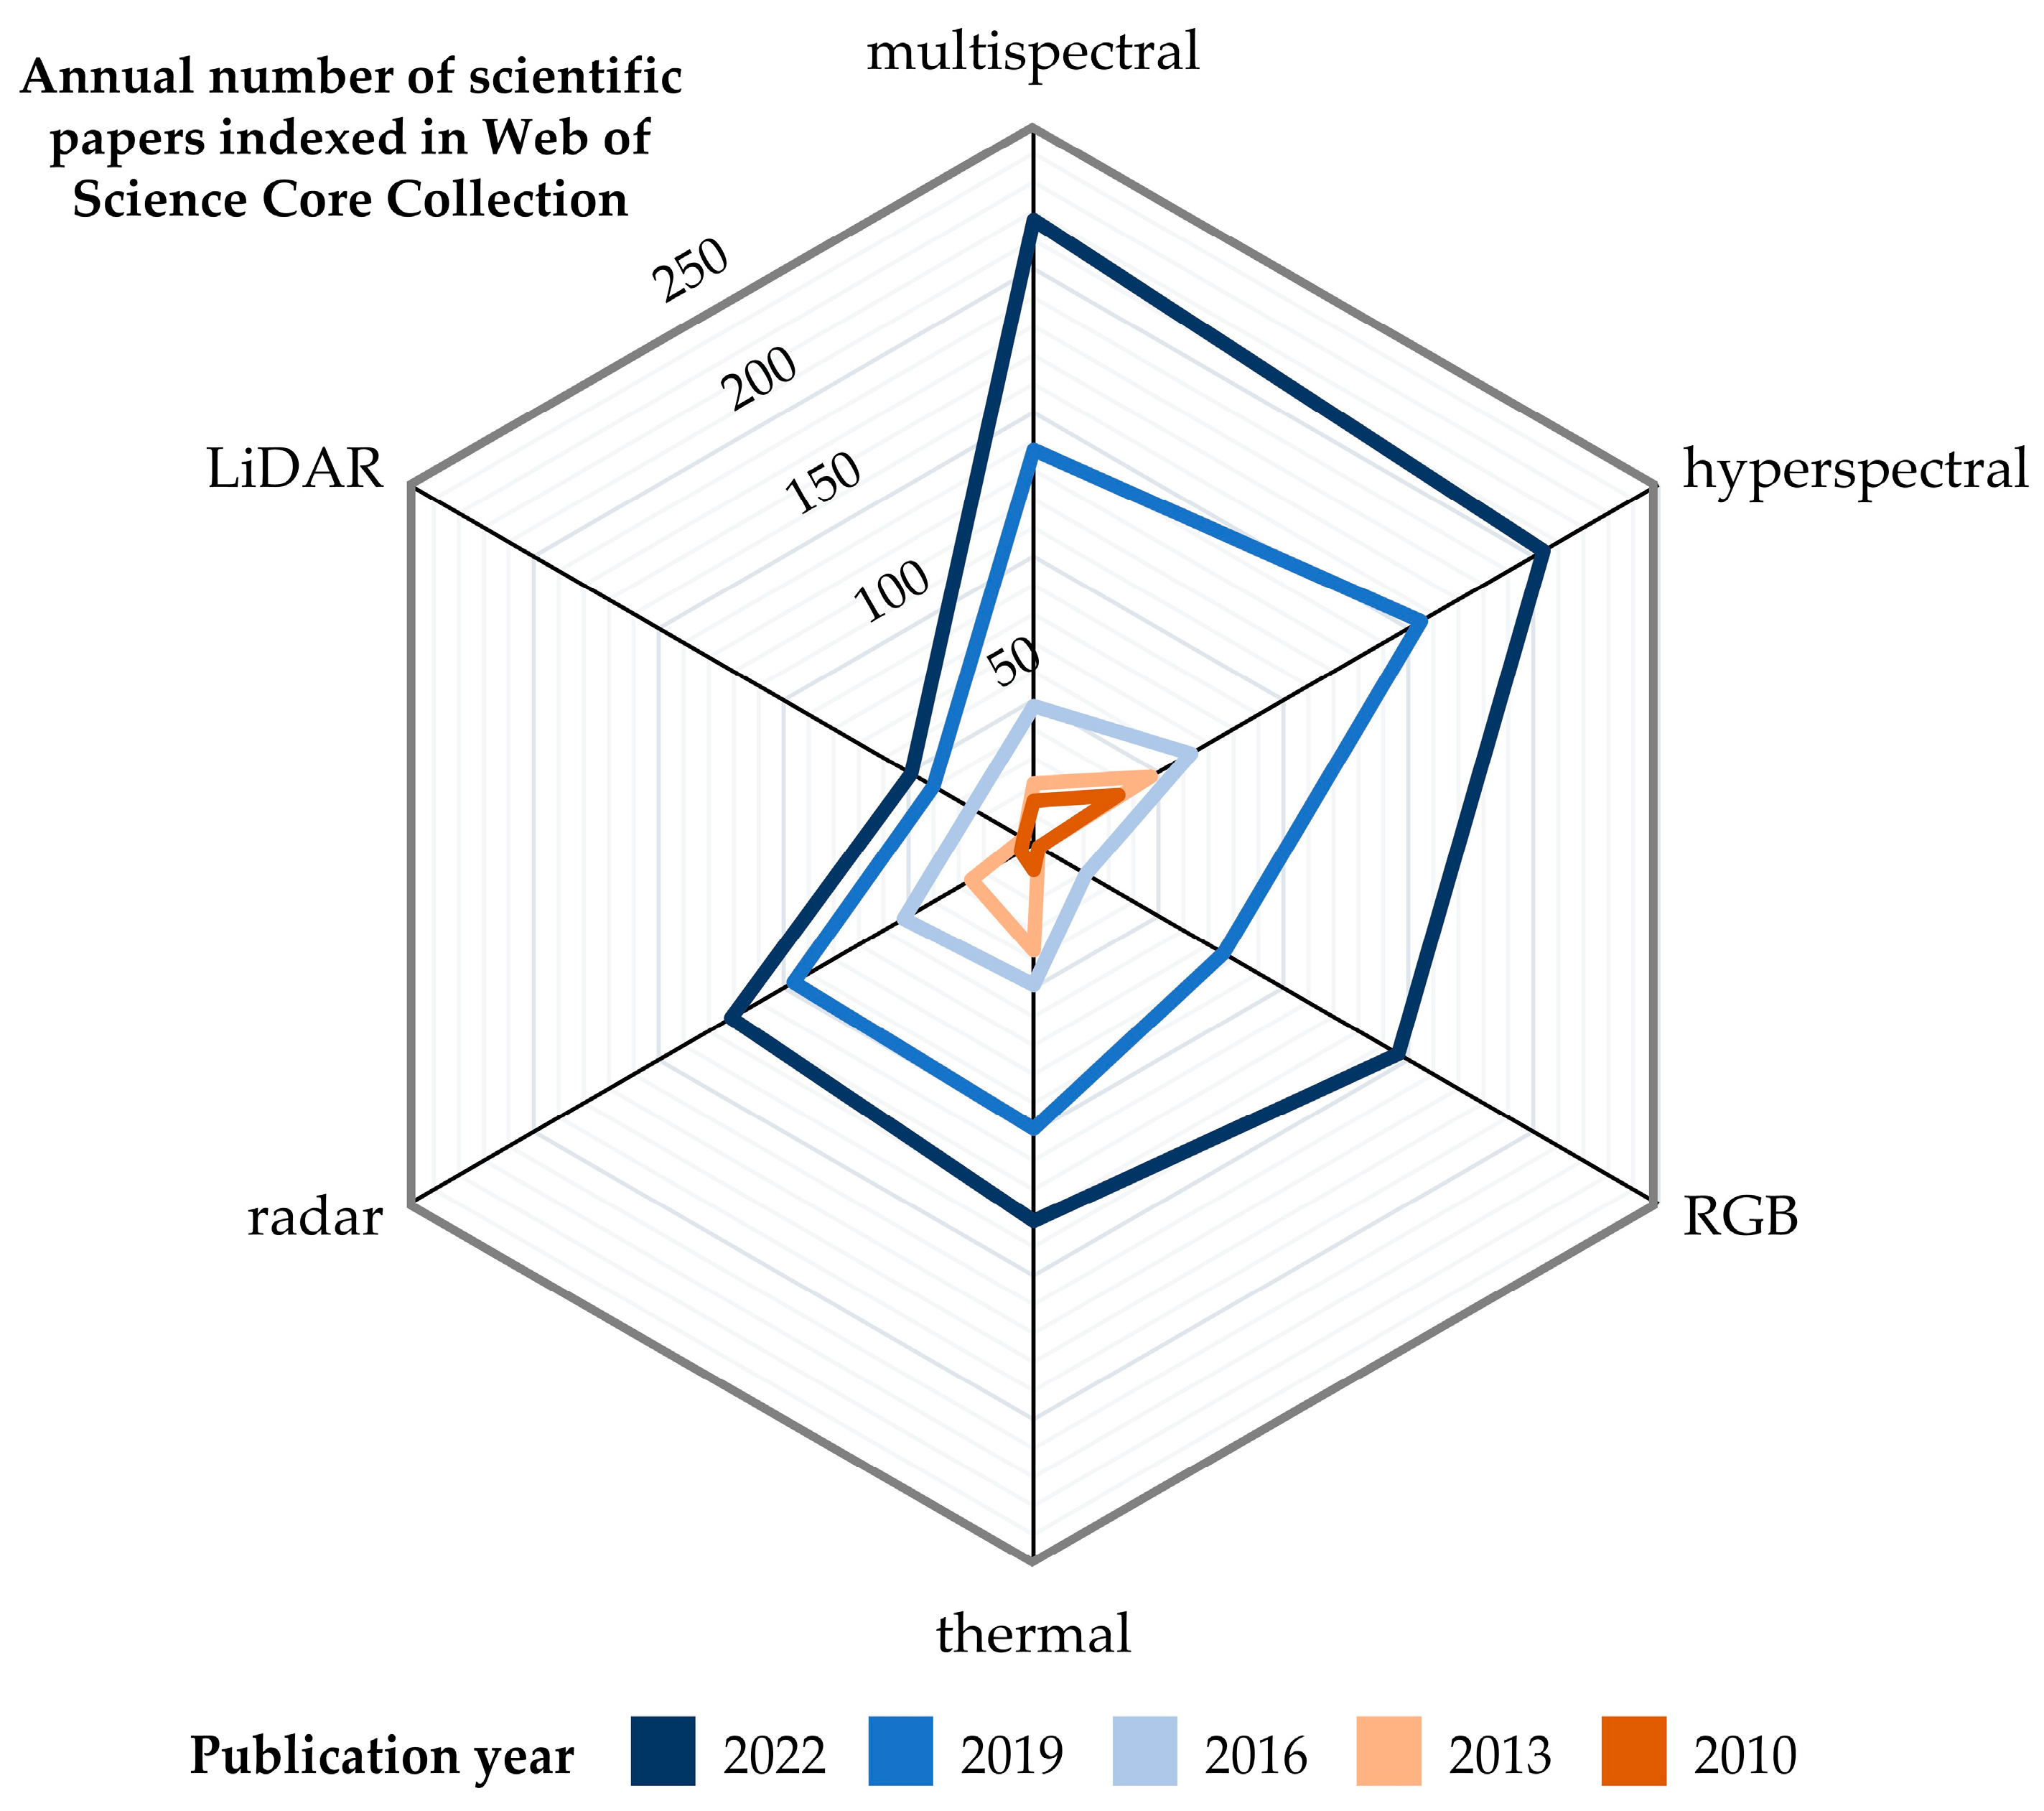
4. Sensors Used for Calculating Vegetation Indices in Precision Agriculture

Available remote-sensing sensors have different spectral and spatial resolutions, as well as varying levels of atmospheric correction capabilities, which can affect the accuracy and reliability of vegetation-index calculations [51]. The sensors with higher spectral resolution can detect finer differences in plant reflectance, allowing for more accurate discrimination between different plant species and more precise measurement of vegetation parameters, such as chlorophyll content and leaf area [52]. On the other hand, sensors with higher spatial resolution can provide more detailed and accurate maps of vegetation patterns and distribution, allowing for finer-scale analysis of crop health and productivity [53]. The recent studies noted RGB, multispectral, hyperspectral, thermal, radar, and LiDAR sensors as the most frequently applied remote-sensing tools for determining crop properties [54,55]. WoSCC was therefore searched for scientific papers with the topic of “precision agriculture” and sensor types, including “multispectral”, “hyperspectral”, “RGB”, “thermal”, “radar”, and “LiDAR”. Among them, RGB, multispectral, and hyperspectral sensors offer the capability of calculating vegetation indices due to spectral coverage in visible and near-infrared bands [56]. According to the number of scientific papers indexed in WoSCC since 2010, multispectral, hyperspectral, and RGB sensors are predominantly used in precision agriculture, with RGB sensors becoming increasingly more popular since the mid-2010s (Figure 5). The overall number of studies utilizing any of the analyzed sensor types grew rapidly in the past decade, growing 10-fold since 2010 and more than tripling between 2016 and 2022 (Figure 6).
While hyperspectral sensors offer the most advanced capabilities of sensing and calculating vegetation indices of the listed sensors, the high cost of commercial solutions for hyperspectral imaging presently restricts their widespread use [57]. Both RGB (red, green, blue) and multispectral sensors are more accessible and affordable for widespread vegetation-index calculation in precision agriculture, although they have different strengths and limitations [58]. RGB sensors, commonly found in low-cost consumer drones and cameras, can be used to visually inspect crop health and detect any obvious issues, such as pests or diseases, but they are limited in their ability to measure the subtler differences in plant reflectance that are indicative of changes in vegetation health and productivity [59]. Multispectral sensors, on the other hand, are designed to capture a wider range of wavelengths, including both visible and near-infrared light. This allows for the measurement of plant reflectance in different spectral bands, which can be used to calculate vegetation indices that provide more detailed information about vegetation health and productivity [60]. While RGB sensors can provide a quick visual assessment of crop health, multispectral sensors are typically better suited for vegetation-index calculation and more detailed analysis of vegetation health and productivity in precision agriculture [17].

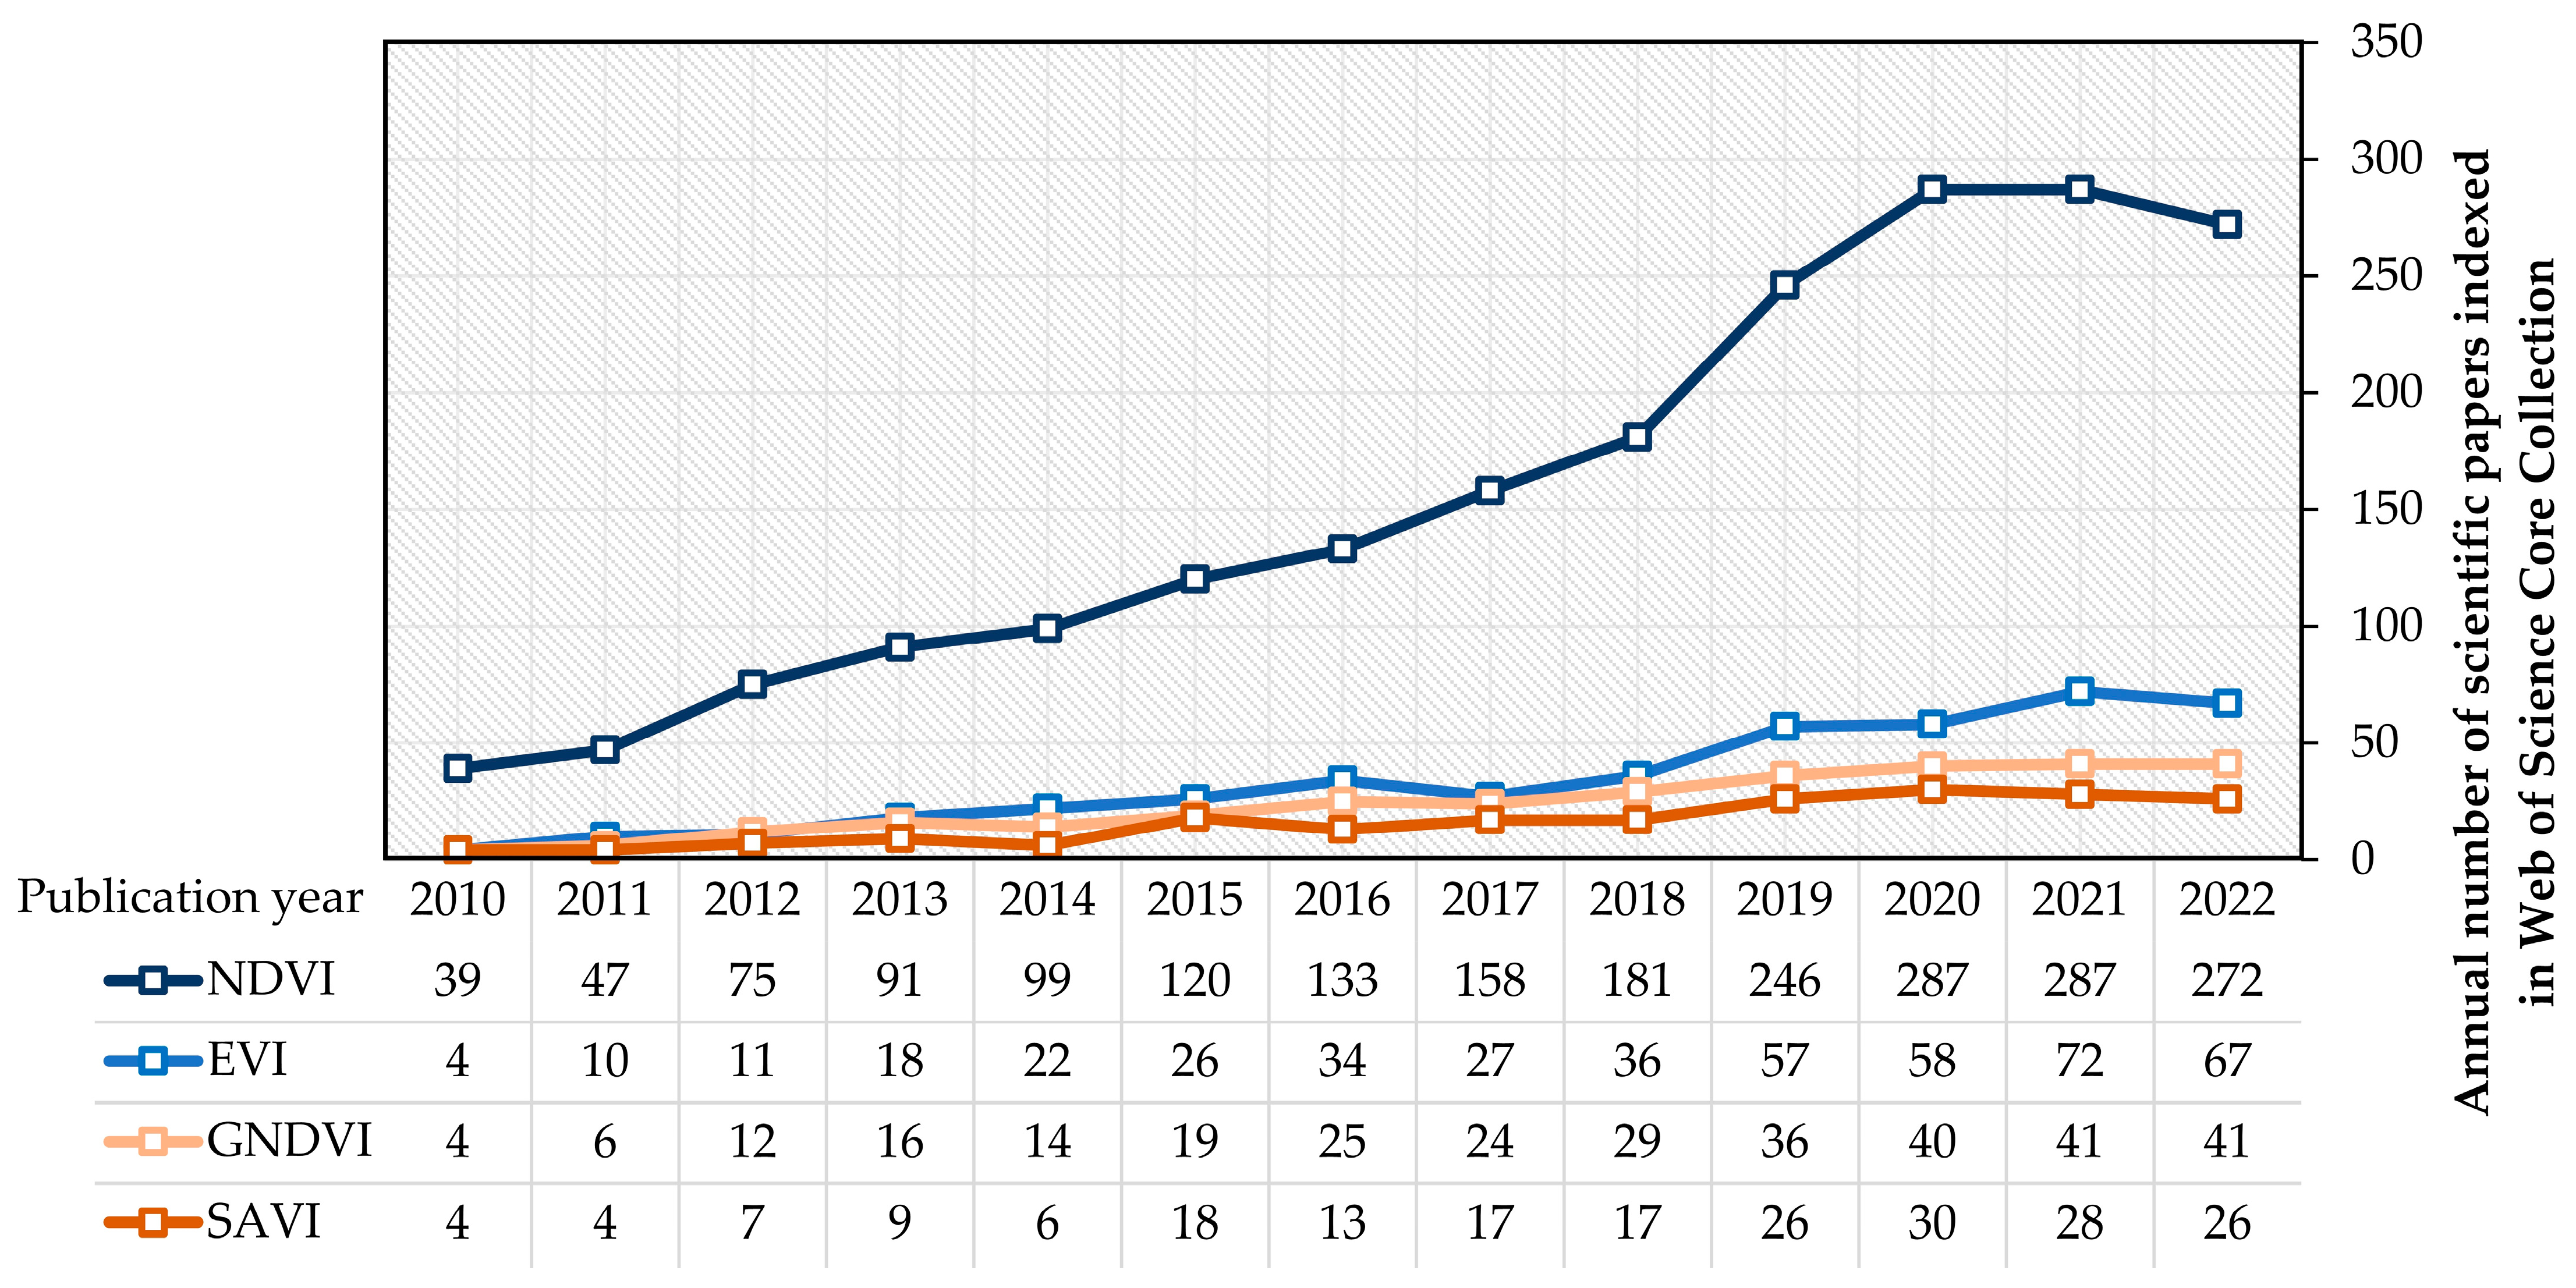
5. Major Vegetation Indices in Precision Agriculture Based on Multispectral Sensors

According to the number of scientific papers indexed in WoSCC since 2000 with the topic of “precision agriculture” and vegetation indices based on multispectral sensors, the NDVI was dominantly the most frequently used vegetation index in precision agriculture with a total of 2200 studies (Table 1). Like most vegetation indices based on multispectral sensors, NDVI is calculated using the reflectance values of red and near-infrared light, and it provides a measure of the greenness or photosynthetic activity of vegetation [61]. China (553 papers) and the United States (484 papers) accounted for 47.1% of these papers. With the additional query of “yield” in the topic search, 1046 papers were identified, as well as 382 papers for “biomass” and 140 papers for “fertilization”. The majority of these studies were based on satellite mission data (925 papers), as opposed to unmanned aerial vehicle (UAV) images (303 papers), out of which 162 papers were indexed from 2020 to 2022. The research of NDVI for the prediction of crop traits, especially yield and biomass, of various crops was proven successful, while the exact effect of remote-sensing platforms on prediction accuracy is still unclear. The wheat-yield prediction based on NDVI was a particularly frequent research topic, for which Guan et al. [62] achieved the coefficient of determination (R2) in the range of 0.60–0.81 based on UAV images, while the studies by Labus et al. [63] and Vannoppen and Gobin [64] produced R2 from 0.44 to 0.75, and 0.66 for the same aim of wheat-yield prediction while utilizing satellite images. Moreover, a study by Benincasa et al. [65] aimed specifically to determine the ability of NDVI from the comparison of satellite and UAV images to predict several wheat parameters according to ground-truth data. The performance from UAV data slightly outperformed satellite data based on the highest achieved R2, with its range of 0.56–0.94 for UAV and 0.40–0.91 for satellite data. However, due to large value ranges of achieved R2 values, the reliable expectancy of the use of NDVI in predicting crop traits can hardly be made, as many variables affect the outcome, including the study area, the quantity of ground-truth data, and seasonal weather conditions [66].
Despite the immense popularity of NDVI in scientific studies of precision agriculture in the past decade (Figure 7), several indices were developed to improve its drawbacks, potentially providing more effective crop monitoring and assessment depending on the field and crop conditions. Among them, EVI improves NDVI by minimizing the effects of soil background and atmospheric influences [75]. EVI takes into account the non-linear relationship between reflectance and vegetation coverage, and it includes the blue reflectance in addition to the red and near-infrared bands used in NDVI [76]. This makes EVI a more robust index for analyzing vegetation health and vigor, especially in areas with high soil background or atmospheric interference [77]. By replacing the red band with green in NDVI formula, GNDVI is potentially more suitable in areas with high soil background or atmospheric interference [78]. GNDVI may also be more effective than NDVI at detecting changes in vegetation caused by environmental factors such as water stress, disease, or nutrient deficiencies [79]. By using the soil adjustment factor, SAVI also aims to minimize the influence of soil background and improve the sensitivity of NDVI in areas with high soil background [80]. While SAVI is useful in areas with mixed vegetation types, SAVI may not be as effective as NDVI in areas with low soil background or in areas where vegetation is not the dominant land cover [81].

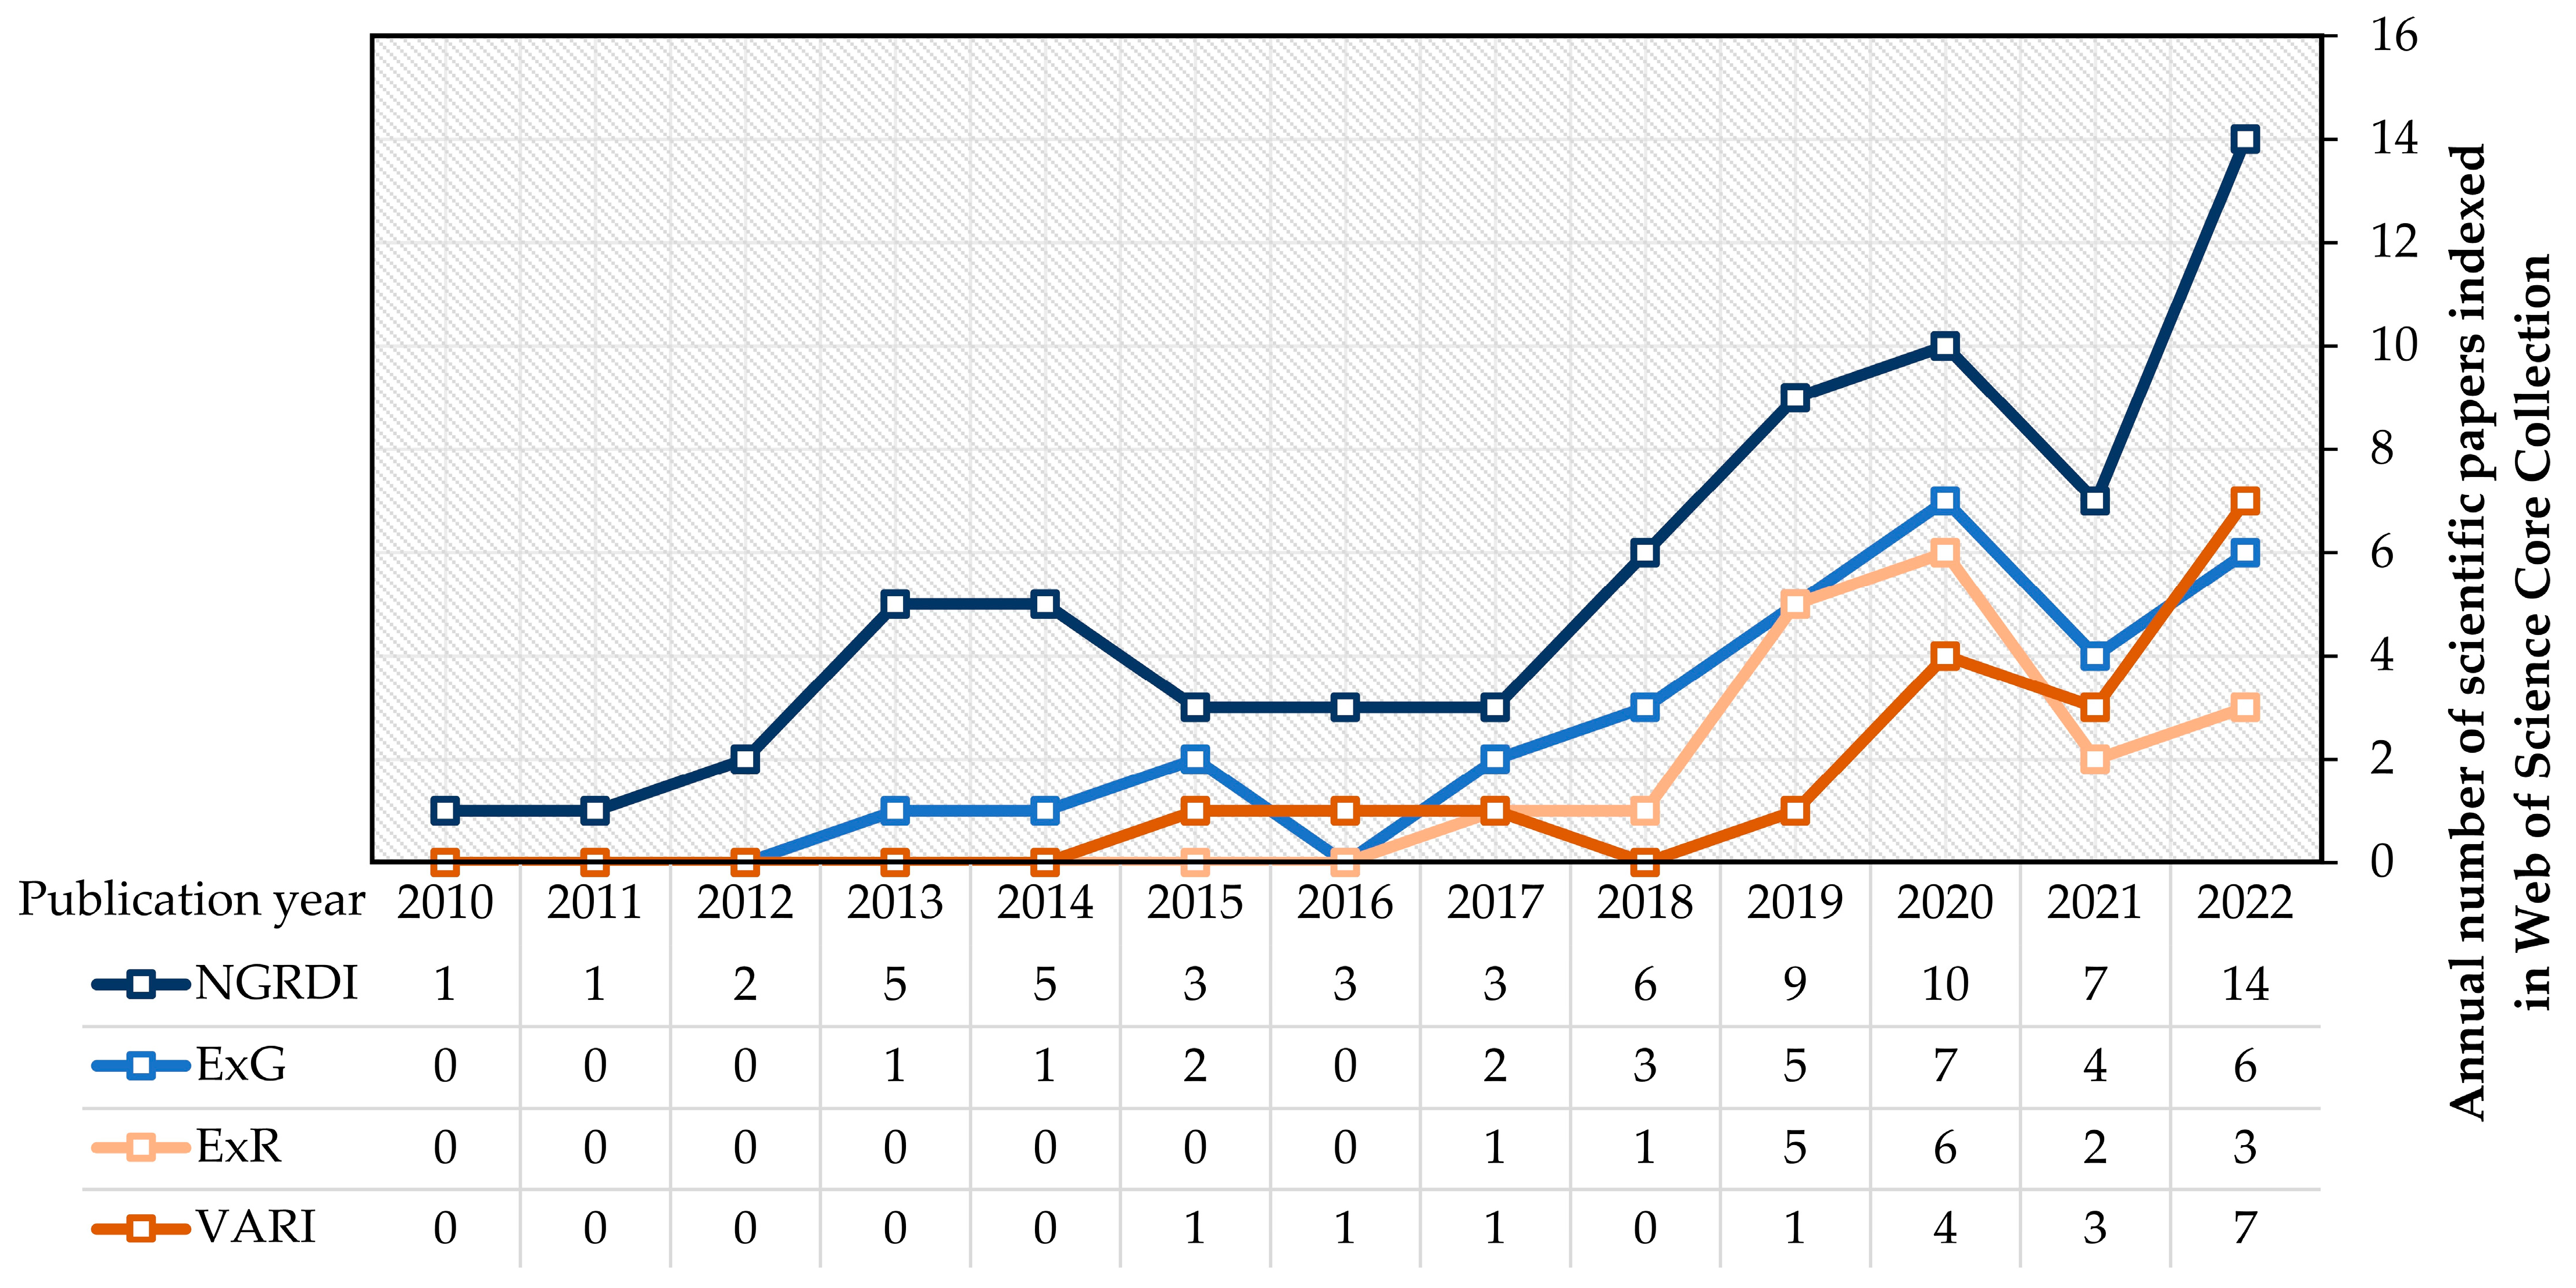
6. Major Vegetation Indices in Precision Agriculture Based on RGB Sensors

Similar to the case of major vegetation indices based on multispectral sensors, the normalized green–red difference index (NGRDI) has been the predominantly used index of the available indices based on RGB sensors during the past decade, based on the scientific papers indexed in WoSCC with the topic of “precision agriculture” and vegetation indices based on RGB sensors (Table 2). The NGRDI provides a low-cost solution to replace NDVI using the RGB sensors, allowing a similar degree of sensitivity to changes in chlorophyll content in plants by replacing near-infrared with green reflectance [82]. While the NGRDI can be a useful index for detecting early signs of crop stress or disease [83], the NDVI provides a more comprehensive assessment of vegetation health and productivity. Since NGRDI is primarily sensitive to chlorophyll content in plants [84], while the NDVI is sensitive to the amount of vegetation present, including leaves, stems, and branches, its application in precision agriculture is less obstructed than areas with more heterogeneous vegetation, such as forestry [85]. However, the NGRDI has been shown to have low variability across different crop types, while the NDVI can vary significantly depending on the type of vegetation being measured [86]. Many authors supported the claim that vegetation indices based on multispectral sensors enable superior performance in precision agriculture to indices based on RGB sensors [24], while the latter are still an adequate low-cost alternative [87]. The United States (20 papers) and China (15 papers) accounted for the majority of scientific papers which utilized NGRDI in precision agriculture, out of which 34 papers matched the additional topic query of “yield”, having a similar percentage of total papers as NDVI. Their application was particularly focused on the UAVs, having 33 papers (45.8% of total papers), compared to satellite missions with 25 papers (34.7% of total papers).
The next top three vegetation indices based on RGB sensors with the criterion of the frequency of use in scientific studies indexed in WoSCC also noted increased use in the past few years (Figure 8). ExG and ExR indices follow NGRDI as the cost-effective solutions for the assessment of vegetation health and vigor and are mutually complementary. The ExG is sensitive to chlorophyll content of crops, with its higher values indicating healthier and more vigorous vegetation, while lower values indicate stressed or damaged vegetation [96]. The ExR is more sensitive to density and crop distribution than ExG, complementing the crop health assessment by ExG by providing the indirect information about the crop biomass [97]. The VARI is based on a similar formula to that of NGRDI, with the addition of blue reflectance in the denominator, which improves resistance to atmospheric effects such as haze, clouds, and shadows [98]. It is particularly useful in areas with high atmospheric interference, such as urban environments or areas with frequent cloud cover, where other vegetation indices may be less reliable [99]. It is also useful for monitoring vegetation health in areas with mixed land use or variable soil conditions, where the vegetation signal may be mixed with non-vegetation signals [100].

7. Conclusions and Limitations of the Review

According to the scientific papers indexed in WoSCC, vegetation indices are a valuable tool in precision agriculture, providing information on the health and growth of crops and aiding farmers to make informed decisions and improve their yields. A total of 9937 scientific papers were analyzed in the study, out of which 98.7% of the papers were indexed in 2000 or later. While their development gradually deceased in the past decade, there are still unknowns of their ability to provide information about crop health in varying field conditions. With advances in technology and data processing, vegetation indices will potentially be calculated with greater accuracy and at higher spatial resolutions. This could be primarily influenced by the increased use of multispectral and hyperspectral sensors, according to trends in their frequency of use in scientific studies indexed in WoSCC. As their cost decreases and their availability increases, particularly in less developed areas of the world, a more widespread adoption of vegetation indices in precision agriculture is expected. United States and China lead the world in quantity of scientific studies in precision agriculture and the application of vegetation indices, while their scientific development is much more balanced on a global scale when observed relative to country area. Despite a low total number of studies, several African countries showed a tendency of focusing on vegetation indices in precision-agriculture studies, which could be further improved by lower cost and increased availability of remote-sensing sensors.
The NDVI was determined as the dominant vegetation index in precision agriculture per scientific papers indexed in WoSCC in the past two decades, having a total of 2200 papers which matched the topic of its application in precision agriculture. The primary application of NDVI in precision agriculture was based on satellite mission data, including the prediction of crop traits with research topic which included “yield”, followed by “biomass” and “fertilization”. Despite the potential advantages of EVI, GNDVI, and SAVI over NDVI, it has a longer history of use in remote sensing and precision agriculture, with its expected value and performance according to ground-truth data being well documented and researched over the years. Therefore, the increased focus on alternative vegetation indices based on multispectral sensors might benefit the global knowledge of the application of remote-sensing data in the assessment of crop health. The RGB sensors had increased popularity in scientific studies in the past few years, primarily with the focus of developing low-cost solutions available to farmers, but otherwise significantly trail behind vegetation indices based on multispectral sensors in their frequency in scientific studies. Contrary to NDVI, the most popular RGB vegetation index, NGRDI, was primarily applied using UAV images, which indicates its significance in scientific studies focusing on the low-cost solutions in precision agriculture, which are accessible to farmers. Nevertheless, every analyzed aspect of vegetation indices in precision agriculture regardless of the sensor used is in a state of rapid growth in scientific studies, which is expected to produce continuous development in the future.
While WoSCC provided a straightforward solution for analyzing the number of scientific papers which match selected topics, the limitation of this study is that study counts are not fully reliable, primarily in two ways: (1) the scientific papers might be reporting the use of vegetation indices in precision agriculture as the part of a discussion, which implies that they were not directly involved in the research and (2) search results included review papers which analyzed an aspect of the use of vegetation indices in precision agriculture. Additionally, there are fundamental limitations of vegetation indices that should be considered when using them in precision agriculture. Environmental factors such as cloud cover, atmospheric conditions, and soil moisture can impact the accuracy and reliability of vegetation-index measurements. These factors must be accounted for in data analysis to ensure that the measurements are meaningful. Calibration is also an important consideration, as vegetation indices must be calibrated to account for differences in sensor characteristics, atmospheric conditions, and other factors that can impact the accuracy of measurements. Failure to calibrate vegetation indices properly can lead to incorrect interpretations of data and incorrect crop-management decisions.

Author Contributions

Conceptualization, D.R.; methodology, D.R.; software, D.R.; validation, M.J.; formal analysis, D.R., A.Š. and R.M.; investigation, D.R., A.Š. and R.M.; resources, D.R.; data curation, D.R.; writing—original draft preparation, D.R.; writing—review and editing, D.R., A.Š., R.M. and M.J.; visualization, D.R.; supervision, M.J.; project administration, M.J.; funding acquisition, D.R. and M.J. All authors have read and agreed to the published version of the manuscript.

Funding

This research received no external funding.

Institutional Review Board Statement

Not applicable.

Informed Consent Statement

Not applicable.

Data Availability Statement

Publicly available datasets were analyzed in this study. This data can be found here: https://www.webofscience.com/wos/woscc/advanced-search (accessed on 14 February 2023).

Acknowledgments

This work was supported by the Faculty of Agrobiotechnical Sciences Osijek as a part of the scientific project “AgroGIT—Technical and technological crop production systems, GIS and environment protection”.

Conflicts of Interest

The authors declare no conflict of interest.

References

  1. Paul, K.; Chatterjee, S.S.; Pai, P.; Varshney, A.; Juikar, S.; Prasad, V.; Bhadra, B.; Dasgupta, S. Viable Smart Sensors and Their Application in Data Driven Agriculture. Comput. Electron. Agric. 2022, 198, 107096. [Google Scholar] [CrossRef]
  2. Brambilla, M.; Romano, E.; Toscano, P.; Cutini, M.; Biocca, M.; Ferré, C.; Comolli, R.; Bisaglia, C. From Conventional to Precision Fertilization: A Case Study on the Transition for a Small-Medium Farm. AgriEngineering 2021, 3, 438–446. [Google Scholar] [CrossRef]
  3. Paustian, M.; Theuvsen, L. Adoption of Precision Agriculture Technologies by German Crop Farmers. Precis. Agric. 2017, 18, 701–716. [Google Scholar] [CrossRef]
  4. Khanal, S.; Kc, K.; Fulton, J.P.; Shearer, S.; Ozkan, E. Remote Sensing in Agriculture—Accomplishments, Limitations, and Opportunities. Remote Sens. 2020, 12, 3783. [Google Scholar] [CrossRef]
  5. Talaviya, T.; Shah, D.; Patel, N.; Yagnik, H.; Shah, M. Implementation of Artificial Intelligence in Agriculture for Optimisation of Irrigation and Application of Pesticides and Herbicides. Artif. Intell. Agric. 2020, 4, 58–73. [Google Scholar] [CrossRef]
  6. Radočaj, D.; Jurišić, M.; Gašparović, M.; Plaščak, I.; Antonić, O. Cropland Suitability Assessment Using Satellite-Based Biophysical Vegetation Properties and Machine Learning. Agronomy 2021, 11, 1620. [Google Scholar] [CrossRef]
  7. Radočaj, D.; Jurišić, M. GIS-Based Cropland Suitability Prediction Using Machine Learning: A Novel Approach to Sustainable Agricultural Production. Agronomy 2022, 12, 2210. [Google Scholar] [CrossRef]
  8. Schmedtmann, J.; Campagnolo, M.L. Reliable Crop Identification with Satellite Imagery in the Context of Common Agriculture Policy Subsidy Control. Remote Sens. 2015, 7, 9325–9346. [Google Scholar] [CrossRef] [Green Version]
  9. Nigam, R.; Tripathy, R.; Dutta, S.; Bhagia, N.; Nagori, R.; Chandrasekar, K.; Kot, R.; Bhattacharya, B.K.; Ustin, S. Crop Type Discrimination and Health Assessment Using Hyperspectral Imaging. Curr. Sci. 2019, 116, 1108–1123. [Google Scholar] [CrossRef]
  10. Candiago, S.; Remondino, F.; De Giglio, M.; Dubbini, M.; Gattelli, M. Evaluating Multispectral Images and Vegetation Indices for Precision Farming Applications from UAV Images. Remote Sens. 2015, 7, 4026–4047. [Google Scholar] [CrossRef] [Green Version]
  11. Nduku, L.; Munghemezulu, C.; Mashaba-Munghemezulu, Z.; Kalumba, A.M.; Chirima, G.J.; Masiza, W.; De Villiers, C. Global Research Trends for Unmanned Aerial Vehicle Remote Sensing Application in Wheat Crop Monitoring. Geomatics 2023, 3, 115–136. [Google Scholar] [CrossRef]
  12. Yang, H.; Yang, X.; Heskel, M.; Sun, S.; Tang, J. Seasonal Variations of Leaf and Canopy Properties Tracked by Ground-Based NDVI Imagery in a Temperate Forest. Sci. Rep. 2017, 7, 1267. [Google Scholar] [CrossRef] [PubMed] [Green Version]
  13. Dong, T.; Liu, J.; Shang, J.; Qian, B.; Ma, B.; Kovacs, J.M.; Walters, D.; Jiao, X.; Geng, X.; Shi, Y. Assessment of Red-Edge Vegetation Indices for Crop Leaf Area Index Estimation. Remote Sens. Environ. 2019, 222, 133–143. [Google Scholar] [CrossRef]
  14. Cui, B.; Zhao, Q.; Huang, W.; Song, X.; Ye, H.; Zhou, X. A New Integrated Vegetation Index for the Estimation of Winter Wheat Leaf Chlorophyll Content. Remote Sens. 2019, 11, 974. [Google Scholar] [CrossRef] [Green Version]
  15. Kent Shannon, D.; Clay, D.E.; Sudduth, K.A. An Introduction to Precision Agriculture. In Precision Agriculture Basics; John Wiley & Sons, Ltd.: Hoboken, NJ, USA, 2018; pp. 1–12. ISBN 978-0-89118-367-9. [Google Scholar]
  16. Johansen, K.; Ziliani, M.G.; Houborg, R.; Franz, T.E.; McCabe, M.F. CubeSat Constellations Provide Enhanced Crop Phenology and Digital Agricultural Insights Using Daily Leaf Area Index Retrievals. Sci. Rep. 2022, 12, 5244. [Google Scholar] [CrossRef] [PubMed]
  17. Tsouros, D.C.; Bibi, S.; Sarigiannidis, P.G. A Review on UAV-Based Applications for Precision Agriculture. Information 2019, 10, 349. [Google Scholar] [CrossRef] [Green Version]
  18. Ahmad, A.; Ordoñez, J.; Cartujo, P.; Martos, V. Remotely Piloted Aircraft (RPA) in Agriculture: A Pursuit of Sustainability. Agronomy 2021, 11, 7. [Google Scholar] [CrossRef]
  19. Singh, P.; Pandey, P.C.; Petropoulos, G.P.; Pavlides, A.; Srivastava, P.K.; Koutsias, N.; Deng, K.A.K.; Bao, Y. 8—Hyperspectral Remote Sensing in Precision Agriculture: Present Status, Challenges, and Future Trends. In Hyperspectral Remote Sensing; Pandey, P.C., Srivastava, P.K., Balzter, H., Bhattacharya, B., Petropoulos, G.P., Eds.; Elsevier: Amsterdam, The Netherlands, 2020; pp. 121–146. ISBN 978-0-08-102894-0. [Google Scholar]
  20. Index DataBase. A Database for Remote Sensing Indices, List of Available Indices. Available online: https://www.indexdatabase.de/db/i.php?offset=1 (accessed on 18 February 2023).
  21. Delavarpour, N.; Koparan, C.; Nowatzki, J.; Bajwa, S.; Sun, X. A Technical Study on UAV Characteristics for Precision Agriculture Applications and Associated Practical Challenges. Remote Sens. 2021, 13, 1204. [Google Scholar] [CrossRef]
  22. Kobayashi, N.; Tani, H.; Wang, X.; Sonobe, R. Crop Classification Using Spectral Indices Derived from Sentinel-2A Imagery. J. Inf. Telecommun. 2020, 4, 67–90. [Google Scholar] [CrossRef]
  23. Giovos, R.; Tassopoulos, D.; Kalivas, D.; Lougkos, N.; Priovolou, A. Remote Sensing Vegetation Indices in Viticulture: A Critical Review. Agriculture 2021, 11, 457. [Google Scholar] [CrossRef]
  24. Shen, X.; Cao, L.; Yang, B.; Xu, Z.; Wang, G. Estimation of Forest Structural Attributes Using Spectral Indices and Point Clouds from UAS-Based Multispectral and RGB Imageries. Remote Sens. 2019, 11, 800. [Google Scholar] [CrossRef] [Green Version]
  25. Khanna, M.; Atallah, S.S.; Kar, S.; Sharma, B.; Wu, L.; Yu, C.; Chowdhary, G.; Soman, C.; Guan, K. Digital Transformation for a Sustainable Agriculture in the United States: Opportunities and Challenges. Agric. Econ. 2022, 53, 924–937. [Google Scholar] [CrossRef]
  26. Yu, J.; Wu, J. The Sustainability of Agricultural Development in China: The Agriculture–Environment Nexus. Sustainability 2018, 10, 1776. [Google Scholar] [CrossRef] [Green Version]
  27. Li, W.; Clark, B.; Taylor, J.A.; Kendall, H.; Jones, G.; Li, Z.; Jin, S.; Zhao, C.; Yang, G.; Shuai, C.; et al. A Hybrid Modelling Approach to Understanding Adoption of Precision Agriculture Technologies in Chinese Cropping Systems. Comput. Electron. Agric. 2020, 172, 105305. [Google Scholar] [CrossRef]
  28. Serraj, R.; Krishnan, L.; Pingali, P. Agriculture and Food Systems to 2050: A Synthesis. In Agriculture & Food Systems to 2050; World Scientific: Singapore, 2018; Volume 2, pp. 3–45. ISBN 978-981-327-834-9. [Google Scholar]
  29. Pivoto, D.; Waquil, P.D.; Talamini, E.; Finocchio, C.P.S.; Dalla Corte, V.F.; de Vargas Mores, G. Scientific Development of Smart Farming Technologies and Their Application in Brazil. Inf. Process. Agric. 2018, 5, 21–32. [Google Scholar] [CrossRef]
  30. Nolte, K.; Ostermeier, M. Labour Market Effects of Large-Scale Agricultural Investment: Conceptual Considerations and Estimated Employment Effects. World Dev. 2017, 98, 430–446. [Google Scholar] [CrossRef]
  31. Zheng, Y.Y.; Kong, J.L.; Jin, X.B.; Wang, X.Y.; Su, T.L.; Zuo, M. CropDeep: The Crop Vision Dataset for Deep-Learning-Based Classification and Detection in Precision Agriculture. Sensors 2019, 19, 1058. [Google Scholar] [CrossRef] [Green Version]
  32. Barasa, P.M.; Botai, C.M.; Botai, J.O.; Mabhaudhi, T. A Review of Climate-Smart Agriculture Research and Applications in Africa. Agronomy 2021, 11, 1255. [Google Scholar] [CrossRef]
  33. Khan, N.; Ray, R.L.; Sargani, G.R.; Ihtisham, M.; Khayyam, M.; Ismail, S. Current Progress and Future Prospects of Agriculture Technology: Gateway to Sustainable Agriculture. Sustainability 2021, 13, 4883. [Google Scholar] [CrossRef]
  34. Aune, J.B.; Coulibaly, A.; Giller, K.E. Precision Farming for Increased Land and Labour Productivity in Semi-Arid West Africa. A Review. Agron. Sustain. Dev. 2017, 37, 16. [Google Scholar] [CrossRef] [Green Version]
  35. Jellason, N.P.; Robinson, E.J.Z.; Ogbaga, C.C. Agriculture 4.0: Is Sub-Saharan Africa Ready? Appl. Sci. 2021, 11, 5750. [Google Scholar] [CrossRef]
  36. Raj, R.; Kar, S.; Nandan, R.; Jagarlapudi, A. Precision Agriculture and Unmanned Aerial Vehicles (UAVs). In Unmanned Aerial Vehicle: Applications in Agriculture and Environment; Avtar, R., Watanabe, T., Eds.; Springer International Publishing: Cham, Switzerland, 2020; pp. 7–23. ISBN 978-3-030-27157-2. [Google Scholar]
  37. Ferrández-Pastor, F.J.; García-Chamizo, J.M.; Nieto-Hidalgo, M.; Mora-Martínez, J. Precision Agriculture Design Method Using a Distributed Computing Architecture on Internet of Things Context. Sensors 2018, 18, 1731. [Google Scholar] [CrossRef] [PubMed] [Green Version]
  38. Jin, X.; Li, Z.; Feng, H.; Ren, Z.; Li, S. Deep Neural Network Algorithm for Estimating Maize Biomass Based on Simulated Sentinel 2A Vegetation Indices and Leaf Area Index. Crop J. 2020, 8, 87–97. [Google Scholar] [CrossRef]
  39. Cao, J.; Zhang, Z.; Tao, F.; Zhang, L.; Luo, Y.; Zhang, J.; Han, J.; Xie, J. Integrating Multi-Source Data for Rice Yield Prediction across China Using Machine Learning and Deep Learning Approaches. Agric. For. Meteorol. 2021, 297, 108275. [Google Scholar] [CrossRef]
  40. Weiss, M.; Jacob, F.; Duveiller, G. Remote Sensing for Agricultural Applications: A Meta-Review. Remote Sens. Environ. 2020, 236, 111402. [Google Scholar] [CrossRef]
  41. Wang, S.; Di Tommaso, S.; Faulkner, J.; Friedel, T.; Kennepohl, A.; Strey, R.; Lobell, D.B. Mapping Crop Types in Southeast India with Smartphone Crowdsourcing and Deep Learning. Remote Sens. 2020, 12, 2957. [Google Scholar] [CrossRef]
  42. Bégué, A.; Arvor, D.; Bellon, B.; Betbeder, J.; De Abelleyra, D.; Ferraz, R.; Lebourgeois, V.; Lelong, C.; Simões, M.; Verón, S.R. Remote Sensing and Cropping Practices: A Review. Remote Sens. 2018, 10, 99. [Google Scholar] [CrossRef] [Green Version]
  43. Schwalbert, R.A.; Amado, T.; Corassa, G.; Pott, L.P.; Prasad, P.V.V.; Ciampitti, I.A. Satellite-Based Soybean Yield Forecast: Integrating Machine Learning and Weather Data for Improving Crop Yield Prediction in Southern Brazil. Agric. For. Meteorol. 2020, 284, 107886. [Google Scholar] [CrossRef]
  44. Stroppiana, D.; Villa, P.; Sona, G.; Ronchetti, G.; Candiani, G.; Pepe, M.; Busetto, L.; Migliazzi, M.; Boschetti, M. Early Season Weed Mapping in Rice Crops Using Multi-Spectral UAV Data. Int. J. Remote Sens. 2018, 39, 5432–5452. [Google Scholar] [CrossRef]
  45. Radočaj, D.; Jurišić, M.; Gašparović, M. The Role of Remote Sensing Data and Methods in a Modern Approach to Fertilization in Precision Agriculture. Remote Sens. 2022, 14, 778. [Google Scholar] [CrossRef]
  46. Martos, V.; Ahmad, A.; Cartujo, P.; Ordoñez, J. Ensuring Agricultural Sustainability through Remote Sensing in the Era of Agriculture 5.0. Appl. Sci. 2021, 11, 5911. [Google Scholar] [CrossRef]
  47. Mehta, S.V.; Haight, R.G.; Homans, F.R.; Polasky, S.; Venette, R.C. Optimal Detection and Control Strategies for Invasive Species Management. Ecol. Econ. 2007, 61, 237–245. [Google Scholar] [CrossRef]
  48. Liu, G.; Wang, X.; Baiocchi, G.; Casazza, M.; Meng, F.; Cai, Y.; Hao, Y.; Wu, F.; Yang, Z. On the Accuracy of Official Chinese Crop Production Data: Evidence from Biophysical Indexes of Net Primary Production. Proc. Natl. Acad. Sci. USA 2020, 117, 25434–25444. [Google Scholar] [CrossRef] [PubMed]
  49. Liebman, A.K.; Augustave, W. Agricultural Health and Safety: Incorporating the Worker Perspective. J. Agromedicine 2010, 15, 192–199. [Google Scholar] [CrossRef] [PubMed]
  50. Bongiovanni, R.; Lowenberg-Deboer, J. Precision Agriculture and Sustainability. Precis. Agric. 2004, 5, 359–387. [Google Scholar] [CrossRef]
  51. Steven, M.D.; Malthus, T.J.; Baret, F.; Xu, H.; Chopping, M.J. Intercalibration of Vegetation Indices from Different Sensor Systems. Remote Sens. Environ. 2003, 88, 412–422. [Google Scholar] [CrossRef]
  52. Peng, Y.; Zhang, M.; Xu, Z.; Yang, T.; Su, Y.; Zhou, T.; Wang, H.; Wang, Y.; Lin, Y. Estimation of Leaf Nutrition Status in Degraded Vegetation Based on Field Survey and Hyperspectral Data. Sci. Rep. 2020, 10, 4361. [Google Scholar] [CrossRef] [Green Version]
  53. Goldblatt, R.; Rivera Ballesteros, A.; Burney, J. High Spatial Resolution Visual Band Imagery Outperforms Medium Resolution Spectral Imagery for Ecosystem Assessment in the Semi-Arid Brazilian Sertão. Remote Sens. 2017, 9, 1336. [Google Scholar] [CrossRef] [Green Version]
  54. Anastasiou, E.; Balafoutis, A.T.; Fountas, S. Trends in Remote Sensing Technologies in Olive Cultivation. Smart Agric. Technol. 2023, 3, 100103. [Google Scholar] [CrossRef]
  55. Araus, J.L.; Kefauver, S.C.; Zaman-Allah, M.; Olsen, M.S.; Cairns, J.E. Translating High-Throughput Phenotyping into Genetic Gain. Trends Plant Sci. 2018, 23, 451–466. [Google Scholar] [CrossRef] [Green Version]
  56. Ferguson, R.; Rundquist, D. Remote Sensing for Site-Specific Crop Management. In Precision Agriculture Basics; John Wiley & Sons, Ltd.: Hoboken, NJ, USA, 2018; pp. 103–117. ISBN 978-0-89118-367-9. [Google Scholar]
  57. Sarić, R.; Nguyen, V.D.; Burge, T.; Berkowitz, O.; Trtílek, M.; Whelan, J.; Lewsey, M.G.; Čustović, E. Applications of Hyperspectral Imaging in Plant Phenotyping. Trends Plant Sci. 2022, 27, 301–315. [Google Scholar] [CrossRef] [PubMed]
  58. von Bueren, S.K.; Burkart, A.; Hueni, A.; Rascher, U.; Tuohy, M.P.; Yule, I.J. Deploying Four Optical UAV-Based Sensors over Grassland: Challenges and Limitations. Biogeosciences 2015, 12, 163–175. [Google Scholar] [CrossRef] [Green Version]
  59. Feng, L.; Chen, S.; Zhang, C.; Zhang, Y.; He, Y. A Comprehensive Review on Recent Applications of Unmanned Aerial Vehicle Remote Sensing with Various Sensors for High-Throughput Plant Phenotyping. Comput. Electron. Agric. 2021, 182, 106033. [Google Scholar] [CrossRef]
  60. Wasonga, D.O.; Yaw, A.; Kleemola, J.; Alakukku, L.; Mäkelä, P.S.A. Red-Green-Blue and Multispectral Imaging as Potential Tools for Estimating Growth and Nutritional Performance of Cassava under Deficit Irrigation and Potassium Fertigation. Remote Sens. 2021, 13, 598. [Google Scholar] [CrossRef]
  61. Fernandez-Figueroa, E.G.; Wilson, A.E.; Rogers, S.R. Commercially Available Unoccupied Aerial Systems for Monitoring Harmful Algal Blooms: A Comparative Study. Limnol. Oceanogr. Methods 2022, 20, 146–158. [Google Scholar] [CrossRef]
  62. Guan, S.; Fukami, K.; Matsunaka, H.; Okami, M.; Tanaka, R.; Nakano, H.; Sakai, T.; Nakano, K.; Ohdan, H.; Takahashi, K. Assessing Correlation of High-Resolution NDVI with Fertilizer Application Level and Yield of Rice and Wheat Crops Using Small UAVs. Remote Sens. 2019, 11, 112. [Google Scholar] [CrossRef] [Green Version]
  63. Labus, M.P.; Nielsen, G.A.; Lawrence, R.L.; Engel, R.; Long, D.S. Wheat Yield Estimates Using Multi-Temporal NDVI Satellite Imagery. Int. J. Remote Sens. 2002, 23, 4169–4180. [Google Scholar] [CrossRef]
  64. Vannoppen, A.; Gobin, A. Estimating Farm Wheat Yields from NDVI and Meteorological Data. Agronomy 2021, 11, 946. [Google Scholar] [CrossRef]
  65. Benincasa, P.; Antognelli, S.; Brunetti, L.; Fabbri, C.A.; Natale, A.; Sartoretti, V.; Modeo, G.; Guiducci, M.; Tei, F.; Vizzari, M. Reliability of NDVI Derived by High Resolution Satellite and UAV Compared to In-Field Methods for the Evaluation of Early Crop N Status and Grain Yield in Wheat. Exp. Agric. 2018, 54, 604–622. [Google Scholar] [CrossRef]
  66. Wang, Y.-P.; Chang, K.-W.; Chen, R.-K.; Lo, J.-C.; Shen, Y. Large-Area Rice Yield Forecasting Using Satellite Imageries. Int. J. Appl. Earth Obs. Geoinf. 2010, 12, 27–35. [Google Scholar] [CrossRef]
  67. Rouse, J.; Haas, R.H.; Schell, J.A.; Deering, D.W. Monitoring Vegetation Systems in the Great Plains with ERTS. NASA Spec. Publ. 1974, 351, 309. [Google Scholar]
  68. Huete, A.; Didan, K.; Miura, T.; Rodriguez, E.P.; Gao, X.; Ferreira, L.G. Overview of the Radiometric and Biophysical Performance of the MODIS Vegetation Indices. Remote Sens. Environ. 2002, 83, 195–213. [Google Scholar] [CrossRef]
  69. Verstraete, M.M.; Pinty, B. Designing Optimal Spectral Indexes for Remote Sensing Applications. IEEE Trans. Geosci. Remote Sens. 1996, 34, 1254–1265. [Google Scholar] [CrossRef]
  70. Huete, A.R. A Soil-Adjusted Vegetation Index (SAVI). Remote Sens. Environ. 1988, 25, 295–309. [Google Scholar] [CrossRef]
  71. Peñuelas, J.; Gamon, J.A.; Griffin, K.L.; Field, C.B. Assessing Community Type, Plant Biomass, Pigment Composition, and Photosynthetic Efficiency of Aquatic Vegetation from Spectral Reflectance. Remote Sens. Environ. 1993, 46, 110–118. [Google Scholar] [CrossRef]
  72. Barnes, E.M.; Clarke, T.R.; Richards, S.E.; Colaizzi, P.D.; Haberland, J.; Kostrzewski, M.; Waller, P.; Choi, C.; Riley, E.; Thompson, T.; et al. Coincident Detection of Crop Water Stress, Nitrogen Status and Canopy Density Using Ground-Based Multispectral Data. In Proceedings of the 5th International Conference on Precision Agriculture and other resource management, Bloomington, MN, USA, 16–19 July 2000; pp. 1–15. [Google Scholar]
  73. Rondeaux, G.; Steven, M.; Baret, F. Optimization of Soil-Adjusted Vegetation Indices. Remote Sens. Environ. 1996, 55, 95–107. [Google Scholar] [CrossRef]
  74. Pinty, B.; Verstraete, M.M. GEMI: A Non-Linear Index to Monitor Global Vegetation from Satellites. Vegetatio 1992, 101, 15–20. [Google Scholar] [CrossRef]
  75. Karkauskaite, P.; Tagesson, T.; Fensholt, R. Evaluation of the Plant Phenology Index (PPI), NDVI and EVI for Start-of-Season Trend Analysis of the Northern Hemisphere Boreal Zone. Remote Sens. 2017, 9, 485. [Google Scholar] [CrossRef] [Green Version]
  76. Qiu, J.; Yang, J.; Wang, Y.; Su, H. A Comparison of NDVI and EVI in the DisTrad Model for Thermal Sub-Pixel Mapping in Densely Vegetated Areas: A Case Study in Southern China. Int. J. Remote Sens. 2018, 39, 2105–2118. [Google Scholar] [CrossRef]
  77. Jaafar, H.H.; Zurayk, R.; King, C.; Ahmad, F.; Al-Outa, R. Impact of the Syrian Conflict on Irrigated Agriculture in the Orontes Basin. Int. J. Water Resour. Dev. 2015, 31, 436–449. [Google Scholar] [CrossRef]
  78. Gerardo, R.; de Lima, I.P. Monitoring Duckweeds (Lemna minor) in Small Rivers Using Sentinel-2 Satellite Imagery: Application of Vegetation and Water Indices to the Lis River (Portugal). Water 2022, 14, 2284. [Google Scholar] [CrossRef]
  79. Sankaran, S.; Khot, L.R.; Espinoza, C.Z.; Jarolmasjed, S.; Sathuvalli, V.R.; Vandemark, G.J.; Miklas, P.N.; Carter, A.H.; Pumphrey, M.O.; Knowles, N.R.; et al. Low-Altitude, High-Resolution Aerial Imaging Systems for Row and Field Crop Phenotyping: A Review. Eur. J. Agron. 2015, 70, 112–123. [Google Scholar] [CrossRef]
  80. Prudnikova, E.; Savin, I.; Vindeker, G.; Grubina, P.; Shishkonakova, E.; Sharychev, D. Influence of Soil Background on Spectral Reflectance of Winter Wheat Crop Canopy. Remote Sens. 2019, 11, 1932. [Google Scholar] [CrossRef] [Green Version]
  81. Rhyma, P.P.; Norizah, K.; Hamdan, O.; Faridah-Hanum, I.; Zulfa, A.W. Integration of Normalised Different Vegetation Index and Soil-Adjusted Vegetation Index for Mangrove Vegetation delineation. Remote Sens. Appl. Soc. Environ. 2020, 17, 100280. [Google Scholar] [CrossRef]
  82. Gracia-Romero, A.; Kefauver, S.C.; Fernandez-Gallego, J.A.; Vergara-Díaz, O.; Nieto-Taladriz, M.T.; Araus, J.L. UAV and Ground Image-Based Phenotyping: A Proof of Concept with Durum Wheat. Remote Sens. 2019, 11, 1244. [Google Scholar] [CrossRef] [Green Version]
  83. Elazab, A.; Bort, J.; Zhou, B.; Serret, M.D.; Nieto-Taladriz, M.T.; Araus, J.L. The Combined Use of Vegetation Indices and Stable Isotopes to Predict Durum Wheat Grain Yield under Contrasting Water Conditions. Agric. Water Manag. 2015, 158, 196–208. [Google Scholar] [CrossRef]
  84. Radočaj, D.; Šiljeg, A.; Plaščak, I.; Marić, I.; Jurišić, M. A Micro-Scale Approach for Cropland Suitability Assessment of Permanent Crops Using Machine Learning and a Low-Cost UAV. Agronomy 2023, 13, 362. [Google Scholar] [CrossRef]
  85. Cotrozzi, L. Spectroscopic Detection of Forest Diseases: A Review (1970–2020). J. For. Res. 2022, 33, 21–38. [Google Scholar] [CrossRef]
  86. Xie, C.; Yang, C. A Review on Plant High-Throughput Phenotyping Traits Using UAV-Based Sensors. Comput. Electron. Agric. 2020, 178, 105731. [Google Scholar] [CrossRef]
  87. Gašparović, M.; Zrinjski, M.; Barković, Đ.; Radočaj, D. An Automatic Method for Weed Mapping in Oat Fields Based on UAV Imagery. Comput. Electron. Agric. 2020, 173, 105385. [Google Scholar] [CrossRef]
  88. Zarco-Tejada, P.J.; Miller, J.R.; Noland, T.L.; Mohammed, G.H.; Sampson, P.H. Scaling-Up and Model Inversion Methods with Narrowband Optical Indices for Chlorophyll Content Estimation in Closed Forest Canopies with Hyperspectral Data. IEEE Trans. Geosci. Remote Sens. 2001, 39, 1491–1507. [Google Scholar] [CrossRef] [Green Version]
  89. Woebbecke, D.; Meyer, G.; Vonbargen, K.; Mortensen, D. Color Indexes for Weed Identification under Various Soil, Residue, and Lighting Conditions. Trans. ASAE 1995, 38, 259–269. [Google Scholar] [CrossRef]
  90. Meyer, G.E.; Hindman, T.W.; Laksmi, K. Machine Vision Detection Parameters for Plant Species Identification. In Proceedings of the Precision Agriculture and Biological Quality; SPIE: Bellingham, WA, USA, 1999; Volume 3543, pp. 327–335. [Google Scholar]
  91. Gitelson, A.; Merzlyak, M.; Zur, Y.; Stark, R.; Gritz, U. Non-Destructive and Remote Sensing Techniques for Estimation of Vegetation Status. Pap. Nat. Resour. 2001, 3543, 327–335. [Google Scholar]
  92. Bendig, J.; Yu, K.; Aasen, H.; Bolten, A.; Bennertz, S.; Broscheit, J.; Gnyp, M.L.; Bareth, G. Combining UAV-Based Plant Height from Crop Surface Models, Visible, and Near Infrared Vegetation Indices for Biomass Monitoring in Barley. Int. J. Appl. Earth Obs. Geoinf. 2015, 39, 79–87. [Google Scholar] [CrossRef]
  93. Peñuelas, J.; Gamon, J.A.; Fredeen, A.L.; Merino, J.; Field, C.B. Reflectance Indices Associated with Physiological Changes in Nitrogen- and Water-Limited Sunflower Leaves. Remote Sens. Environ. 1994, 48, 135–146. [Google Scholar] [CrossRef]
  94. Hunt, E.R.; Doraiswamy, P.C.; McMurtrey, J.E.; Daughtry, C.S.T.; Perry, E.M.; Akhmedov, B. A Visible Band index for Remote Sensing Leaf Chlorophyll Content at the Canopy Scale. Int. J. Appl. Earth Obs. Geoinf. 2013, 21, 103–112. [Google Scholar] [CrossRef] [Green Version]
  95. Guijarro, M.; Pajares, G.; Riomoros, I.; Herrera, P.J.; Burgos-Artizzu, X.P.; Ribeiro, A. Automatic Segmentation of Relevant Textures in Agricultural Images. Comput. Electron. Agric. 2011, 75, 75–83. [Google Scholar] [CrossRef] [Green Version]
  96. Patrignani, A.; Ochsner, T.E. Canopeo: A Powerful New Tool for Measuring Fractional Green Canopy Cover. Agron. J. 2015, 107, 2312–2320. [Google Scholar] [CrossRef] [Green Version]
  97. Jin, X.; Liu, S.; Baret, F.; Hemerlé, M.; Comar, A. Estimates of Plant Density of Wheat Crops at Emergence from Very Low Altitude UAV Imagery. Remote Sens. Environ. 2017, 198, 105–114. [Google Scholar] [CrossRef] [Green Version]
  98. Wijayanto, A.W.; Wahyu Triscowati, D.; Marsuhandi, A.H. Maize Field Area Detection in East Java, Indonesia: An Integrated Multispectral Remote Sensing and Machine Learning Approach. In Proceedings of the 2020 12th International Conference on Information Technology and Electrical Engineering (ICITEE), Yogyakarta, Indonesia, 6–8 October 2020; pp. 168–173. [Google Scholar]
  99. Barzin, R.; Pathak, R.; Lotfi, H.; Varco, J.; Bora, G.C. Use of UAS Multispectral Imagery at Different Physiological Stages for Yield Prediction and Input Resource Optimization in Corn. Remote Sens. 2020, 12, 2392. [Google Scholar] [CrossRef]
  100. Pôças, I.; Rodrigues, A.; Gonçalves, S.; Costa, P.M.; Gonçalves, I.; Pereira, L.S.; Cunha, M. Predicting Grapevine Water Status Based on Hyperspectral Reflectance Vegetation Indices. Remote Sens. 2015, 7, 16460–16479. [Google Scholar] [CrossRef] [Green Version]
Figure 1. Global map of the number of scientific papers indexed in WoSCC since 2010 with the topic of “precision agriculture”.
Agriculture 13 00707 g001
Figure 2. Global map of the country area in km2 per scientific paper indexed in WoSCC since 2010 with the topic of “precision agriculture”.
Agriculture 13 00707 g002
Figure 3. Global map of the number of scientific papers indexed in WoSCC since 2010 with the topic of “precision agriculture” AND “vegetation index”.
Agriculture 13 00707 g003
Figure 4. Global map of the percentage of scientific papers indexed in WoSCC since 2010 with the topic of “precision agriculture” AND “vegetation index” from the overall number of studies with the topic of “precision agriculture”.
Agriculture 13 00707 g004
Figure 5. The number of scientific papers indexed in WoSCC since 2010 with the topic of “precision agriculture” AND particular sensor type.
Agriculture 13 00707 g005
Figure 6. Radar plot of the number of scientific papers indexed in WoSCC since 2010 with the topic of “precision agriculture” AND particular sensor type for each three years.
Agriculture 13 00707 g006
Figure 7. The number of scientific papers indexed in WoSCC since 2010 with the topic of “precision agriculture” AND individual major index based on multispectral sensors.
Agriculture 13 00707 g007
Figure 8. The number of scientific papers indexed in WoSCC since 2010 with the topic of “precision agriculture” AND individual major index based on RGB sensors.
Agriculture 13 00707 g008
Table 1. Eight major vegetation indices based on multispectral sensors with the highest total number of appearances in WoSCC papers since 2000.
Vegetation IndexAbbreviationFormulaTotal Number of WoSCC Papers * (2000–2022)Reference
Normalized difference vegetation indexNDVI NDVI = NIR R NIR + R 2200[67]
Enhanced vegetation indexEVI EVI = 2.5 × NIR R NIR + 6 × R 7.5 × B + 1 459[68]
Green-normalized difference vegetation indexGNDVI GNDVI = NIR G NIR + G 329[69]
Soil-adjusted vegetation indexSAVI SAVI = 1.5 × NIR R NIR + R + 0.5 225[70]
Simple ratioSR SR = NIR R 202[71]
Normalized difference red-edge indexNDRE NDER = NIR RE NIR + RE 195[72]
Optimized soil-adjusted vegetation indexOSAVI OSAVI = 1.16 × NIR R NIR + R + 0.16 92[73]
Global environmental-monitoring indexGEMI GEMI = η × ( 1 0.25 η ) R 0.125 1 R
η = 2 × ( NIR 2 R 2 ) + 1.5 × NIR + 0.5 × R NIR + R + 0.5
67[74]
* Scientific papers indexed in Web of Science Core Collection with the topic of “precision agriculture” AND selected vegetation index. B: blue reflectance, G: green reflectance, R: red reflectance, RE: red-edge reflectance, NIR: near-infrared reflectance.
Table 2. Eight major vegetation indices based on RGB sensors with the highest total number of appearances in WoSCC papers since 2000.
Vegetation IndexAbbreviationFormulaTotal Number of WoSCC Papers * (2000–2022)Reference
Normalized green–red difference indexNGRDI NGRDI = G R G + R 72[88]
Excess green indexExG ExG = 2 × G B R B + G + R 32[89]
Excess red indexExR ExR = 1.4 × R G B + G + R 19[90]
Visible atmospherically resistant indexVARI VARI = G R G + R B 18[91]
Modified green–red vegetation indexMGRVI MGRVI = G 2 R 2 G 2 + R 2 16[92]
Normalized pigment chlorophyll ratio indexNPCI NPCI = B R B + R 12[93]
Triangular greenness indexTGI TGI = G 0.39 × R 0.61 × B 10[94]
Excess blue indexExB ExB = 1.4 × B G 10[95]
* Scientific papers indexed in Web of Science Core Collection with the topic of “precision agriculture” AND selected vegetation index. B: blue reflectance, G: green reflectance, R: red reflectance.
Disclaimer/Publisher’s Note: The statements, opinions and data contained in all publications are solely those of the individual author(s) and contributor(s) and not of MDPI and/or the editor(s). MDPI and/or the editor(s) disclaim responsibility for any injury to people or property resulting from any ideas, methods, instructions or products referred to in the content.

