1. Introduction
According to the Food and Agriculture Organization (FAO), rice is one of the essential commodities in the world [
1,
2,
3]. More than half of the world’s population depends on rice as the primary food [
1]. Rice paddies account for approximately 12% of the global croplands of the planet [
4]. According to FAO’s 2016 statistics, global rice cultivation is around 741 million hectares, and about 50% of the world’s rice is cultivated in India and China. Historical records show rice has been cultivated in Iran since the first century BC. Based on statistics, Iran is a medium rice producer [
5].
Given the importance of rice in the household food basket, creating jobs and income for large-scale agricultural producers and the government’s willingness to replace high-yielding cultivars with other varieties are crucial challenges for regional and local authorities [
6,
7,
8]. According to the latest reports from governmental institutions in Iran, statistics about the area under cultivation and the annual rate of rice harvesting were carried out through field sampling and census data collection (
www.maj.ir, accessed on 23 October 2022). The reliability of this approach is very low, and consequently, these results cannot be used in critical decision-making due to uncertainties. One of the most critical aspects of this lack of information and accuracy is the spatial distribution of rice paddies in this region [
9].
Identifying and classifying the area under the cultivation of various agricultural products is vital for decision-making, improving management and policymaking, and economic planning for agricultural development [
10,
11]. Monitoring and mapping rice paddies continuously and efficiently play an essential role in agriculture and a sustainable environment, water and food security, damage assessment, and policy and decision-making [
12,
13,
14]. Remote sensing techniques can provide timely and valuable information on crop distribution and the area under cultivation and yield potential for decision-makers [
15,
16].
For decades, optical remote sensing data have been used in different agricultural applications, including crop types classification [
17], biomass and leaf area estimation [
18], yield modeling [
19], and disease identifications [
20]. These applications used data from various spectral bands and sensors, such as Moderate Resolution Imaging Spectroradiometer (MODIS), SPOT, Landsat, etc. [
21].
Due to the increased availability of multispectral remote sensing images, rice mapping has become a hot research topic. To this end, many studies have been done for mapping rice based on optical multispectral satellite imagery. For instance, Zhang et al. [
22] used deep learning convolutional neural network (CNN) for paddy-rice mapping from multi-temporal Landsat 8, phenology data, and thermal datasets. In the first step, the spatial-temporal adaptive fusion model was employed to fuse MODIS and Landsat data to simulate multi-temporal Landsat-like data. Then, a thresholding procedure was conducted to derive the phenological variables from the Landsat-like NDVI time series. A generalized single-channel algorithm was used to derive LST from Landsat 8. Finally, multi-temporal Landsat 8 images, combined with phenology and LST data, were used to map rice paddies using a CNN framework.
Moreover, Jiang et al. [
23] have recently used the differenced NDVI (dNDVI) and a thresholding approach based on Landsat’s NDVI to monitor changes in rice-cultivated areas in Southern China. They used two Landsat images to identify double-cropping rice (DCRs) using dNDVI and one Landsat image to identify single-cropping rice (SCRs). Most studies using optical data to identify rice-cultivated areas have relatively decent accuracies and results. The greatest challenge related to these studies is obtaining a significant number of images (i.e., high temporal resolution) to correctly identify the rice cultivation pattern. However, due to the small size of agricultural lands, the low spatial resolution causes spectral mixing issues, which highly affects the performance of small rice paddy detection and mapping.
According to the previous studies, methods based on the rice phenology cycle employ data from the time-series images of Landsat and MODIS. Due to the high temporal resolution of the MODIS data, it has a high potential to identify the area under rice cultivation. However, due to the low spatial resolution of this data and the small size of the paddies, MODIS pixels may include several different classes. As a result, this spectral mixture may lead to inaccurate identification of the areas under rice cultivation and increases uncertainty. On the other hand, Landsat images have a higher spatial resolution, which can resolve the problem of the mixed pixels and can much better extract the areas under rice cultivation. Due to the high cloud coverage in the study area and the low temporal resolution of Landsat imagery, it is not easy to obtain a significant amount of Landsat data. On the other side, using a high temporal and spatial resolution of the Sentinel-2 images, identifying the area under rice cultivation with the phenological-based rice approach is possible. Due to adverse weather conditions, e.g., clouds and rain, in the northern region of Iran, most of the time, optical data may not be beneficial for rice monitoring.
SAR data has shown attractive characteristics for agricultural applications thanks to their independence from weather and illumination conditions. These advantages of SAR satellite imagery caused some studies to focus on rice mapping based on SAR imagery. For instance, Nguyen, et al. [
24] have studied the potential of time series of C-band SAR data for seasonal mapping of rice-cultivated areas. They showed that Sentinel-1 high-resolution images could increase the accuracy of the classification of rice paddies. Besides, Clauss, et al. [
25] also used the Sentinel-1 time series and super-pixel segmentation for mapping rice fields in Poyang Lake in China. They applied image segmentation using the super-pixel method (i.e., SLIC). They also used a phenology-based decision tree for the extracted time series to classify each segment or object as either rice or no rice. Additionally, Bazzi, et al. [
26] have analyzed the temporal behavior of SAR backscattering in many plots covering different crops. This analysis identified the rice paddies using several metrics derived from the Gaussian profile, the VV/VH time-series variance, and the slope of the linear regression of the VH time series.
Despite all these results, the biggest challenge with radar images and phenology-based methods for identifying rice paddies is the existence of similar classes with rice phenology cycles, such as wetlands, which slightly increases the error rate. Several studies have overlooked this challenge by integrating optical imagery, potentially improving discrimination among similar classes. The fusion of SAR and optical datasets can be considered an essential source for rice mapping. In this regard, Torbick et al. [
27] have produced a land cover map through a random forest (RF) algorithm, including crop, water, forest, shrub, and urban areas, jointly using Sentinel-1, Landsat-8 OLI, and PALSAR-2 satellites in Myanmar. They used only crop pixels and masked non-crop pixels and analyzed the behavior of time-series pixels of crops for Sentinel-1 images. Finally, they used these analyses to extract the rice crop using the decision tree method. Their results showed that the mapped cultivated rice areas were close to the census statistics (e.g., R
2 = 78%).
Moreover, Onojeghuo et al. [
28] employed RF and SVM algorithms to extract rice paddies from multi-temporal Sentinel-1A SAR data and Landsat-derived NDVI data. When the NDVI time-series data were fused with the various combinations of multi-temporal polarization channels (VH, VV, and VH/VV), overall classification improved significantly. In another study, Park et al. [
29] classified paddy rice using RF and SVM machine learning algorithms based on satellite sensors Landsat, RadarSAT-1, and ALOS PALSAR. They first used Landsat images to identify rice paddies using RF and SVM algorithms. Then, SAR images were used to classify and extract rice paddies. Finally, they combined Landsat, SAR, and 30-m DEM to classify paddy rice. The results have shown that the fusion of optical and SAR sensor time-series data has the highest accuracy.
On the other hand, SAR data can be an attractive alternative to optical imagery for studying the dynamics of rice. However, optical data can still help identify rice paddies better, thanks to the absence of speckles in these images. Because of this region’s relatively small rice paddies and the necessity of providing reliable information for operational applications, high-spatial-resolution imageries from both SAR and optical sensors are primordial for rice mapping and monitoring. In addition, multi-temporal satellite imagery is essential for crop monitoring applications in general and rice in particular; this is because, according to the rice cultivation pattern, earth observations with a few days or a week of revisit time are needed to accurately study the crop conditions during the growing season.
The performance of deep learning-based frameworks has been assessed in many agricultural fields, and rice-type mapping is one of the most critical applications. Recently, some deep learning-based rice mapping frameworks have been proposed [
30,
31]. Unlike standard supervised methods, deep learning-based frameworks can automatically generate high-level instances and spatial features from the input dataset [
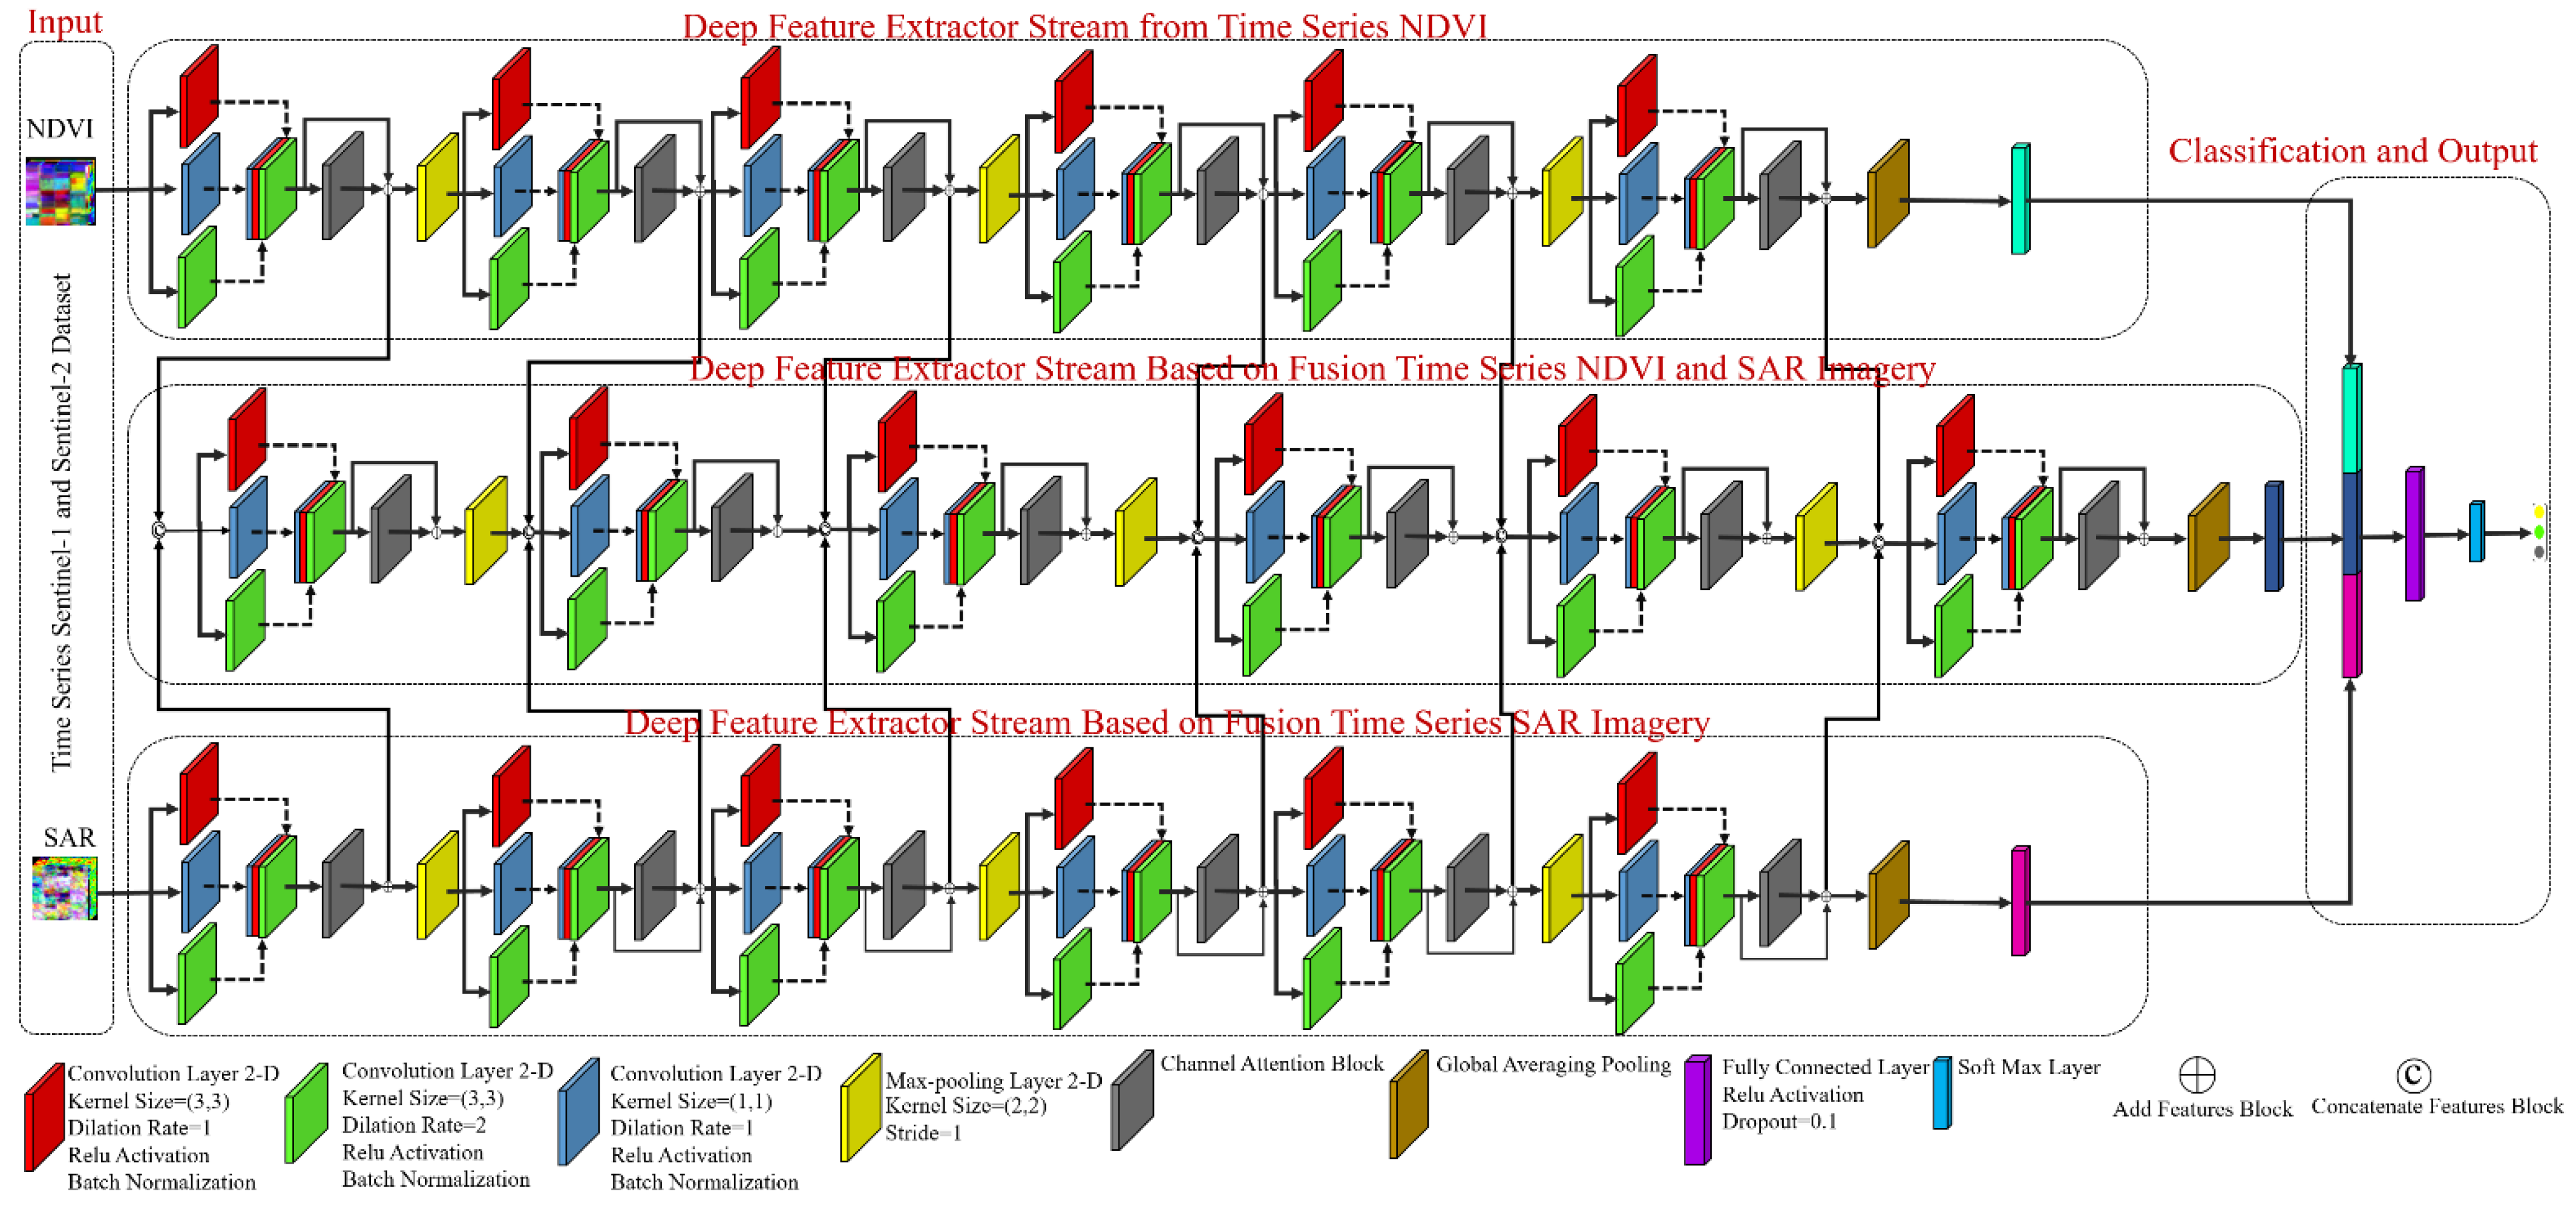
32]. To this end, this research proposes a novel deep-learning framework for rice-type mapping. The proposed framework uses three-channel streams for deep feature extraction. The first and second channels investigate the original SAR and optical datasets, while the third channel considers the fusion of both. This research has made the following key contributions:
- (1)
Presenting a novel deep learning procedure for mapping rice types based on multi-stream CNN.
- (2)
Introducing an informative channel attention module for rice mapping.
- (3)
Utilizing point-wise and group dilated convolution layers for improving the deep feature extractor.
- (4)
Assessing the performance of the advanced rice-type methods based on deep learning frameworks and machine learning-based algorithms.


