
Fodder Grass Strips: An Affordable Technology for Sustainable Rainfed Agriculture in India
Abstract
:1. Introduction
2. Materials and Methods
2.1. Rainfall Scenario
2.2. Soil Sampling
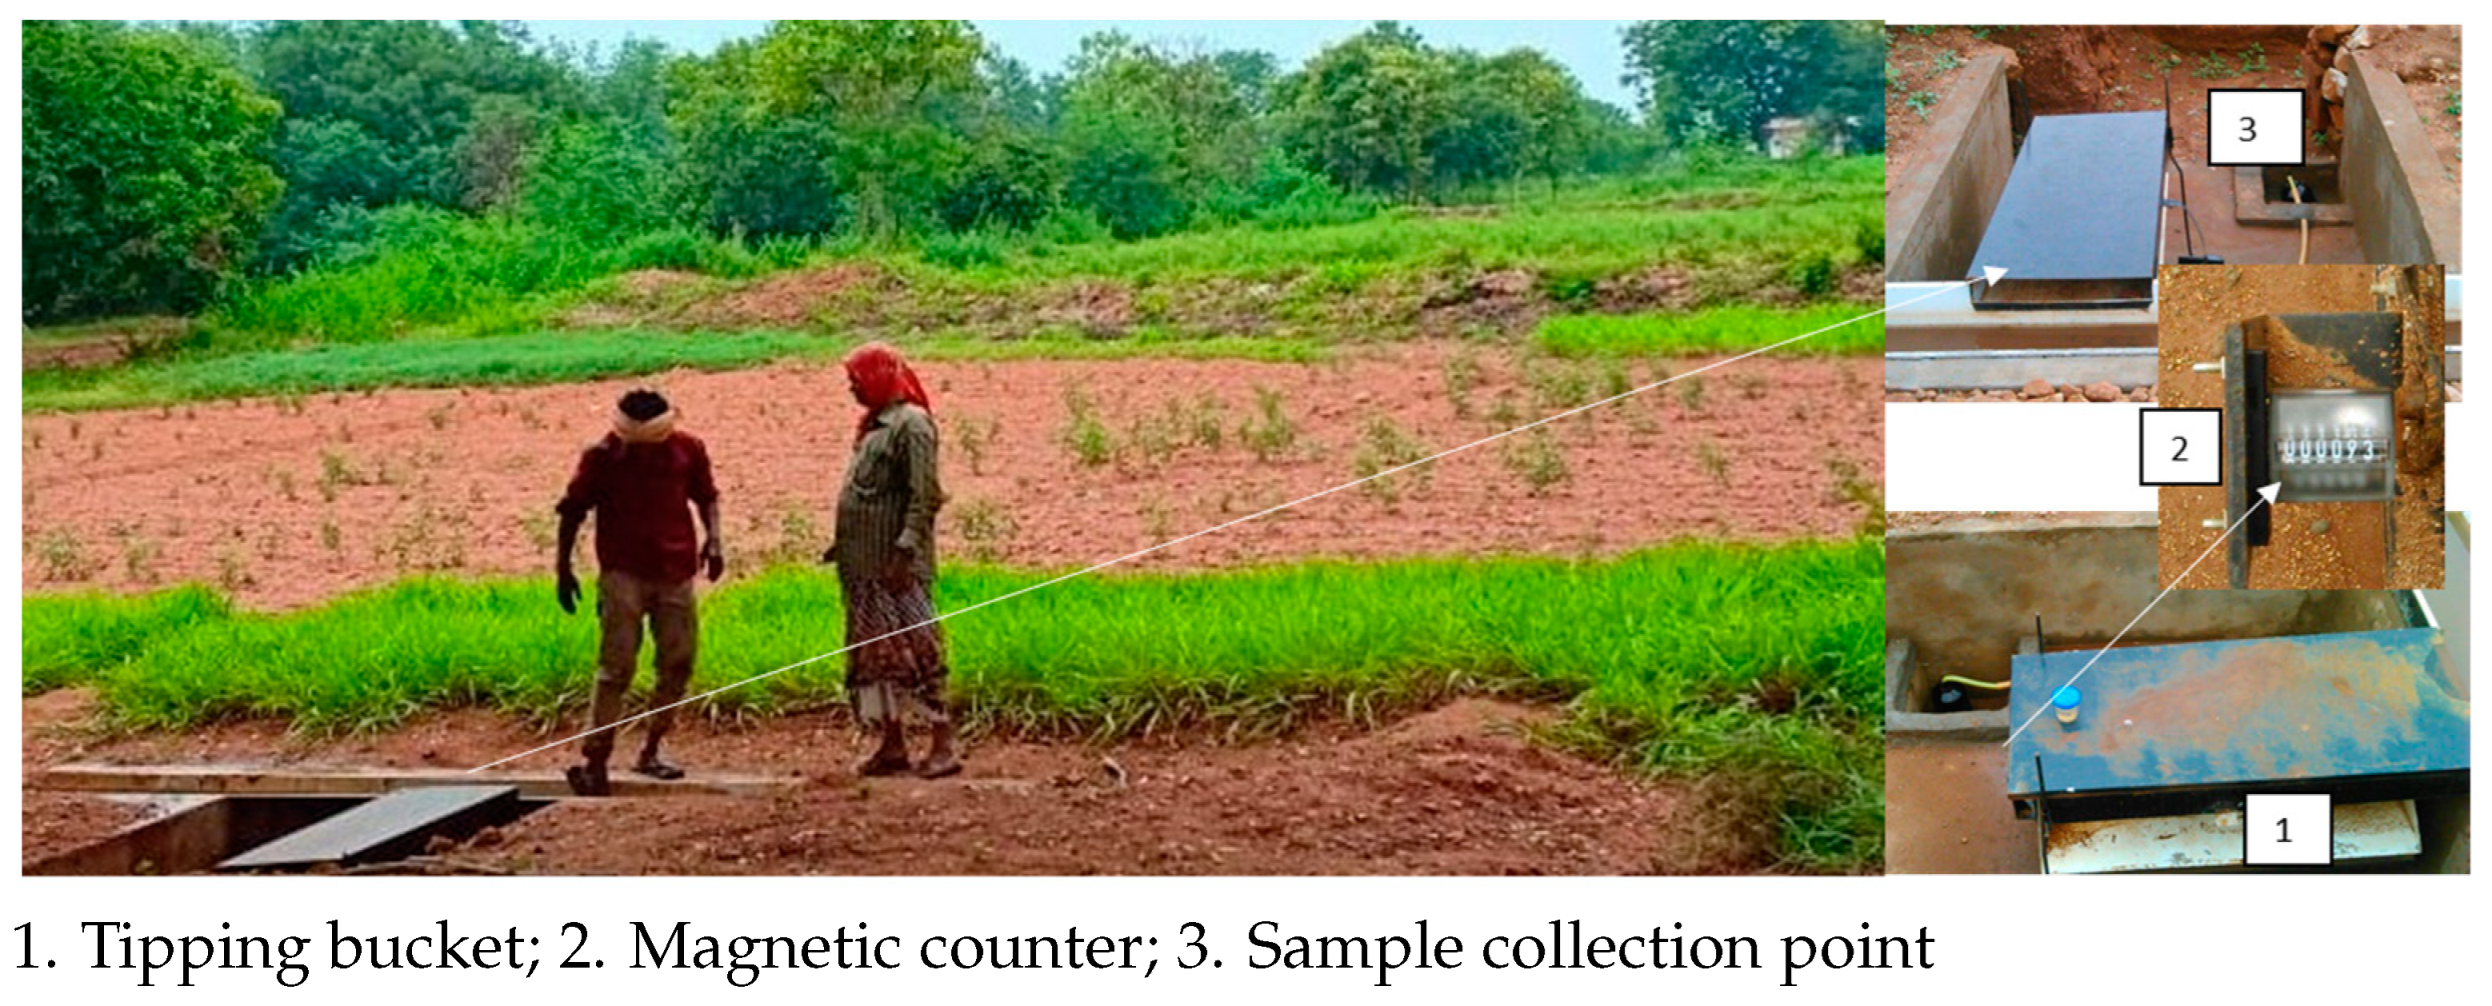
2.3. Runoff Study
2.4. Soil Quality Assessment
2.5. Fodder Quality Assessment
2.6. Economic Assessment
2.7. Statistical Analysis
3. Results
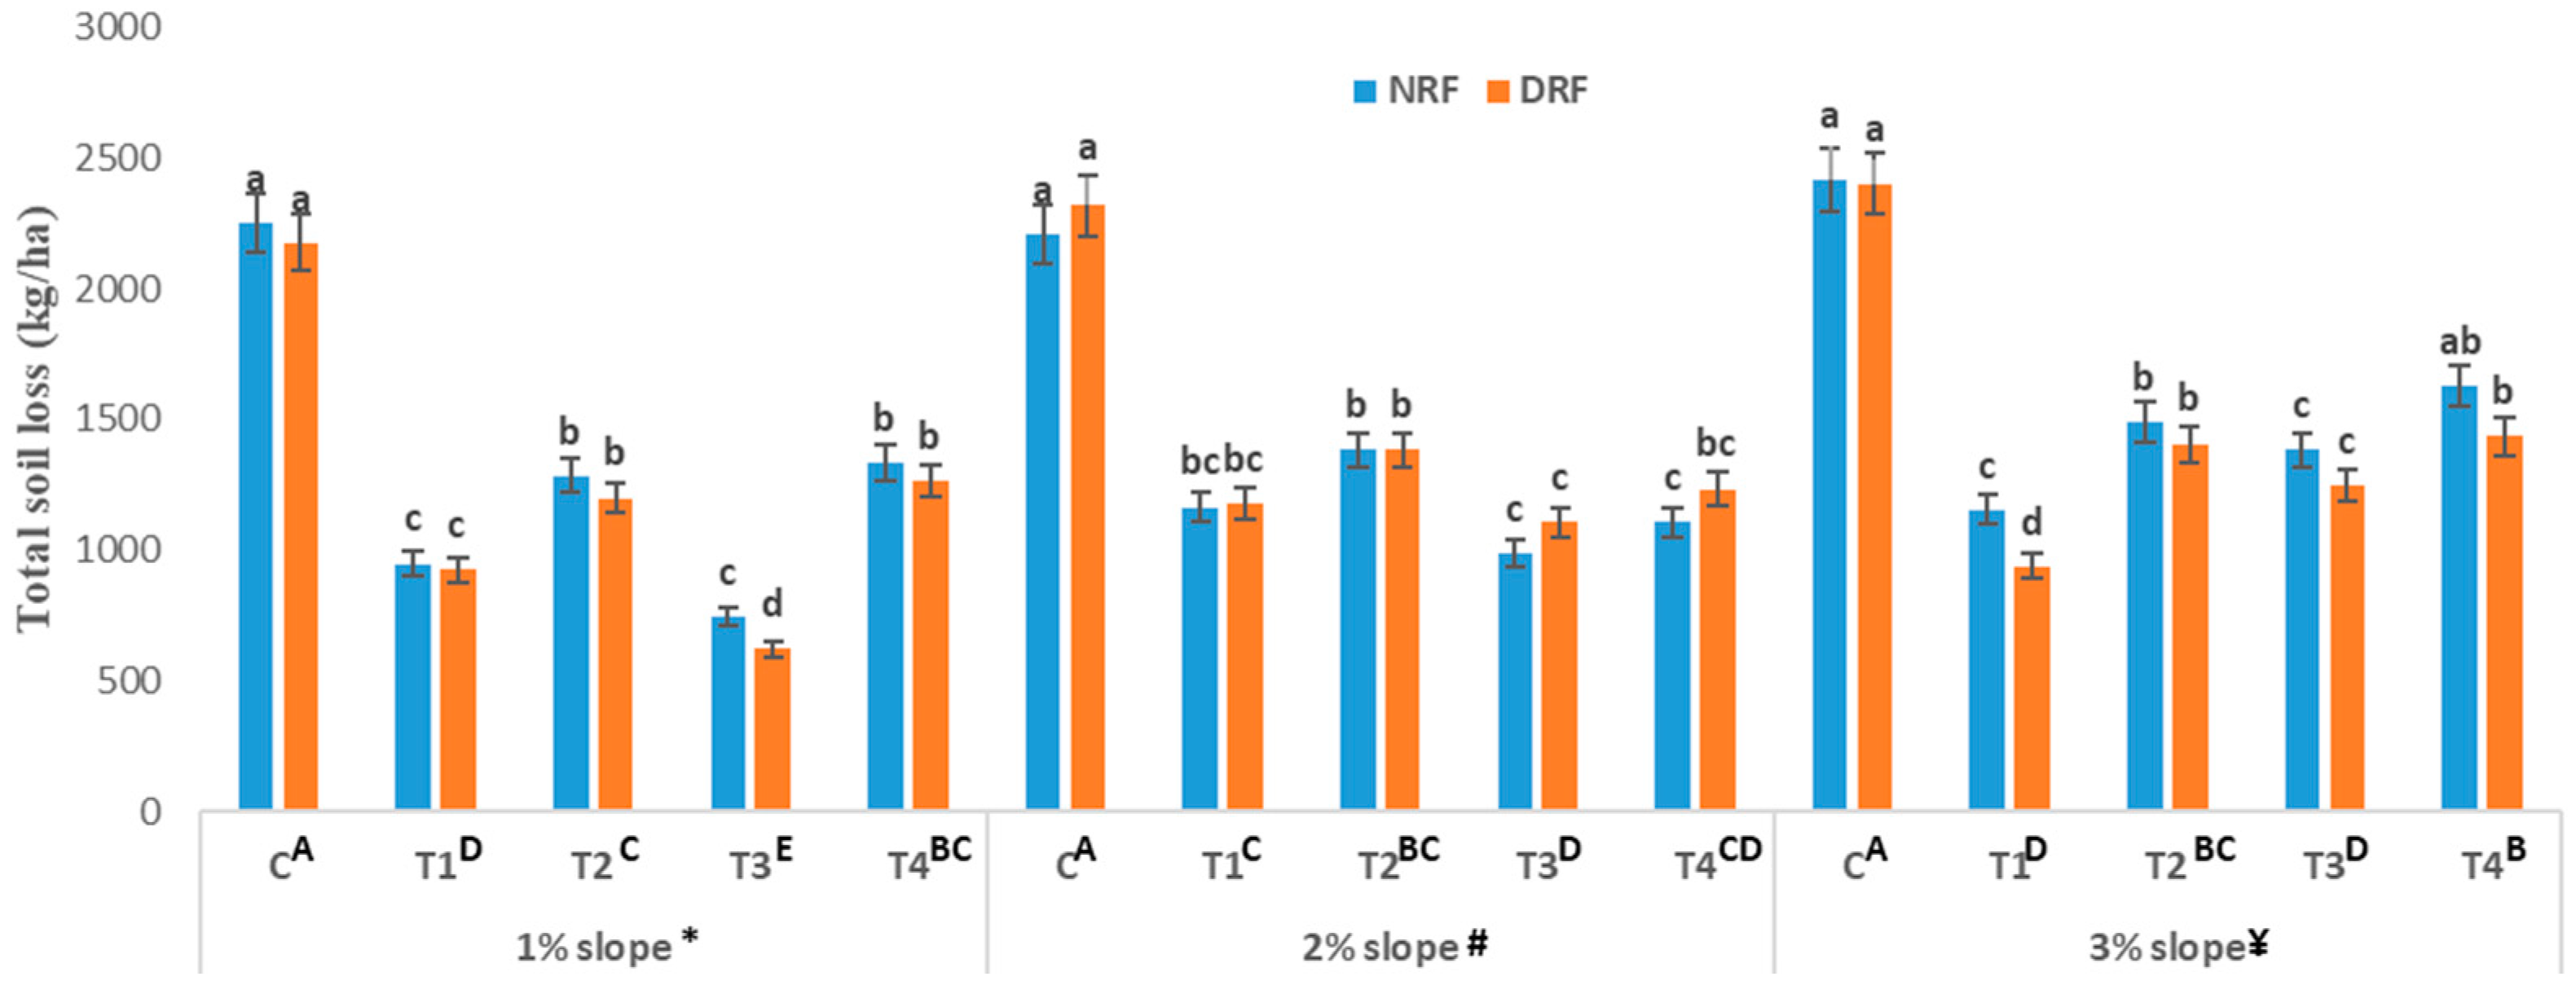
3.1. Erosion Budget
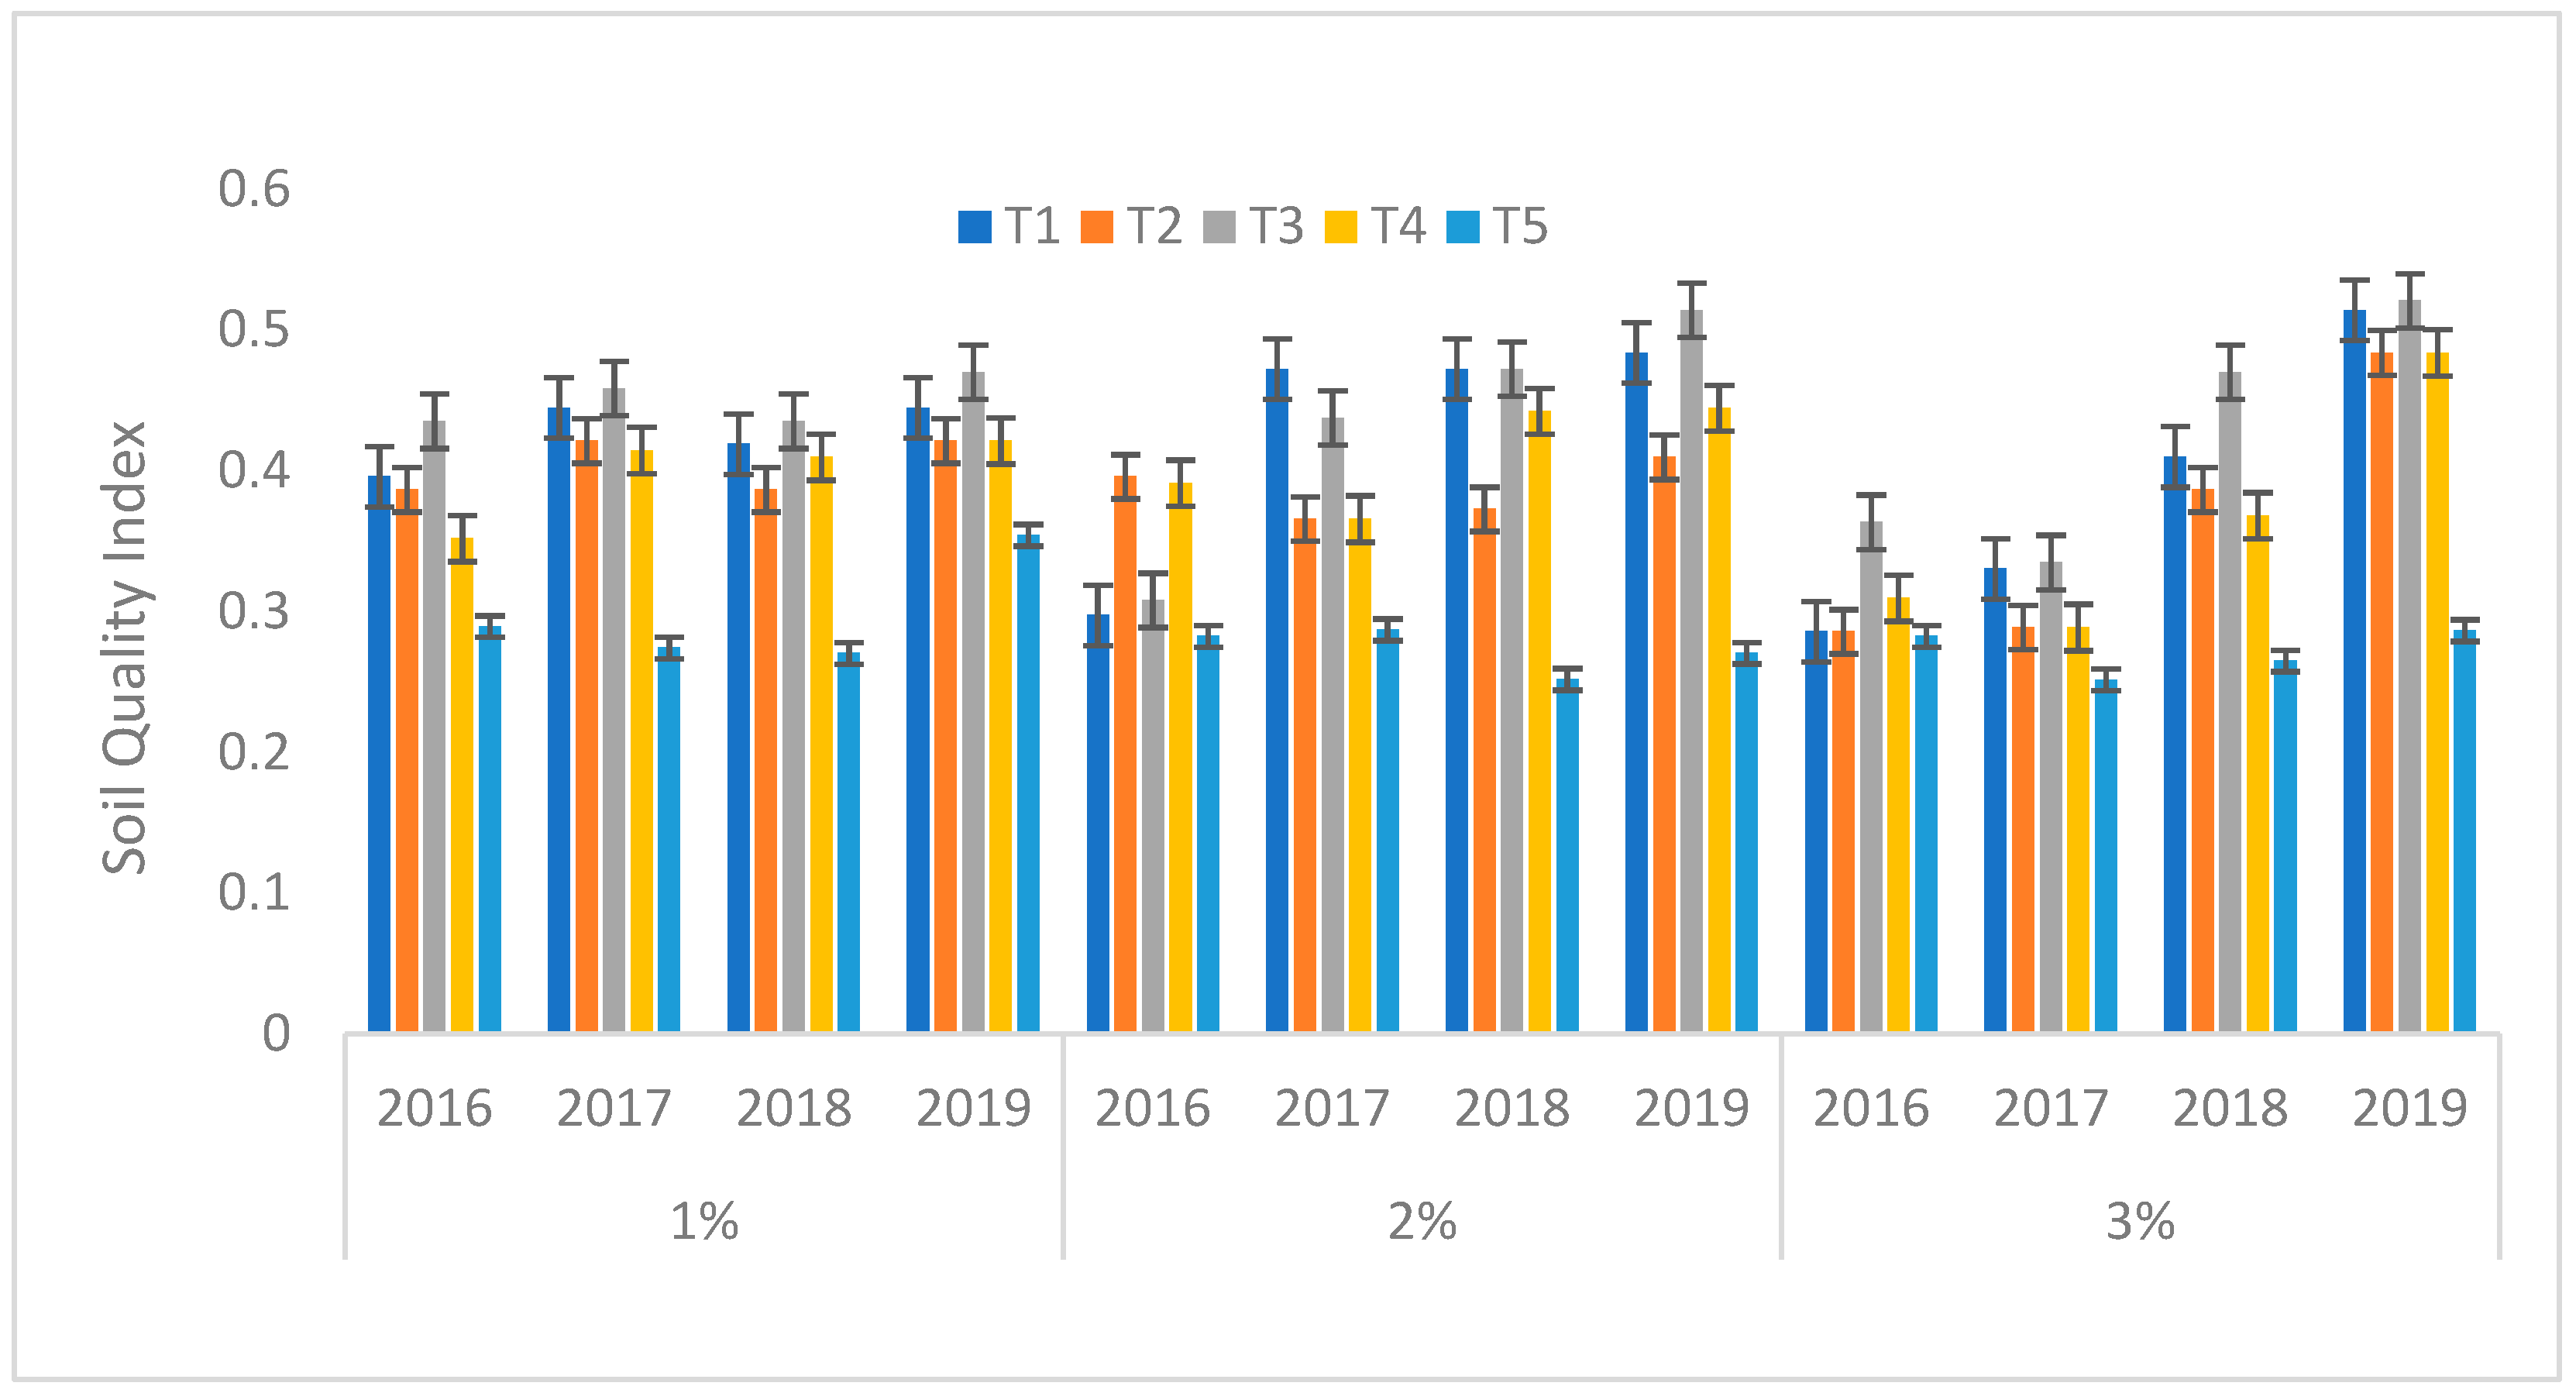
3.2. Soil Quality
3.3. Fodder for Small Ruminants
3.4. Economic Benefits
4. Discussion
4.1. Brachiaria Fodder Strip on Both Sides of the Cultivated Field Has a Positive Effect on Soil Quality
4.2. Grass Strip and Soil Conservation
4.3. The Grass Strip and Its Role in Supporting Livestock Production Systems
5. Conclusions
Author Contributions
Funding
Institutional Review Board Statement
Data Availability Statement
Acknowledgments
Conflicts of Interest
References
- Pal, D.K.; Bhattacharyya, T.; Chandran, P.; Ray, S.K. Tectonics-climate-linked nat-ural soil degradation and its impact in rainfed agriculture: Indian experience. In Rainfed Agri-Culture: Unlocking the Potential; CAB International: Wallingford, UK, 2009; pp. 54–72. [Google Scholar]
- Pushpanjali, J.S.; Rejani, R. Traditional knowledge for soil management India. BEST. Int. J. Humanit. Art. Med. Sci. 2013, 1, 39–44. [Google Scholar]
- Huang, R.; Chen, J.; Huang, G. Characteristics and variations of the East Asian monsoon system and its impacts on climate disasters in China. Adv. Atmos. Sci. 2007, 24, 993–1023. [Google Scholar] [CrossRef]
- Shakoor, A.; Dar, A.A.; Arif, M.S.; Farooq, T.H.; Yasmeen, T.; Shahzad, S.M.; Tufail, M.A.; Ahmed, W.; Albasher, G.; Ashraf, M. Do soil conservation practices exceed their relevance as a countermeasure to greenhouse gases emissions and increase crop productivity in agriculture? Sci. Total Environ. 2022, 805, 150337. [Google Scholar] [CrossRef] [PubMed]
- Huang, M.; Shao, M.; Zhang, L.; Li, Y. Water use efficiency and sustainability of different long-term crop rotation systems in the Loess Plateau of China. Soil Tillage Res. 2003, 72, 95–104. [Google Scholar] [CrossRef]
- National Rainfed Area Authority (NRAA). Accelerating the Growth of Rainfed Agri-Culture-Integrated Farmers Livelihood Approach; Department of Agriculture and Farmers’ Welfare, Ministry of Agriculture & Farmers’ Welfare: New Delhi, India, 2022.
- Meaza, H.; Abera, W.; Nyssen, J. Impacts of catchment restoration on water avail-ability and drought resilience in Ethiopia: A meta-analysis. Land Degrad. Dev. 2022, 33, 547–564. [Google Scholar] [CrossRef]
- Patidar, M. Strip cropping of grass and legume in silvi-pastoral system. In Diversification of Arid Farming Systems; Arid Zone Research Association of India and scientific Publisher: Jodhpur, India, 2008; pp. 141–145. [Google Scholar]
- Magette, W.L.; Brinsfield, R.B.; Palmer, R.E.; Wood, J.D. Nutrient and sediment removal by vegetated filter strips. Trans. ASABE 1989, 32, 663–667. [Google Scholar] [CrossRef]
- Pimentel, D.; McLaughlin, L.; Zepp, A.; Lakitan, B.; Kraus, T.; Kleinman, P.; Vancini, F.; Roach, W.J.; Graap, E.; Keeton, W.S.; et al. Environmental and economic impacts of reducing US agricultural pesticide use. In The Pesticide Question; Springer: Boston, MA, USA, 1993; pp. 223–278. [Google Scholar]
- Koudahe, K.; Allen, S.C.; Djaman, K. Critical review of the impact of cover crops on soil properties. Int. Soil Water Conserv. 2022, 10, 343–354. [Google Scholar] [CrossRef]
- Pushpanjali; Pankaj, P.K.; Samuel, J. Grass strips for soil conservation and soil health in rainfed regions of India. AgricINTERNATIONAL 2019, 6, 1–3. [Google Scholar] [CrossRef]
- Osman, M.; Haffis, S.; Mishra, P.K.; Vijaya Kumar, P. A Case Study of Drought in Andhra Pradesh: Socio-Economic Impacts and Mitigating Strategies. Ind. J. Dryland Agri. Res. Dev. 2010, 25, 44–57. [Google Scholar]
- Klute, A. (Ed.) Methods of Soil Analysis Part 1. Physical and Mineralogical Methods, Agronomy Monograph 9, 2nd ed.; American Society of Agronomy and Soil Science Society of America: Madison, WI, USA, 1986. [Google Scholar]
- Page, A.L.; Miller, R.H.; Keeney, D.R. (Eds.) Methods of Soil Analysis. Part 2. Chemical and Microbiological Properties, Agronomy Monograph 9, 2nd ed.; American Society of Agronomy and Soil Science Society of America: Madison, WI, USA, 1982. [Google Scholar]
- Weaver, R.W.; Mickelson, S.H. (Eds.) Methods of Soil Analysis, Part 2. Microbiological and Biochemical Properties; SSSA Book Series No. 5; Soil Science Society of America: Madison, WI, USA, 1994. [Google Scholar]
- Bashagaluke, J.B.; Logah, V.; Opoku, A.; Sarkodie-Addo, J.; Quansah, C. Soil nutrient loss through erosion: Impact of different cropping systems and soil amendments in Ghana. PLoS ONE 2018, 13, e0208250. [Google Scholar] [CrossRef] [Green Version]
- Karlen, D.L.; Stott, D.E. A framework for evaluating physical and chemical indicators of soil quality. In Defining Soil Quality for a Sustainable Environment; Doran, J.W., Coleman, D.C., Bezdicek, D.F., Stewart, B.A., Eds.; SSSA: Madison, WI, USA, 1994; pp. 53–72. [Google Scholar]
- Fernandes, M.F.; Barreto, A.C.; Mendes, I.C.; Dick, R.P. Short-term response of physical and chemical aspects of soil quality of a kaolinitic Kandiudalfs to agricultural practices and its association with microbiological variables. Agric. Ecosyst. Environ. 2011, 142, 419–427. [Google Scholar] [CrossRef]
- Andrews, S.; Karlen, D.; Mitchell, J. A comparison of soil quality indexing methods for vegetable production systems in Northern California. Agric. Ecosyst. Environ. 2022, 90, 25–45. [Google Scholar] [CrossRef]
- Vasu, D.; Singh, S.K.; Ray, S.K.; Duraisami, V.P.; Tiwary, P.; Chandran, P.; Nimkar, A.M.; Anantwar, S.G. Soil quality index (SQI) as a tool to evaluate crop productivity in semi-arid Deccan plateau, India. Geoderma 2016, 282, 70–79. [Google Scholar] [CrossRef]
- Masto, R.E.; Chhonkar, P.K.; Singh, D.; Patra, A.K. Soil quality response to long-term nutrient and crop management on a semi-arid Inceptisol. Agric. Ecosyst. Environ. 2007, 118, 130–142. [Google Scholar] [CrossRef]
- Mukherjee, A.; Lal, R. Comparison of soil quality index using three methods. PLoS ONE 2014, 9, 1–15. [Google Scholar] [CrossRef] [PubMed] [Green Version]
- Mandal, U.K.; Sharma, K.L.; Venkanna, K.; Pushpanjali; Adake, R.V.; Masane, R.N.; Prasad, J.V.N.S.; Venkatesh, G.; Rao, C.S. Sustaining soil quality, resilience and critical carbon level under different cropping systems in semi-arid tropical Alfisol soils. Curr. Sci. 2017, 112, 1882–1895. [Google Scholar] [CrossRef]
- Glover, J.D.; Reganold, J.P.; Andrews, P.K. Systematic method for rating soil quality of conventional, organic, and integrated apple orchards in Washington State. Agric. Ecosyst. Environ. 2000, 80, 29–45. [Google Scholar] [CrossRef] [Green Version]
- Samuel, J.; Rama Rao, C.A.; Ravindra Chary, G.; Raju, B.M.K.; Pushpanjali. Environmental Impact of Resource Conservation Technology: The Case of Soybean in Central India. Multilogic. Sci. 2020, 32, 489–492. [Google Scholar]
- Gomez, K.A.; Gomez, A.A. Statistical Procedure for Agricultural Research, 2nd ed.; Wiley: New York, NY, USA, 1984. [Google Scholar]
- Jha, S.K.; Tiwari, N. Evaluation of intensive fodder cropping systems for round the year green fodder production in Chhattisgarh. Forage Res. 2018, 44, 115–118. [Google Scholar]
- Manoj, K.N.; Shekara, B.G.; Agrawal, R.K.; Mudalagiriyappa; Chikkarugi, N.M. Productivity and quality of fodder as influenced by different bajra napier hybrid and legume fodder cropping systems. Range Manag. Agrofor. 2022, 43, 88–93. [Google Scholar]
- Pushpanjali; Samuel, J. Soil health in rainfed regions: Grass strips of soil conservation. Indian Farming 2019, 69, 20–21. [Google Scholar] [CrossRef]
- Salehin, S.; Ghimire, R.; Angadi, S.V.; Idowu, O.J. Grass buffer strips improve soil health and mitigate greenhouse gas emissions in center-pivot irrigated cropping systems. Sustainability 2020, 12, 6014. [Google Scholar] [CrossRef]
- Mishra, S.; Sharma, S.; Vasudevan, P. Effect of Single and Dual Inoculation with Rhizobium and AM Fungi on Nodulation, Fodder Production and Quality in Two Stylosanthes Species. Biol. Agric. Hortic. 2009, 26, 411–421. [Google Scholar] [CrossRef]
- Kauthale, V.K.; Takawale, P.S.; Patil, S.D. Fodder productivity influenced by various grass-legume combinations and planting methods in western Maharashtra. Range Manag. Agrofor. 2017, 38, 96–99. [Google Scholar]
- Gichangi, E.M.; Njarui, D.M.; Ghimire, S.R.; Gatheru, M.; Magiroi, K.W. Effects of cultivated Brachiaria grasses on soil aggregation and stability in the semi-arid tropics of Kenya. Trop. Subtrop. Agroecosyst. 2016, 19, 205–217. [Google Scholar]
- Umer, S.; Aticho, A.; Kiss, E. Effects of integrated use of grass strip and soil bund on soil properties, Southern Ethiopia. J. Degrade. Min. Land Manag. 2019, 6, 1569. [Google Scholar] [CrossRef] [Green Version]
- Abiven, S.; Menasseri, S.; Chenu, C. The effects of organic inputs over time on soil aggregate stability–A literature analysis. Soil Biol. Biochem. 2009, 41, 1–12. [Google Scholar] [CrossRef]
- Chenu, C.; Le Bissonnais, Y.; Arrouays, D. Organic matter influence on clay wet-tability and soil aggregate stability. Soil Sci. Soc. Am. J. 2000, 64, 1479–1486. [Google Scholar] [CrossRef]
- Beare, M.H.; Hendrix, P.F.; Coleman, D.C. Water-stable aggregates and organic matter fractions in conventional-and no-tillage soils. Soil Sci. Soc. Am. J. 1994, 58, 777–786. [Google Scholar] [CrossRef]
- Douglas, J.T.; Goss, M.J. Modification of porespace by tillage in two stagnogley soils with contrasting management histories. Soil Tillage Res. 1987, 10, 303–317. [Google Scholar] [CrossRef]
- Berg, W.A.; Smith, S.J.; Coleman, G.A. Management effects on runoff, soil, and nutrient losses from highly erodible soils in the Southern Plains. J. Soil Water Conserv. 1988, 43, 407–410. [Google Scholar]
- Cheruiyot, D.; Midega, C.A.O.; Pittchar, J.O.; Pickett, J.A.; Khan, Z.R. Farmers’ Perception and Evaluation of Brachiaria Grass (Brachiaria spp.) Genotypes for Smallholder Cere-al-Livestock Production in East Africa. Agriculture 2020, 10, 268. [Google Scholar] [CrossRef]
- Njarui, D.M.G.; Gatheru, M.; Ghimire, S.R. Brachiaria grass for climate resilient and sustainable livestock production in Kenya. In African Handbook of Climate Change Adaptation; Springer International Publishing: Midtown Manhattan, NY, USA, 2020; pp. 1–22. [Google Scholar]
- Le Bissonnais, Y.; Lecomte, V.; Cerdan, O. Grass strip effects on runoff and soil loss. Agronomie 2004, 24, 129–136. [Google Scholar] [CrossRef]
- Pankaj, P.K.; Gaur, M.K.; Nirmala, G.; Maruthi, V.; Pushpanjali; Samuel, J.; Reddy, K.S. Diversification and land use management practices for food and nutritional security under the climate change scenario in arid and semi-arid regions of India. In Food Security and Land Use Change Under Conditions of Climatic Variability; Springer: Cham, Switzerland, 2020; pp. 281–309. [Google Scholar]
- Pushpanjali; Reddy, K.S.; Samuel, J.; Pankaj, P.K.; Reddy, A.G.K.; Rohit, J.; Reddy, K.S. Fodder Grass Strips for Soil Conservation and Soil Health. Chem. Proc. 2022, 10, 58. [Google Scholar]
- Alewell, C.; Meusburger, K.; Brodbeck, M.; Banninger, D. Methods to describe and predict soil erosion in mountain regions. Landsc. Urban Plan 2008, 88, 46–53. [Google Scholar] [CrossRef]
- Indian Grassland and Fodder Research Institute (IGFRI). Vision 2050. IGFRI: India. 2015; p. 40. Available online: https://www.igfri.res.in/cms/Publication/Miscellaneous/IGFRI,%20Jhansi%20(Vision%202050).pdf (accessed on 10 January 2023).
- Chandra, A.; Pathak, P.S.; Bhatt, R.K. Stylosanthes research in India: Prospects and challenges ahead. Curr. Sci. 2006, 90, 915–921. [Google Scholar]


| Land Management Practices | Slope Position within the Plot | Replication at 1%, 2%, and 3% Slope |
|---|---|---|
| 2 m strip of Brachiaria ruziziensis | Upper Lower | 4 |
| 2 m strip of Brachiaria ruziziensis | Lower | 4 |
| 2 m strip of Stylosanthes hamata | Upper Lower | 4 |
| 2 m strip of Stylosanthes hamata | Lower | 4 |
| Experimental plot without a grass strip | - | 4 |
| Total composite soil samples | 60 | |
| Soil Parameters | Weights | Class I with Score 4 | Class II with Score 3 | Class III with Score 2 | Class IV with Score 1 |
|---|---|---|---|---|---|
| pH | 0.03 | 6.5- 7.5 | 6–6.5/7.5–8 | 5.5–6/8–8.5 | <5.5/>8.5 |
| EC (µs/ms) | 0.03 | 0–0.8 | 0.8–1.6 | 1.6–3.2 | >3.2 |
| N(kg/ha) | 0.15 | >560 | 560–420 | 280–420 | <280 |
| P(kg/ha) | 0.1 | >25 | 15–25 | 15 to 10 | <10 |
| K (kg/ha) | 0.05 | >280 | 200–280 | 200–120 | <120 |
| Ca (ppm) | 0.03 | >300 | 300–200 | 200–100 | <100 |
| Mg (ppm) | 0.03 | >150 | 150–100 | 100–50 | <50 |
| Zn (ppm) | 0.03 | >2.0 | 1.0–2.0 | 0.5–1.0 | <0.5 |
| Fe (ppm) | 0.03 | >10.0 | 5.5–10 | 2.5–5.5 | <2.5 |
| Mn (ppm) | 0.03 | >10.0 | 4.0–10.0 | 2.0–4.0 | <2.0 |
| Cu (ppm) | 0.03 | >2.0 | 0.5–2.0 | 0.2–0.5 | <0.2 |
| Water stable aggregate (%) | 0.1 | 75–100 | 75–25 | 25.0–10 | <10 |
| Mean weight diameter (mm) | 0.15 | >5.0 | 2.00–5.00 | 1.00–2.0 | <1 |
| Infiltration (mm/hr) | 0.03 | >150 | 150–100 | 100–70 | 70-60 |
| Bulk density (g/cm3) | 0.03 | 1.3–1.4 | 1.2–1.3 or 1.4–1.5 | 1.1–1.2 or 1.5–1.6 | <1.1/>1.6 |
| Organic carbon (%) | 0.15 | >1 | 1–0.75 | 0.75–0.5 | <0.5 |
| Fodder Quality Indicators | Fodder | Weights | Scoring | |||
|---|---|---|---|---|---|---|
| Class IV with Score 1 | Class III with Score 2 | Class II with Score 3 | Class I with Score 4 | |||
| Fodder productivity (t/ha) | Stylo | 0.2 | <8 | 8–11 | 12–15 | >15 |
| Brachiaria | <20 | 20–24 | 25–29 | >29 | ||
| Leafiness (%) | Stylo | 0.1 | <50 | 50–54 | 55–59 | >59 |
| Brachiaria | <50 | 50–54 | 55–59 | >59 | ||
| Crude protein (%) | Stylo | 0.15 | <20 | 20–24 | 25–29 | >29 |
| Brachiaria | <6 | 6–7 | 7–8 | >8 | ||
| Crude fiber (%) | Stylo | 0.15 | >15 | 13–15 | 10–12 | <10 |
| Brachiaria | >34 | 30–34 | 25–29 | <25 | ||
| No. of sheep supported by 1 ha area fodder | Stylo | 0.1 | <25 | 25–29 | 29–34 | >34 |
| Brachiaria | <25 | 25–29 | 29–34 | >34 | ||
| Palatability | Stylo | 0.2 | <70 | 70–79 | 80–89 | >89 |
| Brachiaria | <50 | 50–59 | 60–69 | >69 | ||
| Average daily gain (g/d) | Stylo | 0.1 | <25 | 25–32 | 33–40 | >40 |
| Brachiaria | <20 | 20–24 | 25–29 | >29 | ||
Disclaimer/Publisher’s Note: The statements, opinions and data contained in all publications are solely those of the individual author(s) and contributor(s) and not of MDPI and/or the editor(s). MDPI and/or the editor(s) disclaim responsibility for any injury to people or property resulting from any ideas, methods, instructions or products referred to in the content. |
© 2023 by the authors. Licensee MDPI, Basel, Switzerland. This article is an open access article distributed under the terms and conditions of the Creative Commons Attribution (CC BY) license (https://creativecommons.org/licenses/by/4.0/).
Share and Cite
Pushpanjali; Samuel, J.; Pankaj, P.K.; Reddy, K.S.; Karthikeyan, K.; Reddy, A.G.K.; Rohit, J.; Sammi Reddy, K.; Singh, V.K. Fodder Grass Strips: An Affordable Technology for Sustainable Rainfed Agriculture in India. Agriculture 2023, 13, 318. https://doi.org/10.3390/agriculture13020318
Pushpanjali, Samuel J, Pankaj PK, Reddy KS, Karthikeyan K, Reddy AGK, Rohit J, Sammi Reddy K, Singh VK. Fodder Grass Strips: An Affordable Technology for Sustainable Rainfed Agriculture in India. Agriculture. 2023; 13(2):318. https://doi.org/10.3390/agriculture13020318
Chicago/Turabian StylePushpanjali, Josily Samuel, Prabhat Kumar Pankaj, Konda Srinivas Reddy, Karunakaran Karthikeyan, Ardha Gopala Krishna Reddy, Jagriti Rohit, Kotha Sammi Reddy, and Vinod Kumar Singh. 2023. "Fodder Grass Strips: An Affordable Technology for Sustainable Rainfed Agriculture in India" Agriculture 13, no. 2: 318. https://doi.org/10.3390/agriculture13020318