Article

Investigation on Minimum Ventilation, Heating, and Energy Consumption of Pig Buildings in China during Winter

1
College of Water Resources & Civil Engineering, China Agricultural University, Beijing 100083, China
2
Key Laboratory of Agricultural Engineering in Structure and Environment, Ministry of Agriculture and Rural Affairs, Beijing 100083, China
3
Beijing Engineering Research Center on Animal Healthy Environment, Beijing 100083, China
*
Author to whom correspondence should be addressed.
Agriculture 2023, 13(2), 319; https://doi.org/10.3390/agriculture13020319
Submission received: 24 December 2022 / Revised: 15 January 2023 / Accepted: 24 January 2023 / Published: 28 January 2023

Abstract

:
Ventilation and heating can be necessary for pig production during winter in China. However, it is challenging to balance the ventilation rate and heat loss due to the ventilation. Therefore, it is essential to design the minimum ventilation and heating load properly in order to reduce energy loss. In this paper, a VBA (Visual Basic for Applications) model based on energy balance is established. Meteorological data, pig body masses, outdoor temperatures, feeding densities, and building envelope thermal insulance factors were involved in the model. A model pig house with a length and width of 110 m × 15 m was used to investigate the ventilation, heating time, load, and power consumption in different climate zones, i.e., Changchun, Beijing, Nanning, Wuhan, and Guiyang, representing five major climate regions in China. Based on the simulation results, the models of minimum ventilation and heating load were fitted. The results showed that there is a logarithmic relationship between the minimum ventilation volume and body mass, R2 = 0.9673. The R2 of heating load models for nursery pigs and fattening pigs were 0.966 and 0.963, respectively, considering the feeding area, the outside temperature, the body masses of the nursery and fattening pigs, and the thermal insulance factor of the enclosure. The heating requirements of commercial pig houses within the same building envelope followed the trend in Changchun > Beijing > Guiyang > Wuhan > Nanning. Increasing the building envelope’s thermal insulance factor or using precision heating could reduce the pig house’s power consumption. The analysis of the heating load and energy consumption of winter pig houses in various climate regions provided a reference for precise environmental control and the selection of building thermal insulance factors in China.

1. Introduction

A suitable environment in pig houses in winter is crucial for pig breeding. Low temperatures in the thermal neutral zone of animal housing cause a series of physiological changes in pigs, including accelerated breathing, vasoconstriction, enhanced endocrine activities, and accelerated nutrient and energy metabolism to maintain a normal body temperature, all of which compromise their health and welfare [1,2,3,4]. When pigs are under cold stress, their body mass gain rate decreases, and their feed intake and feed-to-mass ratio increase, seriously affecting the economic benefits of pig farms [5,6].
China has a vast territory with various climatic types, and regional differences are also noticeable. Due to the wide range of winter climates, different areas should adopt different thermal insulation and heating methods to maintain a stable environment for pigs. Pigs raised in heated pig houses grow faster and suffer from fewer diseases than those raised in unheated ones [7,8,9]. However, heating methods can significantly increase energy consumption [10]. According to the survey, thermal energy consumption accounts for 69.2% of overall consumption in pig houses [11].
Over the past decades, studies have been conducted on various topics to save energy consumption by changing the way energy is used [12,13,14], reducing nighttime temperatures [15], and using a PID controller [16], etc. Several studies have reported that ventilation rate, stocking density, and building envelope thermal resistance can significantly impact heating loads [17,18]. Therefore, to maximally save heating energy in fattening pig houses essentially, it is of great significance to design the minimum ventilation and heating load scientifically, which simultaneously meets the requirements of precision control of pig houses.
Models based on various environmental control strategies were constructed for precise environmental management [19,20]. Many of them were based on energy mass balance [21,22]. Among them, Xie et al. [23] developed a novel dynamic thermal exchange model using the energy balance equation to improve indoor thermal environment control and energy conservation. Costantino et al. [24] created a new dynamic energy simulation model for the estimation of the energy consumption for climate control of mechanically ventilated growing–finishing pig houses. However, there have been few studies on the energy consumption generated by ventilation selection and heating load in winter. These studies were based on energy balance and took into account environmental factors, building structure, and pigs’ growth stages, making them complex works [25]. To the authors’ knowledge, however, the detailed analysis of the winter ventilation control of different climate zones in China was still missing, making the energy consumption of pig houses a big problem, especially considering the large volume of pig production there.
Therefore, the main objective of this work was to explore the calculation model for the minimum ventilation and heating load needed in winter, in order to add this missing information to the literature. Furthermore, the heating and energy consumption situation of pig houses in different regions of China were analyzed, which provided a reference for the winter environmental regulation of pig houses in different environments.

2. Materials and Methods

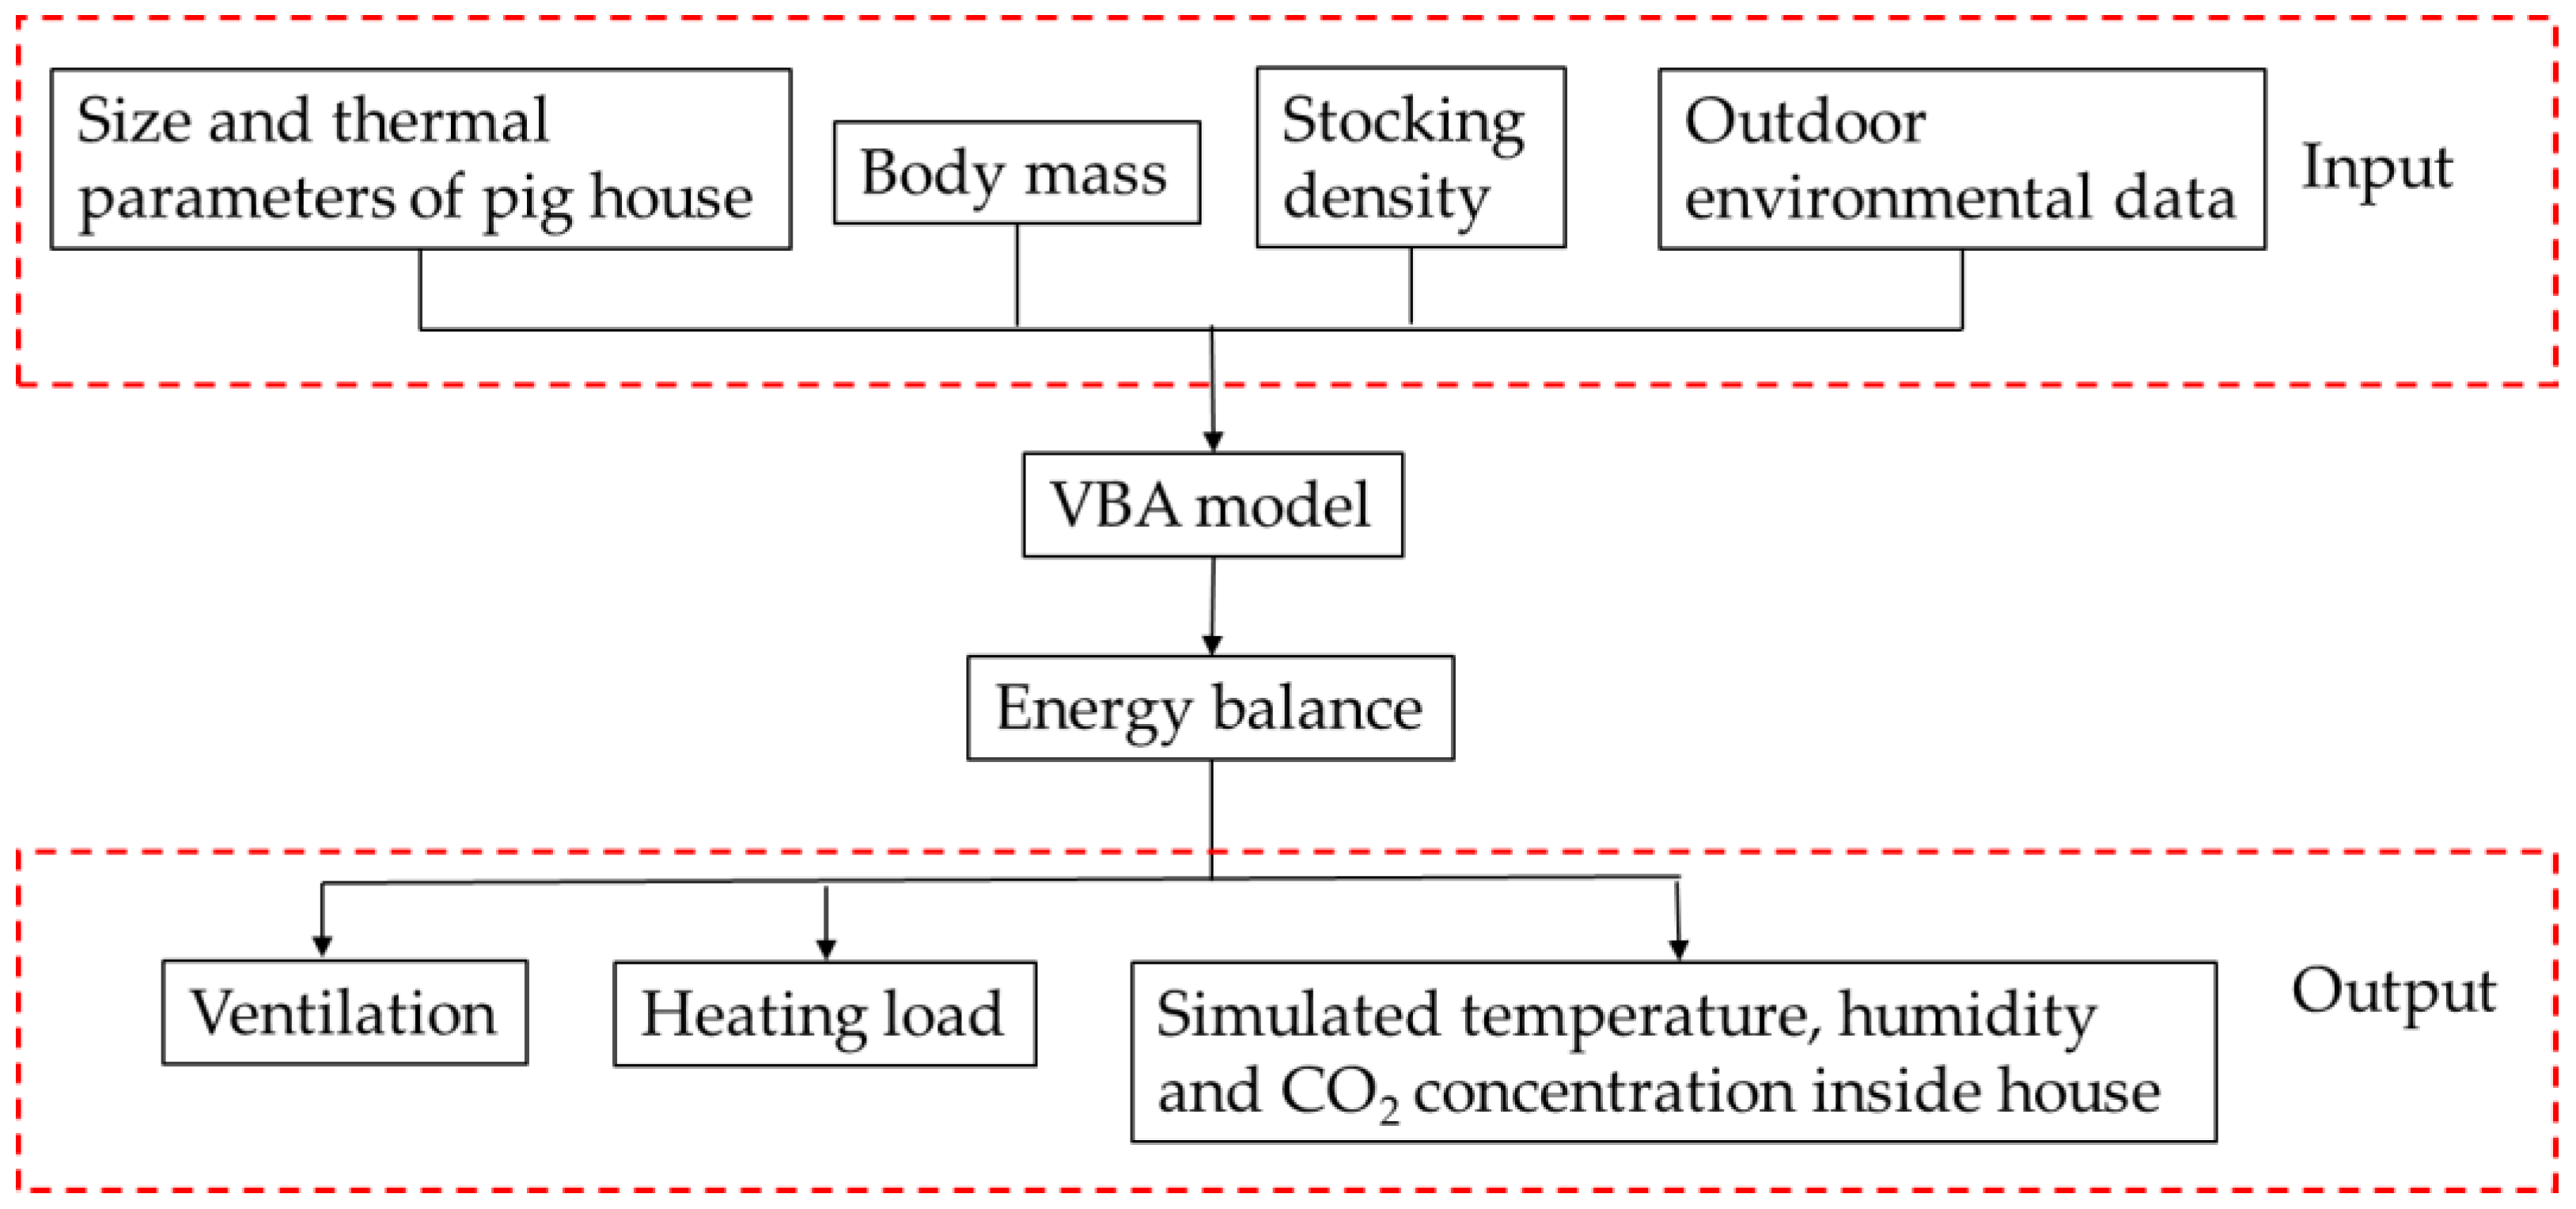
2.1. Construction of VBA (Visual Basic for Applications) Model

Energy balance equations were used to build a VBA model that could simulate the ventilation and environment of pig houses in winter under different breeding conditions. The simulation process is shown in Figure 1. To ensure the model could produce precise results, the model was verified first; the validation of the calculation model is presented in Section 3.1.
The internal equations of the VBA model refer to CIGR [26,27]. The heat balance can be written as follows:
Q s × Y + Q m + Q p = Q w + Q v + Q e ,
where Q s is the sensible heat produced by each pig, W; Y is the number of pigs, head; Q m is the heat dissipated by lighting, motors, and equipment, W, which value was often ignored; Q w is the heat consumption of the building through the envelope, W; Q v is the sensible heat loss of the air, W; Q e is the sensible heat due to water evaporation, W. Because some of the sensible heats have already considered this factor, it is generally not calculated separately; Q p is the supplementary heat of the heating radiator, W. Therefore, the equation of ventilation heat consumption can be simplified as:
Q v + Q s + Q w = 0 .
The value is positive when the air inside the house is heated, and the value is negative when the air inside the house loses heat.
The minimum ventilation rate in winter can be calculated by moisture balance or the limit of CO2 concentration in the house, as shown in Equation (3) [28].
V min = max { V t , V CO 2 , V h } ,
where V min is the minimum ventilation rate in winter in pig houses, m3 h−1;   V t is the ventilation volume determined by the heat balance without heating, m3 h−1;   V CO 2 is the ventilation volume determined by the CO2 balance, m3 h−1;   V h is the ventilation volume determined by the humidity balance, m3 h−1.
The amount of winter ventilation determined by the heat balance is derived from Equation (2) and shown in Equation (4).
V t = Q s × Y + Q w C p ρ w Δ t ,
where C p is the specific heat capacity of air at constant pressure, C p = 0.28 W h (kg∙°C)−1;   ρ w is the air density, ρ w = 353 / ( t + 273 ) , kg m−3;   Δ t is the temperature difference between inside and outside the house, °C.
The relationship model between sensible heat production and total heat production is as follows:
Q S = [ 0.8 ( 1000 + 12 · ( 20 t 1 ) ) 0.38 · t 0 2 ] × Q t 20 1000 ,
where t 1 is the indoor temperature, °C;   Q t 20 is total heat production of pigs at 20 °C, W.
The total heat production model of pigs is as follows:
Q t = 5.09 m 0.75 + [ 1 ( 0.47 + 0.03 m ) ] ( 5.09 n m 0.75 5.09 m 0.75 ) × 0.8 ( 1000 + 12 × 20 t 1 ) ,
where Q t is total heat production of pigs, W;   m is the body mass of the pig, kg; n is the multiple of the daily energy intake and the energy required to maintain the daily activities of pigs, which is typically 3.
The heat consumption of the building through the envelope is as follows:
Q w = e k A Δ t
where e is the heat transfer correction coefficient; k is the heat transfer coefficient, W m−2 °C−1;   A is the surface area of the considered roof and wall, m2; Δ t is the temperature difference between the spaces separated by the wall or the roof, °C. By determining the low-limit critical temperature t imin inside the house and the ambient temperature t outside the house, the temperature difference Δ t between the inside and outside can be calculated. The low-limit critical temperature inside the house t imin satisfied the Equation (8). (The linear regression equation was obtained by analyzing the low-limit critical temperature requirements of pigs with different body masses in CIGR [29]).
t imin = { 0.2299 m + 26.794 ( m < 60   k g ) 13 ( m 60   k g ) ,
where t imin is the low-limit critical temperature inside the house, °C; m is the body mass of the pig, kg. The ventilation rate determined by the moisture balance in winter is shown in Equation (9).
V h = F V ρ w ( d i d 0 ) × 3.6 × 10 6 ,
where F V is the amount of water vapor removed by the ventilation of the pig house, g h−1;   d i is the moisture content of the air inside the house, kg kg−1;   d 0 is the moisture content of the air outside the house, kg kg−1; 3.6 × 10⁶ is the unit conversion coefficient, 1 kg s−1 = 3.6 × 10⁶ g h−1.
The amount of winter ventilation determined by the CO2 balance is shown in Equation (10).
V CO 2 = 0.185 × Q t 20 × A 1000 × ( C i C 0 ) × Y ,
where Q t 20 is the total heat output at 20 °C, W;   C i is the CO2 concentration, and the upper limit concentration inside the house is 3.0 × 10⁻³, m3 m−3;   C 0 is the CO2 concentration outside the house, which is 0.3 × 10⁻³, m3 m−3; 0.185 is the constant factor, and the carbon dioxide production is approximately 0.185 m3 h−1, which corresponds to a medium feeding level for pigs. A is relative animal activity, which can be approximated by the following sinusoidal equation:
A = 1 a · sin [ ( 2 × π 24 ) ( h 6 h min ) ] ,
where a is constant (expressing the amplitude with respect to the constant 1); h is the time point; h min is the time of the day with minimum activity (hours after midnight). Information was obtained from the table where a is 0.43, and h min is 1.3.
When V min = V t , the heating load Q p is 0, and the relative humidity and CO2 concentration are both lower than the limit. When V min = V CO 2 or V h , and the heating load Q p is not 0, the sensible heat production of pigs in the pig house is lower than the heat consumption of the building envelope and the ventilation heat dissipation. So the corresponding heat needs to be supplemented in the house to maintain the heat balance. This additional heating load satisfies the following model:
Q p = Q w + C p ρ w Δ t V min Q s × Y .
Through the analysis of the heating load equation, it was found that the heating load of each pig was determined by the body mass of the pig, the temperature outside the house, the stocking density, and the thermal insulance factors of the building envelope.

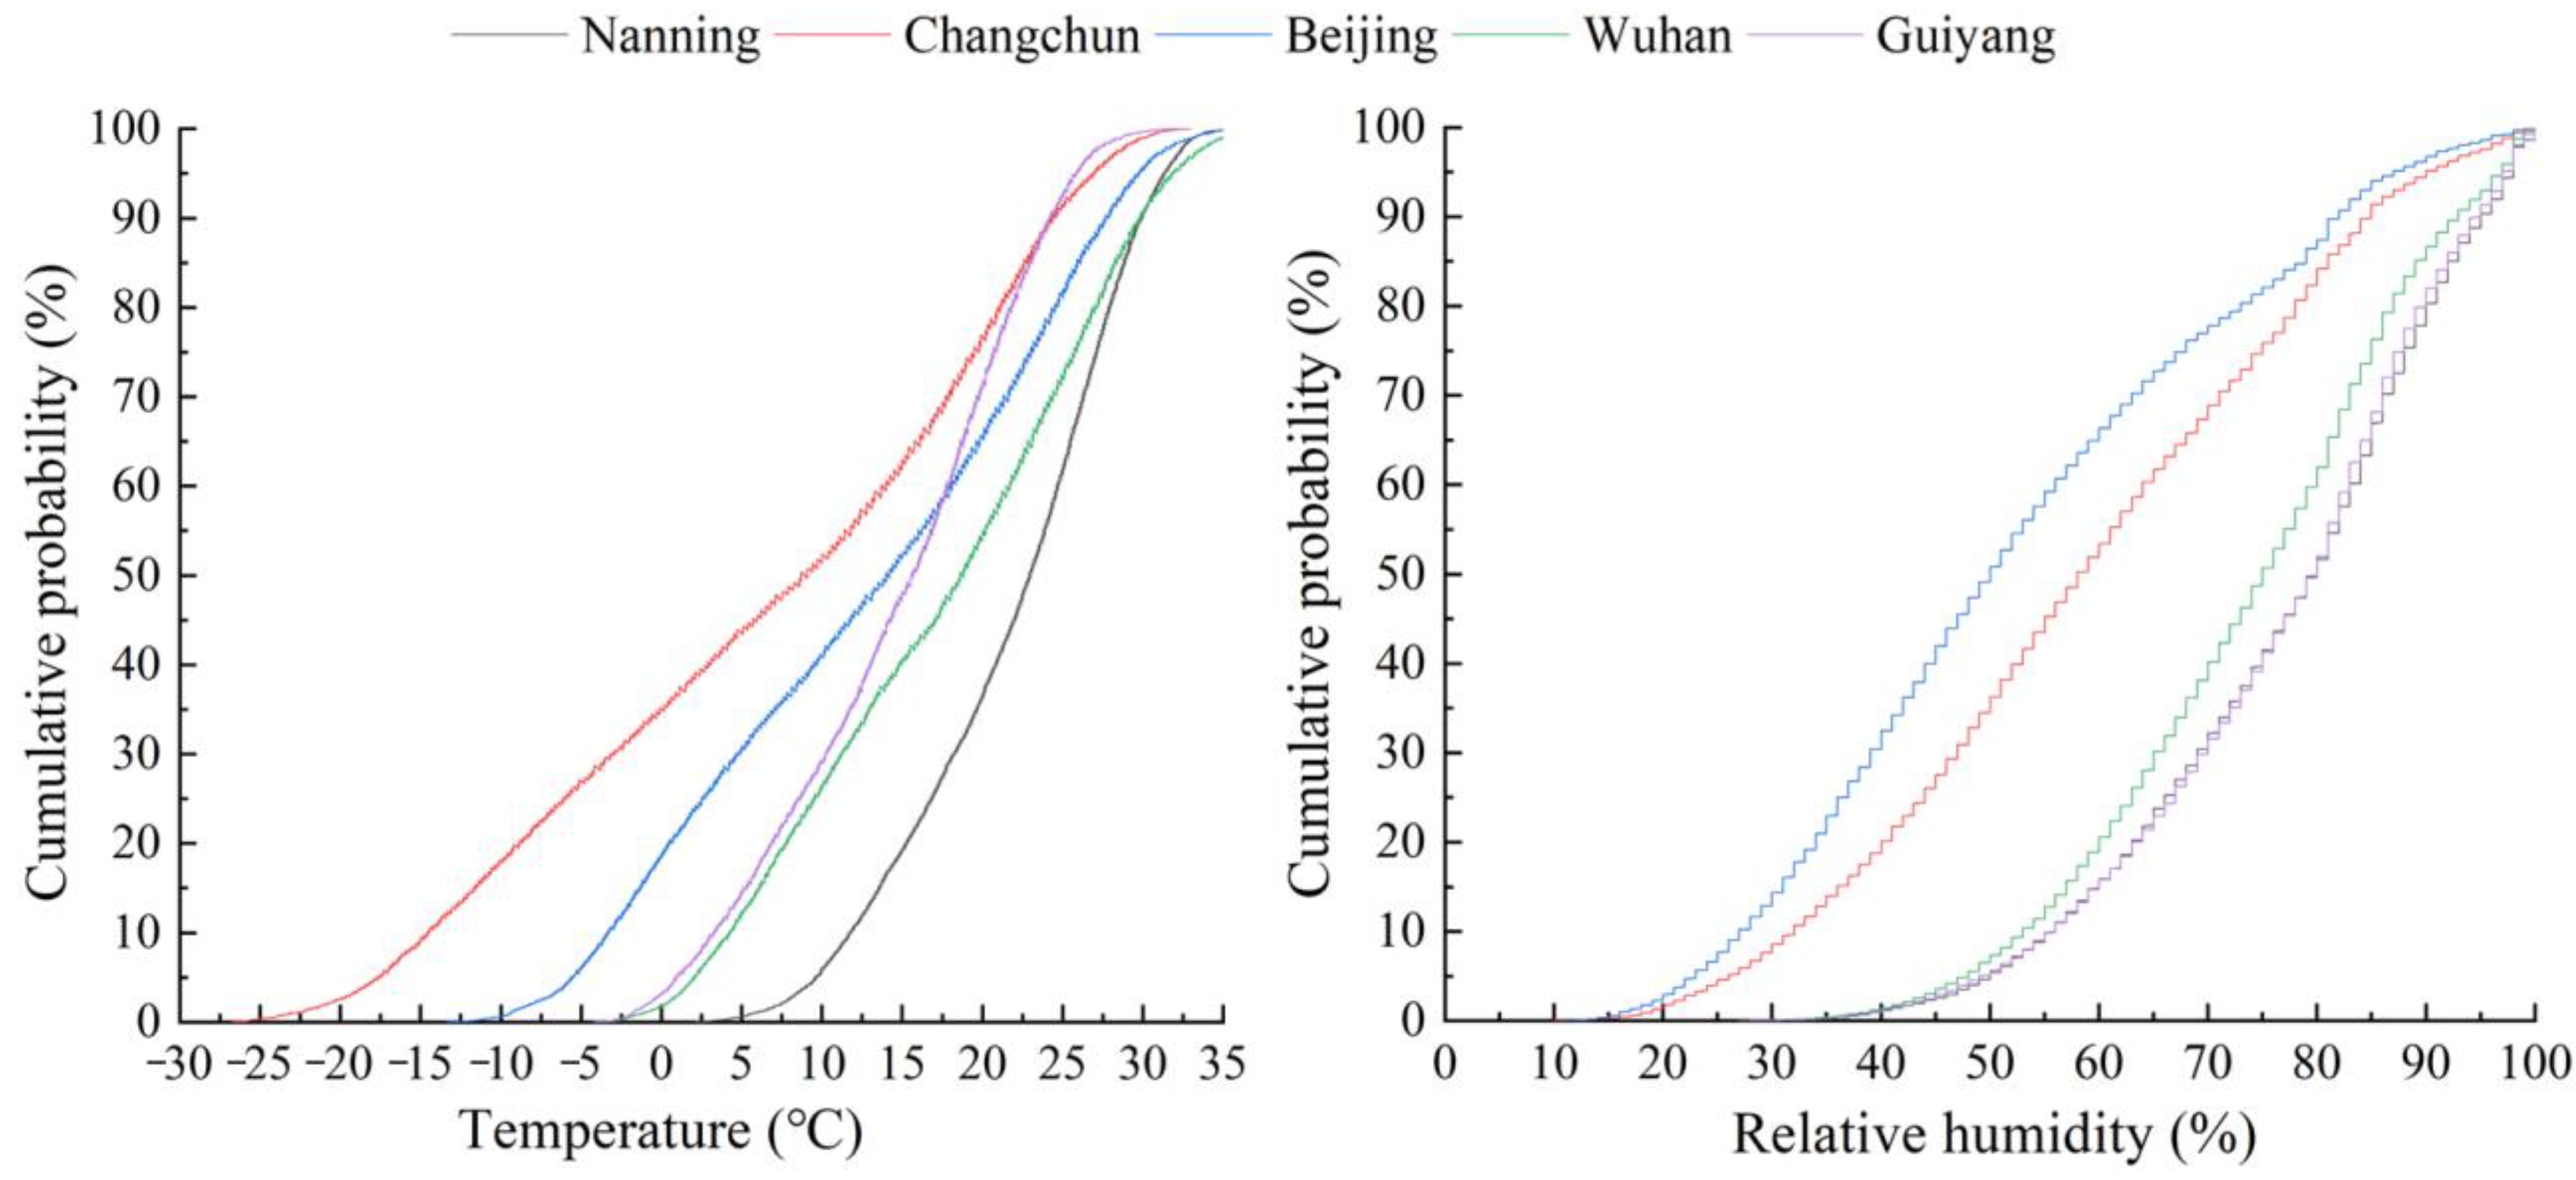
2.2. Calculation of Minimum Ventilation Based on Different Environments in China

This research quoted the thermal zoning standard in the ’Code for Thermal Design of Civil Buildings’, which divided the building into five major thermal zonings: severe cold climate zone, cold climate zone, hot summer and cold winter climate zone, hot summer and warm winter climate zone, and temperate climate zone. In order to study differences in thermal engineering and environmental control parameters of nursery and fattening pig houses in different climate regions, this research selected a typical city in each climate region, including Changchun (severe cold), Beijing (cold), Wuhan (hot summer and cold winter), Nanning (hot summer and warm winter), and Guiyang (mild). The year-round weather data with hourly nodes were used for the analysis in this work.
The meteorological data used in the simulation were derived from Meteonorm 7, which could obtain the annual weather data of each place with an hour as a node. The obtained data (temperature and relative humidity of the five cities) were plotted as a cumulative probability graph, as shown in Figure 2. The graph showed that the lowest temperatures in Changchun, Beijing, Wuhan, Nanning, and Guiyang were −26.7 °C, −13.4 °C, −4.1 °C, 2.1 °C, and −4.2 °C, respectively. The annual temperature difference in Changchun is large, while the annual temperature in Guiyang is relatively moderate, without extreme high and low temperatures. The relative humidity and temperature have basically the same trend, that is, the relative humidity is lower when the temperature is lower. However, the relative humidity in Beijing is lower and in Guiyang and Nanning is higher, which may be related to the location and local geography. In summary, Changchun and Beijing are cold and dry, while Nanning is warm and wet in winter. Therefore, heating in nursery and fattening pig houses in Changchun is relatively important, and the building should apply higher thermal resistance. There were no sub-zero temperatures in Nanning in winter, so the heating demand was lower.
The minimum ventilation rates in winter under different body masses were generated by inputting the external temperature and humidity data of the five regions and the corresponding indoor environmental parameter thresholds into Equation (3) algorithm through the VBA model language implementation.

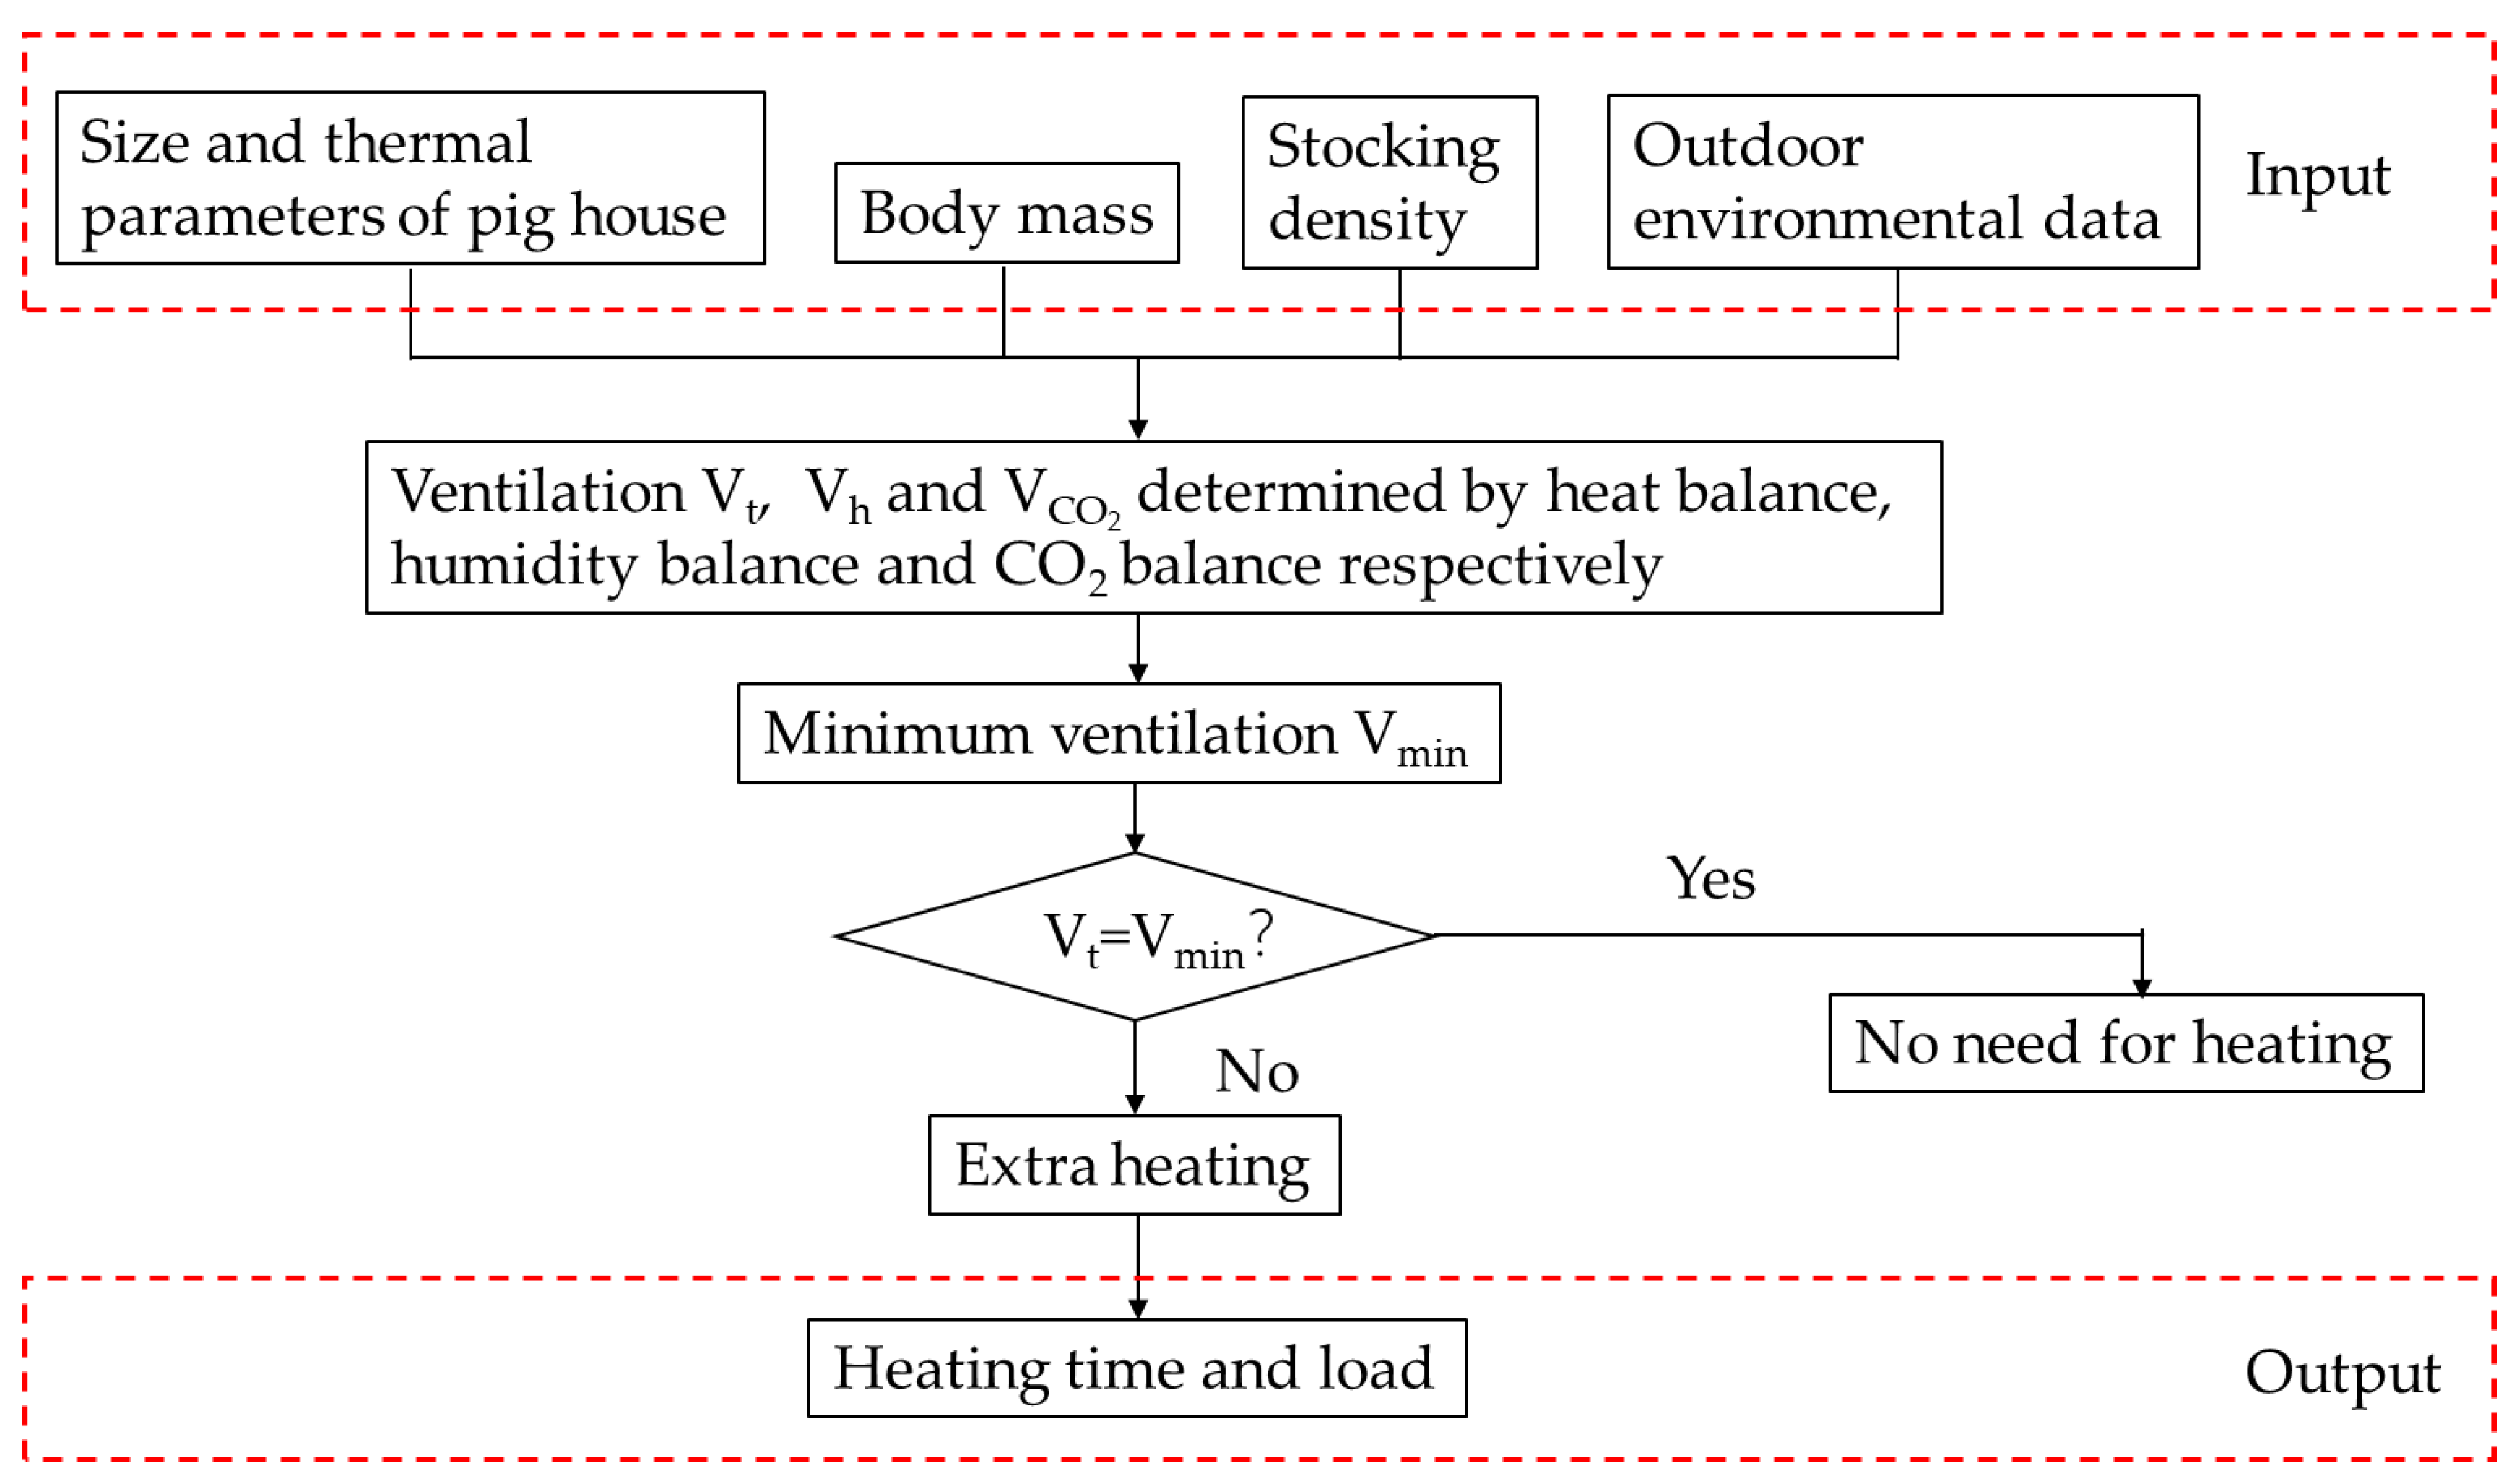
2.3. Calculation of Heating Load Based on Cold Environment in China

In order to determine the effects of four factors (the feeding area of pigs, the outside temperature, the body mass of the pig, and the thermal insulance of the enclosure) on the heating load of nursery and fattening pigs, the geometric dimensions of an actual pig house were used as an example, and different gradients of stocking density and building thermal insulance factors were set as initial values and imported into the simulation computing platform for multiple calculations.
A pig house whose size is shown in Table 1, was used as a model.
In production, if the stocking density was too high, pigs would attack and fight each other. If the stocking density was too low, it would increase the average heating load of each pig, which was not a good practice for saving production costs [30]. Considering the above factors and pig feeding welfare requirements, the feeding density of nursery and fattening pigs should meet the criteria shown in Table 2. The weight gain of the pigs is stable.
The temperature and humidity data of Changchun City, which had the lowest winter temperatures and the longest low-temperature periods among the five cities, were taken as the initial input of outdoor environmental data. The specific input parameters are shown in Table 3.
The heating load of each pig in the house was obtained through the VBA model. Then, SPSS was used to perform a multiple regression analysis and obtain a mathematical model of the heating load of pigs and the four factors. The simulation process is shown in Figure 3.

2.4. Discussion on the Difference of Heating Time and Load in Different Regions

In order to obtain the differences in heating time and heating load related to one year of nursery and fattening pig houses in different regions, the environmental data of different cities and the size parameters, thermal parameters, stocking density, and other parameters of nursery and fattening pig houses were input to the VBA model. The simulation process was the same as Figure 3.
Environmental data were the same as in Section 2.2, and the size parameters of the pig house were the same as in Section 2.3. The stocking densities of the nursery and fattening stages were 0.35 m2 head−1 and 0.8 m2 head−1, respectively.
The thermal insulance factor of the building envelope needed to be greater than the low limit of the thermal insulance factor R 0 which, according to the Code for Thermal Design of Civil Buildings, should meet the Equation (13).
R 0 = ( ( t i t 0 ) Δ t y ) R n .
where R 0 is the low limit of the thermal insulance factor of the building envelope, m2 °C W−1; t i is the indoor low-limit critical temperature in winter, °C;   Δ t y is the permissible temperature difference between the room and the building envelope, °C;   R n is the thermal insulance factor of the inner surface of the building envelope, m2 °C W−1.
The low limit of the thermal insulance factors proposed for the pig house based on the Equation (13) were obtained: Nanning was no low limit of the thermal insulance factor R0, Changchun’s R0 was 0.767, Beijing’s R0 was 0.469, Wuhan’s R0 was 0.479, and Guiyang’s R0 was 0.282. Therefore, for the convenience of calculation, the thermal insulance gradients of the building envelope were set up as 0.5, 1, 2, 3, 4, 5, and 6 m2 °C W−1, respectively. Simulation of the thermal insulance factor of 0.5 m2 °C W−1 as calculated for Changchun was not performed.

3. Results and Discussion

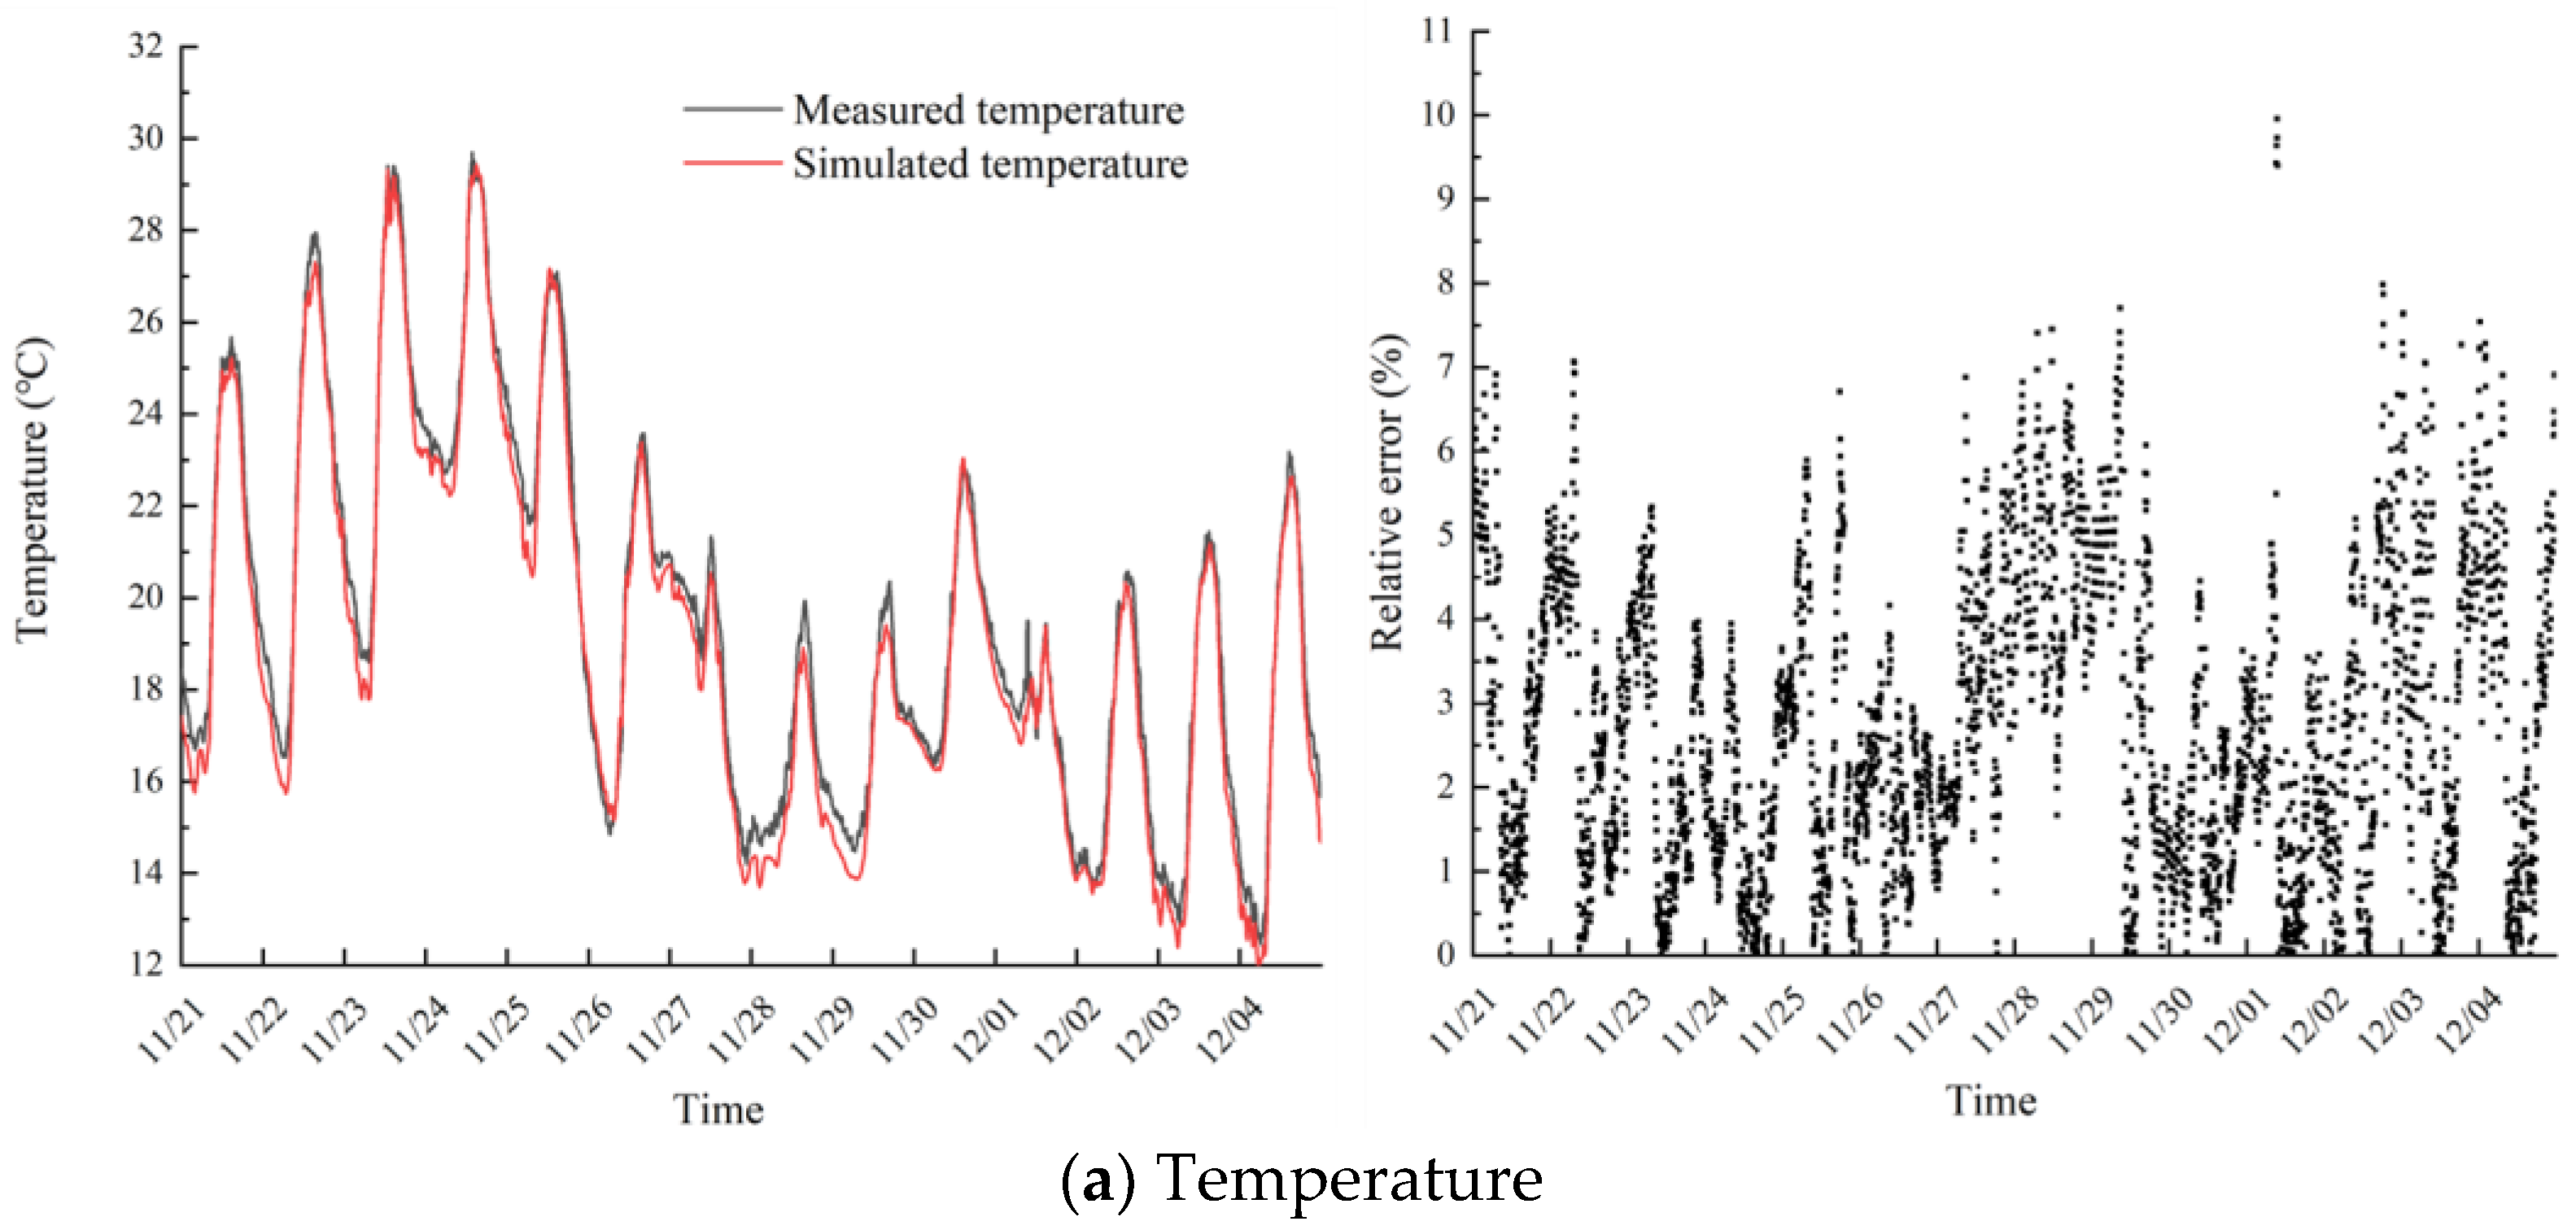
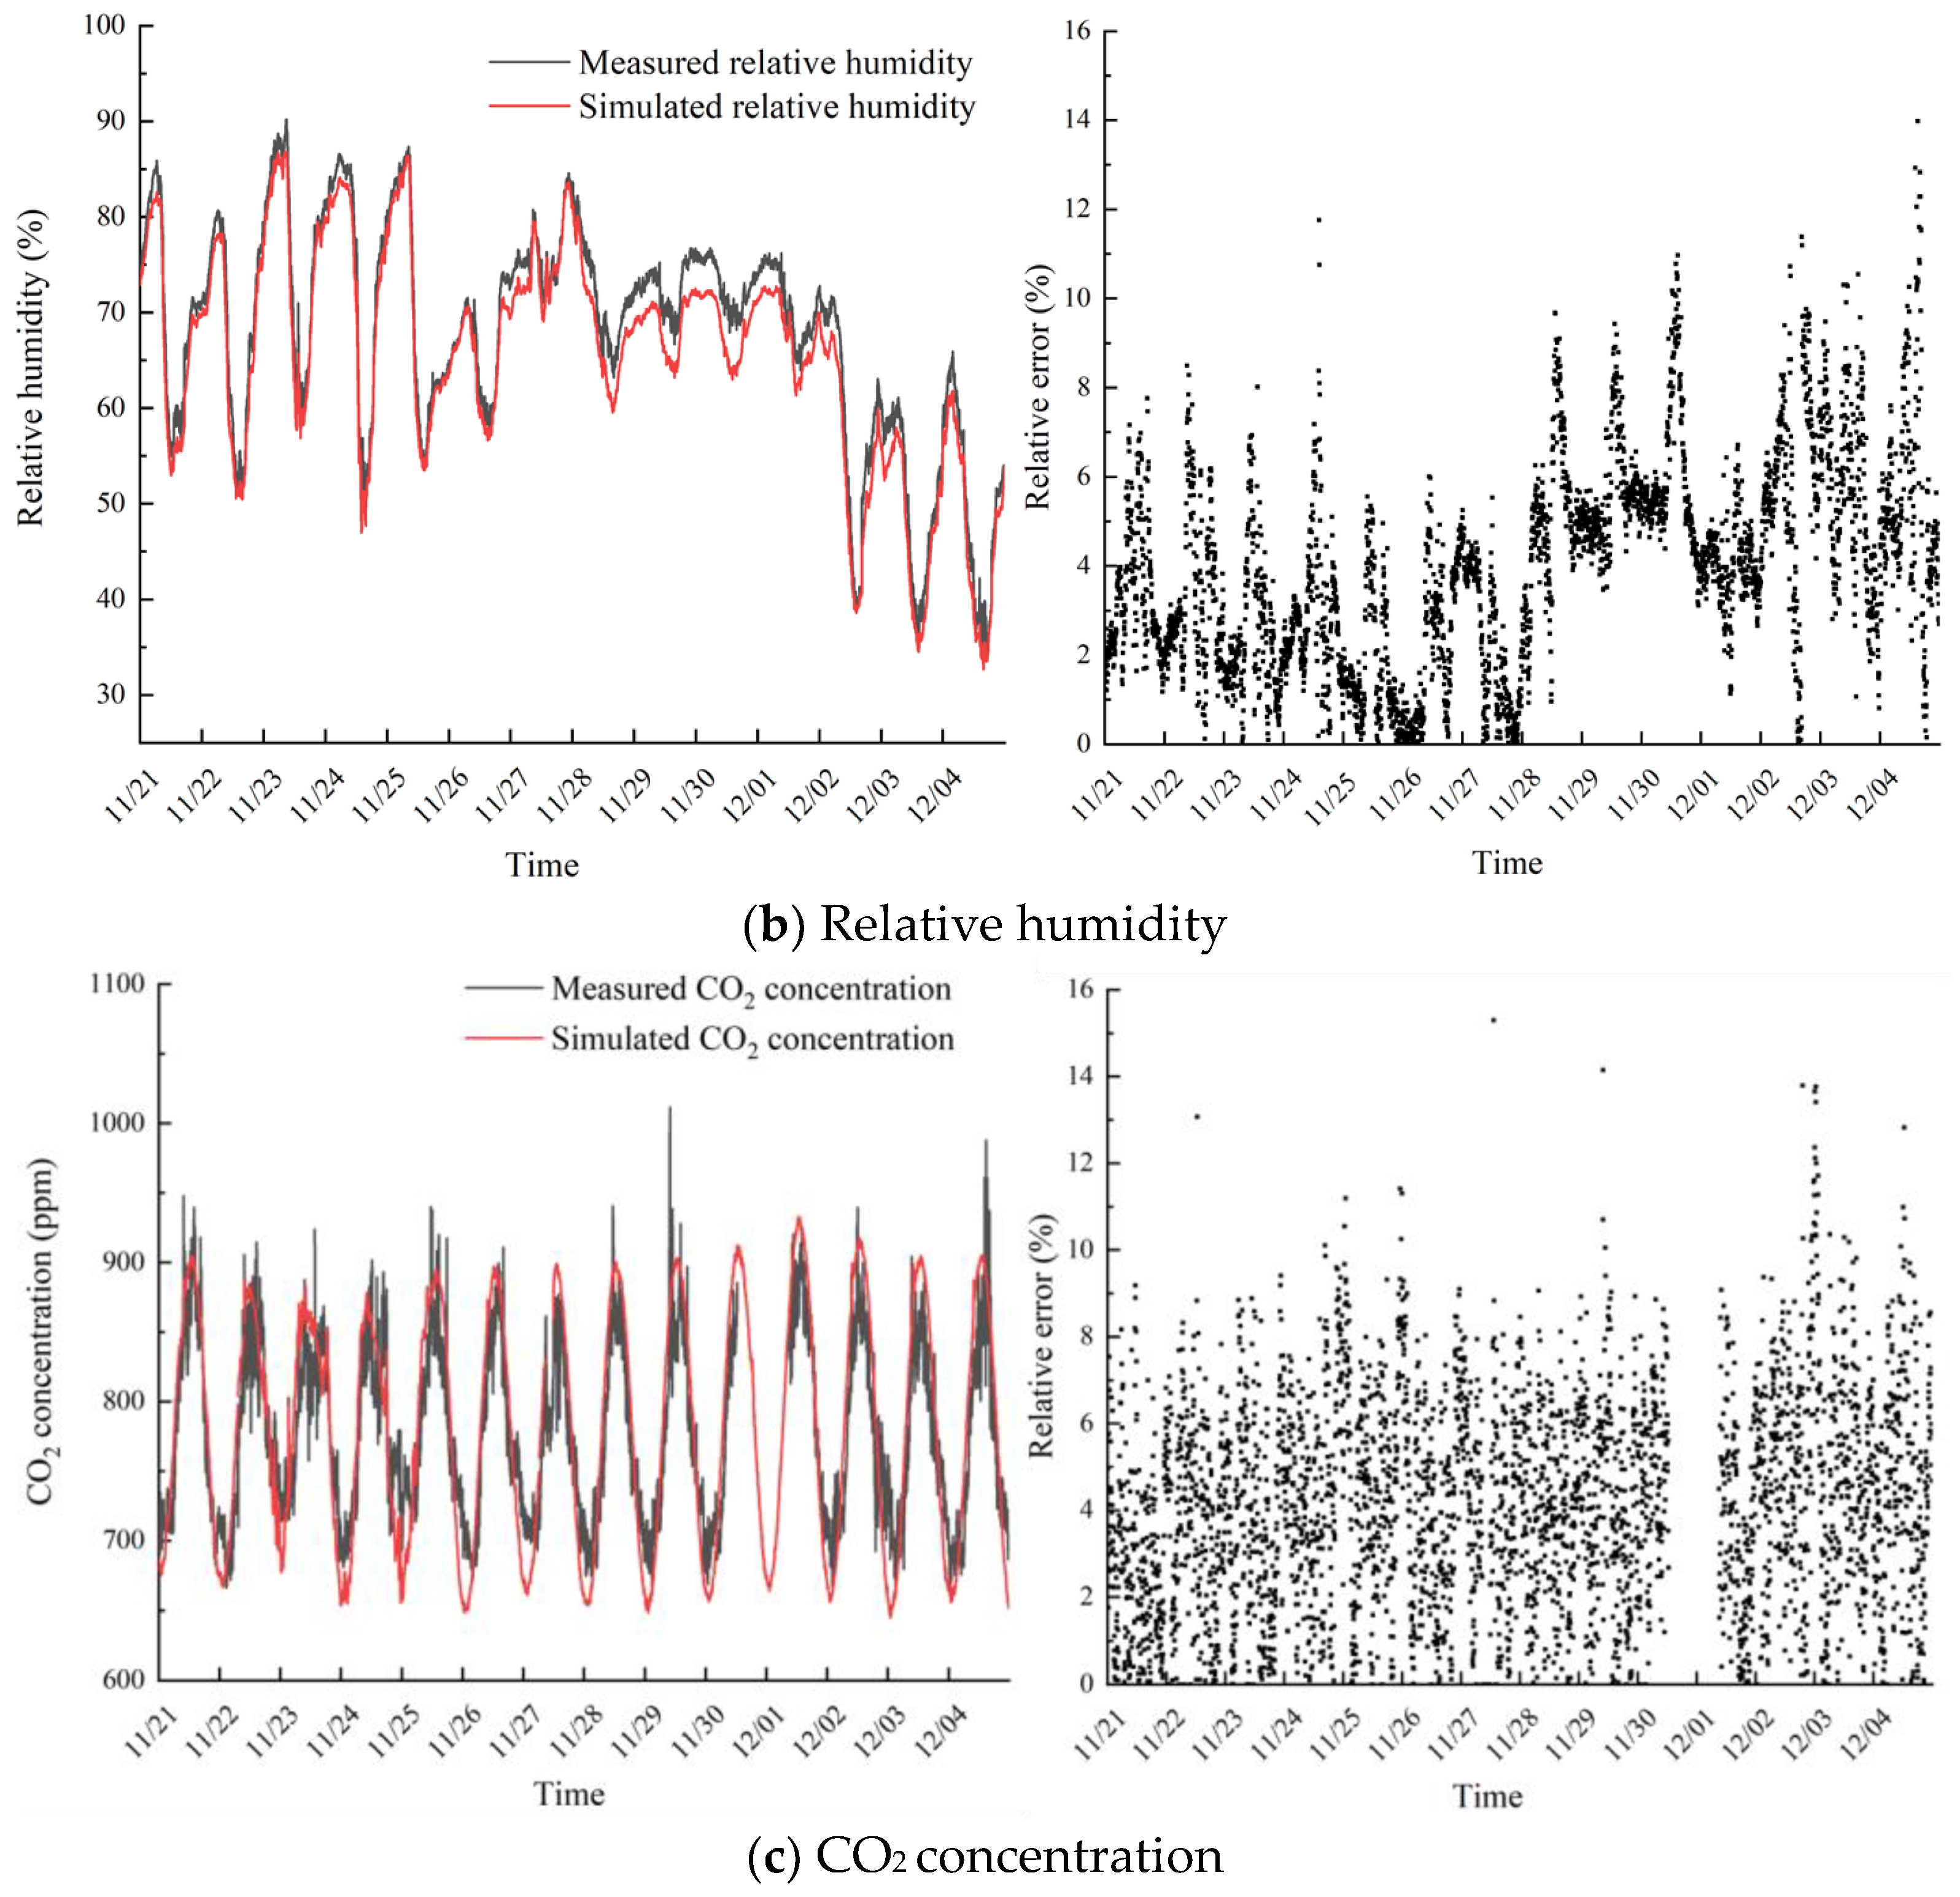
3.1. Verification of VBA Model

In this study, the accuracy of the VBA model was verified by comparing it with the environmental conditions in an actual pig house after regulation. The experiment period is from 21 November to 4 December 2019. The measured data and simulation results are shown in Figure 4.
Through comparison, it was found that the maximum absolute error of the simulated temperature is 1.9 °C, the average absolute error is 0.5 °C, the maximum relative error is 9.9%, and the average relative error is 2.8%. The simulation accuracy of the VBA model for the temperature of the experimental house is similar. The relative errors between the simulated temperature and the measured value is within 5%.
The maximum absolute error between the simulated value of relative humidity and the measured value is 8%, the average absolute error is 3%, the maximum relative error is 14%, and the average relative error is 3.9%. Compared with the temperature simulation, the error of the relative humidity simulation value is a little larger, which may be caused by the following reasons: (1) There is a slight difference in the amount of moisture produced by different breeds of fattening pigs. Therefore, there is a difference between the amount of moisture produced by fattening pigs raised in the experimental house and the amount of moisture produced in the model, which leads to deviations between the simulation results and the actual values. (2) In the course of the experiment, it was observed that the individual size of the fattening pigs differed greatly, and the uneven body mass of the pig population led to this difference.
Due to a power outage caused by the improper operation of on-site workers during the experiment, we excluded the short-term untested data time point related to the power outage of the sensor. Through comparison, it can be seen that the maximum absolute error between the simulated CO2 value and the measured value is 144.2 ppm, the average absolute error is 30.6 ppm, the maximum relative error is 15.2%, and the average relative error is 4.2%. The change of CO2 concentration in the house has the same change trend as the forecast model. However, the CO2 concentration in the house is greatly affected by the amount of animal activity, so the measured value has a large variation amplitude and a large relative error.
Therefore, the model has a certain accuracy in estimating the environmental parameters of a house with a known ventilation rate and can be used to study the construction and environmental control parameters of nursery and fattening pig houses in different regions.

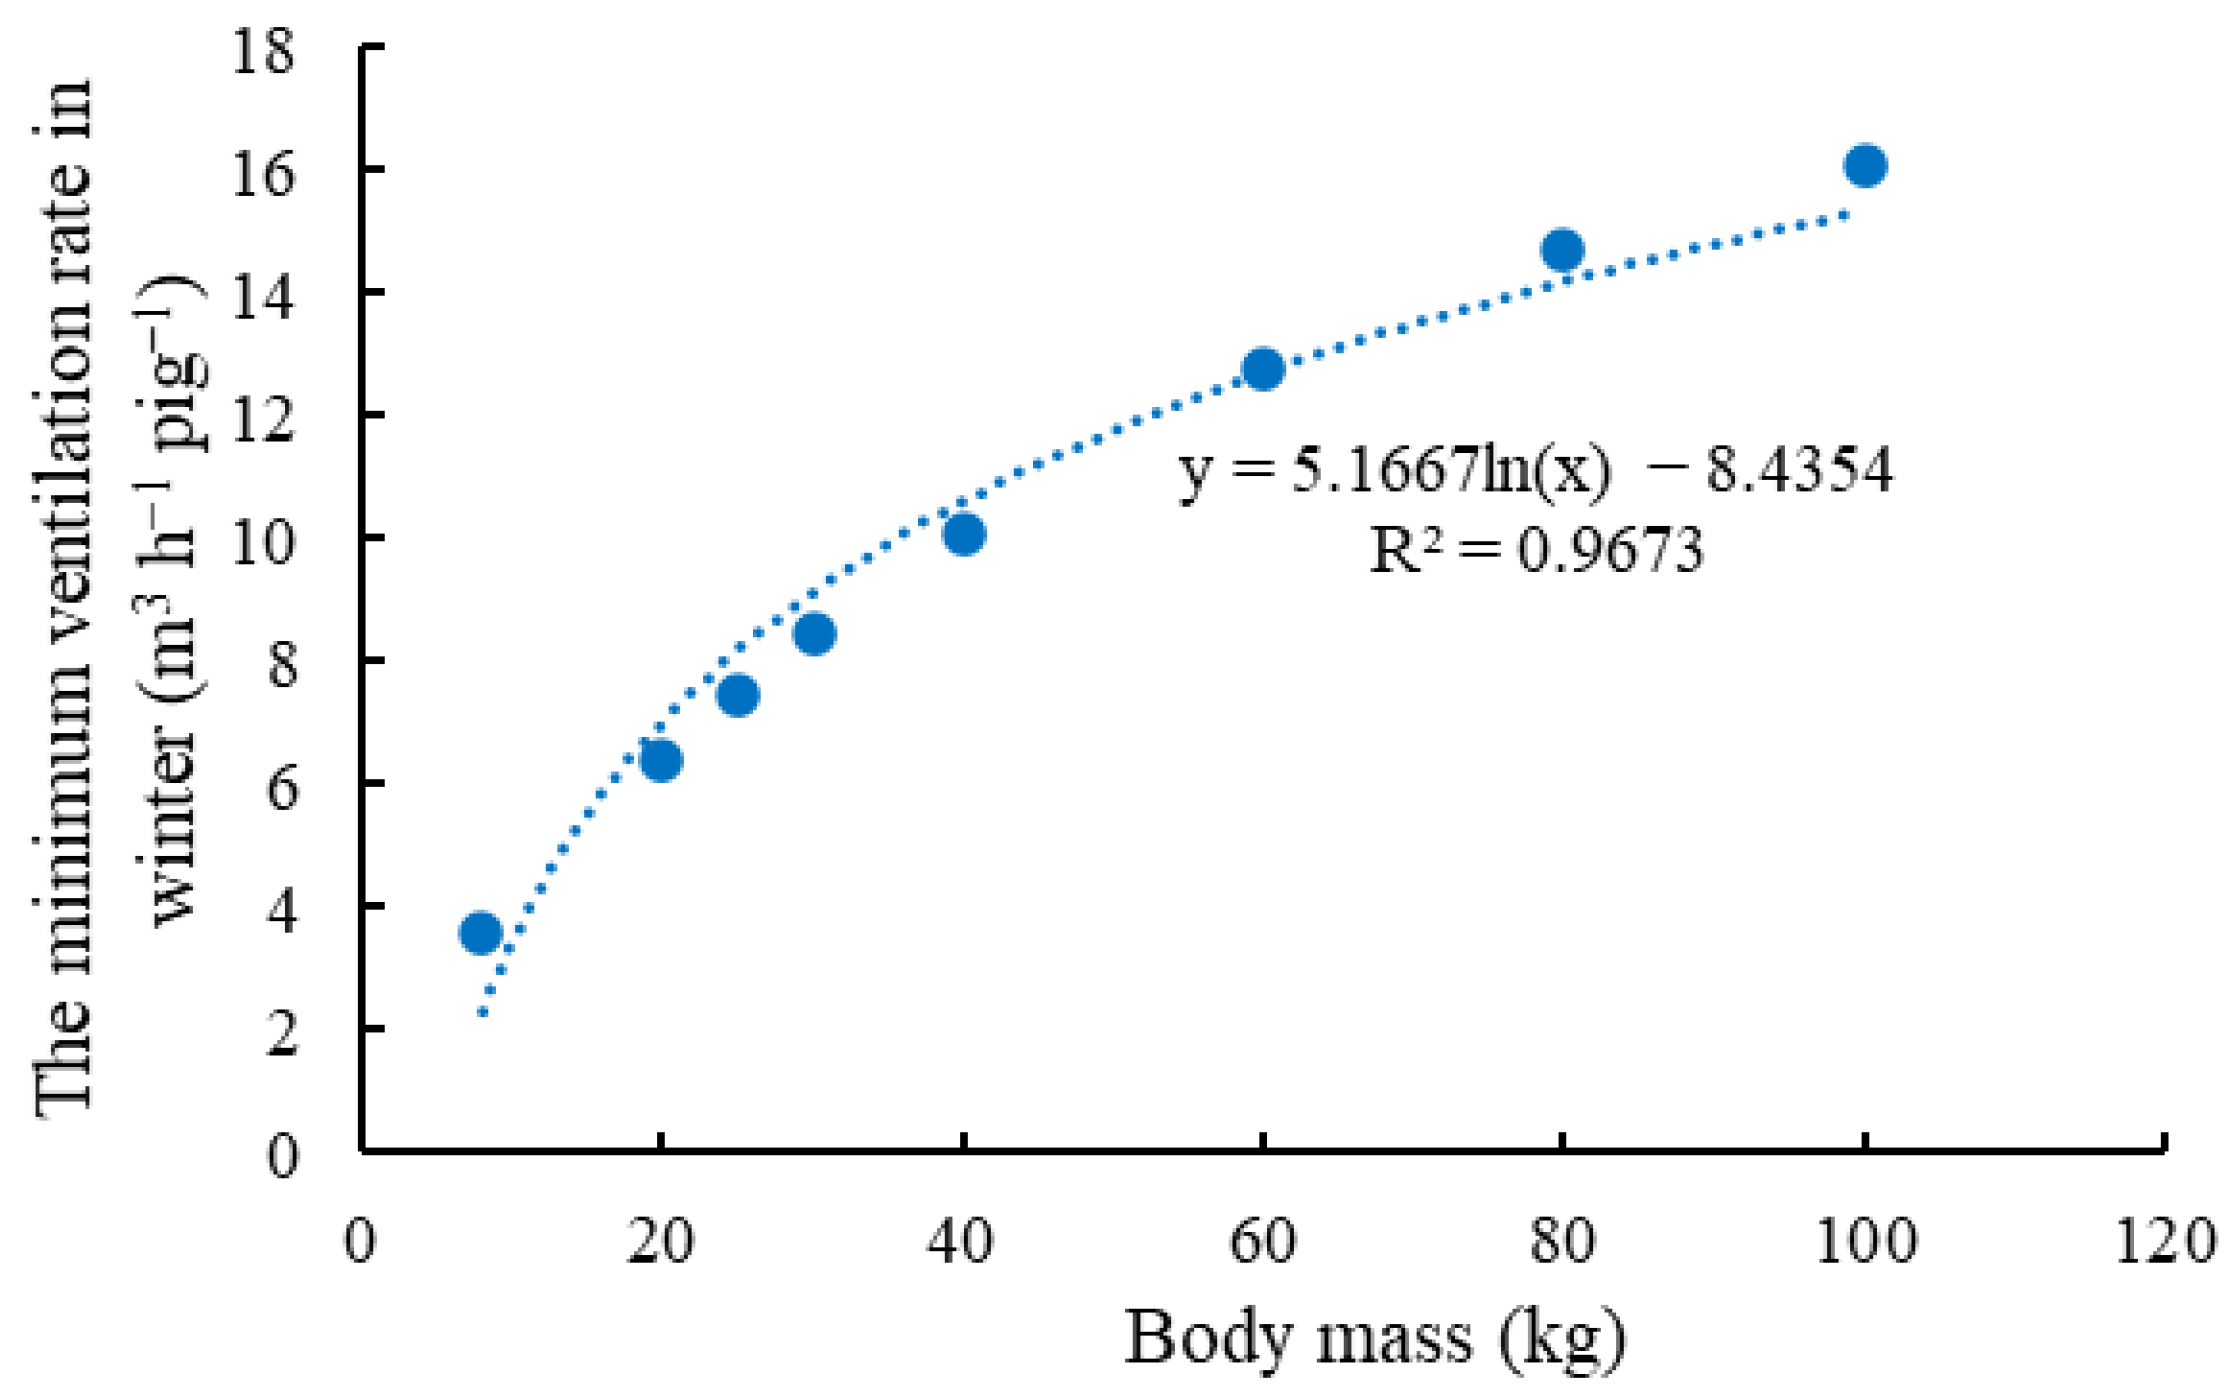
3.2. Minimum Ventilation Model in Winter for Nursery and Fattening Pigs of Different Masses

The relationship between minimum ventilation and pig body mass was obtained through the VBA model simulation, as shown in Figure 5.
In this research, a regression analysis of pig body masses and the corresponding theoretical winter minimum ventilation rate was conducted under a comprehensive consideration of the temperature conditions, relative humidity conditions, and CO2 concentrations in the house. The winter minimum ventilation rate was established as shown in Equation (14).
V min = 5.1667 · ln ( m ) 8.4354 ,
where m is the body mass of the nursery and fattening pig, kg. This equation established a model of the relationship between the masses of nursery and fattening pigs and the minimum ventilation needed in winter. By using it, the winter ventilation demand of the nursery and fattening pig houses could be quickly estimated. Moreover, under the winter ventilation rate, if the pig house still cannot meet the suitable temperature requirements for pig production, additional heating measures should be considered.
According to this equation, the minimum ventilation needed for pigs varies as a logarithmic function of body mass. With an increase in body mass, the minimum ventilation demand per unit body mass decreases gradually. For pigs weighing 8, 20, 25, 30, 40, 60, 80, and 100, the ventilation per body mass is 0.45, 0.32, 0.30, 0.28, 0.25, 0.21, 0.18, and 0.16, respectively. The ventilation demand calculated by this model is lower than the ‘Environmental Parameters and Environmental Management for Intensive Pig Farms’ in China [31], but it is essentially the same as the US MWPS [32] standard. The explanation could be that this model took into account the winter climate characteristics of different climate zones in China and precisely regulated the indoor environment, thus narrowing the range of minimum ventilation. The minimum ventilation obtained according to this equation can meet the ventilation demand, lower the heating load, ensure a suitable indoor environment, and significantly reduce the energy consumption of ventilation and heating systems.

3.3. Mathematical Model of Heating Load for Nursery and Fattening Pigs

The influence of four factors (the feeding area of pigs, the temperature outside the house, the body mass of pigs, and the thermal insulance factor of the enclosure) on the heating load of nursery and fattening pigs could be expressed by the following equations.
For nursery pigs, the heating load model for each pig in the house is shown in Equation (15).
Q psi = 31.13 × n 3.048 × t 0 + 3.72 × m 0.75 + 16.37 R 0.61 × t 0 R 1.89 × m 15.27 ,
and for fattening pigs, the heating load model for each pig in the house is shown in Equation (16).
Q psi = 31.09 × n 5.42 × t 0 52.01 × m 0.75 + 31.52 R 1.08 × t 0 R 13.06 × m + 226 ,
where Q psi is the heating load for nursery and fattening pigs, W;   n is the feeding area of pigs, m2 head−1;   t 0 is the temperature outside the house, °C;   m is the body mass of the pig, kg;   R is the thermal insulance factor of the enclosure, m2 °C W−1.
The correlation coefficients R2 of Equations (15) and (16) are 0.966 and 0.963, respectively. Analysis of the stocking density showed that the coefficient before the stocking density in two equations was approximately 31, which meant that for every increase of 0.1 m2 head−1 in the stocking density, the heating load of each nursery and fattening pig would decrease by approximately 3.1 W. Analysis of the temperature outside the house showed that, taking the thermal insulance factor of the enclosure as 2 m2 °C W−1 as an example, for every 1 °C decrease outside the nursery pig house, the heating load of each nursery pig increased by approximately 3.3 W. For every 1 °C decrease outside the fattening pig house, the heating load of each fattening pig increased by approximately 5.9 W. Analysis of the relationship between the thermal insulance factor of the building envelope and the heating load of each nursery and fattening pig showed the reciprocal of the thermal insulance factor, that is, the heat transfer coefficient has a linear relationship with the heating load. Since the sensible heat production of the nursery and fattening pigs had a non-linear relationship with mass, the relationship between the heating load and masses of the nursery and fattening pigs was a non-linear calculation model.
Equations (15) and (16) can provide a reference for the calculation of the heating load of nursery and fattening pig houses in winter. Based on the temperature of the local coldest month, the associated heating demand can be determined, providing a theoretical foundation for assembly of heating equipment in pig houses in winter.

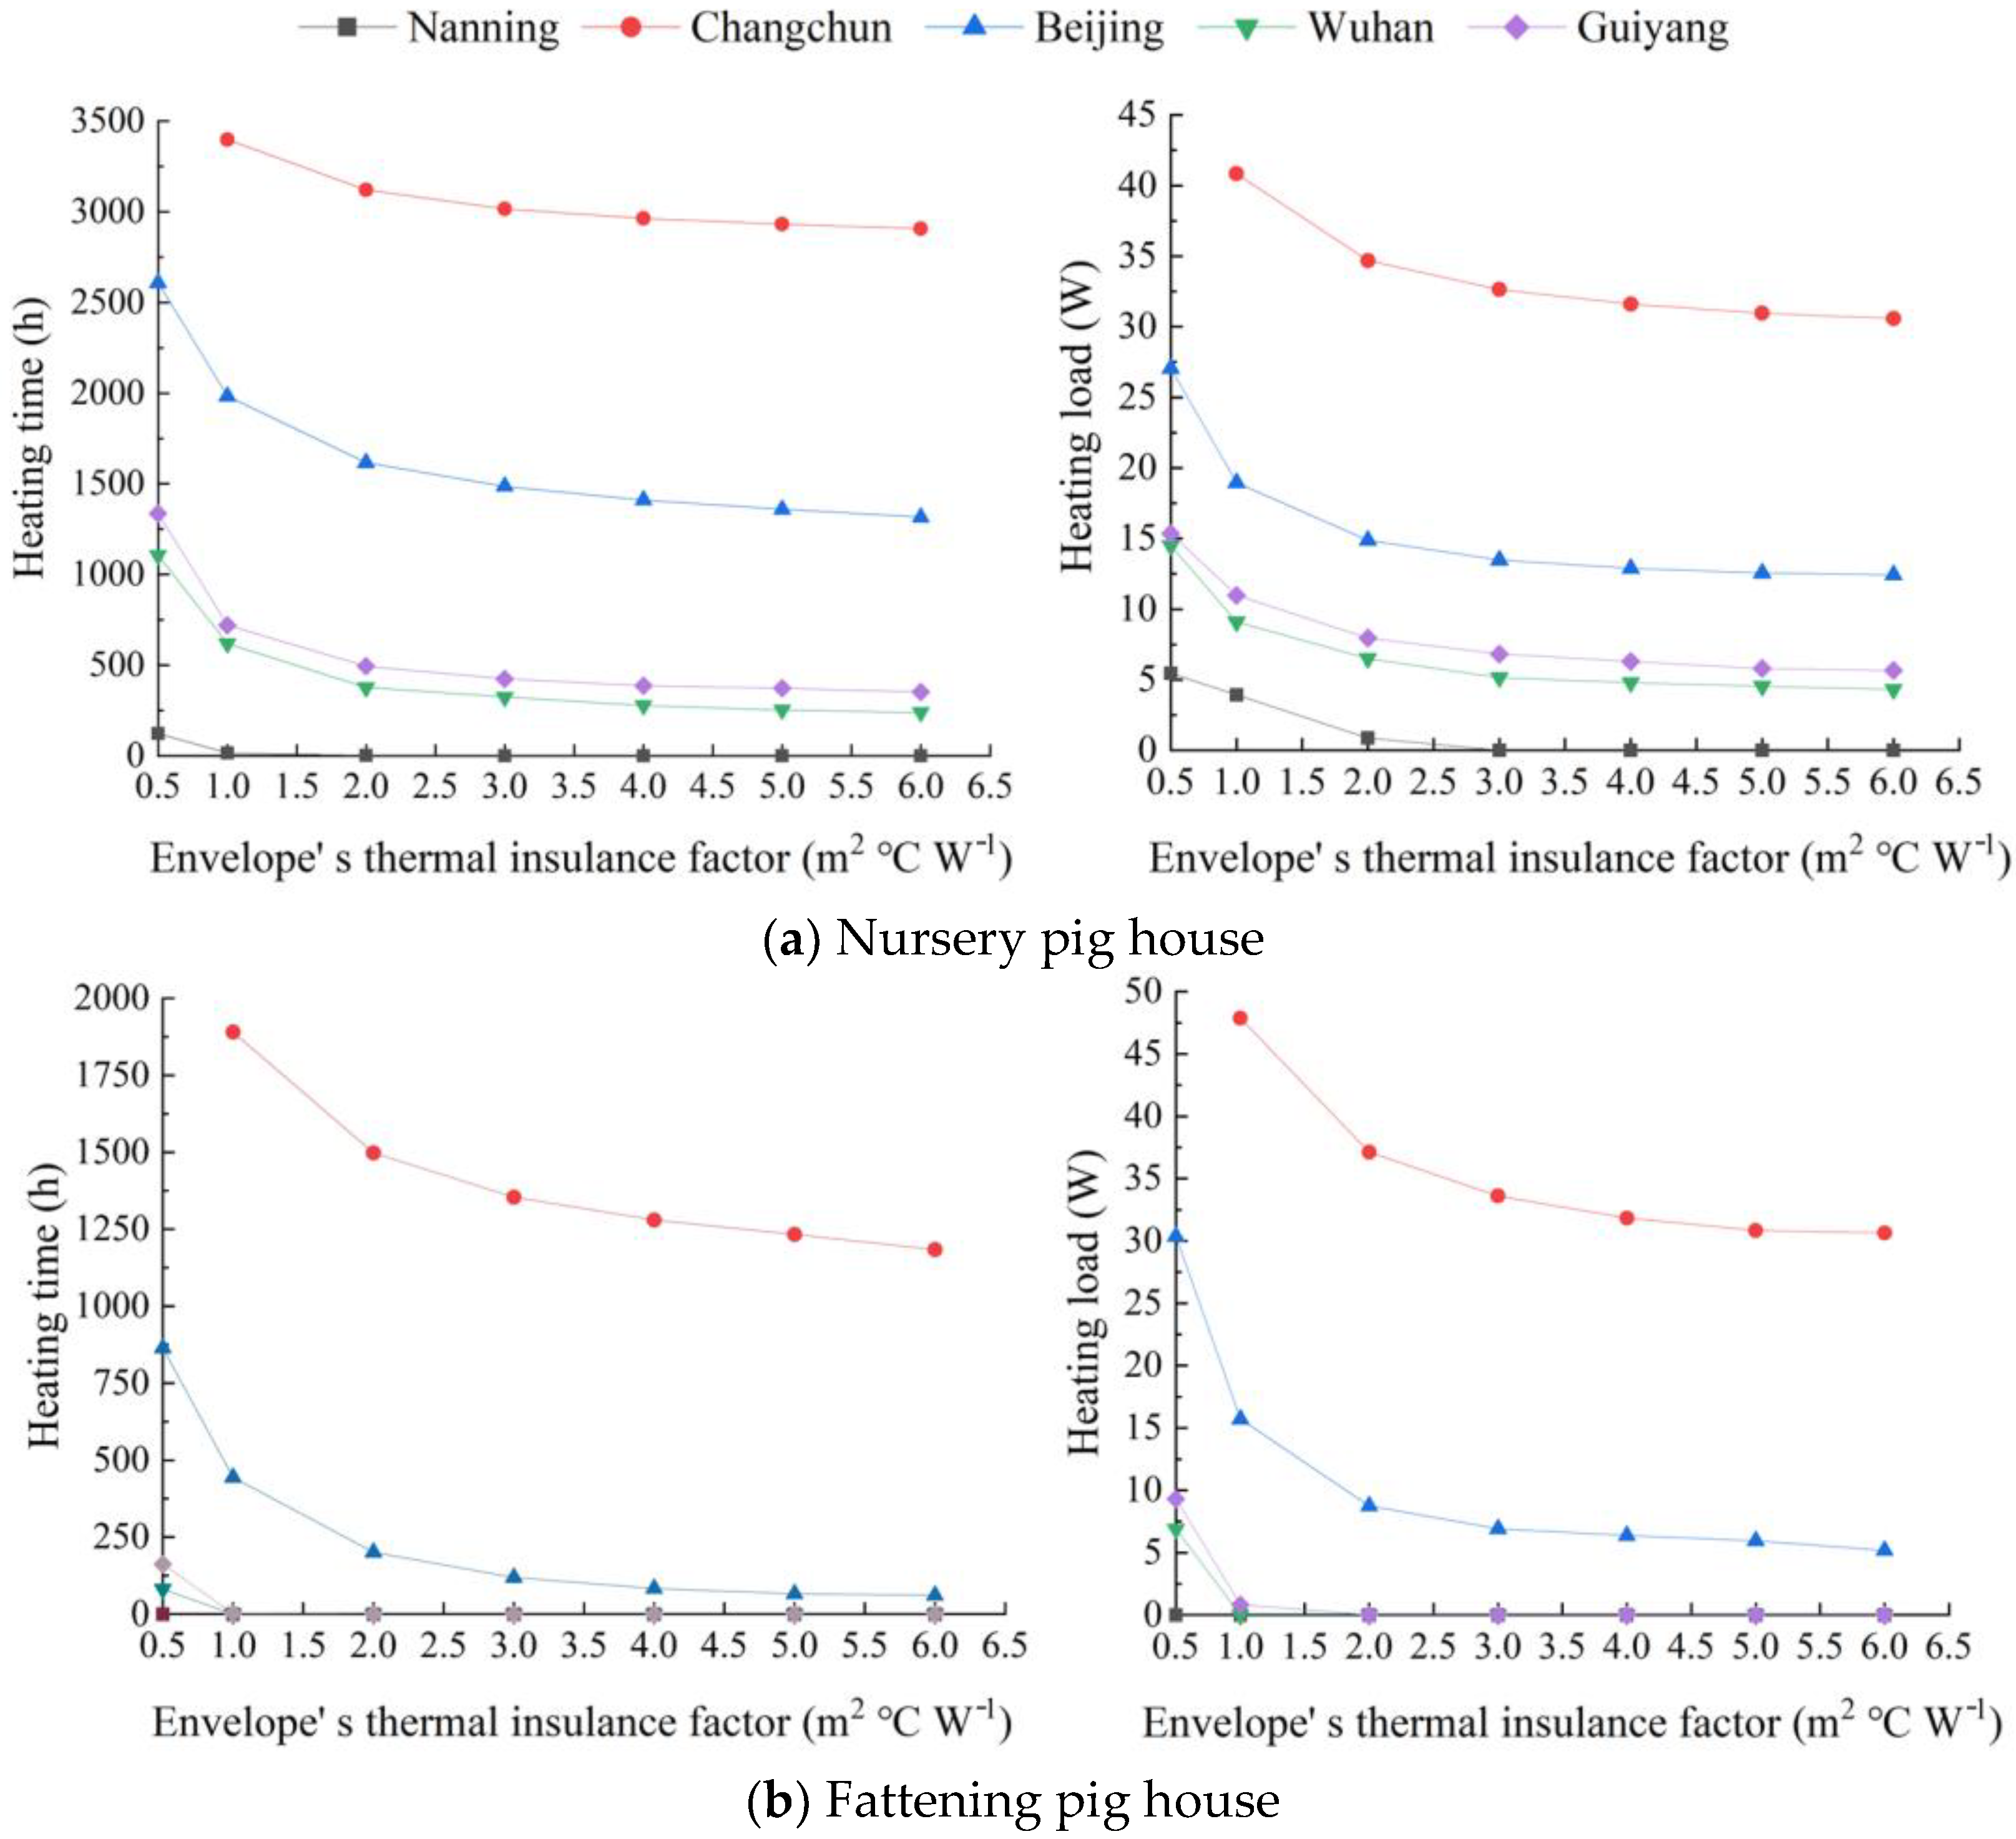
3.4. Differences in Heating Time and Heating Load of Nursery and Fattening Pig Houses in Different Regions

The heating time and load of the nursery and fattening pig houses in different zones obtained through the heating simulation process are shown in Figure 6. The integrated heating days are shown in Table 4.
As shown in Figure 6, due to the large differences in temperature and relative humidity in the climatic regions of the five cities, the heating time and heating load of a year varied significantly. The overall heating conditions of the five areas under the same thermal insulance factor of the building envelope were Changchun > Beijing > Guiyang > Wuhan > Nanning. Figure 6a shows the heating situation in different cities of the nursery pig house. When the thermal insulance factor of the building envelope was 1 m2 °C W−1, the heating time in Changchun was 3397 h, accounting for 38.78% of the annual. Moreover, its heating load was 40.84 W/head, which was 2.2, 3.7, 4.5, and 10.4 times that of Beijing, Guiyang, Wuhan, and Nanning, respectively. With an increase in the thermal insulance factor of the building envelope, the heating time and heating load gradually decreased, and the extent of reduction decreased with the increase in the thermal insulance factor. For Changchun, when the thermal insulance factor of the building envelope exceeded 3 m2 °C W−1, increasing the thermal insulance factor had no obvious effect on shortening the heating time and reducing the heating load. Therefore, the building thermal insulance factor of nursery pig houses in Changchun area should not be greater than 3 m2 °C W−1. In the same way, the thermal insulance factor of the building envelope of the nursery pig houses in Beijing, Wuhan, and Guiyang should not be greater than 2 m2 °C W−1. For Nanning, when the thermal insulance factor was 0.5 m2 °C W−1, the annual heating time was only 123 h, approximately 5.13 days, so the heating demand almost could be ignored. Therefore, 0.5 m2 °C W−1 of the thermal insulance factor in Nanning could basically meet the requirements of winter heat preservation.
Figure 6b shows the heating situation in the fattening pig houses in different cities. It could be clearly observed that the winter heating demand of the fattening pig houses was much lower than that of the nursery pig houses. The reason might be that the fattening pigs produced a large amount of heat. With the increase of the thermal insulance factor of the building envelope, the change trends of the heating time and heating load are the same as those shown in Figure 6a. Therefore, the thermal insulance factor in Changchun and Beijing should not be greater than 3 and 2 m2 °C W−1, respectively. When the thermal insulance factor was 0.5 m2 °C W−1, the heating time in Wuhan and Guiyang were 81 and 162 h, respectively. Therefore, when selecting the thermal insulance factor of the fattening pig house, Wuhan, Guiyang, and Nanning should not exceed 0.5 m2 °C W−1. This provided a reference for the selection of the thermal insulance factor, which was the most economical value to use, in different types of pig houses in different regions.
The precise heating time obtained in Table 4 is shorter than the actual operating period because most pig houses are heated with continuous or intermittent heating. According to the research, the heating period of pig houses in Beijing is 125 d [33], compared with 4 months in cold areas [34]. Precise heating based on actual demand can greatly shorten the heating time, which reduces energy consumption.
As heating for fewer than 10 days is negligible, it can be considered that there is no need for heating in Nanning nursery pig houses and no need for heating in Nanning, Wuhan, and Guiyang fattening pig houses in winter.

3.5. Energy Consumption Generated by Heating

The annual heating power consumption of each pig in different regions can be obtained by heating time and load (Table 5). Increasing the thermal insulance factor of the building envelope could reduce the power consumption of the pig house. In Changchun, when the thermal insulance factor was selected as 2, 3, 4, 5, 6 m2 °C W−1, the power consumption of a single pig would be reduced by 30.53, 40.32, 45.1, 47.96, 49.86 kW·h, respectively, compared with when the thermal insulance factor was selected as 1 m2 °C W−1. Therefore, increasing the thermal insulance factor of the building envelope could greatly save electricity costs for the winter heating of large-scale pig farms. However, in Changchun, even if an enclosure with a thermal insulance factor of 6 m2 °C W−1 is selected, the power consumption of a single pig was still greater than that in other regions with an enclosure with a thermal insulance factor of 0.5 m2 °C W−1. Therefore, the climate environment had a greater impact on the environmental control design and regulation of pig farms. “Reasonable site selection” and “Take actions that suit local circumstances” are the two magic weapons for pig farms to reduce costs and increase efficiency.
The thermal insulance factor of the building envelope in Beijing was selected as 1 m2 °C W−1. The resulting unit heating capacity is only 0.05 kW·h·m−2, approximately 12.8 percent of the current heating load daily [35]. Therefore, the use of precise ventilation and heating in winter can greatly reduce energy consumption.

3.6. Research Limitations and Perspectives

In order to simplify the calculations, some details were ignored in this research, such as the growth curve of pigs and the service period to clean the livestock building, etc. In addition, due to space limitations, only the models of nursery and fattening pigs were constructed. In future studies, the relevant model construction of pigs in other growth stages will be explored and the details of the model will be improved. In addition, the model established in this paper is steady-state; therefore, how to build a transient model is also the target of further research. Furthermore, this study mainly regulated the environment by controlling the minimum ventilation. In the future, CFD (Computational Fluid Dynamics) can be adopted for more accurate air distribution regulation, so as to further improve the precision of environmental control and reduce energy consumption.

4. Conclusions

This article developed mathematical models to calculate the minimum ventilation, heating loads, and power consumption in the nursery and fattening pig houses in winter. Main conclusions can be drawn from the results:
  • The minimum ventilation model proposed in this paper took into account the winter climate characteristics of different climate zones in China and precisely regulated the indoor environment, thus narrowing the range of minimum ventilation.
  • By constructing heating load models for nursery and fattening pigs, it was found that every increase of 0.1 m2 head−1 in stocking density reduced the heat load of each nursery and fattening pig by approximately 3.1 W. The heating load had a linear relationship with the outside temperature and the heat transfer coefficient of the building envelope and a non-linear relationship with the pig body mass.
  • Heating requirements of commercial pig houses in typical cities of different climatic regions under the thermal insulance factor of the same building envelope followed the trend in Changchun > Beijing > Guiyang > Wuhan > Nanning.
  • Increasing the building envelope’s thermal insulance factor or using precision heating could reduce the pig house’s power consumption and regulate the temperature. However, the climate environment still had a more significant impact on the environmental control design and regulation of pig farms.

Author Contributions

Conceptualization, H.L., J.H. and Z.S.; methodology, J.H.; software, F.Q. and J.H.; validation, F.Q., X.Z. and J.H.; formal analysis, F.Q. and X.Z.; investigation, F.Q.; resources, H.L. and Z.S.; data curation, F.Q. and J.H.; writing—original draft preparation, F.Q. and X.Z.; writing—review and editing, H.L., X.Z. and Z.S.; visualization, F.Q. and X.Z.; supervision, H.L. and Z.S.; project administration, H.L. and Z.S.; funding acquisition, H.L. and Z.S. All authors have read and agreed to the published version of the manuscript.

Funding

This work was supported by the National Natural Science Foundation of China (32002226), and the National Center of Technology Innovation for Pigs (NCTIP-XD/B07).

Institutional Review Board Statement

Not applicable.

Data Availability Statement

The data that support the findings of this study are available from the corresponding authors upon reasonable request.

Conflicts of Interest

The authors declare no conflict of interest.

References

  1. Quiniou, N.; Noblet, J.; van Milgen, J.; Dubois, S. Influence of low ambient temperatures on heat production and energy balance of single-housed growing pigs fed ad libitum: A comparison with group-housed pigs. Anim. Res. 2001, 50, 325–333. [Google Scholar] [CrossRef] [Green Version]
  2. Faure, J.; Lebret, B.; Bonhomme, N.; Ecolan, P.; Kouba, M.; Lefaucheur, L. Metabolic adaptation of two pig muscles to cold rearing conditions. J. Anim. Sci. 2013, 91, 1893–1906. [Google Scholar] [CrossRef] [PubMed]
  3. Čobanović, N.; Stajković, S.; Blagojević, B.; Betić, N.; Dimitrijević, M.; Vasilev, D.; Karabasil, N. The effects of season on health, welfare, and carcass and meat quality of slaughter pigs. Int. J. Biometeorol. 2020, 64, 1899–1909. [Google Scholar] [CrossRef] [PubMed]
  4. Ji, H.; Shao, Z.Y.; Liu, Y.; Zhang, X.; Niu, C.Y.; Guo, J.R.; Xu, B.; Zhan, X.L.; Liu, J.X.; Wang, J.F. Effects of Different Degrees of Cold Stress on FIAF Expression in Pigs. Kafkas. Univ. Vet. Fak. 2021, 27, 135–140. [Google Scholar] [CrossRef]
  5. Jensen, A.H.; Kuhlman, D.E.; Becker, D.E.; Harmon, B.G. Response of Growing-Finishing Swine to Different Housing Environments during Winter Seasons. J. Anim. Sci. 1969, 29, 451–456. [Google Scholar] [CrossRef] [PubMed]
  6. Lopez, J.; Jesse, G.W.; Becker, B.A.; Ellersieck, M.R. Effects of Temperature on the Performance of Finishing Swine.2. Effects of a Cold, Diurnal Temperature on Average Daily Gain, Feed-Intake, and Feed-Efficiency. J. Anim. Sci. 1991, 69, 1850–1855. [Google Scholar] [CrossRef] [Green Version]
  7. Brandt, P.; Moustsen, V.A.; Nielsen, M.B.F.; Kristensen, A.R. Floor heating at farrowing in pens for loose-housed sows. Livest. Sci. 2012, 143, 1–4. [Google Scholar] [CrossRef]
  8. Júnior, G.M.O.; Ferreira, A.S.; Rodrigues, V.V.; Figueiredo, É.M.; Formigoni, A.S.; Zangeronimo, M.G.; Santos, W.G.; Alvarenga, R.R. Effect of the type of farrowing room on the welfare and productive performance of lactating sows and of piglets during tropical winter. Anim. Sci. J. 2014, 85, 602–610. [Google Scholar] [CrossRef] [PubMed]
  9. Mun, H.S.; Dilawar, M.A.; Jeong, M.G.; Rathnayake, D.; Won, J.S.; Park, K.W.; Lee, S.R.; Ryu, S.B.; Yang, C.J. Effect of a Heating System Using a Ground Source Geothermal Heat Pump on Production Performance, Energy-Saving and Housing Environment of Pigs. Animals 2020, 10, 2075. [Google Scholar] [CrossRef]
  10. Riva, G.; Pedretti, E.F.; Fabbri, C. Utilization of a heat pump in pig breeding for energy saving and climate and ammonia control. J. Agric. Eng. Res. 2000, 77, 449–455. [Google Scholar] [CrossRef]
  11. Costantino, A.; Fabrizio, E.; Biglia, A.; Cornale, P.; Battaglini, L. Battaglini. Energy use for climate control of animal houses: The state of the art in Europe. Energy Procedia 2016, 101, 184–191. [Google Scholar] [CrossRef] [Green Version]
  12. Krommweh, M.S.; Rosmann, P.; Buscher, W. Investigation of heating and cooling potential of a modular housing system for fattening pigs with integrated geothermal heat exchanger. Biosyst. Eng. 2014, 121, 118–129. [Google Scholar] [CrossRef]
  13. Islam, M.M.; Mun, H.S.; Bostami, A.B.M.R.; Park, K.J.; Yang, C.J. Combined active solar and geothermal heating: A renewable and environmentally friendly energy source in pig houses. Environ. Prog Sustain. 2016, 35, 1156–1165. [Google Scholar] [CrossRef]
  14. Jeong, M.G.; Rathnayake, D.; Mun, H.S.; Dilawar, M.A.; Park, K.W.; Lee, S.R.; Yang, C.J. Effect of a Sustainable Air Heat Pump System on Energy Efficiency, Housing Environment, and Productivity Traits in a Pig Farm. Sustainability 2020, 12, 9772. [Google Scholar] [CrossRef]
  15. Johnston, L.J.; Brumm, M.C.; Moeller, S.J.; Pohl, S.; Shannon, M.C.; Thaler, R.C. Effects of reduced nocturnal temperature on pig performance and energy consumption in swine nursery rooms. J. Anim. Sci. 2013, 91, 3429–3435. [Google Scholar] [CrossRef]
  16. Barros, J.D.G.; Rossi, L.A.; Sartor, K. Use of PID controller as efficient technology in heating system of swine nursery. Rev. Bras. Eng. Agric. Ambient. 2015, 19, 476–480. [Google Scholar] [CrossRef] [Green Version]
  17. Wang, M.Z.; Liu, J.J.; Tian, J.H.; Li, Q.; Wu, Z.H. Energy saving and insulation effect of renovation for existing swine houses in Beijing. Trans. Chin. Soc. Agric. Eng. 2014, 30, 148–154. [Google Scholar] [CrossRef]
  18. Wang, Y.; Li, B.M. Analysis and experiment on thermal insulation performance of outer building envelope for closed layer house in winter. Trans. Chin. Soc. Agric. Eng. 2017, 33, 190–196. [Google Scholar] [CrossRef]
  19. Mikovits, C.; Zollitsch, W.; Hörtenhuber, S.J.; Baumgartner, J.; Niebuhr, K.; Piringer, M.; Anders, I.; Andre, K.; Hennig-Pauka, I.; Schönhart, M. Impacts of global warming on confined livestock systems for growing-fattening pigs: Simulation of heat stress for 1981 to 2017 in Central Europe. Int. J. Biometeorol. 2019, 63, 221–230. [Google Scholar] [CrossRef] [PubMed] [Green Version]
  20. Schauberger, G.; Schönhart, M.; Zollitsch, W.; Hörtenhuber, S.J.; Kirner, L.; Mikovits, C.; Baumgartner, J.; Piringer, M.; Knauder, W.; Anders, I.; et al. Economic risk assessment by weather-related heat stress indices for confined livestock buildings: A case study for fattening pigs in Central Europe. Agriculture 2021, 11, 122. [Google Scholar] [CrossRef]
  21. Pedersen, S.; Takai, H.; Johnsen, J.O.; Metz, J.H.M.; Groot Koerkamp, P.W.G.; Uenk, G.H.; Phillips, V.R.; Holden, M.R.; Sneath, R.W.; Short, J.L.; et al. A comparison of three balance methods for calculating ventilation rates in livestock buildings. J. Agric. Eng. Res. 1998, 70, 25–37. [Google Scholar] [CrossRef] [Green Version]
  22. Blanes, V.; Pedersen, S. Ventilation flow in pig houses measured and calculated by carbon dioxide, moisture and heat balance equations. Biosyst. Eng. 2005, 92, 483–493. [Google Scholar] [CrossRef]
  23. Xie, Q.J.; Ni, J.Q.; Bao, J.; Su, Z.B. A thermal environmental model for indoor air temperature prediction and energy consumption in pig building. Build. Environ. 2019, 161, 106238. [Google Scholar] [CrossRef]
  24. Costantino, A.; Comba, L.; Cornale, P.; Fabrizio, E. Energy impact of climate control in pig farming: Dynamic simulation and experimental validation. Appl. Energ. 2022, 309, 118457. [Google Scholar] [CrossRef]
  25. Seedorf, J.; Hartung, J.; Schroder, M.; Linkert, K.; Pedersen, S.; Takai, H.; Johnsen, J.O.; Metz, J.H.M.; Groot Koerkamp, P.W.G.; Uenk, G.H.; et al. A Survey of Ventilation Rates in Livestock Buildings in Northern Europe. J. Agric. Eng. Res. 1998, 70, 39–47. [Google Scholar] [CrossRef] [Green Version]
  26. CIGR. Climatization of Animal Houses. In Report of Working Group; Scottish Farm Building Investigation Unit: Aberdeen, Scotland, 1984. [Google Scholar]
  27. CIGR. Climatization of Animal Houses. In Working Group Report on: Heat and Moisture Production at Animal and House Level; Pedersen, S., Sällvik, K., Eds.; DIAS: Odense, Denmark, 2002; ISBN 87-88976-60-2. [Google Scholar]
  28. Huang, J.J. Study on Ventilation Rate and Cooling and Heating Load of the Nursery and Fattening Pig House Based on Energy Balance. Master’s Thesis, China Agricultural University, Beijing, China, 2020. [Google Scholar]
  29. CIGR. Livestock Housing and Environment. In Handbook of Agricultural Engineering; American Society of Agricultural and Biological Engineers: Chicago, IL, USA, 2002; Volume II. [Google Scholar]
  30. Fu, L.L.; Li, H.Z.; Liang, T.T.; Zhou, B.; Chu, Q.P.; Schinckel, A.P.; Yang, X.J.; Zhao, R.Q.; Li, P.H.; Huang, R.H. Stocking density affects welfare indicators of growing pigs of different group sizes after regrouping. Appl. Anim. Behav. Sci. 2016, 174, 42–50. [Google Scholar] [CrossRef]
  31. GB/T 17824.3—2008; Environmental Parameters and Environmental Management for Intensive Pig Farms. Ministry of agriculture and rural affairs of the people’s republic of China: Beijing, China, 2008.
  32. Heber, A.J. Mechanical Ventilating Systems for Livestock Housing; MWPS-32; Iowa State University, Midwest Plan Service: Ames, IA, USA, 1990. [Google Scholar]
  33. Wang, M.Z.; Liu, J.J.; Tian, J.H.; Yun, P.; Shi, W.Q.; Deng, B.L.; Wu, Z.H. Research on the potential capacity of energy conservation and emission reduction of existing swine houses heated in winter in Beijing by renovation of energy efficiency. Acta Ecol. Anim. Domastici 2014, 35, 35–41. [Google Scholar]
  34. Hu, X.Y.; Shen, P.; Li, D.P.; Li, X.S.; Shi, Z.X.; Cui, W.H.; Xie, T. Research on the application of energy-saving fresh air preheating system for energy fattening pig house in cold area. Heilongjiang Anim. Sci. Vet. Med. 2022, 19, 9–14. [Google Scholar] [CrossRef]
  35. Wang, M.Z.; Li, S.X.; Wang, H.; Yang, L.F.; Zhang, X.J.; You, X.T.; Wu, Z.H.; Liu, J.J. Thermal insulation and energy consumption characteristics of an assembled piggery for breeding and gestation in winter. Trans. Chin. Soc. Agric. Eng. 2022, 38, 241–249. [Google Scholar] [CrossRef]
Figure 1. VBA (Visual Basic for Applications) model simulation process.
Agriculture 13 00319 g001
Figure 2. Ambient dry bulb temperature and relative humidity.
Agriculture 13 00319 g002
Figure 3. Heating simulation process.
Agriculture 13 00319 g003
Figure 4. Measured and simulated environmental data and relative errors of pig house.
Agriculture 13 00319 g004aAgriculture 13 00319 g004b
Figure 5. The minimum ventilation rate in winter for pigs with different masses.
Agriculture 13 00319 g005
Figure 6. Heating time and heating load of year in nursery and fattening pig house.
Agriculture 13 00319 g006
Table 1. Size of the model pig house.
Length (m)Width (m)Canopy Height (m)Ridge Height (m)Number and Area of Pens (Number, m2)Number and Area of Doors (Number, m2)Number and Area of Windows (Number, m2)
1101534.7572, 3 × 64, 2.1 × 156, 0.9 × 1.5
Table 2. Feeding process parameters of nursery and fattening pigs.
Type of PigsBody Mass (kg)Feeding AgeDaily Gain (kg)Stocking Density (m2 head−1)
Nursery14–3449–770.440.3–0.4
Fattening34–10078–1800.970.6–1.2
Table 3. Initial input parameters of heating load calculation program for nursery and fattening pigs.
TypeBody Mass (kg)Outdoor Environmental DataStocking Density
(m2 head−1)
Thermal Insulance Factor of Envelopes (m2 °C W−1)
Nursery pigs14–34Environmental data of Changchun0.2, 0.3, 0.4, 0.51, 2, 3, 4, 5, 6
Fattening pigs34–100Environmental data of Changchun0.6, 0.7, 0.8, 0.9, 1.0, 1.1, 1.2
Table 4. Integrated heating days of a year in nursery and fattening pig houses (day).
Type of Pig HouseCityEnvelope’s Thermal Insulance Factor (m2 °C W−1)
0.5123456
Nursery pig houseNanning5.130.710.130000
Changchun-141.54130125.63123.42122.17121.08
Beijing108.6782.5867.3361.9258.7956.6754.83
Wuhan46.0825.8315.7113.5411.5810.5410.00
Guiyang55.7130.0420.6317.7116.1315.5814.75
Fattening pig houseNanning0000000
Changchun-78.7962.4256.4253.3351.3849.33
Beijing36.0018.508.384.963.462.752.54
Wuhan3.38000000
Guiyang6.750.0800000
Table 5. Power consumption of a year in nursery and fattening pig houses (kW·h).
Type of Pig HouseCityEnvelope’s Thermal Insulance Factor (m2 °C W−1)
0.5123456
Nursery pig houseChangchun-138.73108.2098.4193.6390.7788.87
Beijing70.5737.5624.0320.0518.1717.0816.37
Wuhan16.045.642.451.671.331.151.04
Guiyang20.547.913.942.902.432.172.00
Fattening pig houseChangchun-90.5255.6145.5040.7638.0436.28
Beijing26.256.981.760.820.530.390.32
Disclaimer/Publisher’s Note: The statements, opinions and data contained in all publications are solely those of the individual author(s) and contributor(s) and not of MDPI and/or the editor(s). MDPI and/or the editor(s) disclaim responsibility for any injury to people or property resulting from any ideas, methods, instructions or products referred to in the content.

