Article

Deep Learning for Laying Hen Activity Recognition Using Wearable Sensors

by
Mohammad Shahbazi
1,*,
Kamyar Mohammadi
1,
Sayed M. Derakhshani
2 and
Peter W. G. Groot Koerkamp
3
1
School of Mechanical Engineering, Iran University of Science and Technology, Tehran 1684613114, Iran
2
Wageningen Food and Biobased Research, 6700 AA Wageningen, The Netherlands
3
Farm Technology Group, Wageningen University, 6700 AA Wageningen, The Netherlands
*
Author to whom correspondence should be addressed.
Agriculture 2023, 13(3), 738; https://doi.org/10.3390/agriculture13030738
Submission received: 16 December 2022 / Revised: 4 March 2023 / Accepted: 7 March 2023 / Published: 22 March 2023

Abstract

:
Laying hen activities in modern intensive housing systems can dramatically influence the policies needed for the optimal management of such systems. Intermittent monitoring of different behaviors during daytime cannot provide a good overview, since daily behaviors are not equally distributed over the day. This paper investigates the application of deep learning technology in the automatic recognition of laying hen behaviors equipped with body-worn inertial measurement unit (IMU) modules in poultry systems. Motivated by the human activity recognition literature, a sophisticated preprocessing method is tailored on the time-series data of IMU, transforming it into the form of so-called activity images to be recognized by the deep learning models. The diverse range of behaviors a laying hen can exhibit are categorized into three classes: low-, medium-, and high-intensity activities, and various recognition models are trained to recognize these behaviors in real-time. Several ablation studies are conducted to assess the efficacy and robustness of the developed models against variations and limitations common for an in situ practical implementation. Overall, the best trained model on the full-feature acquired data achieves a mean accuracy of almost 100%, where the whole process of inference by the model takes less than 30 milliseconds. The results suggest that the application of deep learning technology for activity recognition of individual hens has the potential to accurately aid successful management of modern poultry systems.

1. Introduction

Today’s livestock industry faces important challenges in terms of monitoring, control, economics, etc. Recognizing animals’ behaviors plays an important role in addressing most of these challenges, since animals’ different activities in modern intensive housing systems can dramatically influence the required management systems [1,2]. For an effective management of such systems, the monitoring task should be performed continuously during the daytime. Such an intensive monitoring task is no longer feasible to perform manually by humans, as it is tedious, time-consuming, and also no longer cost-effective. Therefore, a sort of automation is crucial for monitoring systems of today’s livestock production, as well as moving towards precision livestock farming [3,4,5,6,7,8].
There are several reasons supporting the need for development of automatic activity recognition models for hen housing systems, most notably: (i) A significant source of fine dust emissions comes from the agricultural industry. Animal matters, such as feces, hairs, and feathers, are among important contributors in this regard [9,10,11,12,13]. An effective recognition model could detect high-intensity activities of the hens, and proper control policies on illumination, feeding, humidity, and other possible inputs can be implemented accordingly; (ii) Detecting and preventing abnormal behaviors of hens could decrease the rate of injuries among them, since intrusive precautions such as beak trimming are being or have been banned in most developed countries [14,15]. It could also lead to the early detection of animal illnesses, when the behaviors of an individual hen or a flock are monitored day-to-day.
Generally, two different approaches can be taken to perceive different behaviors of hens. Remote sensing through computer vision is one option that provides rich data from the scene. For example, a deep convolutional neural network is trained in [16] to detect and segment hens with the goal to assess the plumage condition. A vision-based posture analysis is developed in [17] to detect sick broilers and give early warnings. Although getting closer to being operational in low intensive environments, it is truly difficult to use it for tracking individual hens in today’s loose housing systems [18]. The visual similarities between hens, the large domain of movements provided in these new housing systems, and occlusion incidences that could happen quite frequently hinder the effective application of this solution. Moreover, recognition of the moderate- and high-intensity activities, accomplished in a short period of time, requires high-frequency data sampling, which is not affordably available through vision sensing. Nevertheless, there are good opportunities for the study of flock behaviors using long-shot imagery, which is not the focus of the present work.
The other option, which is more suited for capturing the behavior of individual subjects, is to make use of wearable sensors that can be safely attached to a target limb of hens. Inertial measurement unit (IMU) modules are commonly used for motion capturing in various domains including human and animal activity recognition [19,20,21]. Whereas, other local positioning systems, such as the RFID technology that could help in positioning tagged subjects within a covered area by antenna receivers, have not received similar attention mostly due to their expensive and time-consuming setups (see [22] for a recent review). The use of IMU sensors for motion capturing and activity recognition has seen a breakthrough after the emergence of MEMS-based modules, which are low-cost, lightweight, easy-to-log, and low-power devices. The attachment of such sensors on animals such as hens does not introduce significant restrictions, and the subject can hopefully behave seamlessly [23]. IMU can provide data about the translational and angular movements of the subject in 3D, which can then be analyzed to infer high-level information about the type of activities being performed [19,21].
Real-time sensor-based hen activity recognition models dealing with the time-series IMU signals typically make use of machine learning technology. Machine learning provides a framework for large datasets to extract hidden features and patterns of signals that are otherwise impossible to be identified by manual or physics-based analyses [24]. A heavy preprocessing practice is required before machine learning-based classifiers can digest the time-series sensory data. Generally, this is accomplished by handcrafting a limited number of features, typically of a statistical flavor, then extracting these features from the segmented raw data, and finally allowing machine learning techniques to learn the correlations between these features and the output.
Based on the intensity of behaviors, Kozak et al. [25] identified three super classes a typical hen can perform: low-, medium-, and high-intensity activities. Accordingly, in [
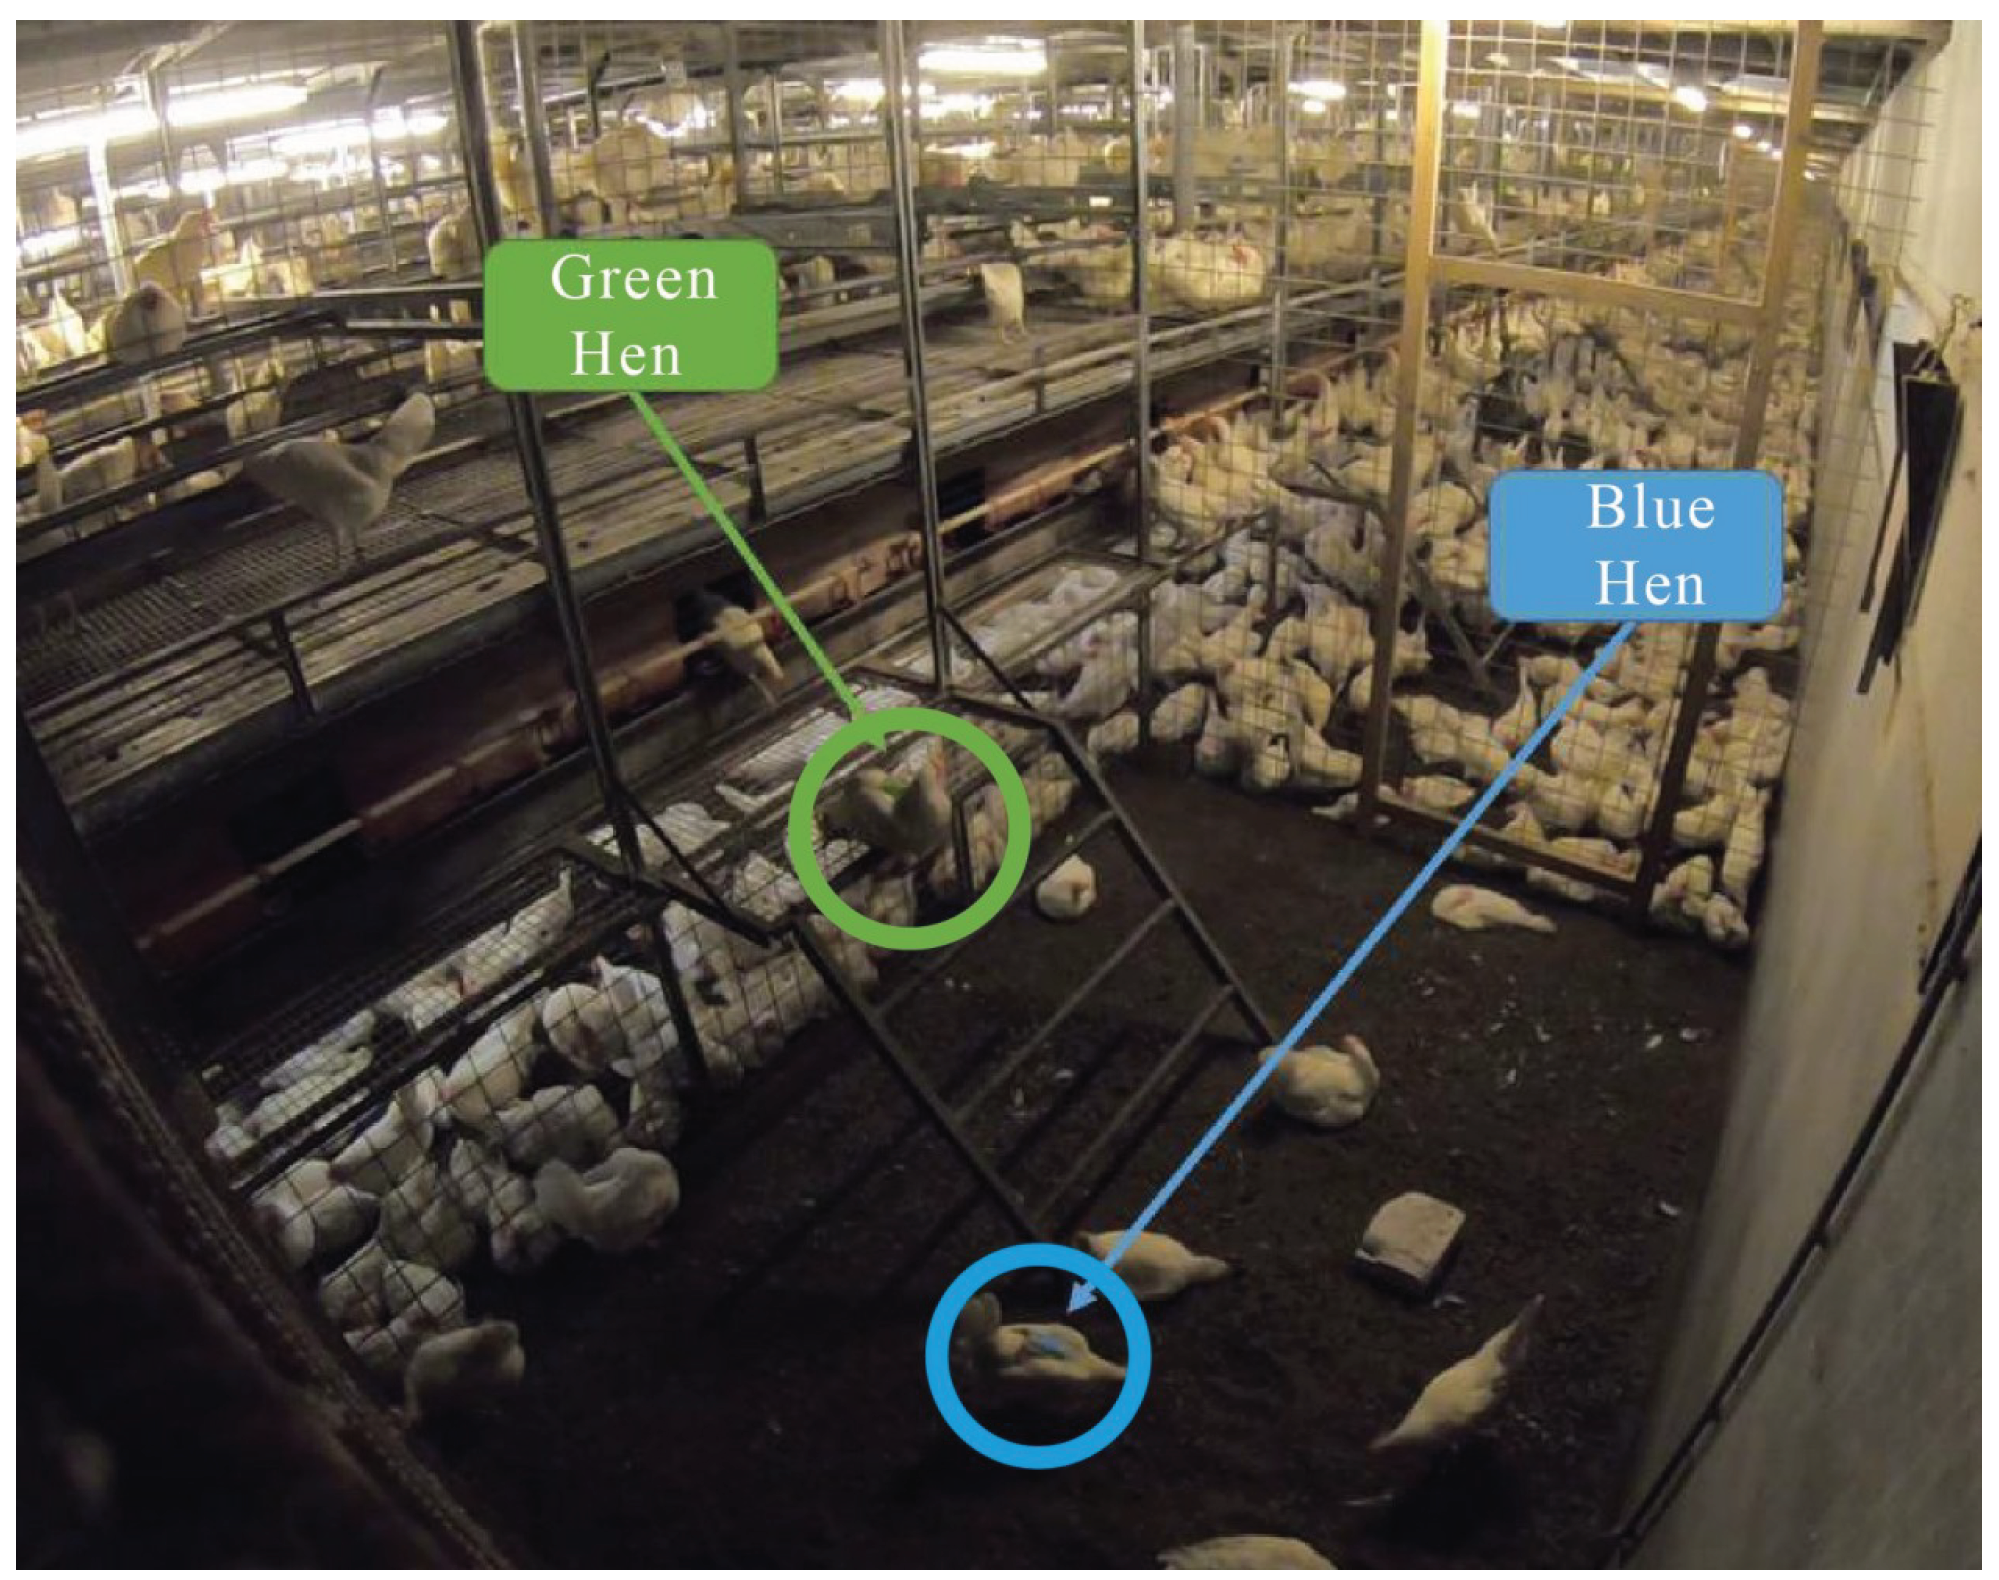
26] we presented a machine learning framework for recognizing these classes using 9-axis IMU modules worn by different hen subjects. A custom dataset was established for this study, and each data sample was manually labeled with the aid of the video streams recorded for this purpose. From the segments of raw data, skewness, kurtosis, mean, standard deviation, variance, minimum, maximum, entropy, energy, and covariance were manually calculated as representative features, and a number of standard machine learning techniques including support vector machine (SVM), and Bagged Trees were trained while the influences of different parameters and settings were thoroughly analyzed. The best predictor model, namely the Bagged Trees, achieved 89% accuracy for the classification.
In a binary classification task, Hepworth et al. [27] showed that applying a SVM model to routinely collected bird farm management data enables the prediction of sickness status with a superior accuracy of up to 99.5%. The activity recognition of hens in a non-cage maintenance system was studied in [28], where wireless accelerometers were installed on the subjects for real-time activity monitoring. The entropy and mean were extracted from the segments of recorded data, and several machine learning models including the Decision Tree and Radial Basis Function were employed to classify the static (sit/sleep), dynamic (walk/run), and resource (feed/drink) activities of the subjects. Accelerometers were also examined in classifying cow behaviors into three classes: standing, walking, and lying down [29]. If further research supports behavioral monitoring to identify animal health status, accelerometers could be used for larger populations of animals at risk for diseases [29].
Apart from the reviewed literature that focused on the training of classical machine learning algorithms using handcrafted features of data, a recent body of literature has studied the autonomous feature learning capabilities of Deep Learning (DL) technology. This paradigm has received particular attention in the field of human activity recognition (see [30] for a recent review). The efficacy of the methods in this scheme has further been enhanced by the rapid advancements in the hardware (i.e., lightweight sensors for large data acquisition, and powerful processors for deep networks training), and software (advanced framework for optimization and parallel computations). Motivated by the outstanding performance of DL models in image classification and object detection, a number of studies have investigated the possibility of encoding IMU signals into a form of images that can readily be recognized by the well-known DL-based models [19,21,31,32,33,34]. This encoding technique is sometimes referred to as the signal imaging.
The primary objective of the present study is to adopt the signal imaging and deep feature learning techniques to the problem of individual hen activity recognition. We would like to explore to what extent the introduced methodology can improve the results obtained by taking a traditional machine learning approach in our earlier study [26]. As a second objective, this study benchmarks the influence of different setups, parameters, and properties pertaining to the data collection and preprocessing, model architecture, and model training process. The results of this benchmark could aid further studies in examining different possibilities through remote/wearable sensing to move from individual hen analysis to a large-scale practical implementation being useful in optimally managing the future’s livestock systems.
The reset of this paper is organized as follows. In Section 2, we start by presenting the pipeline of the work, followed by the description of the dataset establishment. Next, the sophisticated data preprocessing presented in this paper is carefully detailed, and deep learning recognition architectures and the training process are described. Section 3 is devoted to the presentation of results and discussion. Here, the proposed model is investigated in terms of efficacy, robustness, and generalizability. Finally, the paper is concluded in Section 4.

2. Materials and Methods

2.1. System Overview

As outlined in the introduction, the diverse types of hen behaviors can be categorized into three super classes: low-intensity, moderate-intensity, and high-intensity activities. Figure 1 depicts an overview of the behavior recognition system developed to automatically identify these three groups of activities. The process starts by acquiring movement data from the wearable sensor the subject hens are equipped with (Section 2.2). The movement data includes the linear acceleration, angular velocity, and the attitude determined from the magnetic field data. The acquired sensory signals are then sampled through a specific time windowing step (Section 2.3.1), and then transformed into a set of so-called signal images following an encoding algorithm described in Section 2.3.2. The signal images are further transformed into activity images applying Discrete Fourier Transform (DFT). The resulting images serve as the input to a deep neural network (DNN) performing the actual classification task (Section 2.4 and Section 2.5). The rest of this section is devoted to a detailed presentation of all materials and methods involved in the introduced system.

2.2. Data Acquisition, Labeling, and Bundling

Data plays a central role in the success of any deep learning model. Here, we describe how the devised experiments are performed to acquire data, the way by which the time-series data are labeled, and in what combinations they can be bundled for the next steps.

2.2.1. Data Acquisition

An experiment was designed in a part of a commercial laying hen poultry farm to collect data on the behavior of laying hens [26]. The experimental environment was separated from the other parts of the poultry house with a fence. In terms of facilities, this environment was similar to other parts of the poultry farm. The hen house lights were on at 4:30 a.m. and off at 7:45 p.m. Fifteen laying hens that were 34 weeks old were placed in the experimental environment. Two comfortable backpacks to contain a light IMU module of 16 grams were installed on two individual hens for data collection. The backpack attachment is inspired by a common back support belt. The first two days of the experiments were only meant for hens to get used to the new situations [35], and the actual data acquisition was started from the third day.
The MTw2 Awinda Wireless 3DOF Motion Tracker (IMU) from Xsens was used for inertial measurement. The module houses an accelerometer, a gyroscope, and a magnetometer whose specifications can be consulted in Table 1. It contains a built-in battery providing sufficient power for the course of experiments, and the logged data are saved in an internal memory. Please refer to [26] for more details on data acquisition.

2.2.2. Data Labeling

To distinguish the hens from each other, two distinct colors are used for the backpacks, namely green and blue. Accordingly, we shall refer to the subjects as blue hen and green hen, as shown in Figure 2. The green hen data includes 2 h and 20 min of wearable sensor log at a rate of 1000 Hz, whereas the blue hen data includes only 29 min at the same sampling rate. For the sake of labeling, video recording was also performed and synced by the movement signals. An in-house expert has carefully processed recorded sequences frame by frame and labeled the data accordingly. As outlined earlier, only three super classes are considered for labeling, which include different types of low-, moderate-, and high-intensity activities listed in Table 2. The distribution of data among the three classes is shown in Figure 3. Note that the dataset is imbalanced, since the high-intensity (Class 3) samples are much fewer than the other two classes. Additionally, the green hen dataset is considerably larger than the blue one.

2.2.3. Data Bundling

The deployed 9-axis Xsens IMU generates rich movement data including three-dimensional linear acceleration, angular velocity, and magnetic field data, symbolized here by “A”, “V”, and “M”, respectively. One can argue that an efficient training of the activity recognition model may not need all these axes of measurements. For example, if the recognition model trained by only linear acceleration data is proven to be effective, this simply means that practically less expensive wearable sensors and computational power are demanded. Therefore, it is justified to study the different combinations of sensor outputs, which are hereon referred to as the data bundles. Four different data bundles are considered in our experiments, as listed in Table 3. Notice the presence of linear acceleration (A) in all bundles, since it naturally provides the most informative movement data for a hen. Additionally, the size of signal images corresponding to each data bundle, reported in the last column of the table, is determined by the time windowing and signal imaging techniques to be presented in the next section.

2.3. Data Preprocessing

2.3.1. Time Windowing

A form of sampling is usually needed for time-series signals to be digested by DNNs. This is mainly because the durations of different activities, embodied through special patterns in the signals, are substantially different, while DNNs prefer to receive constant-size inputs. As such, a time windowing technique is applied in which a sliding window of a specific size spans the signals, yielding sampled (segmented) pieces of data. As illustrated in Figure 4, an overlap can be considered between every two adjacent segments to ensure a smooth transition. Unless otherwise specified, a sliding window of 50 data samples and 50% overlap are considered in this study. Figure 5 shows how this windowing technique affects the size of data for the green hen. It is easy to show that letting x be the number of samples in a class, the number of data segments after windowing will be x 25 . The width of DNN inputs is determined by the windowing size.

2.3.2. Signal Imaging

One more step is required for the sampled (segmented) data to be transformed into a suitable form for the DNN recognition model. As outlined in the introduction, the traditional way is the handcrafted feature extraction, which is studied in our previous work [26]. Although proven to be effective, it suffers from a few shortcomings. Most notably, it features a form of abstraction in the sense that not all distinctive features embodied in the raw data are necessarily captured by the handcrafted features. Moreover, there is no guarantee that the extracted features are the best representatives of the data. As briefly introduced earlier, an alternative which has been proven to be effective in closely related applications is the signal imaging technique. The encoded time-series data into signal images form two-dimensional arrays showing features and patterns that are hardly found in the original one-dimensional signals [36]. Various encoding techniques, e.g., the Gramian Angular Field [37,38] and the Markov Transition Field [38], have been investigated in the literature. The signal imaging technique used in the present work is adopted from [19], the method that has demonstrated outstanding performance specifically in the realm of human activity recognition. We refer to this method as the Signal Imaging Algorithm (SIA).
Following the SIA proposed in [19], for the AVM data bundle (Table 3) the size of resulting signal image is 36 × 50 (see Figure 6), in which the number of columns corresponds to the sliding window width, that is 50 data samples. The 36 rows of the image are formed by stacking the nine signal channels in an order defined by the algorithm so that every channel is repeated four times and there is a chance for every channel to be adjacent to every other channel. This order is systematically generated by the algorithm. For the particular case of nine channel signals, the order would be “123456789135792468147158259369483726”, where each digit corresponds to a specific channel in the windowed signal. Similarly, for the AV and AM data bundles (Table 3), since the input signal has six channels, the resulting signal images would have 14 rows, as shown in Figure 6. In this case, the generated order by the algorithm would be “12345613514624”.
For the A data bundle, which includes only the three-channel linear accelerations, the SIA is no longer applicable. Here, we introduce a duplicate method resulting in 10 × 50 signal images, in which the 10 rows are formed by stacking the three channels in the order “1231231”. Note that the obtained height for the images of this data bundle is the minimum height acceptable by the implemented DNNs, as will be discussed later. Finally, all signal images are converted to activity images of the same size applying the two-dimensional DFT. It was revealed during the preliminary experiments that applying the DFT would result in more discriminative features.

2.4. Behavior Recognition Model

As outlined earlier, the main objective of the present study is to investigate the power of Deep Learning (DL) classifiers in recognizing different behaviors of laying hens represented by activity images. In the last decade, DL has emerged as one of the best performing predictor classes within machine learning in various implementation areas [39]. Ever-increasing processors capabilities, decreasing computational costs, and advancing learning algorithms promote DL [40]. In particular, Deep Convolutional Neural Networks (DCNNs) have demonstrated outstanding performance in image classification, object detection, and tracking. Numerous successful implementations have revolved around breakthrough DCNN architectures such as LeNet [41], VGG [42], AlexNet [43], ResNet [44], and MobileNet [45]. We will examine a few of these architectures as well as a simple shallow CNN model in the experiments.
The LeNet5 architecture with modified input and layer sizes is illustrated in Figure 7 for the AVM data bundle (see Table 3). The network accepts the activity images as input and gives the probability of occurrence of the three behavior classes as output. The activity images are normalized in the interval [ 0 , 255 ] before feeding to the network. The first two pairs of layers apply convolution and average pooling sequentially, extracting deep features of the images such as key patterns. A flatten layer then vectorizes the feature map, making it ready for densification by three consecutive fully-connected layers, which output the probabilities of each class occurrence. Table 4 reports the number and size of filters as well as the respective activation functions in each layer when applicable. Additionally, the obtained shapes of feature maps in each layer for different data bundles are given in Table 5.
We also consider two alternative network architectures; the first one is the well-known ResNet50 model [44], and the other is a simple shallow CNN network, or the shallow model for short. This network consists of two convolution layers, a fully-connected layer followed by a dense layer, which provides the output. The convolution layers include, respectively, 64 and 128 filters each having a ( 4 × 4 ) shape. As for the activation functions, Relu and SoftMax are used for the convolution and dense layers, respectively.

2.5. Network Training and Evaluation Metrics

All DNN models are programmed and trained in Python 3.8 using TensorFlow 2.9.1 [46] on a normal PC with an i7 9th Gen. Intel processor and 16 GB of RAM. The networks are trained using Adam optimization technique [47] while a categorical cross-entropy loss function [48] is considered. The evaluation policy is to shuffle the activity images randomly. Unless otherwise specified, 70% of the shuffled images are used for the model training while the rest are used for testing. Note that our preliminary experiments revealed that considering a further split between validation and test sets did not influence the results. As such, and since the size of samples in the high-intensity class is relatively small, we decided to follow this train-test policy and, therefore, the terms test and validation are assumed equivalent in this paper.
To illustrate the classification performance, we evaluate commonly used performance metrics illustrated in Figure 8. A true positive (TP) is an outcome where the model correctly predicts the true class. Similarly, a true negative (TN) is an outcome where the model correctly predicts the false class. A false positive (FP) is for the case where the model incorrectly predicts the true class, and a false negative (FN) means the model incorrectly predicts the false class. Accuracy describes the general performance across all classes. It is the ratio of the number of correct predictions to the total number of predictions. Recall calculates the model’s capability to detect the true samples, i.e., it computes the ratio of true samples correctly classified as true to the total number of true samples. Finally, precision measures the ratio between the number of correctly classified true samples to the total number of true classified samples. These performance metrics can take values in the range [ 0 , 1 ] by definition.

3. Results and Discussion

The proposed activity recognition model is thoroughly investigated in terms of efficacy, robustness, and generalizability. First, only the green hen dataset is used in the analyses to provide a focused study on the influence of the following settings: (1) exploring different DCNN architectures; (2) reducing the bundle dimension and dataset size; and (3) introducing noise to the data to evaluate robustness. Then, both the blue and green hens’ datasets are combined to see how well the model can generalize.

3.1. Full-Feature Data Bundle Results

In order to illustrate the best performance achievable by the proposed framework, we train the three introduced models on the green hen activity images of the AVM data bundle, which includes its full-feature dataset. The training process for all models went smoothly, as shown in Figure 9, where the accuracy and loss during training are plotted. All accuracies converged to 1 while the corresponding training losses were ever decreasing. As for testing, Table 6 reports the evaluation of performance indices presented earlier on the test set of the green hen. Additionally, the confusion matrices for all the three models are shown in Figure 10.
The results demonstrate absolutely accurate and precise classifications by all the three models. The perfect confusion matrix of LeNet5, shown in the left panel of Figure 10, implies that the model has succeeded in correctly predicting the intensity level of all 10,000 instances in the test set. Even for the confusion matrices of ResNet50 and shallow model, there are extremely few instances falling off-diagonal. Notice the accurate predictions of high-intensity instances by all three models, despite the small data size in this class. The best accuracy achieved in our previous study [26] was 89.4%. The significant improvement achieved in the present work demonstrates the effectiveness of the deep feature learning and the data preprocessing method through the implemented signal imaging technique. On average, generating an activity image by the signal imaging algorithm and its inference by the trained LeNet5 network on the processing unit introduced in Section 2.5 take 0.6 and 29 milliseconds, respectively, as reported in Table 6. This computation time is short enough for a real-time implementation, given that each activity image accounts for a 50 milliseconds data segment. Note that in terms of computational efficiency, again the LeNet5 model performs slightly better than the ResNet50 and shallow model under the same training policy and conditions.
Overall, the results suggest that the developed model is capable of recognizing different intensity activities of the subject quite accurately, and the computation time complies with a real-time implementation. The next few analyses will further investigate the performance of the model with respect to some important parameters and settings that could be crucial for a large-scale practical implementation. Without loss of generally and for brevity, hereon only the LeNet5 model will be used in the experiments.

3.2. Influence of Bundle Dimension and Trainset Size Reduction

Data collection for animal activity recognition can be cumbersome because of the strict regulations of dealing with animals as well as the lack of continuous control on the sensor proper attachment during the acquisition process. Data labeling can also become challenging in some situations since the subjects do not generally move in any programmable directions for video data recording. As such, it is worth exploring how the performance indices of our model vary with respect to the amount of training data. To this end, we investigate different test-to-train ratios as well as different data bundles introduced in Table 3. A test-to-train ratio of 30/70 implies that 70% of the data are used for training and 30% for testing, which is the default choice in this paper except for the discussion that follows here.
Figure 11 illustrates the distribution of green hen data when different test-to-train ratios are considered. The numbers provided underneath the plot are the sample counts for each subclass used for training. Note that the amount of data used for the high-intensity class is kept constant, because it is already small. In Figure 12a,b, we plot the test accuracy and loss versus different test-to-train ratios for different data bundles. Overall, the model demonstrates satisfactory performance even when extremely small datasets are used for training. Subtle drops in accuracy are seen when the ratio is smaller than 20/80, where the testset size is small, and the model tends to overfit as such. One can see the best performance when the ratio is around 30/70, as expected. As for the different data bundles used for training, no major differences are seen in the results for the small and medium test-to-train ratios. However, we will have more to say about this in the following analysis where we consider noisy data.

3.3. Robustness Analysis

Apart from the size of labeled data discussed in the previous section, accuracy and precision in data measurement are other important factors influencing the robustness of the model. It is clear that a clean or less noisy measured dataset would result in more accurate data interpretations by the recognition model. However, one should take into account the trade-off between accuracy and cost, especially if the wearable sensors are to be implemented in a relatively large scale. To evaluate the robustness of the model against inaccuracies arisen from the measurement device, Gaussian noise is intentionally added to the green hen trainset. In a series of separate experiments, zero-centered Gaussian noises of different standard deviations corrupt the data before training the LeNet5 model.
Figure 13 illustrates the accuracy and validation loss of the model trained by the AVM data bundle of the green hen against the increasing noise levels. As can be seen, the model exhibits a very high level of robustness against even large corruptions on the training data. We expect that this significant performance mainly owes to the effective data preprocessing through the signal imaging adopted for the hen motion data. Representing the motion data in the form of activity images enables the model to take advantages of the now-matured DCNN structures, the tools whose efficacy is demonstrated for real-world image understanding and classification tasks. The results might also imply that the proposed recognition model would perform almost equally well when low-cost wearable sensors are used instead.
Introducing noise to the data will allow us to also study the effect of factors that are otherwise hard to see, such as the windowing size presented in Section 2.3, and different data bundles introduced in Section 2.2. Figure 14 shows the accuracy of the LeNet5 recognition model trained by different data bundles whose associated activity images are generated using three different windowing widths, being 25, 50, and 100 data samples with a 50% overlap. The figure contains three panels corresponding to situations in which zero-, mid-, and high-level noises are introduced to the green hen training set. Multiple observations can be made from this analysis as follows.
First, the considered variations on the data bundle and window width do not present remarkable effects on the performance when uncorrupted data are used for training. Second, when noisy data are involved, however, the performance starts to degrade. In this case, the effect of window size is revealed earlier even with the mid-level noises (middle panel of Figure 14), while the difference between different data bundles remains subtle until high-level noises are considered, as in the right panel of the figure. Third, irrespective of the window width, the noise corruption shows stronger effects on poorer data bundles. This can be seen when comparing the accuracies of the AVM and A data bundles in the right panel of Figure 14. Additionally, notice in the same figure that the AV data bundle performs better than the AM data bundle, suggesting that the angular velocity data may be more useful (i.e., discriminative) than the magnetic field data in the performed experiment and analysis. Finally, when it comes to comparing the performance of models with different window widths, it looks as though there is an optimum value, as can be seen in the right panel of Figure 14. Small window widths result in poor performance because the noise affects the 2D patterns of the data more severely in this case. On the other hand, large window widths are also not desirable, most likely because in this case the number of data segments, i.e., activity images, becomes small and the network cannot train satisfactorily on the small dataset.

3.4. Performance Illustration on Unseen Dataset

Lastly, we would like to study how well the developed algorithms and models are applied to a different subject. To do so, we first train a fresh model on the blue hen dataset following the similar steps taken for the green hen. The results are very similar to what were achieved for the green hen. Table 7 reports the evaluation of different performance indices considered in this study. Additionally, Figure 15 shows the corresponding confusion matrix, indicating the success of the model in predicting the correct class, even for the high-intensity activities for which only a few instances were present. Overall, this experiment corroborates the repeatability of the presented approach on a new subject.
Next, the datasets of both green and blue hens were shuffled, and the LeNet5 model was trained on this combined dataset. Although some of the performance indices suffered slightly in this case (see Table 8), most of them remained remarkably high. This is also evident in the corresponding confusion matrix in Figure 16, where the majority of the instances are on the main diagonal. Overall, the results support the generalizability of the recognition model presented in this work.
One may wonder about the generalizability criterion on the leave-one-out experiment scenario. This refers to the scenario in which the data of multiple subjects are used for training, while one subject’s data are kept reserved for testing. Given that the dataset established in this study contains only two subjects, our results for the leave-one-out experiment were not satisfactory, as expected. To achieve decent performance on this type of experiment requires the involvement of multiple subjects with enough diversity in terms of important factors defining the problem domain.
One final note about typical multi-subject experiments is discussed here on the sensor misalignment across different subjects. To exclude the possibility of having this issue dominantly affecting the leave-one-out experiment, we performed the following offline analysis. The average 3D accelerations for both green and blue hens are calculated from the respective datasets. The rotational transformation between these two vectors could give an indication of the possible misalignment between the coordinate frames independently affixed to the subjects. This rotation matrix R for our dataset is obtained as
R = 0.98 0.17 0 0.17 0.98 0 0 0 1 ,
which is close to the identity matrix. This suggests that the sensors’ frames on the two subjects were almost perfectly aligned.

4. Conclusions

In this study, a deep learning framework was developed for accurately recognizing the activity levels of individual laying hens in a poultry system, using body-worn IMU modules. The framework employs a signal imaging technique that encodes the time-series data of sensors to some form of synthetic images for classification by off-the-shelf deep learning models. The approach allows the deep learning model to learn hidden patterns and significant correlations while end-to-end training, resulting in superior performance metrics compared to classical machine learning techniques and handcrafted feature selection. The developed model offers high performance even with a reduced trainset size and affected data richness, indicating the potential for deploying simpler IMU modules or different sensing technologies fulfilling minimal data requirements. The model also exhibits outstanding robustness to the Gaussian noise of different levels, and even a simple shallow model can perform as well as deeper structures such as ResNet. Also discussed was the generalizability of the model by illustrating its performance on unseen datasets.
The findings highlight the relevance of high-autonomy activity recognition models for monitoring modern poultry houses. They have the potential to effectively detect anomaly behaviors indicative of malfunctions in the management system or the emergence of animal diseases when combined with state-of-the-art unsupervised learning models such as auto-encoders. Future research shall focus on identifying correlations between individual and flock behaviors in poultry systems and exploring noninvasive sensing technologies such as machine vision. For the latter, the objective could be to identify features that fit well into the signal imaging paradigm.

Author Contributions

Conceptualization, M.S. and S.M.D.; data curation, S.M.D.; formal analysis, S.M.D.; investigation, P.W.G.G.K.; methodology, M.S. and K.M.; resources, S.M.D.; software, K.M.; supervision, M.S., S.M.D. and P.W.G.G.K.; validation, K.M. and P.W.G.G.K.; visualization, K.M.; writing—original draft, M.S. and K.M.; writing—review and editing, P.W.G.G.K. All authors have read and agreed to the published version of the manuscript.

Funding

This research received no external funding.

Institutional Review Board Statement

Ethical approval for the experiment was granted by the Animal Welfare Body of Wageningen Research (date: 8 November 2019), for mounting backpacks on two chickens for a maximum period of 5 days, which was not exceeded.

Data Availability Statement

The data presented in this study are available on request from the corresponding author.

Conflicts of Interest

The authors declare no conflict of interest.

References

  1. Winkel, A.; Mosquera, J.; Koerkamp, P.W.G.; Ogink, N.W.; Aarnink, A.J. Emissions of particulate matter from animal houses in the Netherlands. Atmos. Environ. 2015, 111, 202–212. [Google Scholar] [CrossRef]
  2. Bao, J.; Xie, Q. Artificial intelligence in animal farming: A systematic literature review. J. Clean. Prod. 2022, 331, 129956. [Google Scholar] [CrossRef]
  3. Zeppelzauer, M.; Stoeger, A.S. Establishing the fundamentals for an elephant early warning and monitoring system. BMC Res. Notes 2015, 8, 409. [Google Scholar] [CrossRef] [PubMed] [Green Version]
  4. Sahin, Y.G. Animals as mobile biological sensors for forest fire detection. Sensors 2007, 7, 3084–3099. [Google Scholar] [CrossRef] [PubMed] [Green Version]
  5. Nathan, R. An emerging movement ecology paradigm. Proc. Natl. Acad. Sci. USA 2008, 105, 19050–19051. [Google Scholar] [CrossRef] [Green Version]
  6. Langbauer, W.R., Jr.; Payne, K.B.; Charif, R.A.; Rapaport, L.; Osborn, F. African elephants respond to distant playbacks of low-frequency conspecific calls. J. Exp. Biol. 1991, 157, 35–46. [Google Scholar] [CrossRef]
  7. Banzi, J.F. A sensor based anti-poaching system in Tanzania national parks. Int. J. Sci. Res. Publ. 2014, 4, 1–7. [Google Scholar]
  8. Bishop-Hurley, G.; Henry, D.; Smith, D.; Dutta, R.; Hills, J.; Rawnsley, R.; Hellicar, A.; Timms, G.; Morshed, A.; Rahman, A.; et al. An investigation of cow feeding behavior using motion sensors. In Proceedings of the 2014 IEEE International Instrumentation and Measurement Technology Conference (I2MTC) Proceedings, Montevideo, Uruguay, 12–15 May 2014; IEEE: New York, NY, USA, 2014; pp. 1285–1290. [Google Scholar]
  9. Casey, K.D.; Bicudo, J.R.; Schmidt, D.R.; Singh, A.; Gay, S.W.; Gates, R.S.; Jacobson, L.D.; Hoff, S.J. Air Quality and Emissions from Livestock and Poultry Production/Waste Management Systems; ASABE: Washington, DC, USA, 2006. [Google Scholar]
  10. Ellen, H.; Bottcher, R.; Von Wachenfelt, E.; Takai, H. Dust levels and control methods in poultry houses. J. Agric. Saf. Health 2000, 6, 275. [Google Scholar] [CrossRef]
  11. Cambra-López, M.; Aarnink, A.J.; Zhao, Y.; Calvet, S.; Torres, A.G. Airborne particulate matter from livestock production systems: A review of an air pollution problem. Environ. Pollut. 2010, 158, 1–17. [Google Scholar] [CrossRef]
  12. Takai, H.; Pedersen, S.; Johnsen, J.O.; Metz, J.; Koerkamp, P.G.; Uenk, G.; Phillips, V.; Holden, M.; Sneath, R.; Short, J. Concentrations and emissions of airborne dust in livestock buildings in Northern Europe. J. Agric. Eng. Res. 1998, 70, 59–77. [Google Scholar] [CrossRef] [Green Version]
  13. Winkel, A. Particulate Matter Emission from Livestock Houses: Measurement Methods, Emission Levels and Abatement Systems. Ph.D. Thesis, Wageningen University, Wageningen, The Netherlands, 2016. [Google Scholar]
  14. Cheng, H. Morphopathological changes and pain in beak trimmed laying hens. Worlds Poult. Sci. J. 2006, 62, 41–52. [Google Scholar]
  15. Van Niekerk, T. Managing laying hen flocks with intact beaks. In Achieving Sustainable Production of Eggs; Burleigh Dodds Science Publishing Limited: Cambridge, UK, 2017. [Google Scholar]
  16. Lamping, C.; Derks, M.; Koerkamp, P.G.; Kootstra, G. ChickenNet-an end-to-end approach for plumage condition assessment of laying hens in commercial farms using computer vision. Comput. Electron. Agric. 2022, 194, 106695. [Google Scholar]
  17. Zhuang, X.; Bi, M.; Guo, J.; Wu, S.; Zhang, T. Development of an early warning algorithm to detect sick broilers. Comput. Electron. Agric. 2018, 144, 102–113. [Google Scholar] [CrossRef]
  18. Calvet, S.; Van den Weghe, H.; Kosch, R.; Estellés, F. The influence of the lighting program on broiler activity and dust production. Poult. Sci. 2009, 88, 2504–2511. [Google Scholar] [PubMed]
  19. Jiang, W.; Yin, Z. Human activity recognition using wearable sensors by deep convolutional neural networks. In Proceedings of the 23rd ACM International Conference on Multimedia, Ottawa, ON, Canada, 28 October–3 November 2015; pp. 1307–1310. [Google Scholar]
  20. Kamminga, J.W. Hiding in the Deep: Online Animal Activity Recognition Using Motion Sensors and Machine Learning. Ph.D. Thesis, University of Twente, Enschede, The Netherlands, 2020. [Google Scholar]
  21. Tao, W.; Lai, Z.H.; Leu, M.C.; Yin, Z. Worker activity recognition in smart manufacturing using IMU and sEMG signals with convolutional neural networks. Procedia Manuf. 2018, 26, 1159–1166. [Google Scholar] [CrossRef]
  22. Li, N.; Ren, Z.; Li, D.; Zeng, L. Automated techniques for monitoring the behaviour and welfare of broilers and laying hens: Towards the goal of precision livestock farming. Animal 2020, 14, 617–625. [Google Scholar] [CrossRef] [Green Version]
  23. Shepard, E.L.; Wilson, R.P.; Quintana, F.; Laich, A.G.; Liebsch, N.; Albareda, D.A.; Halsey, L.G.; Gleiss, A.; Morgan, D.T.; Myers, A.E.; et al. Identification of animal movement patterns using tri-axial accelerometry. Endanger. Species Res. 2008, 10, 47–60. [Google Scholar] [CrossRef] [Green Version]
  24. LeCun, Y.; Bengio, Y.; Hinton, G. Deep learning. Nature 2015, 521, 436–444. [Google Scholar]
  25. Kozak, M.; Tobalske, B.; Springthorpe, D.; Szkotnicki, B.; Harlander-Matauschek, A. Development of physical activity levels in laying hens in three-dimensional aviaries. Appl. Anim. Behav. Sci. 2016, 185, 66–72. [Google Scholar] [CrossRef]
  26. Derakhshani, S.M.; Overduin, M.; van Niekerk, T.G.; Groot Koerkamp, P.W. Implementation of Inertia Sensor and Machine Learning Technologies for Analyzing the Behavior of Individual Laying Hens. Animals 2022, 12, 536. [Google Scholar] [CrossRef]
  27. Hepworth, P.J.; Nefedov, A.V.; Muchnik, I.B.; Morgan, K.L. Broiler chickens can benefit from machine learning: Support vector machine analysis of observational epidemiological data. J. R. Soc. Interface 2012, 9, 1934–1942. [Google Scholar] [CrossRef]
  28. Banerjee, D.; Biswas, S.; Daigle, C.; Siegford, J.M. Remote activity classification of hens using wireless body mounted sensors. In Proceedings of the 2012 Ninth International Conference on Wearable and Implantable Body Sensor Networks, London, UK, 9–12 May 2012; IEEE: New York, NY, USA, 2012; pp. 107–112. [Google Scholar]
  29. Robert, B.; White, B.; Renter, D.; Larson, R. Evaluation of three-dimensional accelerometers to monitor and classify behavior patterns in cattle. Comput. Electron. Agric. 2009, 67, 80–84. [Google Scholar] [CrossRef]
  30. Chen, K.; Zhang, D.; Yao, L.; Guo, B.; Yu, Z.; Liu, Y. Deep learning for sensor-based human activity recognition: Overview, challenges, and opportunities. ACM Comput. Surv. CSUR 2021, 54, 1–40. [Google Scholar] [CrossRef]
  31. Ahmad, Z.; Khan, N. Inertial sensor data to image encoding for human action recognition. IEEE Sens. J. 2021, 21, 10978–10988. [Google Scholar] [CrossRef]
  32. Sharma, P.K.; Dennison, M.; Raglin, A. Iot solutions with multi-sensor fusion and signal-image encoding for secure data transfer and decision making. arXiv 2021, arXiv:2106.01497. [Google Scholar]
  33. Mehdizadeh, S.A.; Neves, D.; Tscharke, M.; Nääs, I.; Banhazi, T.M. Image analysis method to evaluate beak and head motion of broiler chickens during feeding. Comput. Electron. Agric. 2015, 114, 88–95. [Google Scholar] [CrossRef]
  34. Glasbey, C.A.; Horgan, G.W. Image Analysis for the Biological Sciences; Wiley: Chichester, UK, 1995; Volume 1. [Google Scholar]
  35. Stadig, L.M.; Rodenburg, T.B.; Ampe, B.; Reubens, B.; Tuyttens, F.A. An automated positioning system for monitoring chickens’ location: Effects of wearing a backpack on behaviour, leg health and production. Appl. Anim. Behav. Sci. 2018, 198, 83–88. [Google Scholar] [CrossRef]
  36. Yang, C.L.; Chen, Z.X.; Yang, C.Y. Sensor classification using convolutional neural network by encoding multivariate time series as two-dimensional colored images. Sensors 2019, 20, 168. [Google Scholar] [CrossRef] [Green Version]
  37. Barra, S.; Carta, S.M.; Corriga, A.; Podda, A.S.; Recupero, D.R. Deep learning and time series-to-image encoding for financial forecasting. IEEE CAA J. Autom. Sin. 2020, 7, 683–692. [Google Scholar] [CrossRef]
  38. Wang, Z.; Oates, T. Imaging time-series to improve classification and imputation. In Proceedings of the Twenty-Fourth International Joint Conference on Artificial Intelligence, Buenos Aires, Argentina, 25–31 July 2015. [Google Scholar]
  39. Sezer, O.B.; Gudelek, M.U.; Ozbayoglu, A.M. Financial time series forecasting with deep learning: A systematic literature review: 2005–2019. Appl. Soft Comput. 2020, 90, 106181. [Google Scholar] [CrossRef] [Green Version]
  40. Deng, L. A tutorial survey of architectures, algorithms, and applications for deep learning. APSIPA Trans. Signal Inf. Process. 2014, 3, e2. [Google Scholar] [CrossRef] [Green Version]
  41. LeCun, Y.; Bottou, L.; Bengio, Y.; Haffner, P. Gradient-based learning applied to document recognition. Proc. IEEE 1998, 86, 2278–2324. [Google Scholar] [CrossRef] [Green Version]
  42. Simonyan, K.; Zisserman, A. Very deep convolutional networks for large-scale image recognition. arXiv 2014, arXiv:1409.1556. [Google Scholar]
  43. Krizhevsky, A.; Sutskever, I.; Hinton, G.E. Imagenet classification with deep convolutional neural networks. Adv. Neural Inf. Process. Syst. 2012, 25, 84–90. [Google Scholar] [CrossRef] [Green Version]
  44. He, K.; Zhang, X.; Ren, S.; Sun, J. Deep residual learning for image recognition. In Proceedings of the IEEE Conference on Computer Vision and Pattern Recognition, Las Vegas, NV, USA, 27–30 June 2016; pp. 770–778. [Google Scholar]
  45. Howard, A.G.; Zhu, M.; Chen, B.; Kalenichenko, D.; Wang, W.; Weyand, T.; Andreetto, M.; Adam, H. Mobilenets: Efficient convolutional neural networks for mobile vision applications. arXiv 2017, arXiv:1704.04861. [Google Scholar]
  46. Abadi, M.; Barham, P.; Chen, J.; Chen, Z.; Davis, A.; Dean, J.; Devin, M.; Ghemawat, S.; Irving, G.; Isard, M. TensorFlow: A System for Large-Scale Machine Learning. In Proceedings of the 12th USENIX Symposium on Operating Systems Design and Implementation (OSDI 16), Savannah, GA, USA, 2–4 November 2016; pp. 265–283. [Google Scholar]
  47. Kingma, D.P.; Ba, J. Adam: A method for stochastic optimization. arXiv 2014, arXiv:1412.6980. [Google Scholar]
  48. Janocha, K.; Czarnecki, W.M. On loss functions for deep neural networks in classification. arXiv 2017, arXiv:1702.05659. [Google Scholar] [CrossRef]
Figure 1. Overview of activity recognition model proposed in this study.
Agriculture 13 00738 g001
Figure 2. The experimental setup where two annotated hens are backpacked for data collection.
Agriculture 13 00738 g002
Figure 3. Overview of green and blue hen datasets.
Agriculture 13 00738 g003
Figure 4. Illustration of sampling method for the AVM data bundle.
Agriculture 13 00738 g004
Figure 5. The distribution of green hen data before and after time windowing.
Agriculture 13 00738 g005
Figure 6. Generation of signal and activity images from the segmented raw data for different data bundles. The channels of the segmented signals are stacked in the signal images row-by-row in the following orders: “123456789135792468147158259369483726” for AVM data bundle, “12345613514624” for AV and AM data bundles, and “1231231” for the A data bundle. Please refer to Table 3 for the definition of the data bundles. SIA and DFT stand for Signal Imaging Algorithm and Discrete Fourier Transform, respectively.
Agriculture 13 00738 g006
Figure 7. The architecture of LeNet5 model.
Agriculture 13 00738 g007
Figure 8. Performance metrics defined.
Agriculture 13 00738 g008
Figure 9. Accuracy (left) and loss (right) convergences during the training of the considered recognition models on the green hen AVM dataset.
Agriculture 13 00738 g009
Figure 10. Confusion matrices for the considered recognition models when using the AVM data bundle of the green hen test data.
Agriculture 13 00738 g010
Figure 11. The distribution of green hen data in different test-to-train ratios.
Agriculture 13 00738 g011
Figure 12. LeNet5 test accuracy (a) and loss (b) vs. test-to-train ratios for different data bundles of the green hen dataset.
Agriculture 13 00738 g012
Figure 13. The effect of corrupting the green hen AVM data bundle by Gaussian noises of different levels on the test accuracy (a) and loss (b). The recognition model uses the LeNet5 architecture.
Agriculture 13 00738 g013
Figure 14. The effect of window width and data bundle variations on accuracy of LeNet5 recognition model in the absence and presence of noise corruptions on the green hen dataset.
Agriculture 13 00738 g014
Figure 15. Confusion matrix for the experiment in which the AVM data bundle of blue hen is used for both training and testing of the LeNet5 model.
Agriculture 13 00738 g015
Figure 16. Confusion matrix for the experiment where the combined dataset of both hens is used for training and testing of the LeNet5 model.
Agriculture 13 00738 g016
Table 1. Technical properties of MTw2 Awinda Wireless 3DOF Motion Tracker (www.xsens.com, accessed on 12 December 2022).
ParameterAngular VelocityAccelerationMagnetic Field
DimensionsThree axes3 axes3 axes
Full scale2000 deg/s160 m/s 2 1.9 Gauss
Non-linearity0.1% of FS0.5% of FS0.1% of Fs
Bias stability10 deg/h0.1-
Noise0.01 deg/s/ H Z 0.01 μ g/ H Z 02 mGauss/ H Z
Alignment error0.1 deg0.1 deg0.1 deg
Bandwidth180 Hz180 Hz10–60 Hz (var.)
Table 2. Classification of physical activity of laying hens based on their intensity [26].
Low-IntensityModerate-IntensityHigh-Intensity
Sleep-like restingPreeningWalking
Neck shortening restingForaging & peckingRunning
SleepingDrinking & eatingJumping
Quiet sitting/standingSmall wing adjustmentsWing flapping
Small posturalScratching & stretchingControlled aerial ascent/descent
head/shoulder/neck movementsHead shakingFull-body shaking
PerchingFeather fluffingShaking phase of dust bathing
Egg layingSearching behavior
Side-laying phase of dust bathing
Table 3. Data bundles separately considered for the training of activity recognition models in this study.
Data BundleAxesSignal Image Size
AVMAcceleration—Velocity—Magnetic field 36 × 50
AVAcceleration—Velocity 14 × 50
AMAcceleration—Magnetic field 14 × 50
AAcceleration 10 × 50
Table 4. Adopted LeNet5 properties.
Layer IndexTypeFilter SizeActivationNo. of Filters
1Convolution 3 × 3 Relu6
2Average Pooling 2 × 2 --
3Convolution 3 × 3 Relu16
4Average Pooling 2 × 2 --
5Flatten---
6Dense-Relu-
7Dense-Relu-
8Dense-SoftMax-
Table 5. Shapes of feature maps in each layer of LeNet5 model for different data bundles.
BundleAVMAVAMA
Layer
Input(36 × 50 × 1)(14 × 50 × 1)(14 × 50 × 1)(10 × 50 × 1)
Conv 1(34 × 48 × 6)(12 × 48 × 6)(12 × 48 × 6)(8 × 48 × 6)
Pooling 1(17 × 24 × 6)(6 × 24 × 6)(6 × 24 × 6)(4 × 24 × 6)
Conv 2(15 × 22 × 16)(4 × 22 × 16)(4 × 22 × 16)(2 × 22 × 16)
Pooling 2(7 × 11× 16)(2 × 11 × 16)(2 × 11× 16)(1 × 11 × 16)
Flatten1232352352176
Table 6. Evaluation of performance indices for the considered recognition models when using the AVM data bundle of the green hen test data.
Performance IndexLeNet5ResNet50Shallow Model
Accuracy10.99910.9998
Validation Loss0.00010.00240.0003
Recall 1 1 1 0.9985 0.9995 1 0.9997 1 1
Precision 1 1 1 1 0.9996 0.9250 1 0.9998 1
Average elapsed time for generating an activity image0.6 ms0.6 ms0.6 ms
Average elapsed time for a network inference28.8 ms64.82 ms47.93 ms
Table 7. Evaluation of the performance indices when the AVM data bundle of blue hen is used for both training and testing of the LeNet5 model.
Performance IndexAmount
Accuracy0.9961
Validation Loss0.0027
Recall 0.9844 1 0.9643
   Precision 0.9977 0.9956 1
Table 8. Evaluation of the performance indices when the combined dataset of both hens is used for training and testing of the LeNet5 model.
Performance IndexAmount
Accuracy0.9991
Validation Loss0.0032
Recall 0.9981 1 0.9687
   Precision 1 0.9987 1
Disclaimer/Publisher’s Note: The statements, opinions and data contained in all publications are solely those of the individual author(s) and contributor(s) and not of MDPI and/or the editor(s). MDPI and/or the editor(s) disclaim responsibility for any injury to people or property resulting from any ideas, methods, instructions or products referred to in the content.

