Article

Evaluation of Aspergillus flavus Growth and Detection of Aflatoxin B1 Content on Maize Agar Culture Medium Using Vis/NIR Hyperspectral Imaging

1
Beijing Key Laboratory of Optimization Design for Modern Agricultural Equipment, College of Engineering, China Agricultural University, Beijing 100083, China
2
Key Laboratory of Food Quality and Safety for State Market Regulation, Chinese Academy of Inspection and Quarantine, Beijing 100176, China
3
Crop Genetics and Breeding Research Unit, USDA-ARS, 2747 Davis Road, Tifton, GA 31793, USA
4
Quality & Safety Assessment Research Unit, U. S. National Poultry Research Center, USDA-ARS, 950 College Station Rd., Athens, GA 30605, USA
5
College of Mechanical and Electronic Engineering, Shandong Agricultural University, Tai’an 271018, China
*
Author to whom correspondence should be addressed.
These authors equally contributed to this work.
Agriculture 2023, 13(2), 237; https://doi.org/10.3390/agriculture13020237
Submission received: 30 November 2022 / Revised: 5 January 2023 / Accepted: 16 January 2023 / Published: 19 January 2023
(This article belongs to the Special Issue Sensors Applied to Agricultural Products)

Abstract

:
The physiological and biochemical processes of Aspergillus flavus (A. flavus) are complex. Monitoring the metabolic evolution of products during the growth of A. flavus is critical to the overall understanding of the fungal and aflatoxin production detection mechanism. The dynamic growth process of A. flavus and the aflatoxin B1 (AFB1) accumulation in culture media was investigated with a visible/near-infrared hyperspectral imaging (Vis/NIR HSI) system in the range of 400 to 1000 nm. First, the growth of A. flavus and the synthesis pattern of AFB1 were monitored on maize agar medium (MAM) culture for 120 h with a 24-h time-lapse imaging interval. Second, to classify the A. flavus growth, a principal component analysis (PCA) was employed, and a support vector machine (SVM) model was established with the PC1–PC3 as inputs. The results suggested that the PCA-SVM method could distinguish the A. flavus growth time with a classification accuracy larger than 0.97, 0.91, and 0.92 for calibration, validation, and cross-validation, respectively. Third, regression models to predict the AFB1 accumulation using hyperspectral images were developed by comparing different pre-processing methods and key wavelengths. The successive projection algorithm (SPA) was adopted to distill the key wavelengths. The experimental results indicated that the standard normal variate transformation (SNV) with the partial least squares regression (PLSR) achieved the optimal regression performance with an RC value of 0.98–0.99 for calibration and RV values of 0.95–0.96 for validation. Finally, a spatial map of the AFB1 concentration was created using the PLSR model. The spatial regularity of the AFB1 concentration was comparable to the measurement performed. The study proved the potential of the Vis/NIR HSI to characterize the A. flavus growth and the concentration of AFB1 on the MAM over time.

1. Introduction

Fungi and mycotoxins are widespread in food and feed. Infection with Aspergillus flavus (A. flavus) would reduce the quality of the objects by consuming the nutrients, destroying the physical properties, and eventually producing aflatoxins (AFs) [1,2]. Among all mycotoxins in grains, AFB1 is the most toxic and has been designated as a carcinogenic, teratogenic, and mutagenic agent [3,4,5]. It was affirmed as a Class 1 human by the World Health Organization [2]. Therefore, early detection and control of fungi and toxins are crucial to prevent contaminated substances from entering the production chain [1].
Multiples have been widely used to measure fungi and mycotoxins. The identification of fungal growth has been carried out mainly by measuring the biological properties of fungi, such as the total viable count, metabolite concentrations, and biomass, under specific conditions [6,7]. Aflatoxin detection has been conducted commonly with HPLC, thin layer chromatography (TLC), and enzyme-linked immunity (ELISA) [8,9,10]. The disadvantages of these traditional detection analyses are destructive, labor-intensive, and time-consuming. They are not applicable to rapid detection. Therefore, a non-destructive and rapid detection method is required. Machine vision technology can be non-destructive, but results are unsuitable for low levels of fungal infections or no distinguished features. Near-infrared spectroscopy (NIR) is suitable for the detection of the chemical components of fungi and mycotoxins [11]. However, traditional NIR can only obtain the average spectrum of the detected objects through point sampling, and the spatial distribution of information on the detected object is ignored. As an optical imaging technique, hyperspectral imaging (HSI) generates spatial and spectral data on materials [12], allowing characterizing pixels with spectral information of fungi and toxins within the selected spectral range.
The process of fungal infection and toxin production in grains is complex because it differs among fungal strains and environmental conditions. For example, L-type isolates usually produce fewer toxins on average than S-type isolates, and some L-type strains are non-toxic [13]. Similarly, different environmental conditions may promote or inhibit the growth and development of fungi [14]. With that in mind, the interactions between A. flavus growth and aflatoxin accumulation, even under ideal environmental conditions for growth, are still challenging to monitor and understand their dynamics. In addition, the growth process of A. flavus has accompanied the changes in spore color, colony morphology, and nutrient depletion. Therefore, using Vis/NIR HSI to study the dynamic growth process of A. flavus is necessary.
In available studies, Williams et al. [15] reported the growth of three Fusarium species in the PDA medium at equal time intervals and extracted three characteristic wavelengths associated with the chemical changes of carbohydrate proteins and other proteins during mycelial growth and maturation. Jin et al. [16] employed Vis/NIR HSI to distinguish toxigenic and atoxigenic fungi strains, and the support vector machine (SVM) models achieved 83% and 74% classification accuracies, respectively. Chu et al. [17] applied Vis/NIR HSI to evaluate the active region of A. flavus and A. parasiticus and adopted competitive adaptive reweighted sampling (CARS) to select optical wavelengths. The optimal CARS-SVM classification models with nine optical wavelengths as input obtained discrimination accuracies of 83.33% and 98.15% of the two fungi, respectively. The work of Lu et al. [18] also proved that Vis/NIR HSI can be used to distinguish types of fungi in cereals. Lu et al. applied SPA-SVM models for the differentiation of five kinds of fungi that had been cultivated in one day, and the average accuracy and Kappa coefficient reached 98.89% and 0.97%, respectively. Marin et al. [19] suggested that larger colonies produced a higher toxin accumulation. Pearson et al. [20] used dual wavelengths (750 nm and 1200 nm) to distinguish seriously polluted kernels (>100 ppb) from healthy kernels and showed 99% discrimination accuracy. Wang et al. [21] used a shortwave infrared (SWIR) HSI (1000–2500 nm) united stepwise factor discriminant analysis (FDA) to detect aflatoxin B1 contaminants on grain skin and reported over 88% accuracy.
In general, the current research on fungi mainly focuses on the identification of strain and its early period, with few comprehensive studies on the growth of A. flavus and the accumulation of aflatoxin. Therefore, this research constructed the dynamic growth process of A. flavus in the MAM and monitored it through Vis/NIR HSI. The contents of the current study were to (1) construct a dynamic A. flavus growth and AFB1 biosynthesis model, and acquire time-lapse hyperspectral images; (2) study the growth characteristics in terms of inoculation times and distinguish the fungal growth periods; (3) analyze the spectral differences over sampling time, analyze the AFB1 content, and compare the implementation of the prediction models; and (4) build the multi-spectral model for AFB1 content detection using key wavelengths and create their visualization image maps.

2. Materials and Methods

2.1. Sample Preparation

A. flavus (NRRL 3357) toxigenic strain was obtained from the Institute of Agro-products Processing Science and Technology. The A. flavus strain was cultivated through Potato Dextrose Agar (PDA), at a constant temperature (30 °C) and humidity (60%), and mature conidia were harvested after 7 days. The fresh conidia were separately scraped from the PDA then distilled water was added to obtain spore diluent. To construct an AFB1 biosynthesis model, two 102 and 104 mL−1 conidia spore concentrations with the A. flavus strain were obtained by mixing conidia suspension with MAM. Thus, two treatments (a low concentration and a high concentration) were prepared for culturing A. flavus on the MAM in Petri dishes. A Petri dish plate was poured with 20 mL MAM, and 3 replicated agar plates were prepared. All Petri dishes were incubated for 120 h. One set of samples was taken out every 24 h and refrigerated. Hence, there were 36 Petri dishes (2 treatments × 6 time intervals × 3 replicates) of A. flavus.

2.2. Image Acquisition and Calibration

The Vis/NIR HSI system consisted of an imaging spectrograph (G Series Image-λ-V10-IM, Spectral Imaging Ltd., Oulu, Finland), a CCD camera (Bobcat2.0, Imperx Ltd., Boca Raton, FL, USA), a variable-focal-length lens (Schneider, XENOPLAN, Bad Kreuznach, Germany), a pair of 500 W halogen lamps (Photoflex, Watsonville, CA, USA), and an acquisition system. The resolution of the spectral is 1.78 nm, the pixels are 0.14 nm/pixel, and the exposure time is 32 ms. The sample is 450 mm from the lens, and the motor is translating with a speed of 1.7 cm/s. The collecting spectrum is a range of 380–1012 nm. The wavelength ranges of 380–400 nm and 1000–1012 nm were removed, keeping 400–1000 nm for analysis in order to decrease noise. A total of 36 hyperspectral images were obtained. The intensity of the hyperspectral images was calibrated. Images of the white panel and camera opaque cap were collected as the white reference and black reference images [22], respectively. The correction formula is the following:
R I = L m L d L r L d × 100 %
where RI is the calibration value; Lm is the uncalibrated value; Lr is the white reference value; and Ld is the black reference.

2.3. Quantitative Measurement of the AFB1 Concentration

An HPLC system was used to measure the AFB1 levels. The sample preparation for AFB1 detection on MAM was performed using the modified method of AflaStarTM R immunoaffinity column. The buffer solution with pH 7.4 was prepared, and the extracting solution was acetonitrile/deionized water with a ratio of 84:16. Subsamples were selected from the MAM surface. The selected subsamples were placed in a centrifuge tube of 5 mL, then 2 mL of extracting solution was injected into a centrifuge tube and agitated for 90 min. After, 1 mL of the supernatant and 4 mL of buffer solution were mixed. The mixed solution of dilute was added to the syringe. The 72–96 h sample was diluted twice before being added to the syringe. The dilution corresponding to 72–96 h of culture was 1 mL, and the corresponding dilution for 120 h of culture was 0.1 mL due to the high level of AFB1. The immunoaffinity column was rinsed twice with 5 mL of buffer solution, then rinsed with 5 mL of deionized water to remove impurities in the sample. After the eluent was completely emptied, the immunoaffinity column was eluted of AFB1 samples with 1 mL methanol for HPLC analysis.

2.4. Data Analysis

From each calibrated hyperspectral image, two wavelength ranges (380–400 nm and 1000–1012 nm) were discarded from the analysis because of high levels of noisy reflectance responses in these wavelength regions. A total of 336 wavebands between 400 and 1000 nm were analyzed. Each calibrated hyperspectral image was cropped to 300 × 300 pixels spatially, and a mosaic of the cropped hyperspectral images was constructed for each growth period. Then, a circular region smaller than the diameter of the plate was chosen to create the region of interest (ROI), following obtained average spectra from each ROI. Nine ROIs with the same diameter on each plate were created, and the reflection spectrum was obtained for the qualitative analysis of A. flavus growth. Finally, 162 (9 ROIs × 6 time intervals × 3 replicates) samples of spectral data were obtained for each treatment. The extracted data were randomly partitioned into calibration and validation sets according to 2:1. Similarly, for the quantitative analysis, there were 18 samples (1 ROI × 6 time intervals × 3 replicates) for each treatment that were randomly grouped at a ratio of 2:1. All these operations were performed using ENVI (v. 5.3, L3Harris Geospatial, Boulder, CO, USA).
In this study, the method of PCA and classifier of SVM were adopted for the characteristics of the A. flavus growth period. PCA is a dimension reduction statistical method. By mapping the raw variables onto a collection of variables (principal components, PCs) that are mutually orthogonal, it is possible to preserve the greatest variety of data points in the raw spectral space. Weighted sums of original variables are represented by scores in the PC space without losing key information. PCA score plots display related pixel groupings that are clustered together. The loading plots, which are the variable’s coefficient multiplier, were used to describe the relationship between the PCA score and the key wavelengths. The principal component score is calculated using the following formula:
T = X B + Q
where T represents the principal component score matrix; X represents the primitive variable matrix; B represents the load matrix; and Q represents a residual matrix.
SVM is a machine learning algorithm that shows sensitive preponderance in dealing with small samples and high-dimensional data [23]. Thus, we initially used PCA to reduce the dimensions and extract the PCs with high scores related to fungi. Subsequently, the extracted PCs were used as the input of the SVM classifier to distinguish the growth period of A. flavus.
The extracted spectral data usually contained noise due to light scattering as well as instrumental noise. Thus, it was vital to remove the background noise before data analysis. In this study, the first derivative (FD) and standard normal variate (SNV) were applied as pre-processing techniques. The FD was used to correct the baseline and eliminate the background noise. The SNV was utilized to reduce the impacts of particle size and optical path variation [24]. Hyperspectral images usually have a high dimensionality that causes a degradation in model performance. Therefore, it is significant to select useful wavelengths for reducing the data dimensions. The successive projection algorithm (SPA) is a suitable method for picking the key wavelength by calculating the projection vector of a wavelength on the remaining wavelength and extracting the wavelength with the largest projection vector as the key wavelength [25].
Partial least squares regression (PLSR) is an effective chemometric technique, projecting all dependent and independent variables to another space with reduced dimensionality [26]. The PLSR was carried out to quantitatively predict the AFB1 contents in this study. The changes in the AFB1 content at different culture sampling times were visualized spatially using prediction images of the AFB1 accumulation generated by the PLSR model.
Sensitivity, specificity, confusion matrix, overall accuracy, and Kappa coefficient were applied to assess the capability of the established qualitative model [18]. Sensitivity refers to the proportion of true samples with correct prediction in all true samples, that is, the true positive rate, which represents the ability of the model to test true samples. Specificity represents the proportion of false samples with correct prediction in all false samples, that is, the true negative rate, reflecting the model’s ability to test false samples. The classification accuracy is measured by the number on the diagonal in the confusion matrix. A high number represents a high classification accuracy. The overall accuracy of the confusion matrix is expressed as a percentage of properly identified samples over the entire sample. Generally, the calculation of the Kappa coefficient is based on the confusion matrix. The Kappa coefficient is used to assess classification accuracy. When the value of Kappa is greater than 0.8, it indicates that the model has high precision.
The performance of the regression model was measured by the correlation coefficient (R), root mean squared error (RMSE), and residual predictive deviation (RPD). The correlation coefficient of calibration RC and validation RV was used to assess the goodness of fit of the model. A better regression model corresponds to a high value of R. The deviation between the real value and predicted value was expressed by RMSE. The predictive power was assessed by RPD.

3. Results and Discussion

3.1. Critical Growth Characteristics of A. flavus in Culture Media

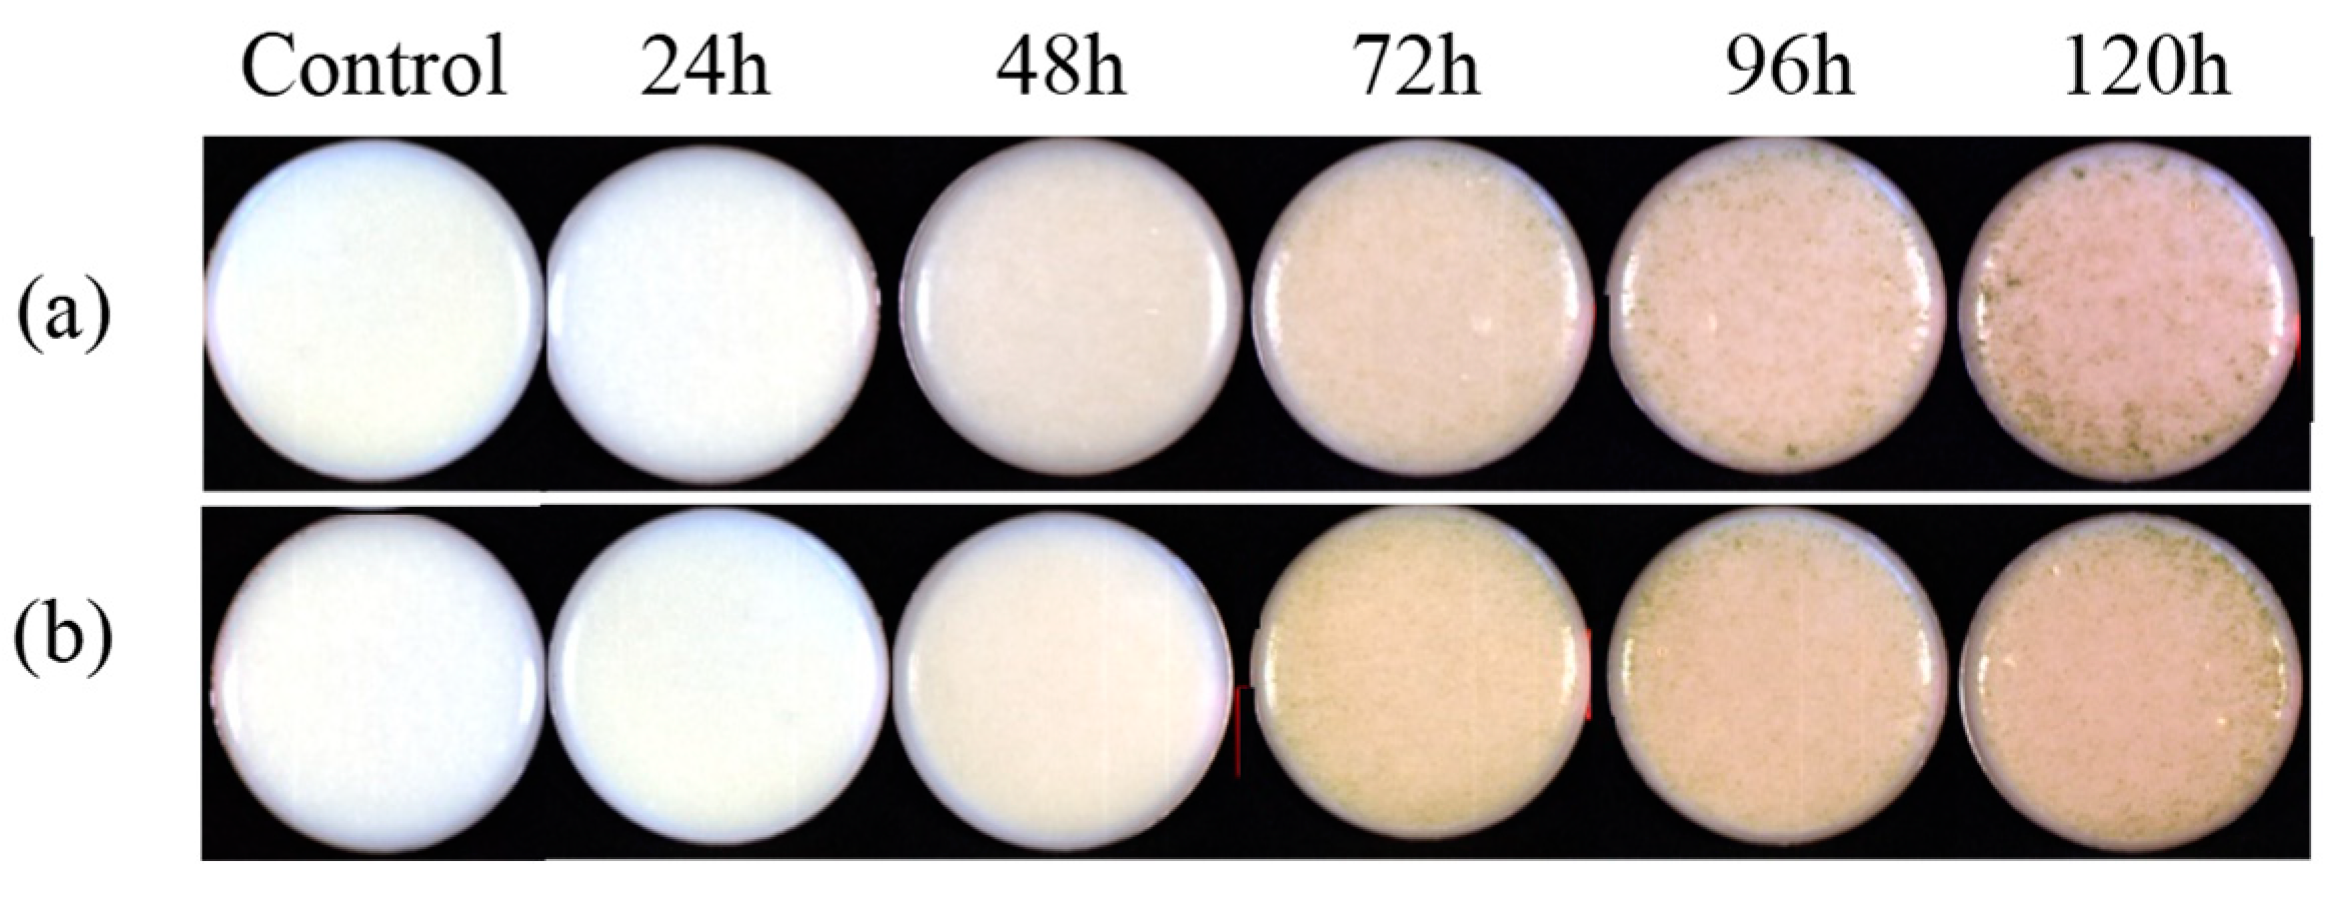
3.1.1. Image Information of A. flavus Growth

Time-lapse hyperspectral images of A. flavus on the MAM plates were visualized with pseudo-color images (blue: 459 nm, green: 550 nm, red: 640 nm). As shown in Figure 1, the individual color images were stitched into mosaics for analysis, where the rows and columns represented different concentrations and growth durations of culture days, respectively. After 24 h of incubation, all treatments of A. flavus strains showed fine white mycelia on the MAM, but the color was not readily distinguishable from the MAM. The cultures grew a small number of mycelia after 48 h. After 72 h, the number of spores in all treatments increased and the color of spores changed to yellowish green. After 96–120 h, the edges of the Petri dishes were covered with yellow-green spores while the central areas of the Petri dishes showed fewer spores. That may be due to the uneven density of the two inoculums in the Petri dishes.

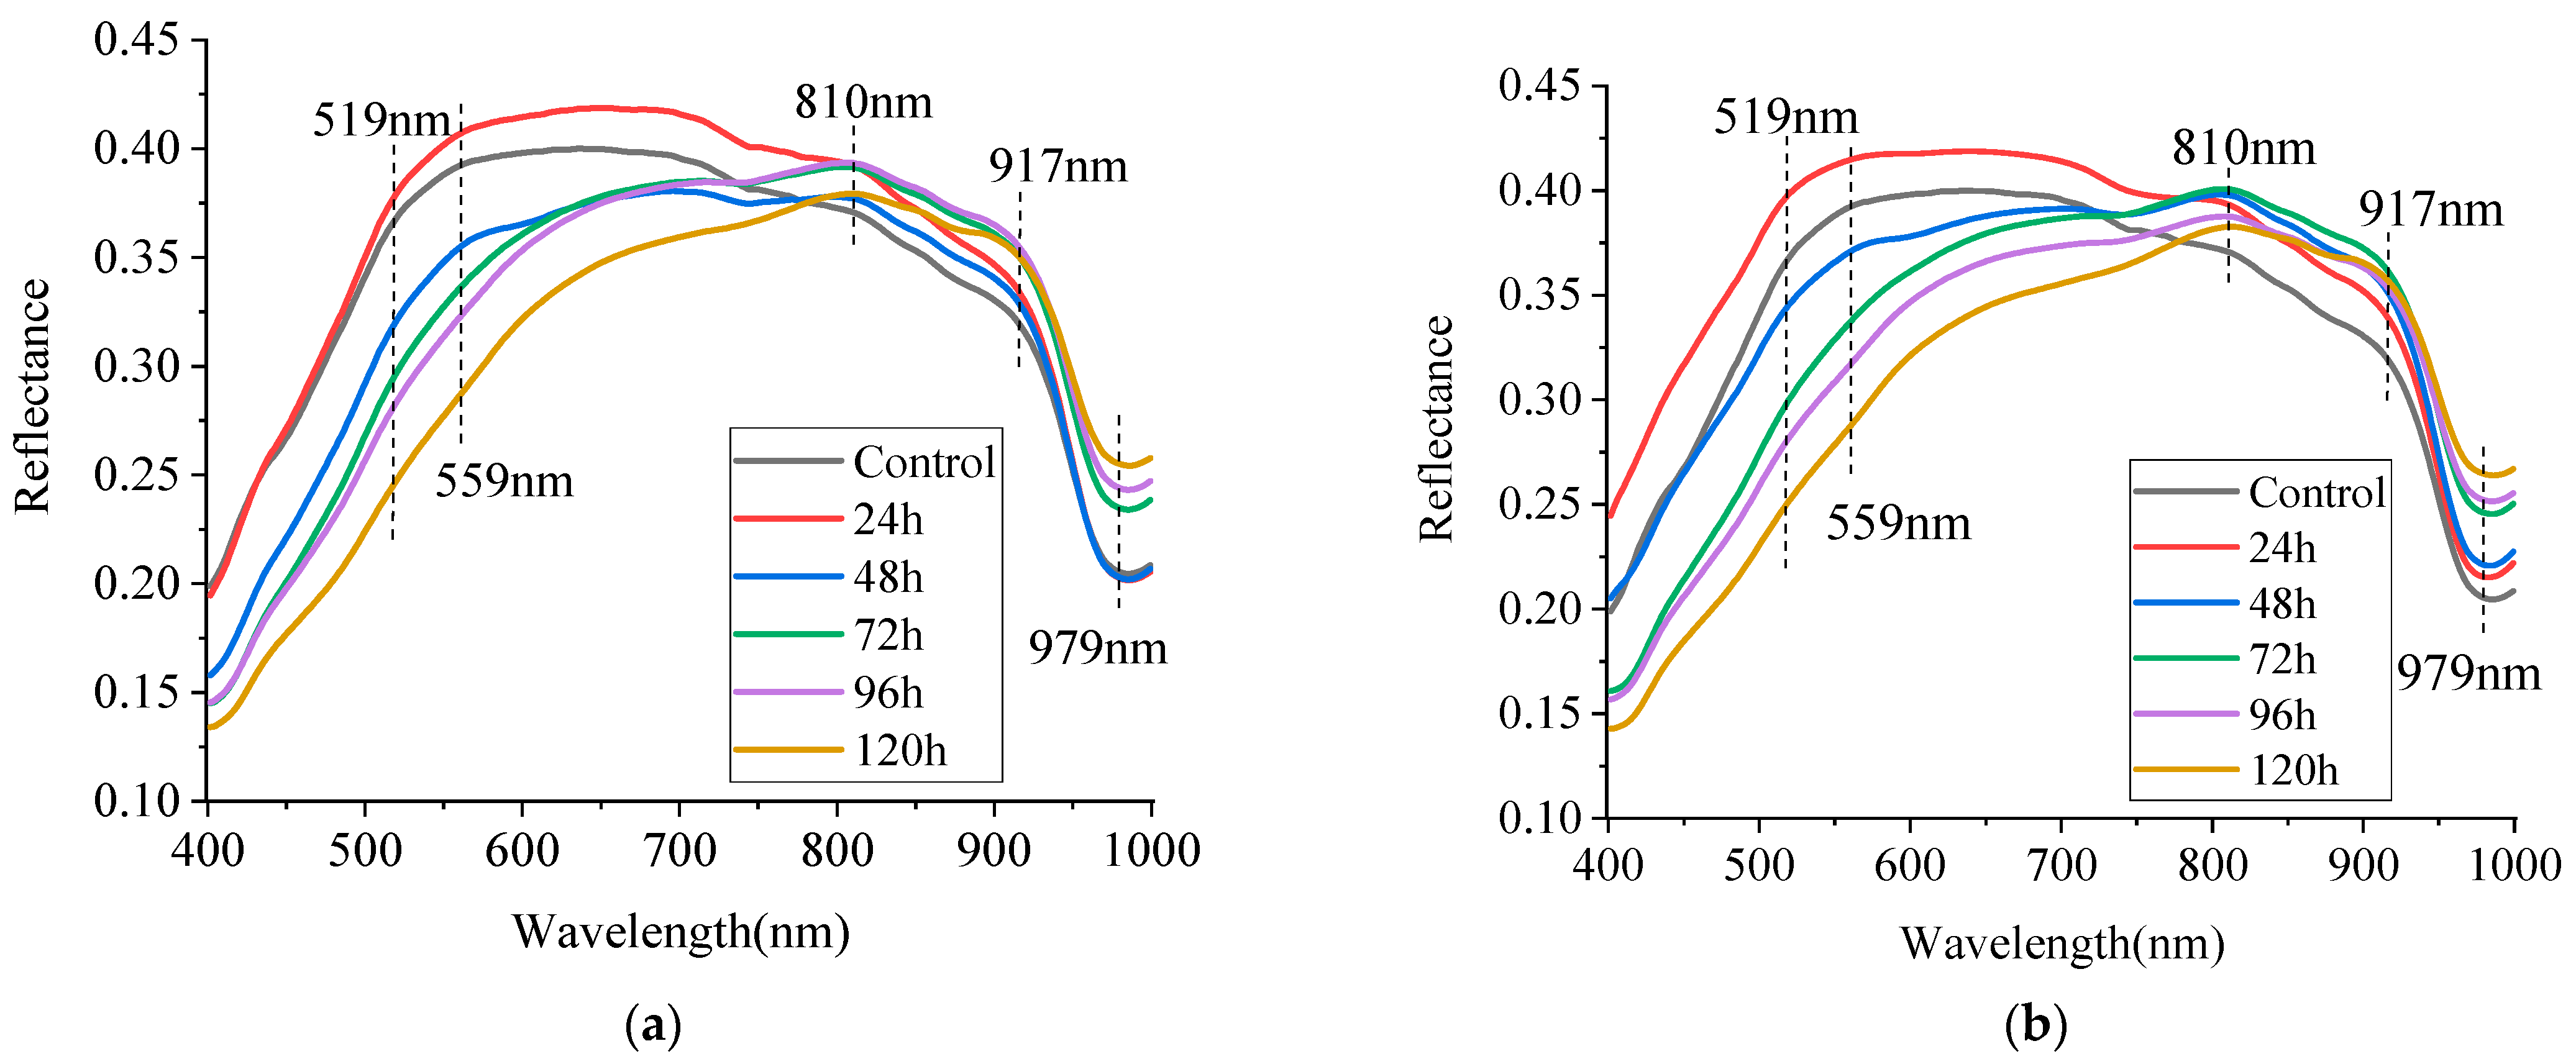
3.1.2. Spectral Characteristics of Fungal Culture in Maize Agar Medium

The raw mean reflectance spectra at different culture sampling times of A. flavus are presented in Figure 2. The spectral curves of the two treatments are bell-shaped with similar trends. During the first 24 h of cultivation, the abundant white mycelia mainly contributed to the higher spectral reflectivity in the color wavelength range below 750 nm. As the incubation time increased, fungal colonies changed from vegetative growth (mycelium) to reproductive growth (spores), conidia began to form, and the yellow-green conidia caused a decrease in overall spectral reflectance. From 96 to 120 h, the spectral reflectance dropped to a more pronounced level as the spore color darkened.
In the visible range, spectral reflectances around 519 and 559 nm were related to the pigment of MAM. The range of 780–1000 nm, as well as 810 nm, 917 nm, and 979 nm, were dominant. The wavelength at around 917 nm was generally correlated with the third overtones of C-H stretching modes that were caused by the changes in fatty acids [27]. Additionally, the valley at around 979 nm was associated with the vibration of the O-H bond in the molecules of H2O.

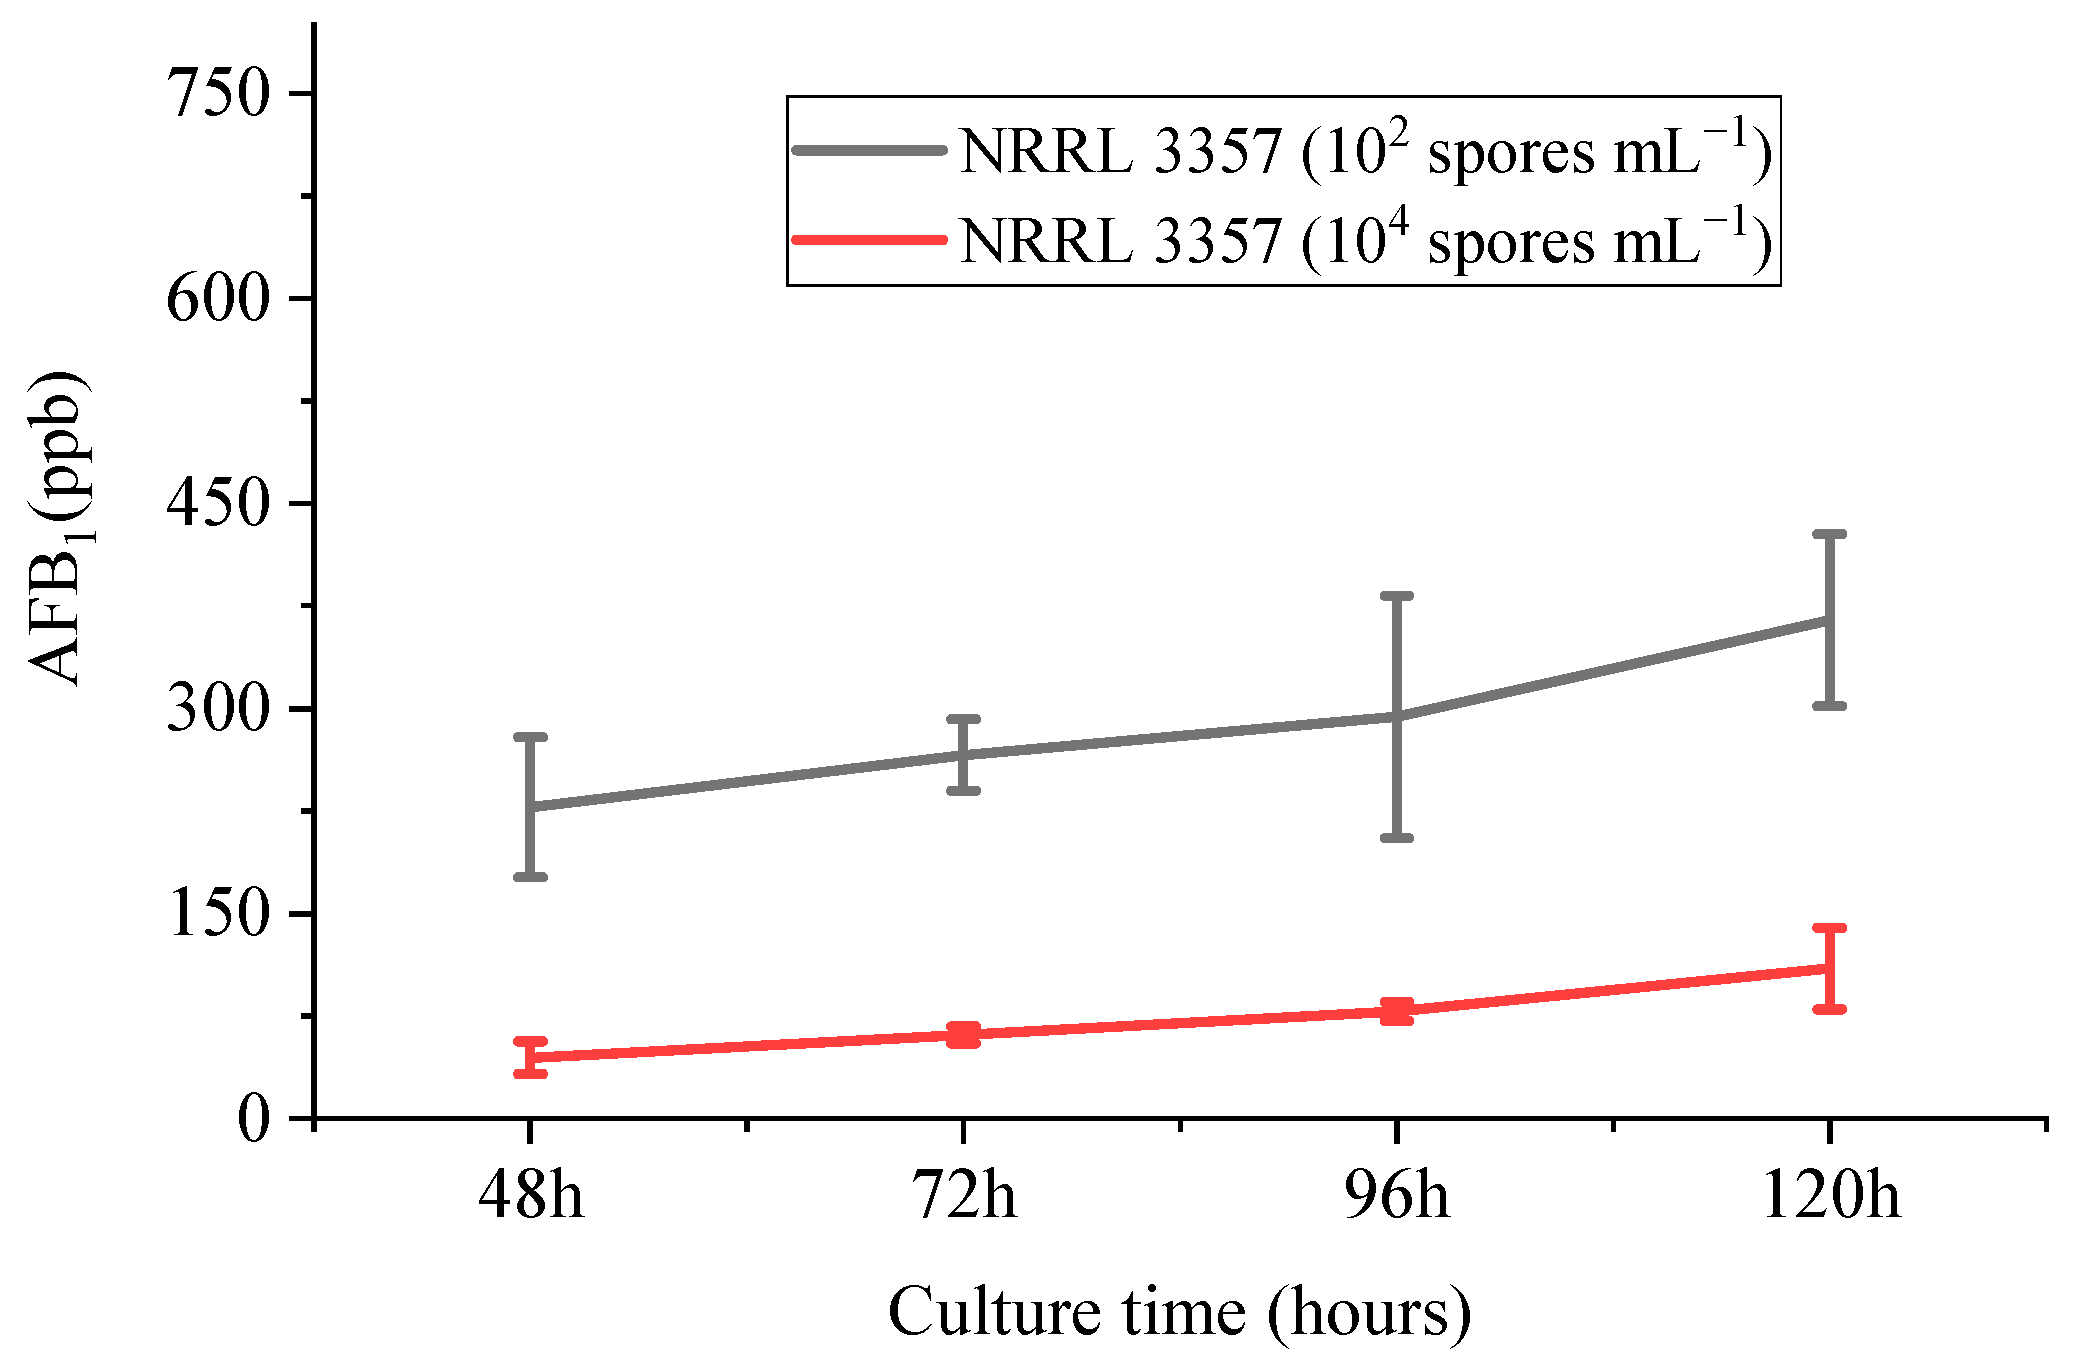
3.1.3. HPLC Analysis of AFB1 Accumulation

The AFB1 concentrations measured with HPLC were investigated using a one-way analysis of variance. Statistical analysis results of the AFB1 concentrations for each treatment are presented in Figure 3. The results showed that different inoculation concentrations (p < 0.05) had a significant effect on the accumulation of AFB1, and there was a statistically significant interaction in the inoculation stage (p < 0.05). These results demonstrated a marked difference between the two cultures, but these differences changed over time. The difference level between the low-density inoculation and the high-density inoculation reached the maximum at 120 h.
Over the whole culturing period, the AFB1 concentrations varied depending on the applied inoculation method. When the AFB1 content was examined in the time series, there was only a small amount of AFB1 detected at 24 h, possibly due to the initial period of A. flavus spore germination and fungal hyphal growth. However, after 48 h, the AFB1 levels in each treatment increased significantly, as reported by Mellon et al. [28]. Furthermore, when comparing the aflatoxin accumulations in terms of treatments at each time point, the AFB1 level from the low-spore inoculation treatment was higher than the high-spore inoculation treatment. In addition, in our previous study, the experimental results showed that no AFB1 was detected when the inoculation concentration was 106 spores mL−1, indicating that AFB1 was not synthesized under this treatment. This result was consistent with the study of Amare and Brow [29,30] and suggested quorum sensing [31] during the growth of A. flavus.

3.2. Identification of the A. flavus Growth Period

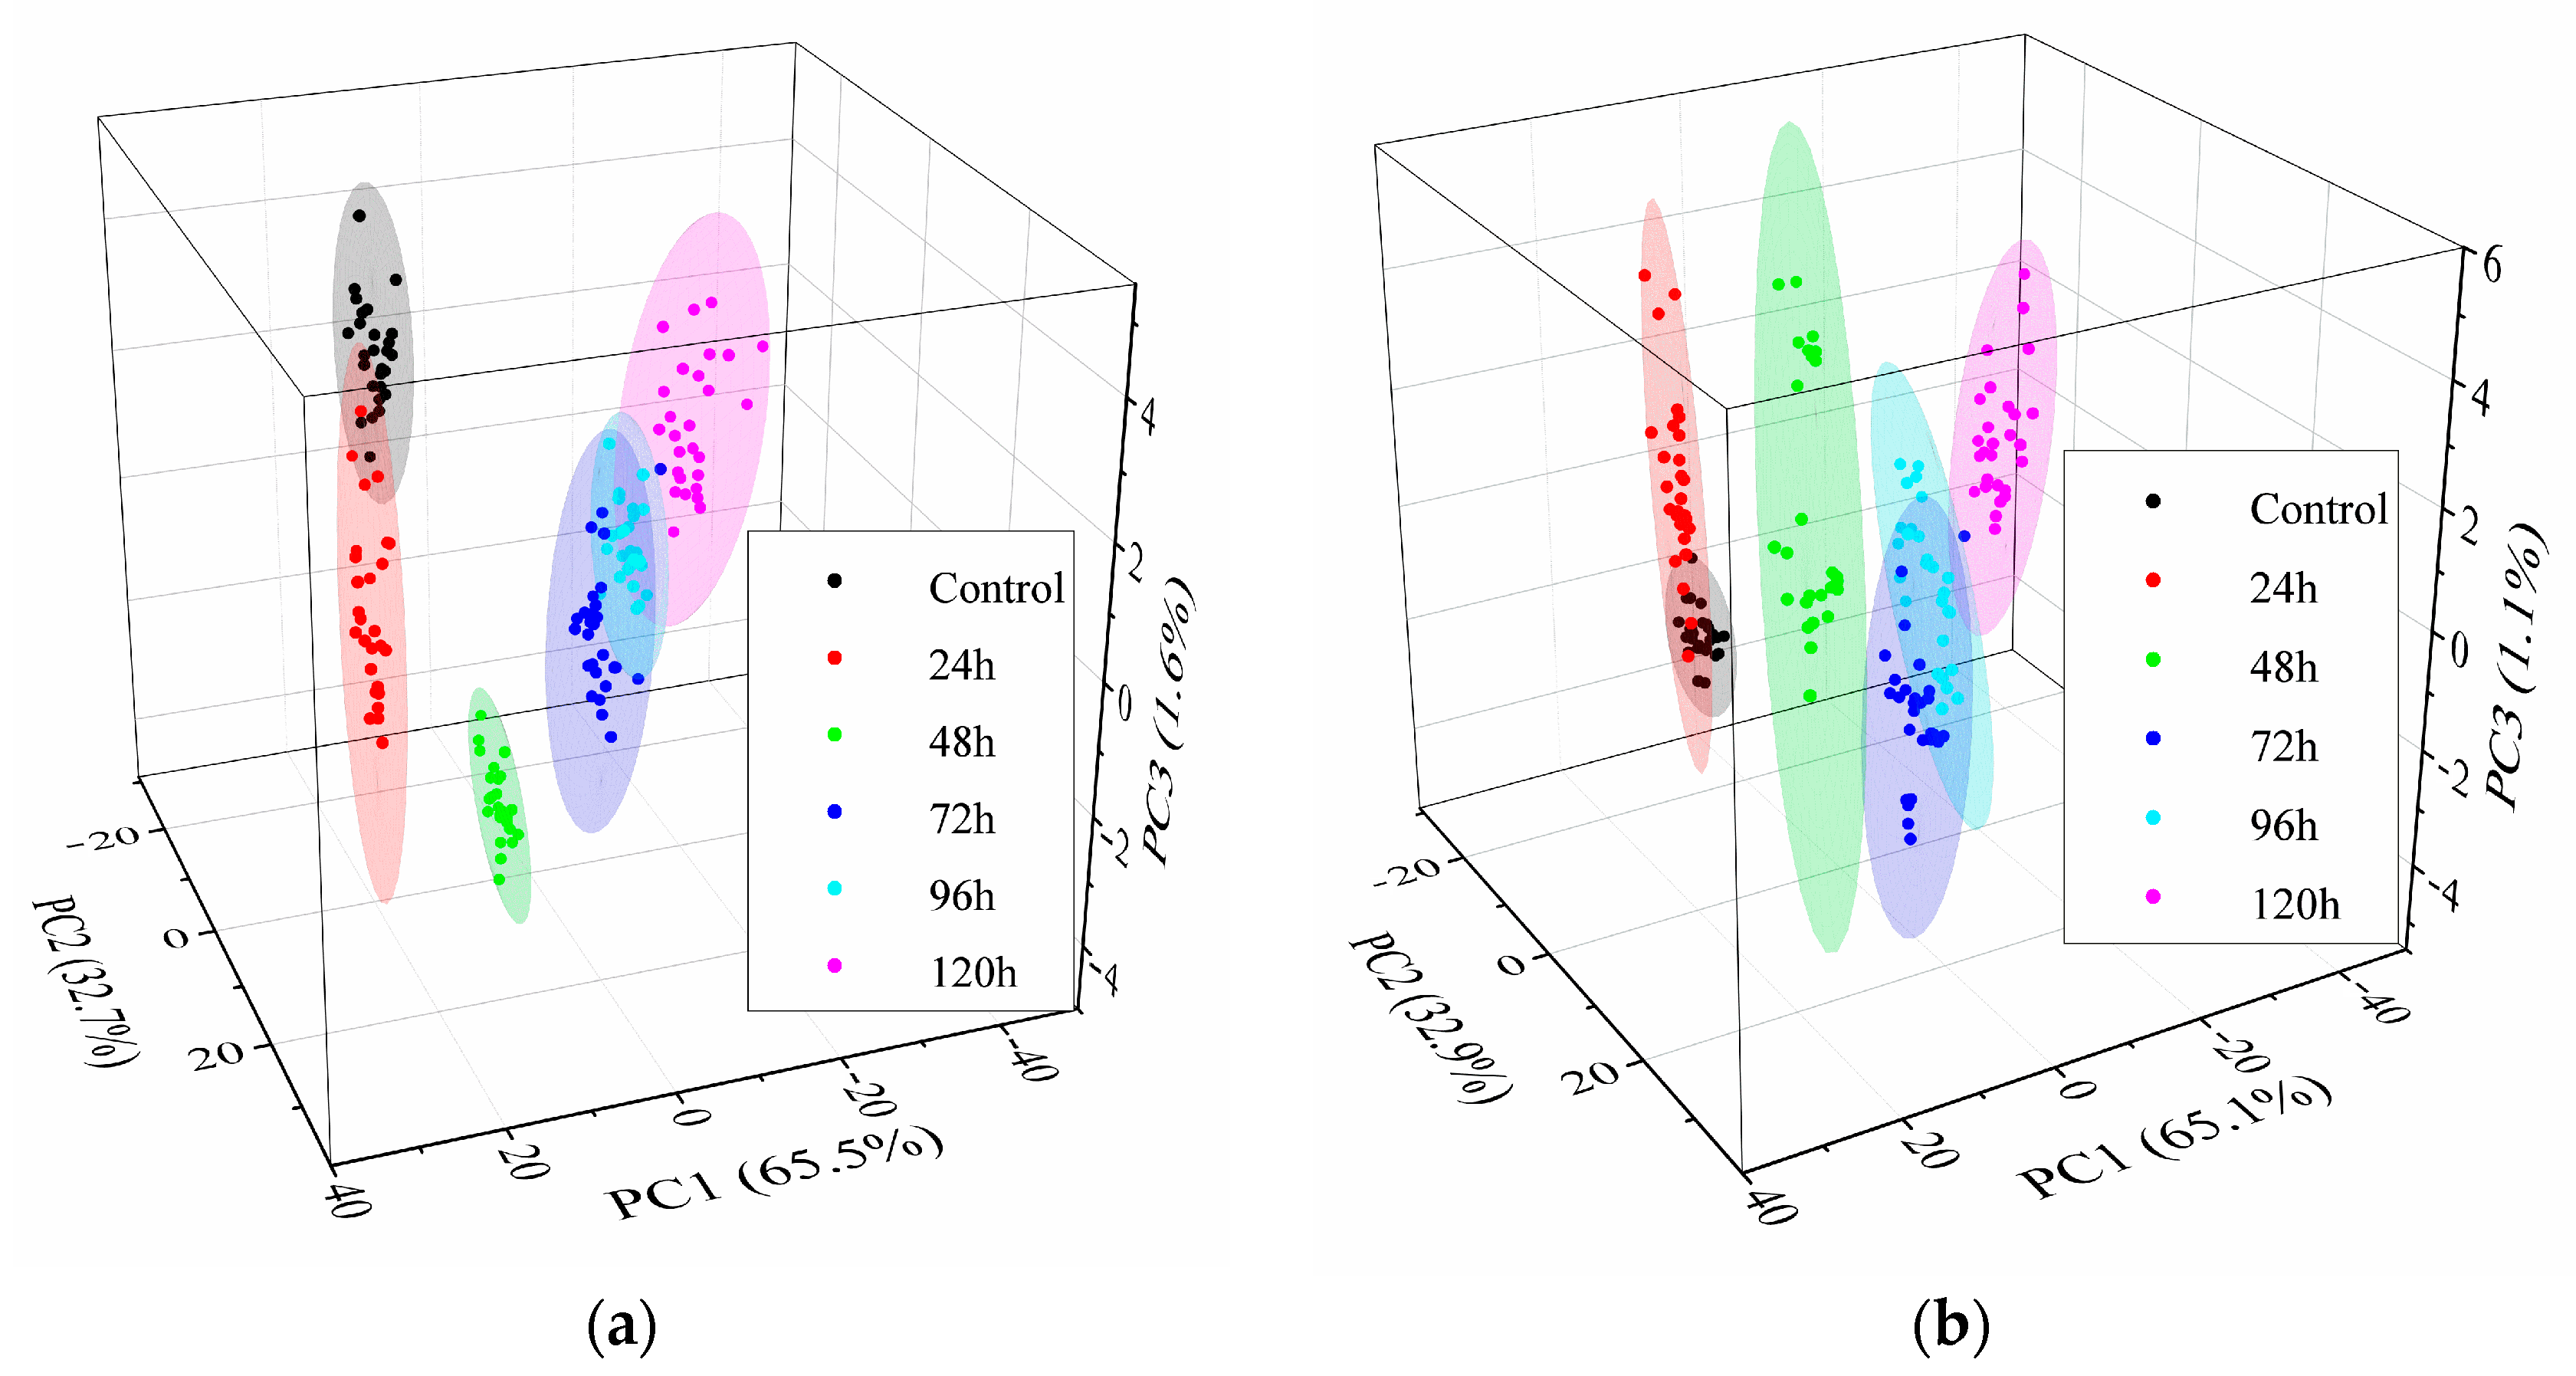
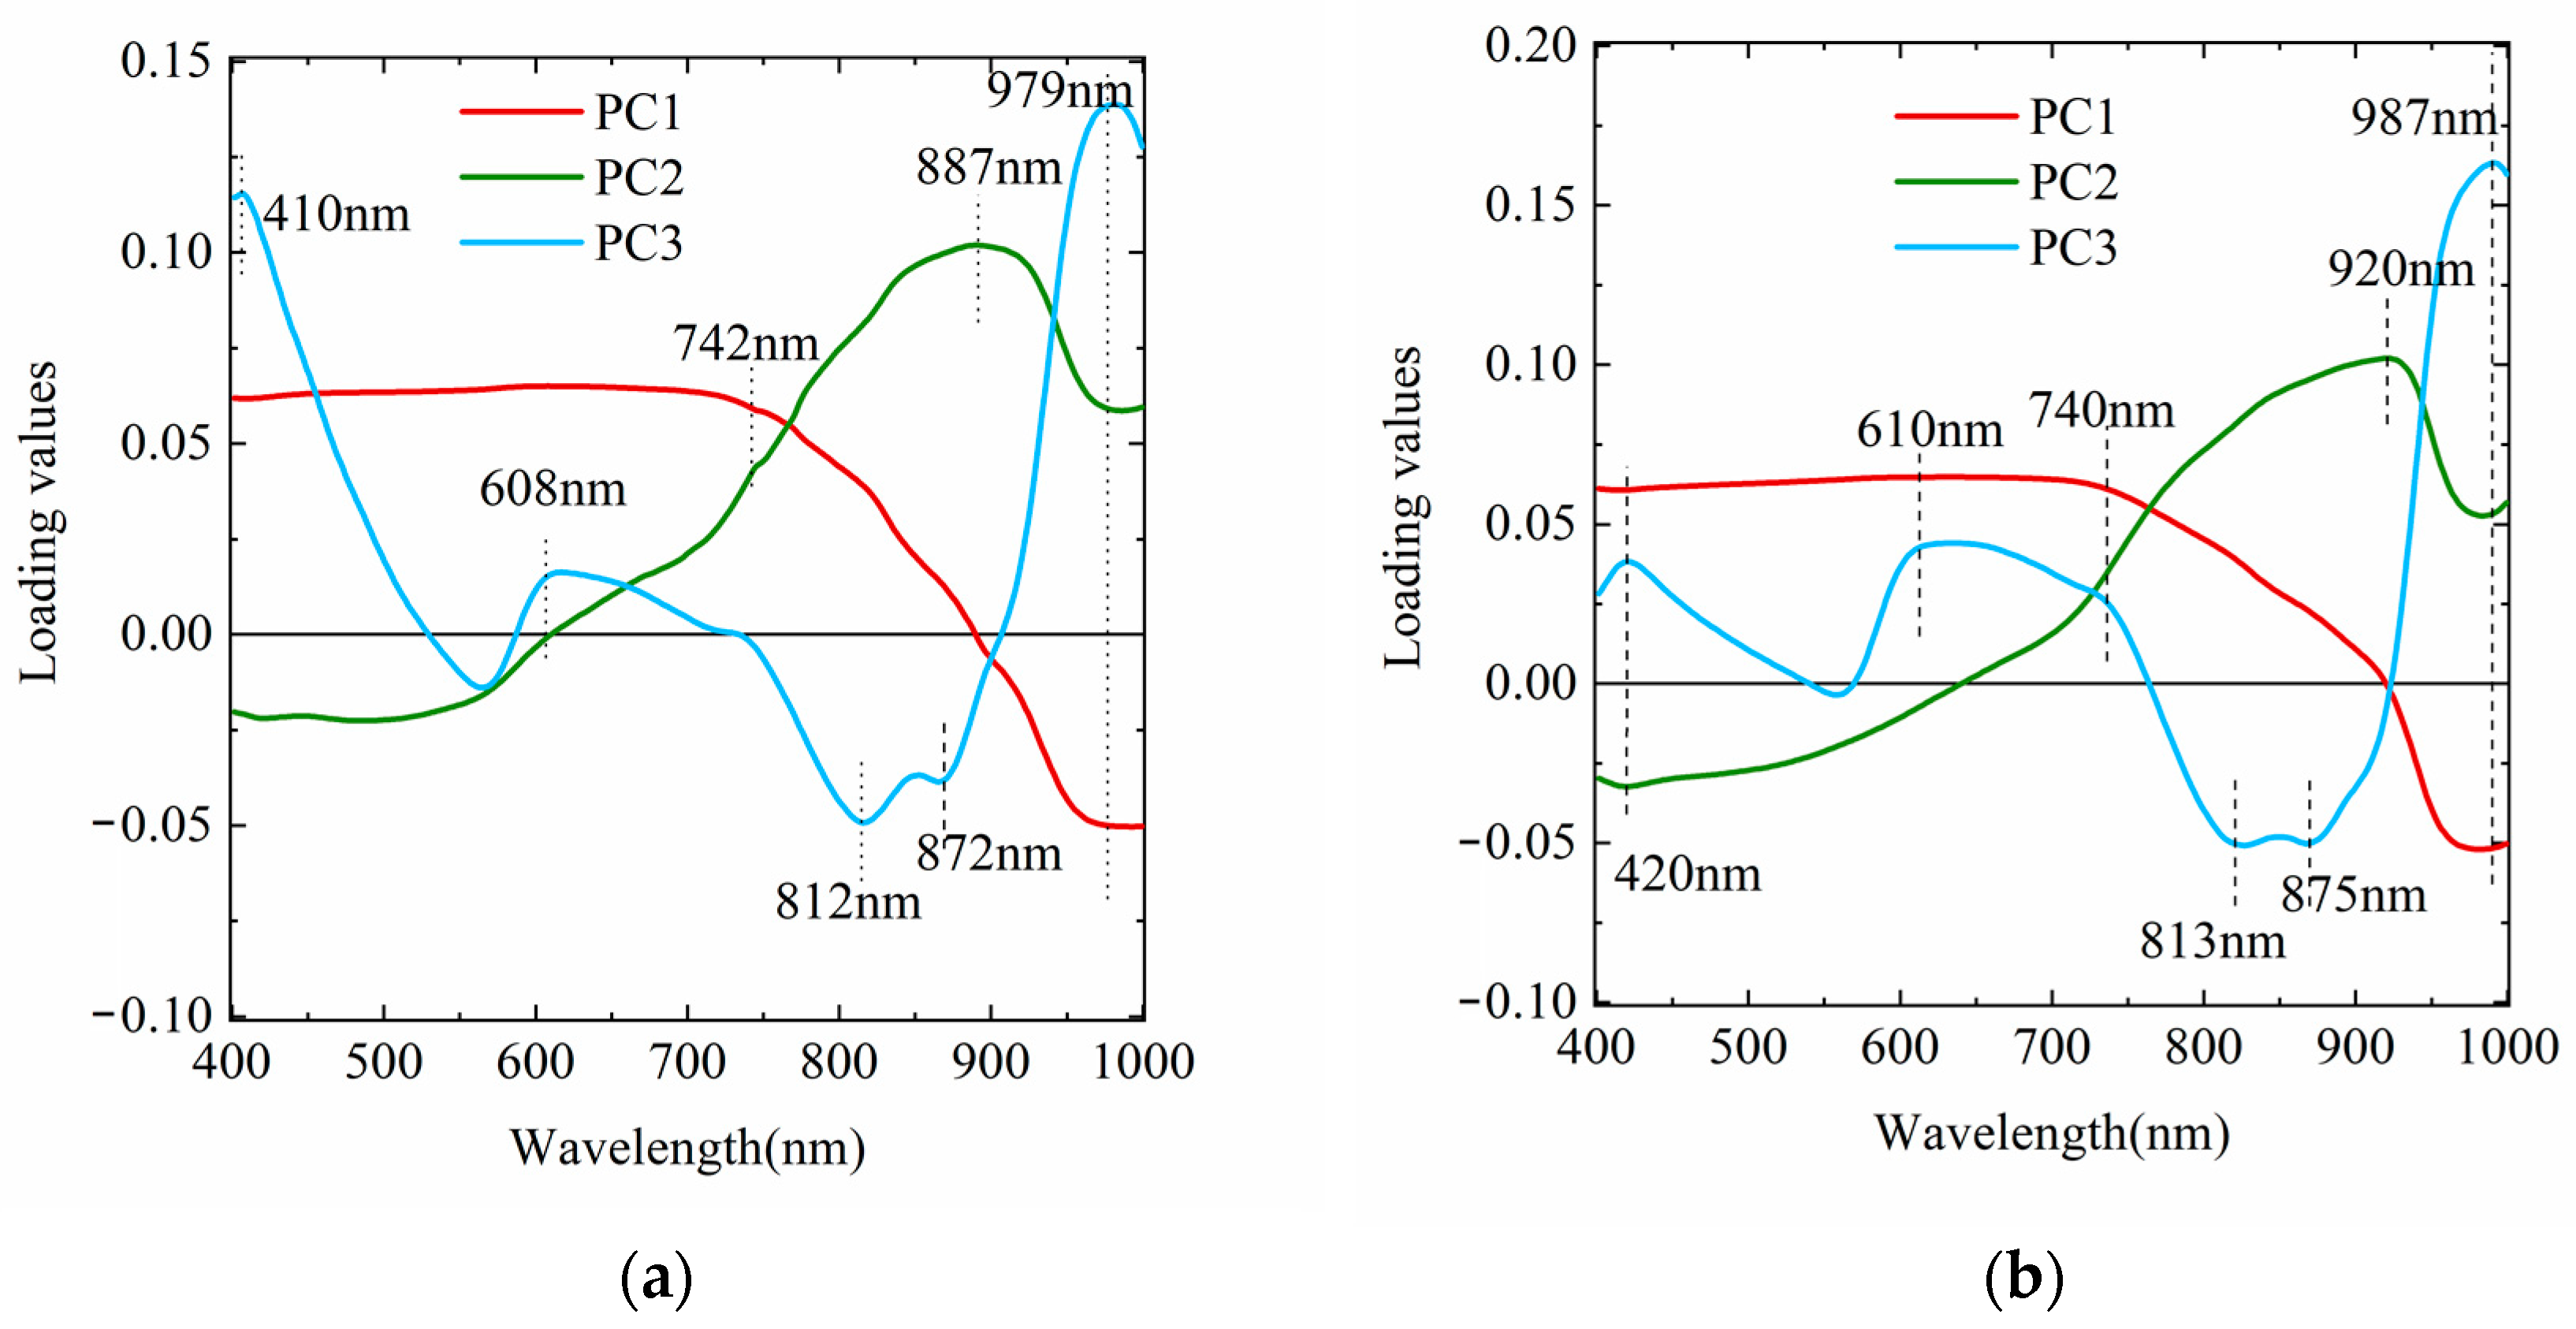
3.2.1. Identification of the A. flavus Growth Period by PCA

The PCA analysis method was used to distinguish the growth period of A. flavus. The contribution rates of the first three PCs of low-density inoculation was 65.5%, 32.7%, and 1.6%, respectively, and the high-density inoculation was 65.1%, 32.9%, and 1.1%, respectively (Figure 4). More than 99% of the original data information was explained. The score maps of the PC1, PC2, and PC3 are presented in Figure 5. From the score maps, the growth periods of A. flavus can be differentiated under two treatments. Samples can be clearly separated at almost all the time intervals, and only a few samples could not be easily separated at 72–120 h.
The dynamic growth of A. flavus in the MAM caused the curve of spectrum difference. At the same time, the first PCs mainly interpreted the change in spore color and the nutrient of the MAM [18]. Then, the loading plots of the PC1, PC2, and PC3 were plotted to further explain the corresponding changes in spectral signal (Figure 5). Wavelengths, such as 410, 420, 608, 610, 740, and 742 nm, in the loading plots corresponded to the spore color differences. Additionally, wavelengths around 812 (813), 872 (875), and 979 (987) nm were associated with the change in chemistry among the A. flavus growth. In addition to the 810 nm, and the 979 nm mentioned in Section 3.2.1, the 872 (875) nm is related to the third-order overtone of the N-H structure in the protein or in the aromatic ring, which is the basis of the cell wall.

3.2.2. Identification of the A. flavus Growth Period based on PCA-SVM

Three variables (the first three PCs), instead of the full band spectrum, were used as input for the SVM classifier to establish the growth period classification model of A. flavus. The performance of the models is exhibited in Table 1. With the two inoculation methods, the accuracy of the models was greater than 0.97, 0.91, and 0.92 for the calibration set, validation set, and cross-validation, respectively. The results showed that the PCA-SVM classification method can accurately identify the growth period of A. flavus. At the same time, the results of cross-validation also demonstrated the excellent stability of the classification models.
By observing the confusion matrix, the growth period of misclassification was further analyzed (Table 2). While the model can accurately identify the A. flavus at 24 h, 48 h, and 120 h, only one sample was misclassified in the control group at 24 h. The misclassification primarily appears in 72 h to 96 h due to the physical color of spores and mycelia being resemblant. Still, the sensitivity and specificity of A. flavus were above 0.93 and 0.78, the accuracy reached 0.97 and 0.94, and the kappa coefficient was above 0.933, which indicated that the growth periods were accurately identified.

3.3. Detection and Prediction of AFB1 Content in the Culture Medium

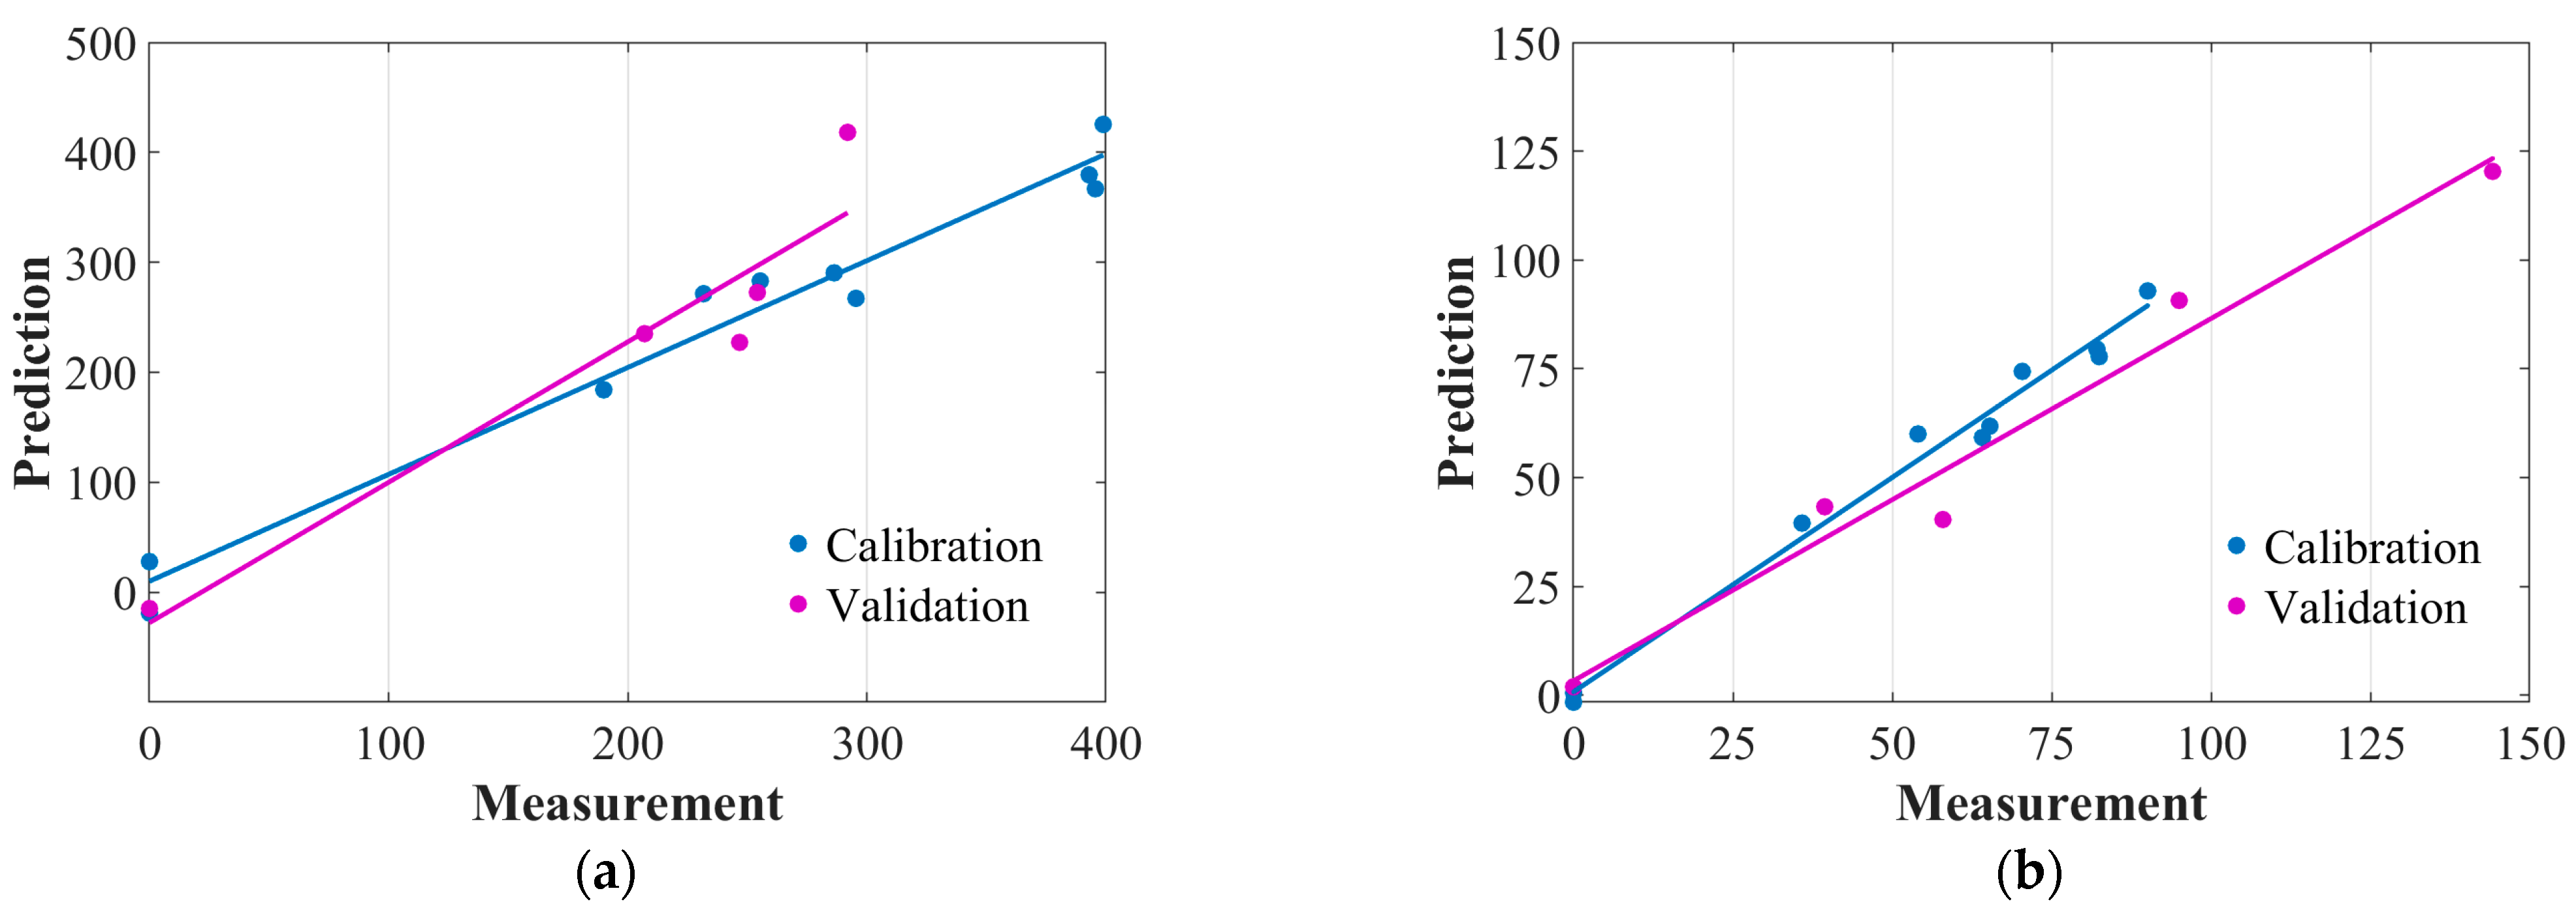
3.3.1. Hyperspectral PLSR Models

Regression models to predict the aflatoxin in terms of incubation time were established using hyperspectral data in full wavelength ranges. The SNV and the FD were applied to the hyperspectral data as preprocessing for the models. The performances of the PLSR among the two types of inoculation methods are displayed in Table 3, with the optimal results marked in bold font. The PLSR regression models ranging from 400–1000 nm predicted the AFB1 content with an RC of 0.91–0.95, RV of 0.87–0.94, and RPD of 1.99–2.54.

3.3.2. Development of Multispectral PLSR Models

To obtain a parsimonious model, multispectral PLSR models based on a few key wavelengths were developed. The SPA algorithm selected seven and six key wavelengths for each culture method type, respectively (Table 4). After the MAM inoculation of A. flavus conidia, the surface color and internal components were changed, which affected the spectral signal of the medium. Key wavelengths, such as 559, 873, and 979 nm, were considered several times. They were associated with cell walls, fatty acids, and moisture in cells. This result was also consistent with the result of Section 3.1.2 and Section 3.2.1. The spectral response at the vicinity of 873 nm was a response to the third overtone of the N-H structure in amino acids, important components of proteins in the furan ring. This also illustrates that the growth of A. flavus is closely related to the production of toxins.
Then, multi-band quantitative models were developed for two types of culture methods (Table 5 and Figure 6). The SPA-PLSR models achieved an RC of 0.98–0.99 and RV of 0.95–0.96, respectively. Although the number of bands had decreased from 336 to 7 and 6, the multi-band models had similar or better performances than the full-band models. The results implied that the developed multispectral models were optimized parsimonious models of just a few key wavelength variables with better predictive power than the hyperspectral models.

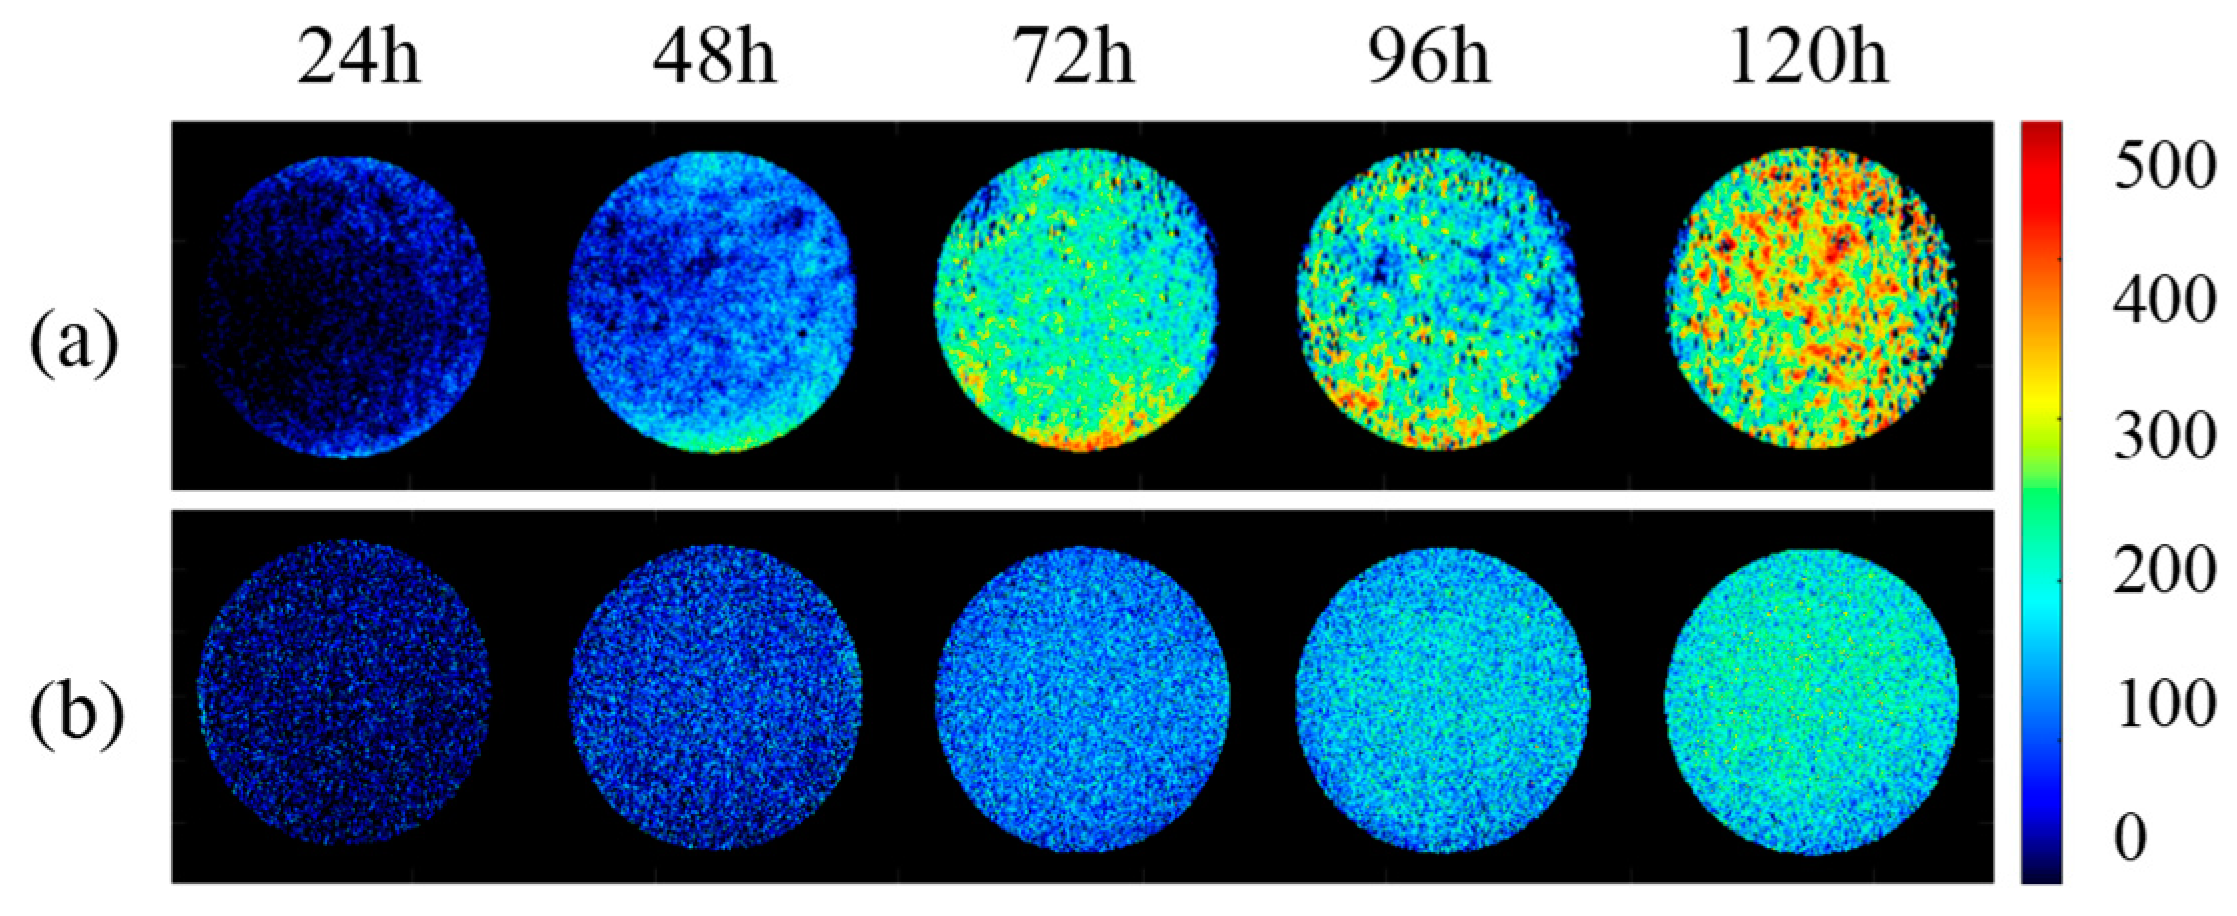
3.3.3. Prediction Image of AFB1 Content

A prediction image, similar to a heat map, was used as a visualization tool to observe the variation of content in the spatial dimension, with each pixel quantitatively displaying the level of AFB1 content with different colors. The prediction images for different culture durations and inoculation types are shown in Figure 7. The color from cold to warm indicates the concentration value of AFB1 from low to high.
The changes in the levels of AFB1 over time were easily observed from the prediction image. The level of AFB1 production, when inoculated with a low concentration of conidia, became higher than that when inoculated with a high concentration of conidia (top rows in Figure 7), which was consistent with the quantitative chemical analysis of AFB1 concentration using the HPLC. The results indicated that the optimal model could be established based on multispectral data to predict the level of AFB1 concentration at each pixel, although the predicted results could not provide accurate (or quantitative) AFB1 concentrations at each pixel. When the predicted results were expressed in different colors, it enabled us to qualitatively analyze the differences in AFB1 concentrations of different culture types spatially (among locations on culture medium) and temporally (among sampling intervals). The findings of the current basic research from culture medium have significant ramifications in detecting and sorting A. flavus infected, as well as aflatoxin contaminated, crop seeds.

4. Conclusions

The Vis/NIR hyperspectral imaging technique was used to examine the growth characteristics of A. flavus inoculated on the MAM and detected the dynamic changes of AFB1 levels among different cultural methods.
Different conditions for AFB1 biosynthesis were achieved by inoculating the medium with different densities of toxigenic A. flavus conidia for different periods of time. The level of AFB1 was different in the imparity growth environments of A. flavus. The inoculation with low conidia concentration synthesized higher levels of AFB1 than the treatments with high conidia concentration on the MAM.
PCA and PCA-SVM methods were applied to distinguish the growth period, and results showed that the PCA-SVM method was the most effective. A quantitative PLSR model with full spectra achieved RC values of 0.91–0.95, RV values of 0.87–0.94, and RPD values of 1.99–2.54. To make the model more available, key wavelengths were chosen to establish multi-spectral models, achieving RC values of 0.98–0.99, RV values of 0.95–0.96, and RPD values of 1.58–2.42. Then, spatially distributed visualization maps were calculated using the simplified model, and the AFB1 concentration regularity was in accordance with the measurement by the HPLC analysis. Results indicated the potential of the HSI to detect A. flavus growth and AFB1 content on a culture medium, which has significant implications for detecting and sorting A. flavus infection and aflatoxin contamination on crop seeds.

Author Contributions

Conceptualization, X.G. and B.J.; Methodology, X.G.; Software, X.G., B.J. and H.Z. (Haicheng Zhang); Validation, B.J., H.Z. (Haicheng Zhang) and X.N.; Formal analysis, B.J., X.N., H.Z. (Hong Zhuang) and Y.L.; Investigation, X.G., B.J., X.N. and H.Z. (Hong Zhuang); Resources, W.W.; Data curation, Y.L.; Writing—raw draft, X.G.; Writing—review & editing, X.G.; Visualization, X.G., X.N., Y.L. and W.W.; Supervision, W.W.; Funding acquisition, W.W. All authors have read and agreed to the published version of the manuscript.

Funding

This research was funded by the National Key Research and Development Program of China (2018YFC1603500), the National Natural Science Foundation of China (31772062), and Jiangsu Province and Education Ministry Co-sponsored Synergistic Innovation Center of Modern Agricultural Equipment (XTCX2016).

Institutional Review Board Statement

Not applicable.

Data Availability Statement

All the necessary data were contained in the paper.

Acknowledgments

We thank Fuguo Xing at the Institute of Agro-products Processing Science & Technology, Chinese Academy of Agricultural Sciences for providing the strain (NRRL 3357). We thank Yelin Liu, technical director of Jiangsu Dualix Co., Ltd. for help with the data collection of hyperspectral images.

Conflicts of Interest

The authors declare no conflict of interest.

References

  1. Su, W.; Yang, C.; Dong, Y.; Johnson, R.; Page, R.; Szinyei, T.; Hirsch, C.D.; Steffenson, B.J. Hyperspectral imaging and improved feature variable selection for automated determination of deoxynivalenol in various genetic lines of barley kernels for resistance screening. Food Chem. 2021, 343, 12857. [Google Scholar] [CrossRef] [PubMed]
  2. Su, W.; Sun, D. Multispectral Imaging for Plant Food Quality Analysis and Visualization. Compr. Rev. Food Sci. Food Saf. 2018, 17, 220–239. [Google Scholar] [CrossRef] [PubMed] [Green Version]
  3. Dipaolo, J.A.; Elis, J.; Erwin, H. Teratogenic Response by Hamsters Rats and Mice to Aflatoxin B1. Nature 1967, 215, 638. [Google Scholar] [CrossRef] [PubMed]
  4. Peraica, M.; Radic, B.; Lucic, A.; Pavlovic, M. Toxic effects of mycotoxins in humans. Bull. World Health Organ. 1999, 77, 754–766. Available online: https://www.webofscience.com/wos/woscc/full-record/WOS:000082975100008 (accessed on 27 September 2021).
  5. Tao, F.; Yao, H.; Hruska, Z.; Burger, L.W.; Rajasekaran, W.; Bhatnagar, D. Recent development of optical methods in rapid and non-destructive detection of aflatoxin and fungal contamination in agricultural products. TrAC Trends Anal. Chem. 2018, 100, 65–81. [Google Scholar] [CrossRef]
  6. Xu, L.; Lu, Z.; Cao, L.; Pang, H.; Zhan, Q.; Fu, Y.; Xiong, Y.; Li, Y.; Wang, X.; Wang, J.; et al. In-field detection of multiple pathogenic bacteria in food products using a portable fluorescent biosensing system. Food Control 2017, 75, 21–28. [Google Scholar] [CrossRef]
  7. Edelstein, L.; Segel, L.A. Growth and Metabolism in Mycelial Fungi. J. Theor. Biol. 1983, 104, 187–210. [Google Scholar] [CrossRef]
  8. Rahmani, A.; Jinap, S.; Soleimany, F. Qualitative and quantitative analysis of mycotoxins. Compr. Rev. Food Sci. Food Saf. 2009, 8, 202–251. [Google Scholar] [CrossRef]
  9. Xie, L.; Chen, M.; Ying, Y. Development of Methods for Determination of Aflatoxins. Crit. Rev. Food Sci. Nutr. 2016, 56, 2624–2664. [Google Scholar] [CrossRef]
  10. Matabaro, E.; Ishimwe, N.; Uwimbabazi, E.; Lee, B.H. Current Immunoassay Methods for the Rapid Detection of Aflatoxin in Milk and Dairy Product. Compr. Rev. Food Sci. Food Saf. 2017, 16, 808–820. [Google Scholar] [CrossRef]
  11. Xing, F.; Yao, H.; Liu, Y.; Dai, X.; Brown, R.L.; Bhatnagar, D. Recent developments and applications of hyperspectral imaging for rapid detection of mycotoxins and mycotoxigenic fungi in food products. Crit. Rev. Food Sci. Nutr. 2019, 59, 173–180. [Google Scholar] [CrossRef] [PubMed]
  12. Wang, L.; Pu, H.; Sun, D.; Liu, D.; Wang, Q.; Xiong, Z. Application of Hyperspectral Imaging for Prediction of Textural Properties of Maize Seeds with Different Storage Periods. Food Anal. Methods 2014, 8, 1535–1545. [Google Scholar] [CrossRef]
  13. Cotty, P.J. Aflatoxin-producing potential of communities of Aspergillus section Flavi from cotton producing areas in the United States. Mycol Res. 1997, 101, 698–704. [Google Scholar] [CrossRef] [Green Version]
  14. Garcia, D.; Ramos, A.J.; Sanchis, V.; Marín, S. Modeling kinetics of aflatoxin production by Aspergillus flavus in maize-based medium and maize grain. Int. J. Food Microbiol. 2013, 162, 182–189. [Google Scholar] [CrossRef]
  15. Williams, P.J.; Geladi, P.; Britz, T.J.; Manley, M. Growth characteristics of three Fusarium species evaluated by near-infrared hyperspectral imaging and multivariate image analysis. Appl. Microbiol. Biotechnol. 2012, 96, 803–813. [Google Scholar] [CrossRef]
  16. Jin, J.; Lie, T.; Hruska, Z.; Yao, H. Classification of toxigenic and atoxigenic strains of Aspergillus flavus with hyperspectral imaging. Comput. Electron. Agric. 2009, 69, 158–164. [Google Scholar] [CrossRef]
  17. Chu, X.; Wang, W.; Ni, X.; Zheng, H.; Zhao, X.; Zhang, R.; Li, Y. Growth Identification of Aspergillus flavus and Aspergillus parasiticus by Visible/Near-Infrared Hyperspectral Imaging. Appl. Sci. 2018, 8, 513. [Google Scholar] [CrossRef] [Green Version]
  18. Lu, Y.; Wang, W.; Huang, M.; Ni, X.; Chu, X.; Li, C. Evaluation and classification of five cereal fungi on culture medium using Visible/Near-Infrared (Vis/NIR) hyperspectral imaging. Infrared Phys. Technol. 2020, 105, 103206. [Google Scholar] [CrossRef]
  19. Marin, S.; Belli, N.; Lasram, S.; Chebil, S.; Ramos, A.J.; Ghorbel, A.; Sanchis, V. Kinetics of Ochratoxin A Production and Accumulation by Aspergillus carbonarius on Synthetic Grape Medium at Different Temperature Levels. J. Food Sci. 2006, 71, 196–200. [Google Scholar] [CrossRef]
  20. Pearson, T.C.; Wicklow, D.T.; Pasikatan, M.C. Reduction of Aflatoxin and Fumonisin Contamination in Yellow Corn by High-Speed Dual-Wavelength Sorting. Cereal Chem. 2004, 81, 490–498. [Google Scholar] [CrossRef] [Green Version]
  21. Wang, W.; Heitschmidt, G.W.; Ni, X.; Windham, W.R.; Hawkins, S.; Chu, X. Identification of aflatoxin B1 on maize kernel surfaces using hyperspectral imaging. Food Control 2014, 42, 78–86. [Google Scholar] [CrossRef]
  22. Jiang, H.; Wang, W.; Zhuang, H.; Yoon, S.C.; Yang, Y.; Zhao, X. Hyperspectral imaging for a rapid detection and visualization of duck meat adulteration in beef. Food Anal. Methods 2019, 12, 2205–2215. [Google Scholar] [CrossRef]
  23. Gromski, P.S.; Correa, E.; Vaughan, A.A.; Wedge, D.C.; Turner, M.L.; Goodacre, R. A comparison of different chemo-metrics approaches for the robust classification of electronic nose data. Anal. Bioanal. Chem. 2014, 406, 7581–7590. [Google Scholar] [CrossRef] [PubMed]
  24. Nicolai, B.M.; Theron, K.I.; Lammertyn, J. Kernel PLS regression on wavelet transformed NIR spectra for prediction of sugar content of apple. Chemom. Intell. Lab. Syst. 2007, 85, 243–252. [Google Scholar] [CrossRef]
  25. Sacre, P.Y.; Deconinck, E.; De Beer, T.; Courselle, P.; Vancauwenberghe, R.; Chiap, P.; Crommen, J.; De Beer, J.O. Comparison and combination of spectroscopic techniques for the detection of counterfeit medicines. J. Pharm. Biomed. Anal. 2010, 53, 445–453. [Google Scholar] [CrossRef] [Green Version]
  26. Menesatti, P.; Zanella, A.; D’Andrea, S.; Costa, C.; Paglia, G.; Pallottino, F. Supervised Multivariate Analysis of Hyper-spectral NIR Images to Evaluate the Starch Index of Apples. Food Bioprocess Technol. 2009, 2, 308–314. [Google Scholar] [CrossRef]
  27. Barlocco, N.; Vadell, A.; Ballesteros, F.; Galietta, G.; Cozzolino, D. Predicting intramuscular fat, moisture and Warner-Bratzler shear force in pork muscle using near infrared reflectance spectroscopy. Anim. Sci. 2006, 82, 111–116. [Google Scholar] [CrossRef]
  28. Mellon, J.E.; Dowd, M.K.; Cotty, P.J. Time Course Study of Substrate Utilization by Aspergillus flavus in Medium Simulating Corn (Zea mays) Kernels. J. Agric. Food Chem. 2002, 50, 648–652. [Google Scholar] [CrossRef]
  29. Amare, M.G.; Keller, N.P. Molecular mechanisms of Aspergillus flavus secondary metabolism and development. Fungal Genet. Biol. 2014, 66, 11–18. [Google Scholar] [CrossRef]
  30. Brown, S.H.; Zarnowski, R.; Sharpee, W.C.; Keller, N.P. Morphological Transitions Governed by Density Dependence and Lipoxygenase Activity in Aspergillus flavus. Appl. Environ. Microb. 2008, 74, 5674–5685. [Google Scholar] [CrossRef] [Green Version]
  31. Affeldt, K.J.; Brodhagen, M.; Keller, N.P. Aspergillus Oxylipin Signaling and Quorum Sensing Pathways Depend on G Protein-Coupled Receptors. Toxins 2012, 4, 695–717. [Google Scholar] [CrossRef] [PubMed]
Figure 1. Pseudo color images of A. flavus growing at different time intervals on MAM. Pseudo color images of medium inoculated (a) NRRL 3357 with concentration of 102 spores mL−1; (b) NRRL 3357 with concentration of 104 spores mL−1.
Agriculture 13 00237 g001
Figure 2. Mean spectra of maize agar medium inoculated with A. flavus. Mean spectra of medium inoculated (a) NRRL 3357 with concentration of 102 spores mL−1; (b) NRRL 3357 with concentration of 104 spores mL−1.
Agriculture 13 00237 g002
Figure 3. AFB1 concentrations in the maize-agar medium with two treatments. There was a significant treatment effect (p < 0.05), and a statistically significant interaction of treatment by day (p < 0.05).
Agriculture 13 00237 g003
Figure 4. Scores of the first three PCs. MAM inoculated (a) NRRL 3357 with concentration of 102 spores mL−1; (b) NRRL 3357 with concentration of 104 spores mL−1.
Agriculture 13 00237 g004
Figure 5. Loading plots of PC1, PC2, and PC3. MAM inoculated (a) NRRL 3357 with concentration of 102 spores mL−1; (b) NRRL 3357 with concentration of 104 spores mL−1.
Agriculture 13 00237 g005
Figure 6. Prediction results of multispectral models. MAM inoculated (a) NRRL 3357 with concentration of 102 spores mL−1; (b) NRRL 3357 with concentration of 104 spores mL−1.
Agriculture 13 00237 g006
Figure 7. AFB1 prediction results of the multispectral PLSR model. MAM inoculated (a) NRRL 3357 with concentration of 102 spores mL−1; (b) NRRL 3357 with concentration of 104 spores mL−1.
Agriculture 13 00237 g007
Table 1. Classification results of the A. flavus growth period based on the full spectrum.
Modeling MethodInoculation MethodsAccuracy
Calibration SetValidation SetCross Validation
PCA-SVMNRRL 3357 (102 spores mL−1)0.970.960.94
NRRL 3357 (104 spores mL−1)0.970.910.92
Table 2. Classification results of the confusion matrix.
GroupNRRL 3357 (102 spores mL−1)NRRL 3357 (104 spores mL−1)
Control24 h48 h72 h96 h120 hControl24 h48 h72 h96 h120 h
Control27000002610000
24 h12600000270000
48 h00270000027000
72 h00025200002511
96 h00022500006210
120 h00000270000027
Sensitivity1.000.961.000.930.931.000.961.001.000.930.781.00
Specificity0.991.001.000.990.991.001.000.991.000.960.990.99
Accuracy0.970.94
Kappa coefficient0.96300.9333
Table 3. Prediction results of AFB1 in two types of culture methods based on full-band spectra.
Inoculation MethodsPreprocessing Methods LVsRCRMSEcRVRMSEvRPD
NRRL 3357
(102 spores mL−1)
Raw40.9320.8510.9241.5472.15
SNV50.9435.0320.9156.0742.02
FD30.9140.6090.8758.4751.99
NRRL 3357
(104 spores mL−1)
Raw40.9413.1770.9328.9572.26
SNV40.9512.7700.9433.6412.54
FD30.9414.0400.9237.3742.23
Note: R, raw reflectance spectrum; bold indicates the optimal model.
Table 4. Key wavelengths selected by SPA.
Inoculation MethodsNumberWavelengths (nm)
NRRL 3357 (102 spores mL−1)7419, 487, 622, 697, 771, 880, 979
NRRL 3357 (104 spores mL−1)6417, 475, 559, 619, 796, 873
Table 5. AFB1 prediction results using key wavelengths.
Inoculation MethodsLVsRCRMSEcRVRMSEvRPD
NRRL 3357 (102 spores mL−1)40.985.4260.9515.2352.42
NRRL 3357 (104 spores mL−1)20.993.8560.9617.4381.58
Disclaimer/Publisher’s Note: The statements, opinions and data contained in all publications are solely those of the individual author(s) and contributor(s) and not of MDPI and/or the editor(s). MDPI and/or the editor(s) disclaim responsibility for any injury to people or property resulting from any ideas, methods, instructions or products referred to in the content.

