Article

An Artificial-Intelligence-Based Novel Rice Grade Model for Severity Estimation of Rice Diseases

1
Department of Computer Science, Symbiosis Institute of Technology, Symbiosis International (Deemed University), Pune 412115, Maharashtra, India
2
Department of Electronics and Telecommunication, Symbiosis Institute of Technology, Symbiosis International (Deemed University), Pune 412115, Maharashtra, India
3
Department of Computer Science, Indian Institute of Information Technology, Kottayam 686635, Kerala, India
4
Department of Technology, NSBT, MGM University, Aurangabad 431005, Maharashtra, India
*
Author to whom correspondence should be addressed.
Agriculture 2023, 13(1), 47; https://doi.org/10.3390/agriculture13010047
Submission received: 8 October 2022 / Revised: 5 December 2022 / Accepted: 19 December 2022 / Published: 23 December 2022
(This article belongs to the Special Issue The Application of Machine Learning in Agriculture)

Abstract

:
The pathogens such as fungi and bacteria can lead to rice diseases that can drastically impair crop production. Because the illness is difficult to control on a broad scale, crop field monitoring is one of the most effective methods of control. It allows for early detection of the disease and the implementation of preventative measures. Disease severity estimation based on digital picture analysis, where the pictures are obtained from the rice field using mobile devices, is one of the most effective control strategies. This paper offers a method for quantifying the severity of three rice crop diseases (brown spot, blast, and bacterial blight) that can determine the stage of plant disease. A total of 1200 images of rice illnesses and healthy images make up the input dataset. With the help of agricultural experts, the diseased zone was labeled according to the disease type using the Make Sense tool. More than 75% of the images in the dataset correspond to one disease label, healthy plants represent more than 15%, and multiple diseases represent 5% of the images labeled. This paper proposes a novel artificial intelligence rice grade model that uses an optimized faster-region-based convolutional neural network (FRCNN) approach to calculate the area of leaf instances and the infected regions. EfficientNet-B0 architecture was used as a backbone as the network shows the best accuracy (96.43%). The performance was compared with the CNN architectures: VGG16, ResNet101, and MobileNet. The model evaluation parameters used to measure the accuracy are positive predictive value, sensitivity, and intersection over union. This severity estimation method can be further deployed as a tool that allows farmers to obtain perfect predictions of the disease severity level based on lesions in the field conditions and produce crops more organically.

1. Introduction

Rice grains are prone to disease. It is a staple food in human consumption. Rice has the second-largest planting area, and its production determines the food security of the population in most of the world’s countries. There are various agro-meteorological factors that cause diseases in rice. The diseases can be predicted and diagnosed based on the environmental parameters [1,2]. If the leaves are infected and are not treated initially, the entire plantation can be infected and eventually lead to enormous economic loss to the farmers [3,4]. The damage caused to the crop due to diseases can be measured by disease severity estimation [5]. As a result, the infected plants are identified, and further, it can be used to forecast yield and make treatment recommendations [6]. The treatment to plant disease is applying pesticides; however, excess usage of pesticides increases the toxic level in agricultural products. Chemical pesticides are used to treat diseases. Pesticides are compounds or compositions of substances used to prevent, destroy, repel, or mitigate pests. Chemicals are becoming an increasingly complex part of modern society as they have negatively impacted both humans and agriculture. The usage of pesticides increases the production cost of crops. Pesticides should be used cautiously by evaluating the severity of the disease and targeting the diseased locations with the appropriate pesticide concentration [7]. If the diseases and their infectious level are identified at the initial stage, it can help reduce the usage of hazardous chemicals [8]. The ability to diagnose illness severity quickly and accurately will aid in reducing yield losses.
Although the naked eye inspection method is commonly employed in the production of crops, the results are subjective, and it is impossible to assess the disease precisely. Plant pathologists currently grade disease using a disease scoring scale. At present, disease severity estimation in plants is calculated in percentage using graph paper analysis. The grid counting method can be used to improve accuracy. This technique is laborious, time-consuming, involves redundant activities, and has a complicated operation process. The method is more prone to errors involving human intervention [9]. As a result, there is a need to address all these concerns related to manual disease severity grading. In agricultural research, image processing expertise has advanced significantly. The concerns with manual disease grading can be accomplished by incorporating machine vision into agriculture to determine the exact grade of the disease [10,11]. The current paper proposes an automatic and accurate disease grading system for rice crops to address the above concerns, which will be extremely useful to agronomists. Rice leaves are being considered for experimentation.
To supplement the traditional method of quantifying disease severity levels, various imaging techniques, such as hyperspectral and thermal UAV imaging, have been used [12]. Plant disease phenotyping enables understanding the progression of diseases; when the imaging techniques are combined with phenotyping, it enables accurate, automatic, and robust disease quantification. In recent years, many researchers have focused on phenotyping based on RGB images compared to other imaging variants, such as hyperspectral, thermal, etc. There are two categories of phenotyping methods based on RGB images: the first is disease detection, which means whether the diseased region is present or not in an image; the second is disease quantification, which refers to the severity of the disease that has impacted the leaf [13].
Computer vision techniques are routinely used to detect plant diseases. The scientists employed algorithms such as support vector machine (SVM), K-nearest neighbor (KNN), random forest (RF), and artificial neural network (ANN) to detect diseases such as early powdery mildew disease, blight, and mosaic virus on a variety of crops [14,15]. Recent research has used convolutional neural networks (CNN) for plant disease diagnosis as deep learning contributes to computer vision applications [16]. The LeNet model in [17] detects banana leaf illnesses, whereas the GoogleNet model was utilized in [18] to detect various biotic stress disorders. The methods outlined before classify an image based on whether a disease is present or not. However, information on the exact location of the infection and its severity is lacking. As a result, the paper focuses on the domain of disease quantification.
Many of the previous research associated with the grading of diseases have used leaf images to obtain the disease-infected area. The authors in [19] have used the Otsu segmentation algorithm to extract the diseased part from the leaf image, captured in a controlled environment. Deep learning models such as VGG-16 and UNet are used to perform tasks such as segmenting the diseased area and classifying severity stages, respectively. The leaves were brought to the laboratory, and the images were captured in a controlled environment. The results obtained from these experiments were of low accuracy [20]. Unmanned aerial vehicles (UAVs) are used to acquire field images that can deliver results with high throughput to overcome the constraints of controlled environment images.
UAV images are captured on the fields. Therefore, they have complex backgrounds, such as illumination issues and multiple leaves overlapping. CNN works best to achieve higher accuracy in object detection and segmentation [21]. So, to address the challenges mentioned above, a novel rice grade framework is proposed. Rice grade calculates the phenotype attributes such as length of leaf area and diseased area from the rice leaf images from the field that are affected with three types of diseases, rice blast, bacterial blight, and a brown spot, for disease severity quantification. The publicly available datasets do not have annotations for leaf and diseased regions. Hence, an annotated dataset was created with an annotation for leaf instances and disease areas on the image in the proposed system. The proposals are generated for each image, and a normalized feature map and a multi-task loss function are used to generate boundary boxes around leaf and disease regions. Later the percentage of diseases area against the leaf is calculated as disease severity quantification percentage, and this percentage is mapped to diseased severity level, which is required for quantitative evaluation.
The novelty of the proposed work can be outlined as follows:
  • The accuracy of disease instances identification directly impacts the accuracy of severity estimation of rice leaf disease as it is the basis for severity quantification of rice leaf disease. As a result, estimation accuracy should be the key indicator when choosing the target detection algorithm. Four mainstream backbone architectures for detecting deep learning targets are VGG16, ResNet101, MobileNet, and EfficientNet-B0. Among them, EfficientNet-B0 architecture is exact in targeting the disease position. Additionally, EfficientNet-B0 is more accurate at detecting patterns. As a result of its efficacy in identifying disease spots reliably, EfficientNet-B0 was used as the key research architecture.
  • A fast and accurate disease severity estimation framework is developed using advanced deep learning methodologies. The architecture identifies leaf instances and diseased regions, making it helpful in automated disease inspection tasks. With the proposed deep learning method, the image’s discriminatory features of leaf and diseased areas will automatically quantify the disease into five severity levels of rice diseases with higher accuracy.
  • A novel real-time rice leaf annotated data set comprises rice leaf instances and diseased areas for estimating the severity levels of rice diseases. The dataset is best suited to avoid overfitting problems in the training phase.
This research paper is further formulated into different segments: Section 3 presents the available literature on plant disease severity estimation and object detection in plant diseases. Section 4 gives a brief review of the proposed rice grade model for rice disease severity quantification deployed on the basis of AI. Section 5 delves into the details of the experimental results; Section 4 concludes the paper along with future prospects in the precision agriculture domain.

2. Related Work

This section provides an overview of deep learning approaches in the disease severity quantification area and object detection that is a key concept to develop the proposed rice grade model.

2.1. Artificial Intelligence for Disease Severity Quantification

The authors in [22] achieved an 80% accuracy in distinguishing cotton leaf infections. An artificial neural network was used to segment cotton leaves (ANN). According to authors in [23], it is a drawback to use ANNs for training as they require large amounts of data and can be computationally expensive. The researchers in [24] used morphological algorithms and iterative thresholding to identify disease spots on corn leaves. With 30 images of corn leaves, 80% detection accuracy was obtained. However, there is a flaw in the morphological method as it does not work well if there are too many edges [25]. Apart from this, in [26], an edge detection segmentation algorithm is used to extract disease spots from cotton leaves. The downside is that this algorithm does not work with imperfectly defined edges, and it is more vulnerable to noise. The severity of leaf disease should therefore be estimated using more effective algorithms.
The researchers in [27] makes use of K-means along with back propagation neural network (BPNN) to detect illness on the leaves of Camellia sinensis and Phaseolus vulgaris. A conversion from RGB to HIS was performed in their study. However, because of its nonlinear transformation, HIS is numerically unstable at low saturation [28]. A few scientists were also investigating the relationship between the performance of different color spaces in recognizing objects. The researchers in [29] have worked with various image color spaces such as HSV, RGB, HIS, etc., for automatic rice disease detection. It is stated in [30] that RGB is ineffective for determining items and recognizing colors.
The authors in [31] make use of K-means algorithm to identify the Cercospora disease severity level in sugar beet and later aligns these results with an expert visual assessment which is based on a severity scale of disease. Despite the similar results of K-means analysis and expert observation, only 12 images of leaves were collected in this study. Moreover, in [32], the severity of olive leaf spot disease are detected and rated using fuzzy C-means, which is used along with auto-cropping segmentation of polygonal patterns. When compared to manual scoring and image analysis, the precision rate was 86 percent. The outcome was less satisfying due to the small database, which only contained 100 images of olive leaves. The limitation of data size, according to authors in [33], will result in insignificant results. As a result, the larger the dataset, the better the results. The authors [34,35] have used the attention approach for detecting and classifying the rice diseases. Further, optimization techniques have been used by [36] for identifying rice diseases.

2.2. Object Detection for Plant Diseases

Due to the meteoric development of the deep learning technique, which could eliminate the disadvantages of machine learning, the convolutional neural network architecture has been efficiently applied in agricultural research. The CNN model outperforms other models in the automatic detection of pest diseases. The convolutional and pooling layers are the two main operators in the CNN model. The convolutional layer can extract more complex and significant image features automatically. The pooling layer reduces the quantity of data parameters due to the convolutional network’s extensive processing capacity. The majority of current research focuses on employing CNN models to classify pest images. Pest classification is less significant than detecting and localizing each pest in photographs of the natural environment. The CNN model’s feature extractors, combined with meta-architecture, could handle computer vision tasks such as object detection [37]. Faster region convolutional networks (Faster RCNN) [38], single shot multi-box detectors (SSD), region convolutional neural networks (RCNN) [39], and you only look once (YOLO) [20] are all object detection methods. Several researchers have recently investigated plant disease classification using object detection techniques [40]. To recognize nine different types of tomato diseases, the authors in [41] combined R-CNN, faster R-CNN, and SSD deep learning meta-learning with the residual network and VGG net. The authors in [42] proposes a real-time rice blast disease segmentation method based on a feature fusion and attention mechanism. The authors in [43] proposed a fast R-CNN model with no anchors to classify 24 different types of pests. The experiments exhibit 56.4% mAP and 85.1% mRecall accuracy on a pest dataset of 24 classes, and is higher than that of YOLO detector and faster R-CNN. In [16], the authors have built a real-time video detection system based on faster R-CNN. The results demonstrated that the suggested approach was capable of detecting the untrained rice sickness in the video. Several studies have looked into deep-learning-based object detection systems for agricultural disease identification, but none have focused on disease grading levels.
It can be summarized from the above existing literature related to crop disease severity estimation that many of the researchers have focused on diagnosing the diseases using deep learning approaches such as YOLO, SSD, RCNN. Very few researchers have concentrated on the severity estimation of the diseases. The existing severity estimation techniques are based on image processing techniques which can be further improvised using deep learning techniques. It is the main gap identified in the literature. It becomes the need to deploy a model that can precisely quantify the severity of the plant disease and help the farmers take appropriate actions against the disease at the right time. If quantification is performed precisely, then appropriate recommendations of the pesticides can be prescribed, which will not excessively harm the crop and keep the quality of the crop more organic. It became the motivation to explore the domain of crop disease grading in precision agriculture.

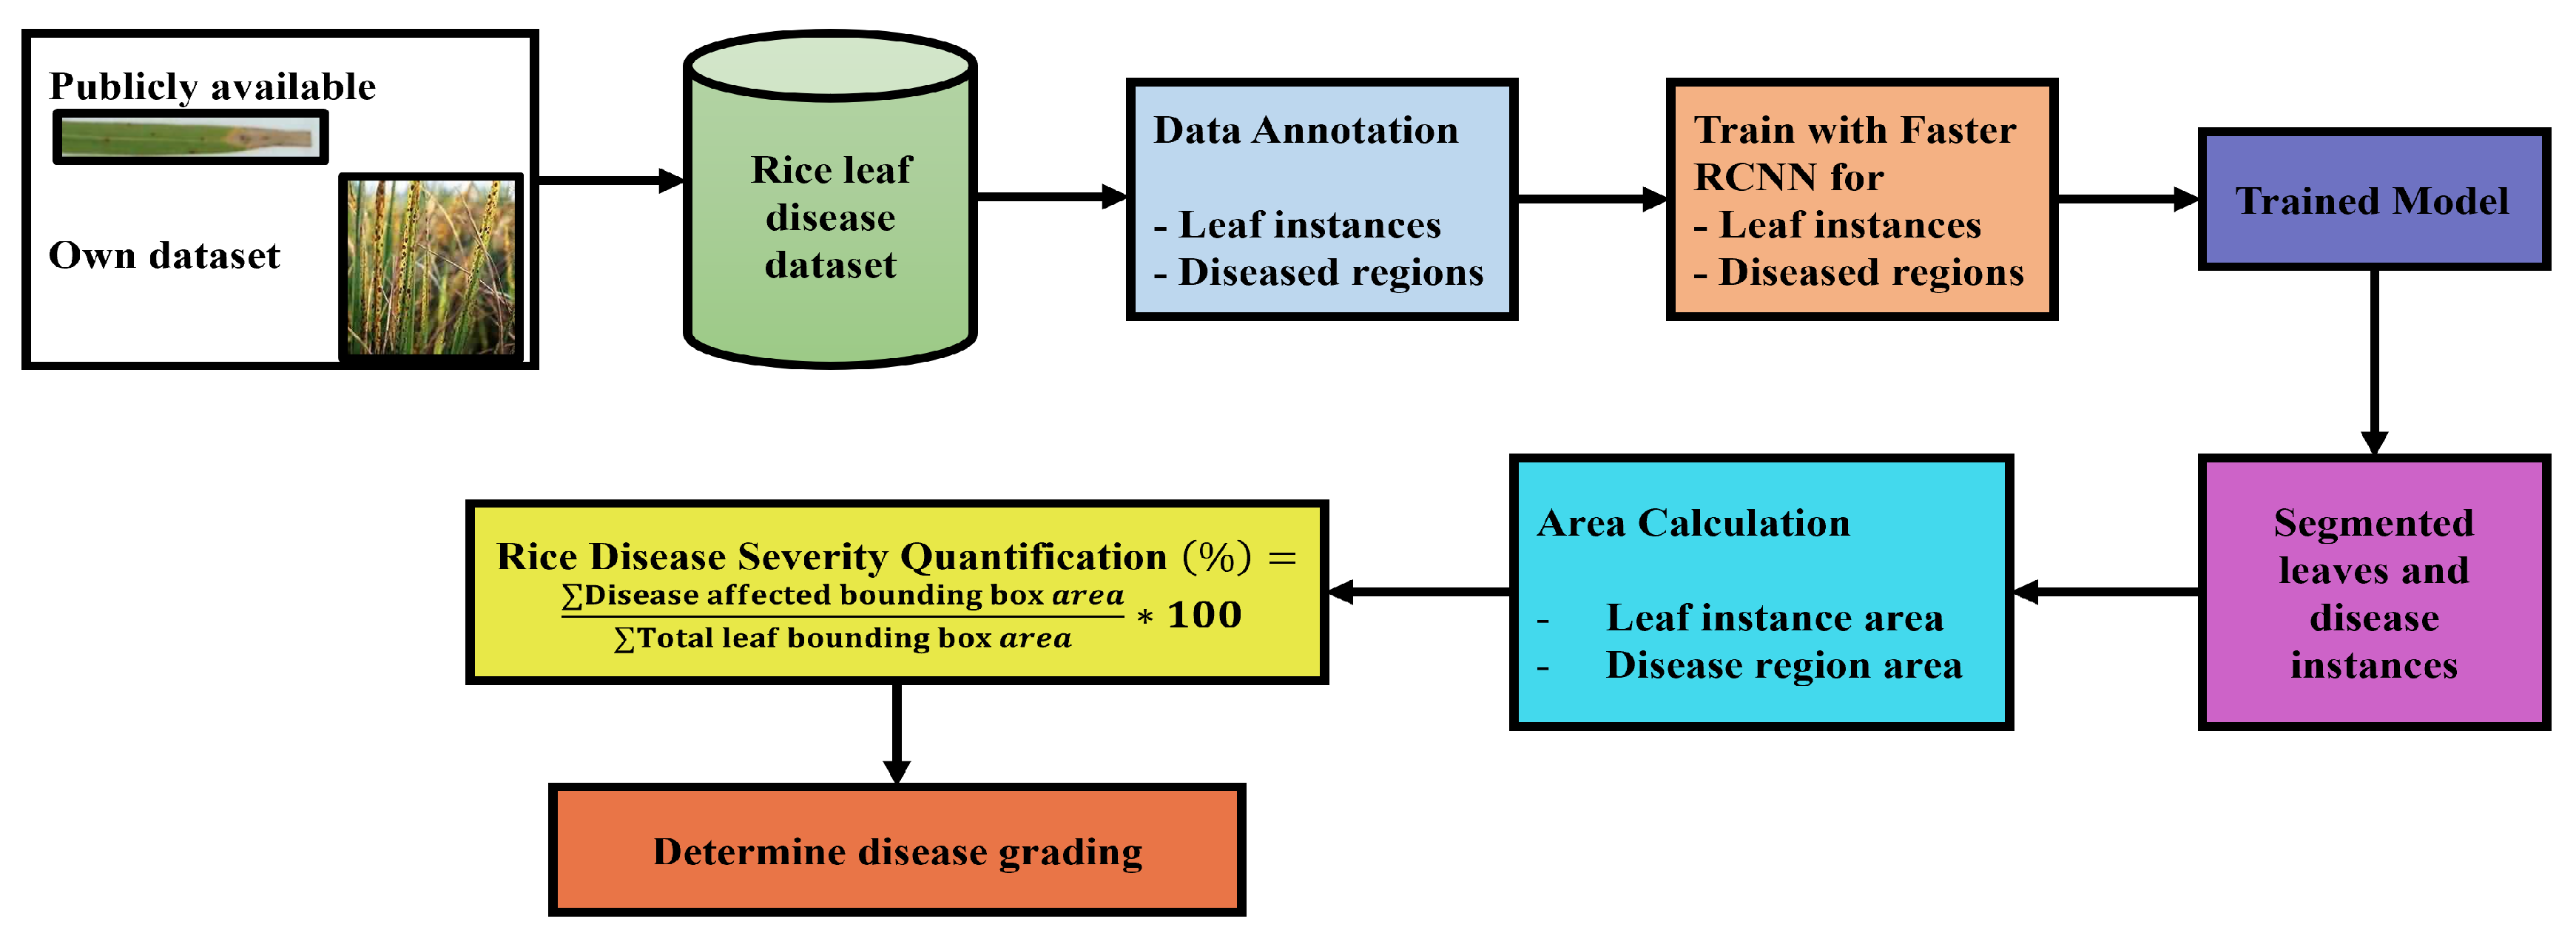
3. Materials and Methodology

Rice grade: A model to estimate severity of the rice diseases
The grading system for rice disease severity is represented in Figure 1. The algorithmic steps of the proposed rice grade model for rice disease severity quantification are as follows:
Step 1:
Primary and secondary dataset collection.
Step 2:
Rice image annotations.
Step 3:
Hyper-tuned optimized faster RCNN architecture for identifying the type of disease and location of the disease affected area.
Step 4:
Testing.
Step 5:
Rice leaf instances and diseased area calculation.
Step 6:
Rice disease severity quantification and determine disease grade level.
Figure 2 shows the diagrammatic representation of the proposed rice grade architecture used to identify the disease severity level on rice crops. Initially, the real-time rice diseases image dataset is collected. Then the selection of an optimized CNN backbone architecture was carried out. After carrying out performance evaluation, the EfficientNet-B0 architecture was considered an optimal backbone for building the rice grade model. It was hyper-tuned using optimal values for configuration parameters. Lastly, the severity scale of the disease is identified.

3.1. Primary and Secondary Dataset Collection

The rice leaf diseased image database utilized in the proposed model includes healthy leaves and images of three diseases: brown spot, blight, and blast. Our own obtained rice leaf image is coupled with a publicly available web database (Kaggle) to improve the robustness of the suggested method. The rice leaf images were recorded for all four rice health categories from the rice fields using colored charge coupled device (CCD). They were collected for approximately two years. While collating images, a fixed distance to acquire an image, illumination, and angle were not considered to make the dataset more heterogeneous. The image acquisition distance was approximately 150 to 250 mm without zoom. In total, 300 brown spot images, 300 bacterial blight images, 300 blast images, and 300 healthy rice leaf images were culled from the dataset. There was a total of 1200 images captured. Table 1 summarizes the total number of rice images used for the proposed study.

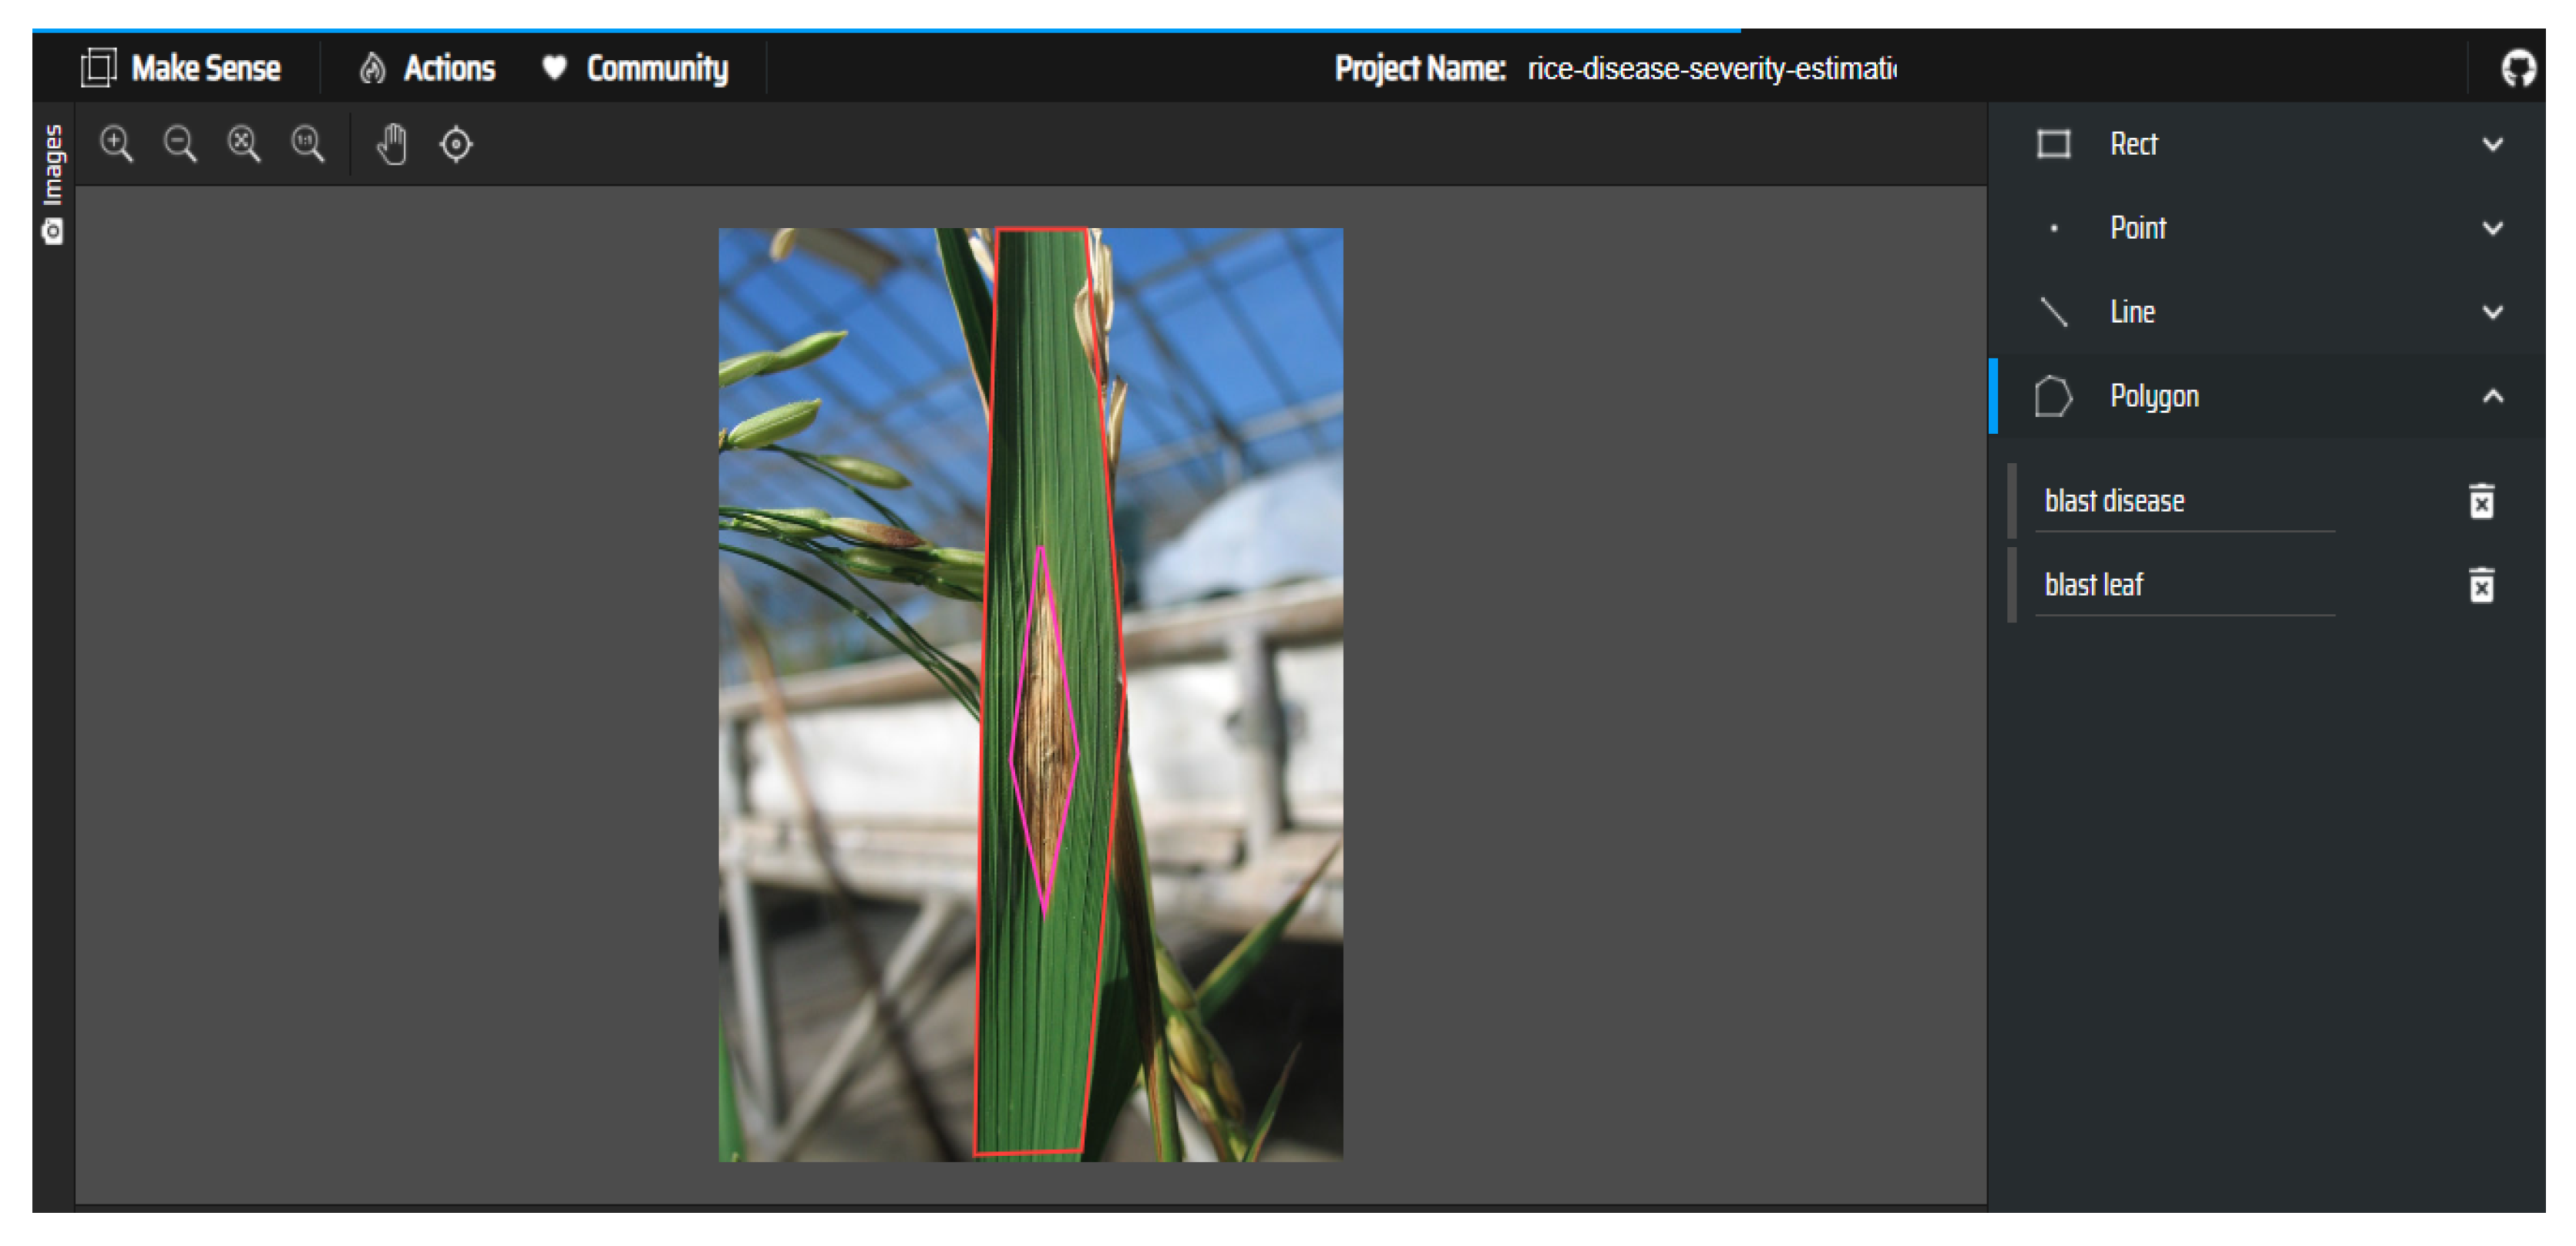
3.2. Annotation of Rice Images

The annotations of leaf and disease regions are crucial in disease severity quantification. The annotation is to specify the precise location of the disease spot and the leaf part in the image so that accurate quantification can be calculated. Agricultural experts have carefully screened every crop disease image to ensure the accuracy and authority of annotations. Annotation is handled by five agriculture experts. For professional and accurate labeling, at least three experts were involved in an image’s labeling process, and a vote was taken to determine the final label. The graphical tool named Make Sense is used to annotate the images. Once the images are imported and annotated, the annotations are exported in a single COCO JSON file format. The JSON file includes information such as coordinates of the bounding boxes and the category number of the classes. There were challenges experienced in the process as many of the disease spots are tiny; even then, the proposed model exhibits high performance. A red polygon marks the leaf instances, and a pink polygon marks the diseased region. Polygons are used for annotation over rectangle, line, and dot as the polygon is more precise in detecting the complex structure of diseases and calculating the affected area. The area tag gives the area of the bounding box. This area is further used for calculating the severity percentage. Figure 3 represents the image annotation performed in Make Sense tool.

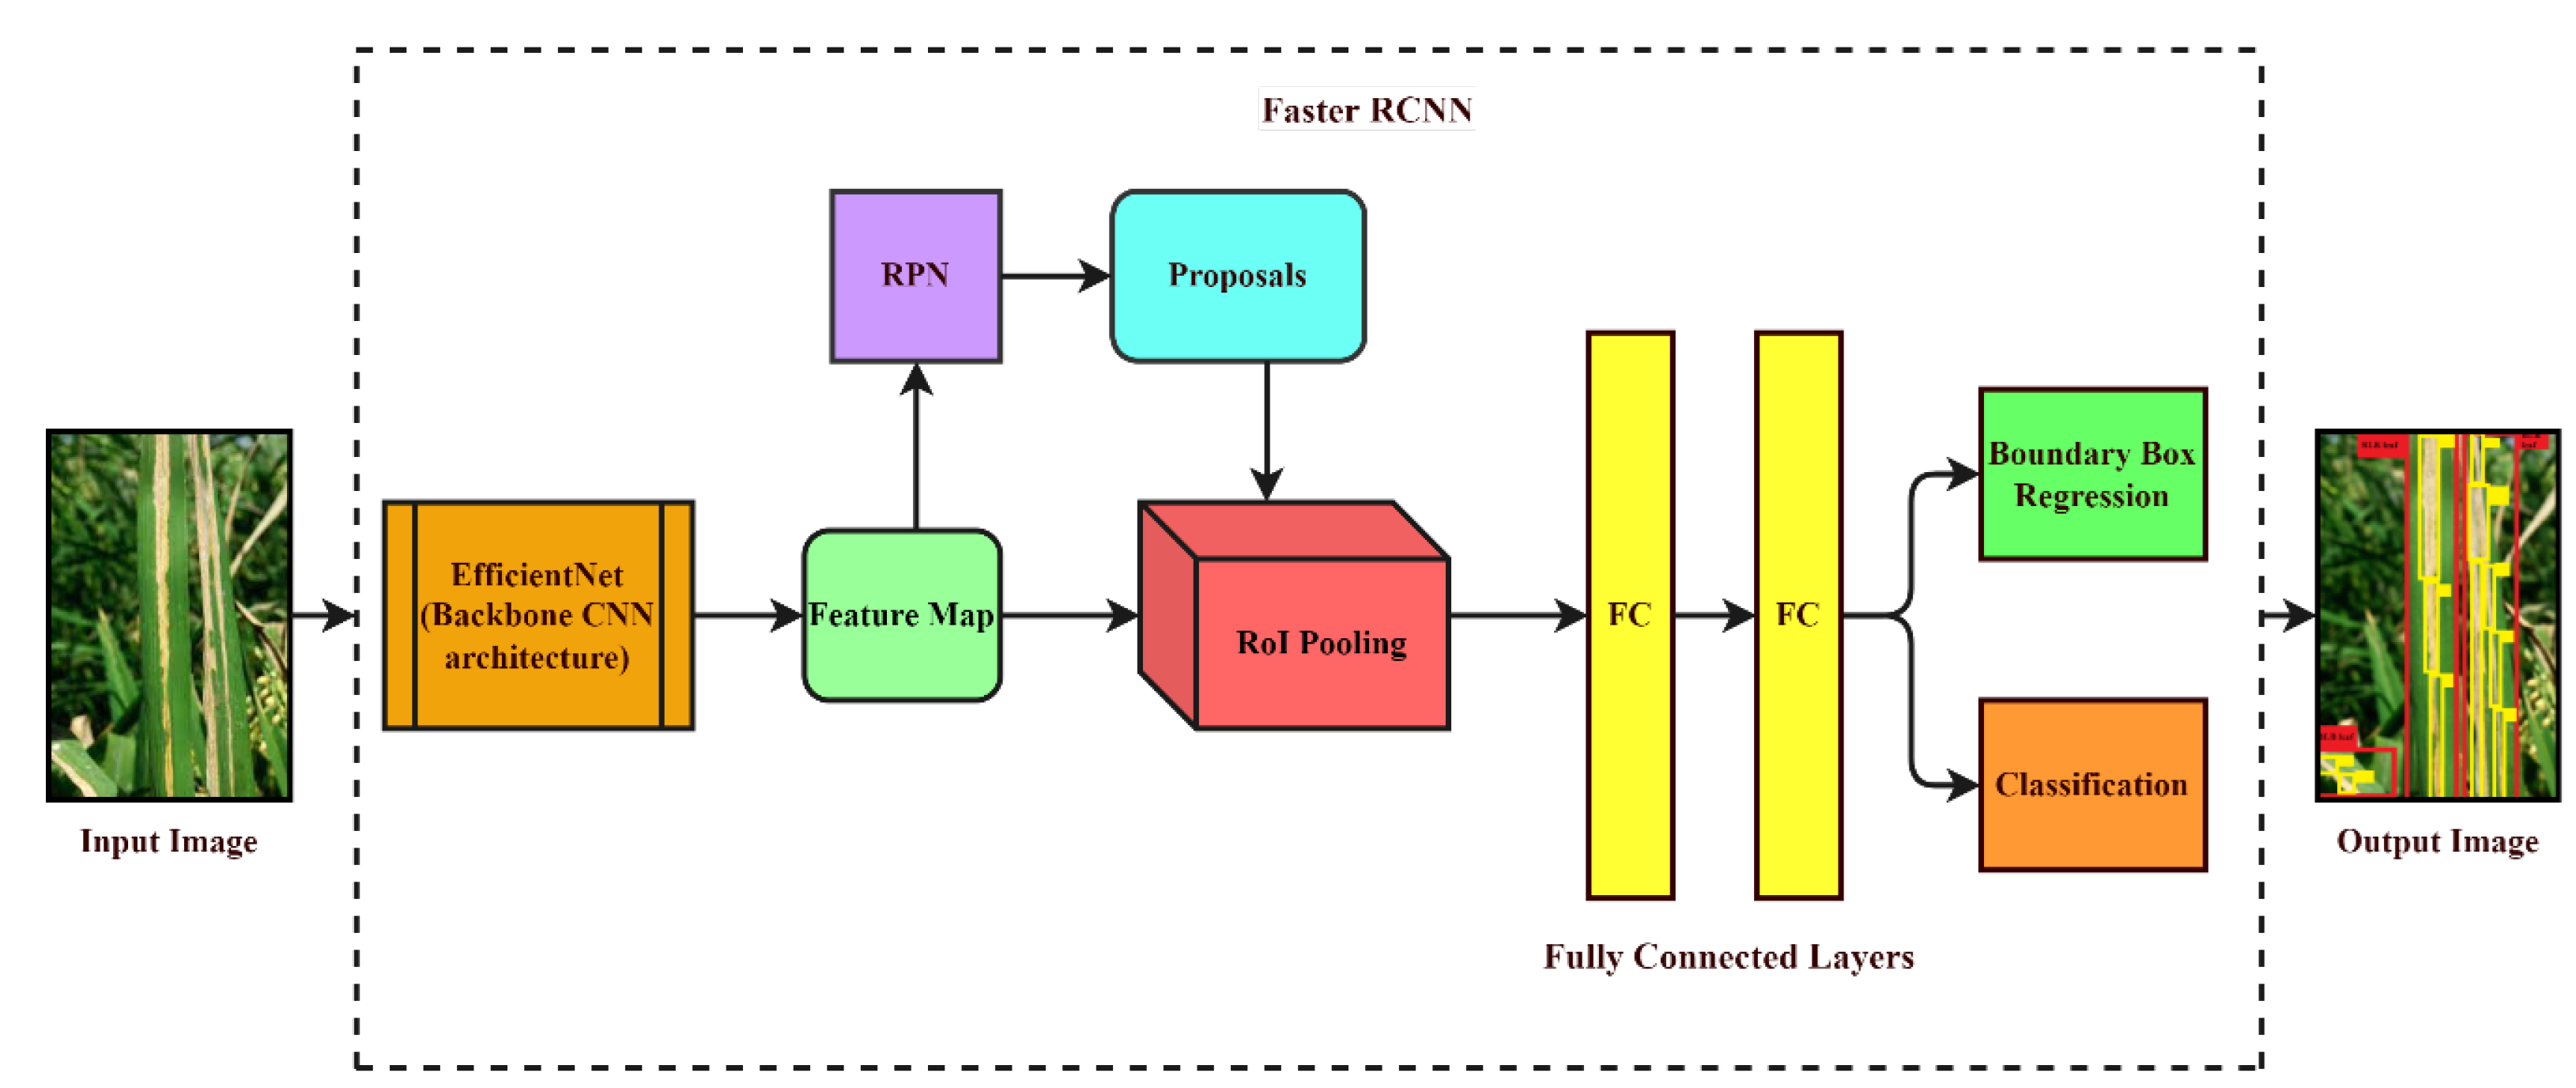
3.3. EfficientNet-B0: CNN Backbone Architecture

Improving the image resolution, deepening the network depth, and widening the network channel size are characteristics of creating a robust and efficient network. These characteristics enhance the model’s accuracy; however, it requires high tuning, and the computational cost of gradient explosion parameters is expensive [44]. ResNet helps avoid gradient explosion limitation by skipping a connection. MobileNet [45,46] uses pointwise and depthwise convolution to minimize the configuration of a network and enhance efficiency. The EfficientNet-B0 architecture is selected in this paper as the most basic and fastest of the EfficientNet family of architectures. The architecture uniformly scales the three dimensions such as the number of channels (width), number of layers (depth), and image size (resolution) and improves system performance by maintaining fewer parameters. The appropriate values of each dimension: resolution, depth, and width, must be set to achieve better model performance. The optimal values for these dimensions are calculated using the GridSearchCV function in python. Table 2 describes the layers in detail of EfficientNet-B0 architecture. The model architecture consists of seven sequential blocks based on Mobile Inverted Convolution (MBCnvl) and convolutional layers. The inverted residual block [47] uses a narrow-to-wide and vice versa architectural approach. ‘Cnvl’ is the convolutional layer with filter size 3 × 3. ‘MBCnvl’ is a reverse form of the conventional CNN—it initially expands using a 3 × 3 Convolution, then a 5 × 5 depth-wise convolution, significantly reducing the parameters. The final steps, the pooling and classification layers, are not considered as the purpose is not to classify the diseases but to use the architecture as the base for identifying foreground and background classes. Thus, this architecture has in-depth separable convolutions that minimize calculation. The PyTorch v1.7.1 and catalyst v20.10.1 frameworks are used to create the EfficientNet-B0 network structure. The network weights are set to none as weights related to the proposed model are unavailable. The weights related to the proposed model will be generated after training the dataset.

3.4. Hyper-Tuned Optimized Faster RCNN Architecture

The fundamental concept to develop this model is object detection. In deep learning, object detection means the target object is present in the image [48]. In the proposed model, object detection is applied to find out the rice leaf instances. Further, the area where the exact infection is present on the leaf is detected. The infected area can be quantified using object detection. Various object detectors are available in deep learning, such as YOLO, faster RCNN, single shot detectors, etc. The proposed approach to quantify the disease severity uses the faster RCNN approach. The architecture of faster RCNN comprises 3 layers: (i) region proposal network (RPN); (ii) region of interest (RoI) pooling; (iii) region-based convolutional neural network (Classifier and Regressor).

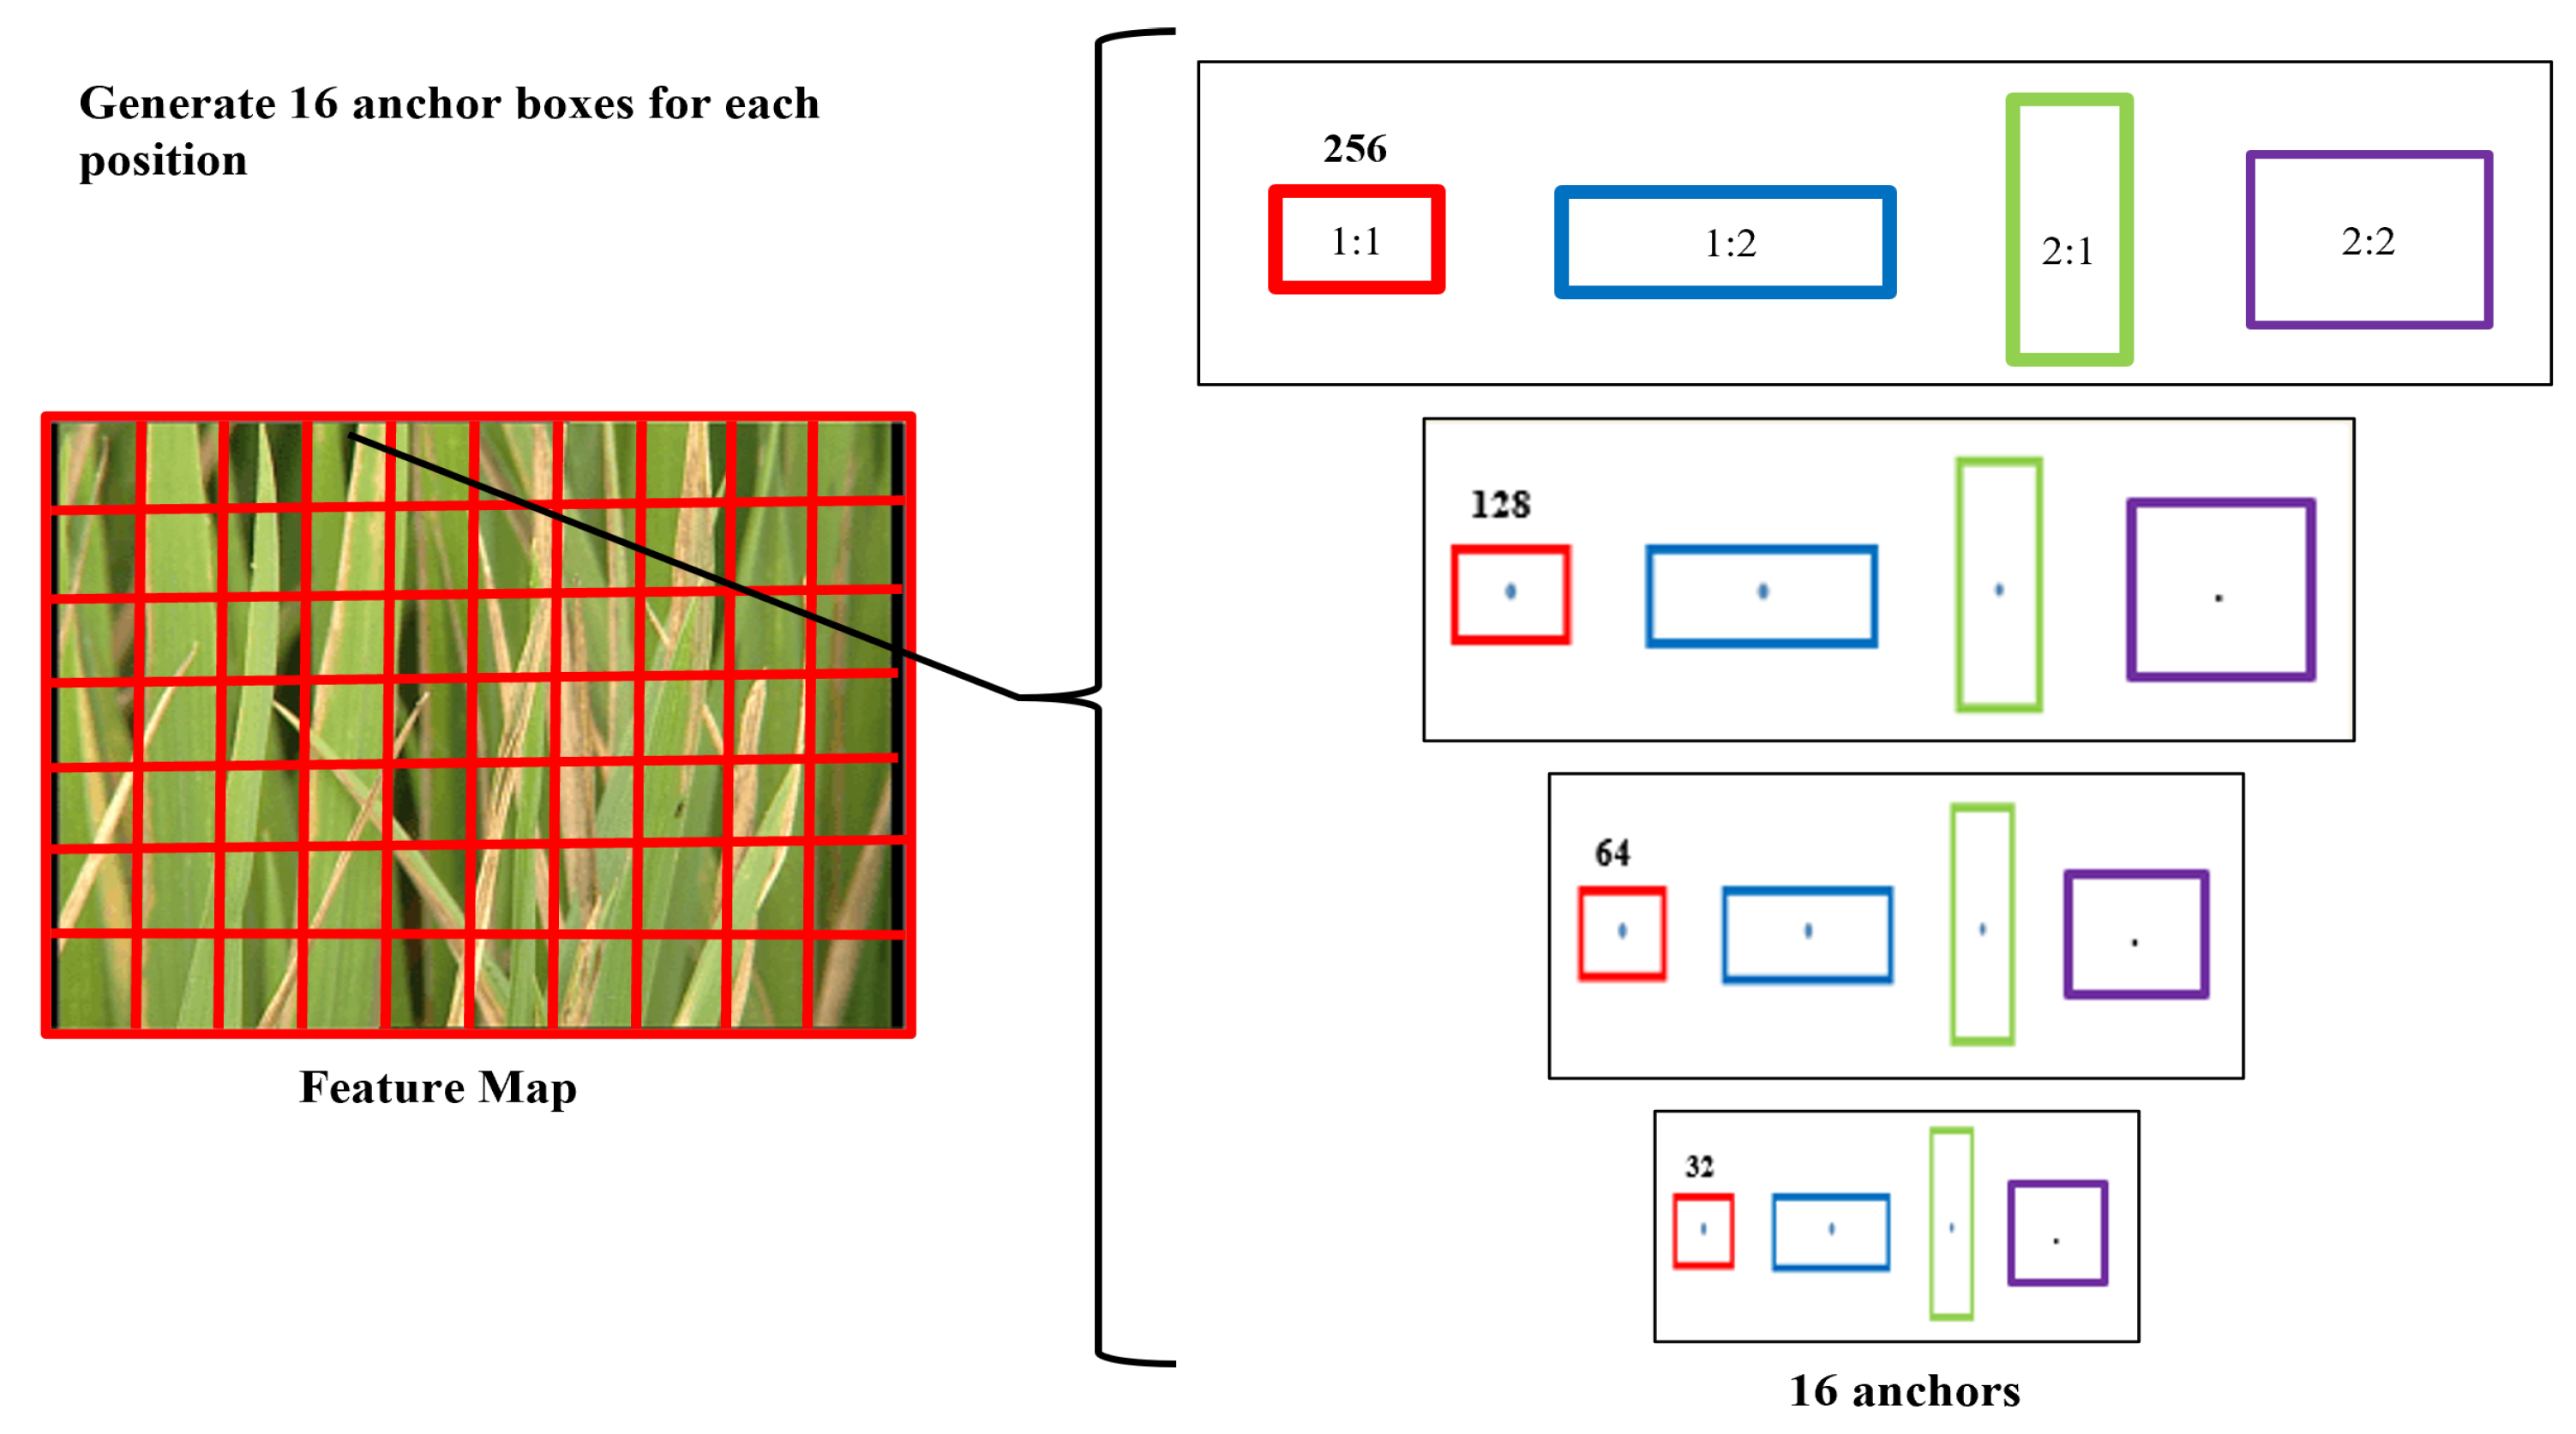
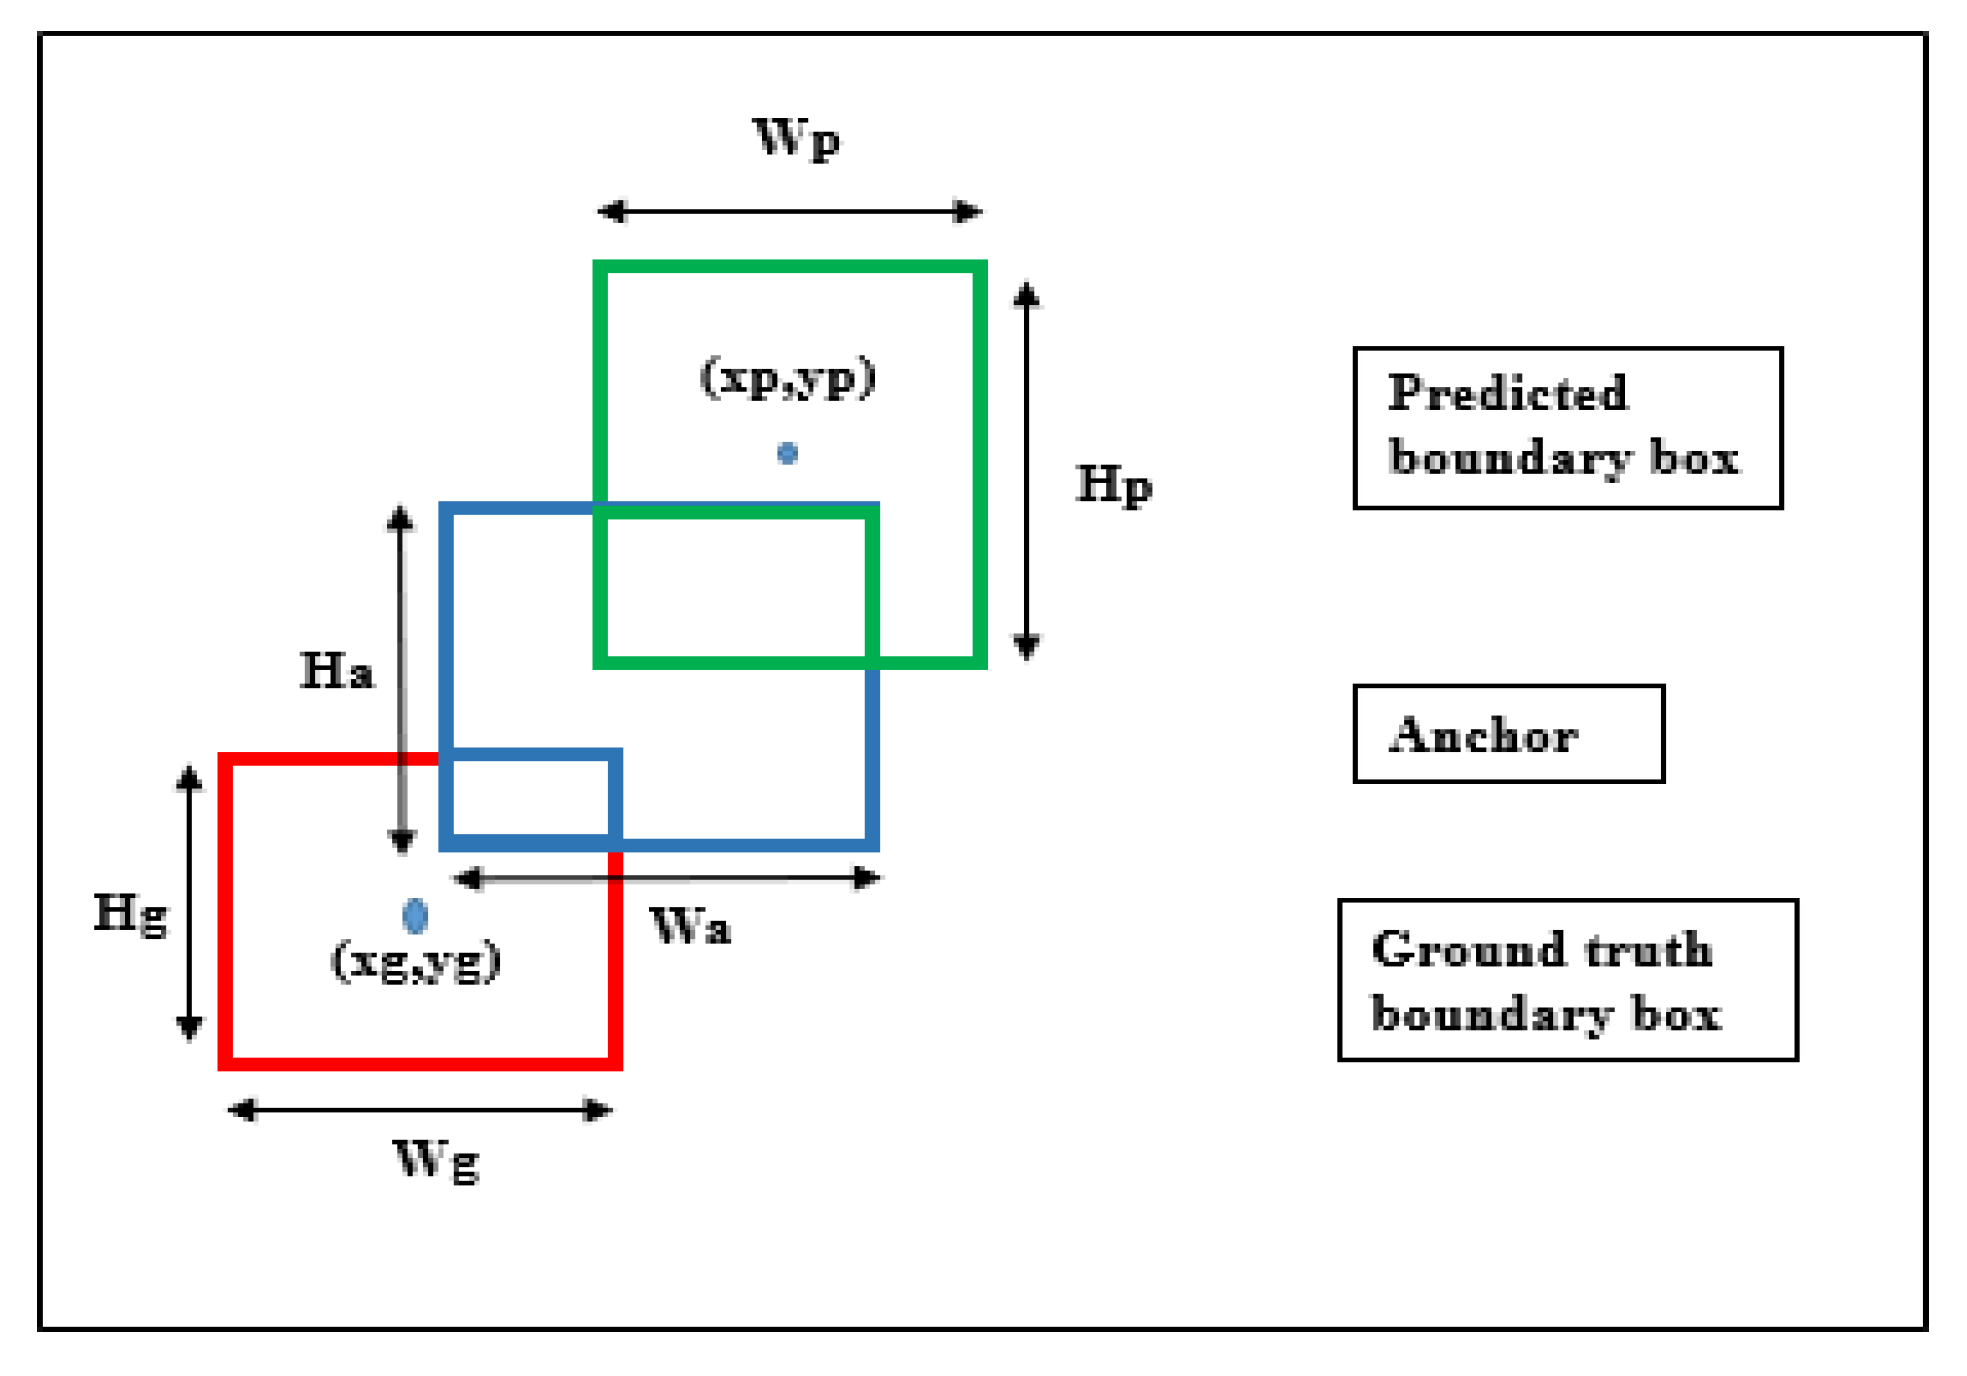
3.4.1. Step 1. Region Proposal Network

The task of RPN is to find out those areas in the image where there is the possibility of leaf instances and diseased regions to be found. Wherever the rice leaf and infectious area are found in the image, that area is labeled as foreground class, while the area where rice leaf and the infectious area are not present is labeled as background class. The foreground classes will be forwarded to the next step of the algorithm. RPN uses anchor boxes to determine where the object is exactly located. RPN accepts input as a feature map produced by the EfficientNet-B0 backbone layer and outputs the anchors generated by sliding window convolution applied on the input feature map.
Step 1.1.
Generate Anchor boxes
To quantify the severity of the disease, it is necessary to accurately identify the leaf and diseased region on plant image. The disease affected areas appear in a variety of sizes and aspect ratios. To accurately determine the sick part, the proposed bounding boxes must be evaluated at each place in the image using a variety of box shapes. These bounding boxes are known as anchor boxes. Anchor boxes are a group of pre-defined bounding boxes with a specific height and breadth. The anchor boxes come in a variety of sizes. The images consist of small disease spots, and the leaf size is big. So, the bounding box for the diseased part is very small, and the bounding box for the leaf is bigger anchor boxes. Therefore, different anchor boxes are used to capture or detect every size of the affected parts. In total, 16 anchor boxes for each siding window are generated in the proposed model with areas of of 32 2 , 64 2 , 128 2 , and 256 2 in size.
Four different aspect ratios, 1:1, 1:2, 2:1, and 2:2, are used along with four different scaling factors. The same is depicted in Figure 4.
The output generated from this layer is passed into two layers of 1 × 1 convolution, the classification layer, and the regression layer. The regression layer has 4 × 16 (W × H × (4 × k)) output parameters (denoting the coordinates of bounding boxes), and the classification layer has 2 × 16 (W × H × (2 × k)) output parameters (indicating the probability of object or not object). The objects in the dataset are both small and large, so it is most important to select the size and scale of anchor boxes as per the objects in the dataset. Many diseased regions are on the scale of 24 × 24 pixels. Hence an anchor box with size 16 × 16 pixels is chosen as the smallest anchor box. Adjusting the size of anchor boxes can detect smaller defected regions and more significant leaf instances with improved accuracy.
Step 1.2.
Calculation of Intersection over Union
After anchor boxes are generated, these anchor boxes are tiled over the input image. This will compute intersection over union (IoU). It is the area between the original bounding box and the expected bounding box that overlaps. Figure 5 shows the geometrical representation of the ground truth box, predicted box, and anchor box. A threshold value is set as per the requirement. Suppose the overlapping area is above the set threshold value. In that case, that object is detected by the box and labeled as foreground class, and if the threshold is less than the set threshold value, the algorithm will not learn from the example and will be labeled as background class. The foreground class will be assigned to the anchor box with the highest IoU.
The responsibility of RPN is to determine the location of the object and identify it as foreground class. The main task of RPN is to predict foreground and background anchor boxes. Anchor boxes labeled as foreground class are input to the next stage. The output from RPN network is a feature map of those anchor boxes which are labeled as foreground classes. The classification of foreground class and background class is mathematically represented in Equation (1)
c l a s s I o U = F o r e g r o u n d c l a s s I o U > t h r e s h o l d v a l u e B a c k g r o u n d c l a s s I o U t h r e s h o l d v a l u e

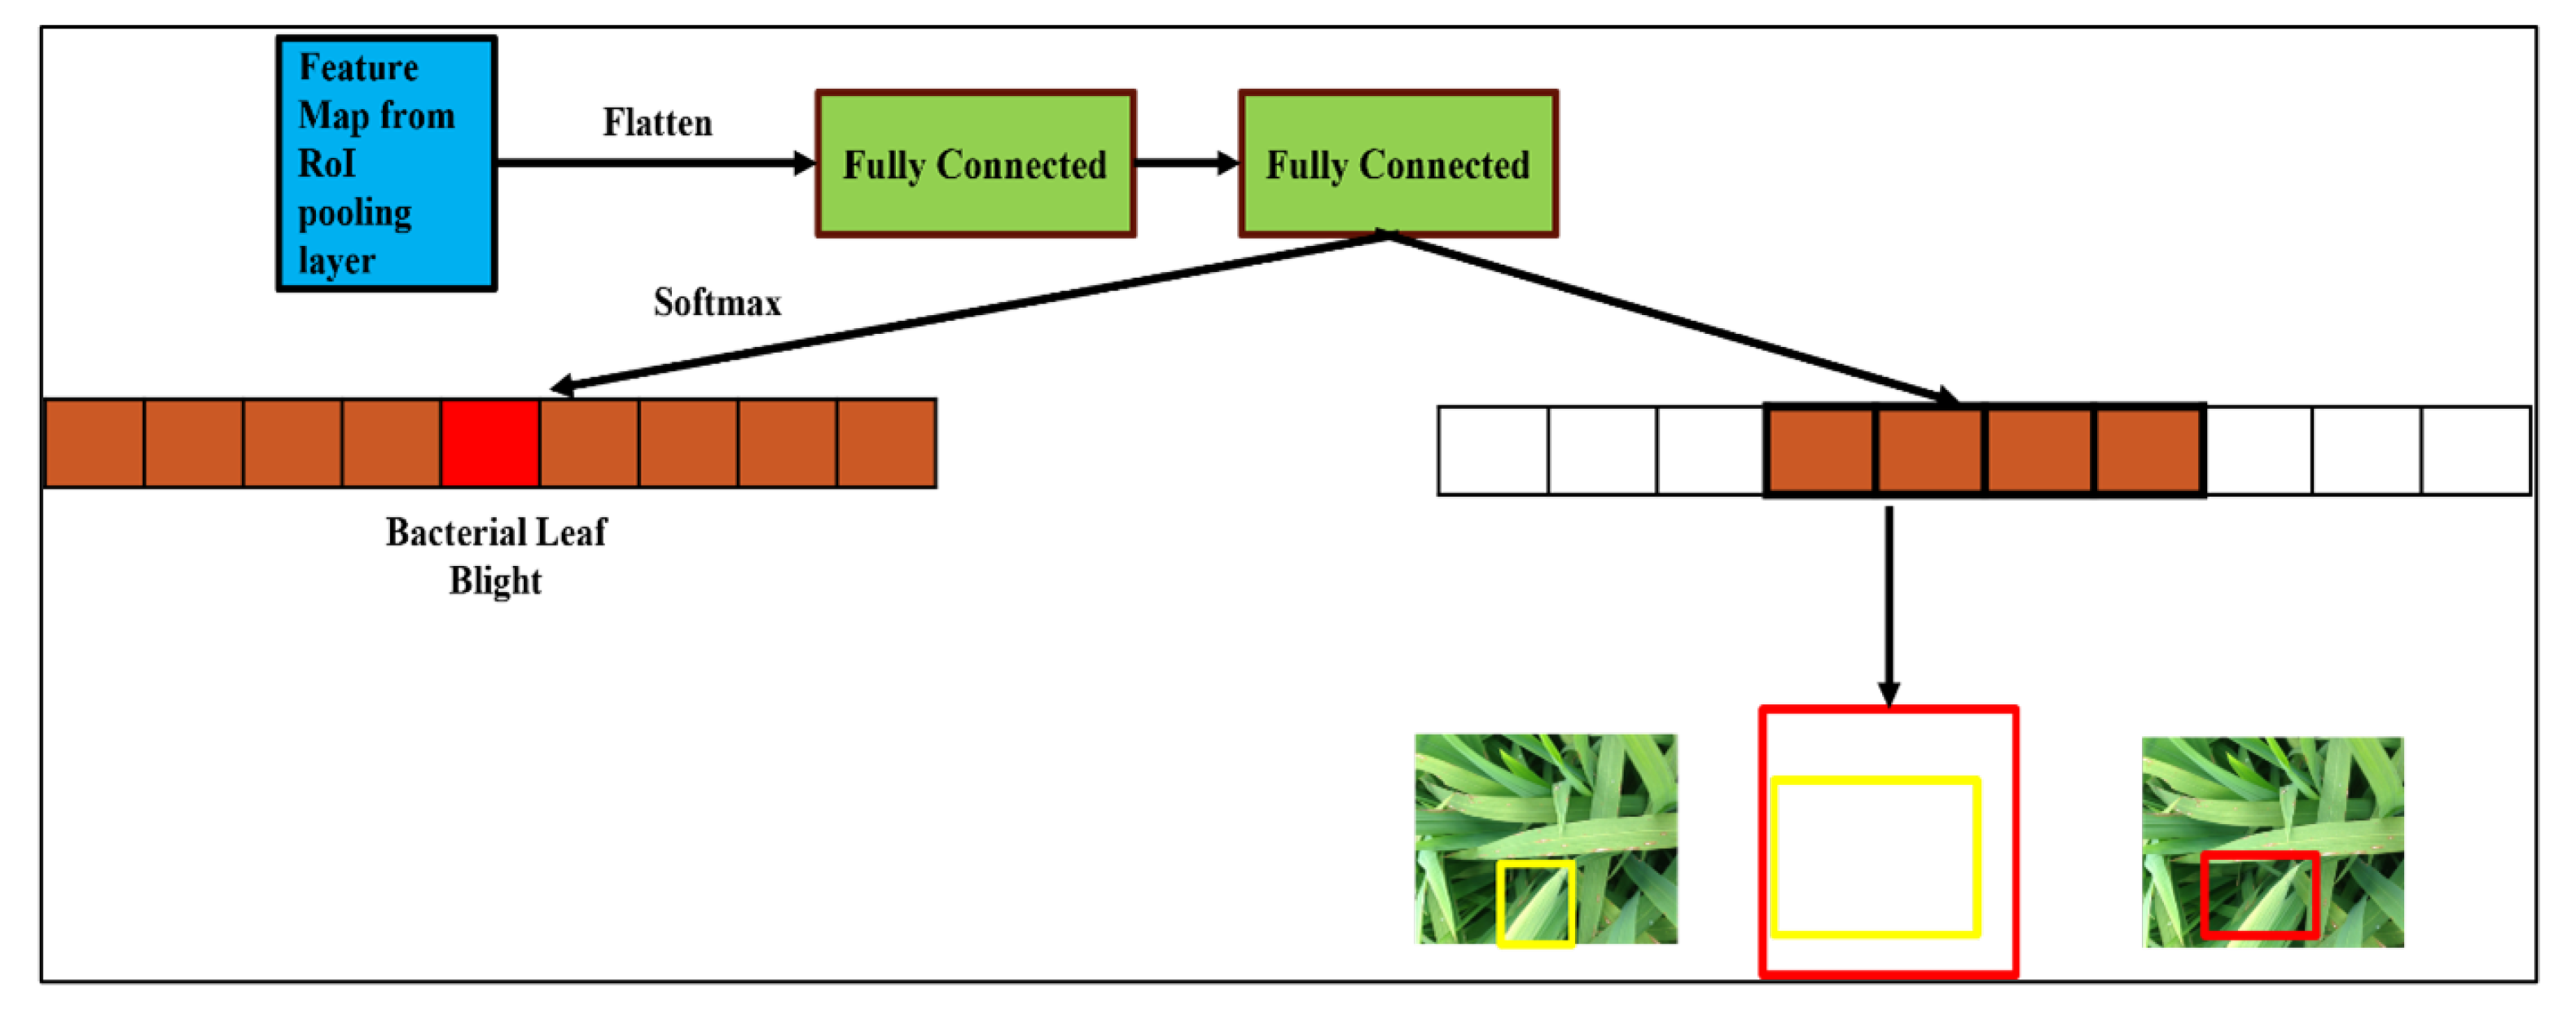
3.4.2. Step 2. Region of Interest (RoI) Pooling

The output of RPN is anchor boxes where objects are captured and labeled as foreground class and are given as input to RoI pooling [49]. The anchor boxes used are of different sizes. Therefore, output anchor boxes of RPN will be feature maps of different sizes. The input to the RoI is different size of feature maps. The task of ROI pooling layer is to normalize all the obtained feature maps to same size. The output of rice grade RoI pooling layer is (7 × 7 × D). The leaf instances and diseased anchor boxes of various sizes are converted into standardized data regardless of the input rice plant image.

3.4.3. Step 3. Region-Based Convolutional Neural Network (Classifier and Regressor)

The RoI pooling layer generates a feature map having size (7 × 7 × D). It is then passed to two fully connected layers. Here, the feature maps are flattened and are further sent as output in two parallel fully connected layers. Each parallel fully connected layer performs a different task. The first layer is the classifier layer, also called as Softmax layer. The Softmax activation function is responsible for determining whether there is an object in an image or background class. The second layer is the regressor layer, which is responsible for finding the four coordinates of the bounding box and drawing the same on the object classified by the classifier layer. In the proposed disease quantization model, the image with dimension 512 × 512 is downsampled to reduce the dimensionality of the features at the expense of some information loss—this aids in reducing computing time. Stride in the convolutional layer is used to downsample the images. The value of stride represents the distance between tiled anchor boxes. Therefore, the feature map dimension can be calculated as Width/stride × Height/stride. Stride is a faster RCNN parameter that can be tuned. The appropriate value of stride must be chosen as applying too low or too high values can lead to localization errors. Localization error is the difference between the ground truth position and predicted position. To mitigate the errors, the object detector learns the offset applied to each tiled anchor box and adjusts the position and size of the anchor box. There are sixteen anchors for every position in the feature map, and each anchor has two possible classes that can be assigned to it, namely foreground and background classes. The number of labels in the proposed model that needs to be classified is four, so the depth of the feature map is 16 × 4. Anchor is a vector that can have binary values representing background and foreground classes. These values are fed to the Softmax activation function, which will predict the label of the rice disease class. Figure 6 represents the RoI pooling layer functioning in the proposed model.

3.5. Training

The neural network was trained using a training set of rice illnesses that was provided to it at random. The testing of the model, examining the test results, was completed after the training procedure. A multi-task loss function is optimized for a faster R-CNN [50]. The classification and bounding box regression losses are combined in the multi-task loss function. Each anchor has been given a binary class label (whether an item or not) for training RPNs. Equation (2) represents the loss function for a picture [51].
L o s s { l _ i } , { p _ i } = 1 N _ c l s L o s s _ c l s P _ i , G T _ i * + λ 1 N _ r e g P _ i * L o s s _ r e g p _ i , g t _ i *
where, l_i is the likelihood that an anchor will include an object or not. GT_i* is the ground truth value of anchors that determines whether or not they contain an object, p_i = predicted anchor coordinates, gt_i* is the ground truth coordinate for bounding boxes, Loss_cls stands for classifier loss (binary log loss over two classes), Loss_reg is loss of regression (Where R is smooth L1_loss, Loss_reg = R( t i - t i *), N_cls is classification normalization parameter, N_reg is regression normalization parameter.

3.6. Building of Rice Grade Model

The configuration parameters used to build the rice grade model is presented in Table 3. The configuration parameters during the training process were optimized using the optim module in PyTorch library. Optimizers play a critical role in improving the accuracy of the rice grade model. The comparison of seven optimizers, namely stochastic gradient descent (SGD), RMSprop, Adagrad, Adadelta, Adam, and Adamax is performed. It can be summarized that SGD outperforms all the optimizers considered for experimental analysis; therefore, SGD is chosen as the best optimizer to perform experimental work as it expedites the model training and minimizes the computational costs. The learning rate is set to 0.0001, and the momentum is set to 0.9. The configuration of the learning rate for different epochs was varied using CosineAnnealingWarmRestarts scheduler of the optim package in PyTorch. On a single GPU unit, images were fed into the model having a batch size equal to sixteen. The model was trained for 500 iterations with an initial learning rate of 0.01, which was later reduced to 0.003 at epoch 111 and 0.001 at epoch 220. The model converges at 222nd epoch and maintain the stability in model accuracy. The network was trained on RGB images that were scaled down to 512 × 512 while retaining proportions. There was a 0.1 percent difference in accuracy between validation and testing samples, indicating that there is no overfitting effect.

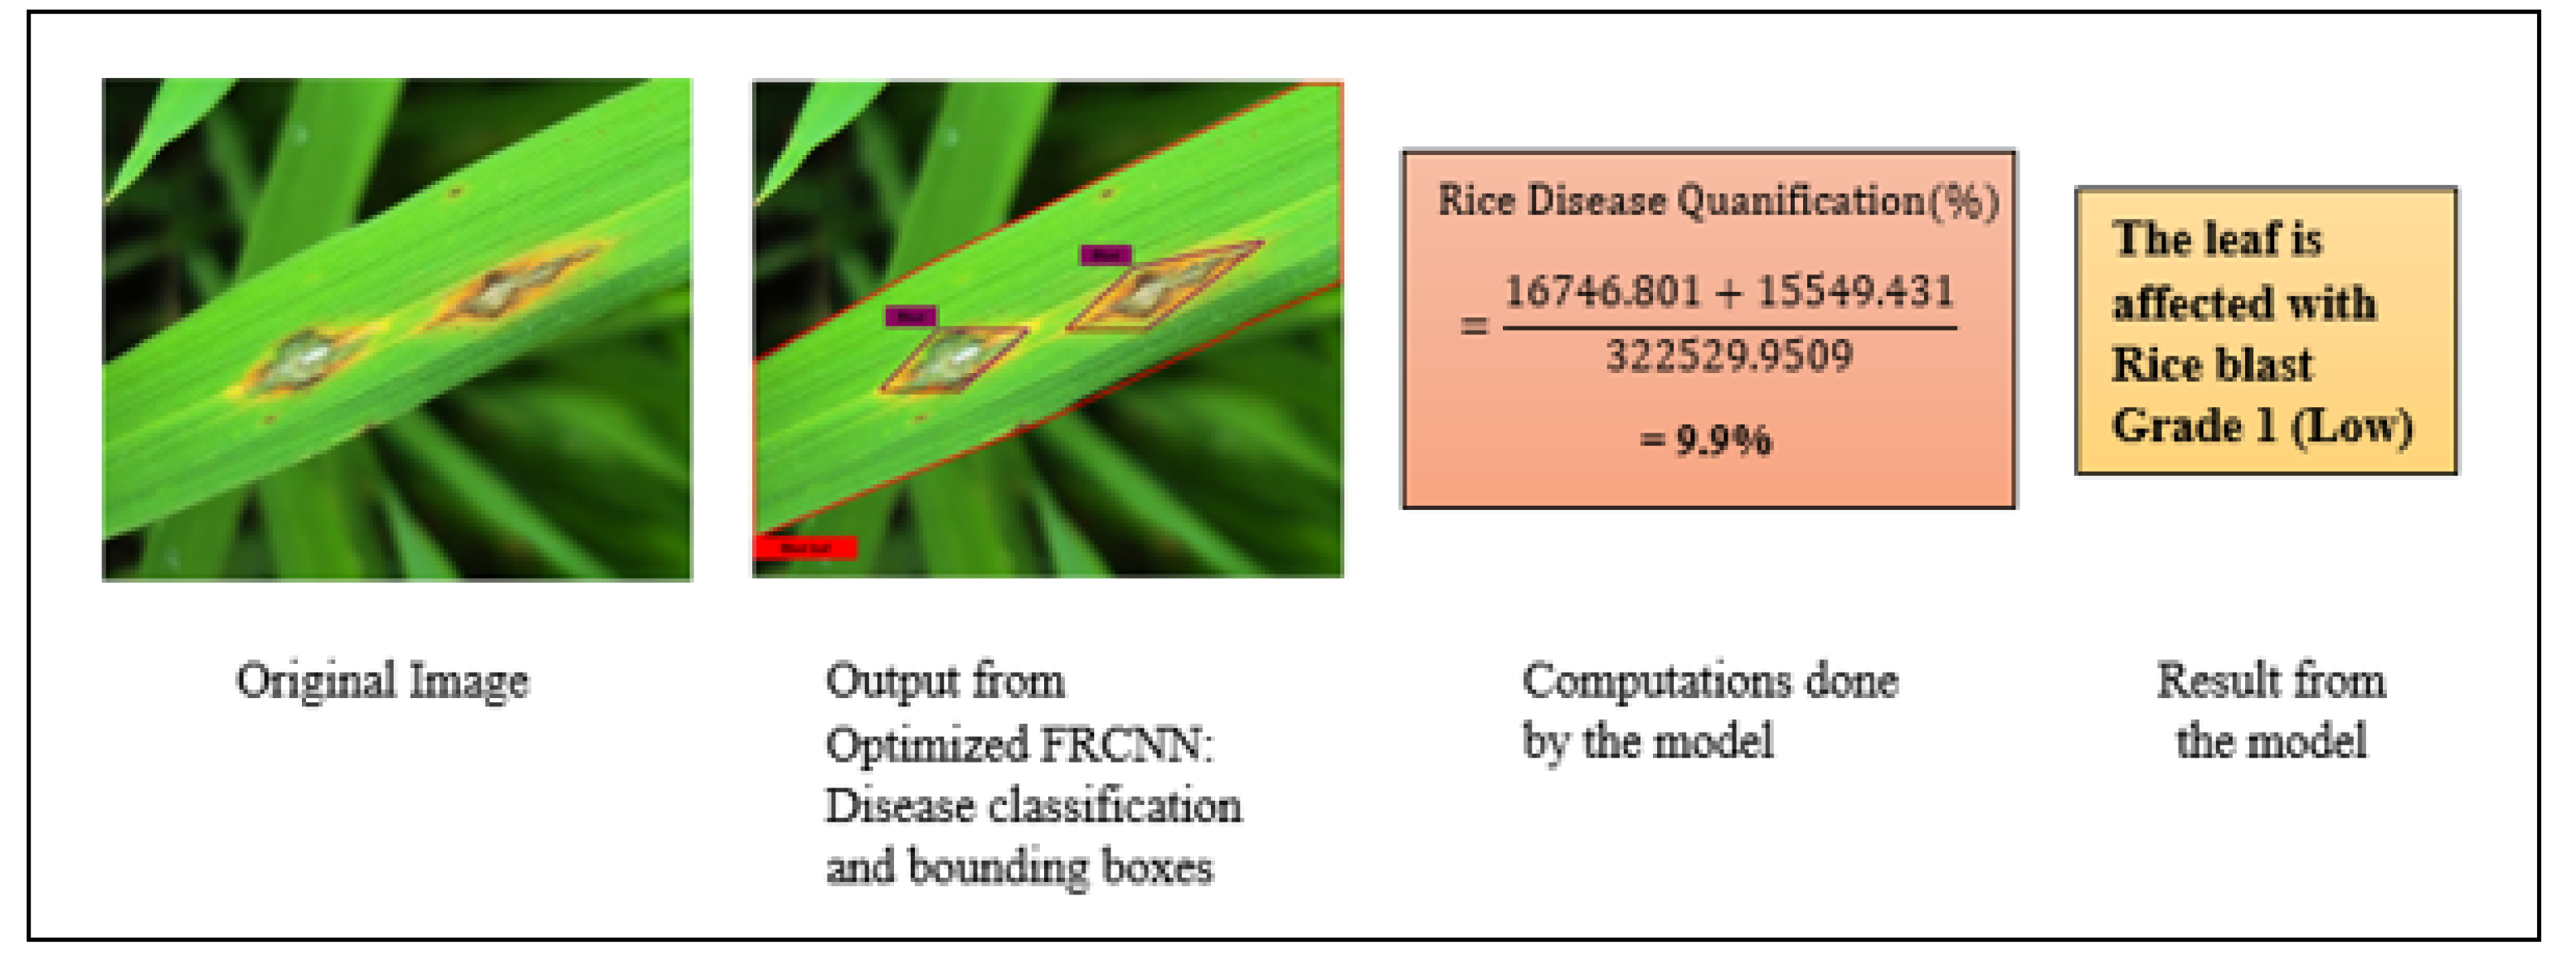
3.7. Rice Disease Severity Quantification

The rice disease severity quantification is performed after the execution of faster RCNN algorithm. The region of interest for the proposed model is the leaves of the rice crop. The algorithm can be applied to almost various species of rice. The other parts of the rice plant, such as rice grains, can be considered as the future scope of the research. The algorithm can handle images with multiple leaves against a single rice leaf blade which is the most common approach used in the existing literature. Initially, from the acquired image, the leaf instances are segregated. Then, from the segregated leaf instances, rice disease instances are found. The total area of leaf instance, as well as the total infectious part on the leaf, is also calculated. The severity percentage of the rice diseases is quantified by calculating the ratio of the diseased region (TDA) with leaf instances area (TLA). The severity quantification can be calculated by applying the formula in Equation (3).
S e v e r i t y Q u a n t i f i c a t i o n % = D i s e a s e a f f e c t e d b o u n d i n g b o x a r e a ( T D A ) ) T o t a l l e a f b o u n d i n g b o x a r e a ( T L A ) 100
The grading of the rice diseases is determined from severity quantification percentage value. The disease severity index of rice grade model is shown in Table 4.

4. Results and Discussion

4.1. Evaluation Parameters of Rice Grade Model

This paper used the testing dataset to evaluate the results of the training models to evaluate the performance of the applied object detection models. The following section will cover the specific details of the experiment’s findings. To evaluate the results of bounding box positioning, the standard statistical measures of intersection over union (IoU), sensitivity, and positive predictive value (PPV) are typically used. Precision refers to how accurately the model identifies only relevant objects. In other words, it measures the total number of TPs that the model has detected. The recall of the model measures how well it detects all ground truths. The IoU operation for model detection is to estimate the closeness between the predicted bounding box and the actual box. It can be used to determine whether the bounding box is correct. Figure 5 depicts the definition of the IoU. For the proposed model the threshold value is set to 0.7 which is obtained after trial and error basis, If the IoU value is greater than 0.7, the object detection classified results are considered true positive (TP). If the IoU value is less than 0.7, a false positive (FP) is considered. False negative (FN) for object detection means that the predicting results should have been positive, but the models detected the object incorrectly.
The IoU output is a popular technical indicator for evaluating the performance of object detection models. The definitions of PPV, sensitivity, and IoU are given in Equations from (4) to (6), respectively. PPV denotes the ability to recognize patterns in negative datasets. The ability of models to distinguish a negative dataset improves as the PPV score increases. Sensitivity represents the ability to recognize positive datasets. When the sensitivity score is higher, the ability of models to account for positive datasets improves.
P r e c i s i o n = T P T P + F P
S e n s i t i v i t y = T P T P + F N
I o U = O v e r l a p p i n g A r e a v i o l e t G r o u n d t r u t h p i n k + o v e r l a p p i n g a r e a v i o l e t + m o d e l p r e d i c t e d b l u e = T P T P + F P + F N

4.2. Comparison of Rice Grade Model Results Using Various Backbone Architectures

This section specifies the results of the rice grade model for rice disease quantification. Figure 7, Figure 8, Figure 9 and Figure 10 represents the positive predictive value and sensitivity values for VGG16, ResNet101, MobileNet, and EfficientNet-B0 backbone architectures, respectively. It is observed that rice grade model with EfficientNet-B0 backbone architecture outperforms VGG16, ResNet101, and MobileNet backbone architectures. The X-axis represents the PPV and sensitivity values and Y axis represents the metrics used for assessment.

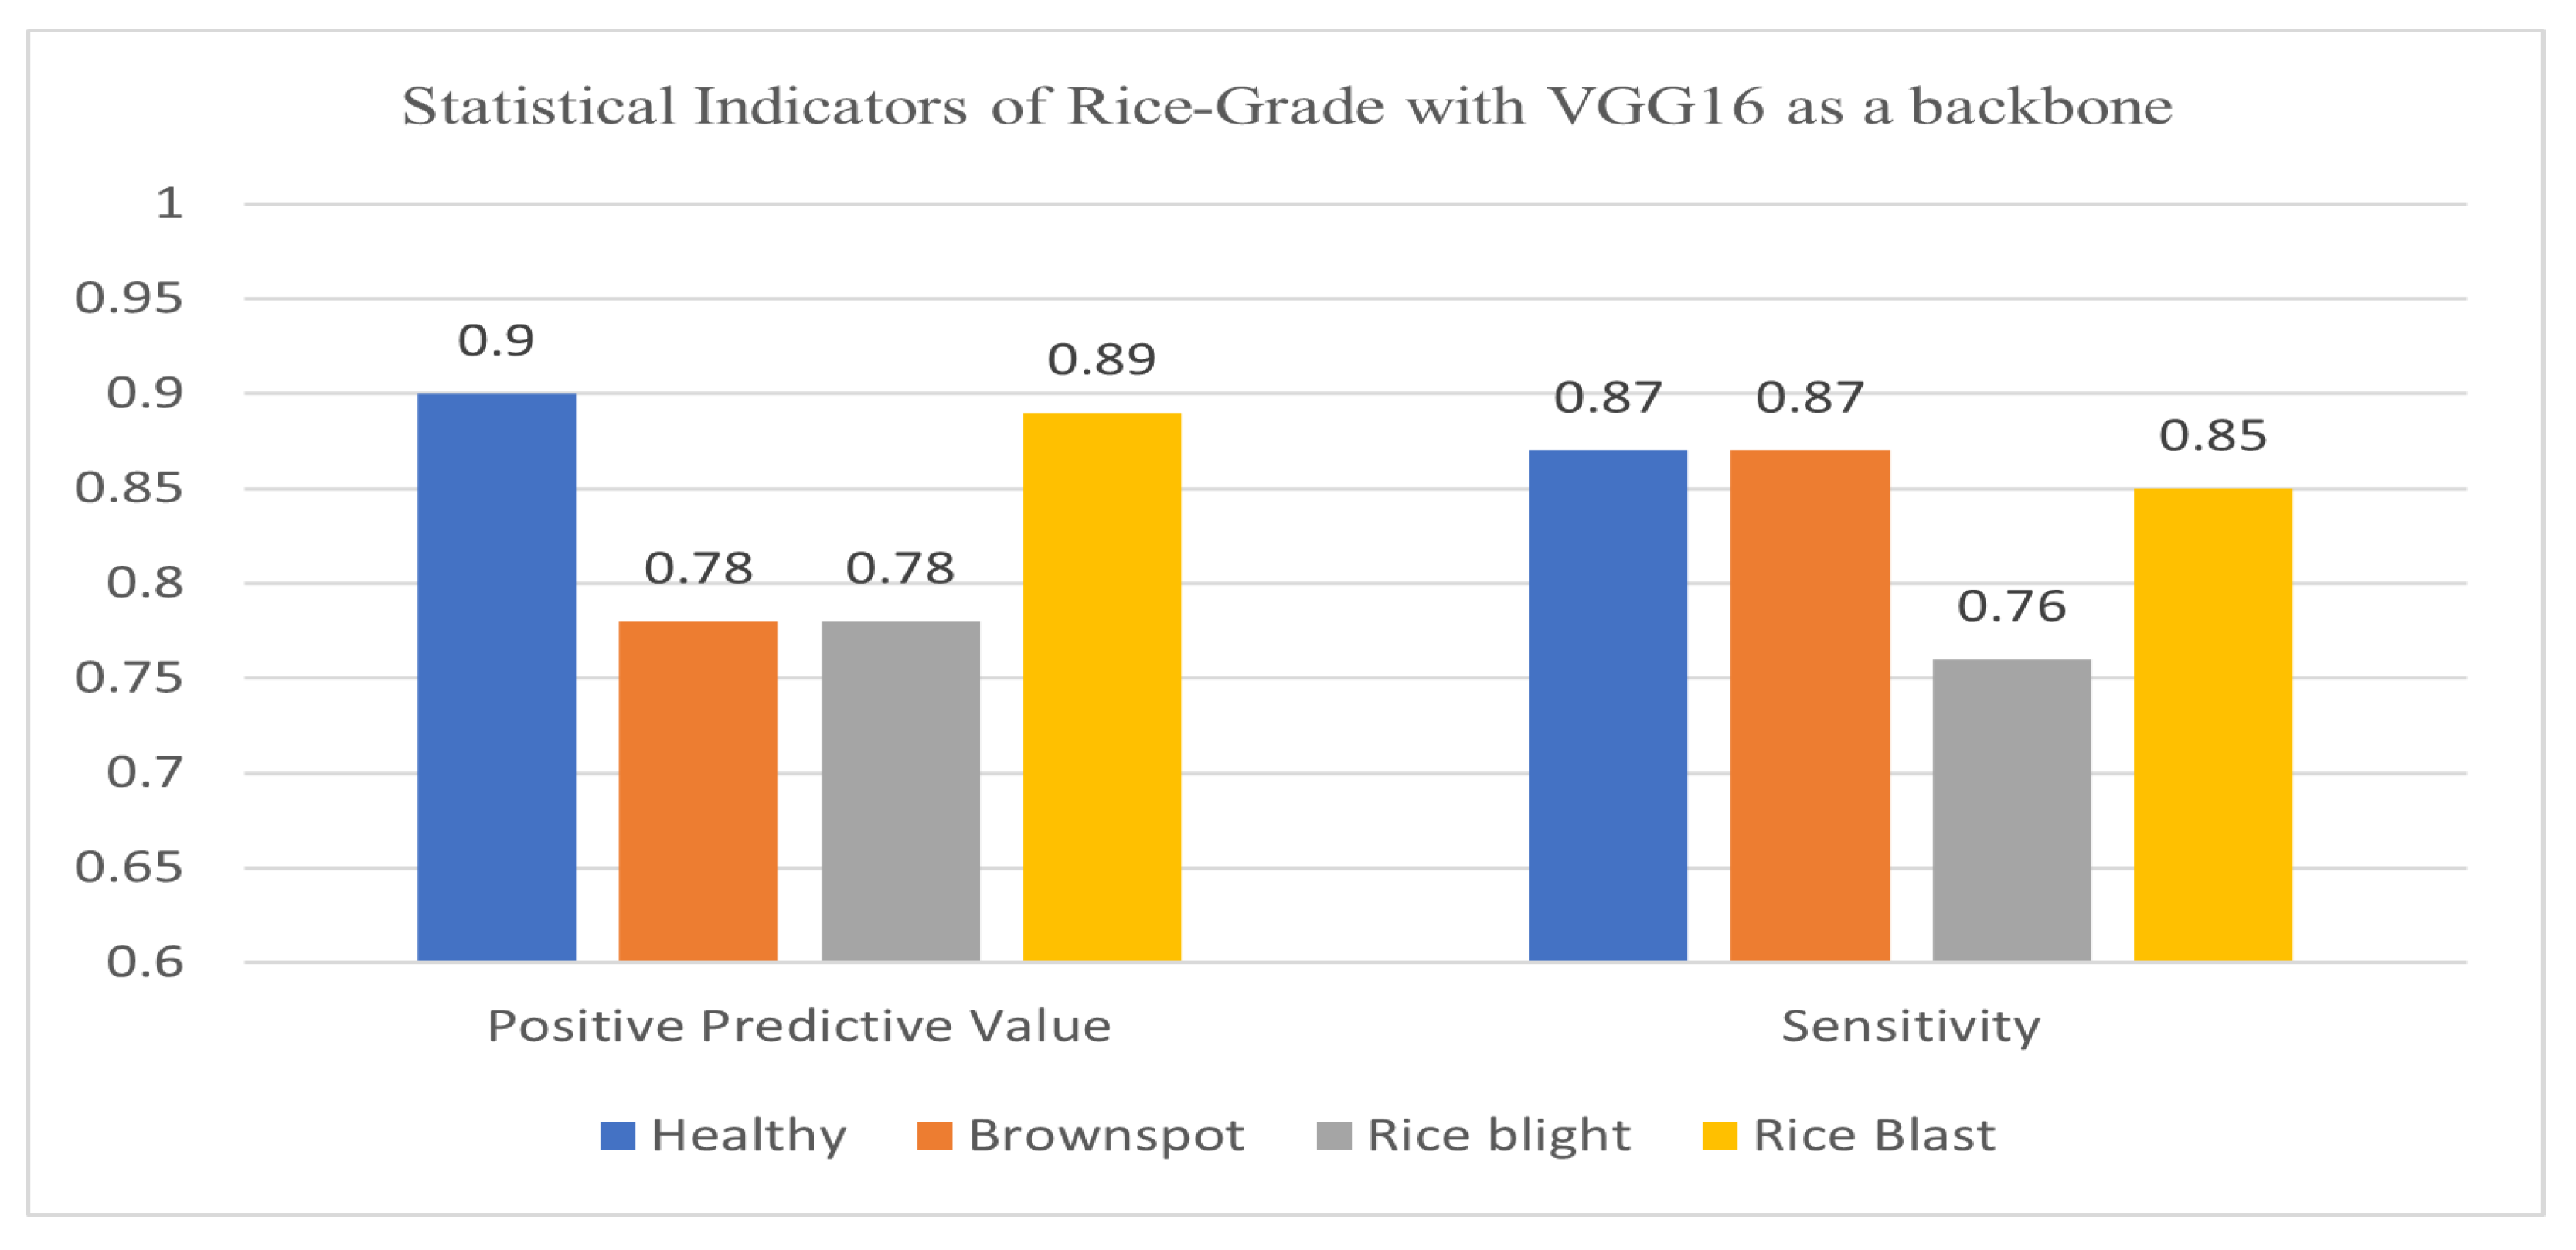
4.2.1. Statistical Indicators of Rice Grade with VGG16 as a Backbone

Figure 7 indicates a healthy class, and that blast disease can be classified more accurately as compared to brown spot and blight classes using VGG16 backbone model. The PPV and sensitivity values for all the classes ranges from 0.76 to 0.9 which can be improved. Hence VGG16 is not chosen as backbone architecture for rice grade.

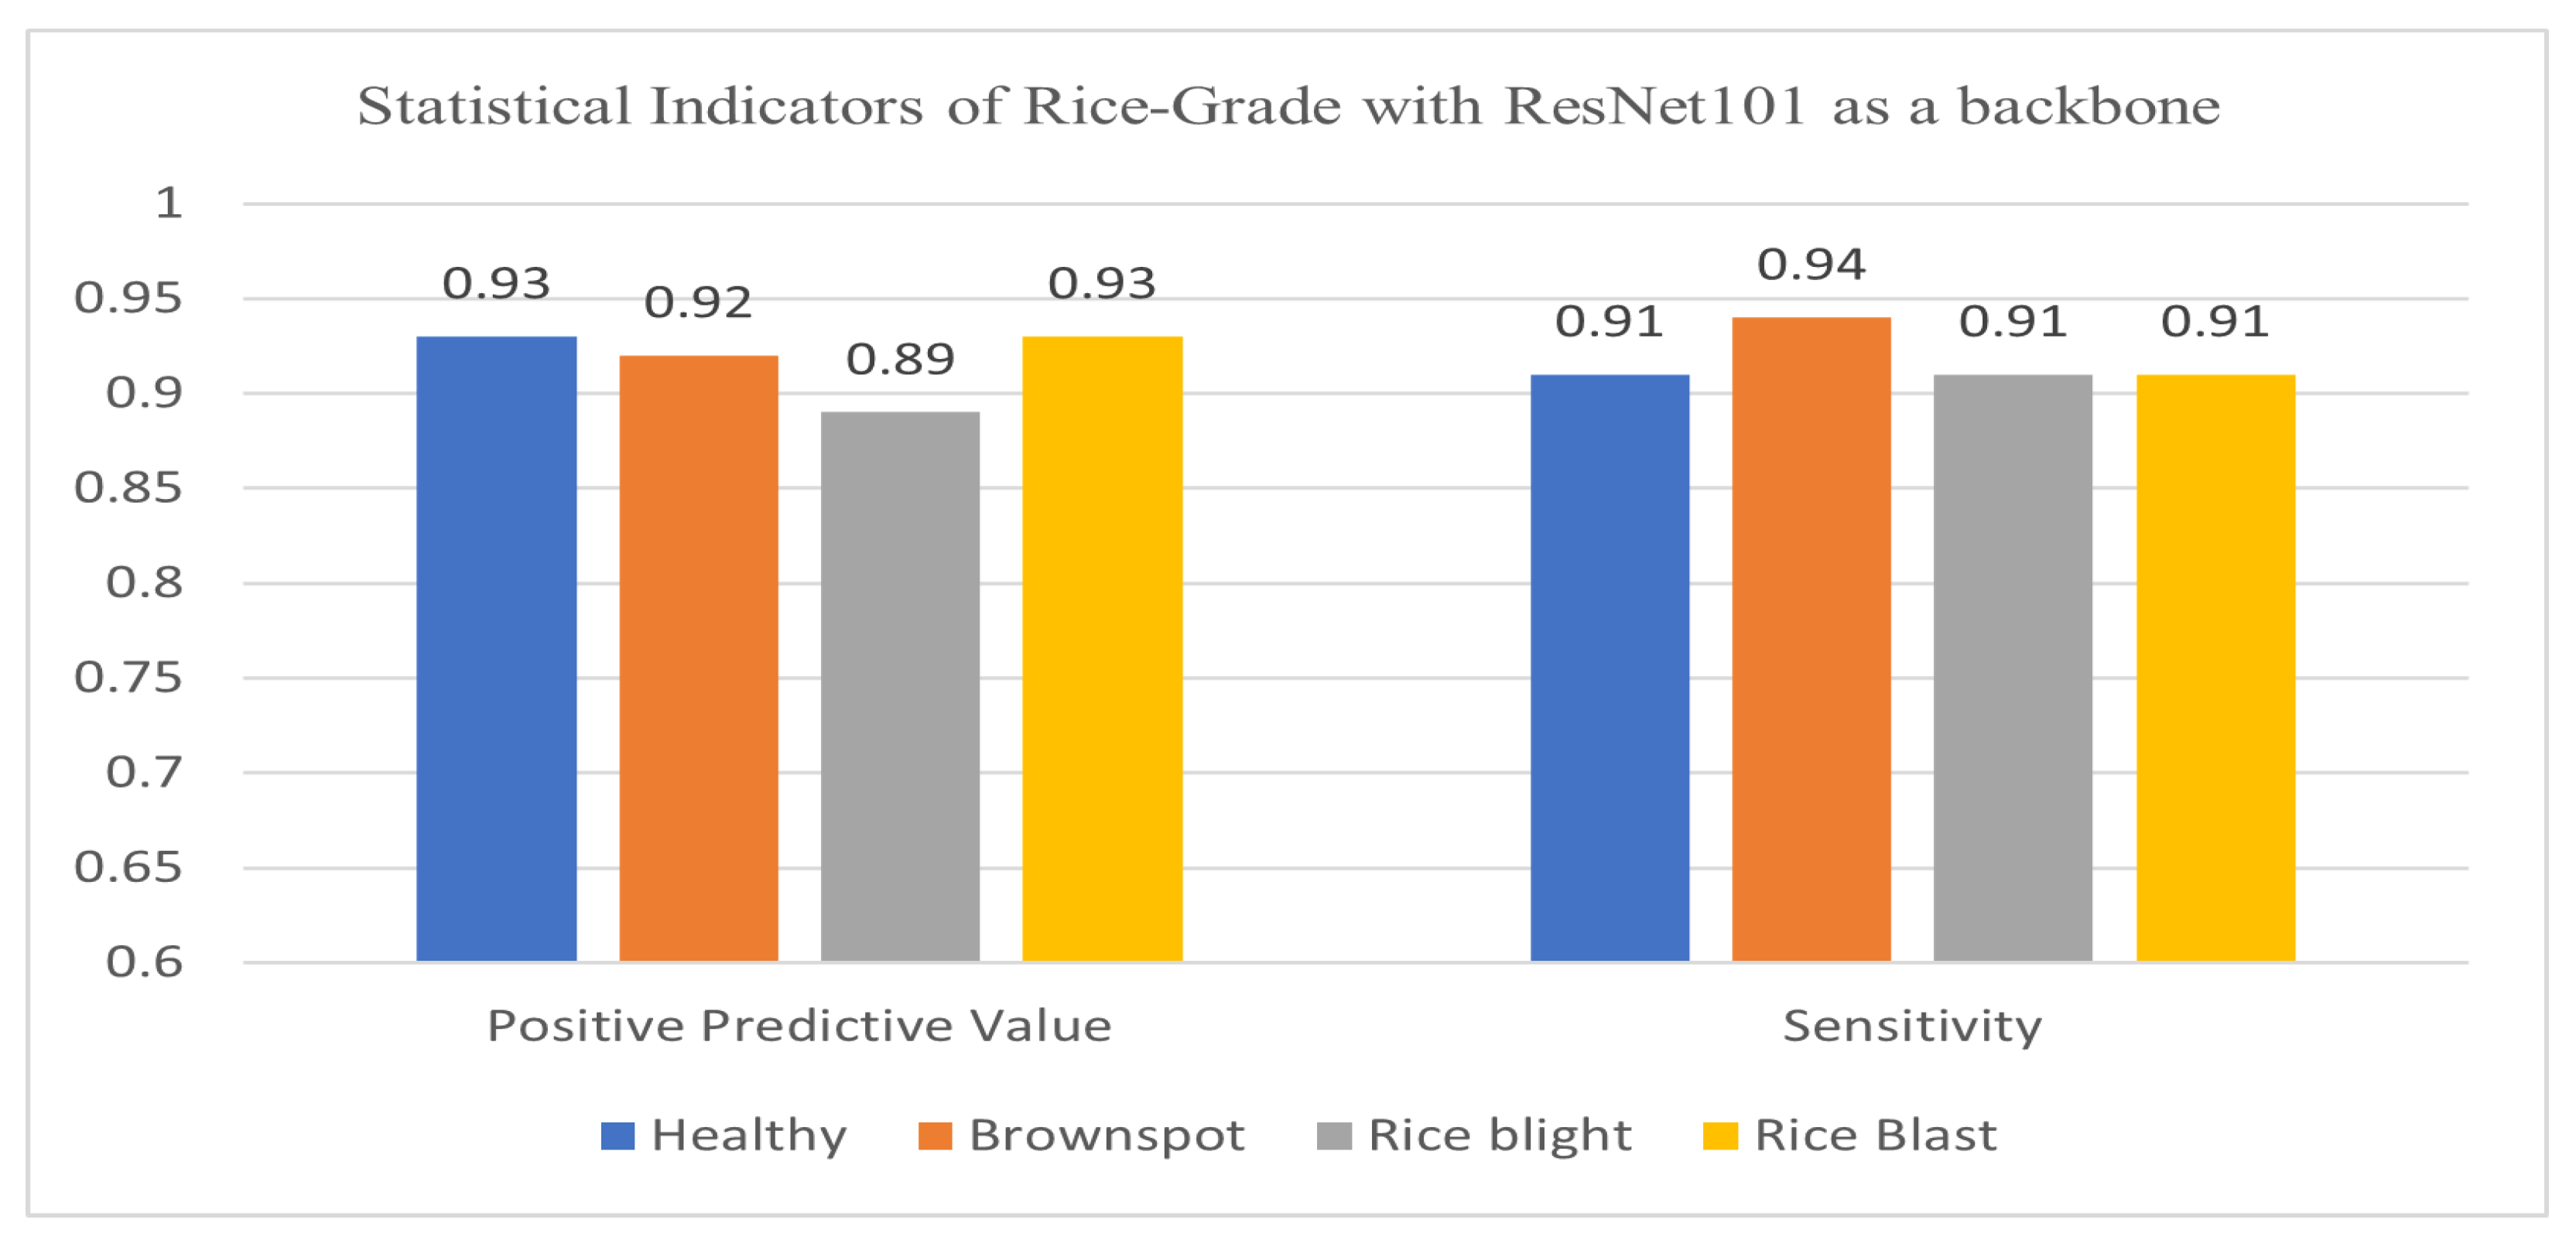
4.2.2. Statistical Indicators of Rice Grade with ResNet101 as a Backbone

Figure 8 represents the evaluation parameters of rice grade with ResNet101 as a backbone framework. The performance has slightly improved as it classifies brown spot disease class in more definite way when compared with VGG16 architecture. However, the performance is still not up to the mark.

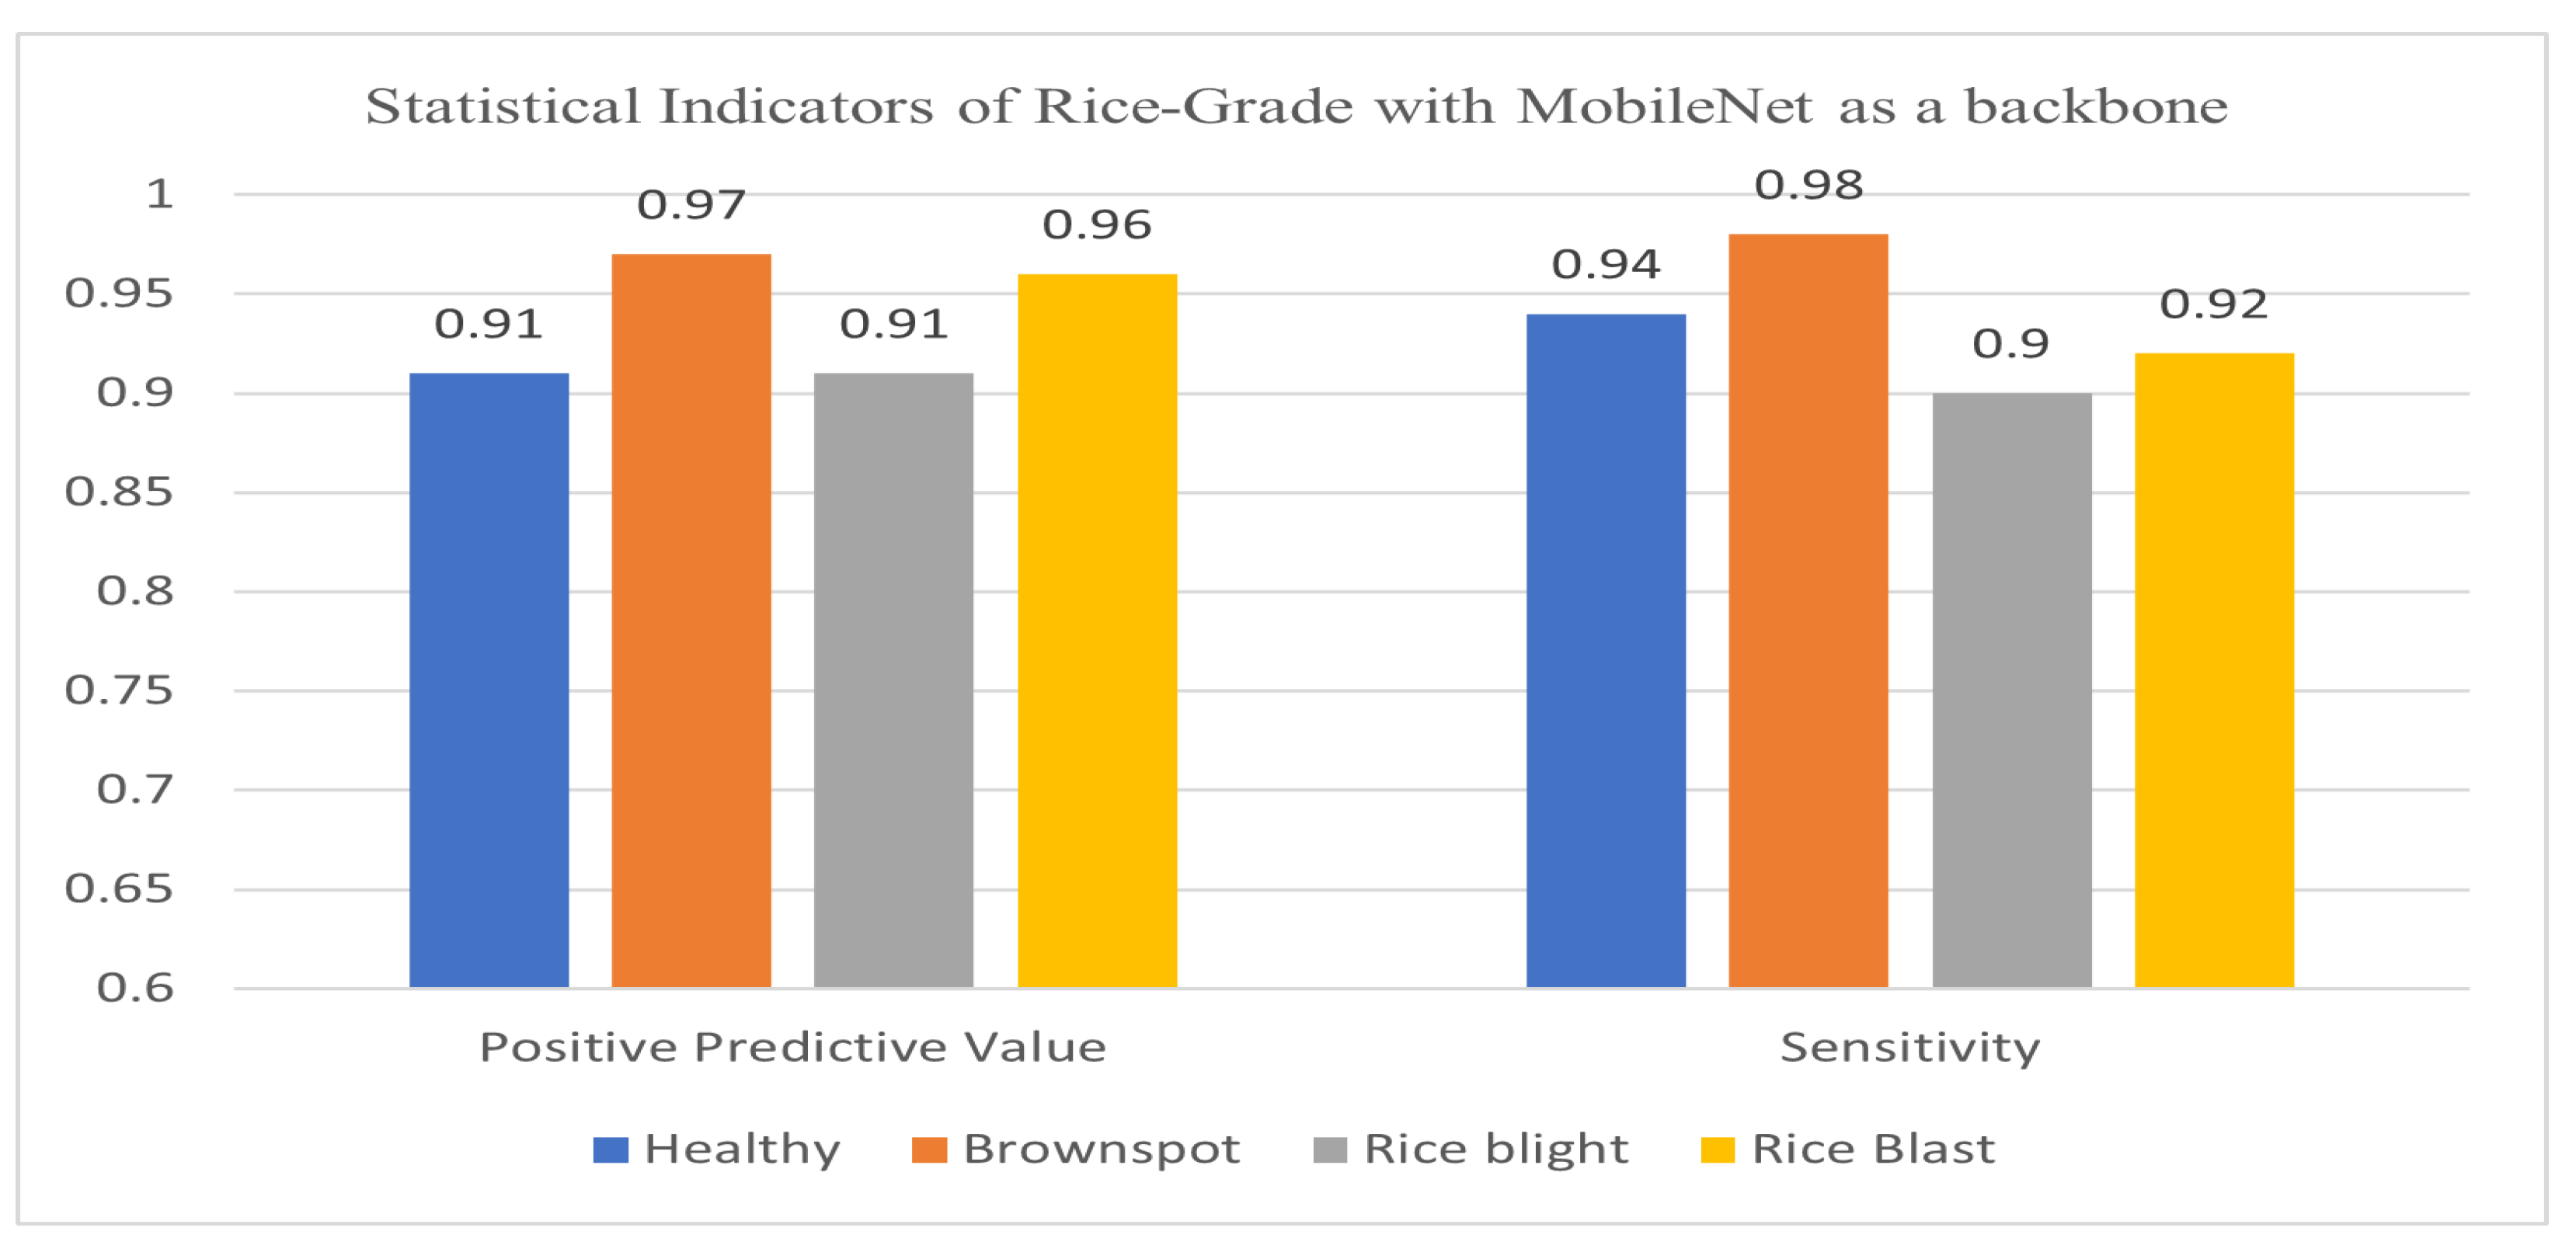
4.2.3. Statistical Indicators of Rice Grade with MobileNet as a Backbone

Figure 9 represents the evaluation parameters of rice grade with MobileNet as a backbone framework. The results demonstrated by the model are better as compared to earlier backbone architectures.

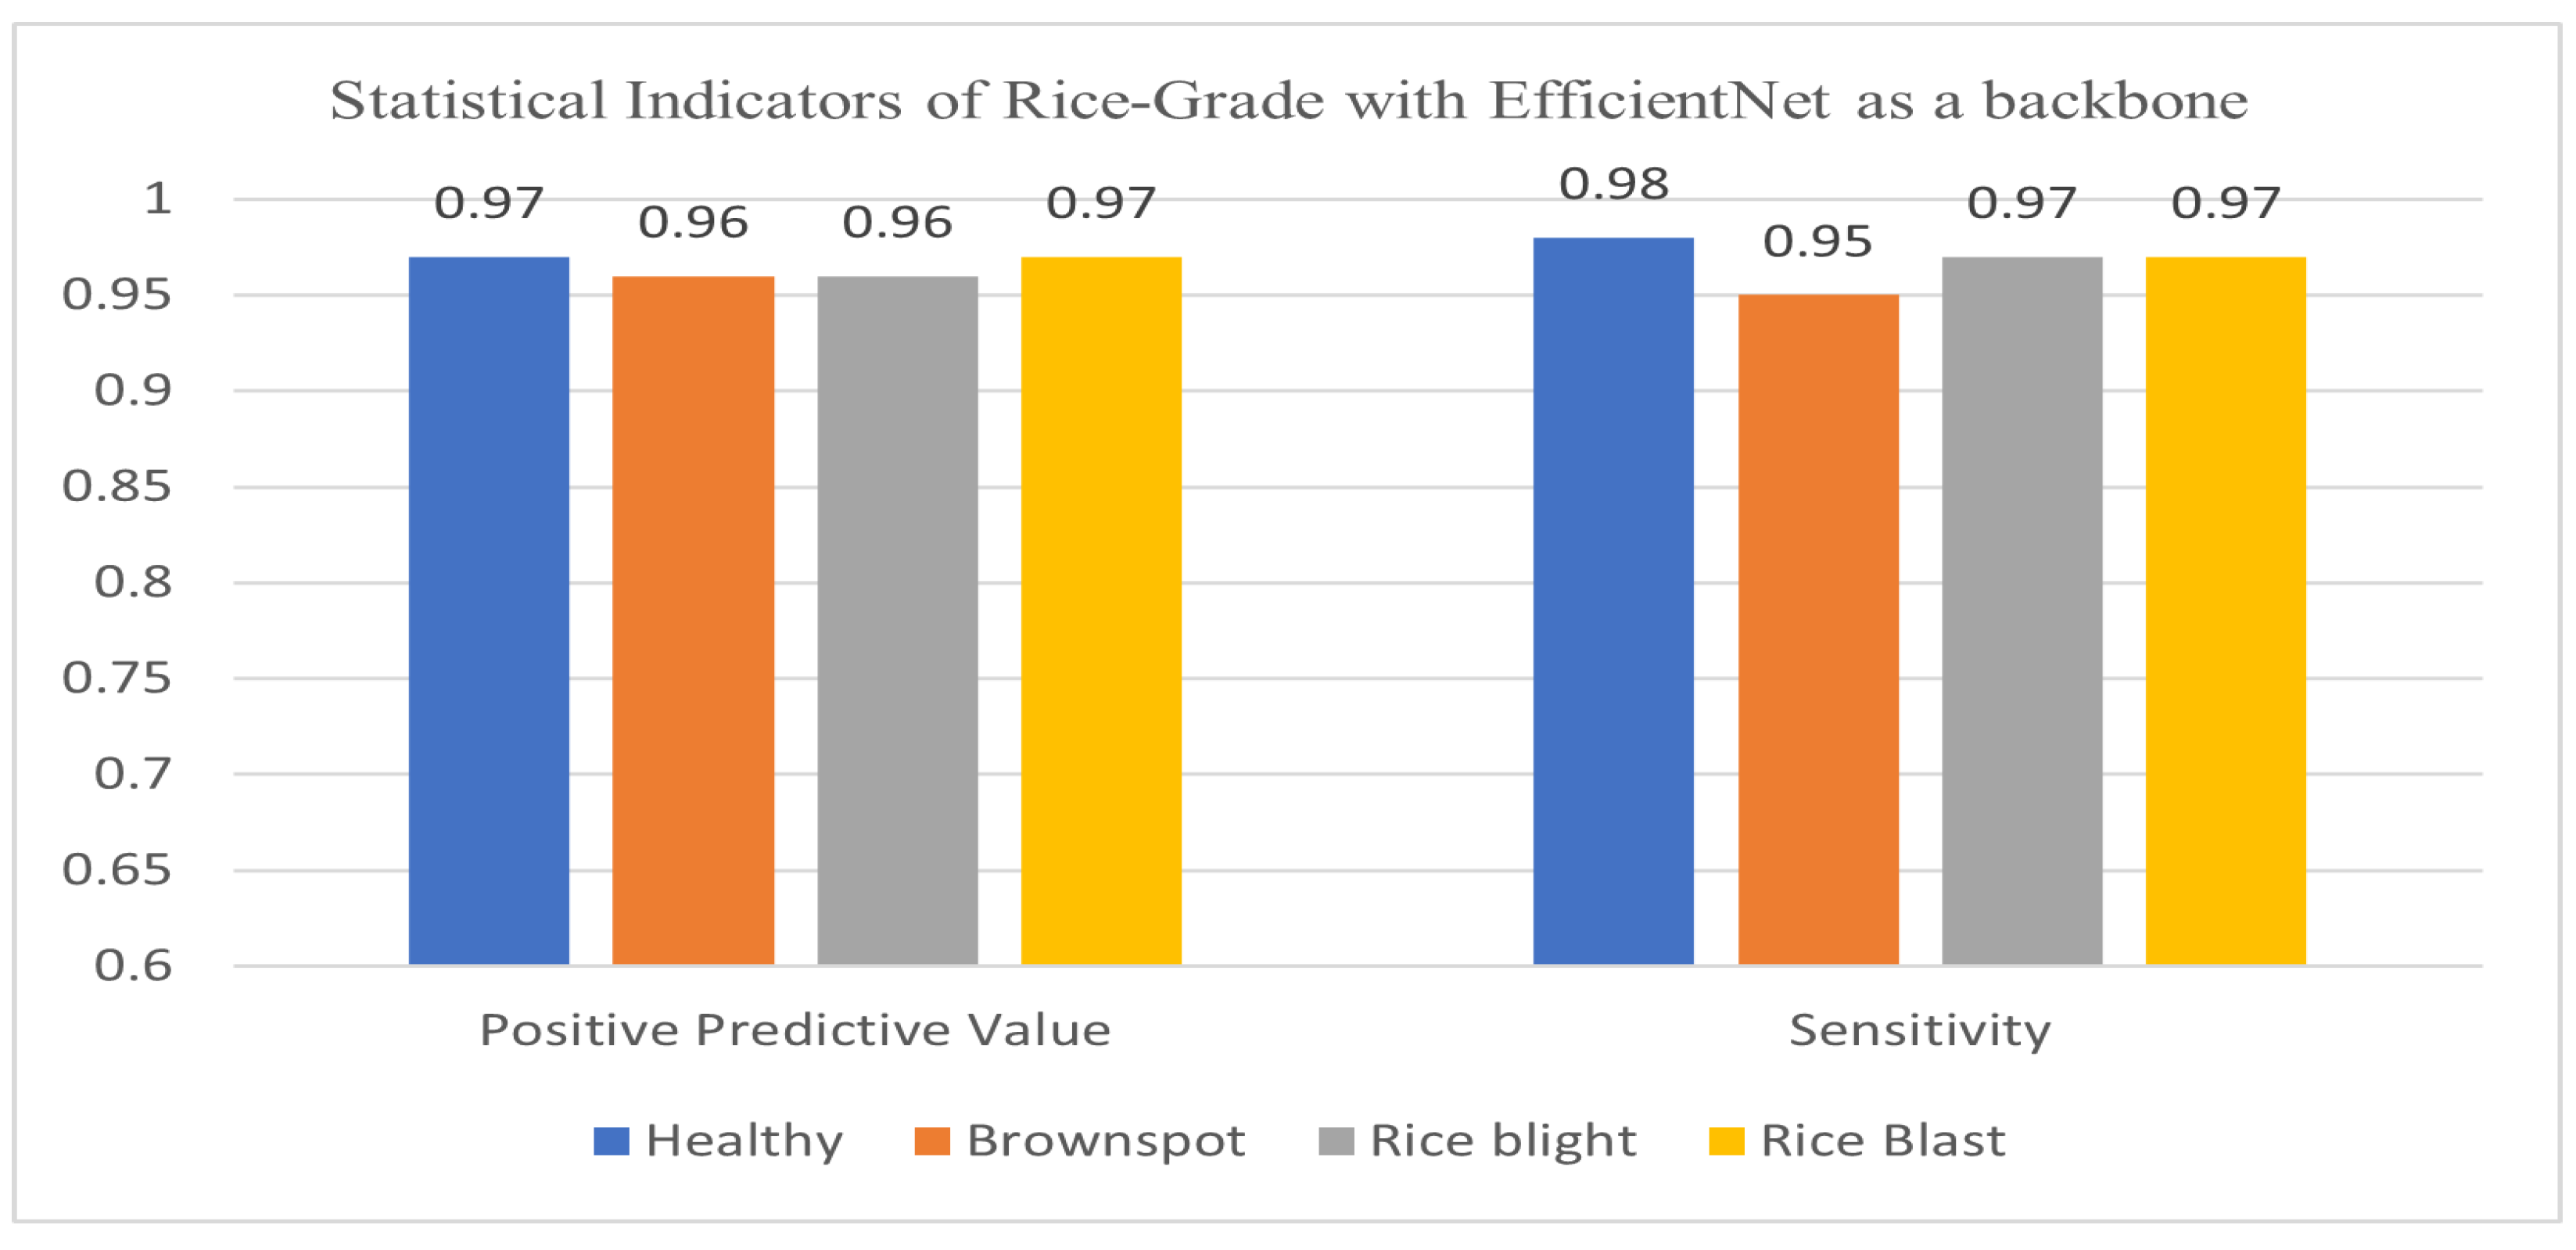
4.2.4. Statistical indicators of rice grade with EfficientNet-B0 as a backbone

Figure 10 represents the evaluation parameters of rice grade with EfficcientNet as a backbone framework. EfficcientNet architecture outperforms other backbone architectures as DSC score for all the classes are highest of all. Hence, EfficientNet-B0 becomes the optimal choice for proposed rice grade model.

4.2.5. Average Precision Parameter Comparison of Rice Grade with Various Backbone Architectures and Different Threshold Values

Table 5 shows the average precision values for two criteria, which is 0.7 and 0.8 for VGG16, ResNet101, MobileNet, and EfficientNet-B0. It can be concluded that when IoU value is 0.7 the model gives best performance in detecting rice disease severity with EfficientNet-B0 as backbone.

4.2.6. Training Time and Inference Time of Rice Grade with Various Backbone Architecture

Table 6 shows the training time (TT) in minutes and the inference time (IT) in milliseconds [52]. Table 6 shows that EfficientNet-B0 is the quickest training and inference time. The average per picture inference time in milliseconds over ten runs for all backbone models considered is listed in the table for batch size equal to one on Tesla k80. According to Table 6, when the batch size is one, all backbone models can achieve excellent real-time performance on the Tesla k80. EfficientNet-B0 is computationally simpler and thus takes up less computing space. As a result, in terms of training and inference speeds, EfficientNet-B0 outperforms the other architectures. VGG16, on the other hand, is by far the most expensive architecture investigated for this experiment, both in terms of processing requirements and the number of parameters tested. Increasing the number of layers and parameters, on the other hand, had no effect in this scenario because the model’s complexity began to outweigh the accuracy gains. As a result, accuracy began to saturate at a certain point. Overall, comparing the computational speeds and model accuracy, it appears that there is no linear relationship between the model computational speeds and model accuracy for this experiment. MobileNet, for example, has a longer inference and training time than EfficientNet-B0, but their accuracy is very close. As a result, EfficientNet-B0 is the best choice for grading the severity of rice diseases.
Figure 11 represents the final result produced by the rice grade model. In Figure 11, the leaf image is of rice blast. The predicted boundary boxes of the leaf instance is represented by red color and disease instances boundary boxes is represented by pink color. The pixel area of red bounding box and pink bounding box is calculated and the ratio of pink to red area is taken to calculate the severity grade level of the rice blast disease. Finally, the percentage is mapped to Table 4 and as per the percentage the model outputs that the leaf is affected with rice blast disease with grade 1 (low) severity level.
Table 7 shows the comparison of rice grade with the state-of-the-art crop disease severity estimation techniques.

4.2.7. Limitations of the Work

  • Need of database expansion: The size of the dataset has a significant impact on the deep learning model’s performance. The suggested model training is strongly reliant on images that have undergone numerous post-processing processes. One of the challenges of this project is the restricted number of images available. As a result, database expansion is required to achieve greater accuracy.
  • Data annotation: The image annotation task is predominant in artificial intelligence models for estimating rice disease severity. The annotations of the image are entirely subject to the annotator’s expertise in identifying rice diseases.

5. Conclusions and Future Work

It is crucial to deploy a real-time rice disease severity estimation system to increase crop productivity. Therefore, a severity estimation system is proposed to identify the type and quantity of the infection on the leaves. This system has a unique feature that simultaneously detects and segments rice infections using images. This feature makes the proposed rice grade model more suitable for an automated, integrated management system for rice crops. The proposed model outperforms the existing severity quantification systems for crops in the literature. The experimental results reveal that the proposed model achieves a superior result in recognizing the three disease classes of rice disease and one healthy class, identifying blight with sensitivity score of 97%, blast with that of 97%, and brown spot with that of 95%. Further, the disease severity level was quantified by taking the ratio of leaf area and the affected areas. This study also proves that the architecture could improve the speed and increase the accuracy of real-time disease level estimation. The effectiveness of the rice grade model is represented by comparing it with other available CNN architectures in the literature for object detection. In comparison to the other architectures, the rice grade model trained with the feature extractor Resnet-101 achieved the highest mean average precision. Using an Adam optimizer to train obtained the most significant identification results, gaining 92% of mAP. The overall accuracy achieved is 96.43%. This accuracy is achieved using paradigms such as transfer learning and deep learning techniques for object detection and localization. Thus, the rice grade severity quantification model described in this work can grade the severity of the infection on rice with high accuracy. The system can handle the real-time rice diseases image dataset collected in heterogeneous backgrounds corresponding to diseases. It can be concluded that the proposed method is new because the quantification based on the leaf instances and the diseased area is calculated. The successful severity estimation of rice diseases by artificial intelligence techniques would lead to the appropriate application of pesticides and fungicides. The following are some future recommendations for the scientific community:
  • The data samples collected are limited as far as different environmental conditions are considered. The requirement of deep learning techniques is a large number of data samples. So, the few shot learning approach is recommended, which works on very few data samples and achieves better accuracy.
  • The accuracy can be improved using techniques, such as removing features, cross-validation, early stopping, ensembling, regularization, etc., which can prevent overfitting.
  • Agricultural experts must be involved in annotating rice leaf instances and disease instances. So, creating publicly available annotated datasets is recommended to help agricultural researchers enhance their research in this field.
  • It can be further helpful for agricultural robot systems that quantify the crop disease severity level in real-time, contributing to precision agriculture.

Author Contributions

Conceptualization, R.R.P. and S.K.; methodology, R.R.P. and S.K.P.; software, R.R.; validation, S.C. and R.R.P.; formal analysis, S.K.; resources, S.K. and R.R.; writing—original draft preparation, R.R.P. and S.K.; writing—review and editing, S.C. and S.K.; supervision, S.K.; project administration, S.K.; funding acquisition, S.C., R.R. and S.K.P. All authors have read and agreed to the published version of the manuscript.

Funding

This research received no external funding.

Institutional Review Board Statement

Not applicable.

Data Availability Statement

Not applicable.

Conflicts of Interest

The authors declare no conflict of interest.

References

  1. Patil, R.R.; Kumar, S. Predicting rice diseases across diverse agro-meteorological conditions using an artificial intelligence approach. PeerJ Comput. Sci. 2021, 7, e687. [Google Scholar] [CrossRef] [PubMed]
  2. Patil, R.R.; Kumar, S. Priority selection of agro-meteorological parameters for integrated plant diseases management through analytical hierarchy process. Int. J. Electr. Comput. Eng. 2022, 12, 649–659. [Google Scholar] [CrossRef]
  3. Mutka, A.M.; Bart, R.S. Image-based phenotyping of plant disease symptoms. Front. Plant Sci. 2015, 5, 734. [Google Scholar] [CrossRef] [PubMed] [Green Version]
  4. Patil, R.; Kumar, S. A Bibliometric Survey on the Diagnosis of Plant Leaf Diseases using Artificial Intelligence. Libr. Philos. Pract. 2020, 2020, 3987. [Google Scholar]
  5. Ampatzidis, Y.; Bellis, L.D.; Luvisi, A. iPathology: Robotic applications and management of plants and plant diseases. Sustainability 2017, 9, 1010. [Google Scholar] [CrossRef] [Green Version]
  6. Wang, G.; Sun, Y.; Wang, J. Automatic Image-Based Plant Disease Severity Estimation Using Deep Learning. Comput. Intell. Neurosci. 2017, 2017, 2917536. [Google Scholar] [CrossRef] [Green Version]
  7. Patil, S.B.; Bodhe, S.K. Leaf disease severity measurement using image processing. Int. J. Eng. Technol. 2011, 3, 297–301. [Google Scholar]
  8. Patil, R.R.; Kumar, S. Rice-Fusion: A Multimodality Data Fusion Framework for Rice Disease Diagnosis. IEEE Access 2022, 10, 5207–5222. [Google Scholar] [CrossRef]
  9. Cruz, A.; Ampatzidis, Y.; Pierro, R.; Materazzi, A.; Panattoni, A.; De Bellis, L.; Luvisi, A. Detection of grapevine yellows symptoms in Vitis vinifera L. with artificial intelligence. Comput. Electron. Agric. 2019, 157, 63–76. [Google Scholar] [CrossRef]
  10. Johannes, A.; Picon, A.; Alvarez-Gila, A.; Echazarra, J.; Rodriguez-Vaamonde, S.; Navajas, A.D.; Ortiz-Barredo, A. Automatic plant disease diagnosis using mobile capture devices, applied on a wheat use case. Comput. Electron. Agric. 2017, 138, 200–209. [Google Scholar] [CrossRef]
  11. Zhang, J.; Naik, H.S.; Assefa, T.; Sarkar, S.; Reddy, R.V.; Singh, A.; Ganapathysubramanian, B.; Singh, A.K. Computer vision and machine learning for robust phenotyping in genome-wide studies. Sci. Rep. 2017, 7, 44048. [Google Scholar] [CrossRef] [Green Version]
  12. Ngugi, L.C.; Abelwahab, M.; Abo-Zahhad, M. Recent advances in image processing techniques for automated leaf pest and disease recognition—A review. Inf. Process. Agric. 2021, 8, 27–51. [Google Scholar] [CrossRef]
  13. Garg, K.; Bhugra, S.; Lall, B. Automatic quantification of plant disease from field image data using deep learning. In Proceedings of the IEEE/CVF Winter Conference on Applications of Computer Vision (WACV), Virtual, 5–9 January 2021; pp. 1964–1971. [Google Scholar] [CrossRef]
  14. Sandika, B.; Avil, S.; Sanat, S.; Srinivasu, P. Random forest based classification of diseases in grapes from images captured in uncontrolled environments. In Proceedings of the 2016 IEEE 13th International Conference on Signal Processing (ICSP), Chengdu, China, 6–10 November 2016; pp. 1775–1780. [Google Scholar] [CrossRef]
  15. Patil, P.; Yaligar, N.; Meena, S. Comparision of Performance of Classifiers—SVM, RF and ANN in Potato Blight Disease Detection Using Leaf Images. In Proceedings of the 2017 IEEE International Conference on Computational Intelligence and Computing Research, ICCIC 2017, Coimbatore, India, 14–16 December 2017; pp. 1–5. [Google Scholar] [CrossRef]
  16. Li, D.; Wang, R.; Xie, C.; Liu, L.; Zhang, J.; Li, R.; Wang, F.; Zhou, M.; Liu, W. A recognition method for rice plant diseases and pests video detection based on deep convolutional neural network. Sensors 2020, 20, 578. [Google Scholar] [CrossRef] [Green Version]
  17. Amara, J.; Bouaziz, B.; Algergawy, A. Amara, J.; Bouaziz, B.; Algergawy, A. A deep learning-based approach for banana leaf diseases classification. In Datenbanksysteme für Business, Technologie und Web (BTW 2017)—Workshopband; Gesellschaft für Informatik e.V.: Bonn, Germany, 2017; Volume 266, pp. 79–88. [Google Scholar]
  18. Brahimi, M.; Boukhalfa, K.; Moussaoui, A. Deep Learning for Tomato Diseases: Classification and Symptoms Visualization. Appl. Artif. Intell. 2017, 31, 299–315. [Google Scholar] [CrossRef]
  19. Thailambal, G.; Yogeshwari, M. Automatic segmentation of plant leaf disease using improved fast Fuzzy C-Means clustering and adaptive Otsu thresholding. Eur. J. Mol. Clin. Med. 2020, 7, 5447–5462. [Google Scholar]
  20. Chen, S.; Zhang, K.; Zhao, Y.; Sun, Y.; Ban, W.; Chen, Y.; Zhuang, H.; Zhang, X.; Liu, J.; Yang, T. An approach for rice bacterial leaf streak disease segmentation and disease severity estimation. Agriculture 2021, 11, 420. [Google Scholar] [CrossRef]
  21. Sharma, P.; Berwal, Y.P.S.; Ghai, W. Performance analysis of deep learning CNN models for disease detection in plants using image segmentation. Inf. Process. Agric. 2020, 7, 566–574. [Google Scholar] [CrossRef]
  22. Tekam, E.R.; Pimple, J. A Survey Disease Detection Mechanism for Cotton Leaf: Training & Precaution. Int. J. Innov. Res. Sci. Eng. Technol. 2017, 6, 205–210. [Google Scholar]
  23. Abiodun, O.I.; Jantan, A.; Omolara, A.E.; Dada, K.V.; Mohamed, N.A.E.; Arshad, H. State-of-the-art in artificial neural network applications: A survey. Heliyon 2018, 4, e00938. [Google Scholar] [CrossRef] [Green Version]
  24. Zhu, J.H.; Wu, A.; Li, P. Corn leaf diseases diagnostic techniques based on image recognition. Commun. Comput. Inf. Sci. 2012, 288, 334–341. [Google Scholar] [CrossRef]
  25. Alaknanda; Anand, R.S.; Kumar, P. Flaw detection in radiographic weld images using morphological approach. NDT E Int. 2006, 39, 29–33. [Google Scholar] [CrossRef]
  26. Zhang, J.-h.; Kong, F.-t.; Wu, J.-z.; Han, S.-q.; Zhai, Z.-f. Automatic image segmentation method for cotton leaves with disease under natural environment. J. Integr. Agric. 2018, 17, 1800–1814. [Google Scholar] [CrossRef]
  27. Ghaiwat, S.N.; Arora, P. Detection and Classification of Plant Leaf Diseases Using Image processing Techniques: A Review. Int. J. Recent Adv. Eng. Technol. (IJRAET) ISSN (Online) 2014, 2, 2347–2812. [Google Scholar]
  28. Cheng, H.D.; Jiang, X.H.; Sun, Y.; Wang, J. Color image segmentation: Advances and prospects. Pattern Recognit. 2001, 34, 2259–2281. [Google Scholar] [CrossRef]
  29. Verma, T.; Dubey, S. Impact of Color Spaces and Feature Sets in Automated Plant Diseases Classifier: A Comprehensive Review Based on Rice Plant Images. Arch. Comput. Methods Eng. 2020, 27, 1611–1632. [Google Scholar] [CrossRef]
  30. Abayomi, B.; Rapheal, I.A.; Olaitan, B.M.; City, L. Performance Comparison of Carbonized and Un- Carbonized Neem Leaves Briquette. J. DOI 2021, 7, 50–59. [Google Scholar] [CrossRef]
  31. Özgüven, M.M. Determination of Sugar Beet Leaf Spot Disease Level (Cercospora Beticola Sacc.) with Image Processing Technique by Using Drone. Curr. Investig. Agric. Curr. Res. 2018, 5, 621–631. [Google Scholar] [CrossRef]
  32. Al-Tarawneh, M.S. An empirical investigation of olive leave spot disease using auto-cropping segmentation and fuzzy C-means classification. World Appl. Sci. J. 2013, 23, 1207–1211. [Google Scholar] [CrossRef]
  33. Arsenovic, M.; Karanovic, M.; Sladojevic, S.; Anderla, A.; Stefanovic, D. Solving current limitations of deep learning based approaches for plant disease detection. Symmetry 2019, 11, 939. [Google Scholar] [CrossRef] [Green Version]
  34. Patil, R.R.; Kumar, S. Rice Transformer: A Novel Integrated Management System for Controlling Rice Diseases. IEEE Access 2022, 10, 87698–87714. [Google Scholar] [CrossRef]
  35. Wang, Y.; Wang, H.; Peng, Z. Rice diseases detection and classification using attention based neural network and bayesian optimization. Expert Syst. Appl. 2021, 178, 114770. [Google Scholar] [CrossRef]
  36. Goluguri, N.V.R.R.; Devi, K.S.; Srinivasan, P. Rice-net: An efficient artificial fish swarm optimization applied deep convolutional neural network model for identifying the Oryza sativa diseases. Neural Comput. Appl. 2021, 33, 5869–5884. [Google Scholar] [CrossRef]
  37. Li, W.; Zheng, T.; Yang, Z.; Li, M.; Sun, C.; Yang, X. Classification and detection of insects from field images using deep learning for smart pest management: A systematic review. Ecol. Inform. 2021, 66, 101460. [Google Scholar] [CrossRef]
  38. Xie, X.; Ma, Y.; Liu, B.; He, J.; Li, S.; Wang, H. A Deep-Learning-Based Real-Time Detector for Grape Leaf Diseases Using Improved Convolutional Neural Networks. Front. Plant Sci. 2020, 11, 751. [Google Scholar] [CrossRef] [PubMed]
  39. Hammad Saleem, M.; Khanchi, S.; Potgieter, J.; Mahmood Arif, K. Image-based plant disease identification by deep learning meta-architectures. Plants 2020, 9, 1451. [Google Scholar] [CrossRef]
  40. Liu, J.; Wang, X. Plant diseases and pests detection based on deep learning: A review. Plant Methods 2021, 17, 22. [Google Scholar] [CrossRef]
  41. Fuentes, A.; Yoon, S.; Kim, S.C.; Park, D.S. A robust deep-learning-based detector for real-time tomato plant diseases and pests recognition. Sensors 2017, 17, 2022. [Google Scholar] [CrossRef] [Green Version]
  42. Feng, C.; Jiang, M.; Huang, Q.; Zeng, L.; Zhang, C.; Fan, Y. A Lightweight Real-Time Rice Blast Disease Segmentation Method Based on DFFANet. Agriculture 2022, 12, 1543. [Google Scholar] [CrossRef]
  43. Jiao, L.; Dong, S.; Zhang, S.; Xie, C.; Wang, H. AF-RCNN: An anchor-free convolutional neural network for multi-categories agricultural pest detection. Comput. Electron. Agric. 2020, 174, 105522. [Google Scholar] [CrossRef]
  44. Ahmad, U.; Ali, M.J.; Khan, F.A.; Khan, A.A.; Rehman, A.U.; Shahid, M.M.A.; Haq, M.A.; Khan, I.; Alzamil, Z.S.; Alhussen, A. Large Scale Fish Images Classification and Localization using Transfer Learning and Localization Aware CNN Architecture. Comput. Syst. Sci. Eng. 2023, 45, 2125–2140. [Google Scholar] [CrossRef]
  45. Howard, A.G.; Zhu, M.; Chen, B.; Kalenichenko, D.; Wang, W.; Weyand, T.; Andreetto, M.; Adam, H. MobileNets: Efficient Convolutional Neural Networks for Mobile Vision Applications. arXiv 2017, arXiv:1704.04861. [Google Scholar]
  46. Kadam, K.D.; Ahirrao, S.; Kotecha, K.; Sahu, S. Detection and Localization of Multiple Image Splicing Using MobileNet V1. IEEE Access 2021, 9, 162499–162519. [Google Scholar] [CrossRef]
  47. Tan, M.; Le, Q.V. EfficientNet: Rethinking model scaling for convolutional neural networks. In Proceedings of the 36th International Conference on Machine Learning, ICML 2019, Long Beach, CA, USA, 9–15 June 2019; pp. 10691–10700. [Google Scholar]
  48. Genaev, M.A.; Skolotneva, E.S.; Gultyaeva, E.I.; Orlova, E.A.; Bechtold, N.P.; Afonnikov, D.A. Image-based wheat fungi diseases identification by deep learning. Plants 2021, 10, 1500. [Google Scholar] [CrossRef]
  49. Bari, B.S.; Islam, M.N.; Rashid, M.; Hasan, M.J.; Razman, M.A.M.; Musa, R.M.; Nasir, A.F.A.; Majeed, A.P. A real-time approach of diagnosing rice leaf disease using deep learning-based faster R-CNN framework. PeerJ Comput. Sci. 2021, 7, e432. [Google Scholar] [CrossRef]
  50. Girshick, R. Fast R-CNN. In Proceedings of the 2015 IEEE International Conference on Computer Vision, ICCV 2015, Santiago, Chile, 7–13 December 2015; pp. 1440–1448. [Google Scholar] [CrossRef]
  51. Alamsyah, D.; Fachrurrozi, M. Faster R-CNN with inception v2 for fingertip detection in homogenous background image. J. Phys. Conf. Ser. 2019, 1196, 012017. [Google Scholar] [CrossRef]
  52. Nguyen, N.-D.; Do, T.; Ngo, T.D.; Le, D.-D. An Evaluation of Deep Learning Methods for Small. J. Electr. Comput. Eng. 2020, 2020, 3189691. [Google Scholar]
  53. Sibiya, M.; Sumbwanyambe, M. An Algorithm for Severity Estimation of Plant Leaf Diseases by the Use of Colour Threshold Image Segmentation and Fuzzy Logic Inference: A Proposed Algorithm to Update a “Leaf Doctor” Application. AgriEngineering 2019, 1, 205–219. [Google Scholar] [CrossRef] [Green Version]
  54. Gui, J.; Fei, J.; Wu, Z.; Fu, X.; Diakite, A. Grading method of soybean mosaic disease based on hyperspectral imaging technology. Inf. Process. Agric. 2021, 8, 380–385. [Google Scholar] [CrossRef]
  55. Patil, P.U.; Lande, S.B.; Nagalkar, V.J.; Nikam, S.B.; Wakchaure, G. Grading and sorting technique of dragon fruits using machine learning algorithms. J. Agric. Food Res. 2021, 4, 100118. [Google Scholar] [CrossRef]
Figure 1. Process to estimate the rice disease severity using rice grade model.
Agriculture 13 00047 g001
Figure 2. Rice grade architecture to quantify the rice disease severity level.
Agriculture 13 00047 g002
Figure 3. Rice leaf and diseased area image annotation performed using Make Sense tool.
Agriculture 13 00047 g003
Figure 4. Sixteen anchor boxes with different scales generated for each sliding window position in the feature map.
Agriculture 13 00047 g004
Figure 5. Geometrical representation of ground truth box, predicted box, and an anchor box.
Agriculture 13 00047 g005
Figure 6. Output of RoI pooling layer of rice grade model.
Agriculture 13 00047 g006
Figure 7. PPV, sensitivity, and DSC of proposed model using VGG16 backbone architecture.
Agriculture 13 00047 g007
Figure 8. PPV, sensitivity, and DSC of proposed model using ResNet101 backbone architecture.
Agriculture 13 00047 g008
Figure 9. PPV, sensitivity, and DSC of proposed model using MobileNet backbone architecture.
Agriculture 13 00047 g009
Figure 10. PPV, sensitivity, and DSC of proposed model using EfficientNet-B0 backbone architecture.
Agriculture 13 00047 g010
Figure 11. Rice grade model: original image, classification, and boundary box from FRCNN, computations, and result.
Agriculture 13 00047 g011
Table 1. Total number of rice images used for the proposed study.
Rice Infection TypePublicly Available DatasetOn Field Dataset
Healthy200100
Brown spot200100
Bacterial Blight200100
Rice Blast200100
Total800400
Grand Total1200
Table 2. EfficientNet-B0 parameters used in proposed work.
StageOperatorImage Resolution; No. of ChannelsNumber of Layers
1Cnvl3 × 3512 × 512; 321
2MBCnvl1, k3 × 3256 × 256; 161
3MBCnvl6, k3 × 3256 × 256; 242
4MBCnvl6, k5 × 5128 × 128; 402
5MBCnvl6, k3 × 364 × 64; 803
6MBCnvl6, k5 × 532 × 32; 1123
7MBCnvl6, k5 × 532 × 32; 1924
Table 3. Configuration parameters used to build the proposed model.
Configuration of Rice Grade ModelOptimal Value
Number of proposals generated (Anchor box)16
Anchor box size32, 64, 128, 256
Anchor Box Scale Ratios(1:1), (1:2), (2:1), (2:2)
Proposal Selection count200
Overlap Threshold0.8
Learning Rate0.0001
OptimizersSGD
Table 4. The disease severity index of rice grade modeler of rice images used for the proposed study.
Severity GradePercentage of Diseased Region on Leaf InstancesSeverity Level
00No Infection
10.1–10%Low
210.1–25%Mild
325.1–50%Moderate
450.1–75%Severe
5>75%Critical
Table 5. Average precision parameter comparison of rice grade with various backbone architectures.
Backbone ArchitectureAverage Precision (>0.7)Average Precision (>0.8)
VGG160.670.71
ResNet1010.810.84
MobileNetV10.880.90
EfficientNet-B00.890.92
Table 6. Training time and inference time with different backbone architectures.
Backbone ArchitectureTraining TimeInference Time
VGG16738.21847
ResNet101639.36723
MobileNetV1529.11701
EfficientNet-B0522.22693
Table 7. Comparison of rice grade with the state-of-the-art crop disease severity estimation techniques.
ReferenceCrop/FruitAffected with DiseaseInput DatasetMethodology UsedModel Evaluation Parameters
[6]AppleBlack rotPlant villageVGG16Accuracy = 90.4%
[53]MaizeBlight
Gray Spot
and Rust
Plant villageOtsu
segmentation
and fuzzy
logic
Severity levels: Low,
Moderate and High
[13]MaizeNorthern Leaf
Blight
Unmanned Aerial
Vehicle acquired
images
Cascaded Mask
Region CNN
Disease Severity
Correlation = 73%
[54]SoybeanSoybean
mosaic
virus disease
Own dataset of
hyperspectral
images
CNN-SVM
combined model
Accuracy = 94.17%
[55]Dragon fruitQuality of fruitOwn datasetANN, CNN, SVMQuality levels: High,
Low, Moderate
and Infected
Proposed rice grade modelRiceBrownspot, Rice blight, BlastImages (real time images collected from rice farm as well as images from publicly available datasets)Updated Faster RCNN with EfficientNet-B0 as backbonePrecision = 0.97, Sensitivity = 0.96, Dice Similarity Coefficient = 0.96, MAP = 0.92, Accuracy = 96.43
Disclaimer/Publisher’s Note: The statements, opinions and data contained in all publications are solely those of the individual author(s) and contributor(s) and not of MDPI and/or the editor(s). MDPI and/or the editor(s) disclaim responsibility for any injury to people or property resulting from any ideas, methods, instructions or products referred to in the content.

