Article

Crop Yield Prediction Using Machine Learning Models: Case of Irish Potato and Maize

by
Martin Kuradusenge
1,*,
Eric Hitimana
1,
Damien Hanyurwimfura
1,
Placide Rukundo
2,
Kambombo Mtonga
3,
Angelique Mukasine
1,
Claudette Uwitonze
1,
Jackson Ngabonziza
1 and
Angelique Uwamahoro
1
1
School of ICT, College of Science and Technology, University of Rwanda, KN 67, Kigali P.O. Box 3900, Rwanda
2
Rwanda Agriculture and Animal Resources Development Board (RAB), Butare P.O. Box 138, Rwanda
3
Training & Education Development Consulting, Lilongwe P.O. Box 164, Malawi
*
Author to whom correspondence should be addressed.
Agriculture 2023, 13(1), 225; https://doi.org/10.3390/agriculture13010225
Submission received: 5 December 2022 / Revised: 3 January 2023 / Accepted: 11 January 2023 / Published: 16 January 2023
(This article belongs to the Special Issue The Application of Machine Learning in Agriculture)

Abstract

:
Although agriculture remains the dominant economic activity in many countries around the world, in recent years this sector has continued to be negatively impacted by climate change leading to food insecurities. This is so because extreme weather conditions induced by climate change are detrimental to most crops and affect the expected quantity of agricultural production. Although there is no way to fully mitigate these natural phenomena, it could be much better if there is information known earlier about the future so that farmers can plan accordingly. Early information sharing about expected crop production may support food insecurity risk reduction. In this regard, this work employs data mining techniques to predict future crop (i.e., Irish potatoes and Maize) harvests using weather and yields historical data for Musanze, a district in Rwanda. The study applies machine learning techniques to predict crop harvests based on weather data and communicate the information about production trends. Weather data and crop yields for Irish potatoes and maize were gathered from various sources. The collected data were analyzed through Random Forest, Polynomial Regression, and Support Vector Regressor. Rainfall and temperature were used as predictors. The models were trained and tested. The results indicate that Random Forest is the best model with root mean square error of 510.8 and 129.9 for potato and maize, respectively, whereas R2 was 0.875 and 0.817 for the same crops datasets. The optimum weather conditions for the optimal crop yield were identified for each crop. The results suggests that Random Forest is recommended model for early crop yield prediction. The findings of this study will go a long way to enhance reliance on data for agriculture and climate change related decisions, especially in low-to-middle income countries such as Rwanda.

1. Introduction

Agriculture is an economic activity that has a high dependency on weather conditions [1]. This means that seasonal agriculture is dependent on natural weather conditions, also known as rainfed agriculture. Rainfed agriculture constitutes 80% of the cropland worldwide and generates good yields when crops have favorable weather conditions. In many lands where rainfall is scarce, rainfed agriculture is supplemented by irrigation practices [2]. The fact still remains that agricultural production is heavily reliant on rainfall and other weather variables. It is such the case that at times, farmers do not acquire the expected harvest due to the scarcity or abundance of rainfall and other weather parameters.
Climate change has a great impact on the productivity of agriculture and may lead to hunger or food insecurity. The latter is a crucial problem in the regions characterized by droughts or other weather-related disasters. Climate variables that affect crop production include precipitation, air temperature, humidity, and solar radiation [3]. Different studies have shown that climate indices at both global and regional levels affect crop yields and food security [4]. In their study, Damien et al. found that the reduced crop yields could be associated with either high temperature or abundant precipitation [5]. Extreme temperature has negative effects on crop production due to various factors such as increased evapotranspiration and respiration of crops, and higher pest infestation [1]. Increased precipitation intensity leads to increased runoff patterns that in turn cause floods and the risk of crop failure [2]. Crop productivity can also be affected by the increased temperature that causes the increase in crop water demand [1,6,7]. In all scenarios, climate change has a potential impact on agriculture in different ways.
Although the climate variables may be the same for a specific area, however, the needs of weather parameters are different from one crop to another according to their growing stage. This means that each crop has a different level of resilience to the atmospheric variables. When weather variables spike at an extreme level, a remarkable influence on crop production will be observed [3]. The influence of climate change on agriculture can be observed everywhere. For example, from March to August 2018, a large portion of Europe experienced extreme temperatures, while the southern region of the continent experienced abundant rainfall [5].
In the context of Rwanda, climate change and its impacts on agriculture have been a challenge to the country in some provinces that have faced long dry season or high rainfall. In 2016, the drought left 44,000 poor households food insecure in the eastern province [8]. Between 2012 and 2016, landslides, floods, and erosion harmed agriculture production in areas with steep slopes and heavy rainfall, resulting in a 1.4% loss of Gross Domestic Product (GDP) [9]. According to the assessment carried out by the Ministry of Agriculture and Animal Resources (MINAGRI), more than 3000 families in the Eastern Province (Kayonza, Kirehe, and Nyagatare districts) faced hunger due to the drought in 2017 [10]. The analysis of the variability in rainfall shows that rainy seasons tend to be shorter with higher intensity and that tendency has an impact on crop yields due to droughts, landslides, and floods [11]. In its seasonal agriculture survey, the National Institute of Statistics of Rwanda (NISR) indicated that insufficient rainfall is the biggest factor that has a high contribution to the bad harvest in Rwanda. In addition, the annual reports published by this institution indicate that the seasonal harvest varies from one crop to another in the respective agriculture seasons depending on the various circumstances including weather conditions.
In order to overcome the problems related to the variation of weather conditions on crops, various solutions have been proposed in different studies. The investigation conducted by Safieh et al. indicated that climate change has the impact on the crop water requirements as well as the predicted crop yields in the future based on weather forecast data [4,12]. The study conducted on the impact of extreme weather conditions on the different regions of Europe showed that the most reliable weather predictors of agricultural production are rainfall and air temperature and their respective thresholds [5]. Precipitation and air temperature are the most common climatic parameters used in many studies. However, other parameters such as solar radiation, air humidity, soil moisture, and wind speed have been used to predict crop yields using different machine learning models (MLM) such as the Artificial Neural Network (ANN), Semiparametric Neural Network [13], Convolutional Neural Network (CNN) [14,15], Lasso, Kernel Ridge, Enet [16], Naïve Bayes, K-Nearest Neighbor [17], Recurrent Neural Network (RNN), Long short-term memory (LSTM) [18], and Random Forest [17,19].
In Rwanda, various studies have been carried out with focus on predicting yields of different crops. In [20], Rugimbana applied the Aqua Crop model to predict maize yields under rainfed agriculture in Eastern province of Rwanda. The author carried out a trend analysis on climatic parameters such as maximum and minimum temperatures, rainfall, evapotranspiration and maize yield. Among the findings was that rainfall trend had non-significant impact on yield over the study area within the considered study period. Ngaruye et al. in [21] applied Small Area Estimation (SAE) techniques under a multivariate linear regression model for repeated measures data to produce district level estimates of crop yield for beans (i.e., bush and climbing beans) in Rwanda during agricultural seasons of 2014. The authors applied the analysis on micro data of NISR obtained from the Seasonal Agricultural Survey (SAS) 2014. Breure et al. [22] predicted the yield of maize crop by applying the Quantitative Evaluation of the Fertility of Tropical Soils (QUEFTS) model. Specifically, the authors compared two methods for developing maps of QUEFTS output, i.e., maize yield and the yield-limiting nutrient, with Rwanda as a case study. The study was based on a database of soil analysis results of 999 samples collected across Rwanda. As these studies highlight, clearly there is an increase in interest on research on yield prediction in Rwanda. However, there is a gap on application of more sophisticated machine learning models for yield prediction. Furthermore, with climate change impacts becoming more apparent, the impact of climatic changes on crop yields will only increase. Hence, the need for extensive research on the impact of climatic factors on crop yields cannot be overemphasized. This study seeks to bridge this gap.
Various researchers have demonstrated the impact of climate anomalies on crops [1,4,5,6] by showing the correlation between crop production and weather variables. Some of these studies have gone further to indicate thresholds of temperature, precipitations, and water requirements for plant development [5]. Studies that have worked on the predictions have come up with good results in terms of prediction capabilities [16,17]. However, each plant has different weather requirements for good production. Hence, knowledge of weather conditions suitable for each crop to produce a decent harvest should be taken into consideration when carrying out yield prediction for a particular crop. Unfortunately, various studies in the literature did not come up with the ratio of the contribution of each weather parameter on crop production. Furthermore, these studies did not indicate at what stage of crop development each weather parameter was more or less needed. The knowledge about the contribution of each climatic factor and its threshold value for good production is crucial for the future prediction of crop yields based on the weather monitoring using the Internet of Things (IoT).
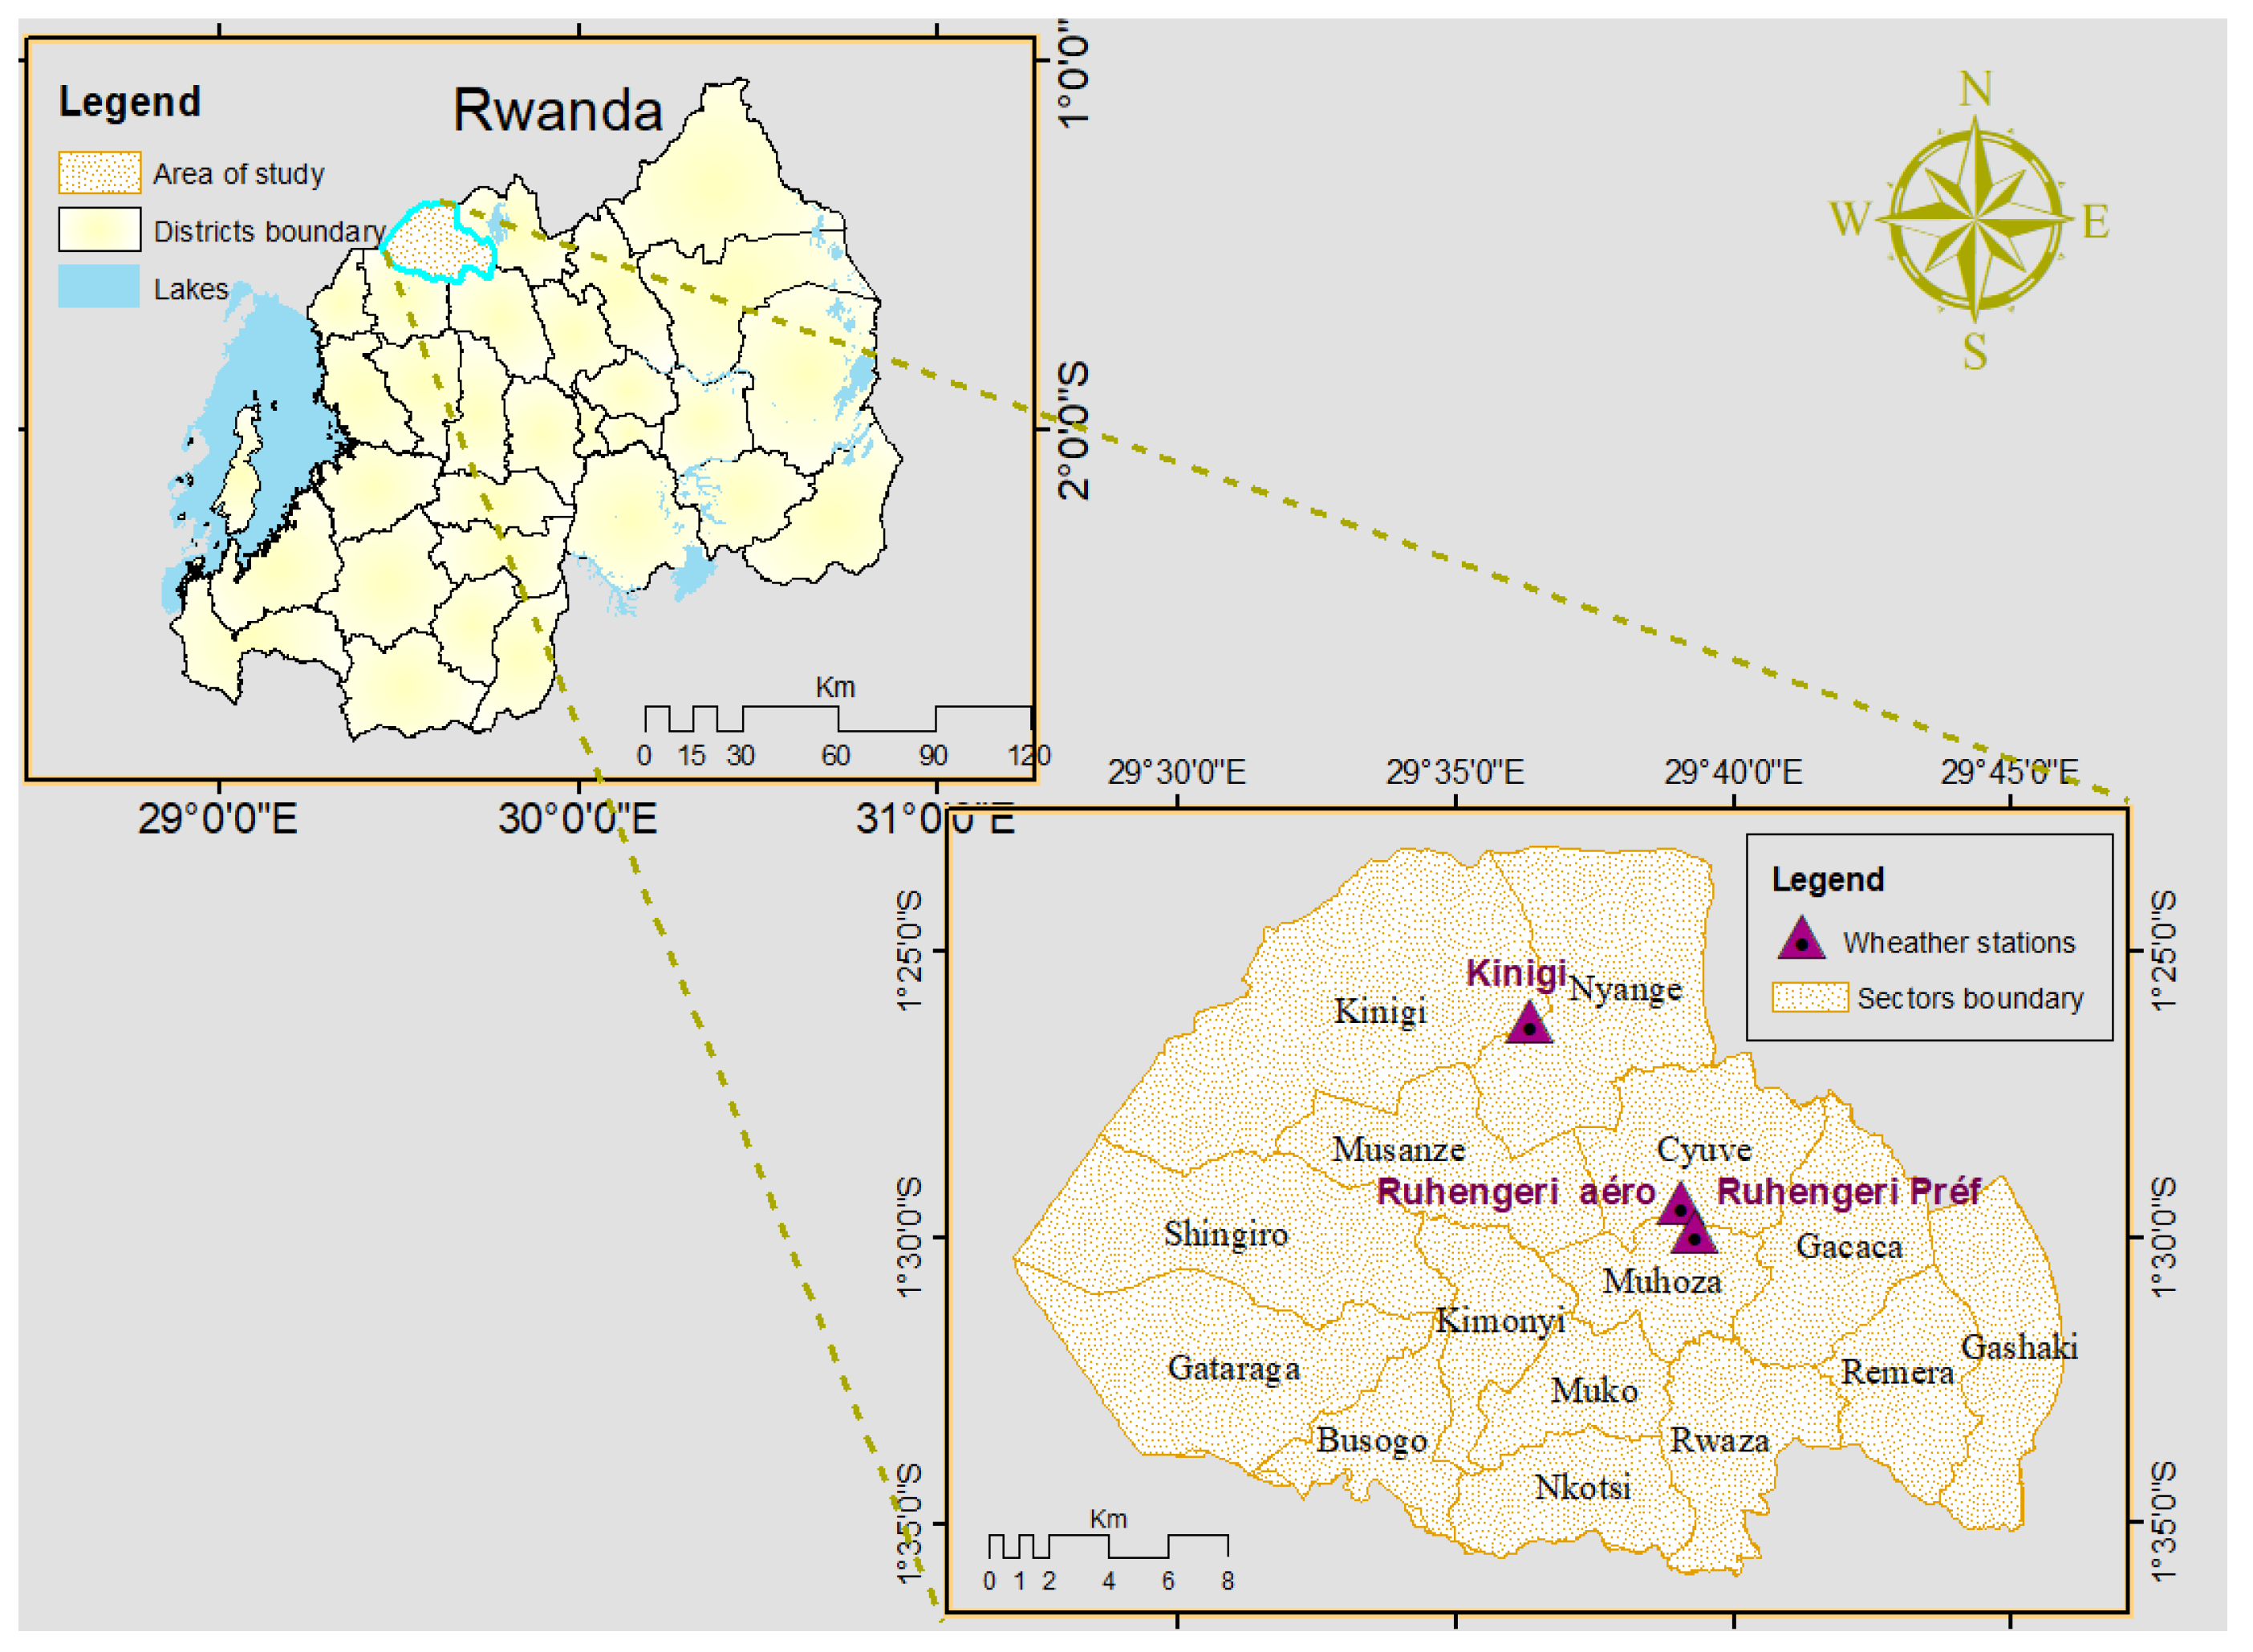
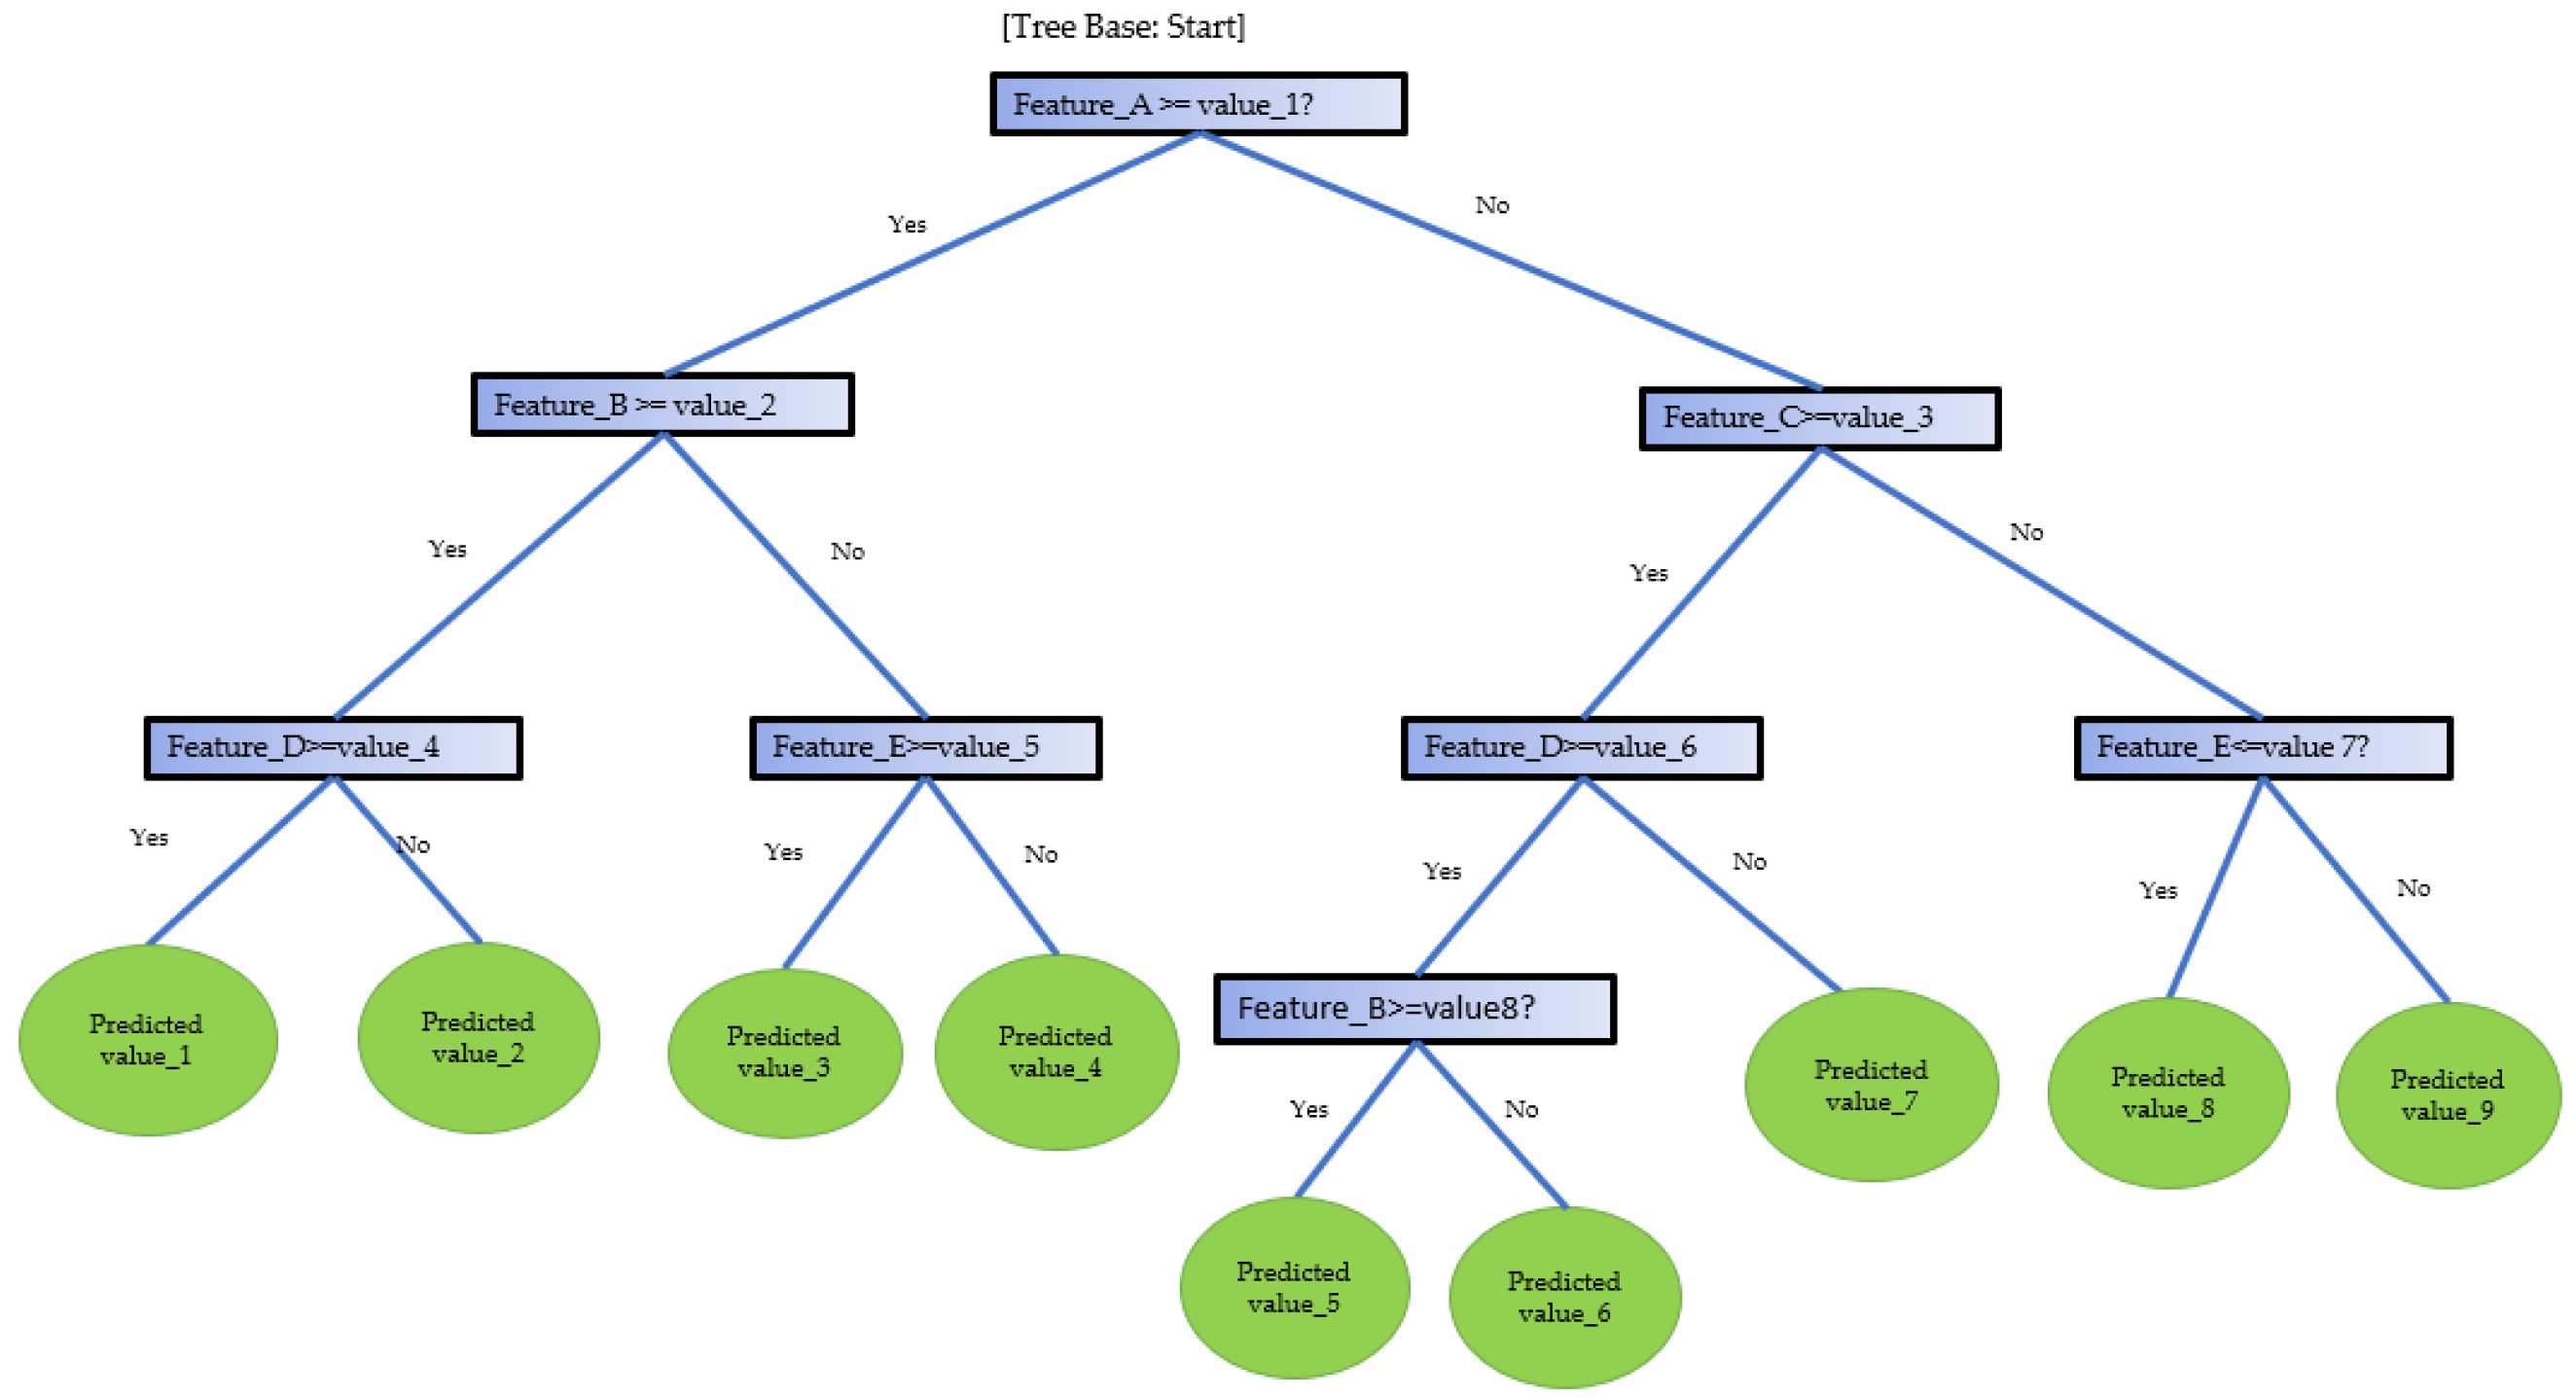
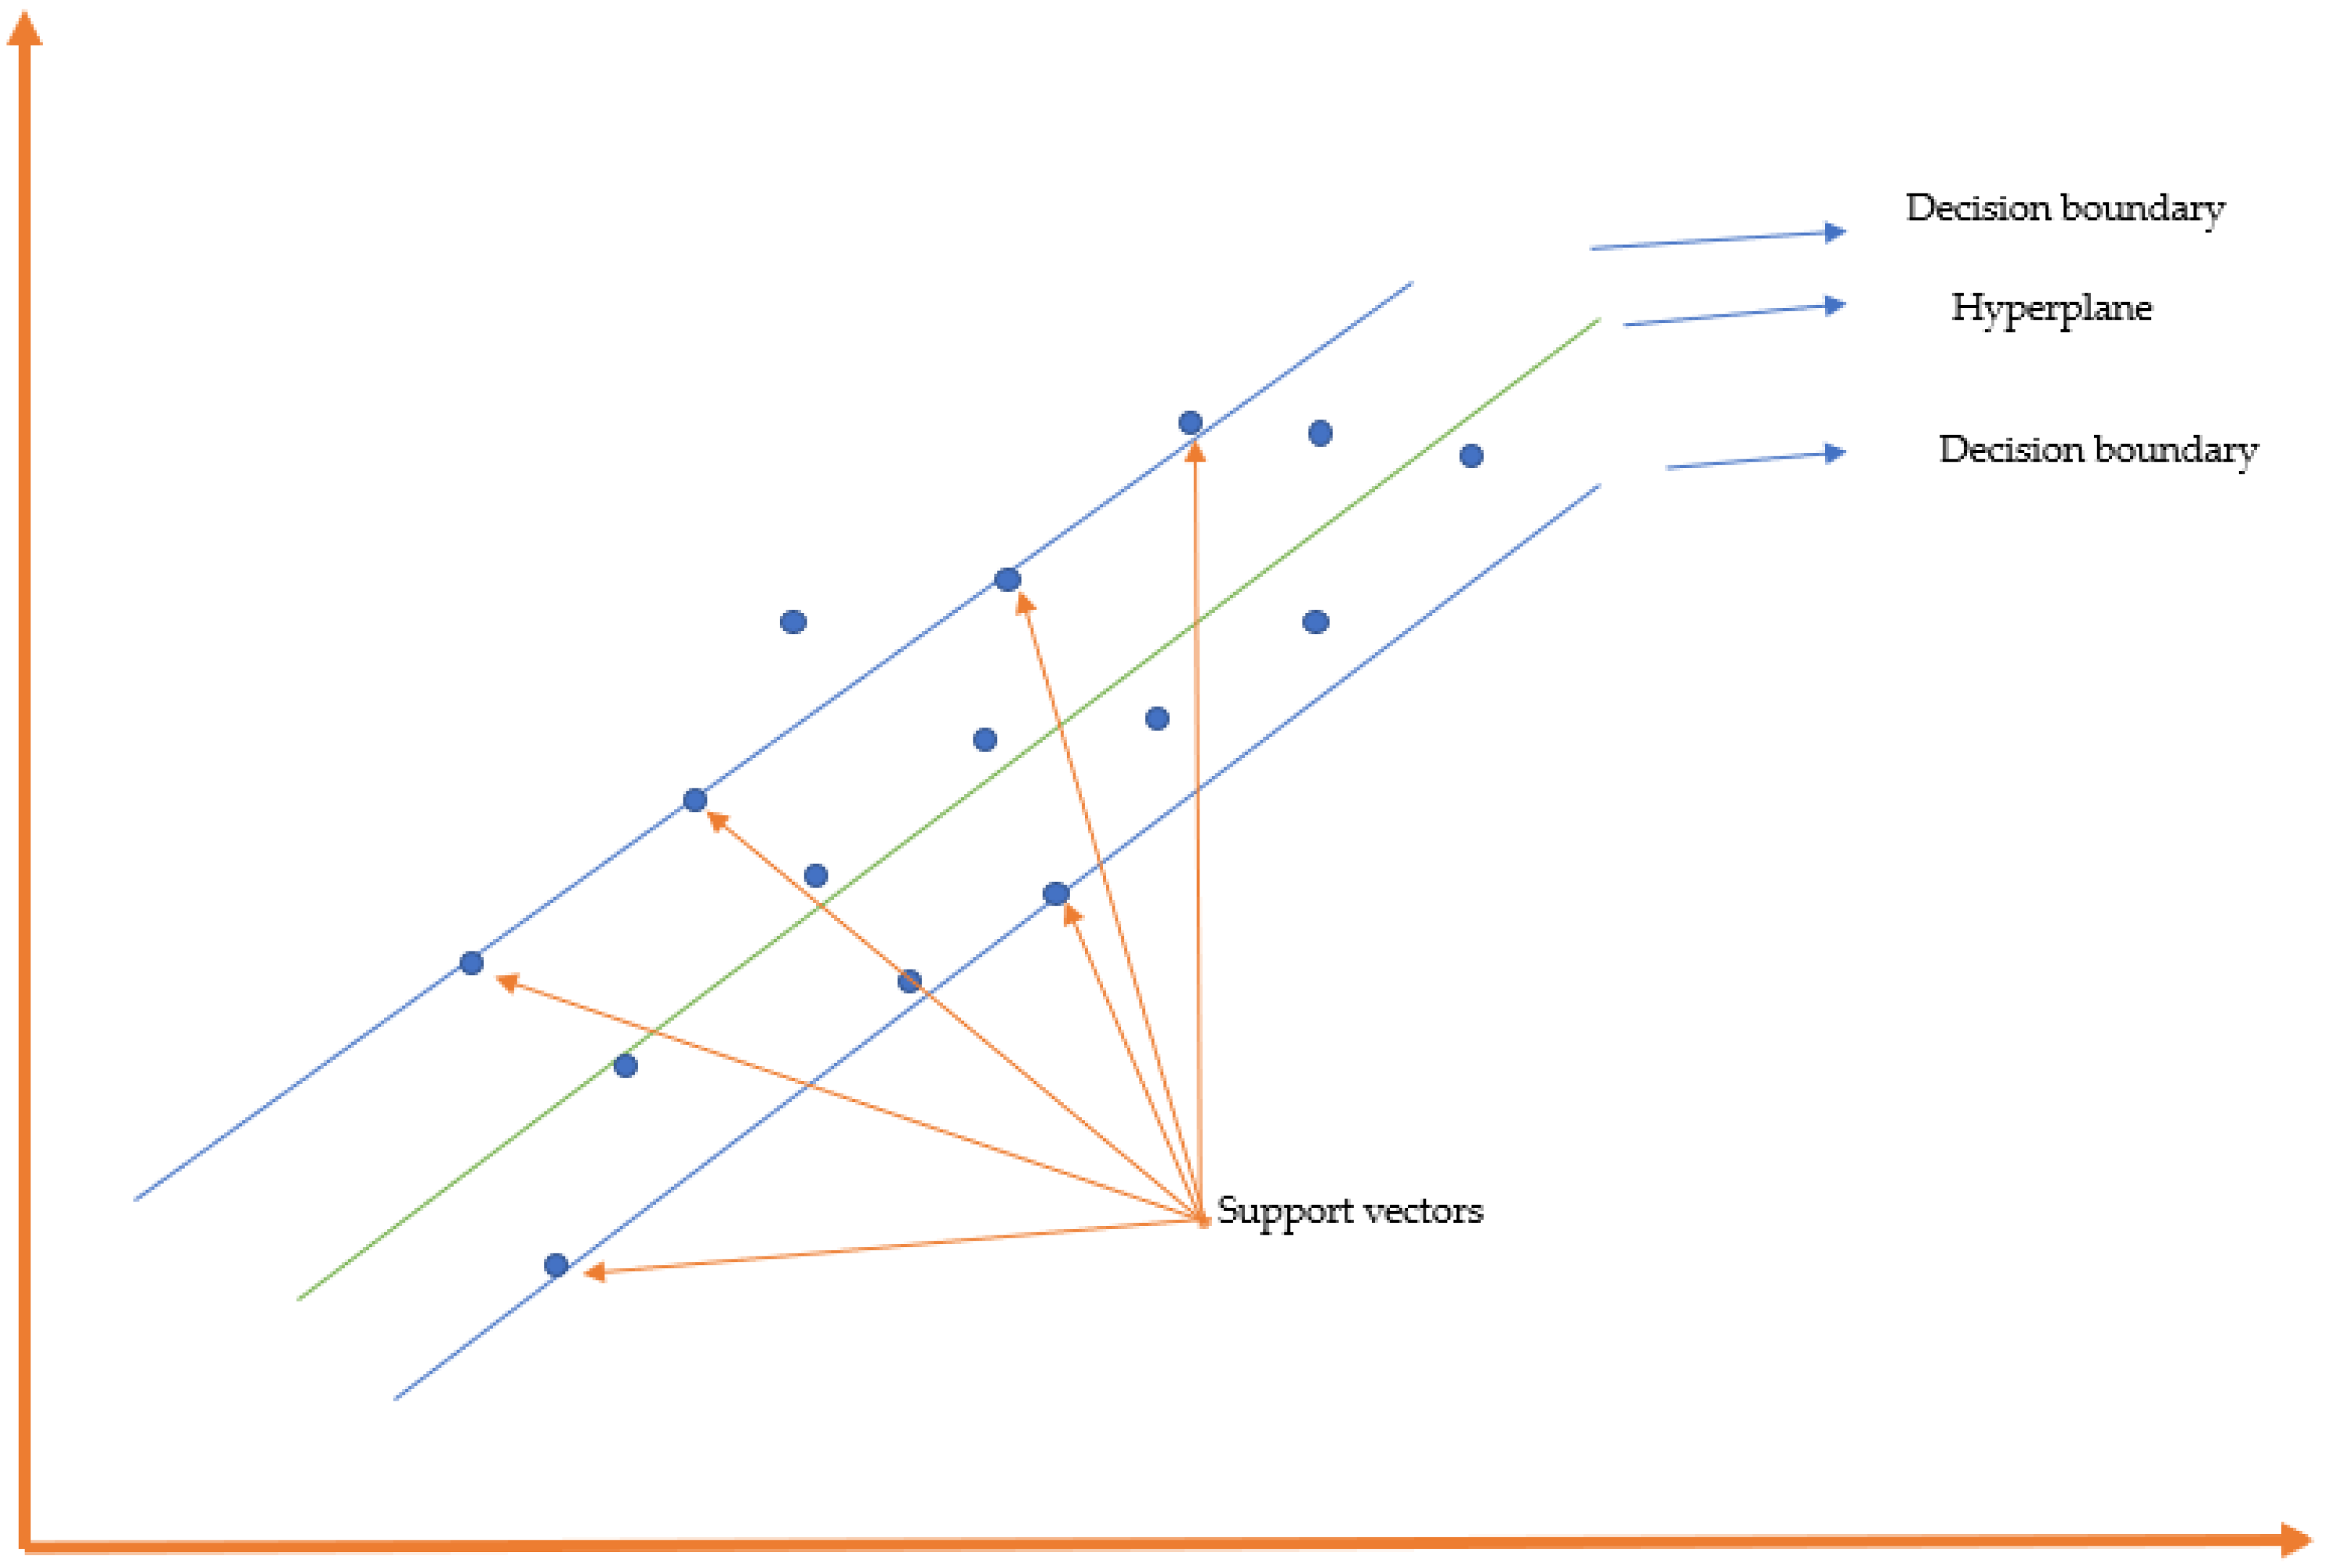
In this study, more than one MLMs have been explored with the goal of knowing which one is best fit to be implemented in our future studies on crop yields prediction through weather monitoring using IoT. The MLMs explored in this study include Random Forest (RF), Polynomial Regression (PR), and Support Vector Regressor (SVR). The crops of interest are maize and Irish potatoes which are dominant crops grown in the district of Musanze of Rwanda. The data for the crop yields were gathered from NISR and from different cooperatives of farmers in the area of study. Rainfall and temperature were used as predictors. Specifically, the main contributions of this work are as follows:
(1)
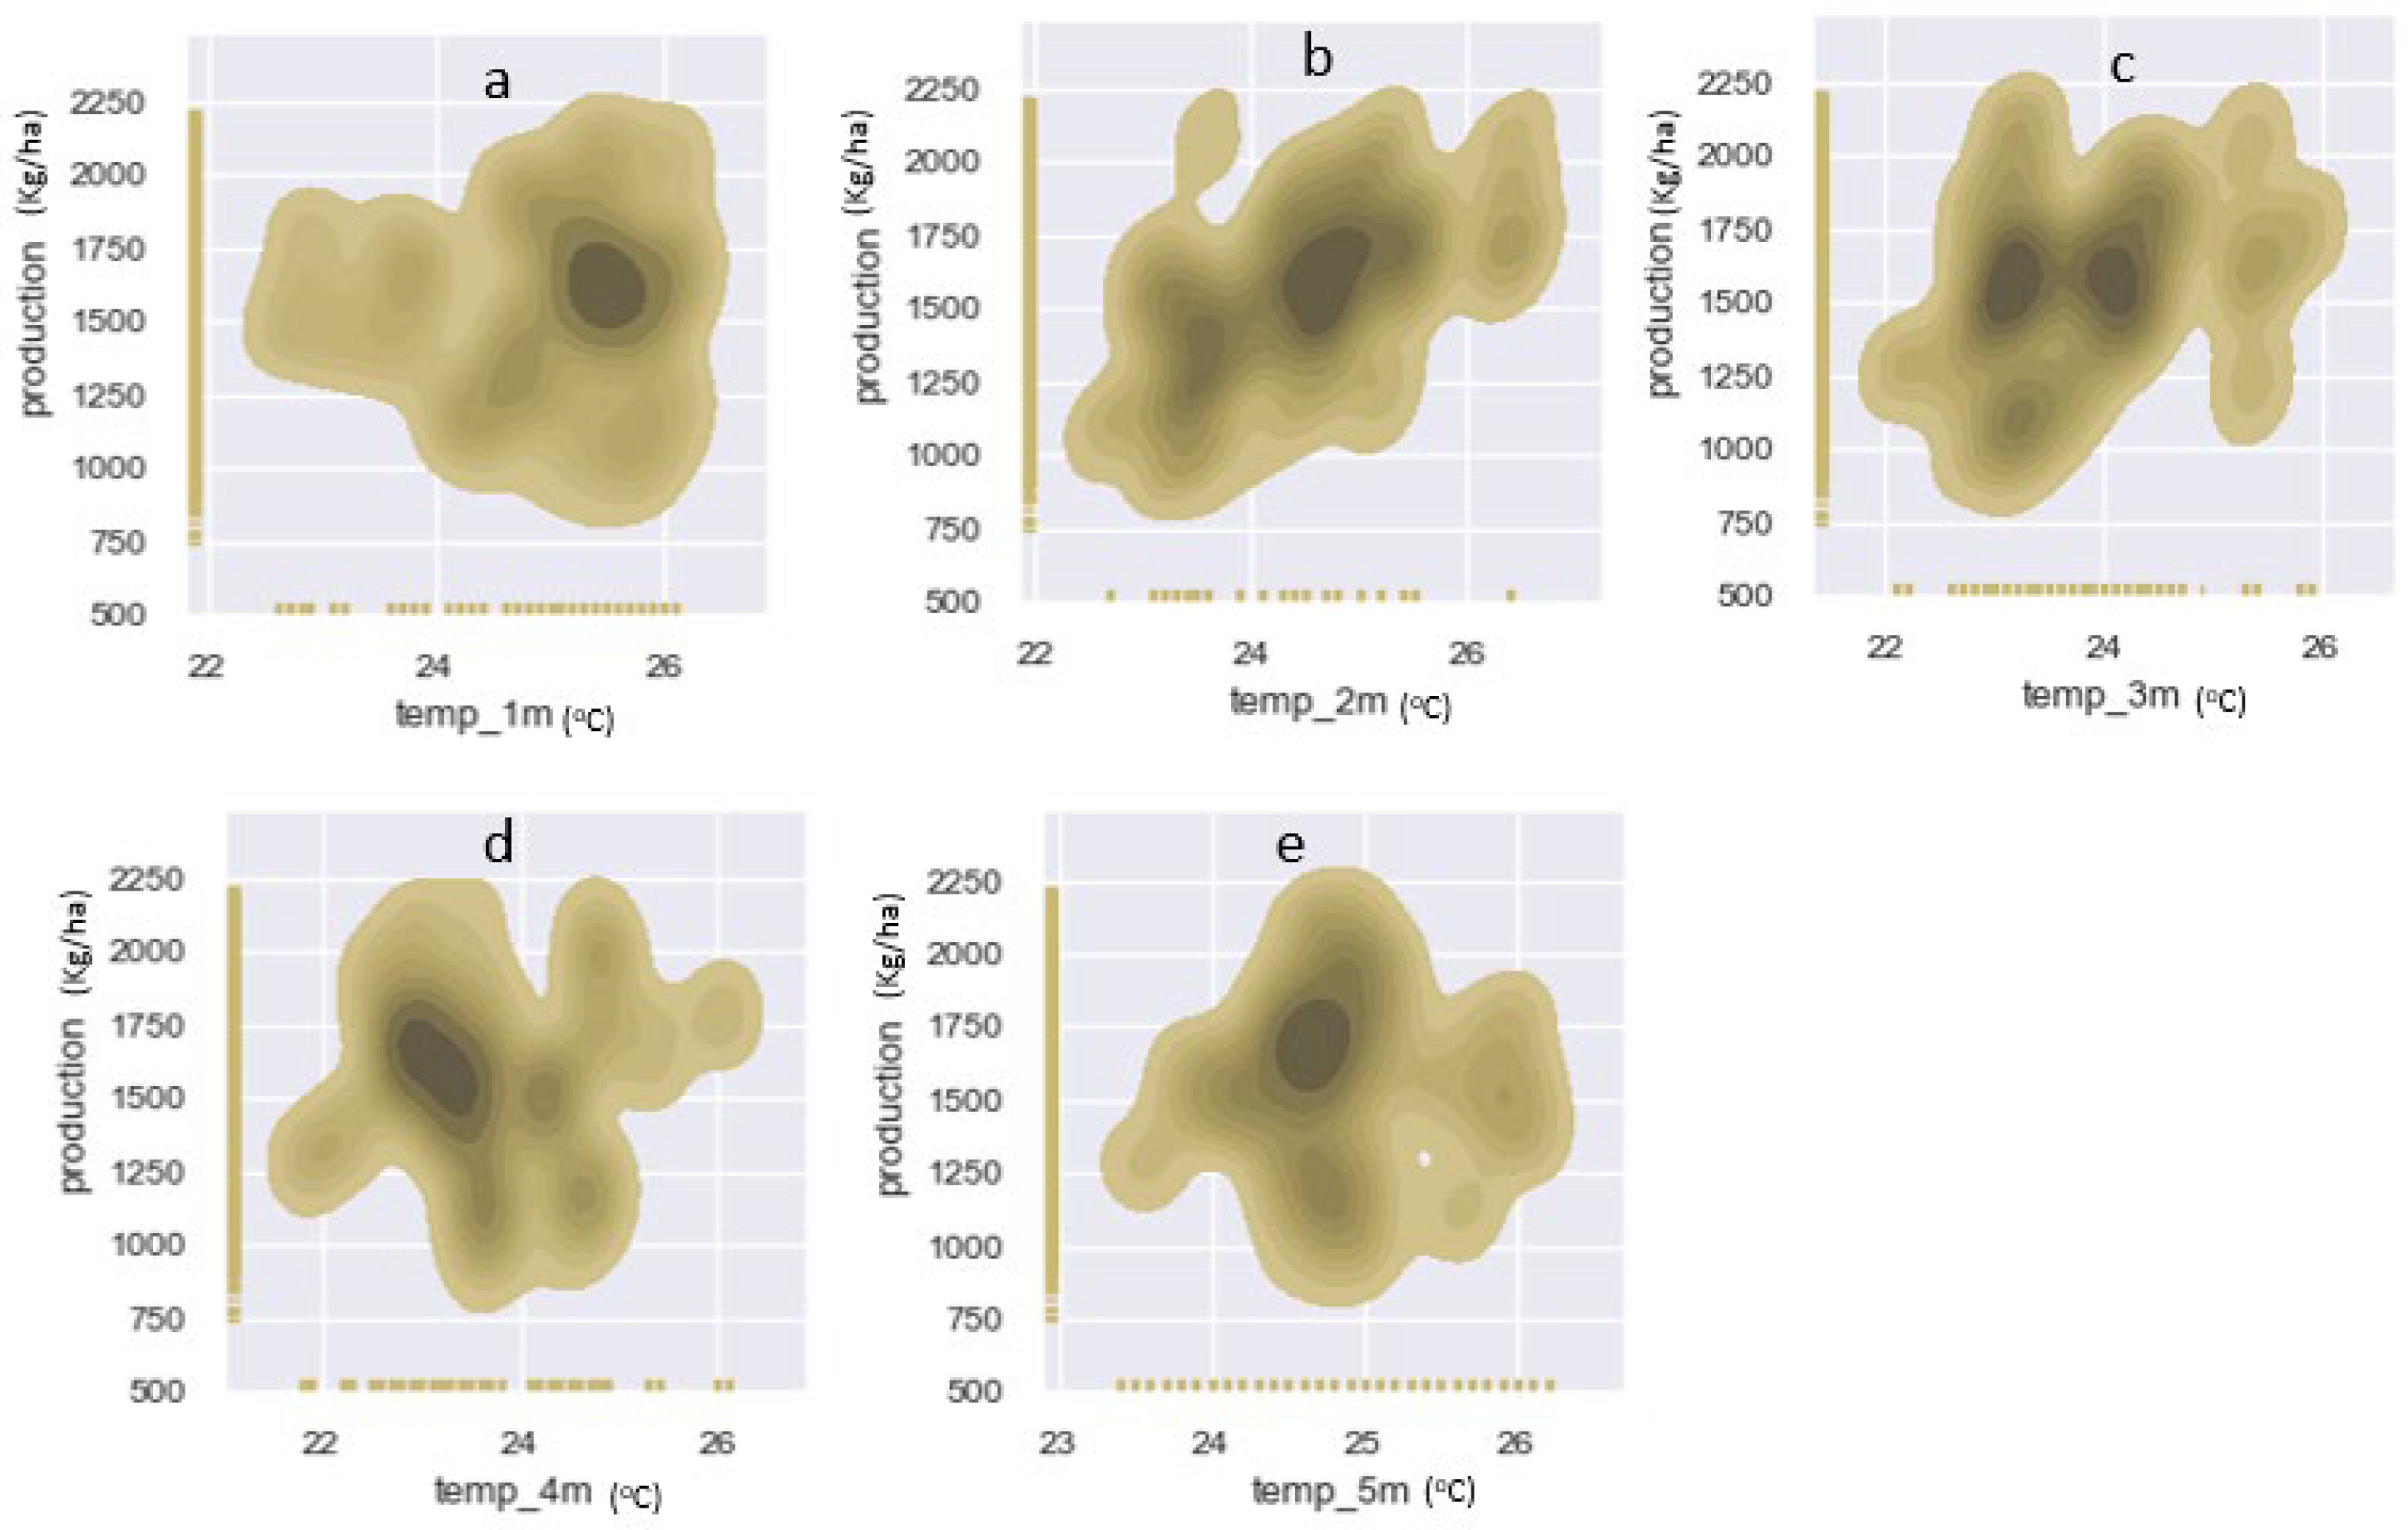
identifying the correlation between crop production and weather parameters (i.e., rainfall and temperature);
(2)
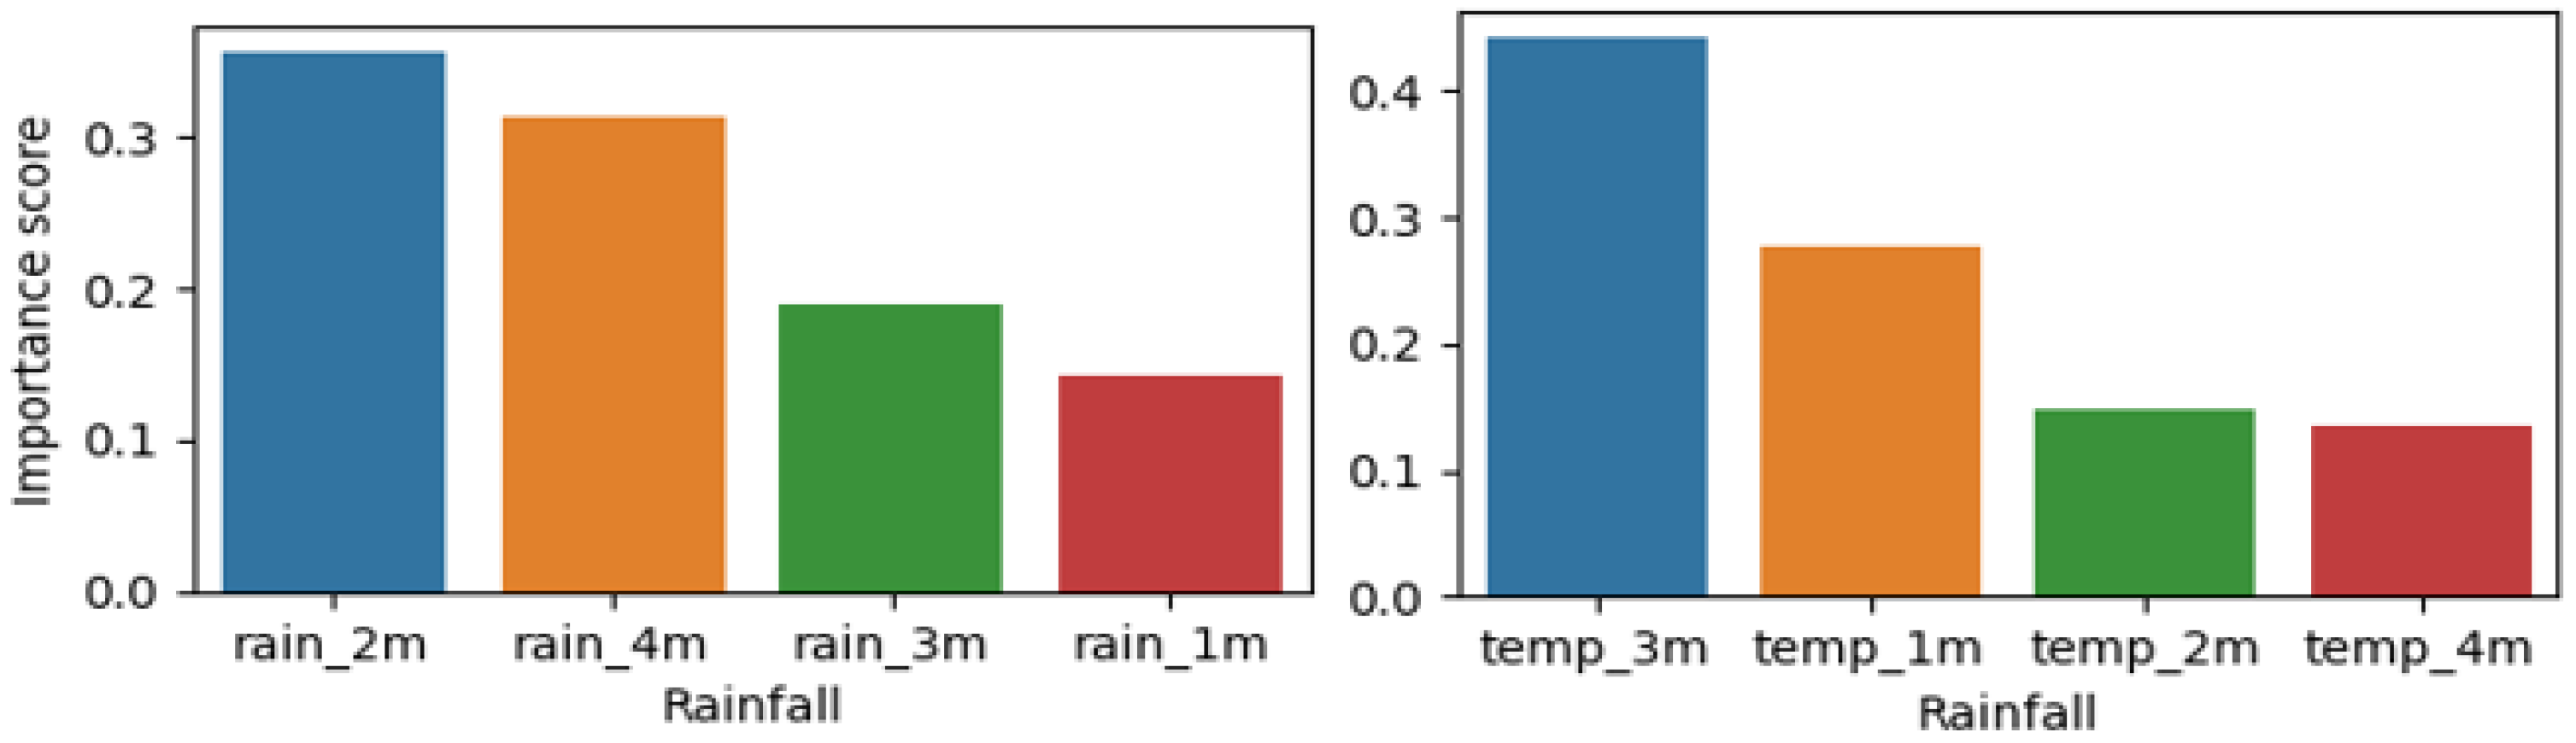
determining the feature importance of each weather parameter on crop production, and;
(3)
identifying the best MLM for the prediction of crop production.
The results of this study will inform the design and development of a crop yield prediction system using IoT and machine learning. The system will be used by farmers and decision makers for the adaptation of reduced crop production.
The rest of the manuscript is organized as follows. In 
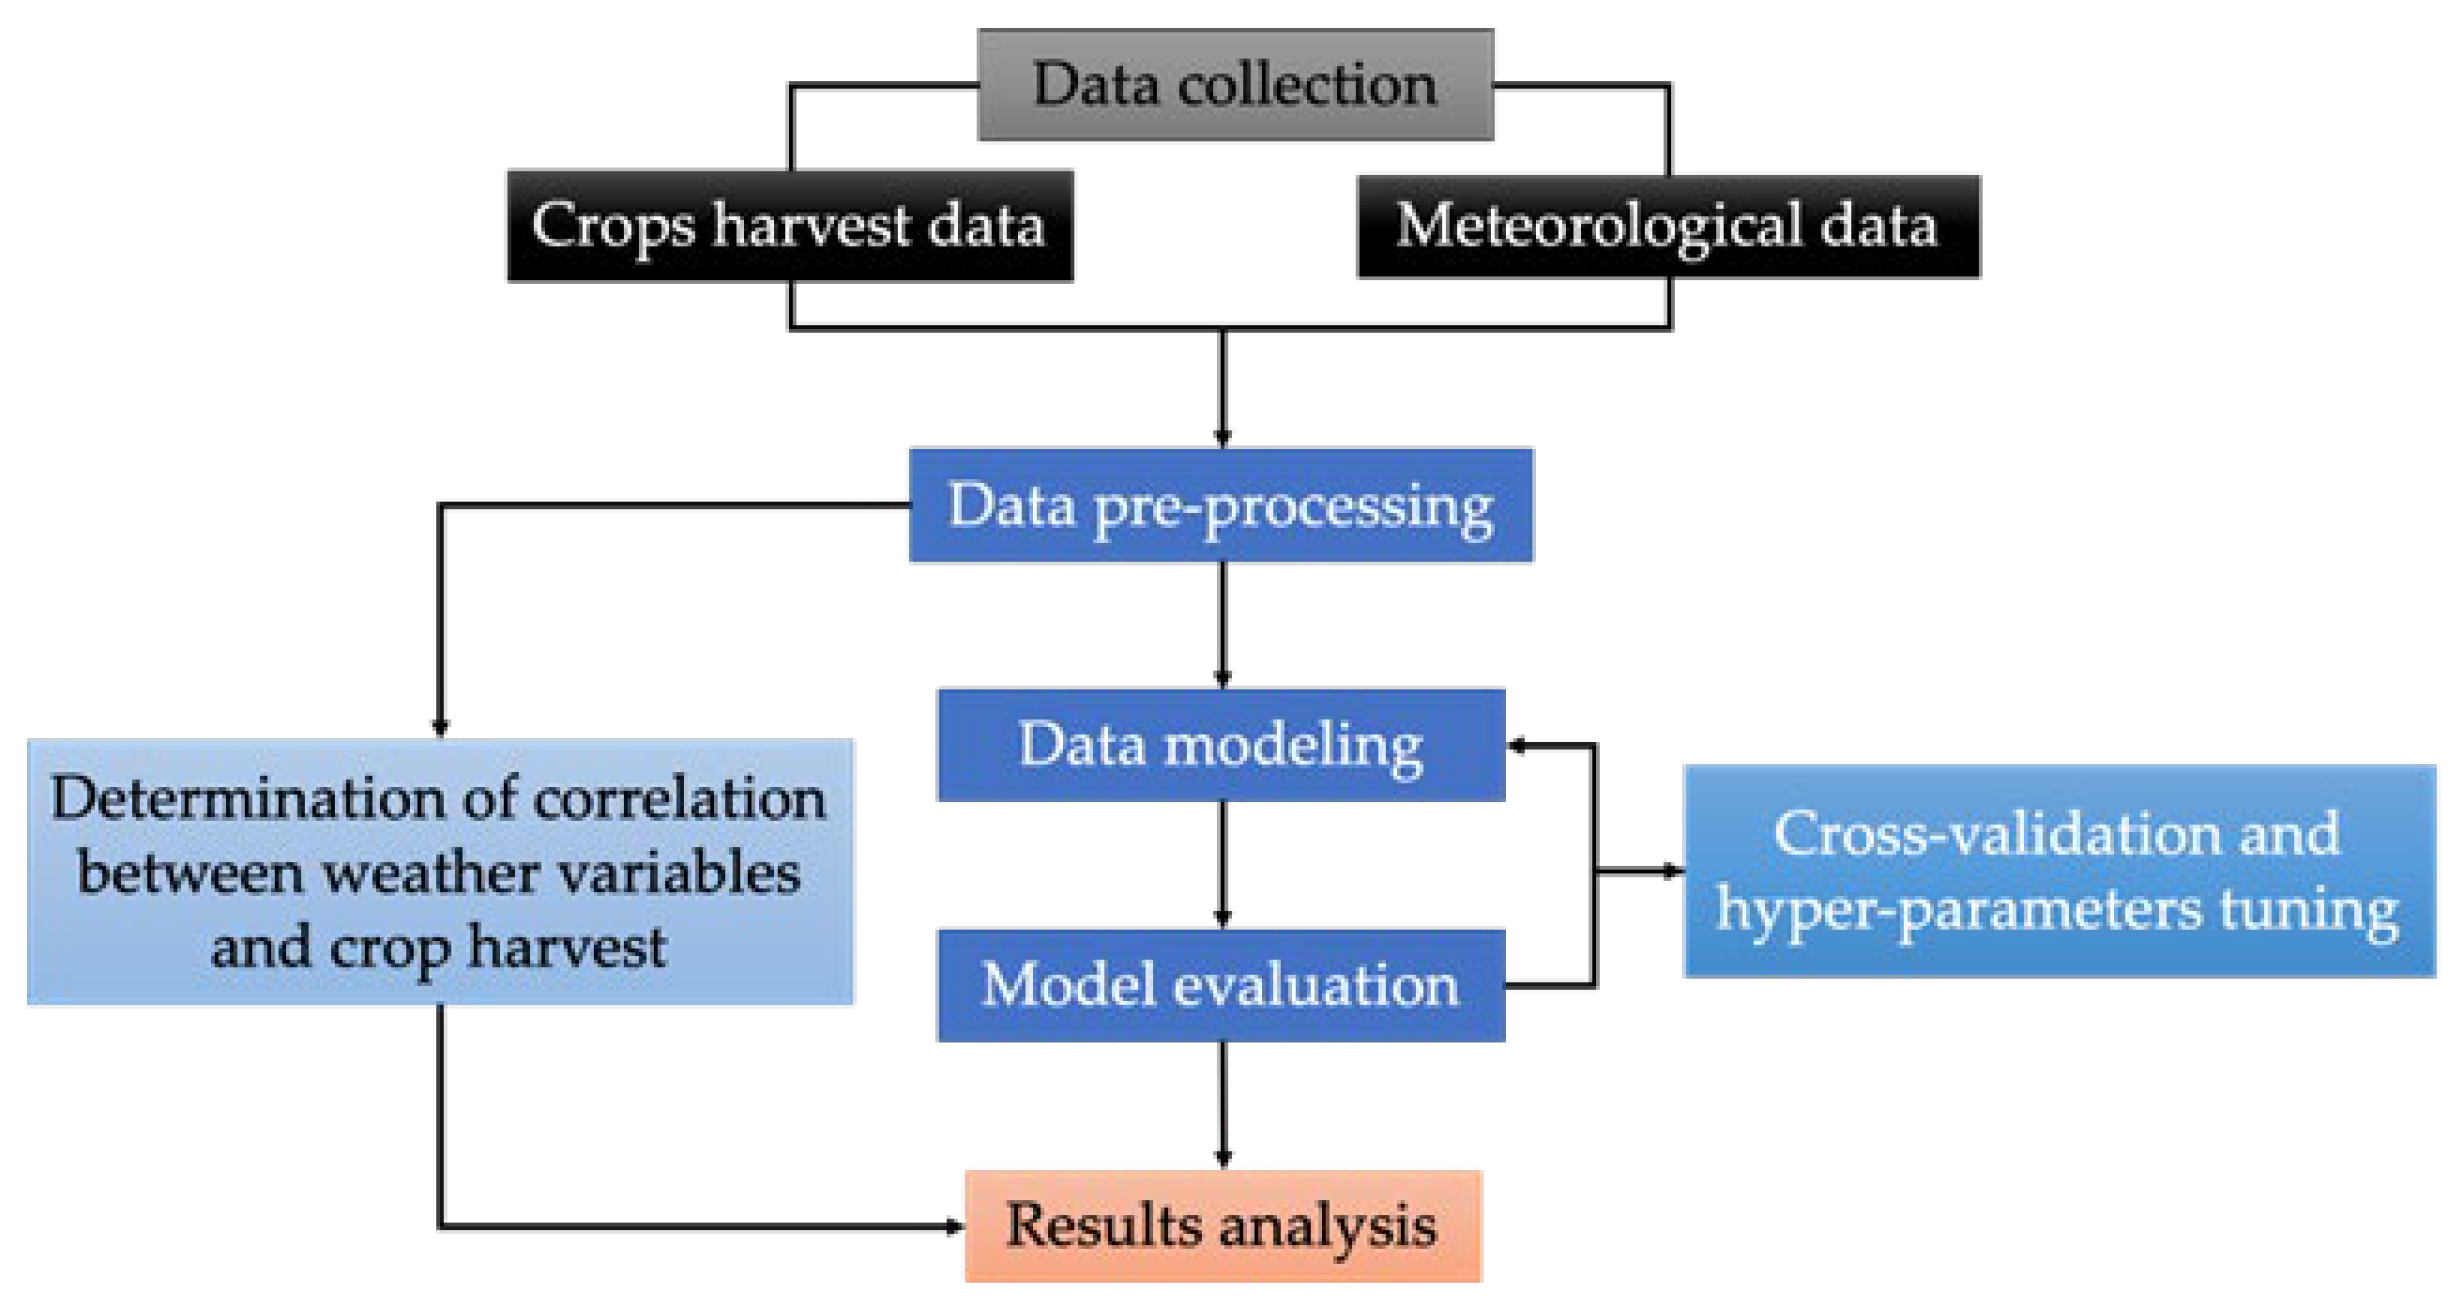
Section 2, a discussion of the materials and research methodology is presented. It includes a discussion of the study area, data collection, data pre-processing and a discussion of the MLMs and the motivation behind their selection. Section 3 presents the results in terms of the performance of the various MLMs. A detailed discussion of the results, its interpretation and how the model performances related to previous works is presented in Section 4. Section 5 is conclusion.

2. Materials and Methods

2.1. Study Area

The study area is Musanze District. It is one of the five districts comprising the Northern Province of Rwanda. The district has a total area of 530.4 km2, in which 60 km2 and 28 km2 are for the Volcanoes National Park and Lake Ruhondo, respectively. The Musanze City is about 110 km from Kigali (Rwanda’s capital). It shares borders with Uganda and the Democratic Republic of the Congo in the north, Gakenke district in the south, Burera district in the east, and Nyabihu district in the west.
Musanze district comprises of 15 administrative sectors, 68 cells, and 432 villages. This district is the most well-known tourist attraction in the nation because of the mountain gorillas that live in the volcanoes national park. Most of the population in this area is employed in agriculture, which poses a threat to the biodiversity of the area. Agriculture leads to stripping away of much of the natural vegetation to grow food crops such as Irish potatoes and maize or cash crops such as pyrethrum.
The soils of Musanze district can be classified as volcanic, with stones and shallow pebbles predominating in volcanic ash soils and volcanic lava on moderate to steep slopes. The volcanic soils are rich in minerals and suitable for agriculture, especially for crops such as; Irish potato, climbing beans, and maize, which are commonly grown in Cyuve, Busogo, Gataraga, Kinigi, Muhoza, Muko, Musanze, Nyange, and Shingiro. The Figure 1 below shows the administrative boundary and weather stations location of the district.
This study was conducted on maize and potato; crops which are under the Crop Intensification Program (CIP) [16] and the area of study was selected based on the dominant crops in the region (district). The district of study is among the highest producers of potato and maize in highland regions.

2.2. Methodology Adopted

This section details the methodology adopted for data processing and analysis used in this study. Figure 2 shows how the activities were cascaded in the process. The data includes harvest and meteorological parameters gathered from different sources. The data used was collected the period 2006 to 2021. A series of data pre-processing for null values removal and correlation determination was conducted, and data modeling processes for cross-validation and hyperparameters tuning activities were conducted. Next, data modeling evaluation was carried out, and prediction results are given.
The source of data includes Rwanda Meteorology Office (for weather data), the NISR that provided data for crops production, Rwanda Agriculture and Animal Resources Development Board (RAB), and the Ministry of Agriculture and Animal Resources (MINAGRI) provided other relevant information.

2.2.1. Crops Production Data

The area of study has fertile soil because the district is surrounded by the volcanic mountains, and this makes the region favorable for agriculture. Maize and Irish potatoes are the most grown crops in this region. Due to the importance of the two crops to the economy of the country and food security, the district decided to consolidate the agriculture land under the CIP. This strategy has the target of increasing the production of two crops from 5.8 tones ha−1 and 29.53 tones ha−1 in the agriculture year 2017/18 to10 tones ha−1 and 42 tones ha−1 in 2022/23 for maize and Irish potatoes, respectively. The agriculture of the two crops is carried out in two seasons: the first season (A) that starts in September and end in January, whereas the second season start in February to June. The two crops are grown alternatively. Irish potatoes are harvested after 3–4 months after planting whereas maize is harvested after 5–6 months.
The data for the crop yields were gathered from NISR and from different cooperatives of farmers in the area of study. The collected data were from agriculture year 2005/2006 to 2020/2021.

2.2.2. Weather Data

The key weather parameters that have an impact on the crop’s development are precipitation, air temperature, air humidity, solar radiation, and wind speed [12]. However, due to the unavailability of the data from the sources for the entire period of the study, this study used rainfall and air temperature since these were the ones available for the period considered in this study.

Rainfall

Precipitation data were collected from Rwanda meteorology agency. Since crops have various water needs according to their stage of development, the monthly total rainfall have been calculated from the daily precipitation to identify the correlation between monthly water requirements and crop production.

Air Temperature

In this study, the monthly mean temperatures have been used since the temperature requirement is different according to the crop stage. The following tables (Table 1 and Table 2) summarize the datasets for Irish potato and maize, respectively.
Columns (rain_1m–rain_4m: rainfall from the 1st month to 4th month) are the monthly rainfall in mm from the first to the fourth month after the day of planting (ADP) in mm, temp_1 to temp_4 are the average of the daily highest temperature in degrees Celsius (°C) from the first month of crop plantation to the fourth month, and product is the seasonal crop yield in kilograms per hectare (kg ha−1).
Where rain_1m–rain_5m are the monthly cumulative rainfall from the 1st to 5th month ADP (in mm), temp_1m–temp_5m is the daily highest temperature average (in °C), and product is the seasonal crop yield (in kg ha−1).

2.3. Machine Learning Models

Various studies have demonstrated that Machine learning is a crucial decision-support tool for predicting crop yield. Machine learning is a technology that can help farmers reduce their farming losses by offering detailed crop advice and insights. The MLMs explored in this study are random forest regressor, polynomial regression, and support Regressor. These approaches were chosen based on the numeric (rather than categorical) nature of the prediction and the size of the dataset.

2.3.1. Random Forest

Random Forest is one of the prominent supervised machine learning algorithms. It can work on both categorical and regression problems with the use of numerous trees, the bootstrap method, and aggregation. The term “decision tree” comes from the way they appear to flow similar to trees (Figure 3). They begin at the tree’s base and proceed through splits with uncertain results until they reach a leaf node, where the outcome is revealed [23].
This decision tree starts with Feature A and splits according to the specific value. When the answer is “yes,” the decision tree takes the indicated path; when it is “no,” it takes the alternative route. After repeating this procedure, the decision is determined at the decision tree’s leaf node. Bootstrapping is the process of randomly selecting subsets of a dataset across a certain number of iterations and variables. Aggregation or assembling is the process of utilizing numerous models that have been trained on the same data and averaging their findings to produce a more potent prediction or classification result [23].

2.3.2. Polynomial Regression

The polynomial regression model was proposed by Drucker et al. [24] in 1996. Regression analysis is a useful statistical tool for analyzing the relationship between a dependent variable and one or more independent variables. Regression analysis can be carried out using simple linear regression or multiple linear regression (polynomial). The simple linear regression technique can only be applied when there are linear relationships between the data. The linear regression is expressed as follows:
y = b 0 + b 1 x .
Nevertheless, suppose that our data are not linear. In this situation, linear regression is unsuccessful because it is unable to produce a best-fit line. Hence, polynomial regression can be used to solve this issue, which reveals the curvilinear relationship between independent and dependent variables. Polynomial regression is a machine learning model derived from linear regression and used for the predictions of the dependent variables where there is no linear correlation between dependent and independent features.
y = b 0 + b 1 x 1 + b 2 x 1 2 + b 3 x 1 3 + + b n x 1 n ,
where y is a dependent variable, b are the regression coefficients, and x is the independent variable. In this study, polynomial regression was chosen since the relationship between the independent and dependent variables need not be linear. It best approximates the relationship between the dependent and independent variables and can fit a wide range of curvature.

2.3.3. Support Vector Regression

Support vector regression is a supervised MLM that is used to examine the linear relationship between two continuous variables. SVR operates on the same basis as the support vector machine (SVM). However, SVM works for the prediction of categorical labels, while the SVR is used for the prediction of continuous variables. SVR’s fundamental premise is to locate the line of best-fit and fit error inside a definite threshold (to estimate the optimum value within a given margin called ε-tube) as shown in Figure 4. The hyperplane with the highest number of points is the best-fit line in SVR [25].
In contrast with other regression models, which strive to minimize the difference between the actual value and the projected value, the SVR seeks to match the best line within a threshold value [24]. The latter is the distance between the hyperplane and the boundary line.

2.4. Models Evaluation

Metrics for evaluating regression models include mean absolute error (MAE), root mean squared error (RMSE), and R Squared [26]. The original-to-predicted value difference is represented by MAE, which averages the absolute difference across the entire data set.
M A E = 1 N i = 1 N y i y ^
RMSE stands for residual mean square error (prediction errors). Data point separation from the regression line is measured by residuals, and the dispersion of these residuals is measured by RMSE. That is to say, it shows how closely the data are centered on the line of best fit.
R M S E = 1 N i = 1 N ( y i y ^ ) 2
R-squared (Coefficient of determination) is a measure of how well the values fit together in relation to the starting values. The percentages are represented by values between 0 and 1. The better the model, the higher the value.
R 2 = 1 ( y i y ^ ) 2 ( y i y ¯ ) 2
where in Equations (3)–(5), y is the predicted value of the production, and y ^ is the actual value of the production.

2.5. Hyper-Parameters Tuning

Before training the models, the dataset was divided into two portions (i.e., train and test sets), where 85% of the data was used for training and 15% was used for testing the model. To decide these ratios, we tried many ratios starting from equal portions (50% for each), increasing the training and decreasing the test portion. We finally found that the best results were obtained for the ratio of 0.85 and 0.15 for the training and testing portions, respectively. Likewise, other parameters have been finetuned using the RandomizedSearchCV tool in python, which returned the best parameters that have been used to train the models so that they can provide good prediction results.

2.6. Cross Validation

To ensure the reliability of the results from the training, k-fold cross validation was used, where different values of k were tried to find the best one to provide good prediction results and k = 3, k = 5, and k = 10 were used, and the results showed no significant difference. We chose k = 5 because it is less biased than k = 3 and has a lower computational cost than k = 10 [27].

3. Results

3.1. Prediction Results

As discussed in Section 2.4, the models’ performance was evaluated using three metrics. The results from cross validation using different values of k showed no significant difference. We chose k = 5 because it is less biased than k = 3 and has a lower computational cost than k = 10 [27]. The results presented in Table 3 indicate that RF fits the data well than PR and SVR as indicated by R2 (0.875, 0.773, and 0.560, respectively).
The same test has been applied to the maize dataset. Table 4 presents the results for R2 through cross validation, where RF fits the data with R2 = 0.817, PR fits the data with R2 score of 0.716, while the R2 score was 0.549 for SVR.
The results presented in the above tables indicate that RF model fits crops yield data than other models as indicated by their respective values of R2.
The following tables (Table 5 and Table 6) summarize the test evaluation results using the performance metrics stated in Section 2.4 for both the Irish potatoes and maize datasets, respectively. The average difference between the predicted values and the actual values for the Irish potatoes are 418.7, 563.6, 722.7 for RF, PR, and SVR, respectively. Whereas the weighted average error between the predicted and the actual crop yield was 510.8, 740.2, and 971.6 for the respective models as shown in Table 5. The results from this prediction indicate that the prediction performance of RF was good since the average of actual production was 11,843.6 kg.
Similarly, the dataset for maize was trained. Table 6 summarizes the performance results for this crop. The mean distance between the actual and predicted crop yields are 96.2, 116.4, and 155.1 for RF, PL, and SVR, respectively. On the other hand, the RMSE for the three respective models were 129.9, 152.7, and 212.4.
Looking at all evaluation metrics, Random Forest regressor has achieved good prediction performance since the mean actual production for maize was 1548.1 kg as shown in Table 2. The comparison analysis of the three models is discussed in Section 3.4.

3.2. Variables Importance

The correlation between crop yields and weather parameters has been identified using python and libraries such as matplotlib and seaborn. As indicated by Figure 5, the second month’s rainfall has a higher contribution to the Irish potatoes in the study area. As shown by Table 1, the average rainfall for the second month was 184.2 mm, i.e., this rainfall amount has been favorited for the optimal crop yield. The first month’s rainfall has been the least contributing to the yield of Irish potatoes. This means that during the first month after planting, this crop does not need much rainfall compared to the subsequent months.
Alternatively, the temperature that had a high contribution to the Irish potato production was that of the 3rd month. Table 1 shows that the average daily maximum temperature was 23.6, while the least contributing temperature was that of the 4th month after planting (month of harvesting).

3.3. Correlation between Weather Variables and Crops Yield

The relationship between weather variables (used in this study) and crops yields has been generated using the Seaborn bivariate kernel density estimate (KDE) tool, which revealed the correlation between monthly rainfall, temperature, and crops yield. Figure 6. Correlation between rainfall and Irish potatoes production.a shows that the monthly rainfall between 50 mm and 200 mm during the first month ADP induced the production of Irish potatoes above 10,000 kg ha−1. During the second month of planting ADP, the high-density distribution was observed around the rainfall of 200 mm that resulted in the production of 14,000 kg ha−1 (Figure 6b). In the third month ADP Irish potatoes, the rainfall that resulted in a good harvest was in the range of 150 to 250 mm, and high distribution density is observed around 200 mm (Figure 6c). Looking the high density of distribution, it has been revealed that the monthly cumulative rainfall in the range of 100 and 200 mm during the fourth month ADP had a production of 1200 kg ha−1 (Figure 6d).
Likewise, the analysis of the crop temperature requirements has been evaluated using Seaborn KDE. As shown by Figure 7a, to acquire a good harvest of Irish potatoes, the maximum temperature required should be between 22–24 °C within the first month ADP, between 23–26 °C during the 2nd month ADP (Figure 7b), in the range of 20–23 °C during the 3rd month ADP (Figure 7c), and 22–25 °C during the 4th month ADP (Figure 7d).
It has also been revealed that the monthly cumulative rainfall of 100–200 mm during the first month ADP was good for the harvest of 1250–2000 kg ha−1, as indicated by the high density distribution in Figure 8a. Rainfall of around 200 mm during the 2nd to 4th month ADP could induce a harvest of 1500 kg ha−1 (Figure 8b–d), whereas the rainfall below 100 mm was good for maize during the last month ADP (Figure 8e).
The maximum daily temperature in the range of 24–26 °C during the 1st month ADP induced the maize production of 1500 kg ha−1 and above, as indicated by the high-density distribution in Figure 9a. The production of maize was below 1500 kg ha−1 when the temperature was below 24 °C during the 2nd month ADP (Figure 9b) but not higher than 26.5 °C. During the 3rd and 4th month ADP the favorite temperature for maize was 22–26 °C (Figure 9c,d), whereas the good temperature during the 5th month was in the range of 24–26 °C.

3.4. Comparative Analysis of the Models

The models have been compared using R2. As shown by Figure 10a, the test results indicated that RF is the best MLM to be used for the prediction of the crop yield since R2 was equal to 0.867, which is a better result compared to the other two models, where R2 = 0.773 and 0.560 for PR and SVR, respectively.
Similar performance results have been realized on the maize dataset. As shown in Table 4, RF was found to be a good prediction model with an R2 = 0.817, 0.716 for PR, and 0.549 for SVR (Figure 10b).

4. Discussion

Crop yields depends on both controllable and non-controllable factors. The first include factors such as crop or seed varieties, tillage practice, the use of fertilizer, and many others. The non-controllable factors are those beyond human control such as weather variables such as precipitation, air temperature, soil temperature, air humidity, soil moisture, solar radiation, etc. If any of the parameters exceed or is below the level of the plant’s requirements, the plant might not grow well, and the productivity will be affected. To achieve a good crop yield prediction, the use of the above-mentioned weather variables is very crucial. However, this can be limited by the availability of the data. For that reason, in this study, the precipitation and temperature data were used for the yield prediction of the Irish potatoes and maize.
Rainfall and temperature requirements differ from one crop to another and from one growing stage to another [12]. This means that an inadequate weather variable at a given stage will have implication on the production level. In the current study, the monthly cumulative rainfall has been used to reflect the crop’s growing stage and the average daily temperature.

4.1. Crops Growing Stages and Climate Requirements

The amount of water needed for any plant depends on the growing stage of the crop, the evaporative requirement of the atmosphere, the crop species, and other parameters [28]. Irish potatoes undertake different stages from the planting day. They are sprout development, vegetative growth, tuber initiation, tuber bulking/filling, and maturity [29]. The growth stages of maize are: establishment, vegetative, tasseling, cob setting (or cob filling), and maturity [30].

4.1.1. Climate Requirements for the Irish Potatoes and Their Impacts on the Production

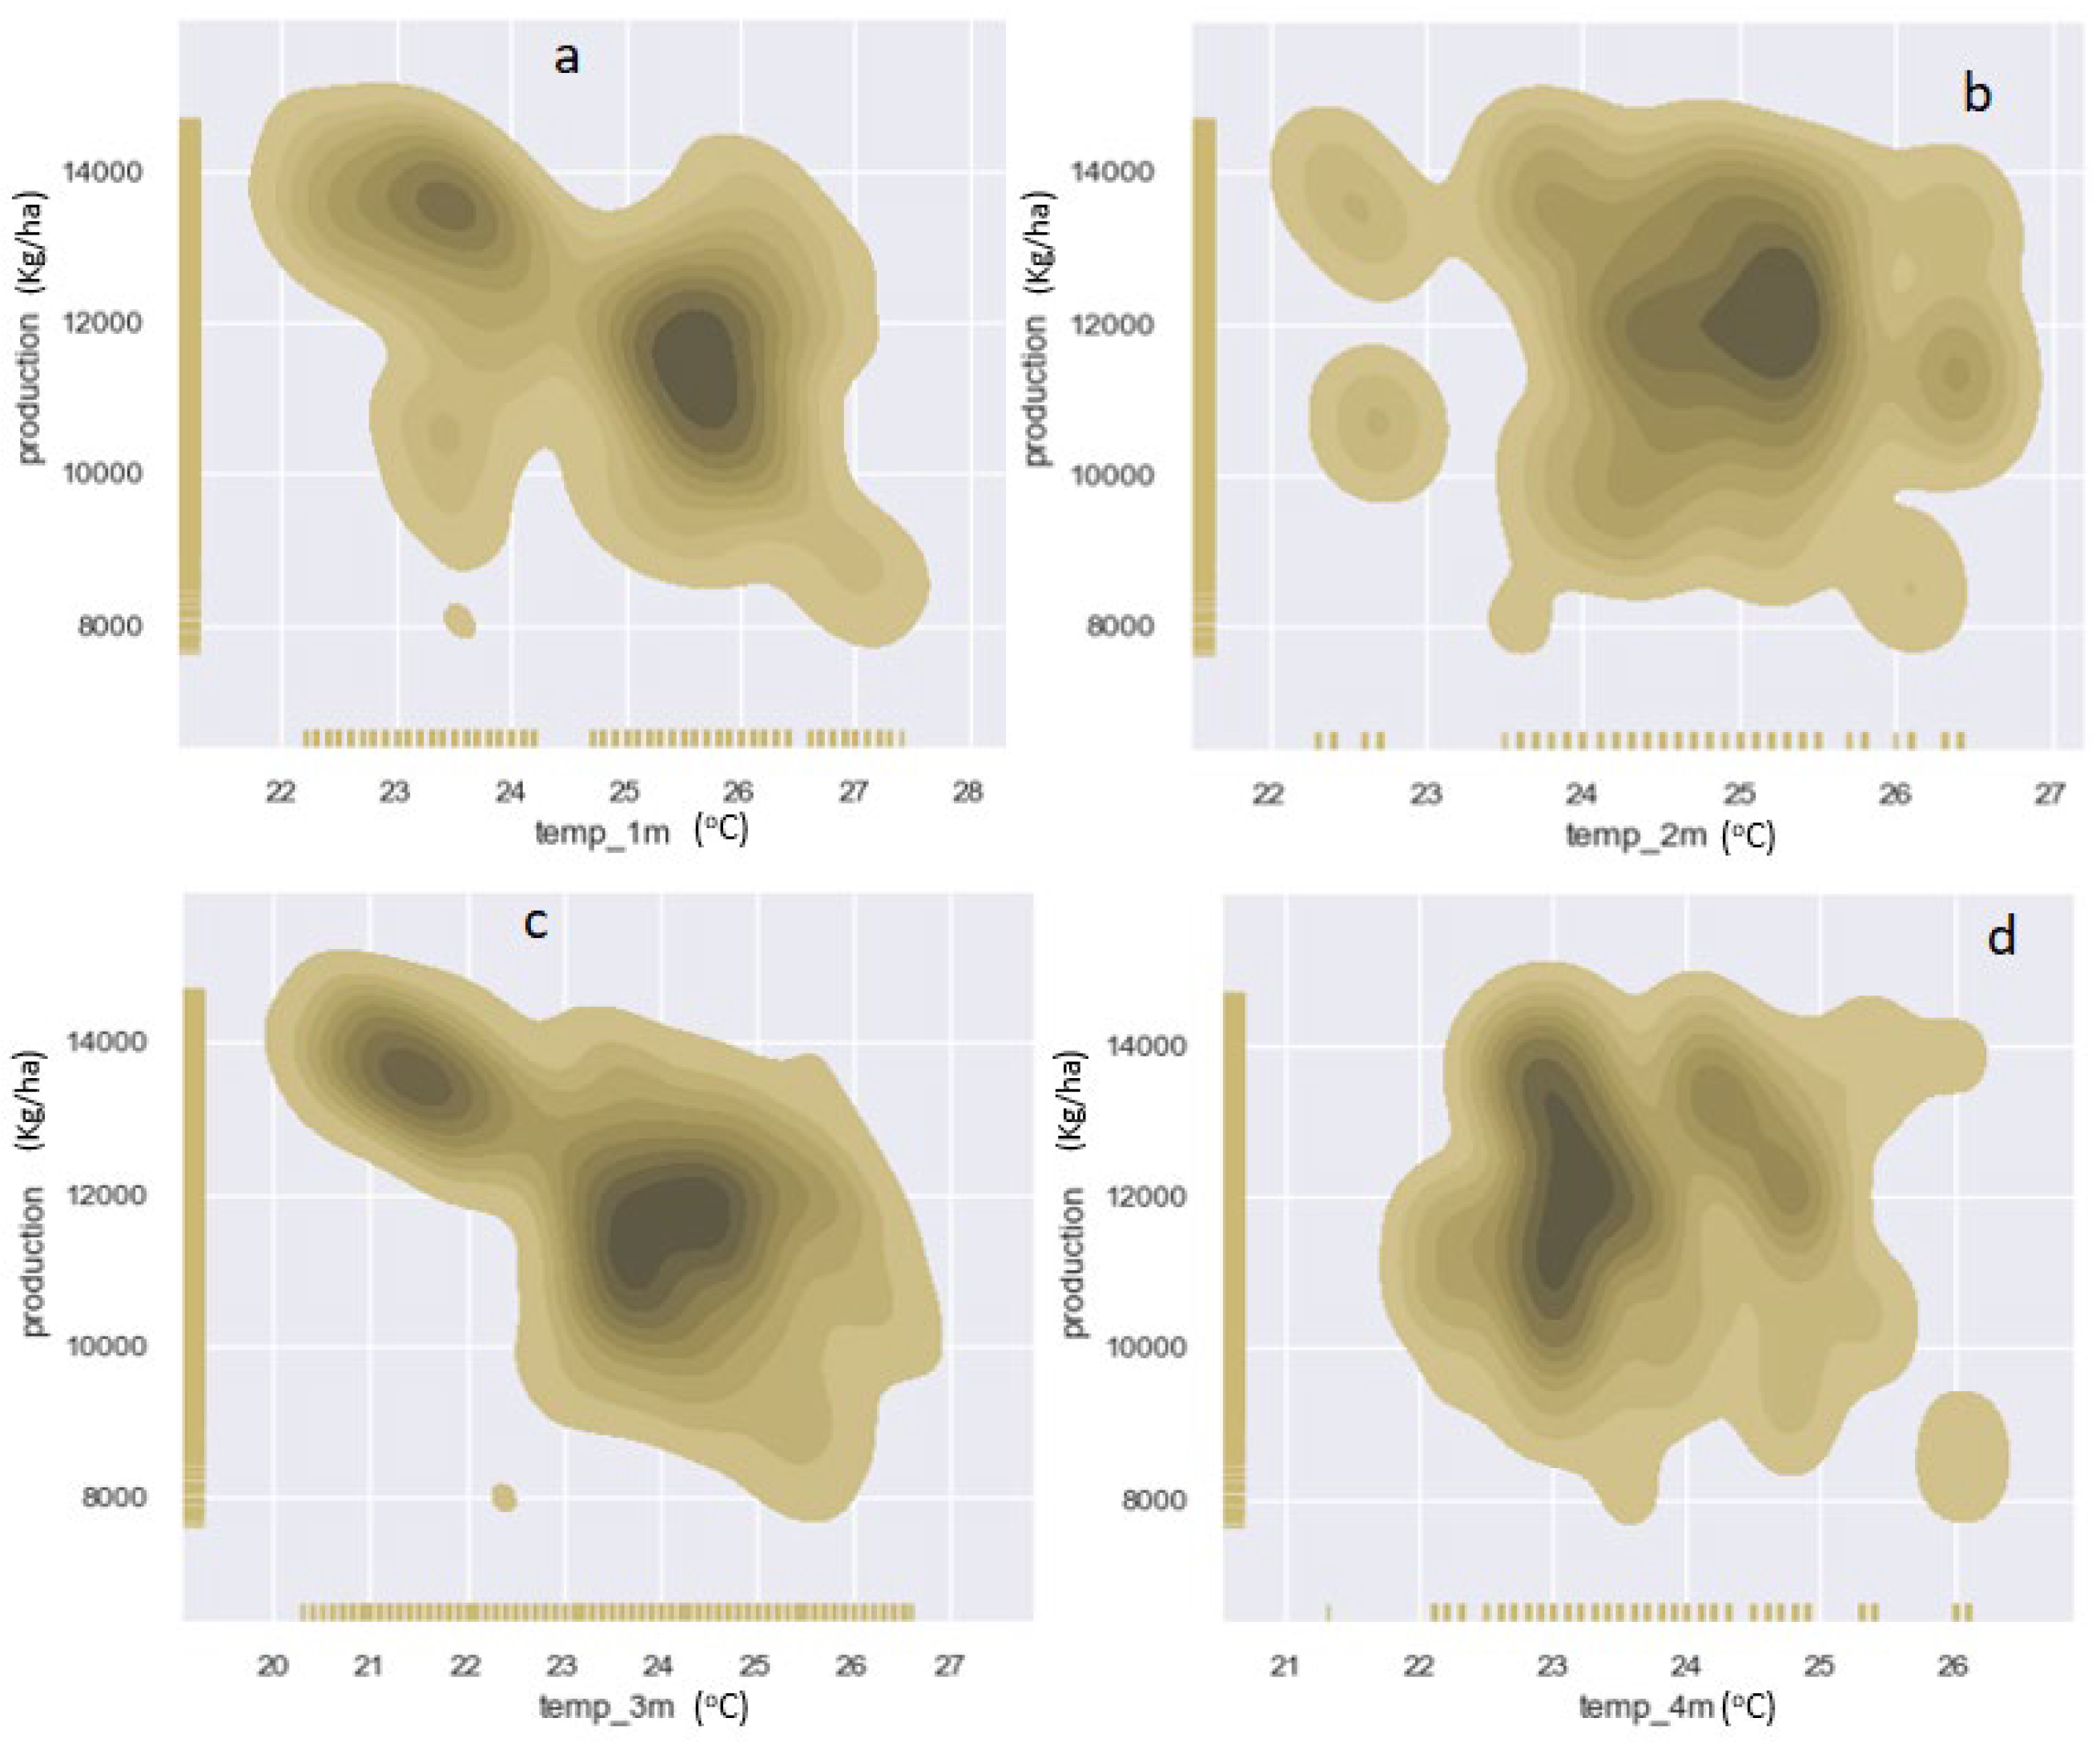
Potatoes are cool environment-loving plant and their growth performs well when the air temperature ranges 16–25 °C during vegetative growth, while the optimum temperature in tuber initiation and bulking stages is in the range of 4–18 °C [
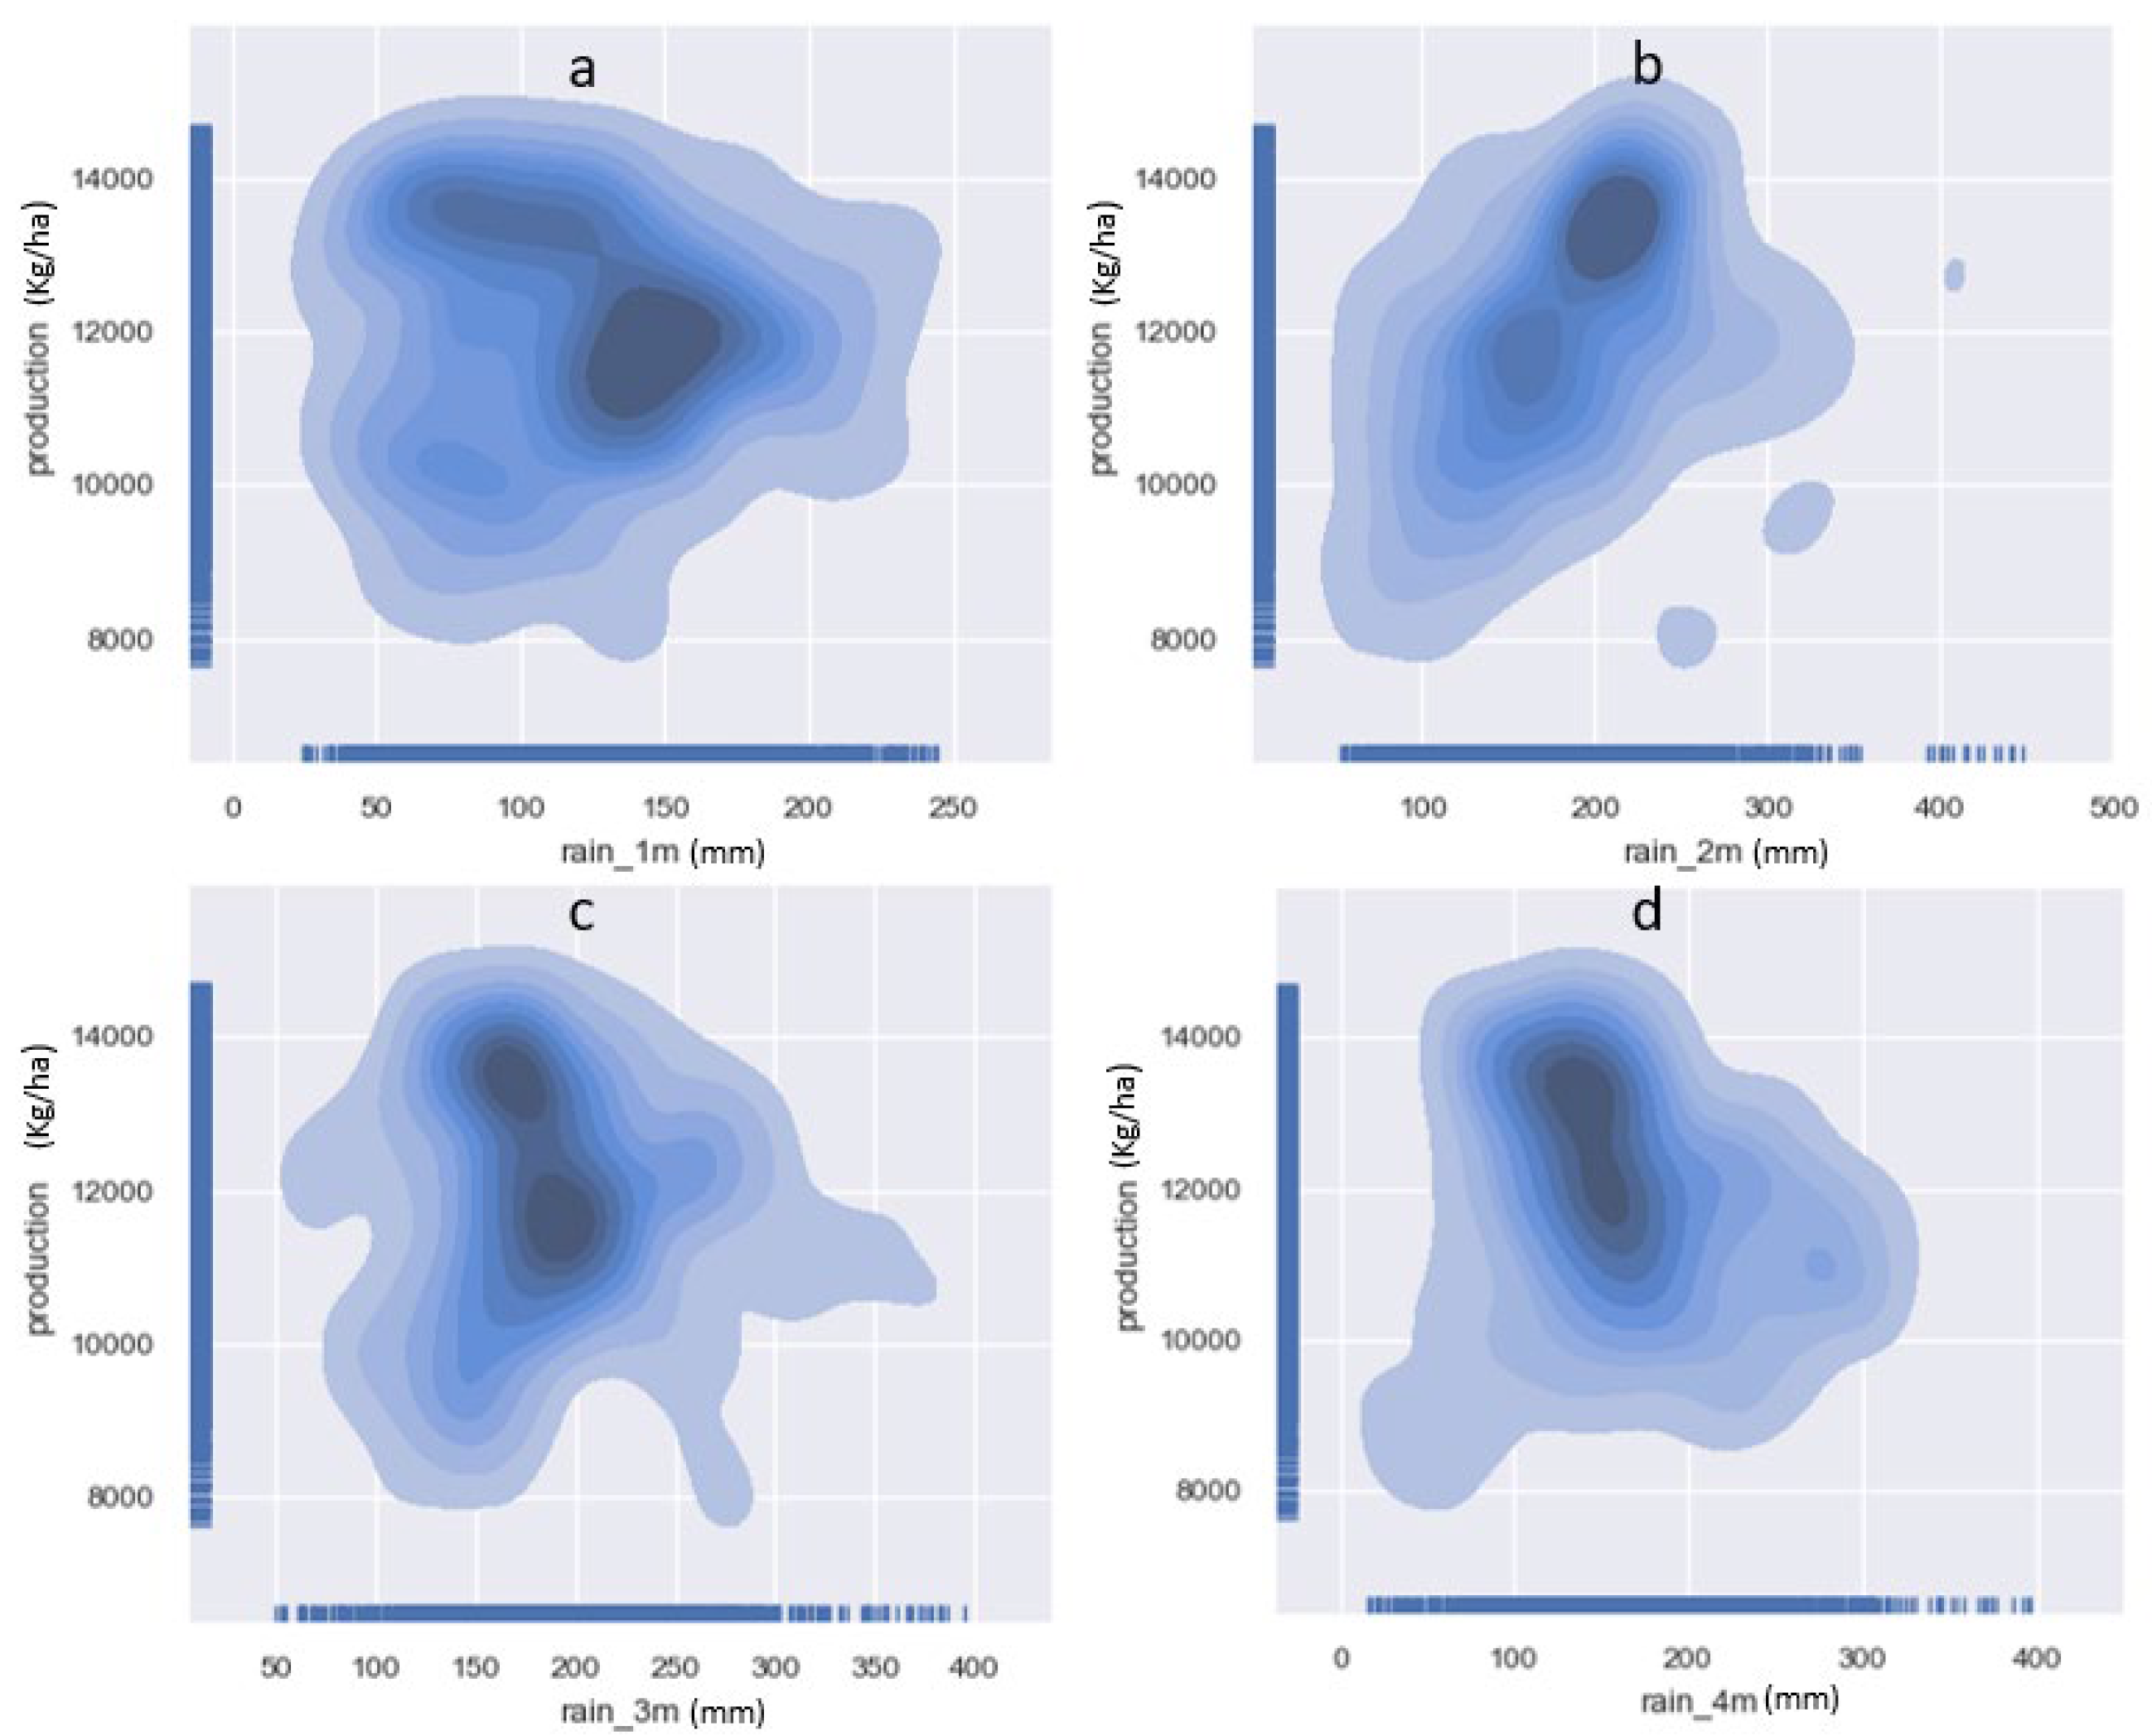
30]. In the present study, we determined the optimum rainfall and temperature needed for Irish potatoes to obtain their optimum production. 
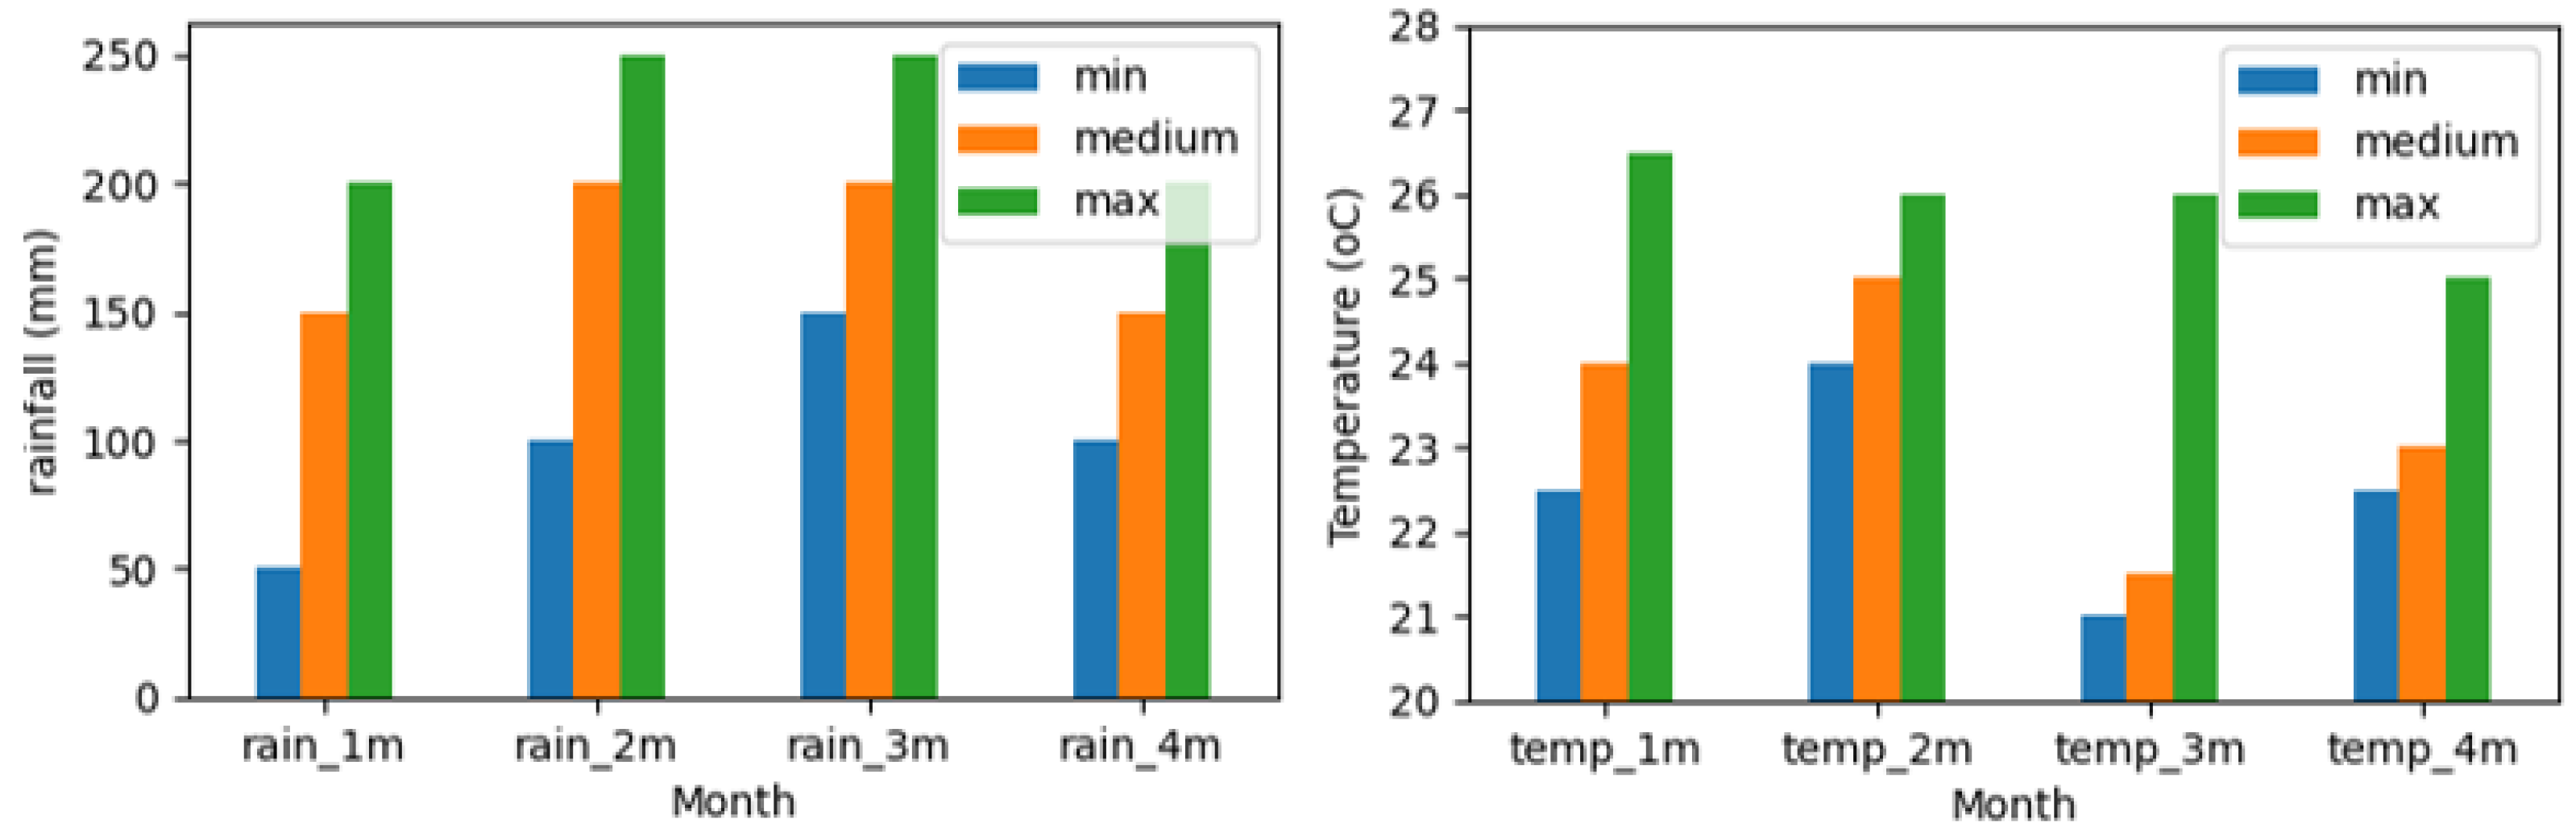
Figure 11 shows the range (minimum, medium, and maximum) of weather requirements from the first month to the last month ADP.
The optimum Irish potato yield is 10,000–14,000 kg ha−1. Given that the establishment (sprouting) stage takes 21 days ADP [30], which means that it occurs during the first month and to obtain the optimum harvest, the rainfall (rain_1m) was in the range of 50–200 mm, whereas the temperature (temp_1m) was 22.5–26.5. From the last week of the 1st month up to the end of the 2nd month is the stage of vegetative growth and tuber initiation. According to the analysis, the ideal rainfall and temperature for these stages are are 100–250 mm and 24–26 °C, respectively. During the tuber bulking stage, the optimum rainfall and temperature for optimum harvest are 150–250 mm and 21–26 °C, respectively, whereas during the maturity stage, the optimum rainfall and temperature for optimum crop yield are 100–200 and 22.5–25 °C, respectively.

4.1.2. Climate Requirements for the Maize and Their Impact on the Production

Crop productivity can be low due to high temperatures. This is attributed to the reduced photosynthesis phenomenon. For instance, for maize, photosynthesis is performed at an optimum level when the temperature is approximately 24 °C and being higher affects the performance of this phenomenon [
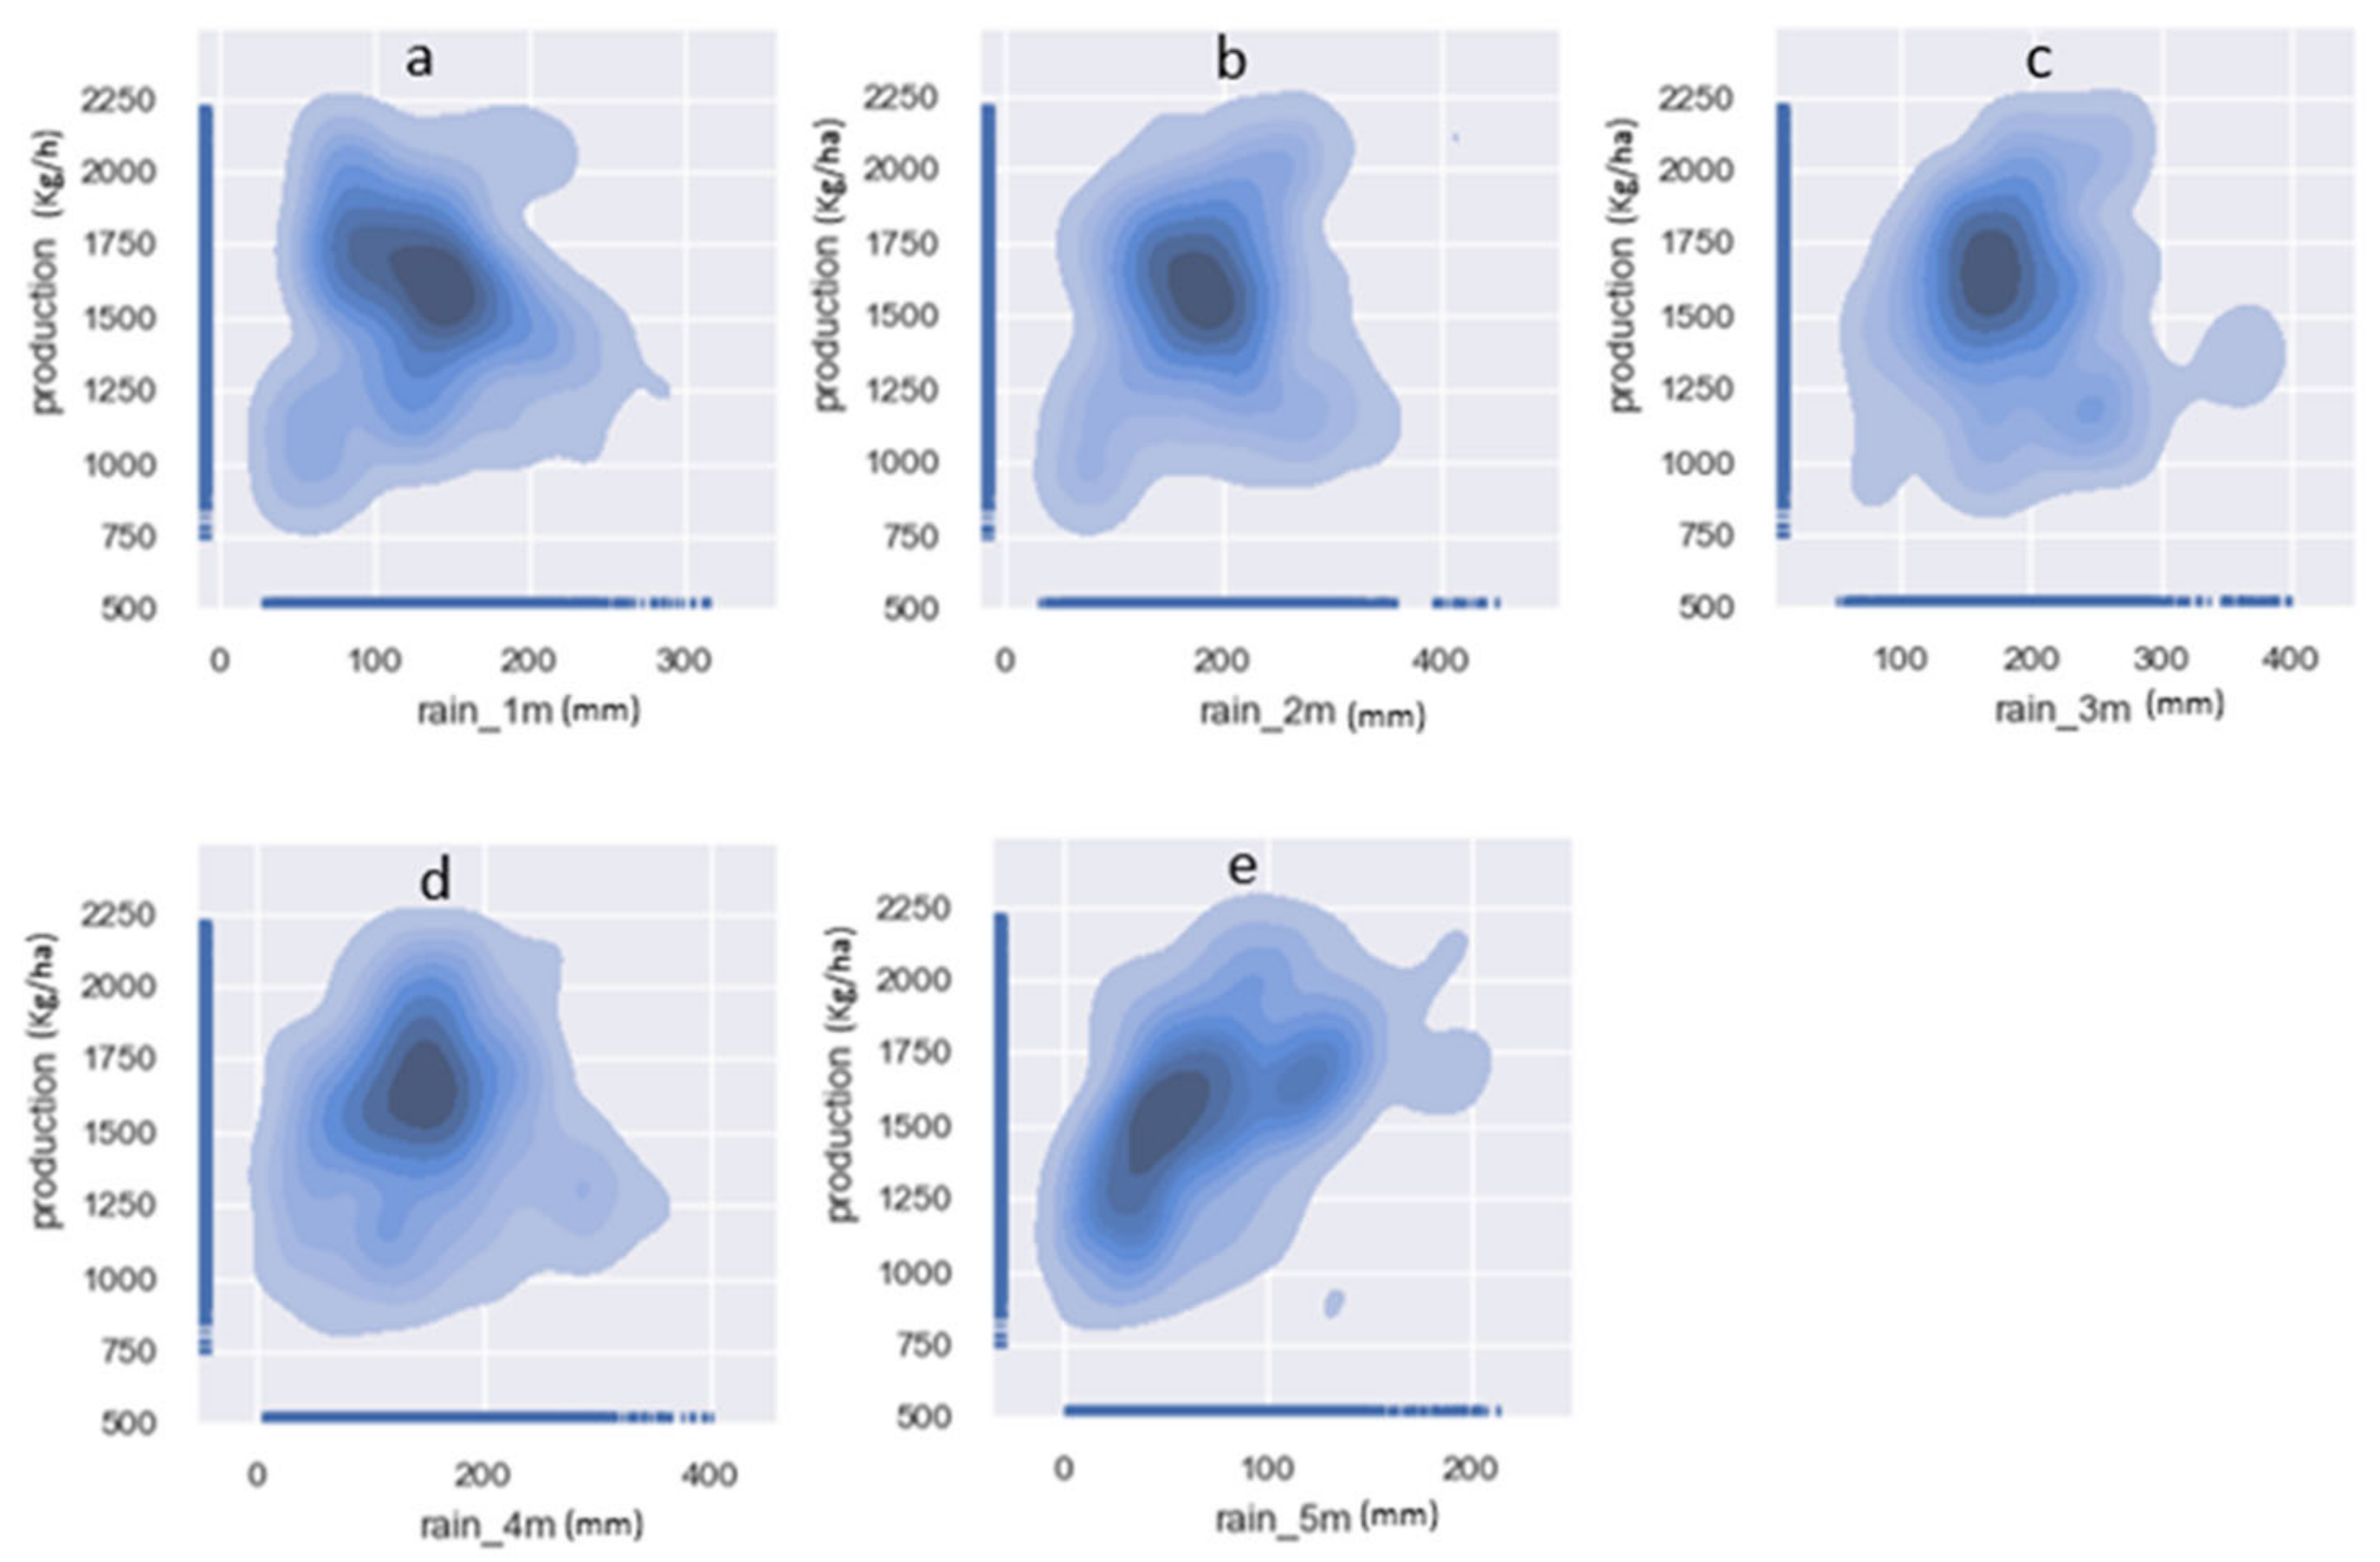
31]. Depending on the maize species, harvesting in the area of study can be carried out after 5 to 6 months ADP. In this study, the analysis of weather requirements was carried out for a period of 5 months since even though the crop can live for 6 months, the need for water and temperature are more critical during the first five months. 
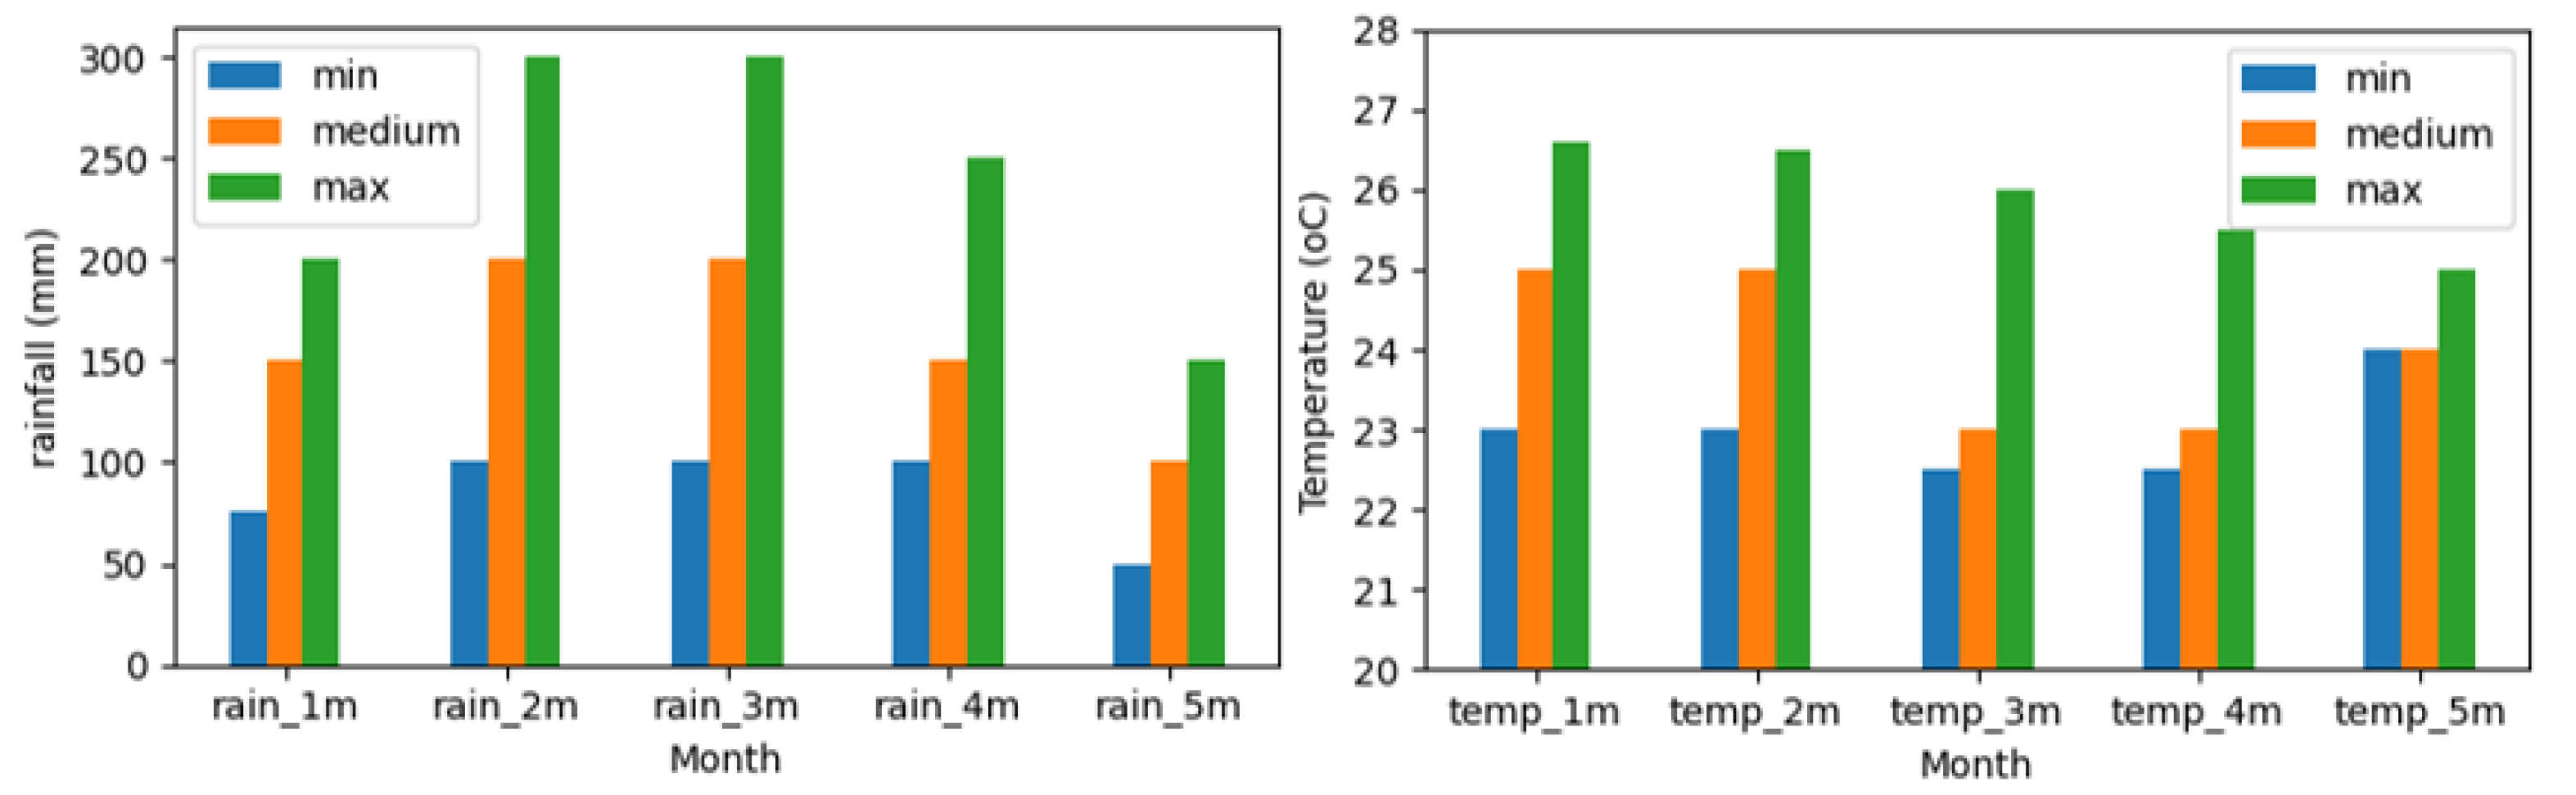
Figure 12 below shows the best weather requirements for the optimization of crop yield.
The rainfall and temperature for the establishment stage are 75–200 mm and 23–26.6 °C, respectively. The water requirement for second to third month ADP (vegetative and tasseling stages) is in range of 100–300 mm, whereas the temperature is 23–26.5 °C and 22.5–26 °C during the second and third month, respectively. The rainfall and temperature during the cob setting stage were 100–250 mm and 22.5–25.5 °C. The maturity stage required rainfall of 50–150 mm, whereas the temperature was in the range of 24–25 °C.

4.2. Prediction and Models Performance

Prediction of crop yield through machine learning is a crucial study because it helps to provide information about the trend of productivity for decision making. In this study, Irish potato and maize datasets were trained in three models for the purpose of finding the best yield predictor to be recommended to the systems developers and for our future work. Although there are many climate-related predictors of crop yield, rainfall and temperature have been used due to the unavailability of other variables such as air humidity, soil moisture, solar radiation etc. The results from the trained and tested models indicate that the precision for Irish potato yield forecasting with RMSE were 510.8, 740, and 971.6 kg ha−1 for RF, SVR, and PR, respectively. On the other hand, the RMSE for maize yield prediction were 129.9, 152.7, and 212.4 kg ha
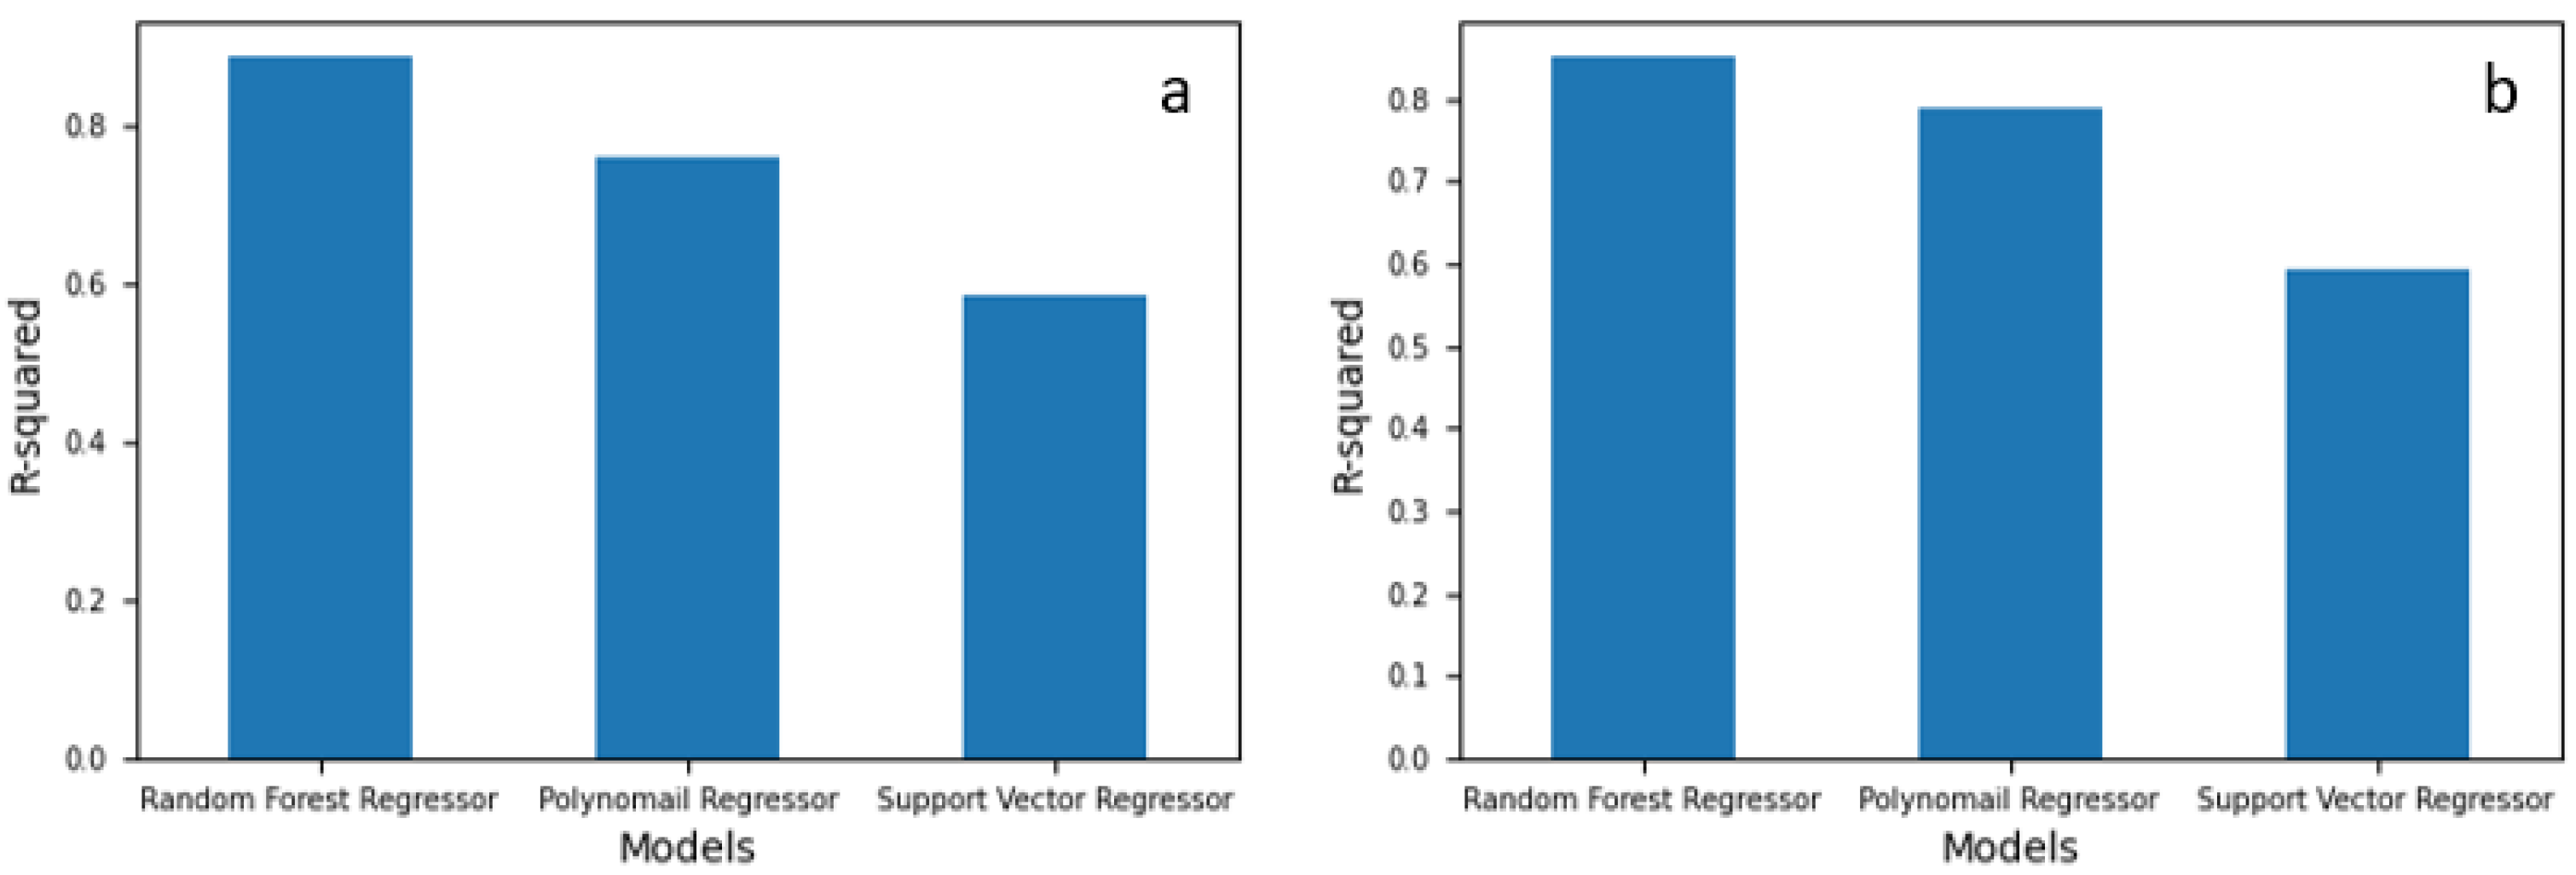
−1 for RF, PL, and SVR. These results imply that RF is the best model, as shown by Figure 10. The strength of correlation between predicted and actual crop yields was evaluated through R2 that were equal to 0.875, 0.773, 0.560 (RF, PL, and SVR) for Irish potatoes, and 0.817, 0.716, 0.549 for maize.
These performance results indicate that the best model to be recommended in the development of early crop yield prediction system is RF. The latter is one of the most widely used MLMs in crop yield forecasting today [26,32,33,34]. Similar studies that used different models such as the SVR, ANN, CNN, DNN, LSTM [13,35,36,37,38] have achieved good performance results. However, authors select MLM and the predictors (independent variables) for different reasons, such as the nature of the dataset, types of the dependent variable (target), size of the dataset, availability of the data, etc. This study considered the climatic variables because the impact climate change has on crop productivity is critical. At their various growth stages, crops can be affected by climate change that may later result in a reduced yield. This is the reason we used rainfall and temperature by considering the growth stages of the crops. Even though the prediction results of the best MLM were good, this study was limited by the lack of data for other parameters such as air humidity, soil moisture, and solar radiations. Improvement of the prediction results would be observed if those parameters were considered. These parameters will be considered in our next study, where the IoT will be used to gather those climatic and hydraulic variables to be fed into the MLM and forecast the crop yield.

5. Conclusions

This study has explored the impact of climate change on rainfed agriculture pro-duction. The work advocates for early information sharing specifically on expected yield so as to ensure proper planning which may help to reduce food insecurity. Three MLMs, namely, RF, SVR and PR have been tested on data from Musanze (an active agricultural district of Rwanda) as to their prediction abilities to forecast maize and Irish potato yields. The RF model has shown superior performance on the data as shown by its R2, MAE and RMSE values for both crops. Historical crop yields and weather conditions comprised the data, with weather variables (i.e., rainfall and temperature) used as predictors. In addition, the analysis of the correlation between weather variables and crop production has been carried out. The optimum values of rainfall and temperature at each crop development stage for the optimal crops yield have been identified as explained in the discussion section.

Future Research Directions

MLMs have proven valuable as building blocks of ubiquitous computing due to their ability to extract meaningful information from measured data. As shown in Section 3, RF model performed superior in yields prediction compared to SVR, and PR. Our future work will explore development of a framework architecture that integrates RF model and IoT for yield prediction. The goal is to use the IoT component for monitoring soil moisture conditions and weather, while the RF model will be used for crop yield prediction. Existing works will prove vital in guiding the design and development of the architecture for optimal performance. Examples of these works include the work of Buschjager et al. [39] in which the authors investigate the implementations of decision trees and random forests for the classical von-Neumann computing architecture and custom circuits; and that of Prajwala et al. [40] in which the authors used 5 attributes, i.e., wind direction, temperature, atmospheric pressure, and humidity to build decision rules to predict rainfall using random forest algorithm.

Author Contributions

Conceptualization, M.K. and E.H.; methodology, M.K.; software, E.H.; validation, D.H., P.R., E.H. and K.M.; formal analysis, A.M.; resources, J.N., A.U. and C.U; data curation, J.N., A.U. and C.U.; writing—original draft preparation, M.K.; writing—review and editing, D.H., P.R., E.H. and K.M.; visualization, D.H.; project administration, M.K.; funding acquisition, M.K. All authors have read and agreed to the published version of the manuscript.

Funding

This research was funded through the grant offered by the University of Rwanda in the partnership with Sida (Swedish International Development Agency) under the programme UR-Sweden program. The grant supported all research activities such as data collection, purchase of equipment and materials, fieldwork, etc. The APC was also funded by the same grant.

Institutional Review Board Statement

Not applicable.

Data Availability Statement

When requested, the authors will make available all data used in this study.

Conflicts of Interest

The authors declare no conflict of interest.

References

  1. Shakoor, U.; Saboor, A.; Ali, I.; Mohsin, A.Q. Impact of climate change on agriculture: Empirical evidence from arid region, Pakistan. J. Agric. Sci. 2011, 48, 327–333. [Google Scholar]
  2. Molden, D.; Vithanage, M.; de Fraiture, C.; Faures, J.M.; Gordon, L.; Molle, F.; Peden, D. Water Availability and Its Use in Agriculture. Treatise Water Sci. 2011, 4, 707–732. [Google Scholar] [CrossRef]
  3. Keen, B.A. Weather and crops. Q. J. R. Meteorol. Soc. 1940, 66, 155–166. [Google Scholar] [CrossRef]
  4. Javadinejad, S.; Eslamian, S.; Askari, K.O.A. The analysis of the most important climatic parameters affecting performance of crop variability in a changing climate. Int. J. Hydrol. Sci. Technol. 2021, 11, 1–25. [Google Scholar] [CrossRef]
  5. Beillouin, D.; Schauberger, B.; Bastos, A.; Ciais, P.; Makowski, D. Impact of extreme weather conditions on European crop production in 2018: Random forest—Yield anomalies. Philos. Trans. R. Soc. B Biol. Sci. 2020, 375, 20190510. [Google Scholar] [CrossRef]
  6. Uleberg, E.; Hanssen-Bauer, I.; van Oort, B.; Dalmannsdottir, S. Impact of climate change on agriculture in Northern Norway and potential strategies for adaptation. Clim. Change 2014, 122, 27–39. [Google Scholar] [CrossRef]
  7. Yadav, M.R.; Choudhary, M.; Singh, J.; Lal, M.K.; Jha, P.K.; Udawat, P.; Gupta, N.K.; Rajput, V.D.; Garg, N.K.; Maheshwari, C.; et al. Impacts, Tolerance, Adaptation, and Mitigation of Heat Stress on Wheat under Changing Climates. Int. J. Mol. Sci. 2022, 23, 2838. [Google Scholar] [CrossRef]
  8. Gallego, A.; Carrión, M.C.; Ruiz, D.P.; Medouri, A. The relationship between AR-modelling bispectral estimation and the theory of linear prediction. Signal Process 1994, 37, 381–388. [Google Scholar] [CrossRef]
  9. US AID. Climate Change Risk Profile: Philippines. 2017, pp. 1–4. Available online: https://www.climatelinks.org/sites/default/files/asset/document/2017_Climate_Change_Risk_Profile_Philippines.pdf (accessed on 2 February 2022).
  10. EastAfrican. 3000 Rwandan Families Face Hunger due to Drought—Rwanda|ReliefWeb, (n.d.). Available online: https://reliefweb.int/report/rwanda/3000-rwandan-families-face-hunger-due-drought (accessed on 3 February 2022).
  11. Kironde, E.G. Rwanda State of Environment and Outlook Report. In REMA; 2016; 1, pp. 93–115. Available online: https://www.rema.gov.rw/soe/chap9.php (accessed on 3 February 2022).
  12. Chakraborty, D.; Saha, S.; Sethy, B.K.; Singh, H.D.; Singh, N.; Sharma, R.; Chanu, A.N.; Walling, I.; Anal, P.R.; Chowdhury, S.; et al. Usability of the Weather Forecast for Tackling Climatic Variability and Its Effect on Maize Crop Yield in Northeastern Hill Region of India. Agronomy 2022, 12, 2529. [Google Scholar] [CrossRef]
  13. Crane-Droesch, A. Machine learning methods for crop yield prediction and climate change impact assessment in agriculture. Environ. Res. Lett. 2018, 13, 114003. [Google Scholar] [CrossRef] [Green Version]
  14. Kang, Y.; Ozdogan, M.; Zhu, X.; Ye, Z.; Hain, C.R.; Anderson, M.C. Comparative assessment of environmental variables and machine learning algorithms for maize yield prediction in the US Midwest. Environ. Res. Lett. 2020, 15, 064005. [Google Scholar] [CrossRef]
  15. Sun, J.; Di, L.; Sun, Z.; Shen, Y.; Lai, Z. County-Level Soybean Yield Prediction Using Deep CNN-LSTM Model. Sensors 2019, 19, 4363. [Google Scholar] [CrossRef] [Green Version]
  16. Nishant, P.S.; Venkat, P.S.; Avinash, B.L.; Jabber, B. Crop Yield Prediction based on Indian Agriculture using Machine Learning. In Proceedings of the 2020 International Conference for Emerging Technology (INCET), Belgaum, India, 5–7 June 2020; pp. 5–8. [Google Scholar] [CrossRef]
  17. Reddy, D.; Kumar, M.R. Crop Yield Prediction using Machine Learning Algorithm. In Proceedings of the 2021 5th International Conference on Computational Intelligence in Information Systems (CIIS 2022), Madurai, India, 6–8 May 2021; pp. 1466–1470. [Google Scholar] [CrossRef]
  18. Wang, X.; Huang, J.; Feng, Q.; Yin, D. Winter Wheat Yield Prediction at County Level and Uncertainty Analysis in Main Wheat-Producing Regions of China with Deep Learning Approaches. Remote. Sens. 2020, 12, 1744. [Google Scholar] [CrossRef]
  19. Kumar, Y.J.N.; Spandana, V.; Vaishnavi, V.; Neha, K.; Devi, V. Supervised Machine learning Approach for Crop Yield Prediction in Agriculture Sector. In Proceedings of the 2020 5th International Conference on Communication and Electronics Systems (ICCES), Coimbatore, India, 10–12 June 2020; pp. 736–741. [Google Scholar] [CrossRef]
  20. Rugimbana, C. Predicting Maize (Zea Mays) Yields in Eastern Province of Rwanda Using Aquacrop Model. University of Nairobi. 2019. Available online: https://ccafs.cgiar.org/resources/publications/predicting-maize-zea-mays-yields-eastern-province-rwanda-using-aquacrop (accessed on 29 December 2022).
  21. Ngaruye, I.; von Rosen, D.; Singull, M. Crop yield estimation at district level for agricultural seasons 2014 in Rwanda. Afr. J. Appl. Stat. 2016, 3, 69–90. [Google Scholar] [CrossRef] [Green Version]
  22. Breure, M.S.; Kempen, B.; Hoffland, E. Spatial predictions of maize yields using QUEFTS—A comparison of methods. Geoderma 2022, 425, 116018. [Google Scholar] [CrossRef]
  23. Breiman, L. Random forests. Mach. Learn. 2001, 45, 5–32. [Google Scholar] [CrossRef] [Green Version]
  24. Drucker, H.; Surges, C.; Kaufman, L.; Smola, A.; Vapnik, V. Support vector regression machines. Adv. Neural Inf. Process Syst. 1997, 1, 155–161. [Google Scholar]
  25. Smola, A.J.; Schölkopf, B. A tutorial on support vector regression. Stat. Comput. 2004, 14, 199–222. [Google Scholar] [CrossRef] [Green Version]
  26. Van Klompenburg, T.; Kassahun, A.; Catal, C. Crop yield prediction using machine learning: A systematic literature review. Comput. Electron. Agric. 2020, 177, 105709. [Google Scholar] [CrossRef]
  27. Rodriguez, J.D.; Perez, A.; Lozano, J.A. Sensitivity Analysis of k-Fold Cross Validation in Prediction Error Estimation. IEEE Trans. Pattern Anal. Mach. Intell. 2010, 32, 569–575. [Google Scholar] [CrossRef] [PubMed]
  28. Wright, G.; Bell, M.; Bell, M. Plant population studies on peanut (Arachis hypogaea L.) in subtropical Australia. 3. Growth and water use during a terminal drought stress. Aust. J. Exp. Agric. 1992, 32, 197–203. [Google Scholar] [CrossRef]
  29. Obidiegwu, J.E.; Bryan, G.J.; Jones, H.G.; Eprashar, A. Coping with drought: Stress and adaptive responses in potato and perspectives for improvement. Front. Plant Sci. 2015, 6, 1–23. [Google Scholar] [CrossRef] [PubMed] [Green Version]
  30. Zemba, B.; Wuyep, S.; Adebayo, A.; Jahknwa, C. Growth and Yield Response of Irish Potato (Solanum tuberosum) to Climate in Jos-South, Plateau State, Nigeria Growth and Yield Response of Irish Potato Solanum Tuberosumto Climate in Jos-South, Plateau State, Nigeria Strictly as per the compliance a. Int. J. Plant Res. 2013, 2019, 1–7. [Google Scholar] [CrossRef]
  31. Ku, S.-B.; Edwards, G.E.; Tanner, C.B. Effects of Light, Carbon Dioxide, and Temperature on Photosynthesis, Oxygen Inhibition of Photosynthesis, and Transpiration in Solanum tuberosum. Plant Physiol. 1977, 59, 868–872. [Google Scholar] [CrossRef] [Green Version]
  32. Charoen-Ung, P.; Mittrapiyanuruk, P. Sugarcane Yield Grade Prediction Using Random Forest with Forward Feature Selection and Hyper-Parameter Tuning BT—Recent Advances in Information and Communication Technology 2018; Unger, H., Sodsee, S., Meesad, P., Eds.; Springer International Publishing: Cham, Switzerland, 2019; pp. 33–42. [Google Scholar]
  33. Ranjan, A.K.; Parida, B.R. Paddy acreage mapping and yield prediction using sentinel-based optical and SAR data in Sahibganj district, Jharkhand (India). Spat. Inf. Res. 2019, 27, 399–410. [Google Scholar] [CrossRef]
  34. Jeong, J.H.; Resop, J.P.; Mueller, N.D.; Fleisher, D.H.; Yun, K.; Butler, E.E.; Timlin, D.J.; Shim, K.-M.; Gerber, J.S.; Reddy, V.R.; et al. Random Forests for Global and Regional Crop Yield Predictions. PLoS ONE 2016, 11, 1–15. [Google Scholar] [CrossRef] [Green Version]
  35. Matsumura, K.; Gaitan, C.F.; Sugimoto, K.; Cannon, A.J.; Hsieh, W.W. Maize yield forecasting by linear regression and artificial neural networks in Jilin, China. J. Agric. Sci. 2015, 153, 399–410. [Google Scholar] [CrossRef]
  36. Gandhi, N.; Armstrong, L.J.; Petkar, O.; Tripathy, A.K. Rice crop yield prediction in India using support vector machines. In Proceedings of the 2016 13th International Joint Conference on Computer Science and Software Engineering (JCSSE), Khon Kaen, Thailand, 13–15 July 2016; pp. 1–5. [Google Scholar]
  37. Ju, S.; Lim, H.; Heo, J. Machine learning approaches for crop yield prediction with MODIS and weather data. In Proceedings of the 40th Asian Conference on Remote Sensing: Progress of Remote Sensing Technology for Smart Future, ACRS 2019, Daejeon, Republic of Korea, 14–18 October 2019; pp. 1–4. [Google Scholar]
  38. Ahmad, I.; Saeed, U.; Fahad, M.; Ullah, A.; Rahman, M.H.U.; Judge, J. Yield Forecasting of Spring Maize Using Remote Sensing and Crop Modeling in Faisalabad-Punjab Pakistan. J. Indian Soc. Remote. Sens. 2018, 46, 1701–1711. [Google Scholar] [CrossRef]
  39. Buschjager, S.; Morik, K. Decision Tree and Random Forest Implementations for Fast Filtering of Sensor Data. IEEE Trans. Circuits Syst. I: Regul. Pap. 2018, 65, 209–222. [Google Scholar] [CrossRef]
  40. Prajwala, T.R.; Ramesh, D.; Venugopal, H. Modeling and Forecasting of Rainfall using IoT sensors and Adaptive Boost Classifier for a Region. SSRN Electron. J. 2021, 58–61. [Google Scholar] [CrossRef]
Figure 1. The administrative boundary and weather stations location of Musanze district.
Agriculture 13 00225 g001
Figure 2. Data collection and processing methodology.
Agriculture 13 00225 g002
Figure 3. RF Decision Tree.
Agriculture 13 00225 g003
Figure 4. Support Vector Regressor.
Agriculture 13 00225 g004
Figure 5. Features importance. Where rain_1m-rain_5m are the monthly cumulative rainfall from the first to fifth month ADP, temp_1m-temp_5m is the daily highest temperature average.
Agriculture 13 00225 g005
Figure 6. Correlation between rainfall and Irish potatoes production.
Agriculture 13 00225 g006
Figure 7. Correlation between air temperature and Irish potatoes production.
Agriculture 13 00225 g007
Figure 8. Correlation between rainfall and maize production.
Agriculture 13 00225 g008
Figure 9. Correlation between air temperature and maize production.
Agriculture 13 00225 g009
Figure 10. Models’ comparison: (a) Irish Potatoes, (b) Maize.
Agriculture 13 00225 g010
Figure 11. Optimum rainfall and temperature for optimum potatoes’ yield.
Agriculture 13 00225 g011
Figure 12. Optimum rainfall and temperature for optimum maize’s yield.
Agriculture 13 00225 g012
Table 1. Dataset description (Potato).
rain_1mrain_2mrain_3mrain_4mtemp_1mtemp_2mtemp_3mtemp_4mProduct
count192119211921192119211921192119211921
mean120.9184.2186.1162.424.824.823.623.611,843.6
std47.161.851.662.41.30.91.50.91514.9
min24.553.250.115.522.222.320.321.37649
25%82.7140153.8122.323.524.222.62310,787.8
50%121.3185.9179.3153.325.324.823.823.311,938.2
75%152221211.6193.825.825.424.724.213,105.2
max243.9447.7394.1395.727.426.426.626.114,679
Table 2. Dataset description (maize).
rain_1m rain_2mrain_3mrain_4mrain_5mtemp_1mtemp_2mtemp_3mtemp_4mtemp_5mProduct
count19211921192119211921192119211921192119211921
mean129.9186.0188.1149.374.224.924.523.823.724.81548.1
std51.066.257.568.743.00.91.00.90.90.6301.6
min28.232.751.46.2122.622.722.121.823.4749.2
25%90.4140.3150.3105.140.524.423.623.12324.51334.1
50%126.4184.6181.9145.467.925.324.523.723.624.81564.4
75%159.6226.4220.3185.8104.525.525.224.424.425.11758.3
max315.2449.9398.6400.8213.426.126.425.926.126.22223.2
Table 3. Models’ results through cross validation test (Irish Potatoes).
FoldRandom Forest RegressorPolynomial RegressorSupport Vector Regressor
10.8680.7680.545
20.8680.8050.586
30.8850.7880.516
40.8760.7620.575
50.8790.7440.578
Average0.8750.7730.560
Standard deviation0.0060.0210.026
Table 4. Models’ results through cross validation test (maize).
FoldRandom Forest RegressorPolynomial RegressorSupport Vector Regressor
10.8420.7670.529
20.7640.6570.494
30.8210.7080.568
40.8160.7290.563
50.8390.7200.592
Average0.8170.7160.549
Standard deviation0.0280.0350.034
Table 5. Models’ performance for Irish potato yield prediction.
ModelMAERMSE
Random Forest Regressor418.699510.817
Polynomial Regressor563.587740.199
Support Vector Regressor722.779971.633
Table 6. Models’ performance for maize yield prediction.
ModelMAERMSE
Random Forest Regressor96.196129.977
Polynomial Regressor116.418152.759
Support Vector Regressor155.092212.423
Disclaimer/Publisher’s Note: The statements, opinions and data contained in all publications are solely those of the individual author(s) and contributor(s) and not of MDPI and/or the editor(s). MDPI and/or the editor(s) disclaim responsibility for any injury to people or property resulting from any ideas, methods, instructions or products referred to in the content.

