
Long-Term Trends of Global Wine Market

1
Independent Researcher, Variability, Ashalim 85512, Israel
2
Chemical Engineering Department, Ariel University, Ariel 40700, Israel
3
Eastern Regional R&D Center, Ariel 40700, Israel
*
Authors to whom correspondence should be addressed.
Agriculture 2023, 13(1), 224; https://doi.org/10.3390/agriculture13010224
Submission received: 14 December 2022
/
Revised: 6 January 2023
/
Accepted: 10 January 2023
/
Published: 16 January 2023
(This article belongs to the Section Crop Production)
Abstract
:The major factors of wine trade have been showing distinct patterns of temporal trends worldwide in past decades. Wine consumption, production, imports, and exports differ according to their location and classification to Old World and New World wine markets. Using datasets from various sources, this work focused on quantifying long-term trends (1995–2021) of these wine industry factors for each country, including long-term means and temporal trends, using the Mann-Kendall trend test, and resulting in Z-scores. The temporal relationships between these global factors were quantified by applying Pearson correlation to the original values, as well as by correlating the Z-scores. Our findings show that Old World wine consumers and producers (e.g., Spain, France, and Italy) have been experiencing gradual decreasing trends of wine consumption and production. In New World countries, some of the largest wine-consuming countries were found to have strong, significant increases in wine consumption and new wine production markets show rapid growth trends. About 80% of the countries demonstrated increasing trends of wine imports, signifying the impact of globalization on the wine market and the growing demand for foreign wine. Globally, consumption per capita was found to have significantly decreased. Wine production showed a strong, significant, and lagged dependence on wine consumption, which was also related to the temporal trends of wine imports and exports. The major forces driving the wine market are possibly economic growth and wider competition, with climate change acting as a disruptive force.
1. Introduction
The geography of the wine industry has been the subject of ongoing revolution. Wine consumption in Asian, Northern European, and North American countries (i.e., New World) has been experiencing an ongoing growth since the 1990s, alongside a consistent decrease in wine demand in the Southern European countries (i.e., Old World) [1]. The wine sector is affected by multiple drivers, such as the regional and temporal patterns of consumer demand [2], policy and regulations [3], public health and food safety [4], and economic growth [1]. The major factors of the wine trade are wine consumption, production, imports, and exports, each of which have been experiencing varying degrees of changes during recent decades [5] with respect to their location. Globalization processes were shown to affect these wine industry factors through time [6], introducing major changes in New World and Old World wine markets. Global wine trade is shifting from domestic wine consumption to growing trends of demand for imported wine [7]. These changes are characterized by the constant growth of New World wine production volumes and steadily increasing numbers of consumer markets. Meanwhile, Old World producing countries are experiencing decreasing rates of domestic wine consumption, resulting in declining production [8].
Income was found by multiple studies to be a major driver of wine consumption both at the country scale and in the consumption structure of households, mainly in New World countries [8,9,10]. Liu and Song (2021) [11], for example, found that income was a significant factor affecting wine consumption in the Chinese wine market. Hussain et al. (2007) [12] analyzed multiple factors affecting wine consumption and found a positive, significant effect of income on consumption in the United States of America (USA). In the United Kingdom (UK), the expected slower income growth as a result of Brexit is projected to have a decreasing effect on the wine market [13]. A study on drivers of wine consumption in Norway found that income was one of the factors associated with a higher probability of drinking wine [14]. Old World countries, however, do not follow these patterns. Although countries such as France and Italy have been experiencing income growth, they were shown to have strong decline in wine consumption [15]. According to Gual and Colom (1997) [16], alcohol consumption, and specifically, the demand for wine in Old World countries (Italy, France, Greece, Portugal, and Spain), has been decreasing rapidly due to various factors. These factors include lack of advertising; encroachment of new beverages, including beer (as well as sodas, juices, etc.); public health policies and awareness of the threats in alcohol consumption; alcohol policies; and increased pricing of wines (especially in Spain). None of these factors are related to levels of income. These diverging wine consumption patterns are assumed in many studies to reflect regional and global processes of convergence [10,17] and narrowing of dissimilarities in wine consumption [18] as a result of globalization and intercultural diffusion in drinking patterns [15]. This trend towards convergence is emphasized by the fact that currently, the USA (in 2021) is the largest wine consuming country in the world, while Italy, France, and Spain together account for 47% of the world wine production in 2021 [19], although experiencing consistent decreases in production [1]. Despite these convergence trends, the EU is still the top wine-consuming region in the world and accounts for 48% of the world consumption [19]. The research hypothesis is therefore that convergence patterns will be quantitatively found at the country level, with Old World countries and New World countries showing contradicting trends of wine consumption and wine production. Furthermore, it is hypothesized that wine production is responsive to other wine-market factors (i.e., consumption, imports, and exports).
Viticulture is facing the growing implications of climate change, as multiple regions are subjected to increasing temperatures, altered precipitation patterns, prolonged drought periods, and higher variabilities in meteorological attributes [20,21,22]. Since vine phenology is driven by temperatures, phenological stages and maturation are advancing in the presence of a warmer climate [23,24]. Temperature increases affect yield components, berry composition, wine quality, and pest activities [25], having major implications for wine production. Climate change affects wine-producing regions non-uniformly. Vineyards in regions characterized by a warm climate, high evapo-transpiration levels, and low water availability are becoming more dependent on irrigation [26]. Contrarily, more temperate regions may benefit from temperature rise as wine quality is expected to improve [23]. These shifts are uncertain and unstable, and strongly affect the wine market [27].
Efforts to quantify the temporal trends of wine industry factors at the global scale have been very few [28]. The vast majority of the quantitative scientific papers on temporal dynamics of wine consumption, consumption per capita, production, imports, and exports have been limited to specific regions or countries [29,30,31] and did not quantify statistical relationships among these factors. Furthermore, providing a method to quantify the current state of trends in the wine market at the country level can serve as a decision-making tool for a wide array of professionals, including winemakers, investors, wine growers, retailers, and scientists. In this current work, the innovation stems from suggesting a framework overviewing the trends of the five wine industry factors for each country and enable a full global comparison and insights. This work aims to determine the trends of these factors for each country in the world for the first time, allowing to test the hypothesis of convergence patterns of wine consumption and wine production. The main objective was therefore to determine the mean values, long-term trends, and relationships between the wine industry factors for each country around the world and globally. The specific objectives were twofold: (1) to rank the countries according to the different wine industry factors and analyze the temporal trends for each country; and (2) to explore the temporal relationships between the global wine industry factors.
2. Methodology
The dataset used in this study was acquired mainly from the International Organisation of Vine and Wine (OIV) database, available online (https://www.oiv.int/what-we-do/statistics (accessed on 23 October 2022)). It was utilized to perform long-term trend analysis and determine correlations among the wine industry factors.
2.1. Data Collection
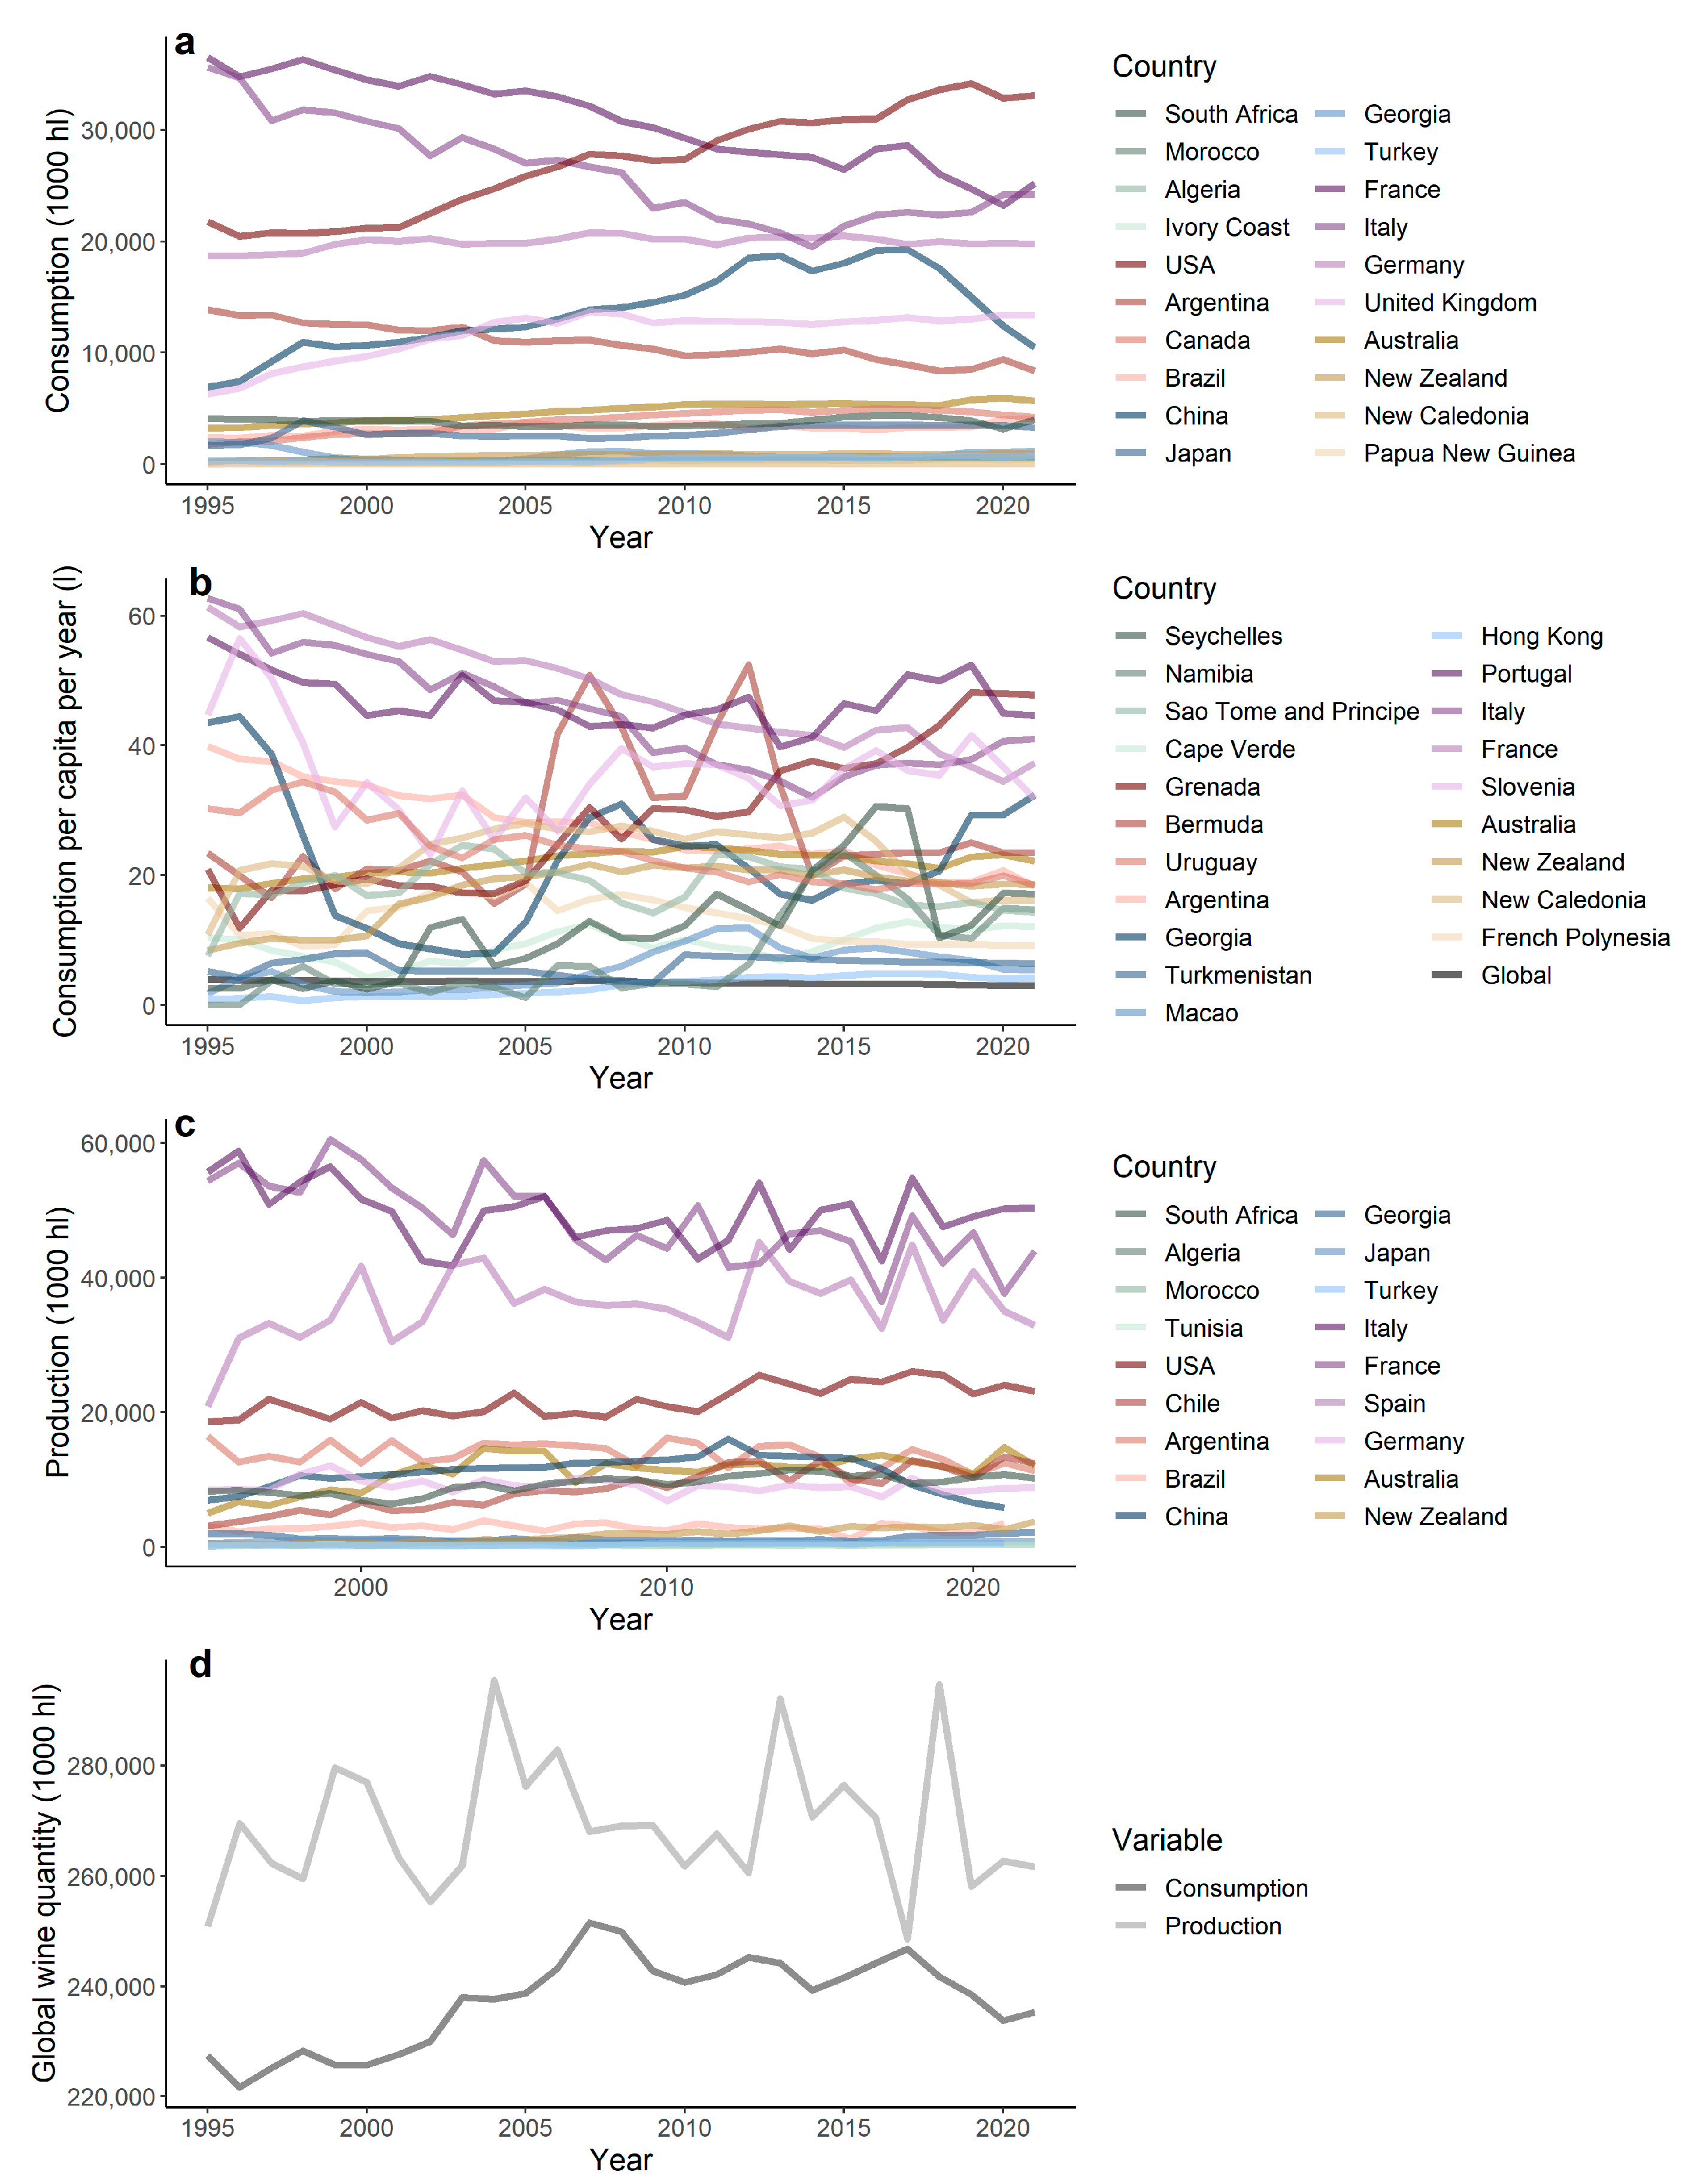
This current study utilized datasets from a few sources to enable the analysis of wine market trends. Data regarding wine consumption, production, imports, and exports (all provided in 1000 hl) for each country were derived from the OIV database, available online from 1995 to 2021. To calculate wine consumption per capita, a dataset consisting of annual population records for each country was downloaded from the World Bank Group (WBG) website (https://databank.worldbank.org/home.aspx (accessed on 23 October 2022)). The wine consumption time series for each country was then divided by the corresponding set of population values to receive wine consumption per capita. Surface area planted with vines for all purposes (i.e., wine and juices, table grapes, and dried grapes) was also used [19]. The resulting statistics for each country were illustrated using a world map, available through the “ggplot2” package in R [32]. Some of the wine market factors are illustrated in Figure 1, featuring the temporal dynamics for consumption, consumption per capita, and production (Figure 1, panels a, b, and c, respectively) of the top four countries in 2021 in each continent, as well as global consumption and production trendlines (Figure 1d). Preprocessing of the data was conducted using the “dplyr” package in R [33].
There were some gaps in the data, resulting from a simultaneous lack of records from the OIV dataset and absence of population records in the World Bank dataset. Furthermore, the recorded vineyard surface areas included also table grapes [19], thus preventing a precise analysis of the surface area allocated for wine production.
2.2. Country Ranking and Temporal Trend Analysis of Wine Market Factors
For each of the five wine market factors (e.g., consumption, consumption per capita, production, imports, and exports) recorded for each country, the multi-annual means were computed in order to illustrate the rank of the wine industry factors by country. The temporal data for each country were used to perform a trend analysis. The long-term trend of each wine market factor was conducted using a two-sided Mann–Kendall (MK) trend test. The MK trend test is a non-parametric test, ranking the magnitude and direction of the temporal trend of a predefined variable [34]. The significance of the trends is provided in the standardized test statistic Z, enabling the identification of the direction of the trend (negative, none, or positive), its significance (p-values corresponding to critical values of the Z statistic), and magnitude (Z scores farther from zero denote stronger magnitudes of trend). The MK test has been widely used for assessing trends in environmental studies [35,36], hydrological processes [37], meteorological factors [38,39], and food systems [40]. The MK was applied using the “trend” package in R [41].
2.3. Relationships among Wine Industry Factors
To analyze the linear association among several wine industry factors at the country scale, Pearson’s correlation was conducted for paired factors, including production against consumption, production against consumption per capita, consumption against imports, and production against exports. This analysis was illustrated once more in a world map, with a correlation coefficient (r) for each country denoting the direction of relationship and degree of similarity among the time series dynamics [42].
Furthermore, the country means and resulting Z-scores from the MK test for all countries were used for analyzing the relationships among the wine industry factors. A correlation matrix was derived for country means and a second matrix was computed for the Z-scores. In this manner, the relationships between wine industry factors could be interpreted both for the original values of the factors (multi-annual means), and for their trends (i.e., Z-score values) at the global scale.
An additional analysis was conducted to determine the lagged response of some wine industry factors to other market-affecting factors using only the global time series. In other words, this analysis attempted to quantify the time it takes (years) for the dynamics of certain factors to affect the temporal course of other factors. To explore these relationships the Granger causality test was applied [43]. The Granger causality test is a non-parametric test for characterizing dependence relations in bivariate time series, one which determines whether past and current values of a certain variable contain additional information on future dynamics of a response variable, controlling for the temporal autocorrelation of the response variable [44]. The Granger causality test follows the formula:
where is the dependent variable during time , is the predictor variable, and is the error term. The coefficients (, and ) account for the importance of each variable in predicting . If is found to be significantly different than 0, it suggests that has Granger causality over . The lag may be adjusted according to the desired lag-effect. Specifically, the analysis focused on the lagged effects that wine consumption, consumption per capita, exports and imports have on wine production; the lagged effects of wine consumption on imports and surface area; and the lagged response of surface area on consumption per capita. This analysis was conducted using the “lmtest” package in R [45].
3. Results
3.1. Temporal Analysis of Wine Industry Factors
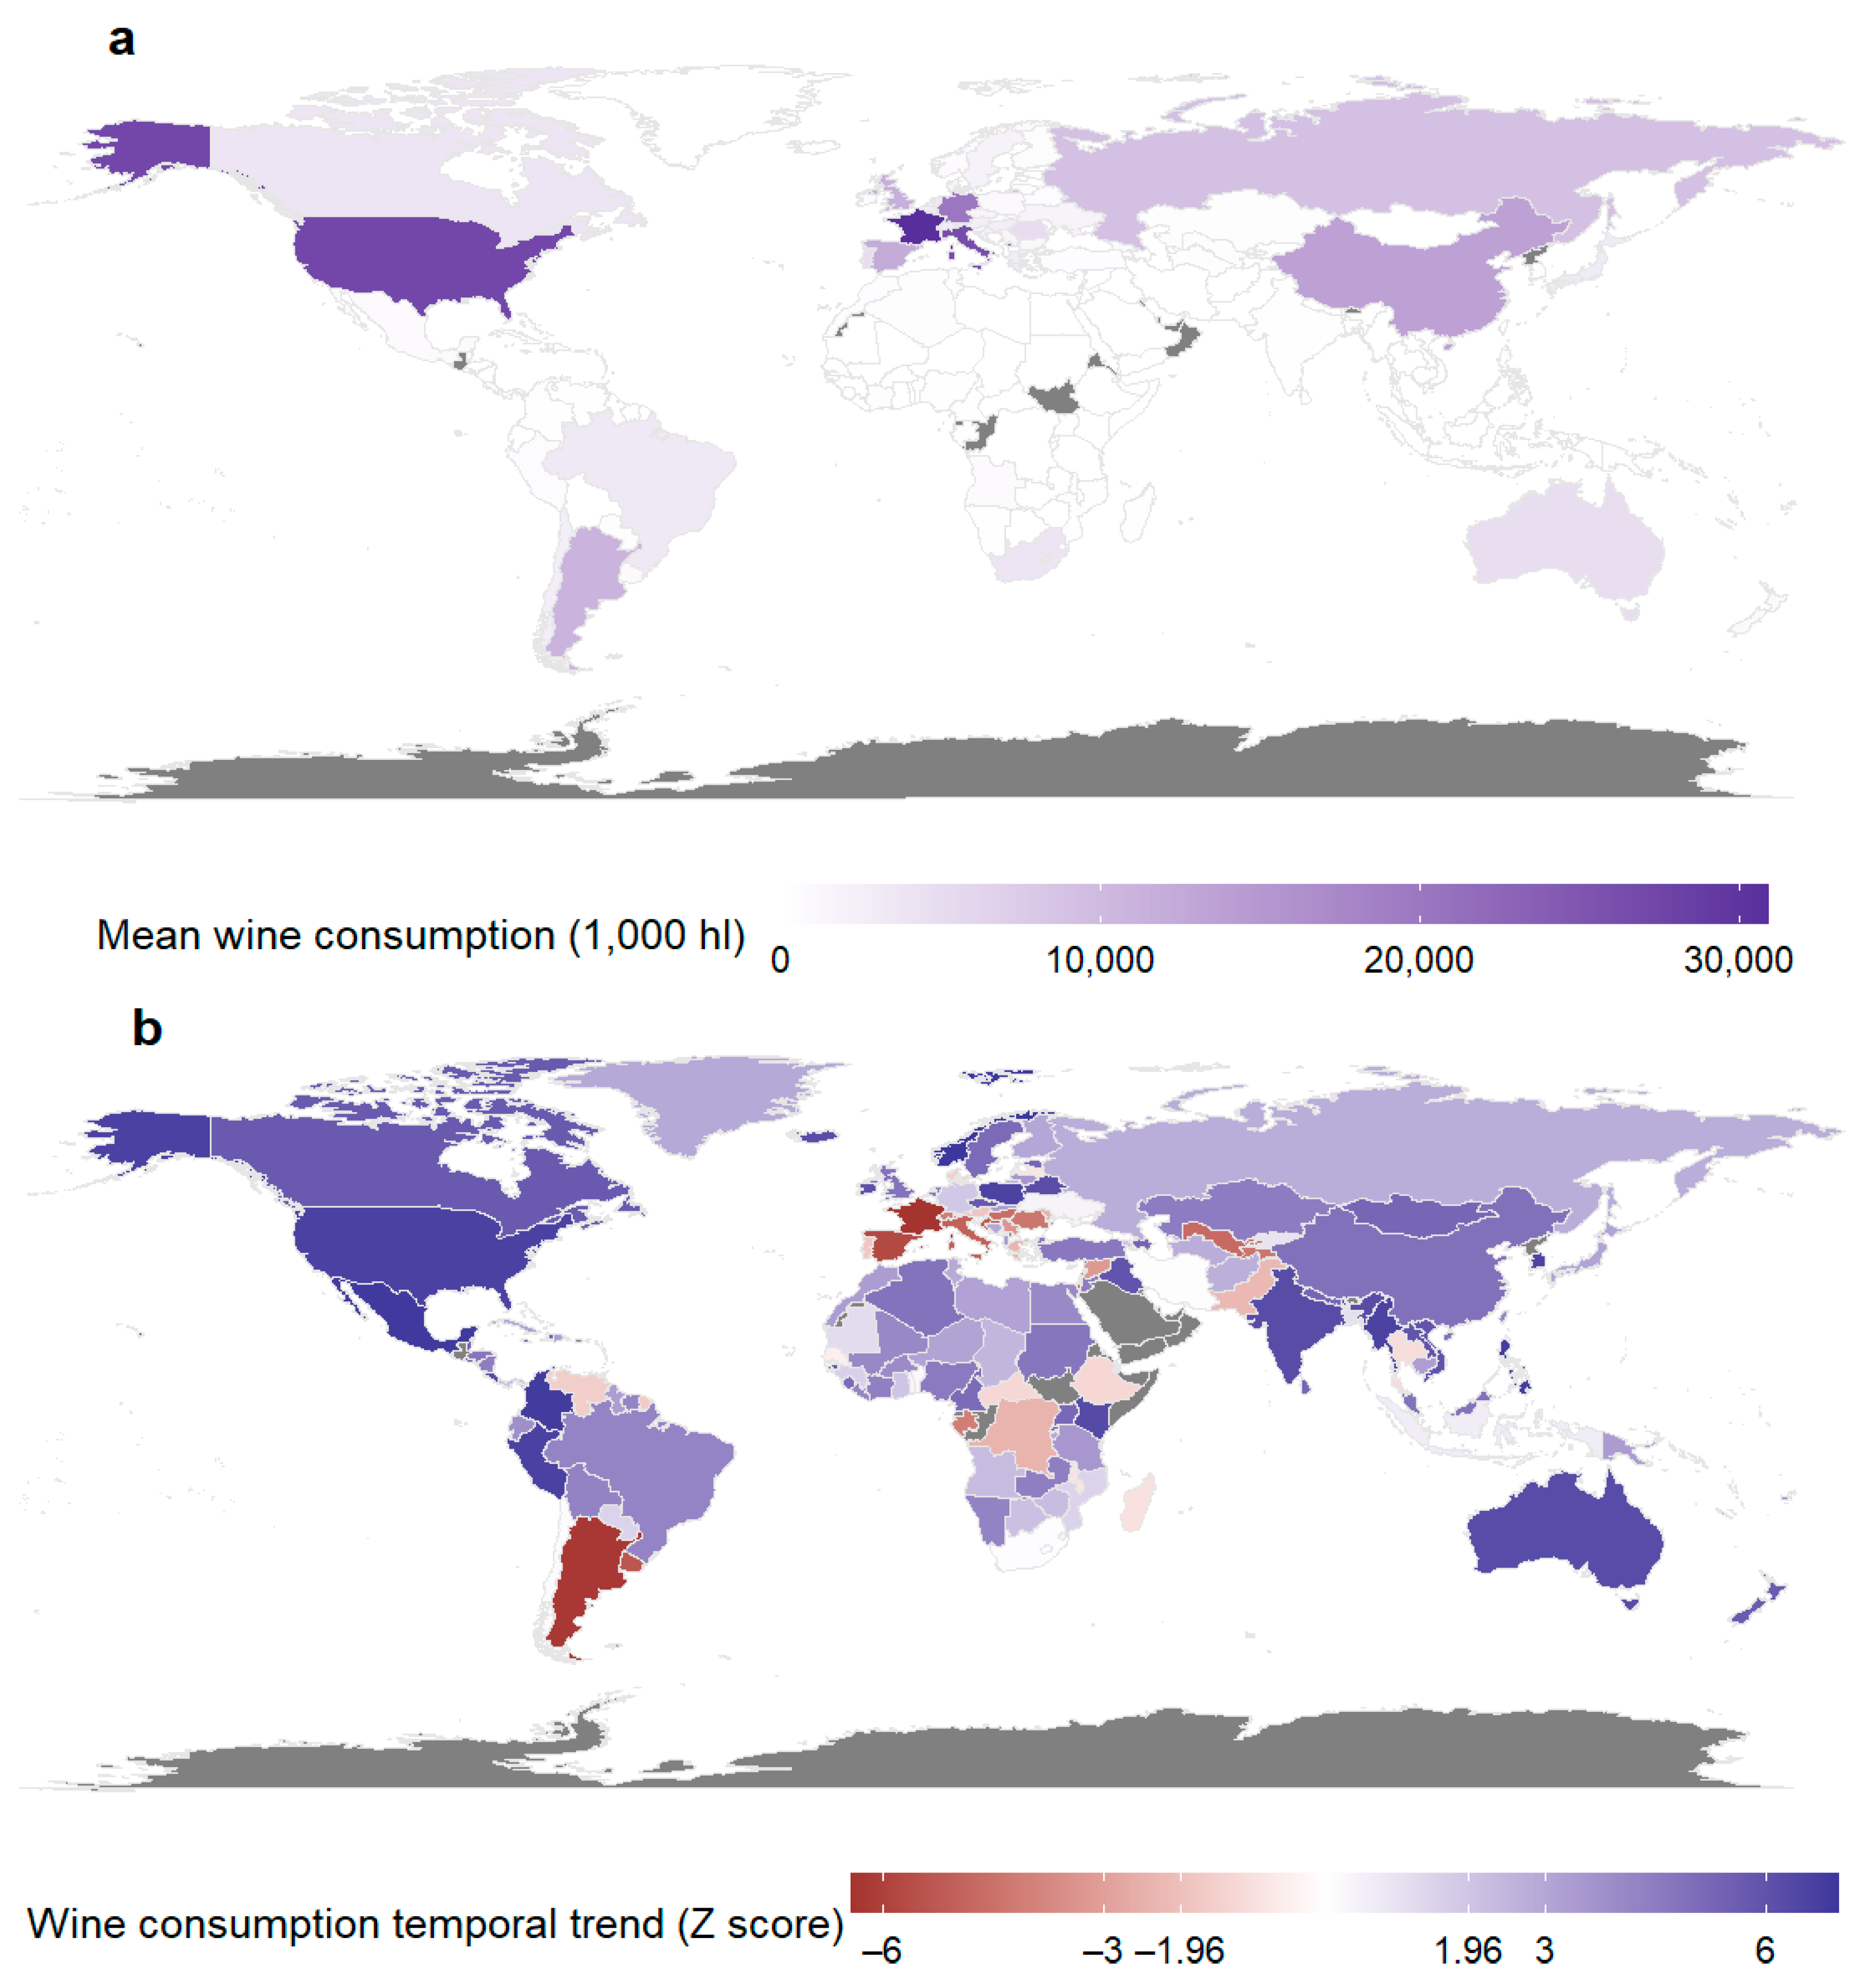
The multi-annual mean values and Z-scores following the MK trend test for each country are illustrated using world maps in Figure 2, Figure 3, Figure 4, Figure 5 and Figure 6. Each of these figures displays the means and trends for a different wine industry factor. Figure 2 shows the means and trends of multi-annual wine consumption, with clear representation of the highest consumers, which include France, with over 30,823 × 103 hl on average, USA, with 27,027 × 103 hl, followed by Italy, Germany, China, Spain, UK, Argentina, Russia, Romania, Portugal, Australia, Canada, and South Africa (full list and mean values are available in Appendix A, Table A1). The leading European countries demonstrate ongoing significant decreasing trends of wine consumption, with France, Spain, and Italy receiving Z-Scores lower than −5, Argentina and Uruguay with Z = −6.25 and Z = −5.31, respectively, and Croatia with Z = −5.25. The highest increases in wine consumption were found in Norway, Mexico, Colombia, The Philippines, Maldives, Peru, and the USA, each with Z > 6.5 (the full list of Z-scores is available in Appendix A, Table A2). Of the largest consumers on average, Australia, Russia, UK, China, and Canada were found to have significant increases in wine consumption over 27 years. The global mean of multi-annual wine consumption between 1995 and 2021 was over 237,315 × 103 hl, ranging between 227,425 × 103 hl in 1995 and 235,318 × 103 hl in 2021, and peaking during 2007 with 251,518 × 103 hl (Figure 1d). The global trend was found to be positive and significant (Z = 3).
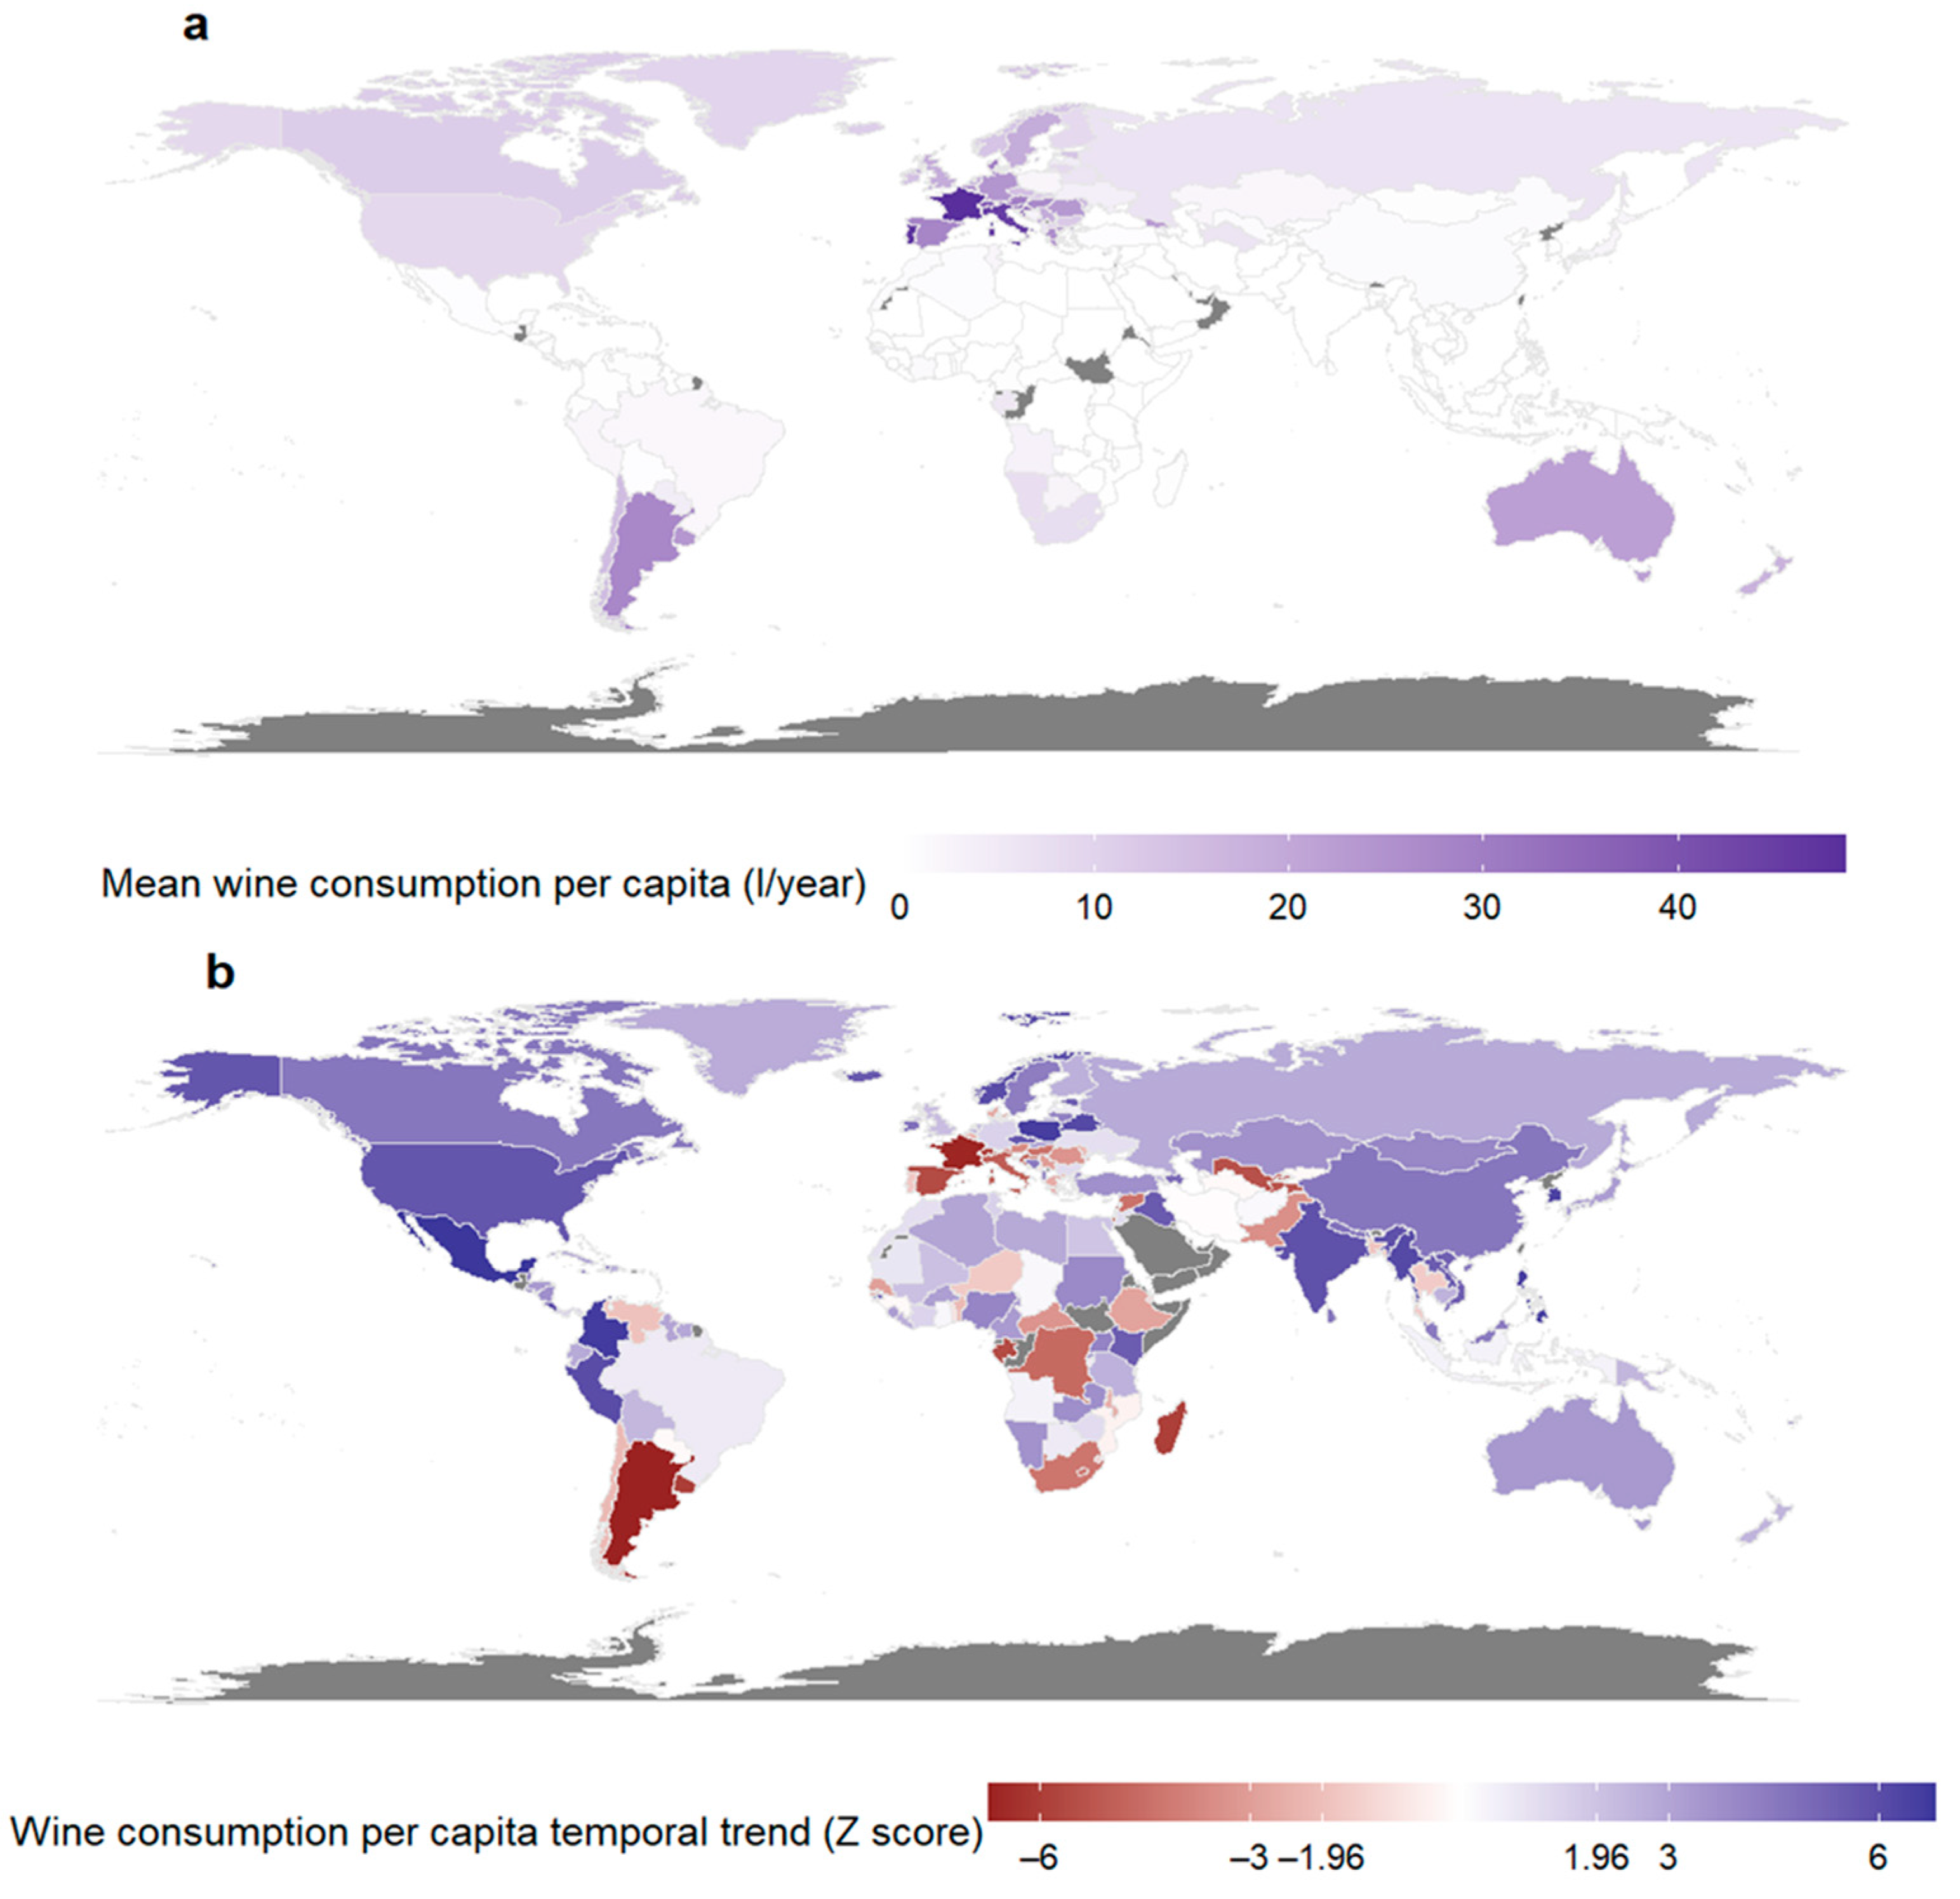
The results for wine consumption per capita position France, Portugal, Italy, Switzerland, Slovenia, Croatia, Denmark, and Austria as top wine consumers per unit of population, with 48.53, 46.98, 44.95, 36.94, 35.69, 34.39, 29.51 and 29.46 liters per year, respectively (Figure 3a) (the full list is available in Appendix A, Table A1). For countries with a wine consumption per capita that is higher than the global average (i.e., 3.53 liters year 1), the long-term trend (Figure 3b) shows strong, significant decrease in consumption per capita. Examples for notable countries are Argentina, France, Uruguay, Switzerland, Spain, and Italy, with Z-scores of −6.71, −6.13, −5.96, −5.84, −5.59, and −5.0, respectively. Strong positive trends were found for Mexico, Colombia, Poland, the Philippines, South Korea, Belarus, Peru, Norway, and Hong Kong, all with Z > 6 (the complete list of Z-scores can be found in Appendix A, Table A2). The global wine consumption per capita was 3.53 liters per year (ranging between 3.99 liters per year in 1995 and 3.00 liters per year in 2021), resulting in a strong, significant decrease (Z = −6.13), with a sharper decreasing trendline after 2007.
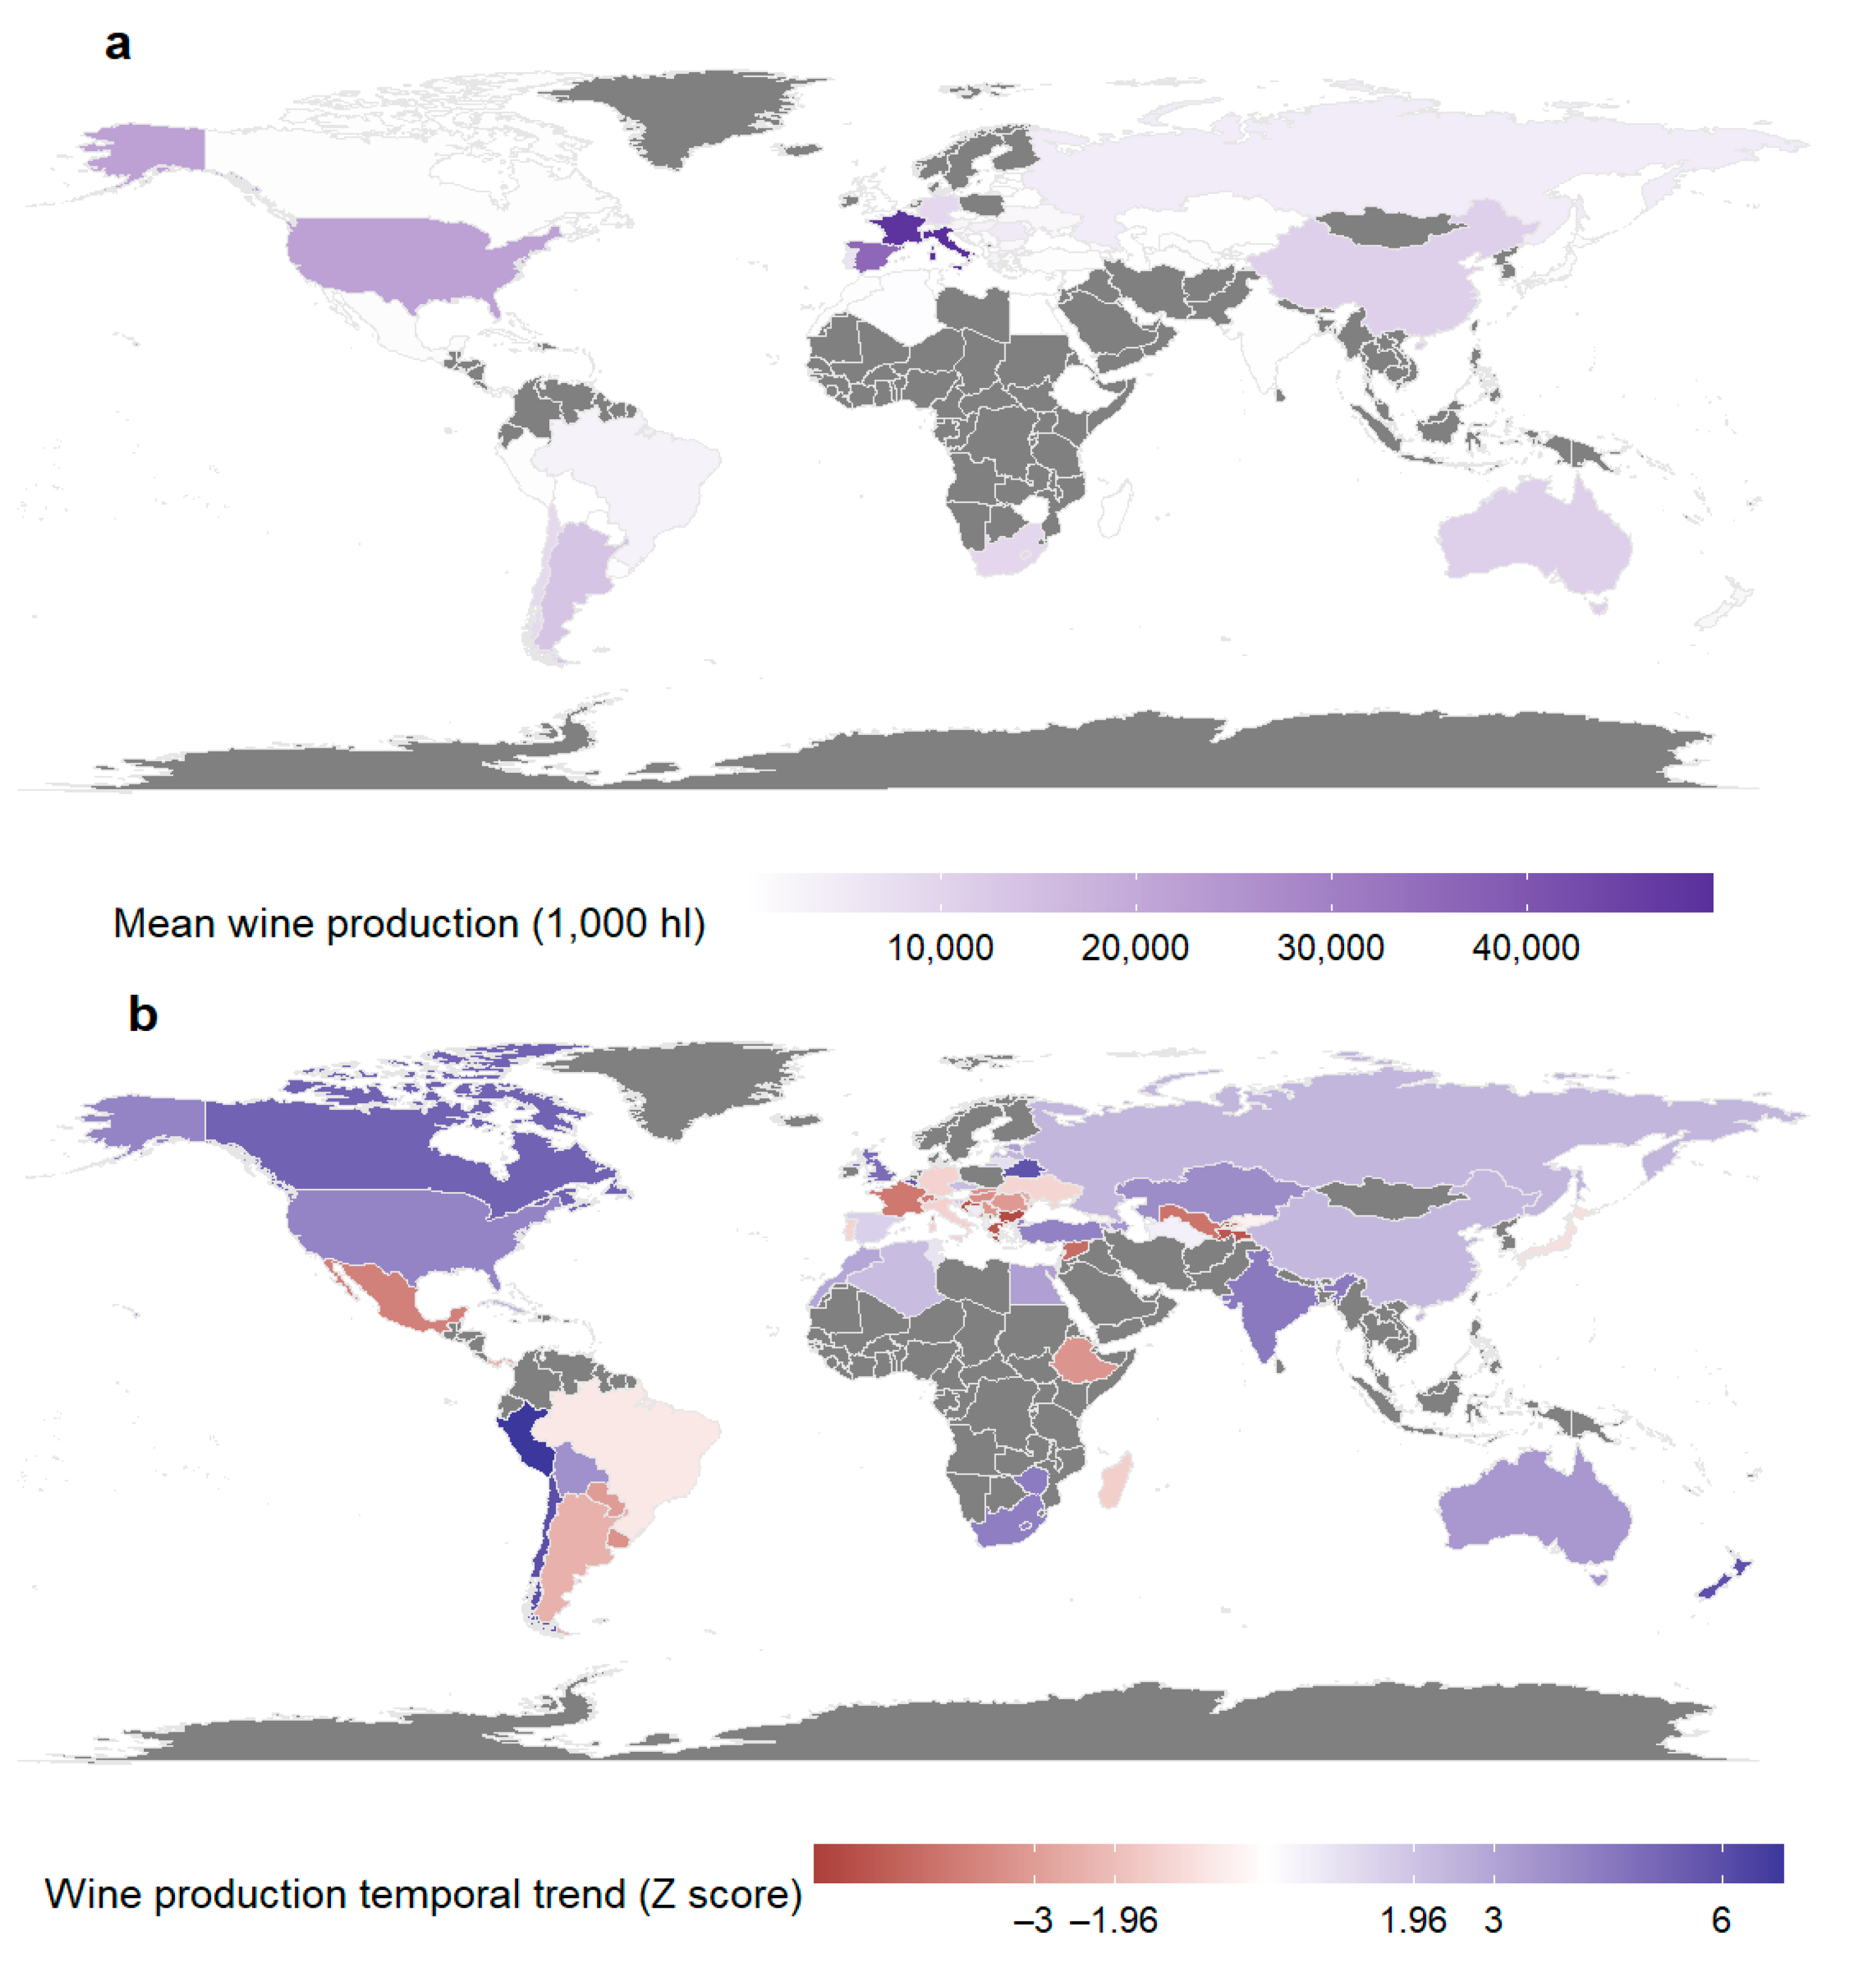
Multi-annual means of wine production worldwide are illustrated in Figure 4a, with the primary producing countries being Italy, France, Spain, USA, Argentina, Australia, China, South Africa, Germany, Chile, and Portugal, with values in 103 hl of 49,468, 48,421, 35,906, 21,805, 13,709, 11,180, 11,084, 9369, 9123, 8715 and 6698, respectively. The five leading countries in wine production account for 62.91% of the global wine market. Most African countries, excluding South Africa, do not have records of wine production during the studied period. The sharpest increasing trends of winemaking were found for Peru, Chile, New Zealand, Belarus, Belgium, Canada, and UK, with Z-scores of 6.76, 5.95, 5.87, 5.78, 5.65, 5.24 and 4.9, respectively. Decreasing trends of wine production were found for Cyprus, Bulgaria, Croatia, and Greece, all with Z < −5. The main producers have been experiencing various degrees of trends. Italy, Spain, and Portugal were found to have non-significant trends; France and Argentina experienced a significant decrease in wine production; and South Africa, USA, Australia, China, and Chile showed a significant production increase (Figure 4b, Appendix A, Table A2). Globally, mean multi-annual production for 1995–2021 was 269,122 × 103 hl, ranging between 250,874 × 103 hl in 1995 and 261,737 × 103 hl in 2021, peaking at 295,441 × 103 hl in 2004 while showing very strong variability through time (Figure 1d). The trend was non-significant over the studied period.
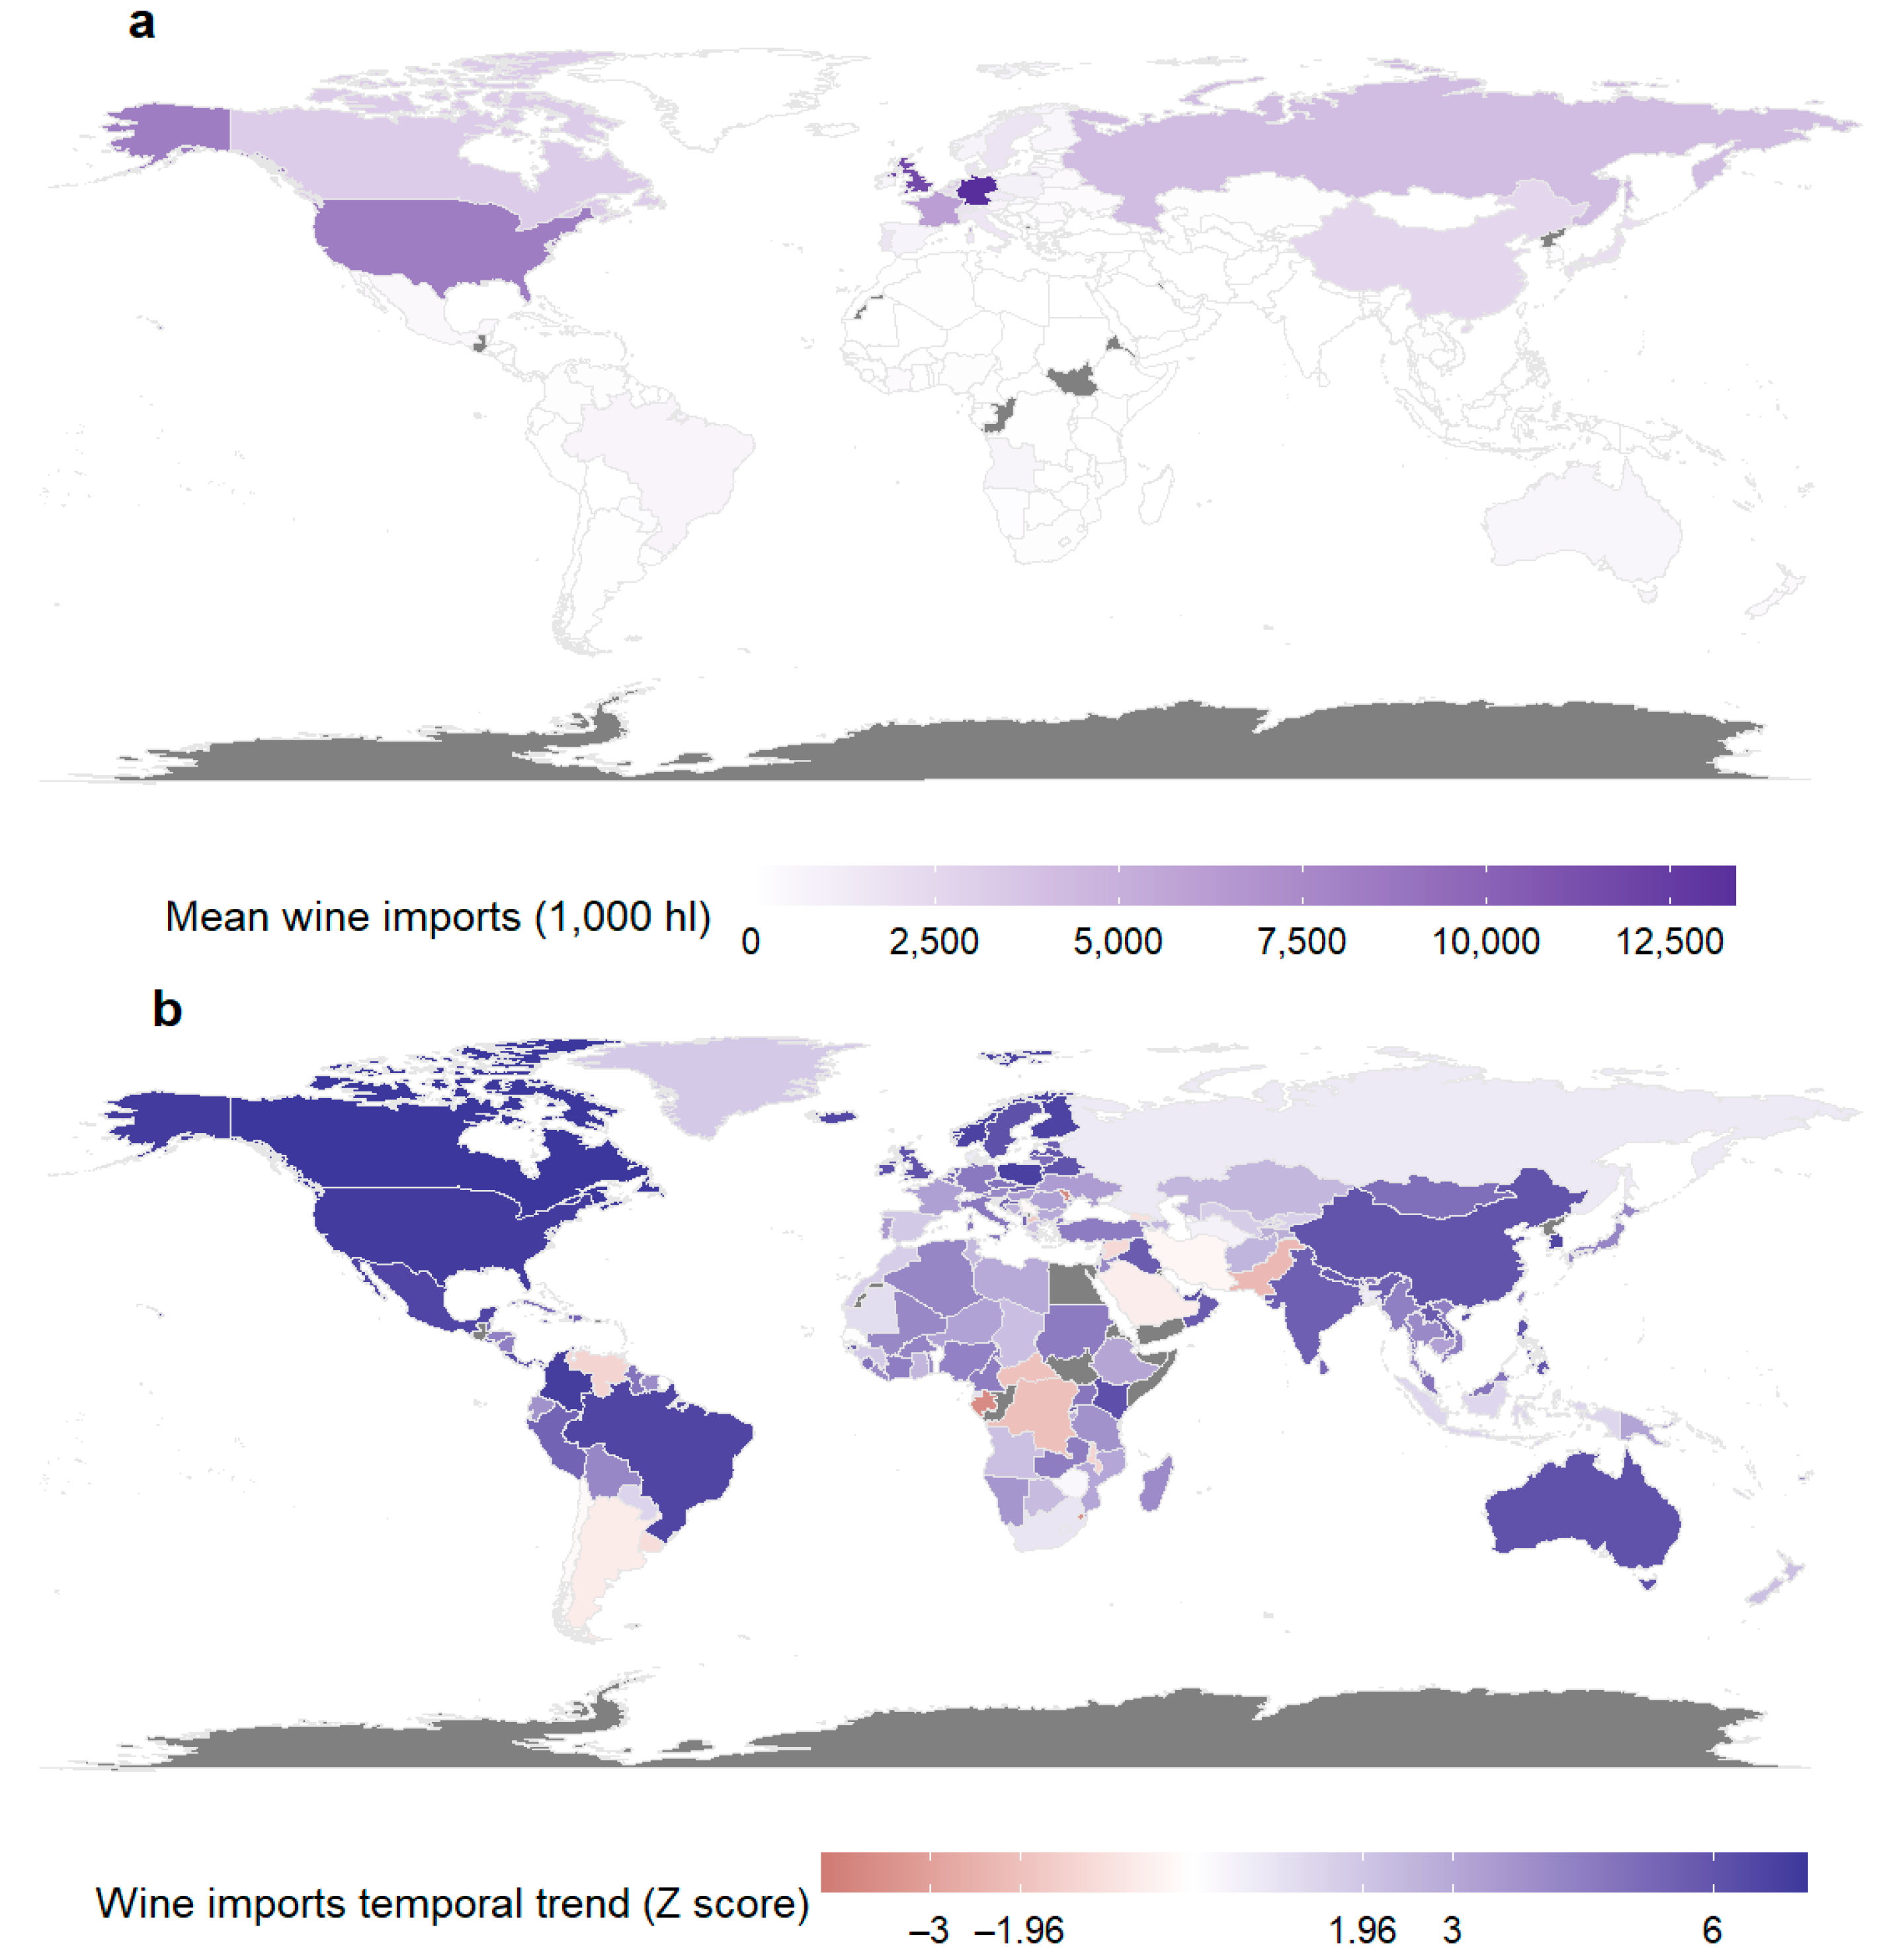
Wine imports are attributed mainly to Germany, UK, the USA, France, Russia, and the Netherlands (Figure 5a), summing up to an average of 47,162 × 103 hl a year, consisting of 56.4% of world wine imports. Most countries have shown increasing trends of wine imports during 1995–2021, with only 15 countries showing significant negative trends of imports, all of them considered low wine consumers. The strongest positive trend was attributed to Canada (Z = 7.05), followed by the USA, Colombia, Poland, and Norway (Figure 5b, Appendix A, Table A2). A global average of wine imports was found to be 83,650 × 103 hl, ranging between 51,771 × 103 hl in 1995 and 108,714 × 103 hl in 2021, peaking in 2017 with 111,010 × 103 hl. The increasing trend was therefore very strong and significant, with Z = 6.67.
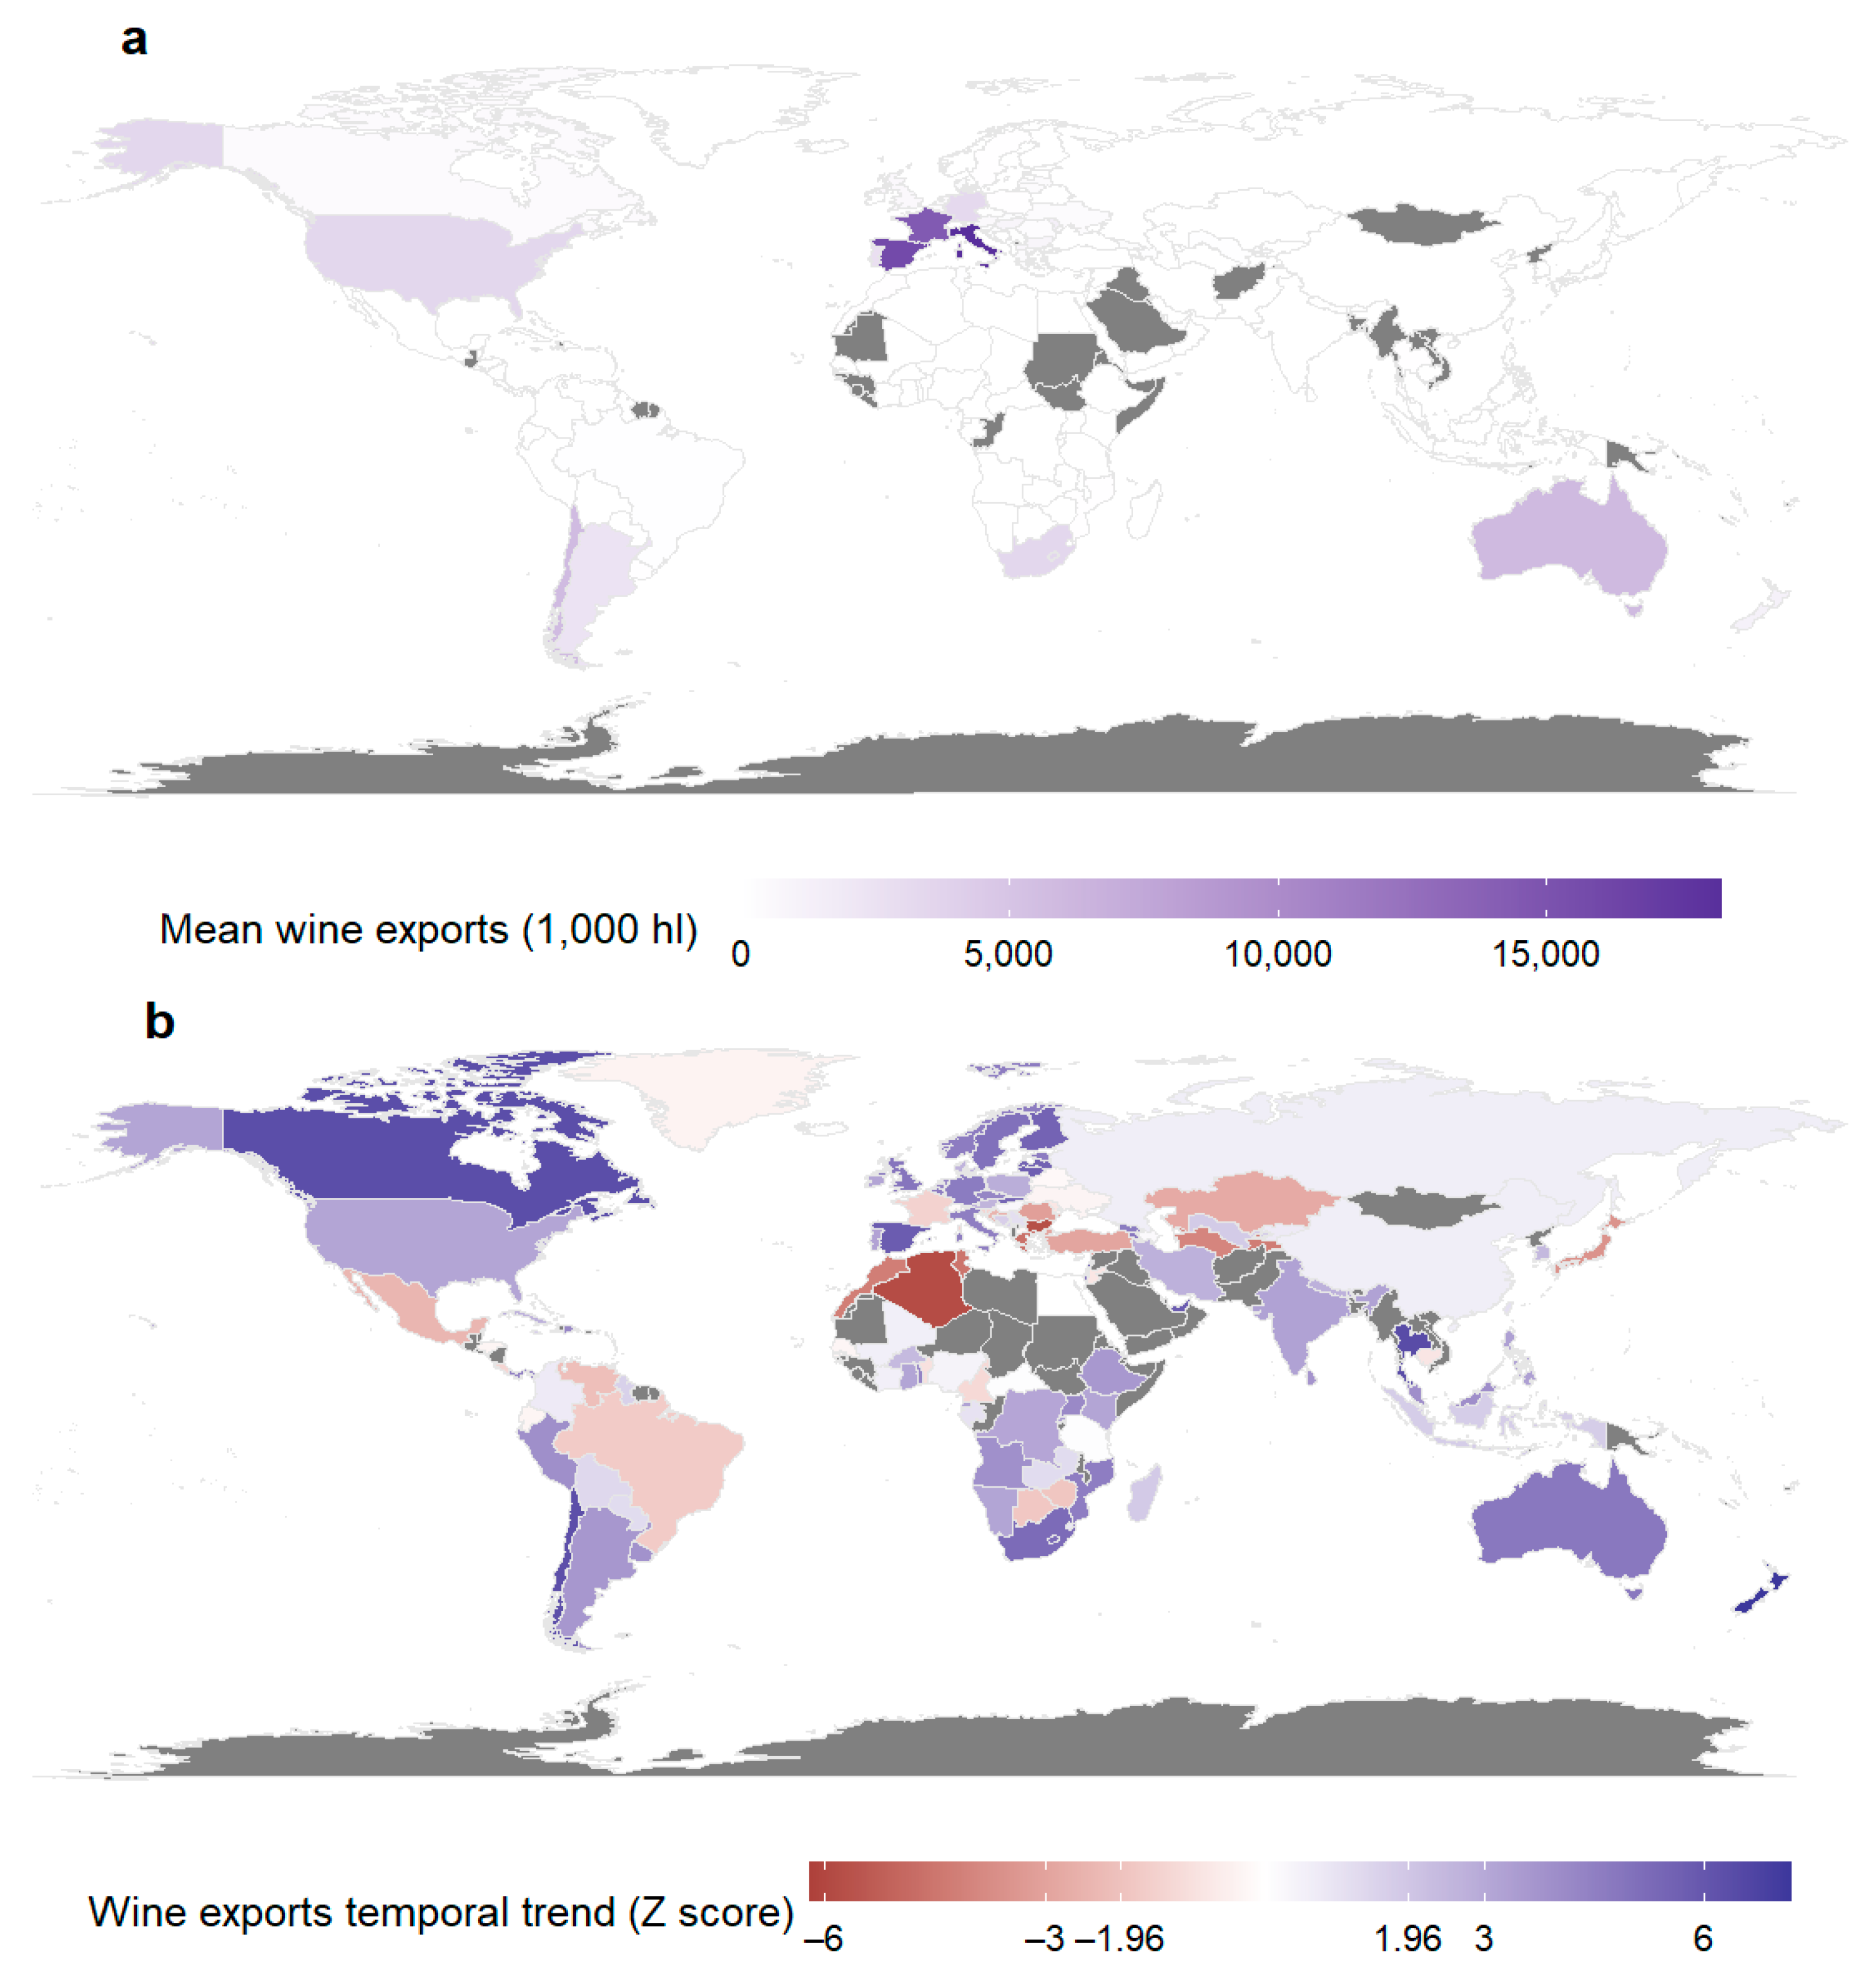
During the period between 1995 and 2021, wine exports were highest in Italy, Spain, and France (Figure 6a), with 18,225, 15,803 and 14,417 × 103 hl per year in average, respectively, consisting of 56% of global exports. The strongest decrease was attributed to Cyprus (mean of 60 × 103 hl per year). Most major exporters have experienced significant positive trends, including Australia (Z = 4.75), Chile (Z = 6.26), South Africa (Z = 5.21), USA (Z = 3.13), Germany (Z = 4.62), Portugal (Z = 3.21), Italy (Z = 4.54), and Spain (Z = 5.79), while France was found to have a non-significant, negative trend (Figure 6b). Global exports consisted of a multi-annual average of 86,585 × 103 hl per year, ranging between 55,016 × 103 hl in 1995 and 112,654 × 103 hl in 2021, similar to the global imports. The trend was therefore positive and significant, with Z = 6.55.
3.2. Relationships among Wine Market Factors
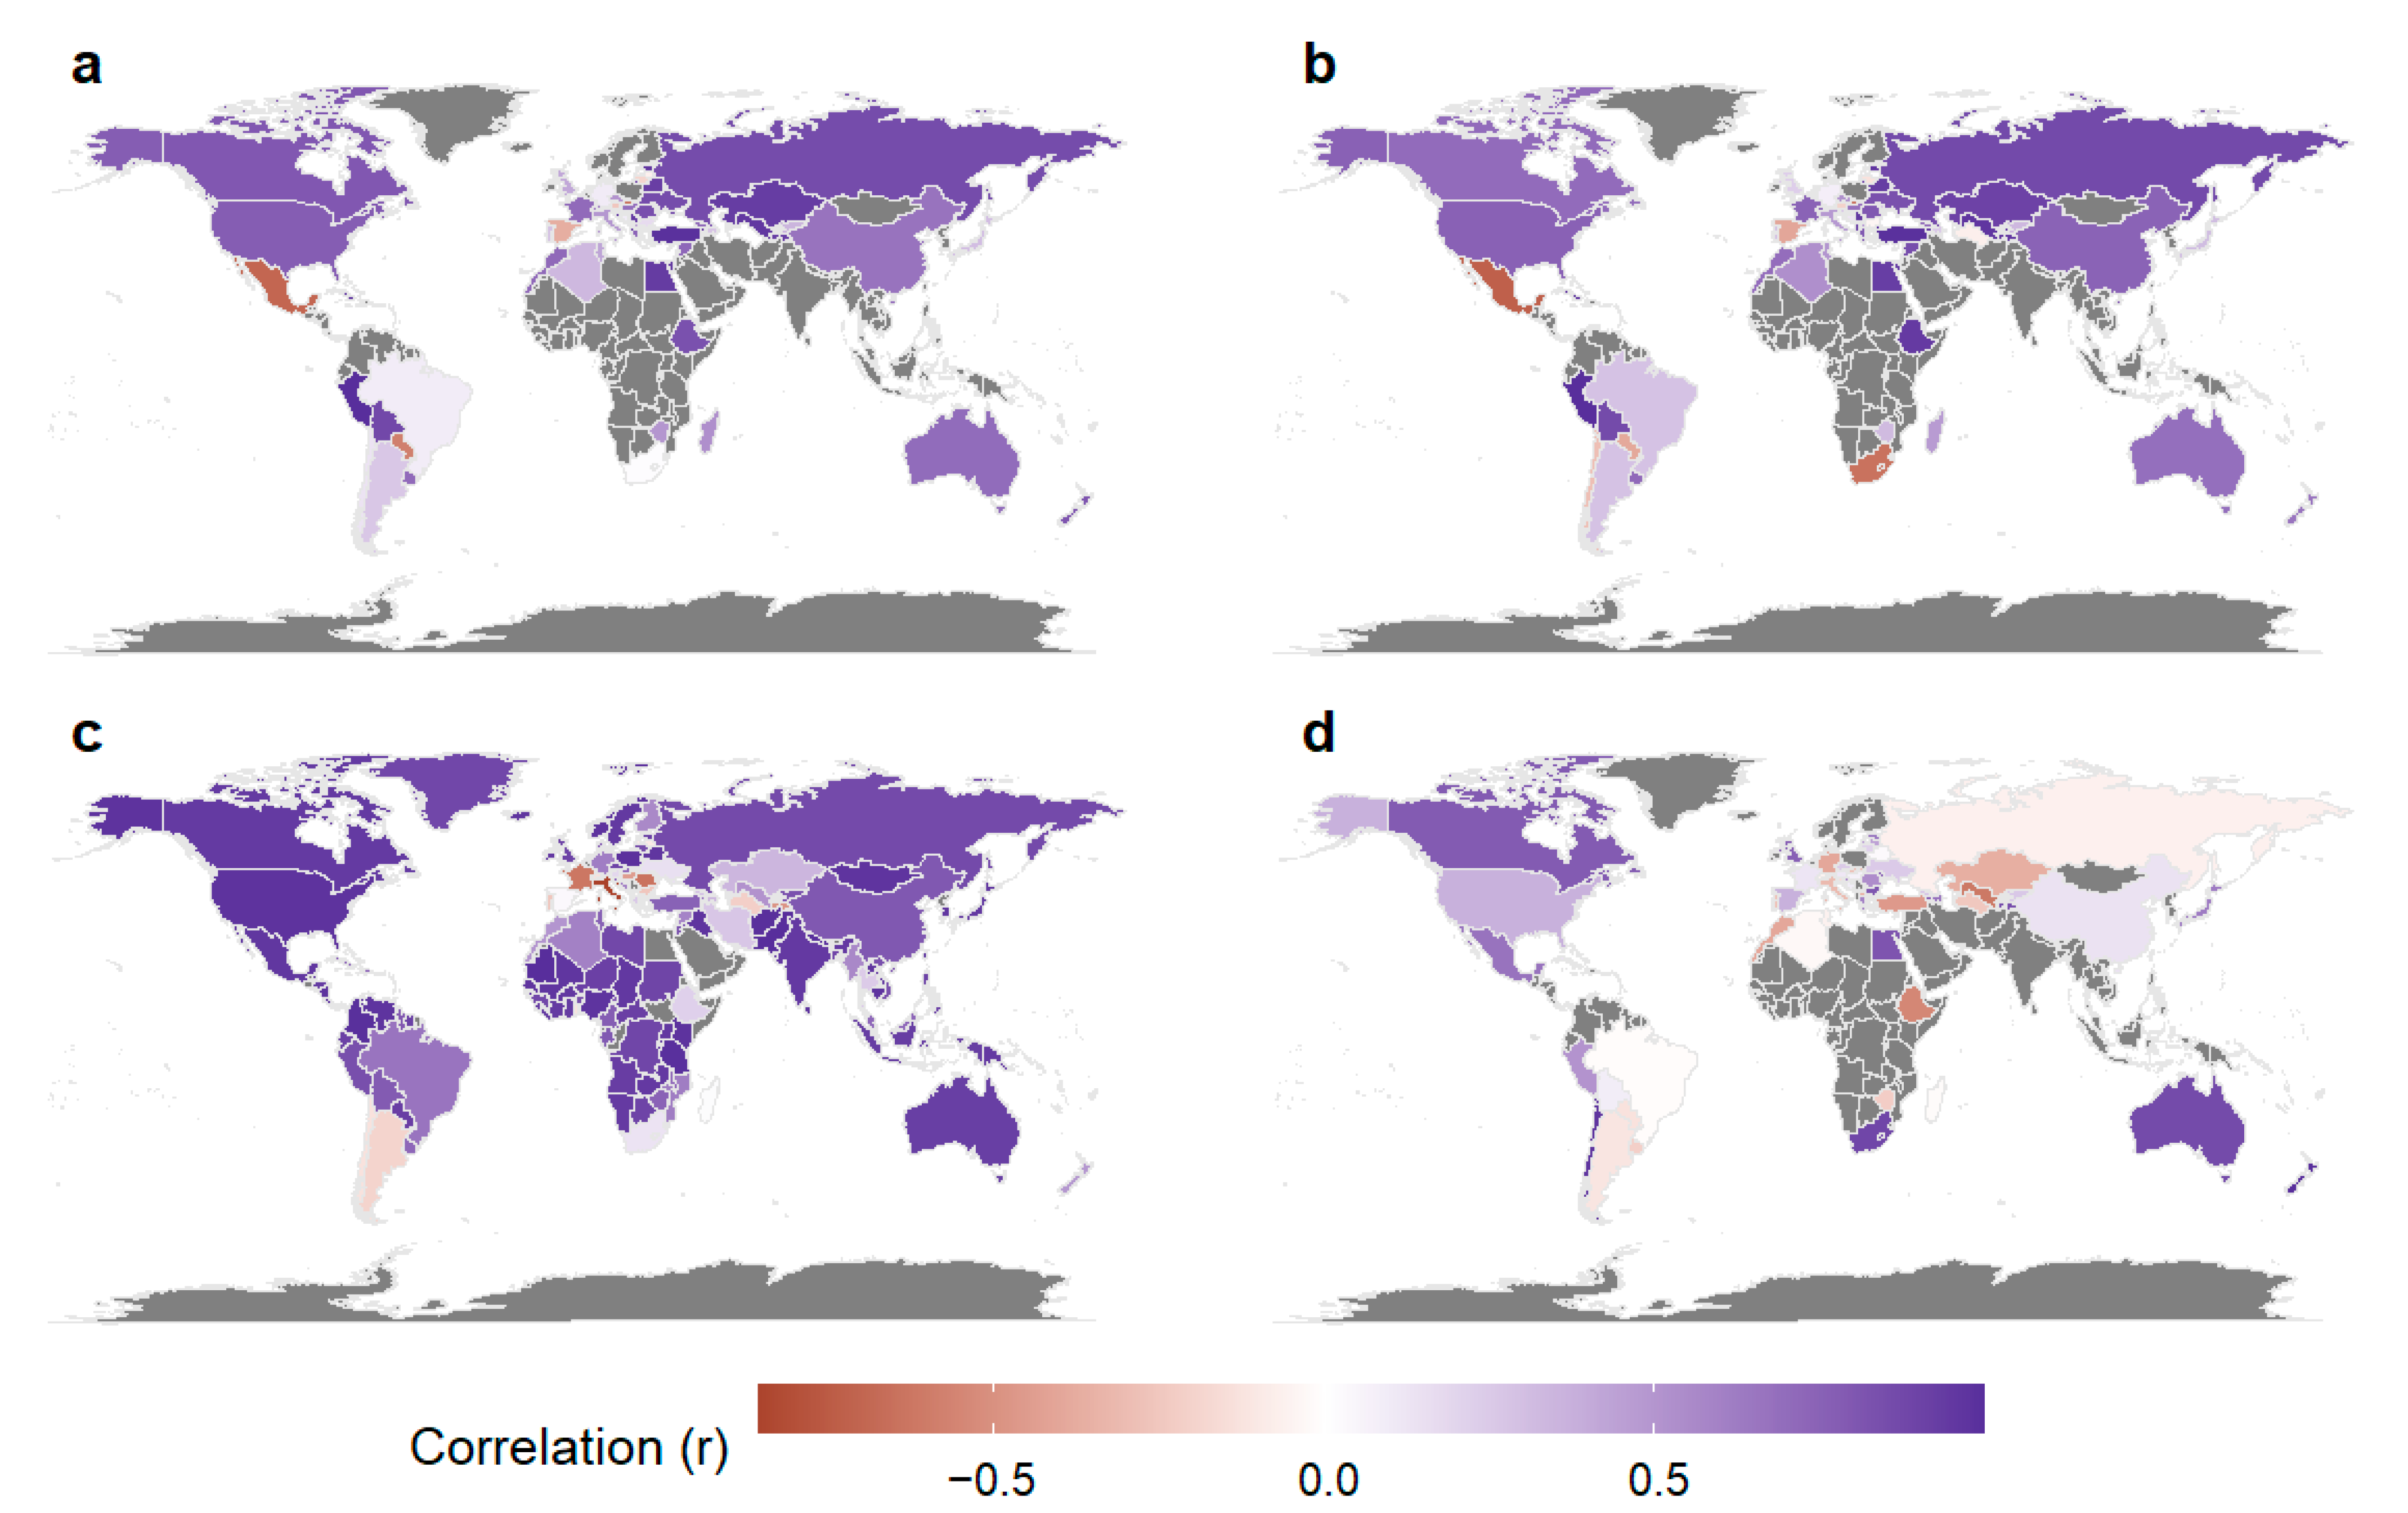
The country-level correlation analysis revealed the association among some paired wine industry factors (Figure 7). Wine production and consumption were found to have positive relationships in most countries, with Cyprus having a strong negative correlation (r = −0.86), and Mexico, Slovakia, Israel, and Paraguay having moderate negative correlations (r = −0.70, −0.65, −0.60, −0.58, respectively). Countries such as Spain, Austria, South Africa, Brazil, Germany, Chile, Argentina, Portugal, and Japan were found to have negligible coefficients, denoting no relationships (Figure 7a). Similar patterns were found for the correlations between wine production and consumption per capita, except for South Africa with a correlation of r = −0.64 (Figure 7b). Wine consumption and imports were positively related, with 80% of cases displaying a value of r > 0.3. Strong negative relationships were found for Croatia and Italy (both with r = −0.87), Romania (r = −0.65), and France (r = −0.63). Negligible associations were found between wine consumption and imports in Portugal, Argentina, Switzerland, Chile, Spain, South Africa, Ukraine, Austria, Greece, and Georgia (Figure 7c). Finally, the relationships between wine production and exports were found to have various patterns of associations (Figure 7d), with about 12% of the countries showing values of r < −0.3, about 35% with r > 0.3, and 49% with low (or none) associations. The strongest positive relationships were found for New Zealand, Chile, South Africa, and Australia (r > 0.8), while the strongest negative relationships between wine production and exports were found for Lebanon (r < −0.8).
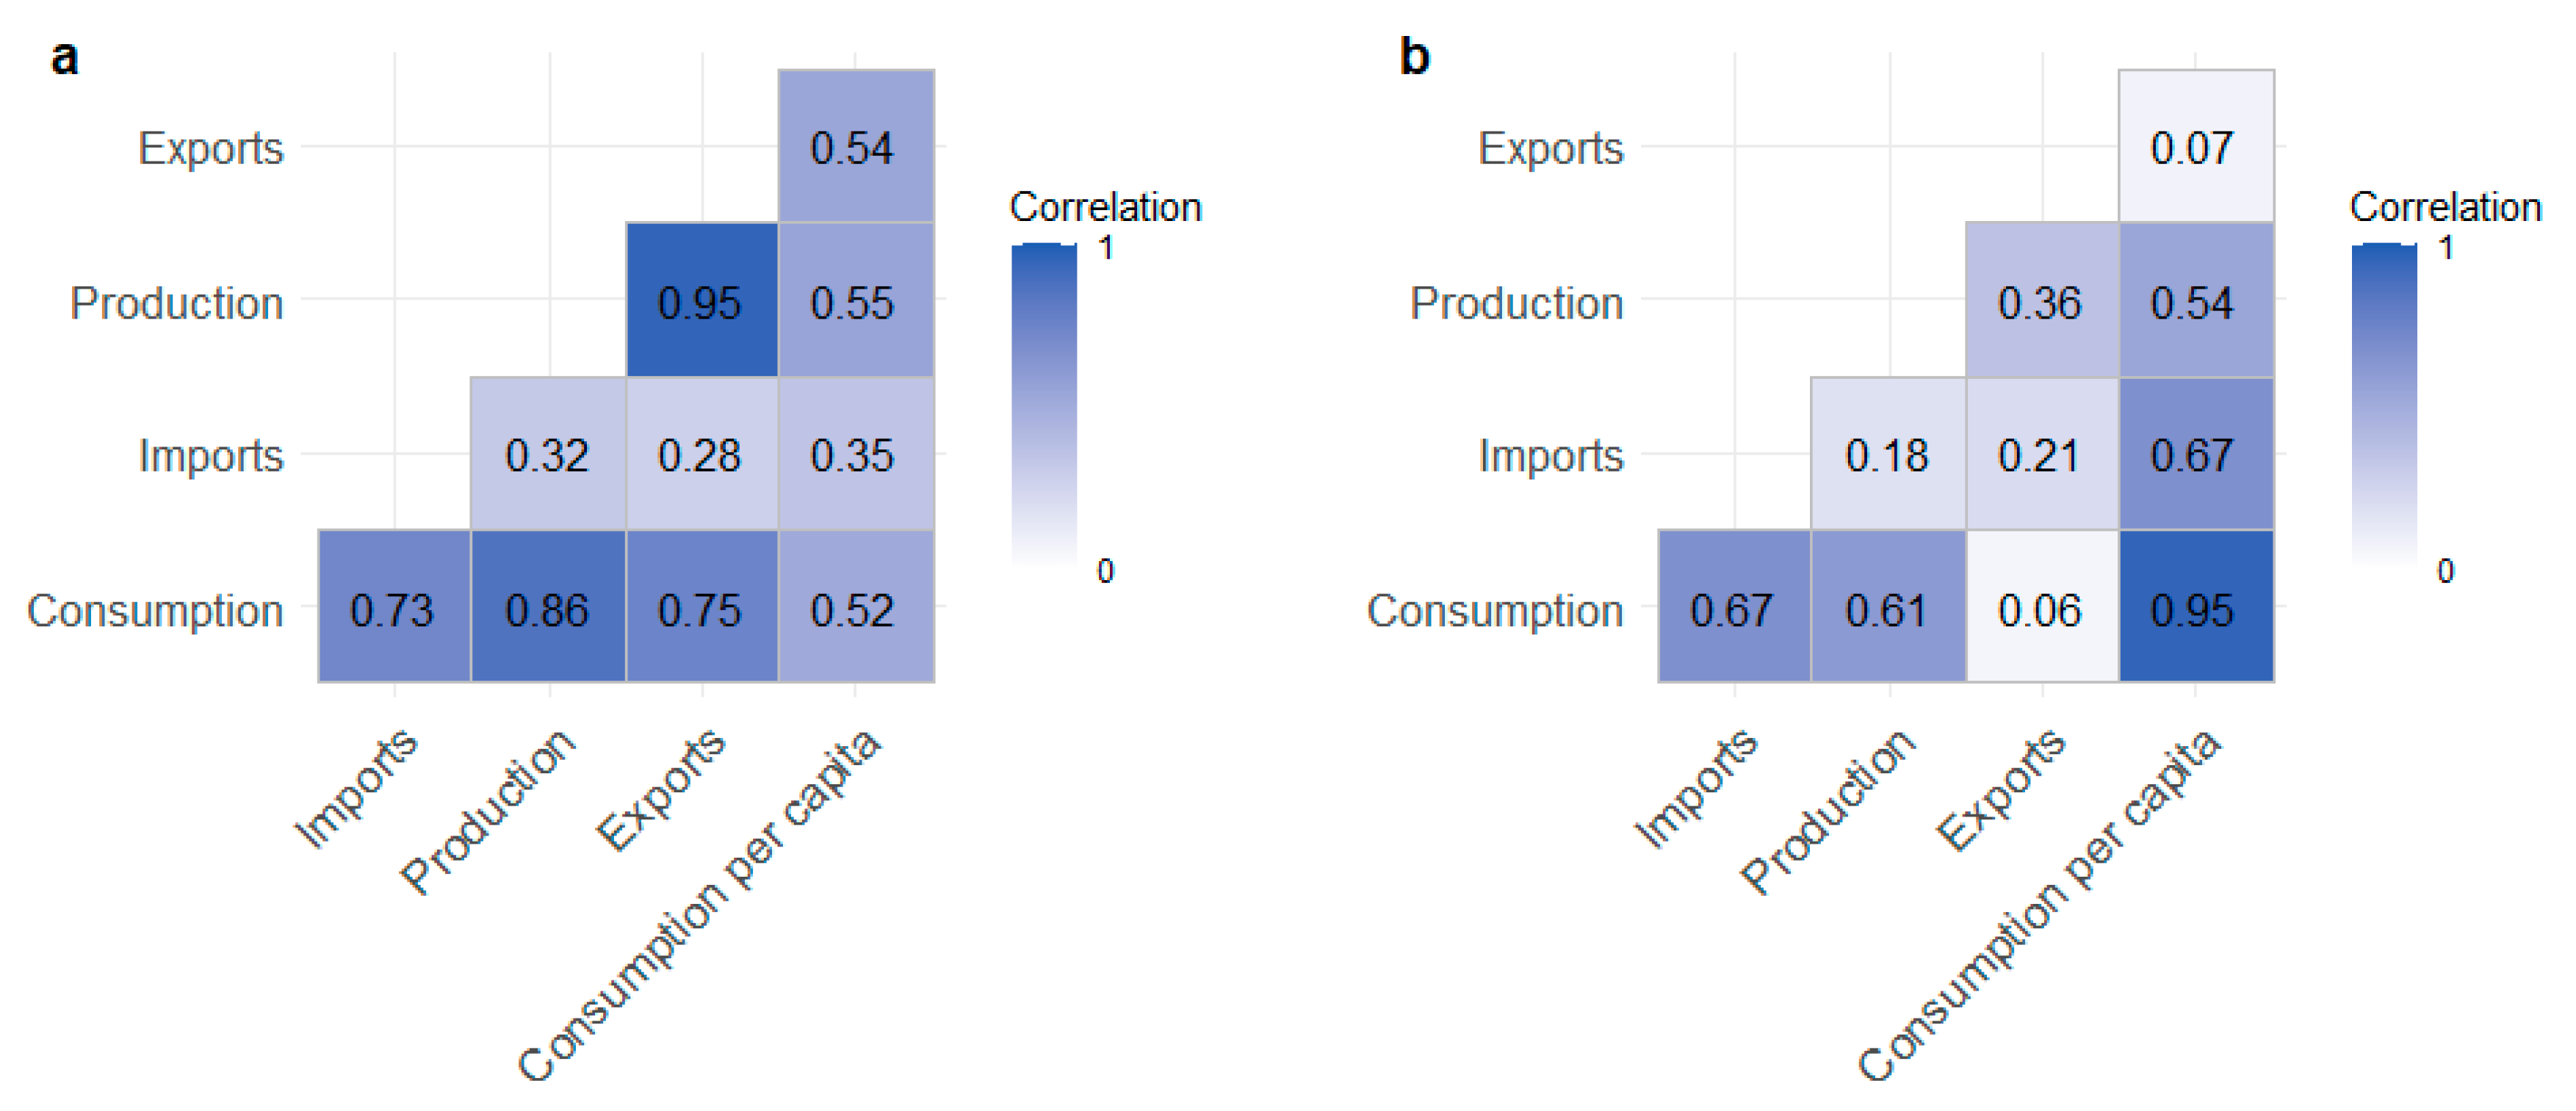
To quantify the relationships among the wine industry factors, Pearson correlation was conducted among each pair of factors for multi-annual mean values (Figure 8a), and Z-scores (Figure 8b). Countries that had no data regarding one or more of the paired variables were excluded from the analysis. The results show that no negative relationships were found between the factors’ means or trends. The mean wine exports factor was highly correlated to mean wine production (Figure 8a), with r = 0.95. Other medium-high correlations among multi-annual means were found for wine consumption against exports, imports, and production. Correlations among trends (Figure 8b) were overall low or moderate, except for a strong link between consumption and consumption per capita (r = 0.95). The consumption trend was found to have a moderate to strong association with trends of imports and production with correlations of 0.67 and 0.61, respectively. A moderate relationship was also found between the trend of wine imports and consumption per capita (r = 0.67).
Finally, the Granger causality test was performed for the global time series of various factors to assess the lagged response of certain factors to other wine industry factors. Table 1 illustrates that the temporal dependencies of wine consumption on wine production were significant for lags of 4 and 5 years, and consumption patterns were affected by surface area in lags of 3 and 4 years (i.e., it takes 3–5 years for these factors to respond to wine consumption demands). Exports and imports were both significant drivers of wine production for lag = 4, and consumption per capita affected production at lags 4 and 5. Consumption was not found to be a future determinant of wine imports, and consumption per capita did not affect future time patterns of surface area under vineyards.
4. Discussion
This study presents a trend analysis at the country level of five wine-market factors. Although the information derived from these analyses may be useful as an overview of global processes in the wine industry, it lacks the specificity of the processes within each country. The scope of this study did not enable it to address the causes and effects of each wine-market factor in each country, and the findings attempt to provide a wide and limited view on these processes. Furthermore, the period selected for this analysis (1995–2021) only provides answers to trends that took place during this timeframe. Thus, earlier trends and patterns are not accounted for, nor are future projections.
The worldwide analysis conducted in this current research shows a sharp decrease in wine consumption in traditional wine-consuming countries (e.g., France, Italy, and Spain) and some other high-consuming countries, such as Argentina and Uruguay (Figure 2b). Drinking patterns in Southern European countries have been gradually shifting for some decades, with studies reporting on decreases from the early 1970’s [28]. These trends were claimed to be due to marketing factors, public health policies, pricing and taxing, and agricultural policies. For instance, beer and spirits consumption has been shown to have increased in these countries during the 1970s and 1980s, as opposed to traditional preferences [16]. Wine consumption in Italy has been reportedly decreasing since the 1970s, due to various reasons, such as shifts to new drinks among younger generations, decreases in drinking among male heavy drinkers who were the main contributors to wine consumption, migration from the countryside, where wine is a part of the culinary tradition, to the city, and more [46]. Contrarily, some of the largest wine-consuming countries were found to have strong, significant increases in wine consumption between 1995 and 2021, as also reported by many studies published in recent years [28]. For instance, Australia has also been experiencing a sharp increase in wine consumption over the past several years [19]. García-Cortijo et al. (2019) [47] reported that the Chinese increase in wine consumption between 2000 and 2014 was due to multiple factors, including the improved standard of living of the middle class, which resulted in an overall increase in alcohol consumption, including wine. The entry of China into the World Trade Organization in 2001 resulted in a reduction in wine import tariffs and introduced the Chinese market to foreign wines. The increase in wine consumption is therefore associated with higher incomes, along with other contributors such as the expansion of urban areas and tourism. Although Chinese wine consumption was projected to increase and surpass all other wine-consuming countries [1,48], our analysis shows a decreasing pattern since 2018. This downward trend has been accelerated by COVID-19 effects and lack of tourism and may have global effects on wine consumption [19]. In the USA, studies have shown a negative demand in response to increasing wine prices. Wine demand is also subjected to adjustment in wine marketing regulations [49]. Overall, countries that are experiencing rapid economic growth have shown the fastest-growing wine consumption (Figure 2a) and strong relationships to wine imports (Figure 7c), where wealthy and middle-class sectors were reported to be significant wine consumers [1]. These wine import trends were not shown during earlier decades [28], and are attributed to the past 30 years. Our findings suggest an overall significant increasing global trend of wine consumption, despite the sharp decreases in wine consumption among the traditional European countries. With that said, the increasing patterns have been moderated since 2008 (Figure 1d), possibly following the great recession which had a negative impact on income.
Wine consumption per capita, however, was found to significantly decrease during the examined period at the global scale, following sharp decreases in the most highly-consuming wine countries. These findings do not align with the work of Anderson and Nelgen (2011), which reported a mild global decrease in wine consumption per capita between 2000 and 2009, and it is therefore assumed that the sharper decrease is more recent. The trends of consumption and consumption per capita were found to be highly correlated (Figure 8b). The findings show that Old World countries experienced decreasing trends of wine consumption per capita, corresponding to the trends shown between the 1970s and 2000 in previous studies [6,50]. New World countries, on the other hand, were found to have increasing levels of individual wine consumption, suggesting that this may eventually lead to a convergence towards similar levels and an overall homogenization pattern, as previously suggested by other studies [15,51]. Several mechanisms underlying the decreasing trends in traditional wine-consuming countries have been previously suggested, including the indistinct cultural boundaries as a function of globalization. In this current study, wine consumption was found to be closely linked to wine imports in most countries (Figure 7b). Indeed, wine preferences appear to be driven less by regional traditions than in the past, and are more open to cultural change [18]. Increasing growth rates in Eastern Europe, Asia, and parts of Africa are responsible for rising levels of wine consumption per capita [1], while cultural shifts, health policies, alcohol policies, and pricing were the reported drivers of reduction in wine consumption per capita in the Southern European countries [16].
Wine consumption was found to be a driving factor of wine production (Table 1) and was also related to imports and exports temporal trends (Figure 8). Our findings show very high fluctuations in global wine production over time (Figure 1d), leading to an insignificant trend. Wine production has been partially driven by the rapid expansion of wealthy and middle classes in fast-growing economies, leading to an increase in the New World wine industry, including developing countries [1]. In the USA, the growing consumer demand for table wines in the past decades has reportedly led to a sharp increase in the establishment of wineries [52], thus increasing productivity. These past findings correspond with our study, showing a high correlation between wine consumption and production (r = 0.77) in the USA (Figure 7a). South Africa was also found to have high increasing trends of wine production, with suggested underlying causes such as affordable high-quality production, unique products, and continuous innovation, as well as intense competition in the local market [53]; wine consumption in South Africa, however, is stable through time (Figure 2b), thus displaying no relationship between consumption (no trend) and production (strong positive trend). On the other hand, Argentina has been experiencing vineyard surface area decline since 2015, supposedly due to climate change issues [19] including water scarcity [54], increasing temperatures, and drought conditions [55], negatively affecting its wine production (Figure 4b). France has been experiencing a reduction in wine production due to unfavorable meteorological conditions [19], which are expected to continue [56], as well as changing marketing practices [57], and the correlation between wine consumption (sharp decrease) and production (also decreasing) was found to be positive (r = 0.71). China’s wine production levels have been declining since 2017 (Figure 1c) as a consequence, among other factors, of China’s decreasing consumption levels (r = 0.67, Figure 7a), challenging climate conditions, and technological constraints [19]. The global levels of production have been mostly higher than the levels of consumption (Figure 1d), introducing problems of overproduction in the wine industry. To deal with this excess capacity, EU countries are offering subsidies to uproot vines, turn lower-quality wine to fuel additives for industrial alcohol [58], and use distillation practices for extracting wine-based products [59] or industrial alcohol [60].
At the global scale, imports and exports were found to have lagged effects on wine production. During recent decades, decreasing tariffs, reduction in logistical costs, and the lowering of some trade barriers have presented the opportunity for wine producers to export their products [61]. Wine imports and exports have therefore shown global increasing trends, with Z > 6.5, and more than 80% of the countries showing a positive trend of wine imports (Figure 5b) and positive correlations between wine consumption and wine imports (Figure 7c). Wine consumers in Canada, with the strongest positive trend of wine imports, perceive local wines as over-priced, as compared to imports [62]. Therefore, as Canadian wine consumption increases, imports are also rising. Although wine production was also found to significantly increase, imports exceed wine exports in Canada by 2761 × 103 hl in average, a pattern also observed by Madill et al. (2003) [63]. The USA has also been showing rising trends of wine imports and now accounts for 10% of world wine imports, in average, as also reported in various studies [12,64]. Poland was likewise found to have a strong increasing trend of wine imports, largely from Georgia [65]; indeed, Georgia displayed a corresponding high exporting trend (Z = 4.63). In Norway, wine imports were found to have increased sharply (Z = 6.65) and have a very strong correlation to wine consumption (r = 0.97) due to deregulations of wine imports in 1995, enabling private wine importers to expand their trade [66].
The largest exporters are consistently France, Italy, and Spain (Figure 6a). While Spain and Italy continue to demonstrate significant increases in wine exports (Z = 5.8 and Z = 4.54, respectively, Appendix A, Table A2), France has been experiencing an insignificant decrease (Z = −1.46, Appendix A, Table A2), as also shown by Anderson and Nelgen (2011) [28]. Cardebat and Figuet (2019) [67] suggest that this reduction in wine exports stems from exchange rate variations, although higher-quality wines are not affected by decreasing trends of overall wine export volumes. The relationship between wine production and exports in France, however, is negligible (Figure 7d) since the rate of decrease in production (Z = −4.17) is much stronger than the rate of export decrease, probably signifying that the domestic reduction in wine consumption is a strong contributor to the decline in wine production (r = 0.71, Figure 7a). Australian exports have been consistently increasing since the 1980s [6], and the amount of exported wine consists of half of the country’s wine produce (Appendix A, Table A1), as also found by Duncan and Greenaway (2008) [58]. Approximately 75% of these wine exports reach the USA, UK, and Canada [68], which all show very strong increasing trends in wine imports (Z > 6, Appendix A, Table A2) and strong correlations between wine consumption and imports (USA with r = 0.98, UK with 0.90, and Canada with 0.94). In Chile, the production volumes have doubled since the 1980s [58], and exports consist of about 60% of wine produce (Appendix A, Table A1), with a correlation of 0.92 between wine production and exports (Figure 7d). The large increase in exports have led to rising wine prices in the country, turning wine into a luxury and decreasing Chile’s domestic wine consumption (Z = −2.13, Appendix A, Table A2) [68]. With the transition to a post-apartheid regime of South Africa in the early 1990s, the international markets were opened for exports including wine [69], and South Africa is exporting an average of about 35% of its produce (Appendix A, Table A1), at an increasing rate (Z = 5.21, Appendix A, Table A2), and a correlation of 0.84 between wine production and exports.
Our findings regarding lagged effects of surface area under vineyards and wine consumption on production processes (Table 1) are supported by previous works. Hussain et al. (2008) [61] and Cholette et al. (2005) [60] stated that the lag between vineyard planting and increasing production results in a supply of wine grapes that is asynchronous with demand. Oczkowski (2014) [70] also suggested a mechanism of a four-year production lag between vine planting and grape output and four-year lagged quantities. Wine imports did not show any global lagged response to wine consumption; however, the country means of these two factors were found to be correlated (r = 0.73, Figure 8a), as well as their trends (r = 0.67, Figure 8b), and it is possible that there is less than a two-year lag effect between wine consumption and imports.
5. Summary and Conclusions
This work attempted to quantify the temporal trends of various wine industry factors (i.e., consumption, consumption per capita, production, imports, and exports) and the relationships among these factors. The methods used in this study were applied for each country and included: computation of mean values for the wine-market factors throughout the study period; applying the MK trend test to quantify the direction, magnitude and significance of the trend for each wine-market factor; computing correlations among the factors for each country, as well as computing the correlations among the factors’ Z-scores to receive global-scale interrelations among the factors’ trends; and using the Granger causality test to determine lagged effects between factors. The findings show that there is an overall distinction between the trend levels of wine consumption, consumption per capita, and production between the Old World and the New World, as globalization processes generate suitable conditions for homogenization in wine trade. These findings support the hypothesis and claims of previous works that raised a theory regarding a converging trend in wine consumption and wine production. Although sharp increases were quantified in some New World countries, the Southern European countries still serve as major wine consumers and producers in the global wine market. Imports have been rising in most countries, signifying the growing demand for foreign wine and a cross-cultural pattern. Furthermore, current increases of wine consumption seem to be linked to modern, developed, and wealthy countries, and characterized by urban populations and high-income. Therefore, the major forces driving the wine market are economic growth and wider competition.
Climate change is a disruptive force that continues threatening the agricultural sector. The wine market is suffering from increasing levels of inter-annual variations in production due to unfavorable and unpredictable weather conditions. Adaptation to the new meteorological characteristics includes alteration of wine production areas and farming practices, re-establishment of wine grape varieties, and managing irregular cycles of the growing seasons, thus affecting the costs of production, revenues, and profits, and causing instabilities in the wine market. Future research should therefore focus on suitable adaptation measures and policies, in order to secure the wine market from potential climate change impacts.
The analysis performed in this study and the corresponding findings may assist the wine-industry sector to make informed decisions about the production processes of wine, answer questions regarding the distribution of wine and the utilization of land for allocation of vineyards, and identify new opportunities within the market. Policymakers may benefit from the methods presented in this study, as they are useful for understanding the trends, patterns, and relationships that shape the industry. Finally, the framework presented in this study may be applied to any other market to achieve a global understanding of temporal patterns and trends.
Author Contributions
Conceptualization, N.O.-L.; methodology, N.O.-L.; software, N.O.-L.; validation, N.O.-L.; formal analysis, N.O.-L.; investigation, N.O.-L.; resources, N.O.-L. and Y.N.; data curation, N.O.-L. and Y.N.; writing—original draft preparation, N.O.-L.; writing—review and editing, N.O.-L. and Y.N.; visualization, N.O.-L.; supervision, N.O.-L.; project administration, N.O.-L. All authors have read and agreed to the published version of the manuscript.
Funding
This research received no external funding.
Institutional Review Board Statement
Not applicable.
Data Availability Statement
Data used in this study was based on the datasets of wine consumption, production, imports, and exports available on the International Organisation of Vine and Wine (OIV) website (https://www.oiv.int/what-we-do/data-discovery-report?oiv (accessed on 23 October 2022)) and additional population data per country downloaded from the World Bank Group (WBG) website (https://databank.worldbank.org/home.aspx (accessed on 23 October 2022)). Visualization of the world was enabled using a world map, available through the “ggplot2” package in R.
Acknowledgments
The authors would like to thank Ido Lewinsohn and Olivier Fratty for their beneficial comments and valuable ideas. We would like to thank the Israeli Ministry of Science and Technology for the support in Eastern R&D Center.
Conflicts of Interest
The authors declare no conflict of interest.
Appendix A

Table A1.
Multi-annual mean values of wine consumption, consumption per capita, production, imports, and exports for each country.
Table A1.
Multi-annual mean values of wine consumption, consumption per capita, production, imports, and exports for each country.
| Continent | Country | Consumption (1000 hl) | Mean Consumption Per Capita (l) | Production (1000 hl) | Imports (1000 hl) | Exports (1000 hl) |
|---|---|---|---|---|---|---|
| Asia | Afghanistan | 1.44 | 0.01 | NA | 1.41 | NA |
| Europe | Albania | 183.85 | 6.21 | 158.46 | 24.93 | 0.00 |
| Africa | Algeria | 327.19 | 0.91 | 566.78 | 38.52 | 32.33 |
| Oceania | American Samoa | 0.04 | 0.07 | NA | 0.04 | NA |
| Africa | Angola | 677.00 | 3.03 | NA | 686.04 | 4.63 |
| America | Antigua | 10.00 | 11.10 | NA | 10.70 | 0.33 |
| America | Argentina | 10,865.59 | 27.53 | 13,708.79 | 71.44 | 2379.63 |
| Asia | Armenia | 57.22 | 1.91 | 67.81 | 3.26 | 11.78 |
| America | Aruba | NA | NA | NA | 24.48 | 1.44 |
| Oceania | Australia | 4745.85 | 21.82 | 11,179.61 | 547.00 | 5871.78 |
| Europe | Austria | 2458.74 | 29.46 | 2394.36 | 634.37 | 485.26 |
| Asia | Azerbaijan | 53.33 | 0.58 | 98.78 | 2.74 | 55.89 |
| America | Bahamas | 26.15 | 7.48 | NA | 30.78 | 0.04 |
| Asia | Bahrain | 14.96 | 1.40 | NA | 15.07 | 0.15 |
| Asia | Bangladesh | 1.04 | 0.00 | NA | 1.00 | NA |
| America | Barbados | 18.59 | 6.61 | NA | 19.78 | 0.52 |
| Europe | Belarus | 589.33 | 6.17 | 220.61 | 385.37 | 15.78 |
| Europe | Belgium | 2753.73 | 25.25 | 5.63 | 2358.93 | 343.43 |
| America | Belize | 6.56 | 1.91 | NA | 6.56 | 0.00 |
| Africa | Benin | 35.48 | 0.41 | NA | 38.19 | 2.63 |
| America | Bermuda | 17.37 | 27.20 | NA | 19.26 | NA |
| Asia | Bhutan | NA | NA | NA | 1.48 | 0.00 |
| America | Bolivia | 59.30 | 0.59 | 56.48 | 6.81 | 0.04 |
| Europe | Bosnia and Herzegovina | 99.11 | 2.76 | 51.81 | 69.11 | 25.56 |
| Africa | Botswana | 52.00 | 2.71 | NA | 48.07 | 0.37 |
| America | Brazil | 3237.37 | 1.70 | 2924.44 | 651.11 | 63.59 |
| Asia | Brunei | 0.11 | 0.03 | NA | 0.19 | NA |
| Europe | Bulgaria | 921.04 | 12.18 | 1703.46 | 71.07 | 856.89 |
| Africa | Burkina Faso | 38.07 | 0.23 | NA | 39.19 | 0.78 |
| Africa | Burundi | 2.04 | 0.02 | NA | 2.07 | 0.00 |
| Africa | Ivory Coast | 282.74 | 1.39 | NA | 292.48 | 0.63 |
| Africa | Cape Verde | 45.44 | 9.34 | NA | 46.81 | 0.04 |
| Asia | Cambodia | 9.00 | 0.06 | NA | 9.15 | 0.07 |
| Africa | Cameroon | 83.11 | 0.41 | NA | 80.44 | 5.44 |
| America | Canada | 3838.89 | 11.33 | 532.54 | 3154.30 | 393.30 |
| America | Cayman Islands | NA | NA | NA | 10.00 | NA |
| Africa | Central African Republic | 5.59 | 0.14 | NA | 5.52 | 0.04 |
| Africa | Chad | 6.41 | 0.05 | NA | 6.22 | 0.00 |
| America | Chile | 2502.22 | 15.04 | 8715.04 | 31.67 | 5761.63 |
| Asia | China | 13,635.44 | 1.02 | 11,084.15 | 2544.48 | 40.00 |
| America | Colombia | 124.37 | 0.27 | NA | 127.56 | 0.15 |
| Africa | Comoros | 1.67 | 0.24 | NA | 1.70 | NA |
| Africa | Democratic Republic of the Congo | 34.67 | 0.06 | NA | 35.74 | 1.41 |
| Oceania | Cook Islands | 1.48 | NA | NA | 1.52 | NA |
| America | Costa Rica | 69.93 | 1.52 | NA | 71.15 | 0.04 |
| Europe | Croatia | 1485.52 | 34.39 | 1360.89 | 145.07 | 63.96 |
| America | Cuba | 143.30 | 1.27 | 98.44 | 42.96 | 0.11 |
| Europe | Cyprus | 140.30 | 13.09 | 251.75 | 43.22 | 60.74 |
| Europe | Czech Republic | 1541.56 | 14.73 | 570.57 | 1241.26 | 100.70 |
| Europe | Denmark | 1626.15 | 29.51 | NA | 1845.81 | 275.04 |
| Africa | Djibouti | 2.59 | 0.32 | NA | 2.56 | 0.00 |
| America | Dominica | 2.37 | 3.36 | NA | 2.52 | 0.07 |
| America | Dominican Republic | 74.70 | 0.78 | NA | 91.44 | 15.96 |
| America | Ecuador | 57.56 | 0.39 | NA | 61.63 | 0.22 |
| Africa | Egypt | 54.48 | 0.07 | 55.52 | 0.00 | 0.22 |
| America | El Salvador | 17.37 | 0.28 | NA | 17.59 | 0.00 |
| Africa | Equatorial Guinea | NA | NA | NA | 76.56 | 2.04 |
| Europe | Estonia | 175.89 | 13.16 | 54.70 | 155.37 | 28.67 |
| Africa | Eswatini | 12.93 | 1.27 | NA | 14.26 | 2.00 |
| Africa | Ethiopia | 19.59 | 0.02 | 15.15 | 4.78 | 0.37 |
| Europe | Faroe Islands | 3.44 | 7.21 | NA | 3.44 | NA |
| Oceania | Fiji | 11.26 | 1.33 | NA | 11.48 | NA |
| Europe | Finland | 463.37 | 8.67 | NA | 546.70 | 33.07 |
| Europe | France | 30,823.37 | 48.53 | 48,421.25 | 6051.22 | 14,417.15 |
| America | French Guiana | 9.44 | NA | NA | 6.86 | NA |
| Oceania | French Polynesia | 33.59 | 13.05 | NA | 36.44 | NA |
| Africa | Gabon | 80.15 | 5.52 | NA | 82.41 | 0.37 |
| Africa | Gambia | 0.88 | 0.05 | NA | 1.04 | NA |
| Asia | Georgia | 889.44 | 22.40 | 1326.93 | 6.30 | 284.59 |
| Europe | Germany | 19,912.04 | 24.26 | 9123.25 | 13,372.26 | 3219.41 |
| Africa | Ghana | 68.22 | 0.29 | NA | 72.33 | 4.37 |
| Europe | Greece | 2806.19 | 25.80 | 3210.54 | 134.78 | 356.89 |
| America | Greenland | 5.48 | 9.71 | NA | 6.56 | 1.00 |
| America | Grenada | 30.70 | 28.54 | NA | 33.78 | 3.07 |
| America | Guadeloupe | 25.56 | NA | NA | 6.37 | NA |
| Oceania | Guam | 0.44 | 0.28 | NA | 0.37 | NA |
| Africa | Guinea | 6.81 | 0.07 | NA | 7.07 | NA |
| Africa | Guinea-Bissau | 55.19 | 3.51 | NA | 55.04 | NA |
| America | Guyana | 0.56 | 0.07 | NA | 1.00 | 0.41 |
| America | Haiti | 8.22 | 0.08 | NA | 10.81 | NA |
| America | Honduras | 13.22 | 0.16 | NA | 13.52 | 0.04 |
| Asia | Hong Kong | 204.74 | 2.87 | NA | 317.70 | 108.33 |
| Europe | Hungary | 2709.07 | 26.98 | 3260.39 | 147.52 | 816.26 |
| Europe | Iceland | 35.04 | 11.02 | NA | 36.52 | 0.11 |
| Asia | India | 111.07 | 0.01 | 149.50 | 23.70 | 7.96 |
| Asia | Indonesia | 8.00 | 0.00 | NA | 9.93 | 1.37 |
| Asia | Iran | 0.07 | 0.00 | NA | 0.11 | 1.41 |
| Asia | Iraq | 3.30 | 0.01 | NA | 3.41 | NA |
| Europe | Ireland | 618.30 | 13.95 | NA | 629.26 | 17.52 |
| Asia | Israel | 58.67 | 0.85 | 177.11 | 48.78 | 74.33 |
| Europe | Italy | 26,232.96 | 44.95 | 49,468.29 | 1592.44 | 18,225.00 |
| America | Jamaica | 23.07 | 0.81 | NA | 28.41 | 4.44 |
| Asia | Japan | 2905.00 | 2.29 | 850.79 | 2079.19 | 3.63 |
| Asia | Jordan | 1.70 | 0.02 | NA | 2.07 | 0.33 |
| Asia | Kazakhstan | 316.33 | 1.91 | 239.36 | 92.37 | 3.85 |
| Africa | Kenya | 41.30 | 0.10 | NA | 48.26 | 5.89 |
| Oceania | Kiribati | 0.04 | 0.04 | NA | 0.04 | NA |
| Asia | South Korea | 236.22 | 0.47 | NA | 256.63 | 0.89 |
| Asia | Kuwait | NA | NA | NA | NA | NA |
| Asia | Kyrgyzstan | 32.52 | 0.61 | 20.74 | 14.04 | 2.59 |
| Asia | Laos | 11.07 | 0.17 | NA | 11.56 | NA |
| Europe | Latvia | 96.07 | 4.44 | 19.44 | 387.63 | 328.04 |
| Asia | Lebanon | 116.74 | 2.57 | 130.81 | 10.00 | 16.89 |
| Africa | Lesotho | 5.19 | 0.25 | NA | 5.44 | NA |
| Africa | Liberia | 3.15 | 0.08 | NA | 3.22 | NA |
| Africa | Libya | 0.19 | 0.00 | NA | 0.15 | 0.00 |
| Europe | Lithuania | 256.74 | 8.32 | 51.96 | 519.19 | 320.74 |
| Europe | Luxemburg | 262.41 | NA | 120.82 | 172.56 | 74.24 |
| Asia | Macao | 31.33 | 5.70 | NA | 34.07 | 2.93 |
| Africa | Madagascar | 88.41 | 0.46 | 80.44 | 6.44 | 0.30 |
| Africa | Malawi | 3.93 | 0.03 | NA | 4.00 | 0.00 |
| Asia | Malaysia | 43.85 | 0.16 | NA | 71.59 | 16.81 |
| Asia | Maldives | 10.52 | 2.62 | NA | 10.89 | 0.00 |
| Africa | Mali | 5.33 | 0.03 | NA | 5.59 | 0.04 |
| Europe | Malta | 59.41 | 13.91 | 34.04 | 38.78 | 1.63 |
| America | Martinique | 17.78 | NA | NA | 5.68 | 0.00 |
| Africa | Mauritania | 0.19 | 0.01 | NA | 0.19 | NA |
| Africa | Mauritius | 16.63 | 1.35 | NA | 17.26 | 0.81 |
| America | Mexico | 646.48 | 0.55 | 748.93 | 408.22 | 14.07 |
| Oceania | Micronesia | NA | NA | NA | 0.37 | NA |
| Europe | Moldova | 464.70 | 16.20 | 1843.46 | 71.11 | 1384.30 |
| Asia | Mongolia | 12.11 | 0.43 | NA | 12.15 | NA |
| Europe | Montenegro | 109.50 | 17.66 | 126.25 | 19.65 | 60.29 |
| America | Montserrat | 0.15 | NA | NA | 0.15 | NA |
| Africa | Morocco | 379.19 | 1.18 | 352.82 | 80.41 | 47.89 |
| Africa | Mozambique | 71.59 | 0.31 | NA | 118.04 | 46.07 |
| Asia | Myanmar | 22.26 | 0.04 | NA | 10.70 | NA |
| Africa | Namibia | 171.26 | 7.58 | NA | 191.96 | 14.19 |
| Oceania | Nauru | 0.00 | 0.00 | NA | 0.00 | NA |
| Asia | Nepal | 4.78 | 0.02 | NA | 4.93 | 0.11 |
| Europe | Netherlands | 3249.26 | 19.65 | NA | 3595.44 | 354.59 |
| America | Netherlands Antilles | 13.41 | NA | NA | 12.78 | NA |
| Oceania | New Caledonia | 55.48 | 22.97 | NA | 56.30 | NA |
| Oceania | New Zealand | 762.78 | 17.47 | 1803.18 | 365.00 | 1178.19 |
| America | Nicaragua | 8.78 | 0.15 | NA | 8.85 | 0.00 |
| Africa | Niger | 6.56 | 0.04 | NA | 6.74 | 0.00 |
| Africa | Nigeria | 149.89 | 0.09 | NA | 143.85 | 0.74 |
| Oceania | Niue | 0.00 | NA | NA | 0.00 | NA |
| Oceania | Norfolk Island | NA | NA | NA | 0.78 | NA |
| Europe | Norway | 654.19 | 13.35 | NA | 715.89 | 13.52 |
| Asia | Oman | NA | NA | NA | 4.26 | 0.00 |
| Asia | Pakistan | 0.41 | 0.00 | NA | 0.41 | 0.00 |
| America | Panama | 24.19 | 0.69 | 1.26 | 32.07 | 23.48 |
| Oceania | Papua New Guinea | 11.15 | 0.15 | NA | 11.56 | NA |
| America | Paraguay | 255.93 | 4.23 | 35.74 | 232.22 | 0.04 |
| America | Peru | 595.63 | 2.02 | 528.33 | 76.93 | 2.04 |
| Asia | Philippines | 105.81 | 0.11 | NA | 105.22 | 0.93 |
| Europe | Poland | 831.41 | 2.18 | NA | 869.11 | 48.89 |
| Europe | Portugal | 4866.96 | 46.98 | 6697.82 | 1710.48 | 2695.11 |
| Asia | Qatar | NA | NA | NA | 62.81 | 0.00 |
| Europe | North Macedonia | 201.44 | 9.87 | 899.67 | 5.52 | 744.15 |
| Asia | Turkey | 430.41 | 0.58 | 444.33 | 11.96 | 37.52 |
| Africa | Reunion | 30.74 | NA | NA | 43.70 | 0.00 |
| Europe | Romania | 4902.04 | 23.39 | 4898.29 | 285.96 | 262.04 |
| Europe | Russia | 9071.59 | 6.29 | 4542.37 | 4145.37 | 31.00 |
| Africa | Rwanda | 5.52 | 0.05 | NA | 6.63 | 1.41 |
| Africa | Saint Helena | 0.18 | NA | NA | 0.18 | NA |
| America | Saint Kitts | 1.96 | 4.07 | NA | 1.93 | 0.00 |
| America | Saint Lucia | 10.41 | 6.11 | NA | 13.26 | 2.00 |
| America | Saint Pierre And Miquelon | 1.89 | NA | NA | 1.85 | NA |
| America | Saint Vincent | 1.78 | 1.63 | NA | 1.81 | 0.00 |
| Oceania | Samoa | 0.41 | 0.21 | NA | 0.52 | NA |
| Africa | Sao Tome and Principe | 31.30 | 18.18 | NA | 31.74 | NA |
| Asia | Saudi Arabia | 0.00 | 0.00 | NA | 0.04 | NA |
| Africa | Senegal | 65.00 | 0.54 | NA | 65.37 | 1.19 |
| Europe | Serbia | 1356.31 | 18.84 | 1179.31 | 237.53 | 115.88 |
| Africa | Seychelles | 10.81 | 11.96 | NA | 11.81 | 0.00 |
| Africa | Sierra Leone | 1.78 | 0.03 | NA | 1.78 | NA |
| Asia | Singapore | 105.78 | 2.16 | NA | 206.48 | 100.33 |
| Europe | Slovakia | 629.30 | 11.65 | 377.50 | 435.52 | 200.07 |
| Europe | Slovenia | 724.70 | 35.69 | 601.29 | 101.67 | 66.93 |
| Oceania | Solomon Islands | 0.78 | 0.14 | NA | 0.81 | NA |
| Africa | Somalia | 0.00 | 0.00 | NA | 0.00 | NA |
| Africa | South Africa | 3790.96 | 7.62 | 9369.00 | 137.67 | 3406.07 |
| Europe | Spain | 12,190.59 | 27.93 | 35,906.54 | 707.96 | 15,803.04 |
| Asia | Sri Lanka | 6.04 | 0.03 | NA | 6.56 | 0.26 |
| Asia | Palestine | 0.26 | NA | NA | 0.37 | 0.44 |
| Africa | Sudan | 0.96 | 0.00 | NA | 1.00 | NA |
| America | Suriname | 3.96 | 0.74 | NA | 3.96 | NA |
| Europe | Sweden | 1786.44 | 18.87 | NA | 1731.59 | 46.96 |
| Europe | Switzerland | 2841.52 | 36.94 | 1038.75 | 1843.67 | 15.67 |
| Asia | Syria | 2.74 | 0.02 | 1.81 | 1.07 | 0.00 |
| Asia | Taiwan | 150.96 | NA | NA | 153.63 | 1.00 |
| Asia | Tajikistan | 30.30 | 0.47 | 29.00 | 1.67 | 3.93 |
| Africa | Tanzania | 28.22 | 0.06 | NA | 28.41 | 0.41 |
| Asia | Thailand | 47.30 | 0.07 | NA | 91.93 | 48.78 |
| Asia | Timor-Leste | 1.93 | 0.18 | NA | 1.85 | NA |
| Africa | Togo | 41.30 | 0.69 | NA | 68.44 | 36.96 |
| Oceania | Tonga | 0.67 | 0.66 | NA | 0.67 | NA |
| America | Trinidad | 10.70 | NA | NA | 11.11 | 0.15 |
| Africa | Tunisia | 241.89 | 2.30 | 313.32 | 1.07 | 69.19 |
| Asia | Turkmenistan | 310.63 | 6.10 | 388.71 | 2.93 | 14.04 |
| Oceania | Tuvalu | 0.19 | 1.69 | NA | 0.19 | NA |
| Africa | Uganda | 9.81 | 0.03 | NA | 11.22 | 1.30 |
| Europe | Ukraine | 1686.96 | 3.62 | 1826.63 | 306.63 | 365.19 |
| Asia | United Arab Emirates | NA | NA | NA | 180.56 | 44.33 |
| Europe | United Kingdom | 11,705.07 | 18.75 | 30.00 | 11,715.15 | 571.59 |
| America | USA | 27,027.00 | 8.88 | 21,805.43 | 8282.74 | 3384.59 |
| America | Uruguay | 796.70 | 23.81 | 828.21 | 43.33 | 51.89 |
| Asia | Uzbekistan | 300.11 | 1.15 | 351.50 | 1.33 | 84.00 |
| Oceania | Vanuatu | 3.85 | 1.67 | NA | 3.74 | NA |
| America | Venezuela | 139.26 | 0.53 | NA | 125.93 | 0.26 |
| Asia | Vietnam | 76.41 | 0.09 | NA | 60.22 | NA |
| America | Virgin Islands | NA | NA | NA | 2.44 | NA |
| Asia | Yemen | 0.00 | 0.00 | NA | 0.00 | 0.00 |
| Africa | Zambia | 13.56 | 0.09 | NA | 14.15 | 0.04 |
| Africa | Zimbabwe | 30.93 | 0.24 | 18.33 | 11.19 | 0.56 |
| Global | Global | 237,314.89 | 3.53 | 269,122.48 | 83,650.11 | 86,585.19 |
Table A2.
Z-score values resulting from the Mann-Kendall trend test, calculated for wine consumption, consumption per capita, production, imports, and exports for each country. Values above 1.96 and below −1.96 are considered significant (α = 0.05).
Table A2.
Z-score values resulting from the Mann-Kendall trend test, calculated for wine consumption, consumption per capita, production, imports, and exports for each country. Values above 1.96 and below −1.96 are considered significant (α = 0.05).
| Continent | Country | Consumption | Consumption Per Capita | Production | Imports | Exports |
|---|---|---|---|---|---|---|
| Asia | Afghanistan | 2.69 | 0.21 | NA | 2.52 | NA |
| Europe | Albania | 3.44 | 3.96 | 0.69 | 5.24 | NA |
| Africa | Algeria | 4.80 | 2.96 | 2.15 | 4.17 | −5.86 |
| Oceania | American Samoa | 0.19 | 0.19 | NA | 0.19 | NA |
| Africa | Angola | 2.23 | 0.42 | NA | 2.13 | 3.88 |
| America | Antigua | 5.31 | 5.09 | NA | 5.34 | −0.23 |
| America | Argentina | −6.25 | −6.71 | −2.39 | −0.65 | 3.63 |
| Asia | Armenia | 2.02 | 2.25 | 2.94 | 2.91 | 4.75 |
| America | Aruba | NA | NA | NA | 6.07 | −0.22 |
| Oceania | Australia | 6.21 | 3.38 | 3.38 | 6.07 | 4.75 |
| Europe | Austria | −1.82 | −3.63 | −0.06 | 4.09 | 2.63 |
| Asia | Azerbaijan | 5.34 | 5.00 | 3.49 | 2.37 | 0.21 |
| America | Bahamas | 5.05 | 3.38 | NA | 4.00 | 0.96 |
| Asia | Bahrain | 2.93 | −0.63 | NA | 2.55 | 2.73 |
| Asia | Bangladesh | 1.07 | −1.84 | NA | 0.64 | NA |
| America | Barbados | 5.71 | 5.42 | NA | 5.17 | 2.01 |
| Europe | Belarus | 6.13 | 6.13 | 5.78 | 6.03 | −0.21 |
| Europe | Belgium | 0.08 | −2.37 | 5.65 | 4.89 | 4.60 |
| America | Belize | 5.41 | 4.38 | NA | 5.14 | NA |
| Africa | Benin | 0.21 | −2.13 | NA | −0.06 | −0.98 |
| America | Bermuda | 2.19 | 2.13 | NA | −0.55 | NA |
| Asia | Bhutan | NA | NA | NA | 4.69 | NA |
| America | Bolivia | 4.27 | 2.33 | 3.65 | 4.14 | 1.35 |
| Europe | Bosnia and Herzegovina | 3.01 | 4.42 | 0.63 | 2.74 | 1.67 |
| Africa | Botswana | 2.11 | 0.71 | NA | 2.28 | −1.81 |
| America | Brazil | 4.23 | 0.71 | −0.71 | 6.50 | −1.69 |
| Asia | Brunei | −0.81 | −0.92 | NA | −0.66 | NA |
| Europe | Bulgaria | 0.00 | 1.17 | −5.55 | 2.92 | −5.74 |
| Africa | Burkina Faso | 3.92 | 3.17 | NA | 4.28 | 2.38 |
| Africa | Burundi | 2.92 | 0.67 | NA | 2.82 | NA |
| Africa | Ivory Coast | 4.36 | 1.42 | NA | 4.48 | 0.54 |
| Africa | Cape Verde | 4.20 | 2.88 | NA | 4.22 | −0.96 |
| Asia | Cambodia | 3.26 | 2.50 | NA | 3.23 | −0.83 |
| Africa | Cameroon | 5.06 | 3.29 | NA | 4.49 | −1.23 |
| America | Canada | 5.69 | 4.54 | 5.24 | 7.05 | 6.30 |
| America | Cayman Islands | NA | NA | NA | 2.28 | NA |
| Africa | Central African Republic | −1.23 | −3.29 | NA | −1.96 | 0.06 |
| Africa | Chad | 2.43 | 0.25 | NA | 2.15 | NA |
| America | Chile | 0.13 | −2.13 | 5.95 | −0.19 | 6.26 |
| Asia | China | 4.88 | 4.54 | 2.29 | 6.00 | 0.61 |
| America | Colombia | 6.82 | 6.63 | NA | 6.82 | 0.73 |
| Africa | Comoros | 3.43 | 0.00 | NA | 3.51 | NA |
| Africa | Democratic Republic of the Congo | −2.40 | −4.63 | NA | −1.99 | 3.10 |
| Oceania | Cook Islands | 4.31 | NA | NA | 4.24 | NA |
| America | Costa Rica | 6.28 | 5.92 | NA | 6.37 | −1.35 |
| Europe | Croatia | −5.25 | −4.96 | −5.30 | 5.34 | −2.44 |
| America | Cuba | 3.21 | 3.00 | 2.33 | 4.97 | 2.74 |
| Europe | Cyprus | 3.51 | 1.42 | −5.89 | 5.99 | −6.20 |
| Europe | Czech Republic | 5.75 | 5.67 | 2.15 | 4.92 | 4.26 |
| Europe | Denmark | −1.54 | −2.67 | NA | 0.69 | 2.67 |
| Africa | Djibouti | 0.92 | −1.33 | NA | 0.12 | NA |
| America | Dominica | −4.39 | −5.34 | NA | −4.08 | −0.60 |
| America | Dominican Republic | 3.32 | 2.63 | NA | 5.32 | 4.16 |
| America | Ecuador | 3.80 | 2.79 | NA | 3.74 | −0.32 |
| Africa | Egypt | 4.01 | 1.92 | 3.14 | NA | 0.00 |
| America | El Salvador | 5.21 | 4.42 | NA | 5.28 | NA |
| Africa | Equatorial Guinea | NA | NA | NA | 1.05 | 3.23 |
| Europe | Estonia | 5.34 | 5.38 | 3.16 | 5.61 | 4.62 |
| Africa | Eswatini | −0.30 | −1.52 | NA | −3.64 | 0.83 |
| Africa | Ethiopia | −1.26 | −2.84 | −3.27 | 3.08 | 3.59 |
| Europe | Faroe Islands | 5.37 | 3.34 | NA | 5.35 | NA |
| Oceania | Fiji | 4.06 | 3.38 | NA | 3.96 | NA |
| Europe | Finland | 3.00 | 2.59 | NA | 6.59 | 5.51 |
| Europe | France | −6.42 | −6.63 | −4.17 | 3.25 | −1.46 |
| America | French Guiana | −1.64 | NA | NA | 0.00 | NA |
| Oceania | French Polynesia | −1.28 | −3.00 | NA | −3.36 | NA |
| Africa | Gabon | −4.11 | −5.59 | NA | −3.71 | 0.98 |
| Africa | Gambia | −4.02 | −4.44 | NA | −2.63 | NA |
| Asia | Georgia | 0.04 | 0.29 | −0.32 | −1.00 | 4.63 |
| Europe | Germany | 1.86 | 1.50 | −1.36 | 4.63 | 4.63 |
| Africa | Ghana | 1.96 | 0.29 | NA | 2.46 | 3.16 |
| Europe | Greece | −2.38 | −2.54 | −5.27 | 2.13 | −4.65 |
| America | Greenland | 2.94 | 2.75 | NA | 1.78 | −0.38 |
| America | Grenada | 5.87 | 5.42 | NA | 5.89 | 3.88 |
| America | Guadeloupe | −4.24 | NA | NA | −2.27 | NA |
| Oceania | Guam | 1.01 | 0.29 | NA | 0.50 | NA |
| Africa | Guinea | 1.56 | −0.17 | NA | 1.80 | NA |
| Africa | Guinea-Bissau | 5.82 | 5.13 | NA | 5.71 | NA |
| America | Guyana | 3.29 | 2.97 | NA | 4.86 | 1.60 |
| America | Haiti | 5.54 | 4.54 | NA | 5.35 | NA |
| America | Honduras | 4.73 | 3.34 | NA | 4.39 | −0.32 |
| Asia | Hong Kong | 6.15 | 6.00 | NA | 4.88 | 3.45 |
| Europe | Hungary | −4.61 | −4.34 | −3.46 | 3.42 | 0.25 |
| Europe | Iceland | 6.18 | 5.59 | NA | 6.46 | −0.04 |
| Asia | India | 6.21 | 5.86 | 4.44 | 5.58 | 3.23 |
| Asia | Indonesia | 0.61 | 0.39 | NA | 1.39 | 1.73 |
| Asia | Iran | −0.05 | −0.09 | NA | −0.28 | 2.73 |
| Asia | Iraq | 5.92 | 5.53 | NA | 5.70 | NA |
| Europe | Ireland | 6.05 | 4.75 | NA | 6.09 | 3.11 |
| Asia | Israel | −4.77 | −5.46 | 0.94 | 5.34 | 5.01 |
| Europe | Italy | −5.03 | −5.00 | −1.40 | 4.67 | 4.54 |
| America | Jamaica | 5.61 | 5.46 | NA | 5.68 | 1.65 |
| Asia | Japan | 3.09 | 3.21 | −0.97 | 4.17 | −3.53 |
| Asia | Jordan | 4.44 | 1.19 | NA | 4.08 | −0.81 |
| Asia | Kazakhstan | 4.46 | 3.63 | 3.80 | 2.44 | −2.74 |
| Africa | Kenya | 6.30 | 5.46 | NA | 6.12 | 3.12 |
| Oceania | Kiribati | −0.06 | −0.06 | NA | −0.06 | NA |
| Asia | South Korea | 6.51 | 6.38 | NA | 6.50 | 2.42 |
| Asia | Kuwait | NA | NA | NA | NA | NA |
| Asia | Kyrgyzstan | 0.94 | −0.21 | −0.42 | 1.57 | 0.74 |
| Asia | Laos | 5.94 | 5.46 | NA | 5.73 | NA |
| Europe | Latvia | −0.77 | 0.63 | 2.41 | 5.96 | 5.55 |
| Asia | Lebanon | −4.28 | −5.50 | −3.99 | 5.00 | 6.03 |
| Africa | Lesotho | 2.66 | 1.76 | NA | 2.68 | NA |
| Africa | Liberia | 4.16 | 2.61 | NA | 3.99 | NA |
| Africa | Libya | 3.15 | 2.82 | NA | 2.90 | NA |
| Europe | Lithuania | 3.53 | 4.17 | 1.05 | 5.03 | 5.68 |
| Europe | Luxemburg | 0.77 | NA | −3.28 | 4.01 | −2.96 |
| Asia | Macao | 3.97 | 3.38 | NA | 3.69 | 3.49 |
| Africa | Madagascar | −0.95 | −5.92 | −1.45 | 3.97 | 1.83 |
| Africa | Malawi | −0.85 | −2.46 | NA | −1.38 | NA |
| Asia | Malaysia | 4.84 | 4.42 | NA | 4.80 | 3.93 |
| Asia | Maldives | 6.67 | 5.00 | NA | 6.52 | NA |
| Africa | Mali | 4.05 | 2.04 | NA | 4.11 | 0.58 |
| Europe | Malta | 3.22 | 1.21 | −4.07 | 5.32 | 0.37 |
| America | Martinique | −4.24 | NA | NA | −2.19 | NA |
| Africa | Mauritania | 1.15 | 0.84 | NA | 1.15 | NA |
| Africa | Mauritius | 4.16 | 3.59 | NA | 3.84 | 2.03 |
| America | Mexico | 6.84 | 6.80 | −3.90 | 6.53 | −2.37 |
| Oceania | Micronesia | NA | NA | NA | 3.94 | NA |
| Europe | Moldova | −2.49 | −2.25 | −2.51 | −3.80 | −0.81 |
| Asia | Mongolia | 5.26 | 3.98 | NA | 5.01 | NA |
| Europe | Montenegro | −0.77 | −0.77 | −3.24 | 3.55 | 1.49 |
| America | Montserrat | −3.11 | NA | NA | −3.11 | NA |
| Africa | Morocco | 3.32 | 1.04 | 2.89 | 1.63 | −4.22 |
| Africa | Mozambique | 1.46 | −0.38 | NA | 3.04 | 4.57 |
| Asia | Myanmar | 6.56 | 6.13 | NA | 4.40 | NA |
| Africa | Namibia | 4.24 | 3.61 | NA | 3.59 | 3.14 |
| Oceania | Nauru | NA | NA | NA | NA | NA |
| Asia | Nepal | 5.29 | 4.72 | NA | 5.74 | 2.74 |
| Europe | Netherlands | 4.55 | 2.46 | NA | 5.51 | 4.34 |
| America | Netherlands Antilles | 0.02 | NA | NA | −0.28 | NA |
| Oceania | New Caledonia | 2.79 | −0.08 | NA | 1.97 | NA |
| Oceania | New Zealand | 5.67 | 2.46 | 5.87 | 2.13 | 7.17 |
| America | Nicaragua | 4.43 | 3.67 | NA | 4.43 | NA |
| Africa | Niger | 3.11 | −1.63 | NA | 3.18 | NA |
| Africa | Nigeria | 4.55 | 4.04 | NA | 4.34 | 0.40 |
| Oceania | Niue | NA | NA | NA | NA | NA |
| Oceania | Norfolk Island | NA | NA | NA | −0.85 | NA |
| Europe | Norway | 6.96 | 6.00 | NA | 6.65 | 4.63 |
| Asia | Oman | NA | NA | NA | 5.73 | NA |
| Asia | Pakistan | −2.25 | −3.43 | NA | −2.25 | NA |
| America | Panama | 2.28 | 1.50 | −2.57 | 5.82 | 4.46 |
| Oceania | Papua New Guinea | 3.36 | 2.38 | NA | 3.09 | NA |
| America | Paraguay | 1.46 | −0.17 | −3.03 | 1.46 | 1.22 |
| America | Peru | 6.59 | 6.00 | 6.76 | 5.44 | 3.92 |
| Asia | Philippines | 6.76 | 6.55 | NA | 5.98 | 3.31 |
| Europe | Poland | 6.55 | 6.55 | NA | 6.71 | 2.84 |
| Europe | Portugal | −1.75 | −1.71 | −1.32 | 3.46 | 3.21 |
| Asia | Qatar | NA | NA | NA | 3.16 | NA |
| Europe | North Macedonia | 0.38 | −0.04 | −0.19 | −1.76 | −0.23 |
| Asia | Turkey | 4.61 | 3.67 | 4.17 | 4.53 | −2.93 |
| Africa | Reunion | −4.24 | NA | NA | −4.24 | NA |
| Europe | Romania | −4.38 | −3.29 | −3.14 | 3.22 | −3.11 |
| Europe | Russia | 2.79 | 2.79 | 2.38 | 0.75 | 0.61 |
| Africa | Rwanda | 5.00 | 3.82 | NA | 5.61 | 3.38 |
| Africa | Saint Helena | −0.94 | NA | NA | −0.89 | NA |
| America | Saint Kitts | 1.95 | −0.83 | NA | 1.75 | NA |
| America | Saint Lucia | 2.39 | 1.58 | NA | 4.23 | 1.85 |
| America | Saint Pierre And Miquelon | 1.09 | NA | NA | 0.98 | NA |
| America | Saint Vincent | 3.61 | 2.17 | NA | 3.62 | NA |
| Oceania | Samoa | 2.61 | 2.02 | NA | 1.59 | NA |
| Africa | Sao Tome and Principe | 2.78 | −1.25 | NA | 2.53 | NA |
| Asia | Saudi Arabia | NA | NA | NA | −0.58 | NA |
| Africa | Senegal | −0.50 | −2.92 | NA | −0.06 | −0.30 |
| Europe | Serbia | −3.38 | −3.02 | −3.21 | −0.21 | 1.11 |
| Africa | Seychelles | 5.18 | 4.59 | NA | 3.83 | NA |
| Africa | Sierra Leone | 5.07 | 3.17 | NA | 4.89 | NA |
| Asia | Singapore | 6.40 | 5.59 | NA | 6.36 | 5.90 |
| Europe | Slovakia | 3.36 | 3.21 | −3.44 | 5.59 | 5.43 |
| Europe | Slovenia | 0.33 | −0.04 | 1.98 | 0.88 | −1.38 |
| Oceania | Solomon Islands | 2.64 | 0.09 | NA | 2.75 | NA |
| Africa | Somalia | NA | NA | NA | NA | NA |
| Africa | South Africa | 0.08 | −4.25 | 4.29 | 0.88 | 5.21 |
| Europe | Spain | −5.76 | −5.59 | 1.48 | 1.83 | 5.80 |
| Asia | Sri Lanka | 5.26 | 4.59 | NA | 5.30 | 3.71 |
| Asia | Palestine | 2.68 | NA | NA | −2.60 | −1.42 |
| Africa | Sudan | 4.71 | 3.90 | NA | 4.58 | NA |
| America | Suriname | 4.23 | 2.88 | NA | 3.99 | NA |
| Europe | Sweden | 5.09 | 4.34 | NA | 6.09 | 5.03 |
| Europe | Switzerland | −4.13 | −5.84 | −4.03 | 0.17 | −0.15 |
| Asia | Syria | −3.22 | −4.38 | −4.52 | −1.21 | NA |
| Asia | Taiwan | 4.11 | NA | NA | 4.23 | 1.08 |
| Asia | Tajikistan | −4.38 | −5.25 | −5.19 | 2.78 | −4.25 |
| Africa | Tanzania | 3.52 | 2.54 | NA | 3.74 | 0.06 |
| Asia | Thailand | −1.09 | −1.58 | NA | 4.05 | 6.39 |
| Asia | Timor-Leste | 0.15 | −1.48 | NA | −0.70 | NA |
| Africa | Togo | −0.27 | −0.85 | NA | 4.03 | 4.31 |
| Oceania | Tonga | 0.33 | −2.43 | NA | 0.39 | NA |
| America | Trinidad | 4.37 | NA | NA | 4.13 | −1.16 |
| Africa | Tunisia | 2.88 | 1.54 | 0.89 | 2.42 | −4.55 |
| Asia | Turkmenistan | 2.78 | −0.17 | 0.46 | 0.47 | −4.00 |
| Oceania | Tuvalu | 1.84 | 1.52 | NA | 1.53 | NA |
| Africa | Uganda | 5.17 | 4.13 | NA | 4.74 | 4.13 |
| Europe | Ukraine | 0.38 | 1.04 | −1.27 | 3.38 | −0.33 |
| Asia | United Arab Emirates | NA | NA | NA | 6.13 | 5.79 |
| Europe | United Kingdom | 4.79 | 2.17 | 4.90 | 6.05 | 4.88 |
| America | USA | 6.59 | 5.67 | 4.09 | 6.88 | 3.13 |
| America | Uruguay | −5.32 | −5.96 | −3.36 | −1.09 | 3.80 |
| Asia | Uzbekistan | −4.74 | −5.38 | −4.29 | 1.69 | 1.79 |
| Oceania | Vanuatu | 2.57 | −0.13 | NA | 2.20 | NA |
| America | Venezuela | −1.55 | −1.88 | NA | −1.36 | −2.08 |
| Asia | Vietnam | 5.97 | 5.34 | NA | 4.44 | NA |
| America | Virgin Islands | NA | NA | NA | 0.83 | NA |
| Asia | Yemen | NA | NA | NA | NA | NA |
| Africa | Zambia | 4.42 | 3.71 | NA | 4.50 | 1.22 |
| Africa | Zimbabwe | 2.20 | 1.17 | 4.40 | 0.25 | −1.86 |
| Global | Global | 3.00 | −6.13 | 0.00 | 6.67 | 6.55 |
References
- Banks, G.; Overton, J. Old World, New World, Third World? Reconceptualising the Worlds of Wine. J. Wine Res. 2010, 21, 57–75. [Google Scholar] [CrossRef]
- Santeramo, F.G.; Lamonaca, E.; Nardone, G.; Seccia, A. The benefits of country-specific non-tariff measures in world wine trade. Wine Econ. Policy 2019, 8, 28–37. [Google Scholar] [CrossRef]
- Meloni, G.; Anderson, K.; Deconinck, K.; Swinnen, J. Wine Regulations. Appl. Econ. Perspect. Policy 2019, 41, 620–649. [Google Scholar] [CrossRef]
- Mariani, A.; Pomarici, E. Barriers to Wine trade. In The Palgrave Handbook of Wine Industry Economics; Ugaglia, A.A., Cardebat, J.M., Corsi, A., Eds.; Palgrave Macmillan: Cham, Switzerland, 2019; pp. 291–315. [Google Scholar] [CrossRef]
- Seale, J.L.; Marchant, M.A.; Basso, A. Imports versus Domestic Production: A Demand System Analysis of the U.S. Red Wine Market. Appl. Econ. Perspect. Policy 2003, 25, 187–202. [Google Scholar] [CrossRef] [Green Version]
- Anderson, K.; Norman, D.; Wittwer, G. Globalization and the World’s Wine Markets: Overview; University of Adelaide, Centre for International Economic Studies: Adelaide, Australia, 2001. [Google Scholar]
- Mariani, A.; Pomarici, E.; Boatto, V. The international wine trade: Recent trends and critical issues. Wine Econ. Policy 2012, 1, 24–40. [Google Scholar] [CrossRef]
- Thorpe, M. The globalisation of the wine industry: New world, old world and China. China Agric. Econ. Rev. 2009, 1, 301–313. [Google Scholar] [CrossRef]
- Arahata, K. The wine market in Japan: Market competition among exporting countries and the strategy of US wine. In Proceedings of the American Agricultural Economics Association Annual Meeting, Denver, CO, USA, 1–4 August 2004. [Google Scholar]
- Bentzen, J.; Smith, V. Structural Changes in the Consumption of Beer, Wine and Spirits in OECD Countries from 1961 to 2014. Beverages 2018, 4, 8. [Google Scholar] [CrossRef] [Green Version]
- Liu, A.; Song, H. Analysis and Forecasts of the Demand for Imported Wine in China. Cornell Hosp. Q. 2021, 62, 371–385. [Google Scholar] [CrossRef]
- Hussain, M.; Cholette, S.; Castaldi, R. Determinants of wine consumption of US consumers: An econometric analysis. Int. J. Wine Bus. Res. 2007, 19, 49–62. [Google Scholar] [CrossRef]
- Anderson, K.; Witter, G. UK and Global Wine Markets by 2025, and Implications of Brexit. J. Wine Econ. 2017, 12, 221–251. [Google Scholar] [CrossRef] [Green Version]
- Gustavsen, G.W.; Rickertsen, K. Wine Consumption in Norway: An Age-Period-Cohort Analysis. J. Wine Econ. 2018, 13, 41–56. [Google Scholar] [CrossRef] [Green Version]
- Leifman, H. Homogenisation in alcohol consumption in the European Union. Nord. Stud. Alcohol Drugs 2017, 18, 15–30. [Google Scholar] [CrossRef]
- Gual, A.; Colom, J. Why has alcohol consumption declined in countries of southern Europe? Addiction 1997, 92, S21–S31. [Google Scholar] [CrossRef]
- Aizenman, J.; Brooks, E. Globalization and Taste Convergence: The Cases of Wine and Beer. Rev. Int. Econ. 2007, 16, 217–233. [Google Scholar] [CrossRef]
- Smith, D.E.; Mitry, D.J. Cultural Convergence: Consumer Behavioral Changes in the European Wine Market. J. Wine Res. 2007, 18, 107–112. [Google Scholar] [CrossRef]
- OIV. State of the world vine and wine sector 2021. In Proceedings of the Pau Roca Director General of the OIV OIV Press Conference, Online, 27 April 2022. [Google Scholar]
- Holland, T.; Smit, B. Climate Change and the Wine Industry: Current Research Themes and New Directions. J. Wine Res. 2010, 21, 125–136. [Google Scholar] [CrossRef]
- Li, Y.; Bardají, I. A new wine superpower? An analysis of the Chinese wine industry. Cah. Agric. 2017, 26, 65002. [Google Scholar] [CrossRef] [Green Version]
- Puga, G.; Anderson, K.; Jones, G.; Tchatoka, F.; Umberger, W. A climatic classification of the world’s wine regions. OENO One 2022, 56, 165–177. [Google Scholar] [CrossRef]
- Ollat, N.; Touzard, J.-M.; van Leeuwen, C. Climate Change Impacts and Adaptations: New Challenges for the Wine Industry*. J. Wine Econ. 2016, 11, 139–149. [Google Scholar] [CrossRef]
- Candiago, S.; Winkler, K.J.; Giombini, V.; Giupponi, C.; Egarter Vigl, L. An ecosystem service approach to the study of vineyard landscapes in the context of climate change: A review. Sustain. Sci. 2022, 1, 1–17. [Google Scholar] [CrossRef]
- Van Leeuwen, C.; Destrac-Irvine, A.; Dubernet, M.; Duchêne, E.; Gowdy, M.; Marguerit, E.; Pieri, P.; Parker, A.; De Rességuier, L.; Ollat, N. An Update on the Impact of Climate Change in Viticulture and Potential Adaptations. Agronomy 2019, 9, 514. [Google Scholar] [CrossRef] [Green Version]
- Anderson, K. The New World in Globalizing Wine Markets: Lessons from Australia; Working Paper No. 0910; University of Adelaide, Wine Economics Research Centre: Adelaide, Australia, 2010. [Google Scholar]
- Ashenfelter, O.; Storchmann, K. Climate Change and Wine: A Review of the Economic Implications*. J. Wine Econ. 2016, 11, 105–138. [Google Scholar] [CrossRef]
- Anderson, K.; Nelgen, S. Global Wine Markets, 1961 to 2009: A Statistical Compendium; University of Adelaide Press: Adelaide, Australia, 2011; p. 468. [Google Scholar] [CrossRef] [Green Version]
- Labys, W.C.; Cohen, B.C. Trends versus cycles in global wine export shares. Aust. J. Agric. Resour. Econ. 2006, 50, 527–537. [Google Scholar] [CrossRef]
- Anderson, K.; Wittwer, G. Modeling Global Wine Markets to 2018: Exchange Rates, Taste Changes, and China’s Import Growth*. J. Wine Econ. 2013, 8, 131–158. [Google Scholar] [CrossRef] [Green Version]
- Ameur, H.B.; Ftiti, Z.; Fur, E.L. What can we learn from the analysis of the fine wines market efficiency? Int. J. Financ. Econ. 2022, 1–6. [Google Scholar] [CrossRef]
- Wickham, H. ggplot2: Elegant Graphics for Data Analysis; Springer: Berlin/Heidelberg, Germany, 2009. [Google Scholar] [CrossRef]
- Wickham, H.; François, R.; Henry, L.; Müller, K. dplyr: A Grammar of Data Manipulation, R package version 1.0.8; 2022. Available online: https://cran.r-project.org/web/packages/dplyr/index.html (accessed on 23 October 2022).
- Mann, H.B. Nonparametric Tests Against Trend. Econometrica 1945, 13, 245. [Google Scholar] [CrossRef]
- Firdaus, R.B.R.; Leong Tan, M.; Rahmat, S.R.; Senevi Gunaratne, M. Paddy, rice and food security in Malaysia: A review of climate change impacts. Cogent Soc. Sci. 2020, 6, 1818373. [Google Scholar] [CrossRef]
- Noy, K.; Ohana-Levi, N.; Panov, N.; Silver, M.; Karnieli, A. A long-term spatiotemporal analysis of biocrusts across a diverse arid environment: The case of the Israeli-Egyptian sandfield. Sci. Total Environ. 2021, 774, 145154. [Google Scholar] [CrossRef]
- Ashraf, M.S.; Ahmad, I.; Khan, N.M.; Zhang, F.; Bilal, A.; Guo, J. Streamflow Variations in Monthly, Seasonal, Annual and Extreme Values Using Mann-Kendall, Spearmen’s Rho and Innovative Trend Analysis. Water Resour. Manag. 2021, 35, 243–261. [Google Scholar] [CrossRef]
- Atta-ur-Rahman; Dawood, M. Spatio-statistical analysis of temperature fluctuation using Mann–Kendall and Sen’s slope approach. Clim. Dyn. 2017, 48, 783–797. [Google Scholar] [CrossRef]
- Baig, M.R.I.; Shahfahad; Naikoo, M.W.; Ansari, A.H.; Ahmad, S.; Rahman, A. Spatio-temporal analysis of precipitation pattern and trend using standardized precipitation index and Mann–Kendall test in coastal Andhra Pradesh. Model. Earth Syst. Environ. 2022, 8, 2733–2752. [Google Scholar] [CrossRef]
- Wang, D.; Li, R.; Gao, G.; Jiakula, N.; Toktarbek, S.; Li, S.; Ma, P.; Feng, Y. Impact of Climate Change on Food Security in Kazakhstan. Agriculture 2022, 12, 1087. [Google Scholar] [CrossRef]
- Pohlert, T. Trend: Non-Parametric Trend Tests and Change-Point Detection, R package version 1.1.4; 2020. Available online: https://cran.r-project.org/web/packages/trend/index.html (accessed on 23 October 2022).
- Karnieli, A.; Ohana-Levi, N.; Silver, M.; Paz-Kagan, T.; Panov, N.; Varghese, D.; Chrysoulakis, N.; Provenzale, A. Spatial and seasonal patterns in vegetation growth-limiting factors over Europe. Remote Sens. 2019, 11, 2406. [Google Scholar] [CrossRef] [Green Version]
- Granger, C.W.J. Investigating Causal Relations by Econometric Models and Cross-spectral Methods. Econometrica 1969, 37, 424. [Google Scholar] [CrossRef]
- Diks, C.; Panchenko, V. A new statistic and practical guidelines for nonparametric Granger causality testing. J. Econ. Dyn. Control 2006, 30, 1647–1669. [Google Scholar] [CrossRef] [Green Version]
- Zeileis, A.; Hothorn, T. Diagnostic Checking in Regression Relationships. R News 2002, 2, 7–10. [Google Scholar]
- Cipriani, F.; Prina, F. The Research Outcome: Summary and Conclusions on the Reduction in Wine Consumption in Italy. Contemp. Drug Probl. 2007, 34, 361–378. [Google Scholar] [CrossRef]
- García-Cortijo, M.C.; Villanueva, E.C.; Castillo-Valero, J.S.; Li, Y. Wine consumption in China: Profiling the 21st century Chinese wine consumer. Ciência E Técnica Vitivinícola 2019, 34, 71–83. [Google Scholar] [CrossRef]
- Camillo, A.A. A strategic investigation of the determinants of wine consumption in China. Int. J. Wine Bus. Res. 2012, 24, 68–92. [Google Scholar] [CrossRef]
- Summer, D.A.; Bombrun, H.; Alston, J.M.; Heien, D. An Economic Survey of the Wine and Winegrape Industry in the United States and Canada; University of California: Davis, CA, USA, 2001. [Google Scholar]
- Anderson, K.; Norman, D.; Wittwer, G. Globalisation of the world’s wine markets. World Sci. Stud. Int. Econ. 2003, 26, 659–687. [Google Scholar] [CrossRef]
- Dal Bianco, A.; Caracciolo, F. Cultural convergences in world wine consumption. Rev. Fac. Ciencias Agrar. Univ. Nac. Cuyo 2013, 45, 210–220. [Google Scholar]
- Folwell, R.J.; Volanti, M. The Changing Market Structure of the USA Wine Industry. J. Wine Res. 2010, 14, 25–30. [Google Scholar] [CrossRef]
- Esterhuizen, D.; Van Rooyen, C.J. An inquiry into factors impacting on the competitiveness of the South African wine industry. Agrekon 2010, 45, 467–485. [Google Scholar] [CrossRef] [Green Version]
- Riera, F.S.; Brümmer, B. Environmental efficiency of wine grape production in Mendoza, Argentina. Agric. Water Manag. 2022, 262, 107376. [Google Scholar] [CrossRef]
- Castex, V.; Tejeda, E.M.; Beniston, M. Water availability, use and governance in the wine producing region of Mendoza, Argentina. Environ. Sci. Policy 2015, 48, 1–8. [Google Scholar] [CrossRef] [Green Version]
- Cardell, M.F.; Amengual, A.; Romero, R. Future effects of climate change on the suitability of wine grape production across Europe. Reg. Environ. Chang. 2019, 19, 2299–2310. [Google Scholar] [CrossRef]
- Ugaglia, A.A.; Cardebat, J.-M.; Jiao, L. The French Wine Industry. In The Palgrave Handbook of Wine Industry Economics; Ugaglia, A.A., Cardebat, J.M., Corsi, A., Eds.; Palgrave Macmillan: Cham, Switzerland, 2019; pp. 17–46. [Google Scholar] [CrossRef]
- Duncan, A.; Greenaway, D. The Economics of Wine—Introduction. Econ. J. 2008, 118, F137–F141. [Google Scholar] [CrossRef]
- Di Giacomo, G.; Romano, P. Advanced fractionation process for wine-based products diversification. J. Food Sci. Technol. 2021, 58, 4685–4692. [Google Scholar] [CrossRef]
- Cholette, S.; Castaldi, R.M.; Fredrick, A. The Globalization of the Wine Industry: Implications for Old and New World Producers; San Francisco State University: San Francisco, CA, USA, 2005. [Google Scholar]
- Hussain, M.; Cholette, S.; Castaldi, R.M. An Analysis of Globalization Forces in the Wine Industry. J. Glob. Mark. 2008, 21, 33–47. [Google Scholar] [CrossRef]
- Lembke, S.; Cartier, L. Wine consumers in British Columbia, Canada: Towards understanding how Millennials differ from previous generations. Int. J. Wine Bus. Res. 2020, 32, 441–455. [Google Scholar] [CrossRef]
- Madill, J.; Riding, A.; Haines, G. Strategic dilemmas of a small market player: The Canadian wine industry. In Proceedings of the International Colloquium in Wine Marketing, Adelaide, Australia, 26–27 July 2003. [Google Scholar]
- Cox, J.; Bridwell, L. Australian companies using globalization to disrupt the ancient wine industry. Compet. Rev. 2007, 17, 209–221. [Google Scholar] [CrossRef]
- Luszczynska, A. Georgian wine market with particular emphasis on foreign trade. Agric. For. 2015, 61, 217–221. [Google Scholar] [CrossRef] [Green Version]
- Landazuri-Tveteraas, U.; Asche, F.; Straume, H.M. Dynamics of Buyer-Seller Relations in Norwegian Wine Imports. J. Wine Econ. 2021, 16, 68–85. [Google Scholar] [CrossRef]
- Cardebat, J.M.; Figuet, J.M. The Impact of Exchange Rates on French Wine Exports. J. Wine Econ. 2019, 14, 71–89. [Google Scholar] [CrossRef]
- Witter, G. The Global Wine Market in the Decade to 2015 with a Focus on Australia and Chile; General Working Paper No. G-166; Centre of Policy Studies, Monash University: Clayton, Victoria, Australia, 2007. [Google Scholar]
- Ponte, S.; Ewert, J. Which Way is “Up” in Upgrading? Trajectories of Change in the Value Chain for South African Wine. World Dev. 2009, 37, 1637–1650. [Google Scholar] [CrossRef]
- Oczkowski, E. Modelling the Demand and Supply Determinants of Australian Wine Grapes. Econ. Pap. A J. Appl. Econ. Policy 2014, 33, 1–12. [Google Scholar] [CrossRef]
Figure 1.
Long-term records of wine industry factors, consisting of four countries from each continent with the highest quantities in 2021 for wine consumption (a); wine consumption per capita (b); and wine production (c). Global trend lines of wine consumption and production are shown in panel (d). Countries located in Europe, Africa, America, Oceania, and Asia are denoted by scales of purple, green, maroon, golden-brown, and blue, respectively.

Figure 2.
Wine consumption representation for each country, including mean long-term quantities (a); and Z-score for each country, signifying the extent of the temporal trend over 27 years (b). Countries in grey represent no data.
Figure 2.
Wine consumption representation for each country, including mean long-term quantities (a); and Z-score for each country, signifying the extent of the temporal trend over 27 years (b). Countries in grey represent no data.

Figure 3.
Wine consumption per capita representation for each country, including mean long-term quantities (a); and Z-score for each country, signifying the extent of the temporal trend over 27 years (b). Countries in grey represent no data.
Figure 3.
Wine consumption per capita representation for each country, including mean long-term quantities (a); and Z-score for each country, signifying the extent of the temporal trend over 27 years (b). Countries in grey represent no data.

Figure 4.
Wine production representation for each country, including mean long-term quantities (a); and Z-score for each country, signifying the extent of the temporal trend over 27 years (b). Countries in grey represent no data.
Figure 4.
Wine production representation for each country, including mean long-term quantities (a); and Z-score for each country, signifying the extent of the temporal trend over 27 years (b). Countries in grey represent no data.

Figure 5.
Wine import representation for each country, including mean long-term quantities (a); and Z-score for each country, signifying the extent of the temporal trend over 27 years (b). Countries in grey represent no data.
Figure 5.
Wine import representation for each country, including mean long-term quantities (a); and Z-score for each country, signifying the extent of the temporal trend over 27 years (b). Countries in grey represent no data.

Figure 6.
Wine export representation for each country, including mean long-term quantities (a); and Z-score for each country, signifying the extent of the temporal trend over 27 years (b). Countries in grey represent no data.
Figure 6.
Wine export representation for each country, including mean long-term quantities (a); and Z-score for each country, signifying the extent of the temporal trend over 27 years (b). Countries in grey represent no data.

Figure 7.
Pearson correlation coefficients between wine industry factors for each country, including correlations between production and consumption (a); production and consumption per capita (b); consumption and imports (c); and production and exports (d).
Figure 7.
Pearson correlation coefficients between wine industry factors for each country, including correlations between production and consumption (a); production and consumption per capita (b); consumption and imports (c); and production and exports (d).

Figure 8.
Correlation matrices exploring the relationships among the mean wine industry variables (a); and mean wine industry Z-scored variables (b).
Figure 8.
Correlation matrices exploring the relationships among the mean wine industry variables (a); and mean wine industry Z-scored variables (b).

Table 1.
Granger causality test results for bivariate global time series, with results for lags of 2–5. Results marked in bold denote significant relationship (α = 0.05) among the factors (driving and response wine industry factors).
Table 1.
Granger causality test results for bivariate global time series, with results for lags of 2–5. Results marked in bold denote significant relationship (α = 0.05) among the factors (driving and response wine industry factors).
| Driving Factor | Response of Wine Industry Factor | Granger Causality Lag 2 | Granger Causality Lag 3 | Granger Causality Lag 4 | Granger Causality Lag 5 |
|---|---|---|---|---|---|
| Consumption | Production | F = 1.52 (p = 0.24) | F = 1.55 (p = 0.24) | F = 10.03 (p < 0.001) | F = 8.89 (p < 0.001) |
| Consumption per capita | Production | F = 1.04 (p = 0.37) | F = 1. 41 (p = 0.28) | F = 5.98 (p = 0.006) | F = 4.52 (p = 0.02) |
| Exports | Production | F = 0.37 (p = 0.73) | F = 0.71 (p = 0.56) | F = 2.81 (p = 0.067) | F = 1.72 (p = 0.21) |
| Imports | Production | F = 1.43 (p = 0.26) | F= 1.84 (p = 0.18) | F = 3.76 (p = 0.028) | F = 2.64 (p = 0.08) |
| Consumption | Imports | F = 0.17 (p = 0.85) | F = 1.39 (p = 0.28) | F = 1.24 (p = 0.34) | F = 0.37 (p = 0.86) |
| Consumption | Surface area | F = 2.07 (p = 0.15) | F = 4.93 (p = 0.01) | F = 5.87 (p = 0.005) | F = 1.69 (p = 0.22) |
| Consumption per capita | Surface area | F = 2.95 (p = 0.076) | F = 1.98 (p = 0.16) | F = 2.26 (p = 0.11) | F = 1.11 (p = 0.41) |
Disclaimer/Publisher’s Note: The statements, opinions and data contained in all publications are solely those of the individual author(s) and contributor(s) and not of MDPI and/or the editor(s). MDPI and/or the editor(s) disclaim responsibility for any injury to people or property resulting from any ideas, methods, instructions or products referred to in the content. |
© 2023 by the authors. Licensee MDPI, Basel, Switzerland. This article is an open access article distributed under the terms and conditions of the Creative Commons Attribution (CC BY) license (https://creativecommons.org/licenses/by/4.0/).
Share and Cite
MDPI and ACS Style
Ohana-Levi, N.; Netzer, Y. Long-Term Trends of Global Wine Market. Agriculture 2023, 13, 224. https://doi.org/10.3390/agriculture13010224
AMA Style
Ohana-Levi N, Netzer Y. Long-Term Trends of Global Wine Market. Agriculture. 2023; 13(1):224. https://doi.org/10.3390/agriculture13010224
Chicago/Turabian StyleOhana-Levi, Noa, and Yishai Netzer. 2023. "Long-Term Trends of Global Wine Market" Agriculture 13, no. 1: 224. https://doi.org/10.3390/agriculture13010224
Note that from the first issue of 2016, this journal uses article numbers instead of page numbers. See further details here.