Article

A Real-Time Sorting Robot System for Panax Notoginseng Taproots Equipped with an Improved Deeplabv3+ Model

1
Faculty of Modern Agricultural Engineering, Kunming University of Science and Technology, Kunming 650500, China
2
Yunnan Key Laboratory of Sustainable Utilization of Panax Notoginseng, Kunming University of Science and Technology, Kunming 650500, China
3
Yixintang Pharmaceutical Group Ltd., Kunming 650500, China
*
Author to whom correspondence should be addressed.
Agriculture 2022, 12(8), 1271; https://doi.org/10.3390/agriculture12081271
Submission received: 7 July 2022 / Revised: 7 August 2022 / Accepted: 18 August 2022 / Published: 20 August 2022
(This article belongs to the Special Issue Internet of Things (IoT) for Precision Agriculture Practices)

Abstract

:
The classification of the taproots of Panax notoginseng is conducive to improving the economic added value of its products. In this study, a real-time sorting robot system for Panax notoginseng taproots was developed based on the improved DeepLabv3+ model. The system is equipped with the improved DeepLabv3+ classification model for different grades of Panax notoginseng taproots. The model uses Xception as the taproot feature extraction network of Panax notoginseng. In the residual structure of the Xception network, a group normalization layer with deep separable convolution is adopted. Meanwhile, the global maximum pooling method is added in the Atrous Spatial Pyramid Pooling (ASPP) part to retain more texture information, and multiple shallow effective feature layers are designed to overlap in the decoding part to minimize the loss of features and improve the segmentation accuracy of Panax notoginseng taproots of all grades. The model test results show that the Xception-DeepLabv3+ model performs better than VGG16-U-Net and ResNet50-PSPNet models, with a Mean Pixel Accuracy (MPA) and a Mean Intersection over Union (MIoU) of 78.98% and 88.98% on the test set, respectively. The improved I-Xce-DeepLabv3+ model achieves an average detection time of 0.22 s, an MPA of 85.72%, and an MIoU of 90.32%, and it outperforms Xce-U-Net, Xce-PSPNet, and Xce-DeepLabv3+ models. The system control software was developed as a multi-threaded system to design a system grading strategy, which solves the problem that the identification signal is not synchronized with the grading signal. The system test results show that the average sorting accuracy of the system is 77% and the average false detection rate is 21.97% when the conveyor belt running speed is 1.55 m/s. The separation efficiency for a single-channel system is 200–300 kg/h, which can replace the manual work of three workers. The proposed method meets the requirements of current Panax notoginseng processing enterprises and provides technical support for the intelligent separation of Panax notoginseng taproots.

1. Introduction

Panax notoginseng is one of the most representative Chinese herbal medicines in Yunnan [1]. In 2019, the planting area of Panax notoginseng in Yunnan Province reached 500,000 acres, the output reached 45,000 tons, and the sales revenue reached RMB 12 billion. The number of heads of Panax notoginseng refers to the number of taproots of Panax notoginseng per 500 g, which is the main basis for classifying Panax notoginseng in the market [2]. Quickly and accurately sorting Panax notoginseng taproots is beneficial to maximizing the economic benefit of Panax notoginseng taproots. As the taproot of Panax notoginseng is extremely irregular, and the distinction among different grades is not obvious, it is quite difficult to classify Panax notoginseng only by morphological characteristics.
The sorting of taproot of Panax notoginseng is realized by the sorting model and the sorting system. The sorting model is mainly used to identify and grade the taproot of Panax notoginseng. The Panax notoginseng sorting system receives the results obtained from the sorting model and carries out sequential sorting through the sorting strategy.
(1) There are more and more cases of solving practical problems in agricultural production through deep learning models [3,4,5], such as non-destructive testing of crops [6,7,8], monitoring of crop growth information [9,10,11], and testing, grading, and picking of fruits and vegetables [12,13,14,15]. Panax notoginseng sorting model is the core of the notoginseng sorting system, which determines the efficiency and accuracy of the system. In recent years, semantic segmentation methods have achieved great progress in image segmentation [16,17,18,19]. Liu et al. proposed a fuzzy detection and segmentation method for green fruits based on a full convolution single stage (FCOS) target detection model. The accuracy of green fruit detection and segmentation in the apple dataset is 81% and 85%, respectively [20]. Su et al. proposed a new data enhancement framework based on random image clipping and patching. The proposed framework can effectively improve the segmentation accuracy and performance on two datasets from different farms [21]. Kang et al. designed an attention-based semantic segmentation model of cotton root in situ images. Compared with the DeepLabv3+ model, U-NET model and SegNet model, the proposed model has higher segmentation accuracy and computational efficiency, with an accuracy of 99% [22]. Sun et al. proposed a segmentation model of apple, peach, and pear flowers in different environments. This model can effectively improve the segmentation effect of the semantic segmentation network. The pixel-level score on the apple dataset is up to 89%, and the score on the peach, pear, and apple datasets is 80% [23]. Moreover, the model achieves high detection accuracy for existing agricultural materials. To sum up, it is feasible to apply a semantic segmentation network in the taproot sorting of Panax notoginseng. According to the experiments conducted in this study, due to the extremely irregular taproots of each grade of Panax notoginseng, the Mean Pixel Accuracy (MPA) of the existing models is between 60 and 80%, and the segmentation efficiency is low. Therefore, the existing model should be improved to meet the requirements of taproot sorting of Panax notoginseng.
(2) At present, most of the research on the identification and sorting of agricultural products only establishes sorting models, but the models are not applied to actual processing and production. Meanwhile, only a small number of studies have achieved online sorting of agricultural products, such as apples [24], garlic [25], and carrots [26]. Baigvan et al. developed a machine vision sorting system for figs based on the LabVIEW platform, which achieves a sorting speed of 90 kg/h and a sorting accuracy of 95% [27]. Sofu et al. developed an automatic sorting system for real-time online detection of apple weighing, with a detection speed of 15 apples per second and detection accuracy of 73–96% under dual channels [28]. Wu et al. established a visual system for sorting tea based on a multi-target recognition model of region segmentation and convolutional neural network. The accuracy of the system is above 90%, and the working efficiency is equivalent to about four manual workers [29]. Dang Quoc Thuyet et al. developed a robotic system for autonomous classification and sorting of root removed garlic based on a deep convolutional neural network using vision technology and Arduino control board, with an overall classification accuracy of 89% [30]. The previous research provides the design idea for the development of the Panax notoginseng sorting system. In this study, the Notoginseng sorting model is applied to the notoginseng sorting system. Meanwhile, the python language is used to develop an integrated identification and control program for the system to avoid the problem of hierarchical asynchronism caused by multiple control cores of the system and improve the efficiency of the system. The system can realize real-time automatic sorting of the primary root of Panax notoginseng.
The sorting robot system based on machine vision for Panax notoginseng taproot has not yet been researched. To meet the requirements of efficient sorting of different grades of Panax notoginseng, this paper developed a real-time sorting robot system based on the improved DeepLabv3+ model. (1) By improving the Xception backbone feature extraction network and ASPP structure in the DeepLabv3+ model, the segmentation accuracy and detection speed of Panax notoginseng taproots were improved to meet the requirements of system sorting. The performance and precision of the improved model were verified by comparing it with other semantic segmentation methods. (2) To synchronize the identification and hierarchical signals, a multi-threaded control software was written in Python. Accurate positioning and sorting of Panax notoginseng taproot were realized by real-time calculation of the delay time. The rest of this paper is organized as follows: Section 2 describes the collection and production of a Panax notoginseng dataset and the improvement of the DeepLabv3+ model; Section 3 compares the experimental results of the improved model with other semantic segmentation networks. Section 4 describes the design of each part of the system and the comprehensive test. Section 5 describes the conclusions of this work.

2. Materials and Methods

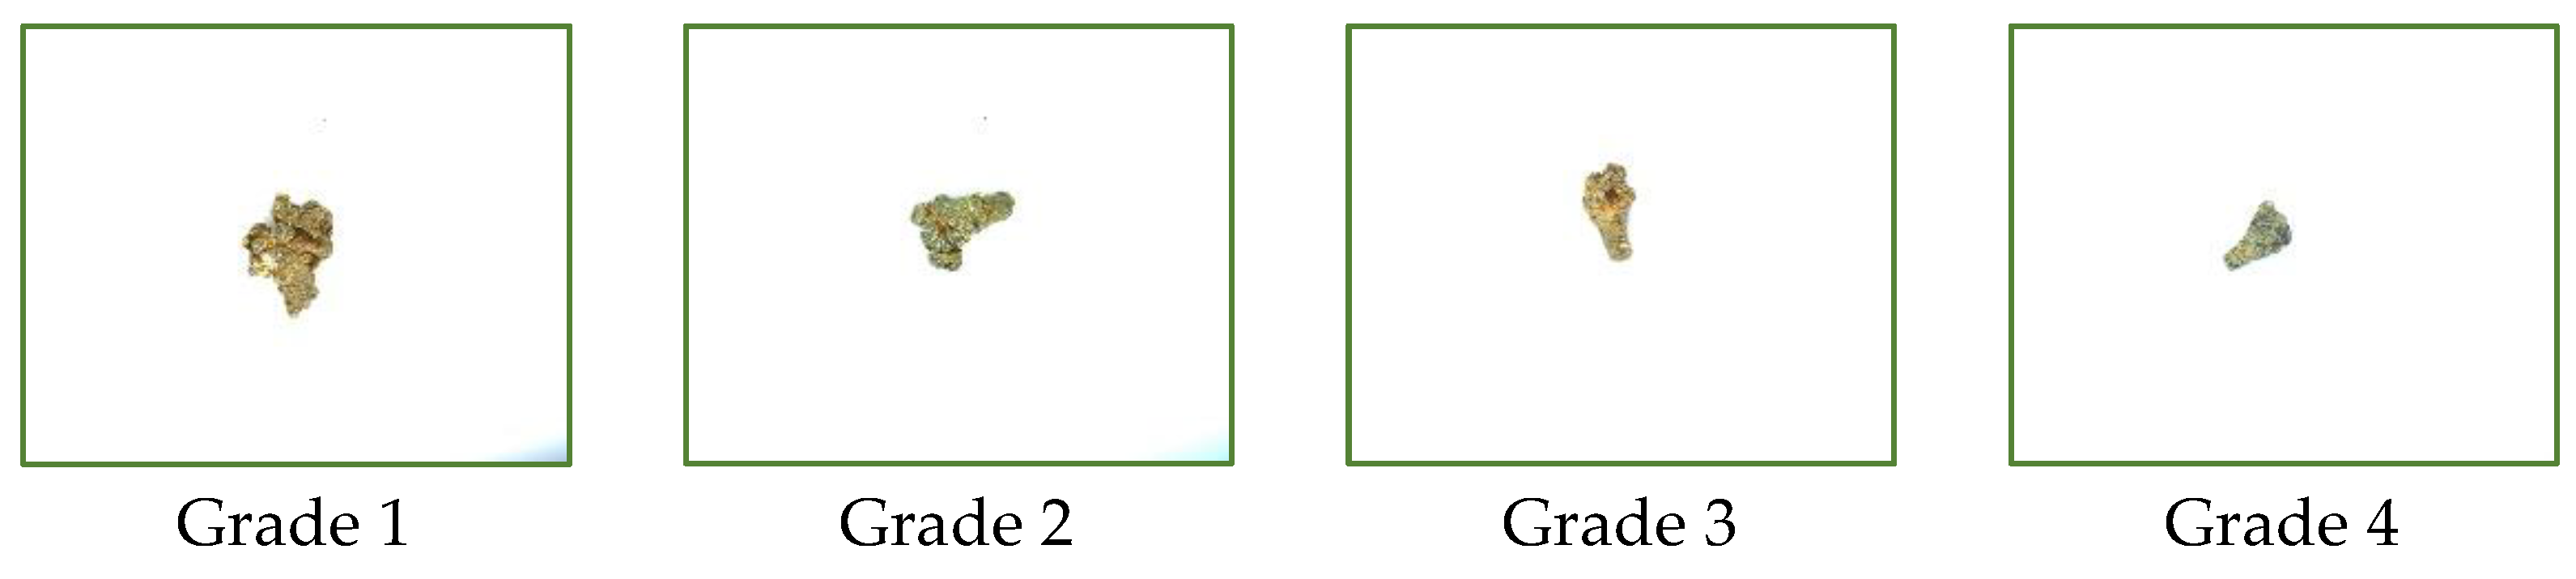
2.1. Image Data Acquisition

In this study, Panax notoginseng in Wenshan Prefecture, Yunnan Province, was used as the experimental object. Panax notoginseng images were collected from the real-time sorting robot system of Panax notoginseng taproots. The simple structure of the sorting robot system is shown in Figure 1. The camera model is a Hikvision industrial camera (MV-CA030-20GC, 1.3 megapixel, Gigabit Ethernet industrial area scan camera, resolution 1280 × 1024). The camera is 35 cm away from the horizontal photo-taking plane. The light source model is JR-LR-400 × 30W, with a power of 16 W and a height of 16.1 cm from the conveyor belt plane. The surface brightness of the material is about 2.3 × 10⁴ Lux. In this experiment, the real-time sorting robot system was used to collect 450 images of Panax notoginseng taproots of 20, 30, 40, and 60 heads, respectively (hereinafter referred to as grade 1, grade 2, grade 3, and grade 4), and there were 1800 images in total. The original image format is JPEG. The images of the four grades of Panax notoginseng taproot are shown in Figure 2.

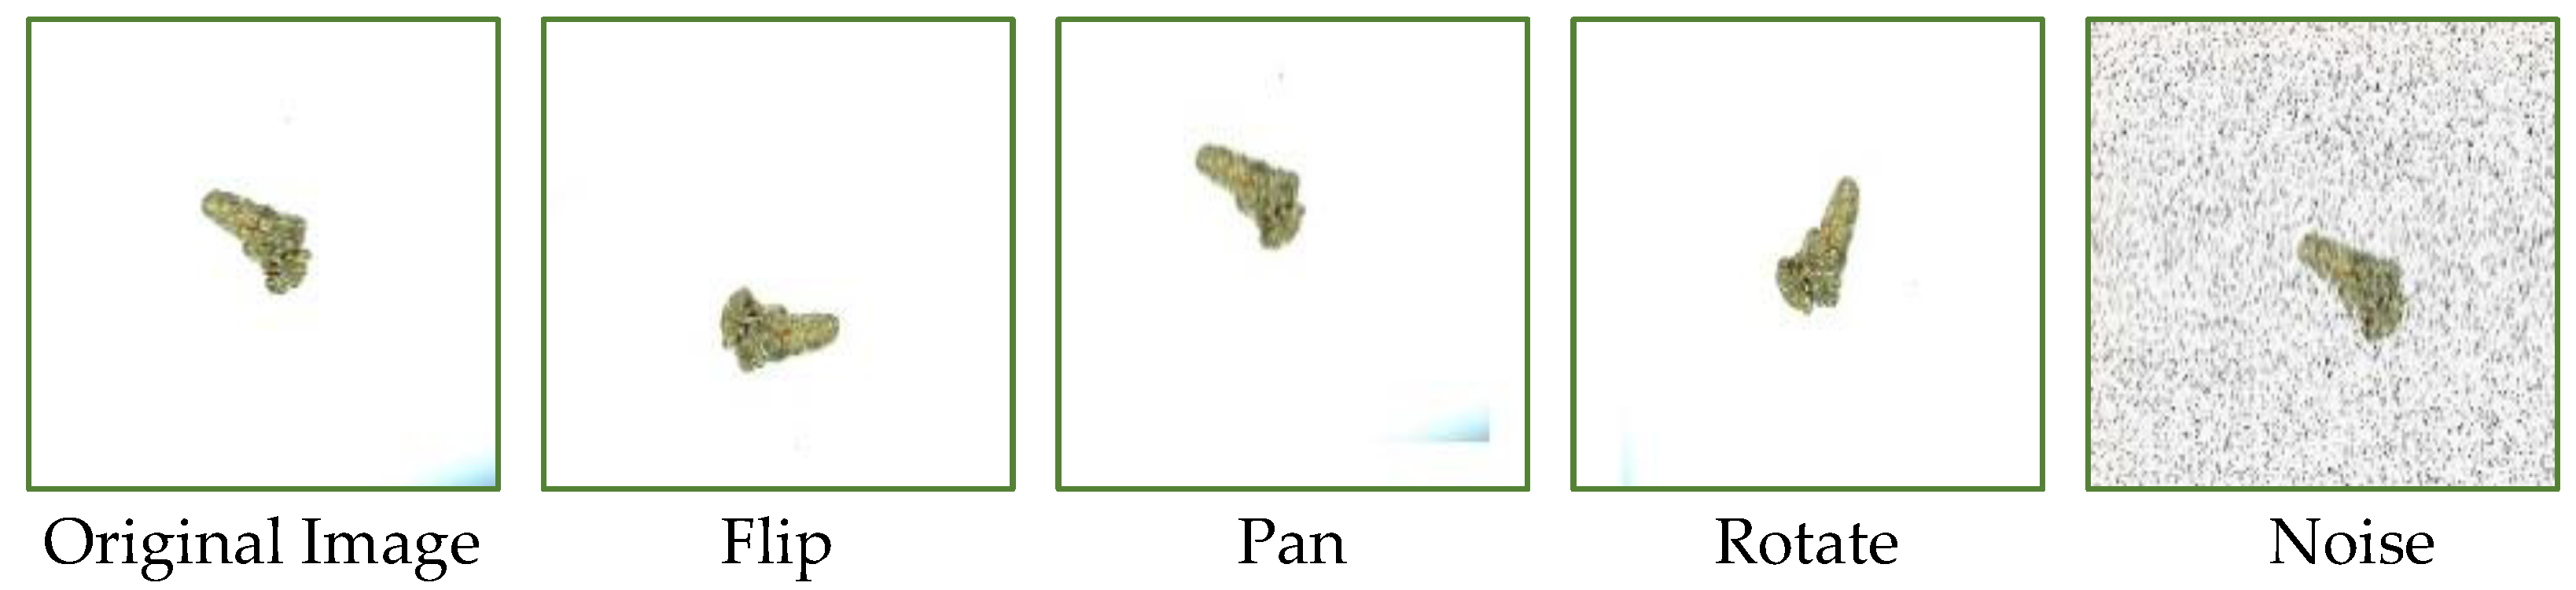
2.2. Image Data Enhancement and Dataset Establishment

First, each type of sample in the dataset was divided into a training set and a test set at the ratio of 4:1. To further increase the diversity of samples and prevent overfitting during training, the dataset was expanded to 6000 images through image enhancement (see Figure 3). Image enhancement can expand the number of images by flipping, translating, rotating, and adding noise. Specifically, flipping is to adjust the image vertically and horizontally; translation is to shift the width of the image by 100 pixels to the right and the height by 100 pixels; rotation is to randomly rotate the image in the directions of 60°, −60°, 45°, −45°, 90°, −90°, 210°, 240°, −210°, and −240°; adding noise is to add Gaussian noise and salt and pepper noise to the image. Then, the semantic segmentation tool Lableme was used to mark the training images, the dataset name, point coordinate information, label name, and other information of the circled marked objects were written into the json file, and the PASCAL VOC dataset was established.

2.3. Panax Notoginseng Quick Identification and Sorting Method

2.3.1. Introduction to Semantic Segmentation Models

U-Net was a relatively early fully convolutional neural network used in semantic segmentation [31]. It is divided into upsampling and downsampling stages. There was no pooling layer in the network structure, only convolutional layers and fully connected layers. Deep and shallow features solve pixel localization and classification problems.
The PSPNet network model mainly adopts an average pooling layer with different step sizes and different pooling sizes, and then fully connects the pooled results, thereby increasing the receptive field of the segmentation layer and merging deep information with shallow information [32]. Finally, the fused feature layer with overall information is obtained.
The DeepLabv3+ network was the most commonly used network in semantic segmentation due to its high segmentation accuracy and superior performance [33]. It consists of an encoder and a decoder. The encoder consists of a backbone feature extraction network and an ASPP module. The decoding part mainly extracts the shallow features of the backbone feature network, and then fuses the extracted shallow features with high-level semantic features to improve the accuracy of the segmentation model.

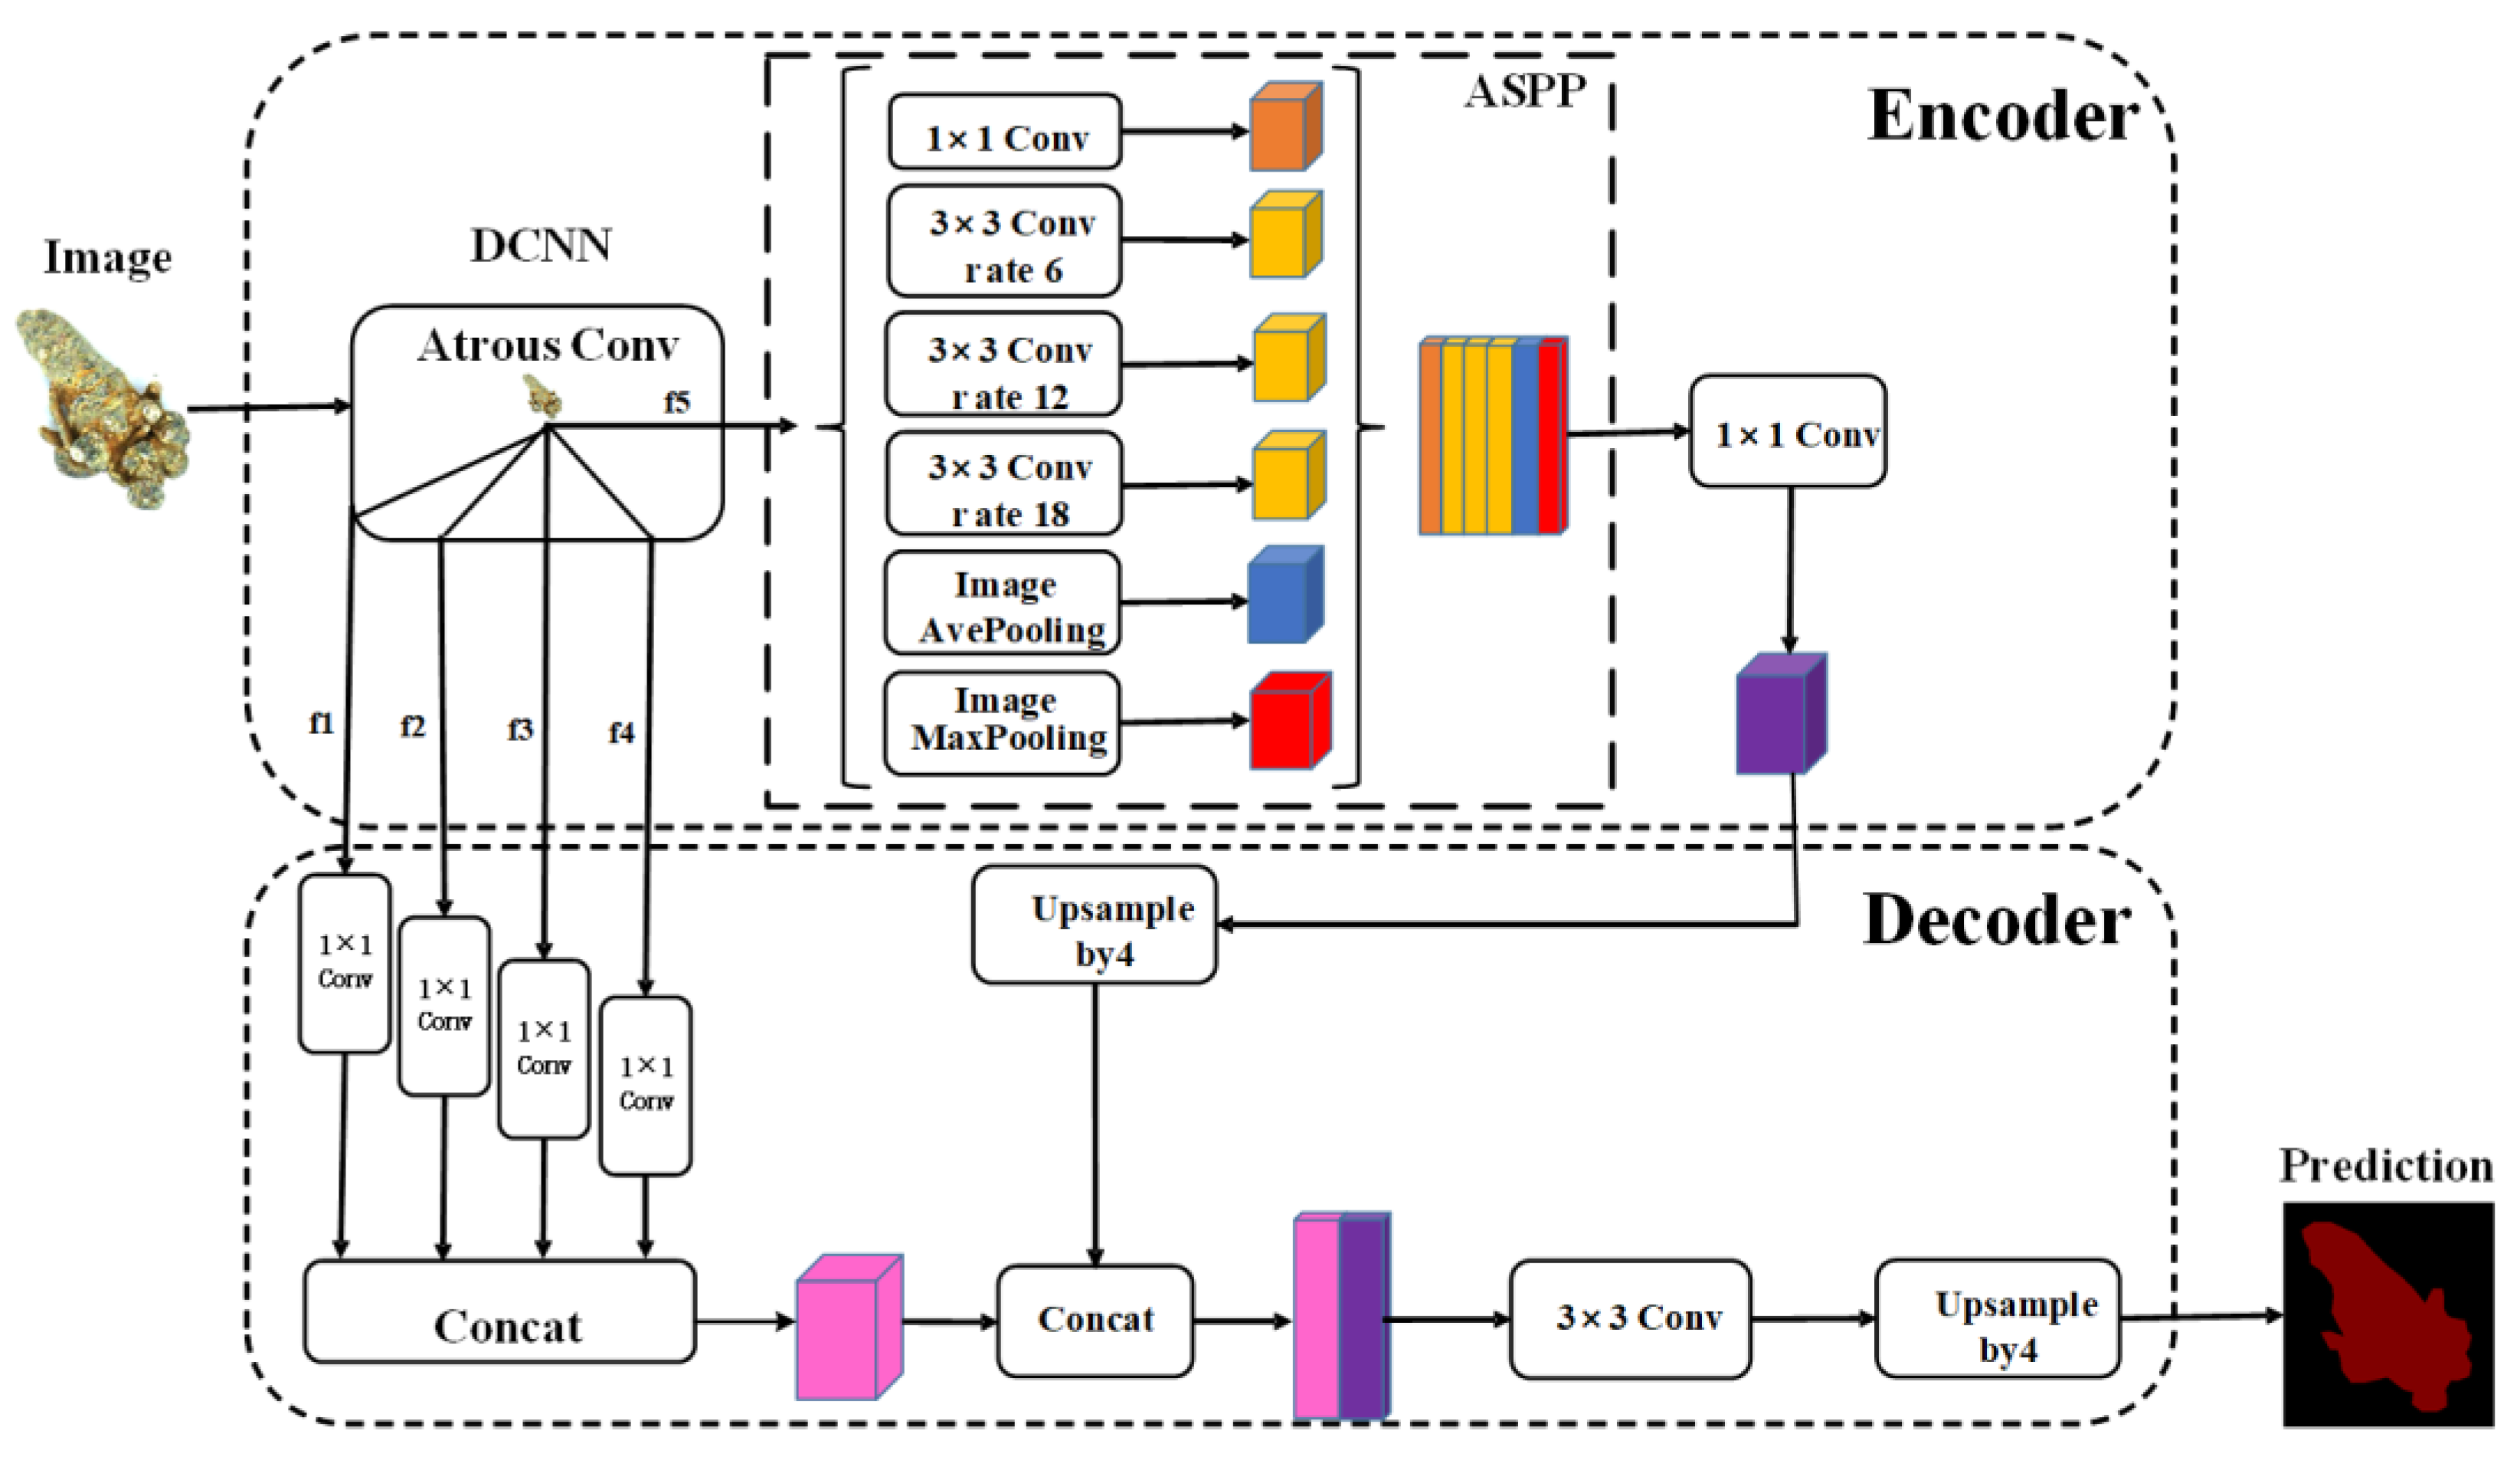
2.3.2. Improved Panax Notoginseng Taproot DeepLabv3+ Grading Model

In this study, DeepLabv3+ was used as the segmentation model of the taproots of Panax notoginseng at different grades, and Xception was used as the backbone feature extraction network. Due to the small difference in the images of the taproots of Panax notoginseng between different grades, it is difficult for the model to identify the taproots of Panax notoginseng of different grades. To improve the classification accuracy of the model for different grades of Panax notoginseng taproots, this study made improvements based on the DeepLabv3+ model.
It can be seen from Figure 4 that the improved network I-Xce-DeepLabv3+ involves the following considerations: (1) To speed up the convergence of the Panax notoginseng taproot classification model and alleviate the problem of gradient dispersion in the deep network, group normalization is used to preprocess the data in Xception. Meanwhile, the mean value and variance are calculated in each group. (2) Since the size difference of the taproots of Panax notoginseng of different grades is not obvious, and the texture difference is difficult to distinguish with the naked eye, this study was conducted on the original ASPP structure to reduce the difference in segmenting the taproots region of Panax notoginseng of different grades and improve the classification efficiency. In Figure 4, f5 is the image after downsampling five times using the backbone feature extraction network. In ASPP, the context information of f5 is effectively and comprehensively extracted through six parallel sampling steps. The parallel sampling steps are as follows: first, through ordinary convolution with a convolution kernel of 1 × 1 and a stride of 1, the output channel number is 256 images because the ordinary downsampling method leads to a decrease in resolution and loss of local information; then, the dilated convolution with an expansion rate of (6, 12, 18), a convolution kernel of 3 × 3, and a stride of 1 × 1 improves the network receptive field and makes the captured input picture information more comprehensive. However, with the increase in the sampling rate, the effective weight of the filter will gradually become smaller, and the filter cannot capture the context information well. Therefore, through global average pooling and preservation of image background information, the output channel number is 320 images. The difference between the seven taproot textures is difficult to distinguish with the naked eye. Through the global maximum pooling, more texture information of the image is preserved. Finally, the contents of the six branches are superimposed. Compared with the original ASPP, the improved ASPP is more comprehensive and effective and collects more contextual information from the input image. (3) To enrich the image information extracted by the network and make the segmentation more accurate. In this study, the shallow feature layers of f1, f2, f3, and f4 extracted from the backbone feature network were convolved with 1 × 1, and the channels were adjusted and stacked. Then, it was stacked with the output of the improved ASPP module and connected with the shallow feature layer after up-sampling by a 1 × 1 convolution adjustment channel.

2.3.3. Focal Loss Function

Due to the small difference between the adjacent grade Panax notoginseng taproots, the adjacent Panax notoginseng taproots will misrecognize others during model segmentation. As a loss function, cross-entropy can measure the difference degree of two different probability distributions in the same random variable. In machine learning, it can be expressed as the difference between the real probability distribution and the predicted probability distribution, which can solve the problem that the taproot of the neighboring grade 37 misidentifies others. The cross-entropy loss function is shown in Formula (1).
C E = i = 1 K y i log ( P i )
S ( x i ) = e x i j = 1 n e x i
where K is the number of species and y is the label. If the category is i, then yi = 1, otherwise yi = 0. P is the output of the neural network, which refers to the probability that the category is i. This output value is calculated using Formula (2). The calculation steps are: (1) calculate the power of e with respect to each element of the input vector; (2) add all the powers to get the denominator; (3) each power is used as the numerator of the output result at the corresponding position; and (4) output probability = numerator/denominator.

2.4. Experiment Environment and Parameter Settings

All the experiments in this paper were conducted on the DELL-P2419H workstation equipped with an Intel Corei7-9700F CPU@3.70 GHz (16 cores and 32 threads), 64 GB main memory, a Quadro P5000 GPU (2560 CUDA cores), 16 GB video memory, and running the Windows operating system. The Tensorflow-gpu1.13.2 deep learning framework, Python3.6 programming language, and CUDA11.0 were used. All model training and testing were performed under the same hardware configuration. The image input size is 1280 × 1024. The batch size is set to 2. The learning rate is set to 0.00001. Adams was used as a model optimization algorithm.

2.5. Model Evaluation Metrics

To evaluate the effectiveness of the improved Panax notoginseng taproot segmentation detection model of different grades in this study, the Mean Pixel Accuray (MPA) and the Mean Intersection over Union (MIoU) were selected as evaluation indicators.
Category Pixel Accuracy (CPA): among the predicted values of category i, the accuracy of pixels that actually belong to category i. True Positive (TP), False Positive (FP), False Negative (FN), True Negative (TN), the calculation is shown in Formula (3):
c l a s s   i : P i = T P i T P i + F P i
MPA: calculate the proportion of correctly classified pixels in each class, i.e., CPA, and then calculate the average by accumulative calculation, as shown in Formula (4):
M P A = S u m ( p i ) n u m b e r   o f   c l a s s e s
IoU: the ratio of the intersection and union of the prediction result of a certain category and the true value of the model, the calculation is shown in Formulas (5) and (6):
I o U P = T P T P + F P + F N
I o U n = T N T N + F N + F P
MIoU: The ratio of the intersection and union of the predicted results of each type and the true value of the model, summed and averaged, the calculation is shown in Formula (7):
M I o U = I o U p + I o U n 2

3. Model Results and Analysis

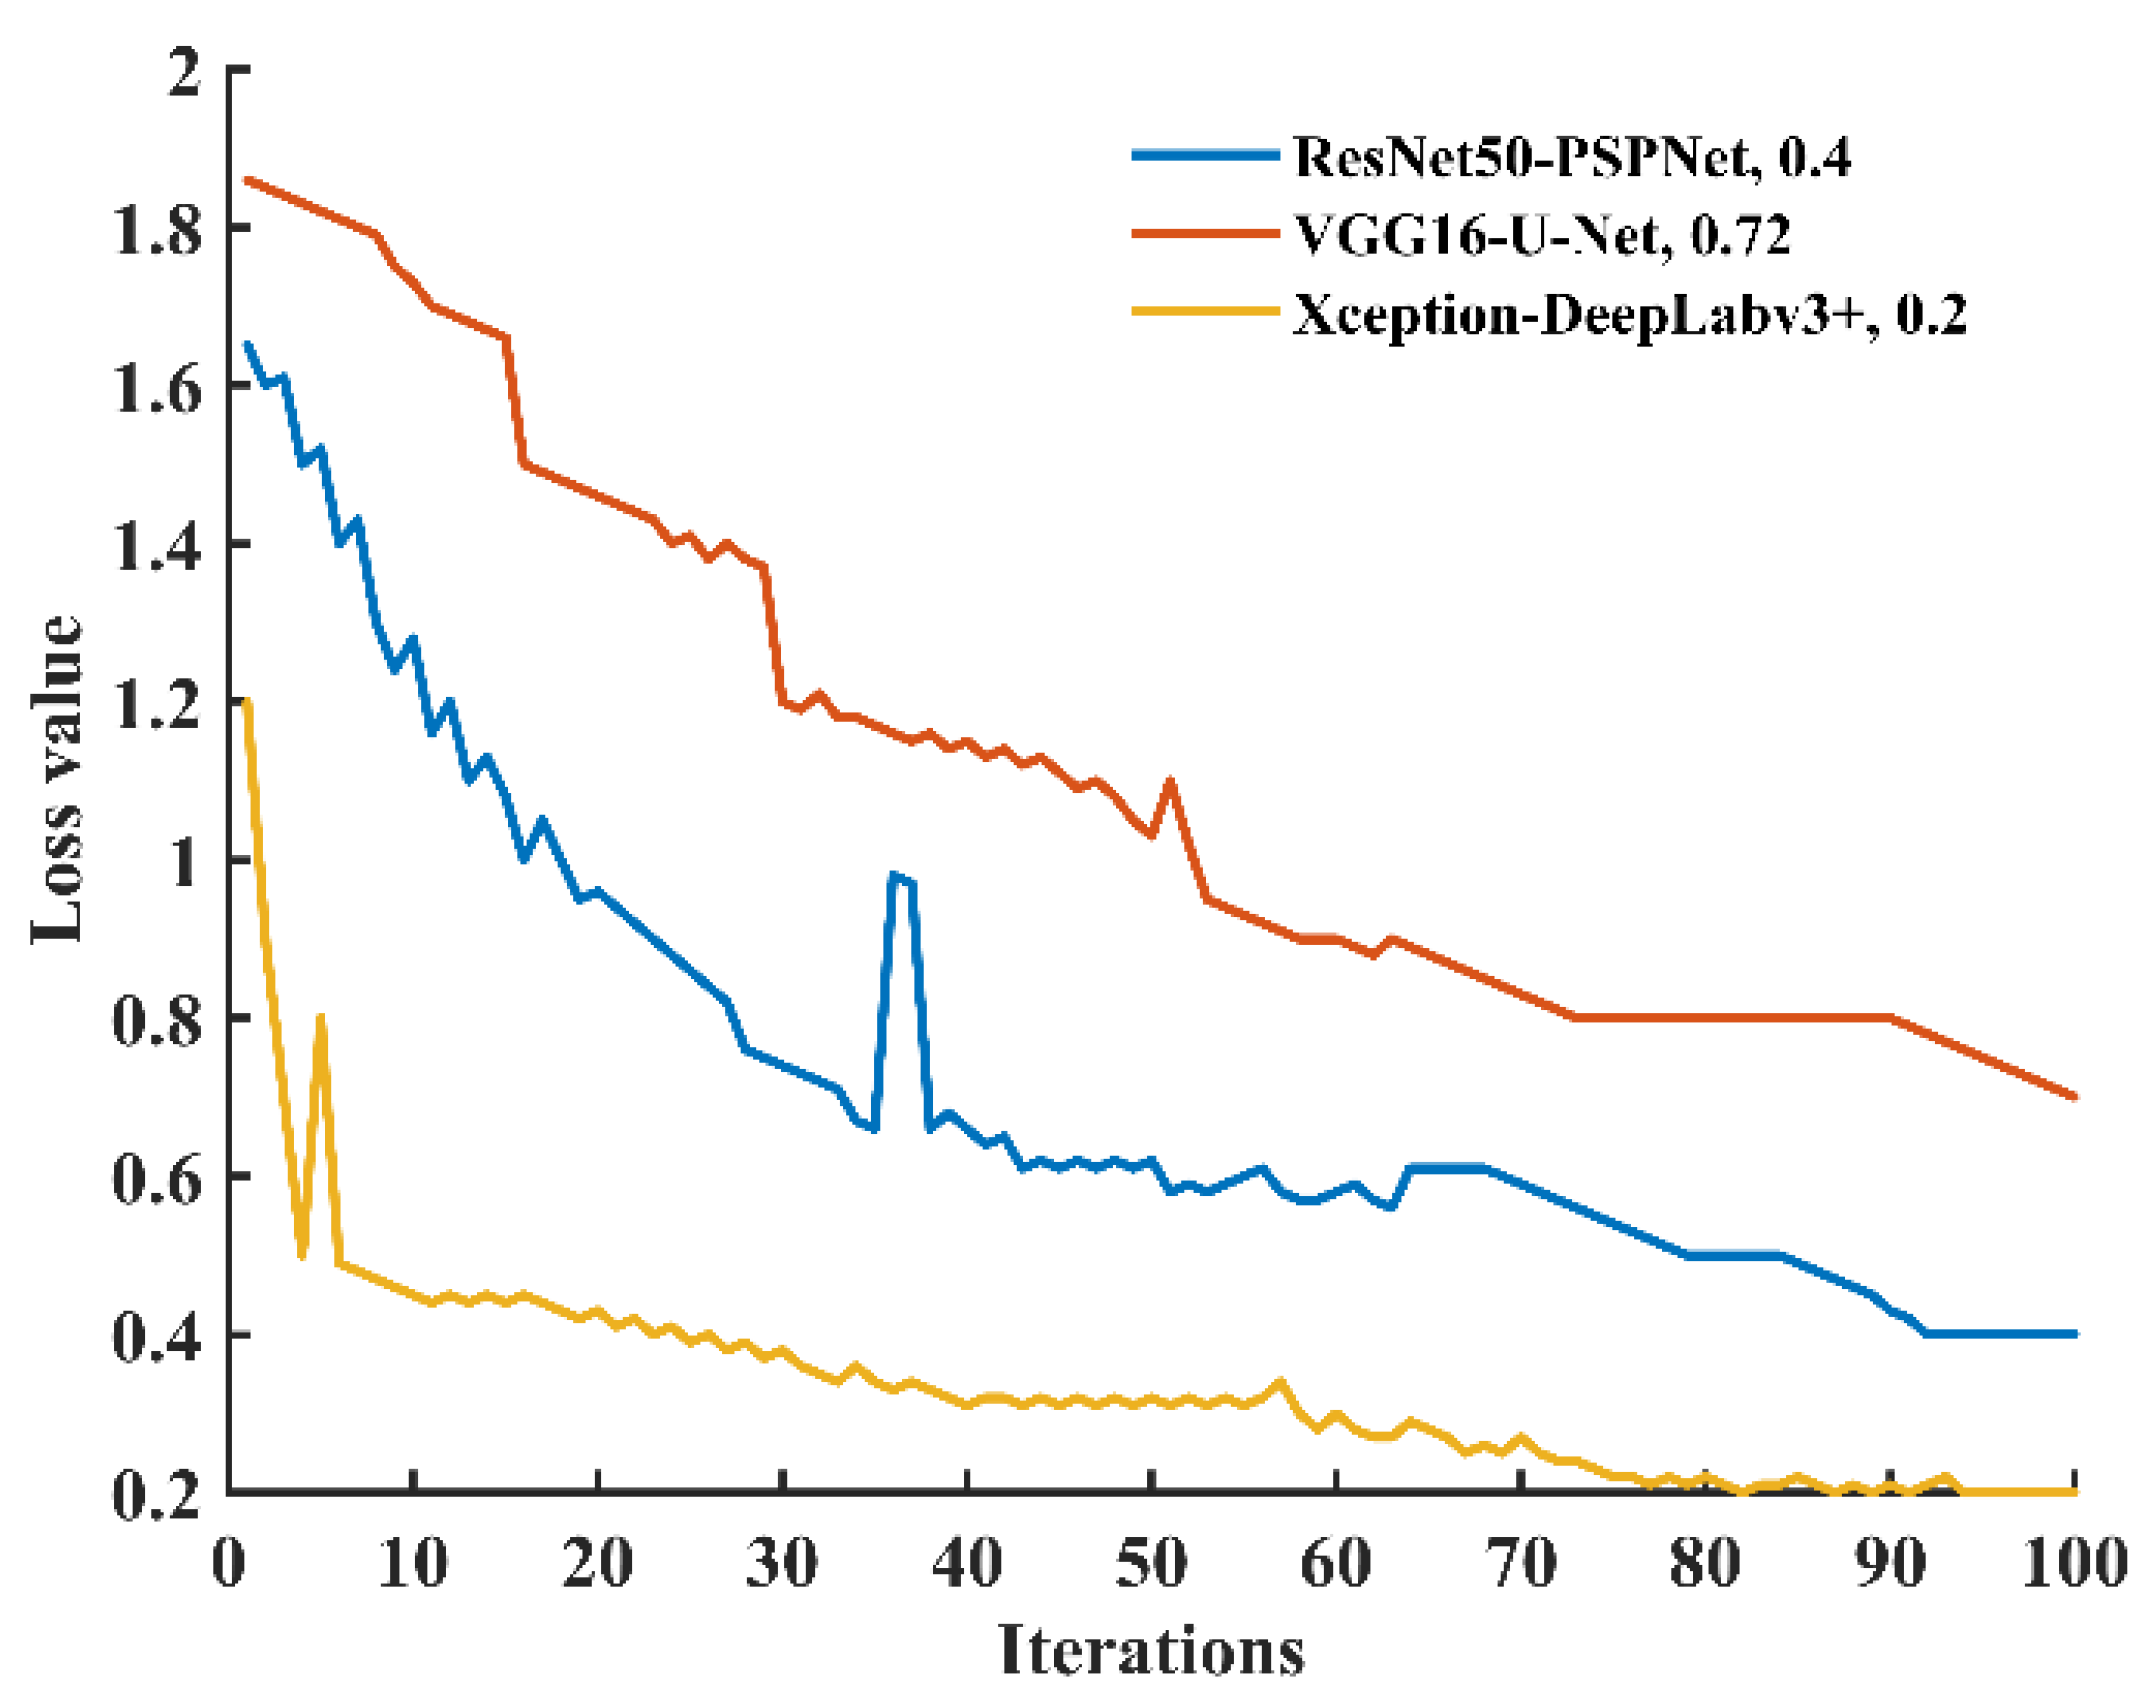
3.1. Comparison of Different Semantic Segmentation Models

In this paper, three semantic segmentation frameworks of PSPnet, U-Net, and DeepLabv3+ were selected as the taproot classification model of Panax notoginseng with different numbers of heads, and three types of convolutional neural networks of ResNet50, VGG16, and Xception were used as the feature extraction network. In this experiment, four types of Panax notoginseng were used, and the total number of taproot samples was 6000.
It can be seen from Figure 5 that in the first iteration of the VGG16-U-Net model, the loss value was 1.86; it did not show large oscillation in the middle and then gradually converged to about 0.72. The ResNet50-PSPNet model fitted quickly in the first 36 iterations, and the loss value decreased rapidly. In the 37–38 iterations, the loss value fluctuated greatly and then gradually stabilized at around 0.4. Before the first five iterations of the Xception-DeepLabv3+ model, the loss value decreased rapidly. During the 6–7 iterations, the loss value oscillated slightly, and after the 8-th iteration, the loss value gradually stabilized at about 0.2.
It can be seen from Table 1 that VGG16-U-Net is the largest model and takes the longest training time, but its MPA and MIoU are the lowest. ResNet50-PSPNet has a smaller model size and takes less training time, and its MPA and MIoU are not optimal, which are all smaller than those of the Xception-DeepLabv3+ model. Through comparison, it is found that the Xception-DeepLabv3+ model achieves the best overall performance, with an MPA of 78.98% and an MIoU of 88.98% on the test set. Therefore, the Xception convolutional neural network in the DeepLabv3+ model has better performance as a segmentation network for the taproot area of Panax notoginseng at different grades, and it is suitable for sorting the taproots of Panax notoginseng.

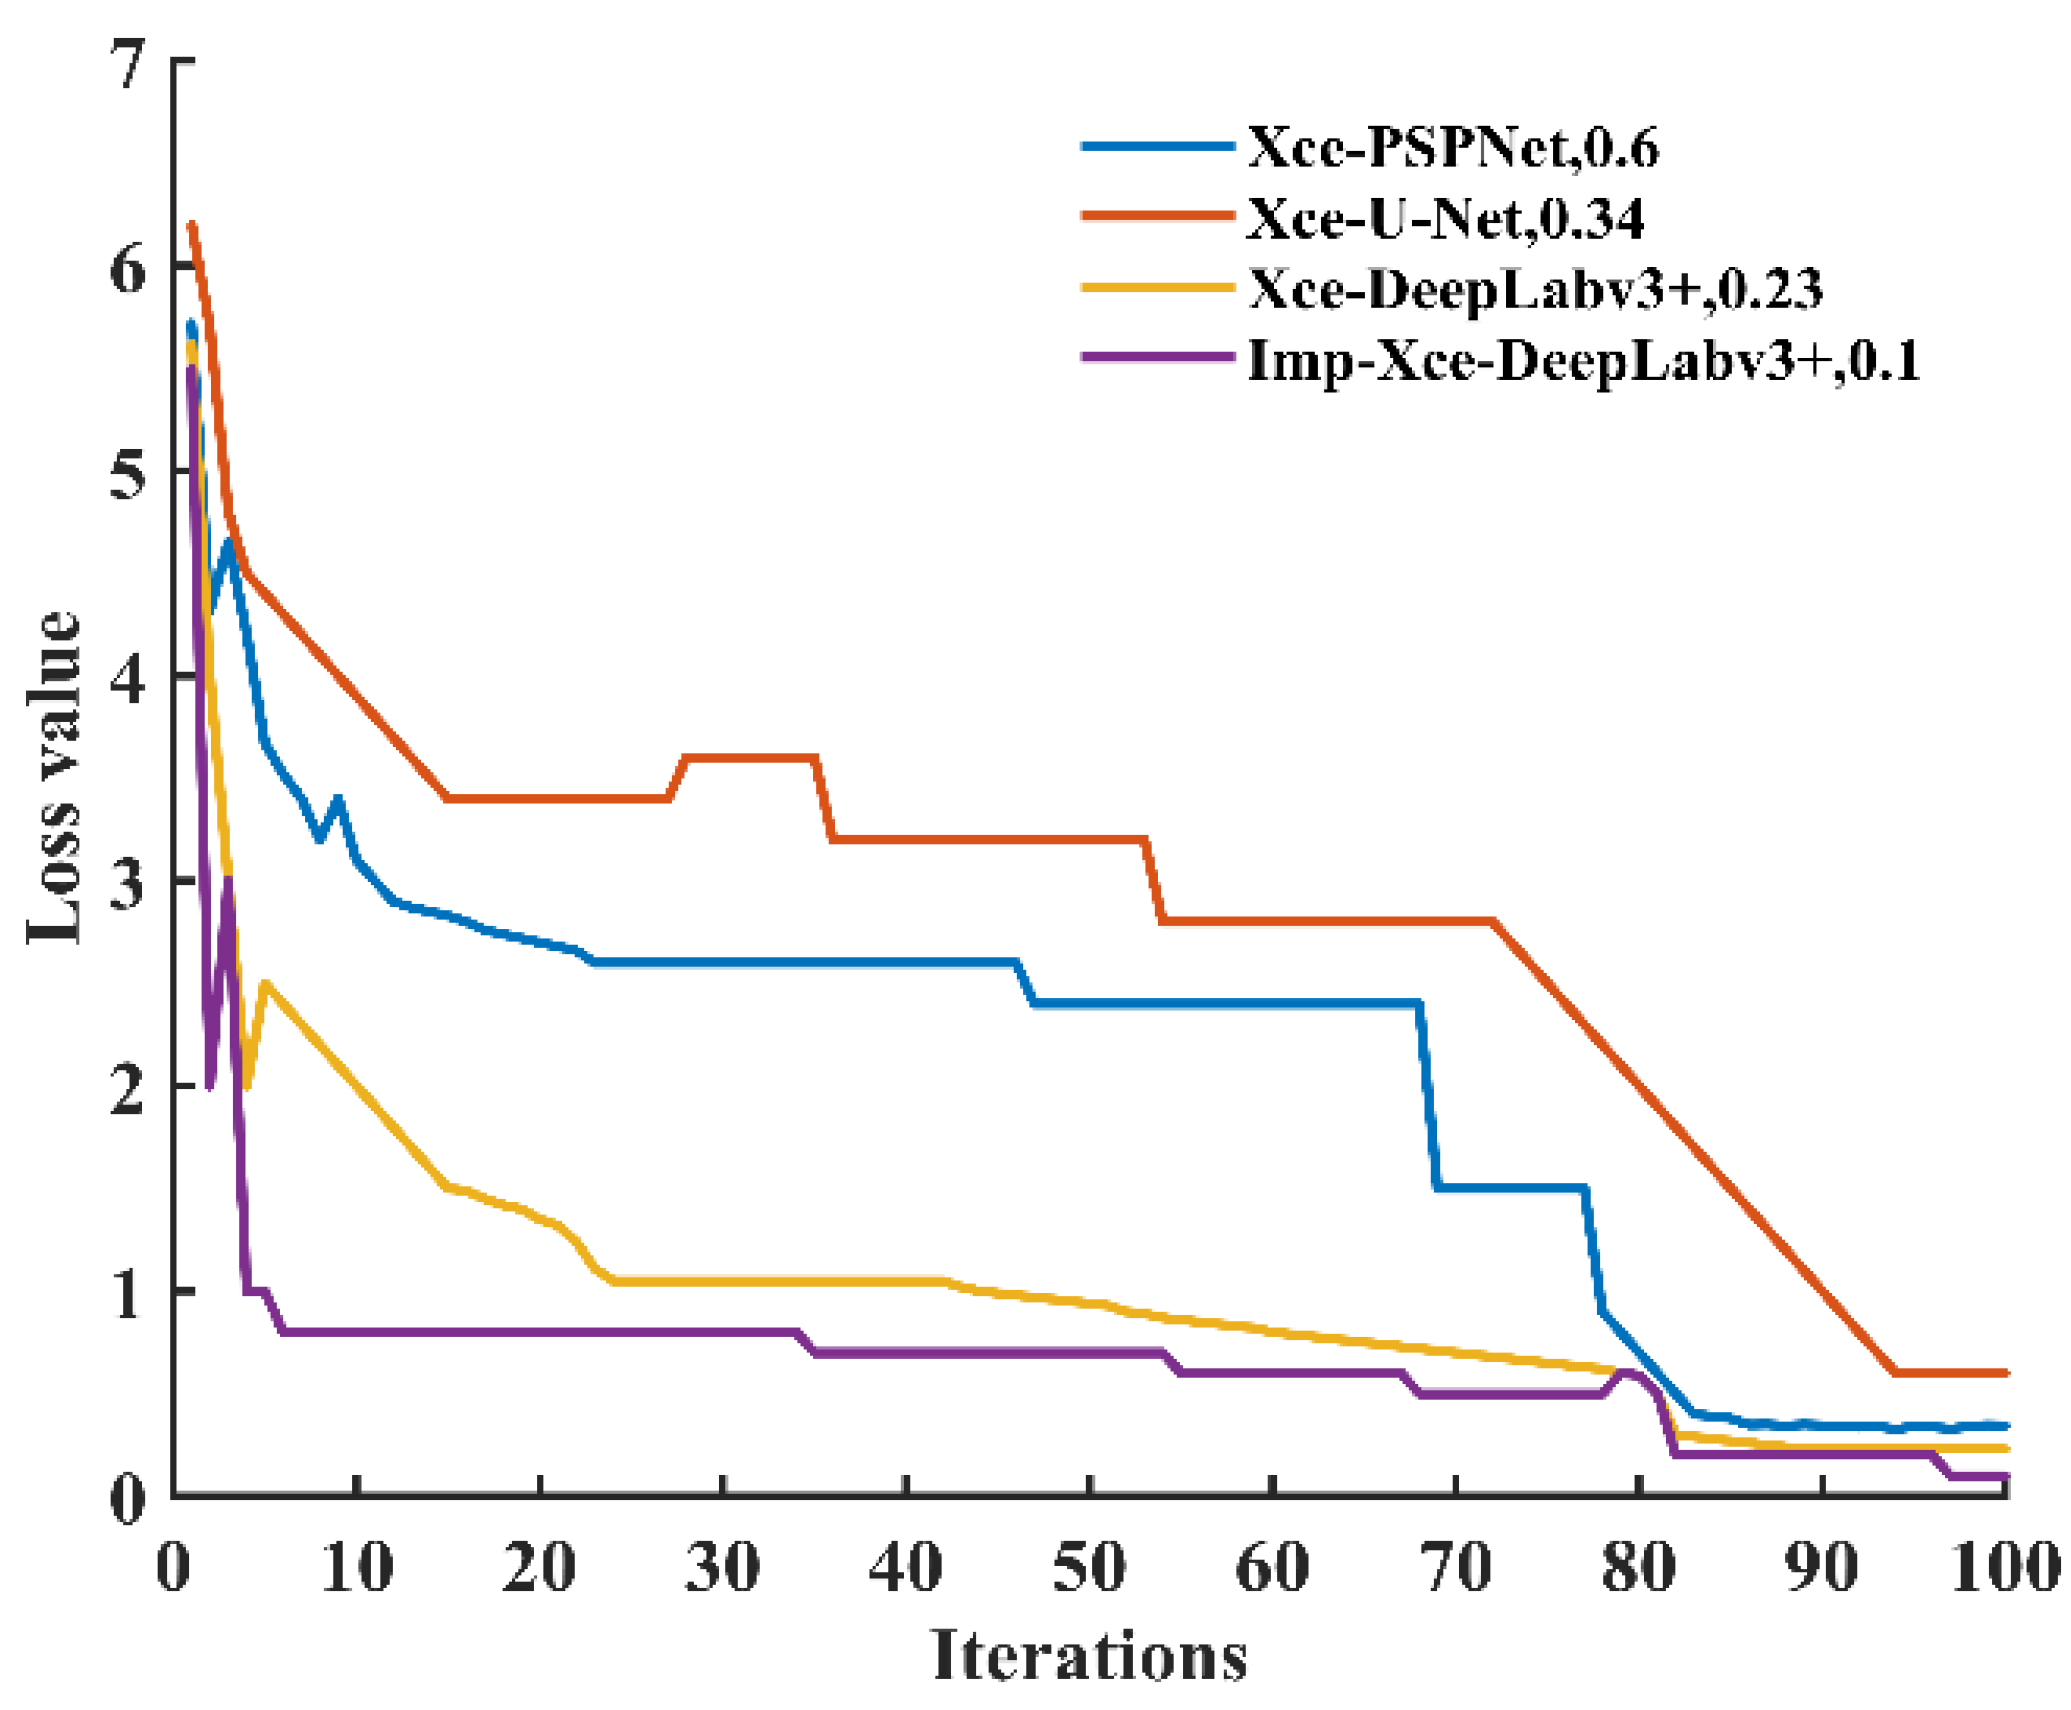
3.2. Comparison of Improved DeepLabv3+ Segmentation Network Models

This study took Xception as the encoder, and four different decoders were constructed with DeepLabv3+, PSPNet, U-Net, and the improved DeepLabv3+, respectively, and four segmentation models Xce-DeepLabv3+, Xce-PSPNet, Xce-U-Net, and I-Xce-DeepLabv3+. In this experiment, 6000 samples of the four types of Panax notoginseng taproots were used.
It can be seen from Figure 6 that the Xce-U-Net model fitted quickly in the first five iterations, and the loss value decreased rapidly. In the 5–75 iterations, the loss value decreased slowly, and in the 76–94 iterations, the loss value decreased again and finally stabilized at around 0.34; the Xce-PSPNet model fitted rapidly in the first 10 iterations, and the loss value decreased rapidly. Then, the loss value gradually stabilized at about 0.6 after 84 iterations. For the Xce-DeepLabv3+ model, the loss value decreased rapidly before the second iteration and oscillated from 3 to 7. Then, it gradually changed after eight iterations and converged to around 0.23. For the I-Xce-DeepLabv3+ model, the loss value decreased rapidly in the first five iterations and then gradually stabilized at around 0.1. During the training process, the quality of the model was evaluated by MPA and MIoU.
As can be seen from Table 2, the comparison of the PSPNet, U-Net, and DeepLabv3+ models with Xception as the backbone feature extraction network indicates that Xce-DeepLabv3+ has the best overall performance, with an MPA of 78.98% and an MIoU of 88.98% on the test set. The time to detect and segment a single image is 0.34 s. Compared with the original model, the improved I-Xce-DeepLabv3+ model has a similar model size, but it reduced the detection time by 1 s and improved MPA and MIoU. It shows that the network structure designed in this study can quickly segment the taproot regions of different grades of Panax notoginseng.

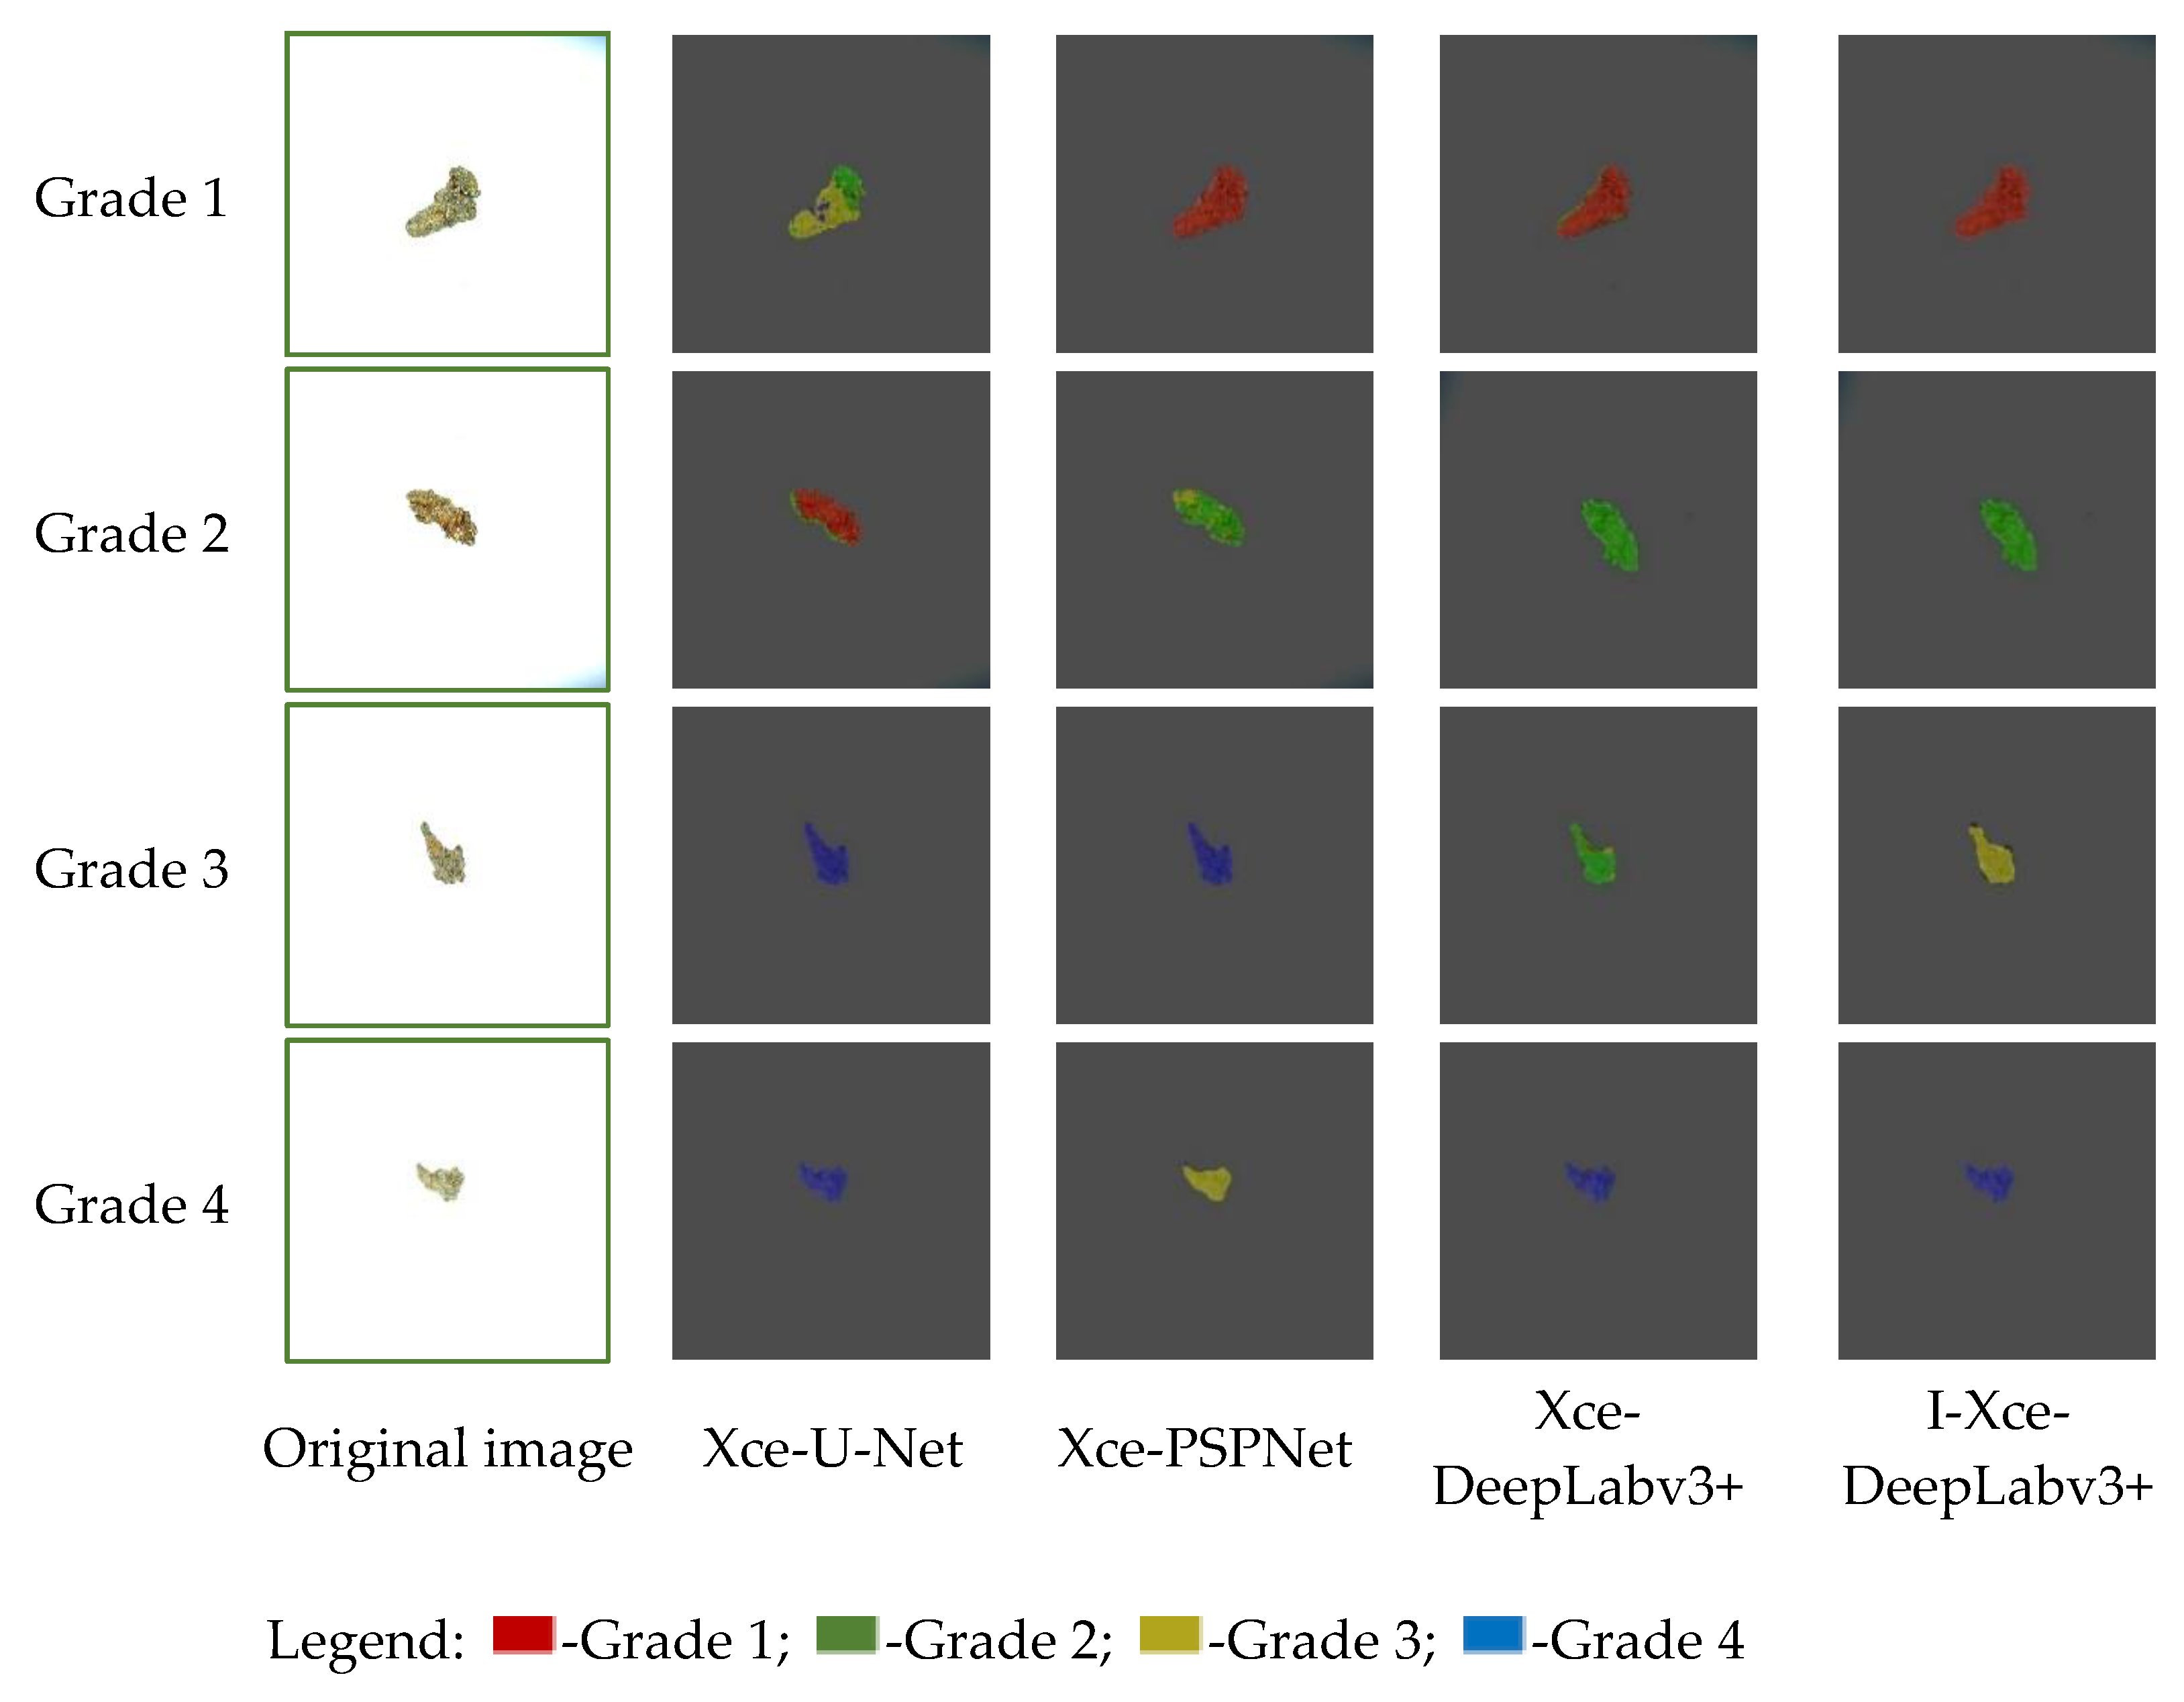
Visualization of the Effect of Different Segmentation Models under Xception

To compare the segmentation effects of the Xce-PSPNet, Xce-U-Net, Xce-DeepLabv3+, and I-Xce-DeepLabv3+ models more intuitively, four images of the taproots of Panax notoginseng of different grades were randomly selected in the test set to visualize the segmentation effects of different models.
It can be seen from Figure 7 that the segmentation regions of different grades of Xce-U-Net have overlaps and holes, and the segmentation effects of grades 2 and 3 are poor. The Xce-PSPNet exhibits poor segmentation of the taproot of Panax notoginseng of different grades. The edge of the Xce-DeepLabv3+ segmentation area has obvious jaggedness, which is prone to segmentation errors for low-grade products. The segmentation effect of I-Xce-DeepLabv3+ is closest to the original image labeling result. This is because Xce-U-Net and Xce-PSPNet only extract the deep effective feature layer of the taproot of Panax notoginseng through the pyramid pooling module. Xce-DeepLabv3+ not only adds atrous convolution to the pyramid pooling module but also adds shallow effective feature maps. In this way, the receptive field of the feature map is increased without changing the size of the feature map, and the loss of spatial position information is avoided. Meanwhile, the context information is obtained by fully connecting with the deep feature layer. Based on DeepLabv3+, I-Xce-DeepLabv3+ extracts more texture features from the taproot of Panax notoginseng by adding global max pooling in the ASPP module. The extracted multiple shallow effective feature layers are fully connected with the deep effective feature layers to obtain more comprehensive image information. The above results indicate that the I-Xce-DeepLabv3+ model has high segmentation accuracy and robustness for different grades, and it can be used as an automatic segmentation model for the taproot of Panax notoginseng at different grades.

4. Design and Experiment of the Sorting Robot System

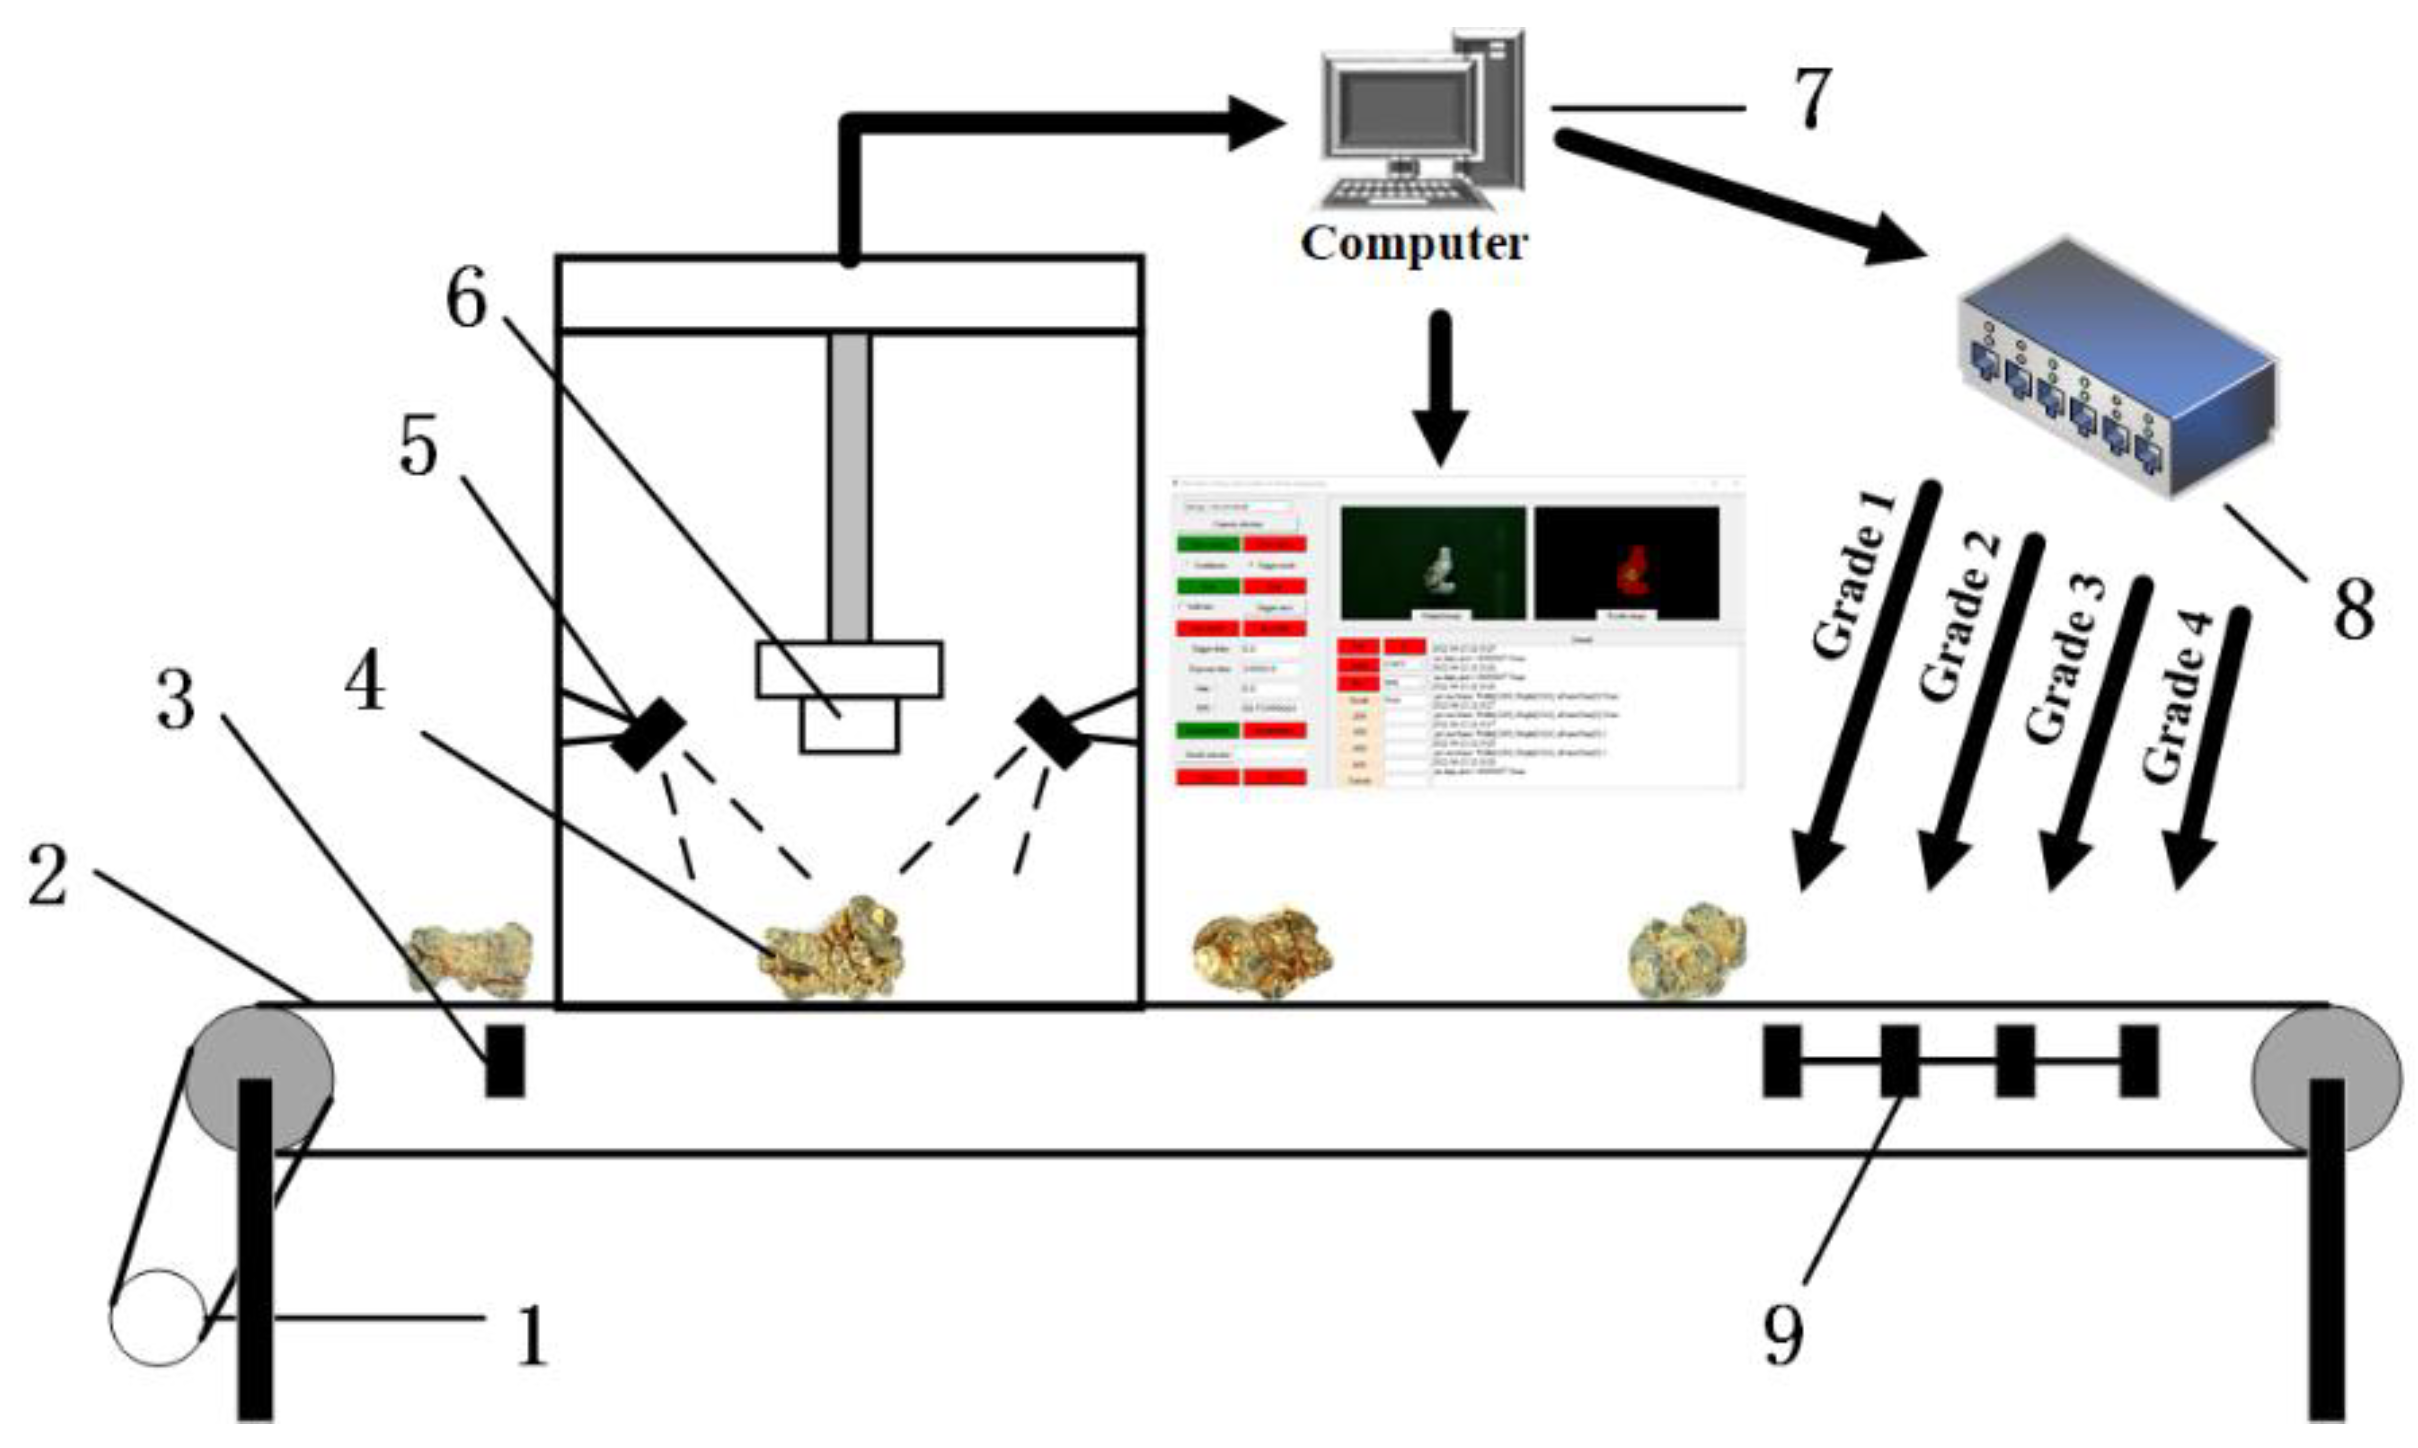
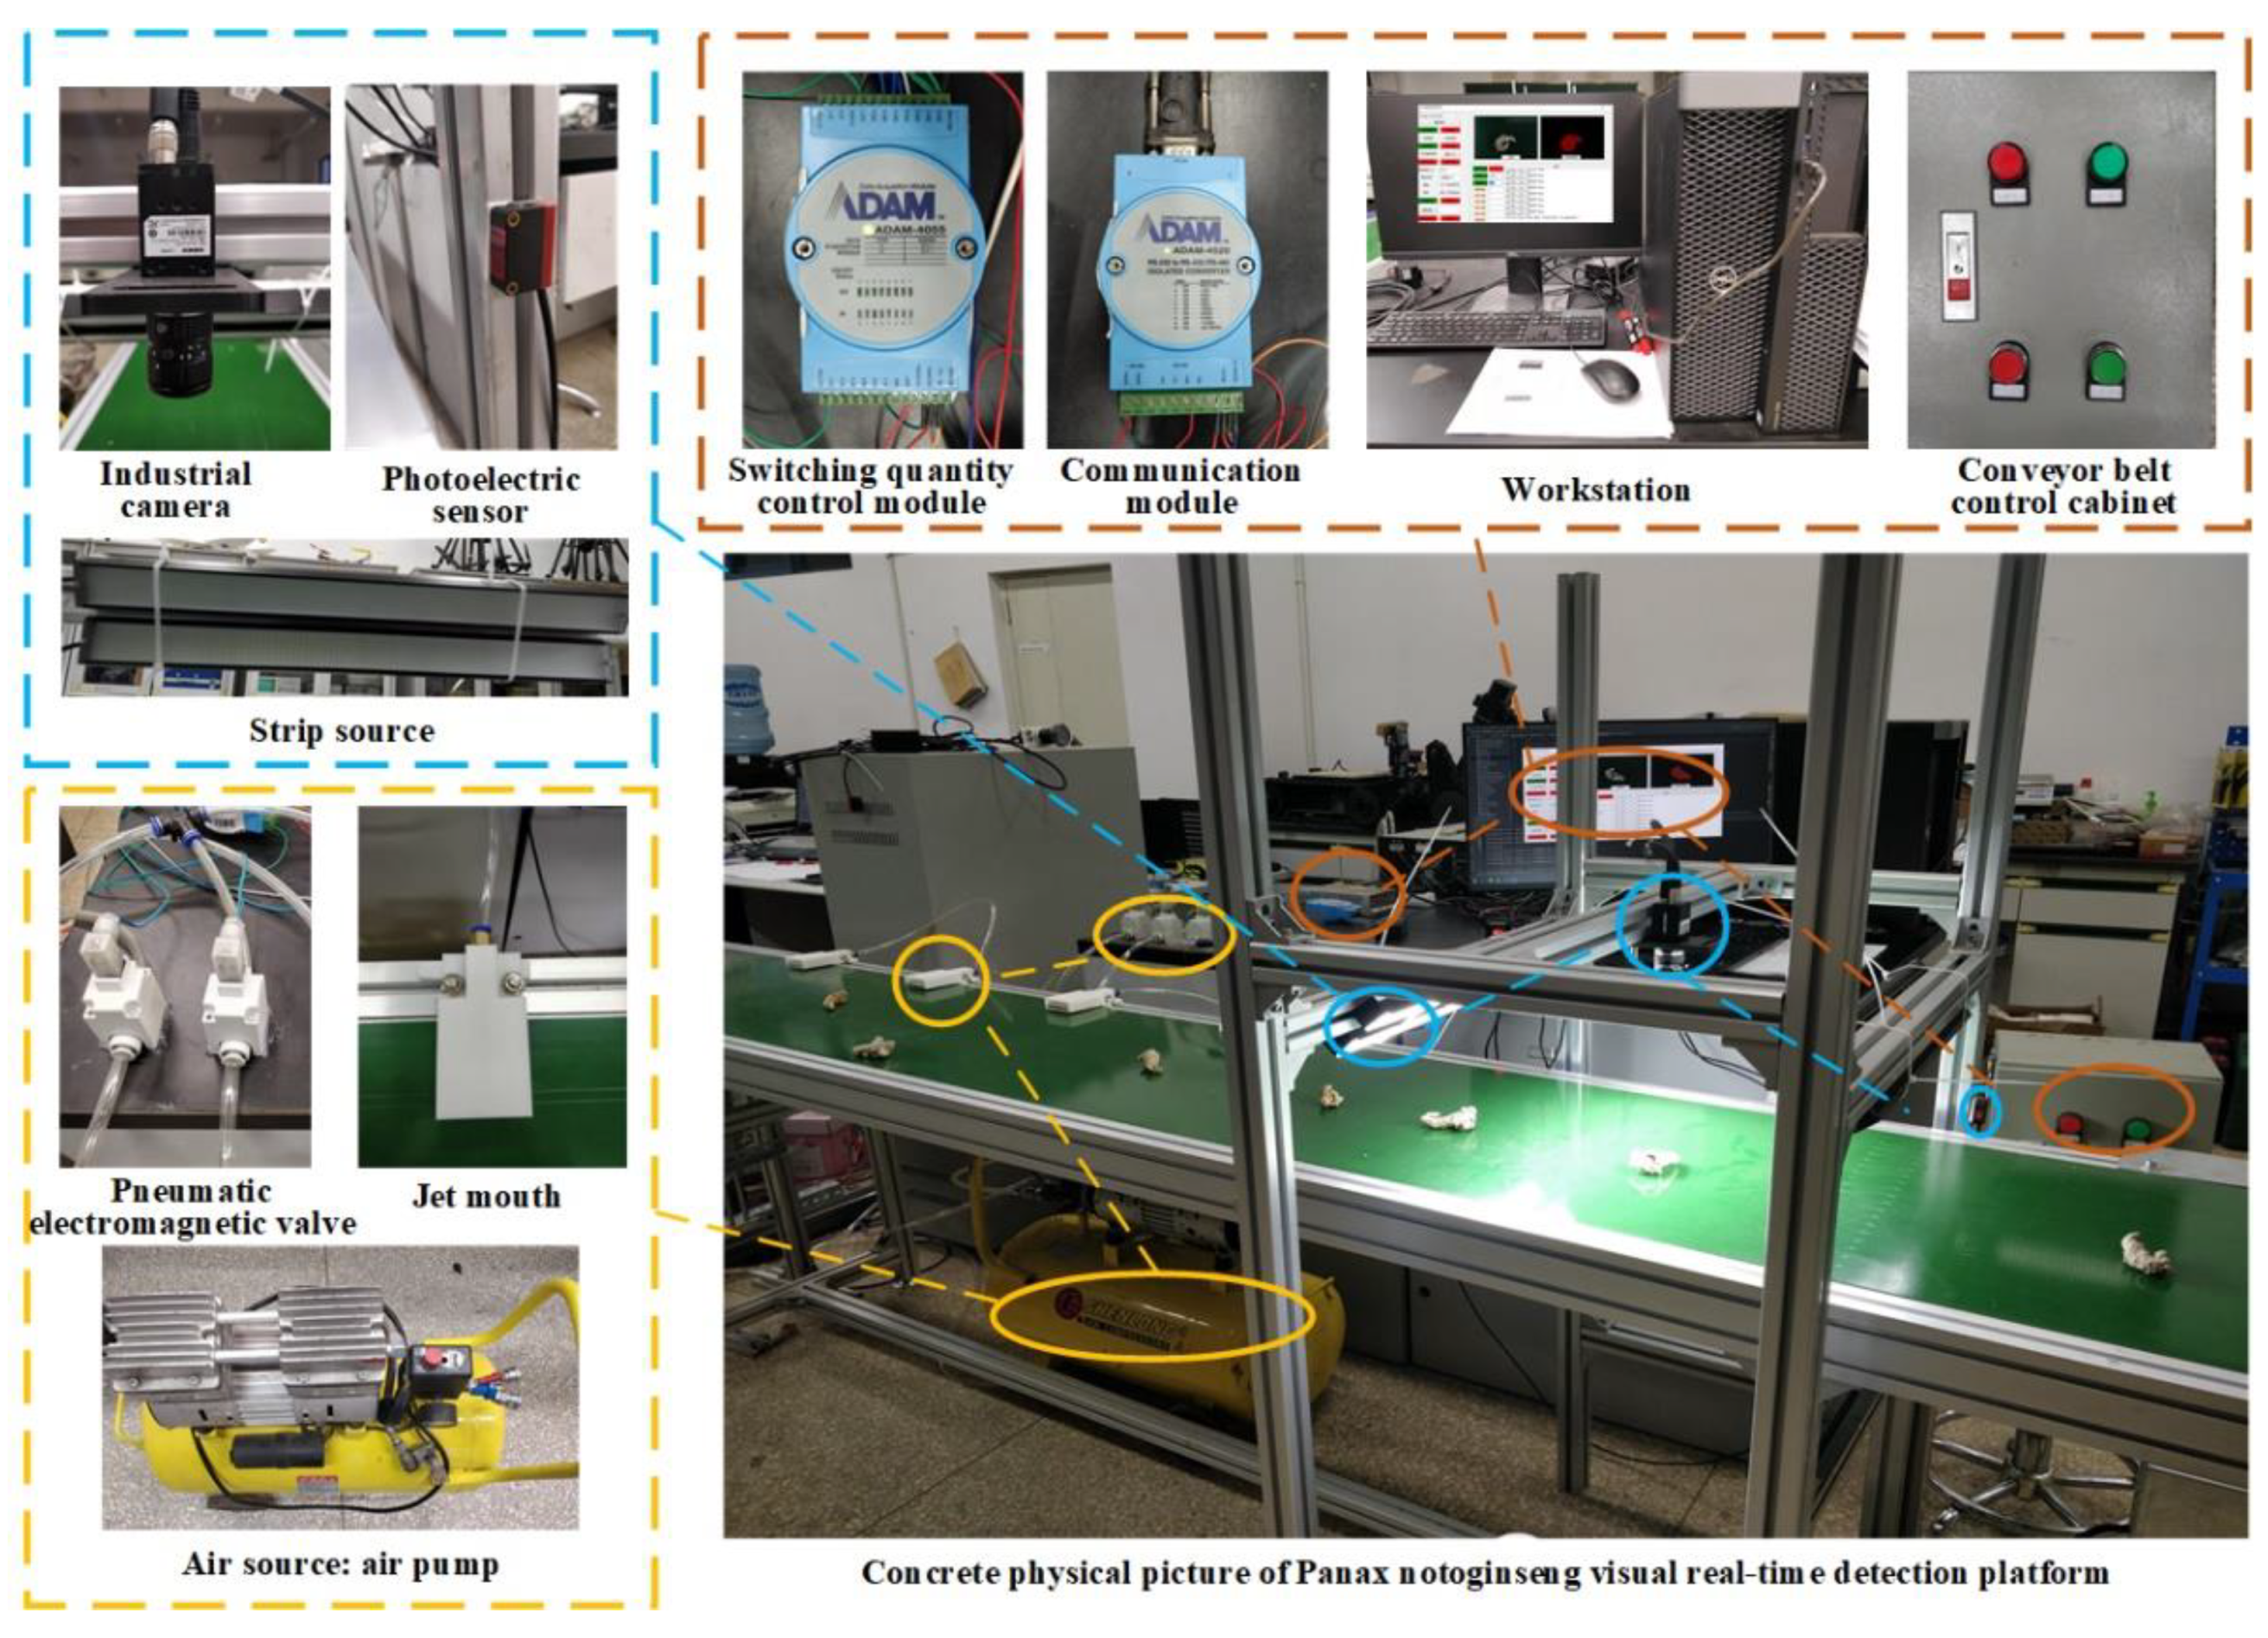
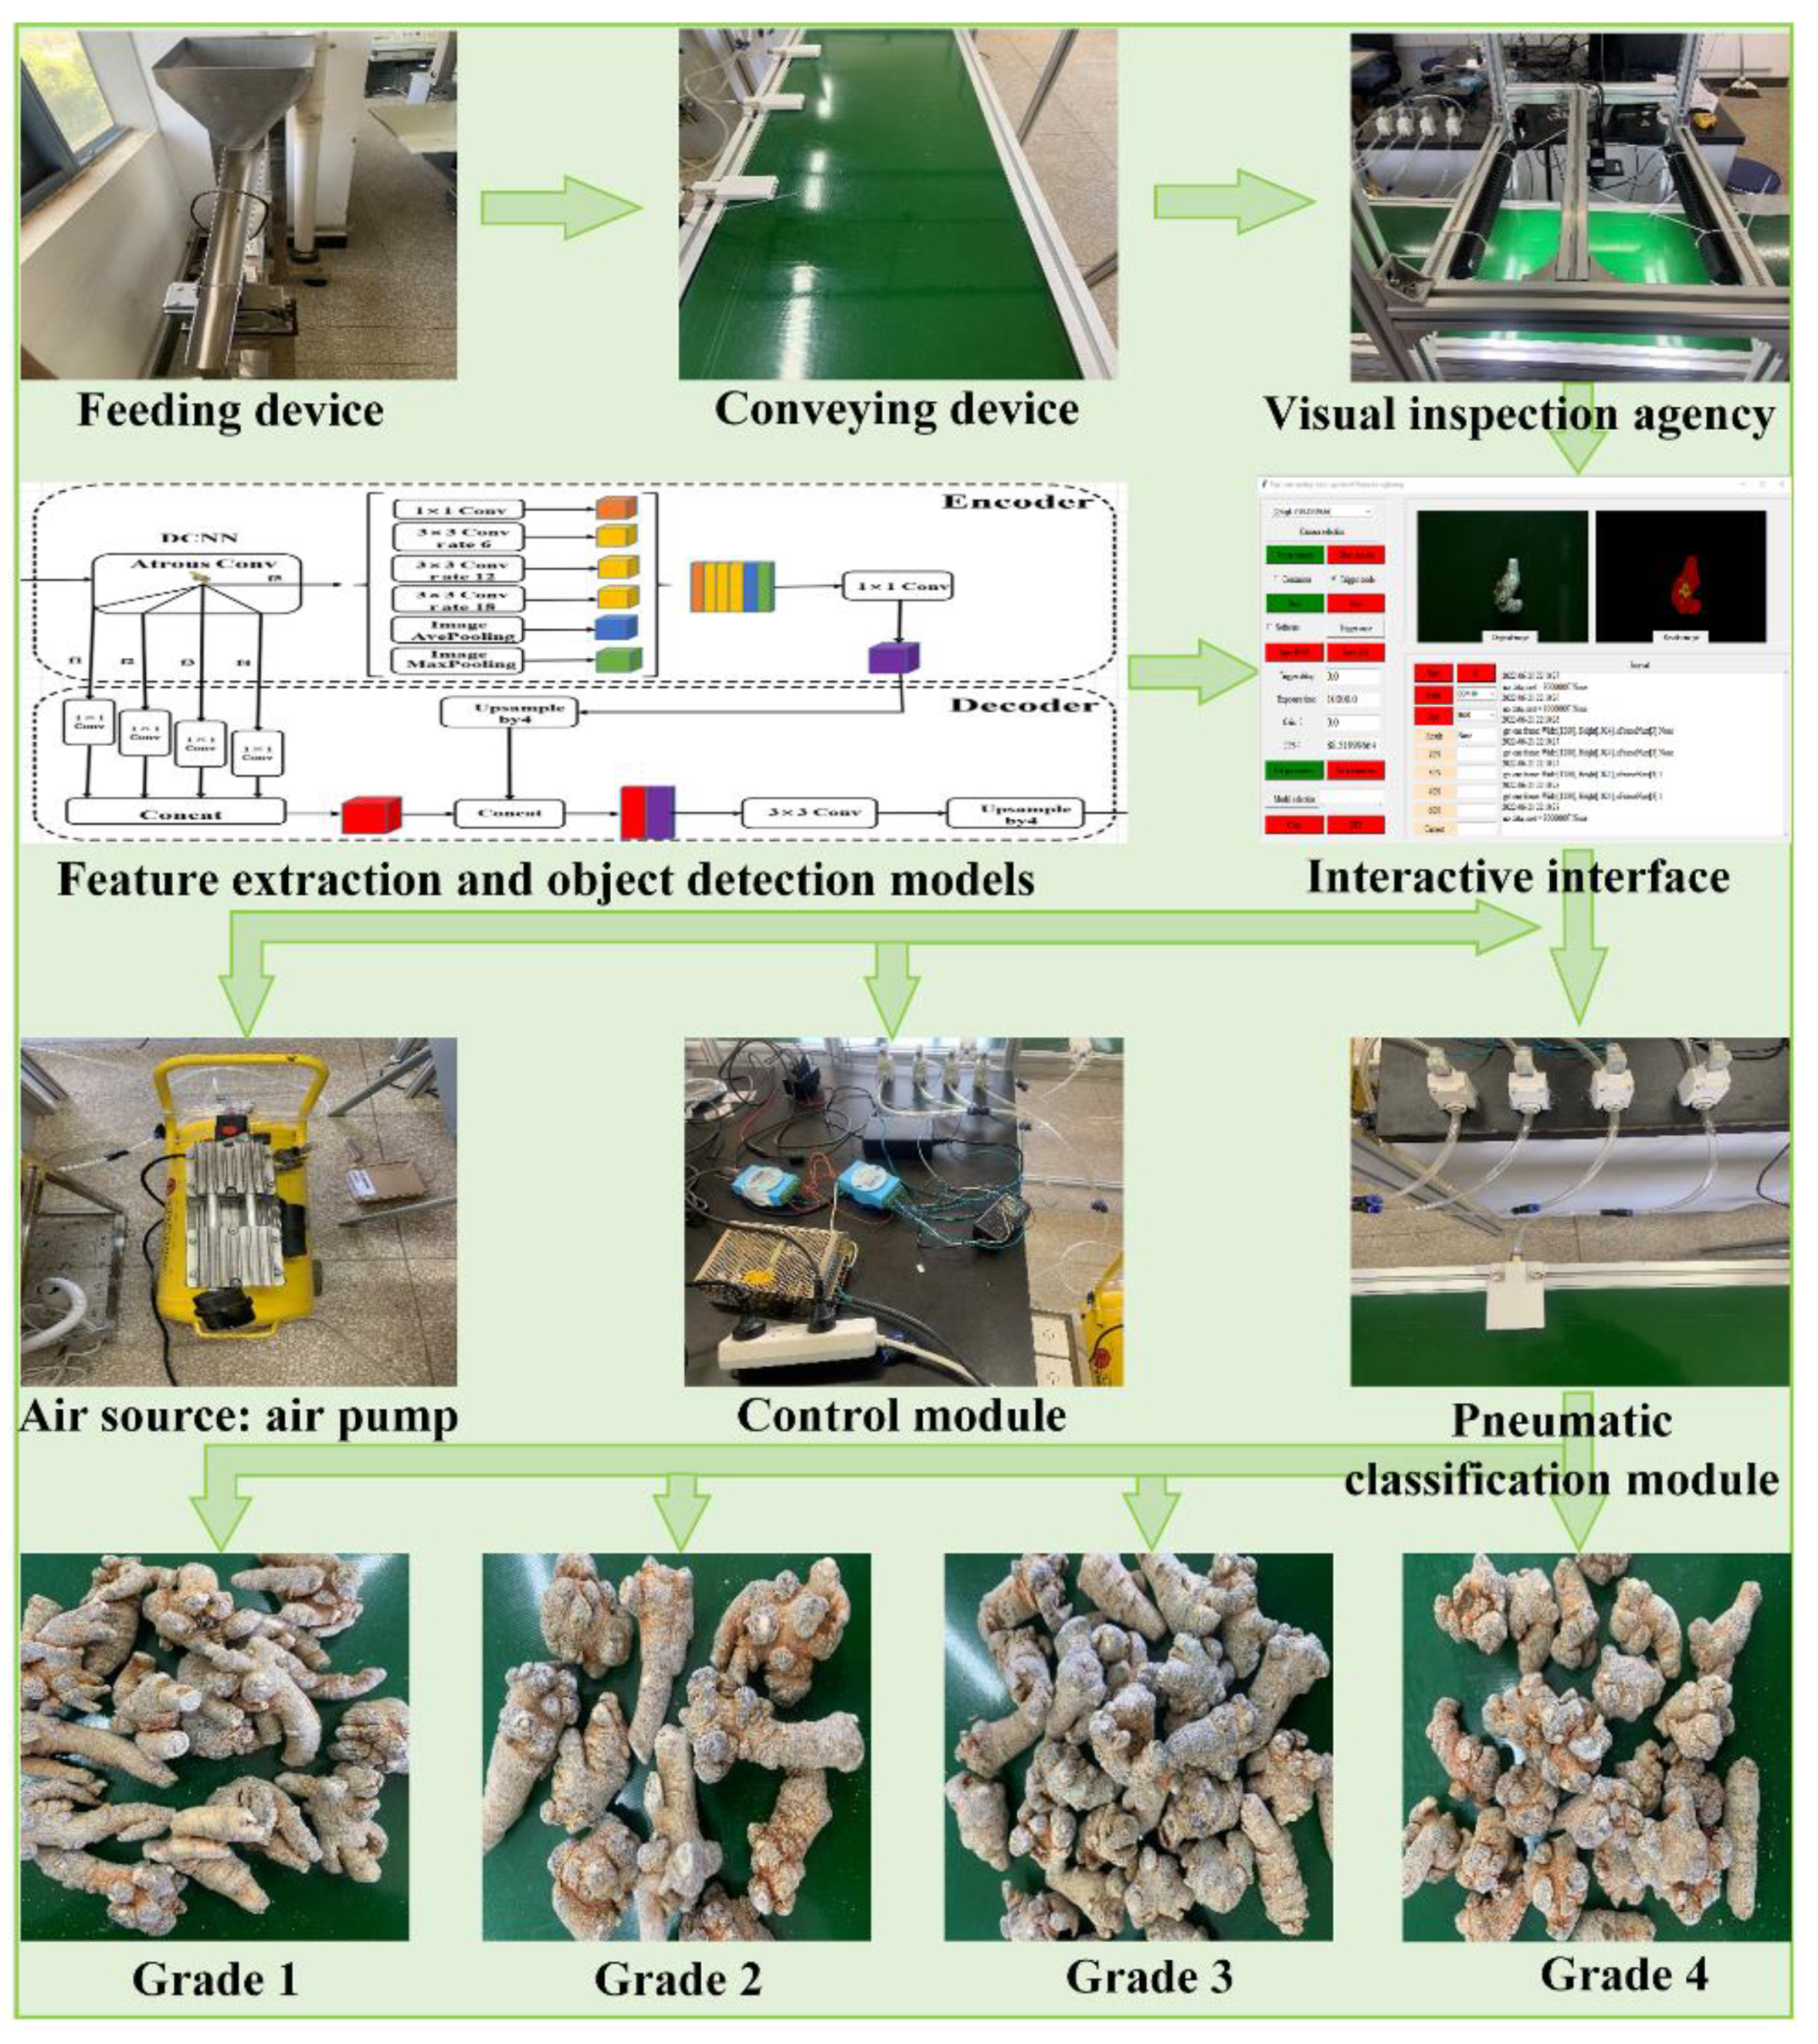
4.1. System Hardware Design

This system mainly performs feeding, image acquisition, identification, and sorting of Panax notoginseng materials. The hardware includes the vibration feeding mechanism, image acquisition mechanism, conveying and sorting mechanism, and control system. The feeding and conveying mechanism drops the taproots of Panax notoginseng from the hopper to the conveyor belt in an orderly manner. The camera in the image acquisition mechanism is located 16.2 cm above the conveyor belt, and the brightness of the light on the surface of the conveyor belt is about 2.3 × 10⁴ Lux. The photoelectric sensor is installed on the inlet side of the conveyor belt. When the material passes through the photoelectric sensor, the camera is triggered for image acquisition and identification. The conveying and sorting mechanism consists of a conveyor belt, conveyor belt control box, air pump, solenoid valve, and jet port. The conveyor belt regulates the conveying speed through the frequency converter. The air pump provides air pressure of 0.6 mpa, and the action of the jet port is controlled by a solenoid valve to blow various materials into different sorting ports. The control system includes computer system software and a lower computer ADAM controller (ADAM-4520 and ADAM-4055, it was developed by Advantech Co., Ltd., Kunshan, Jiangsu, China, the manufacturer’s website is http://www.advantech.com/eAutomation accessed on 5 October 2021). The human–computer interaction interface on the software realizes real-time display of Panax notoginseng materials, pattern recognition, system parameter setting, and real-time control of the equipment of the lower computer. The physical exploded view of the system is shown in Figure 8.

4.2. System Software Design

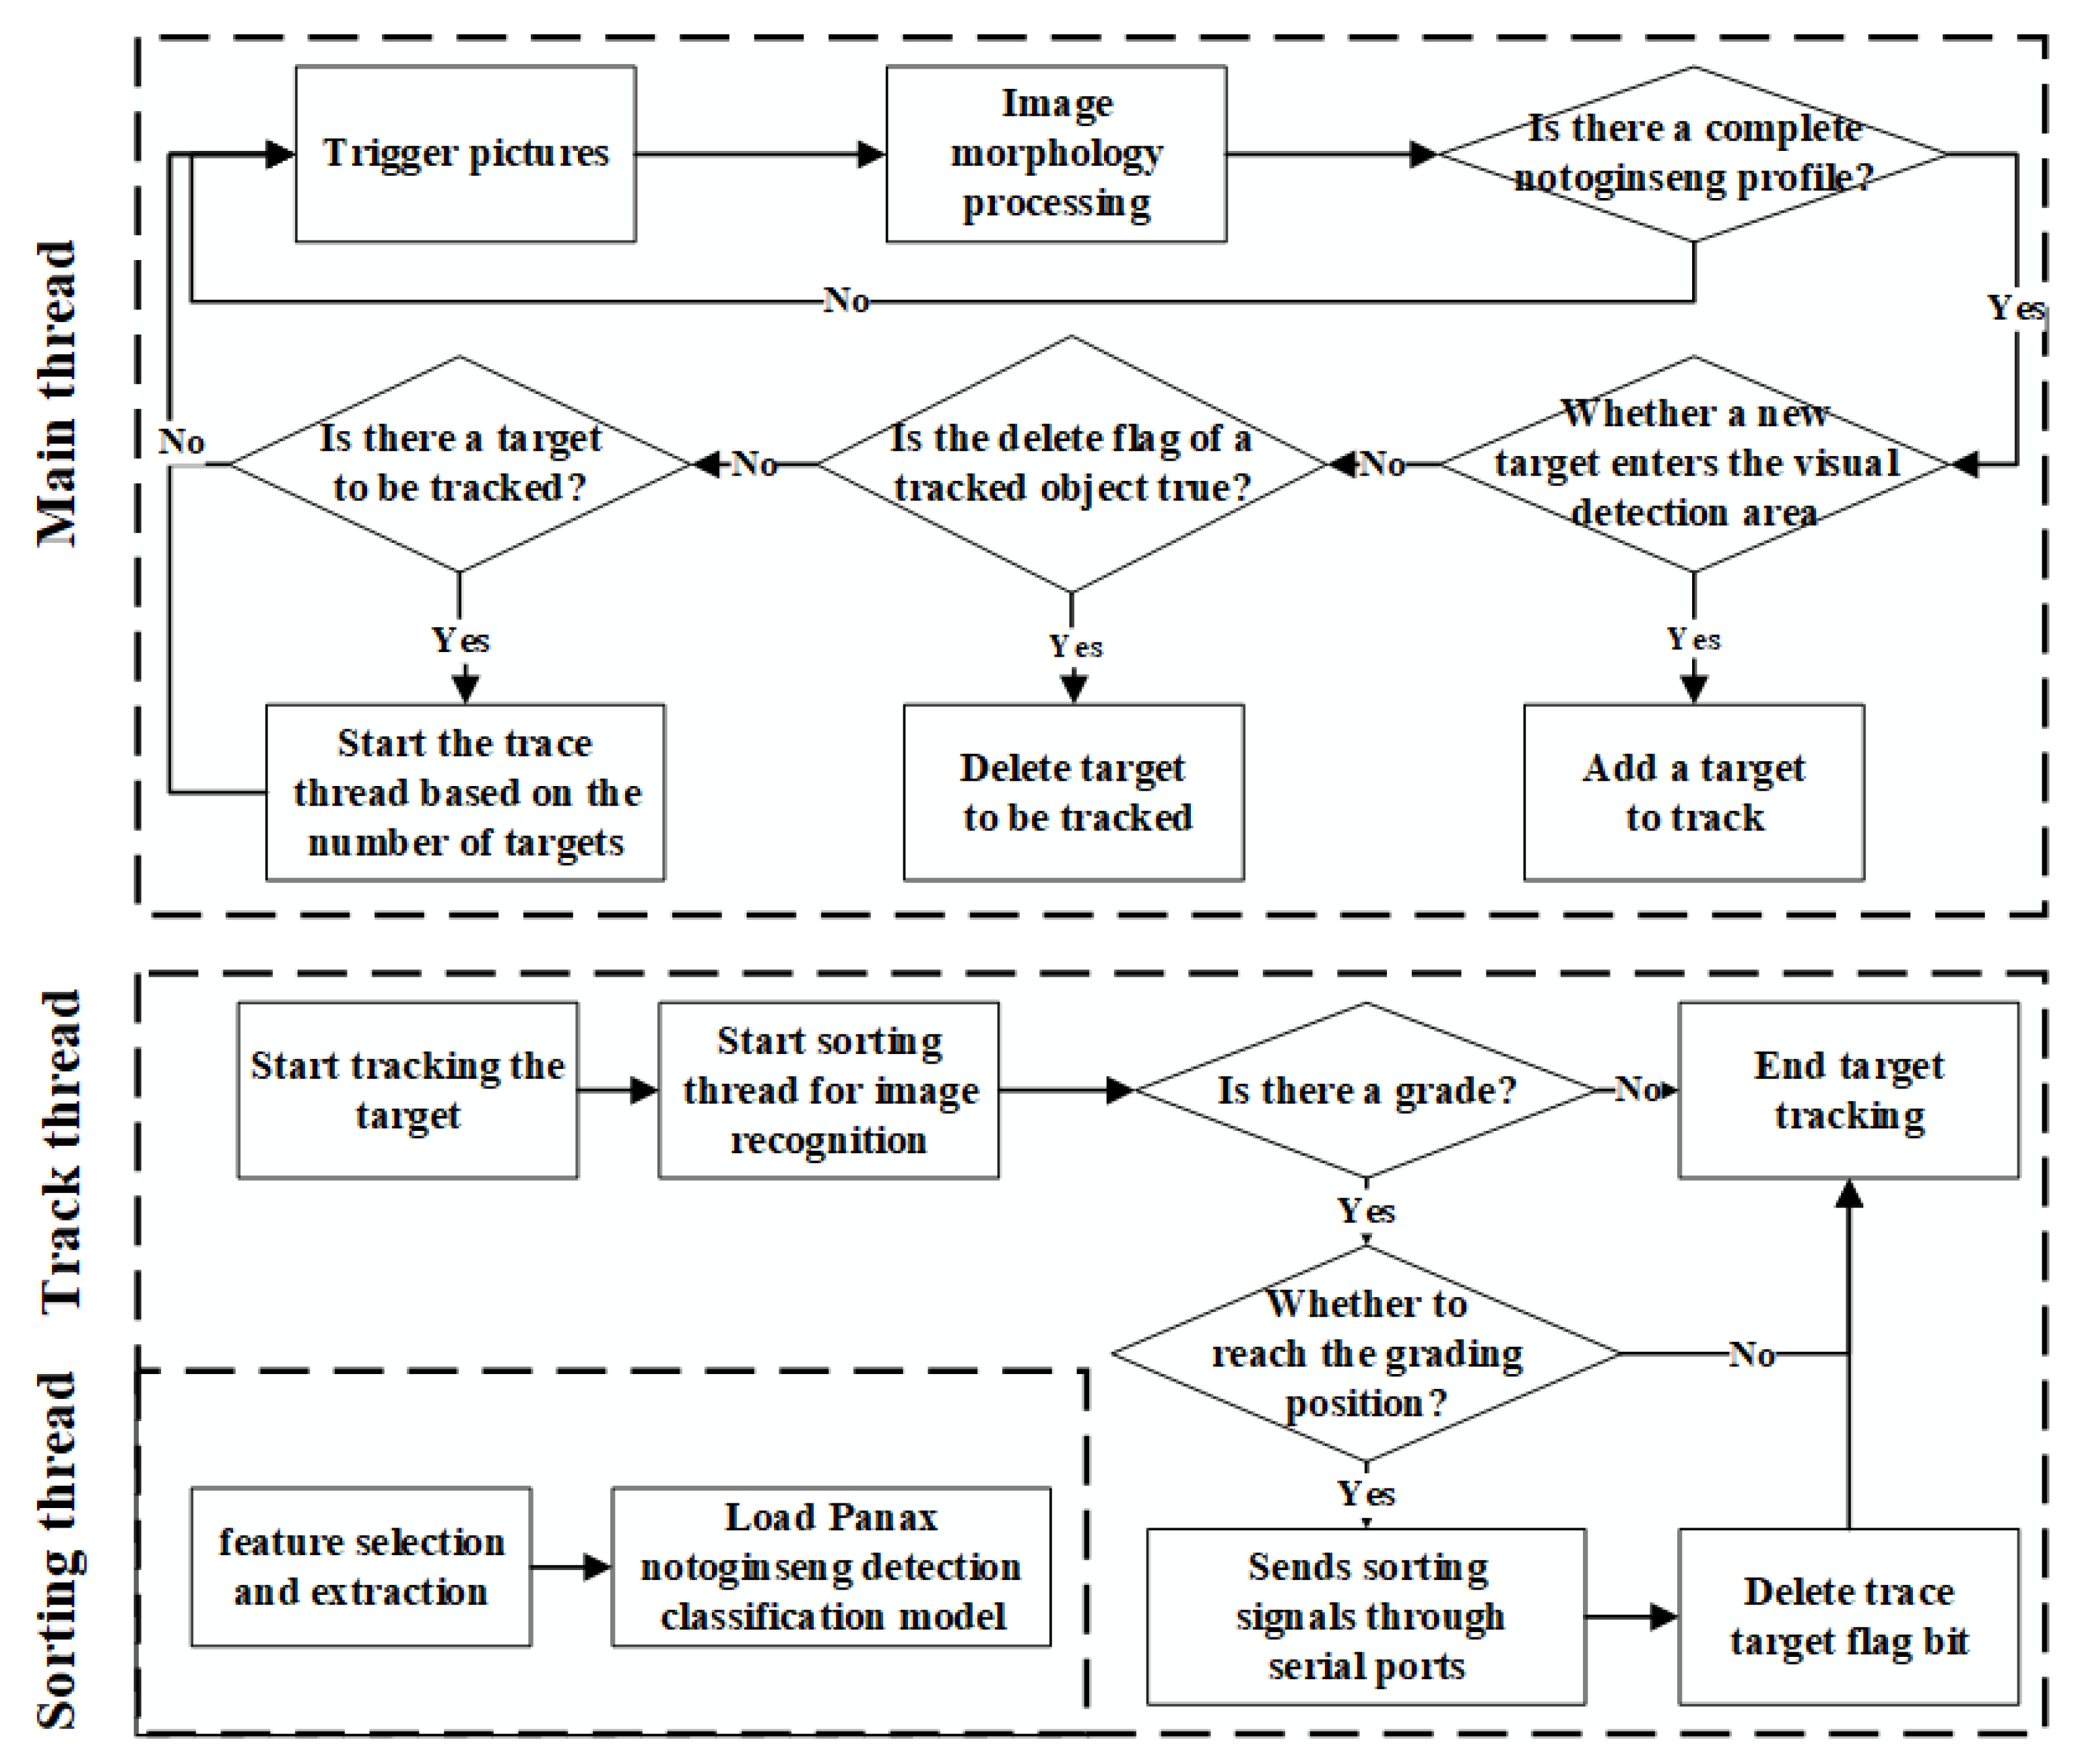
4.2.1. Design Strategy of the System Control Software

As shown in Figure 9, the control system software adopts multi-thread technology to track Panax notoginseng materials in real-time. The control system is written in the Python language, and the library functions such as camera opening, streaming, and closing are called. Meanwhile, the sorting function file is written based on the I-Xce-DeepLabv3+ Panax notoginseng sorting model. This file includes calculating the area proportion of each category region in the taproot image of Panax notoginseng after segmentation, taking the category with the highest proportion of segmented region as the recognition result of the image, and output the recognition result as the prediction result of the sorting function. The external photoelectric sensor triggers the camera to collect and process pictures in real-time and judge whether there are new materials as the main thread of the system. The sorting function is set as the sorting thread for the recognition programs of different grades of Panax notoginseng. The tracking thread is responsible for calling the sorting thread, receiving the forecast result and position information of the material, and making a judgment on the grade and real-time position. The tracking thread sends the sorting signal to the lower computer ADAM-4520 controller through the Modbus RTU protocol of serial communication, thereby driving the sorting mechanism to act. It triggers the camera to collect pictures in real-time, enables the sorting model to process in real-time, executes the program of the subordinate computer to drive the sorting mechanism in real-time, and tracks the status of Panax notoginseng on the conveyor belt in real-time. In this way, the problem that the identification signal is not synchronized with the sorting signal is solved. The flow chart of the system software control strategy is shown in Figure 9.

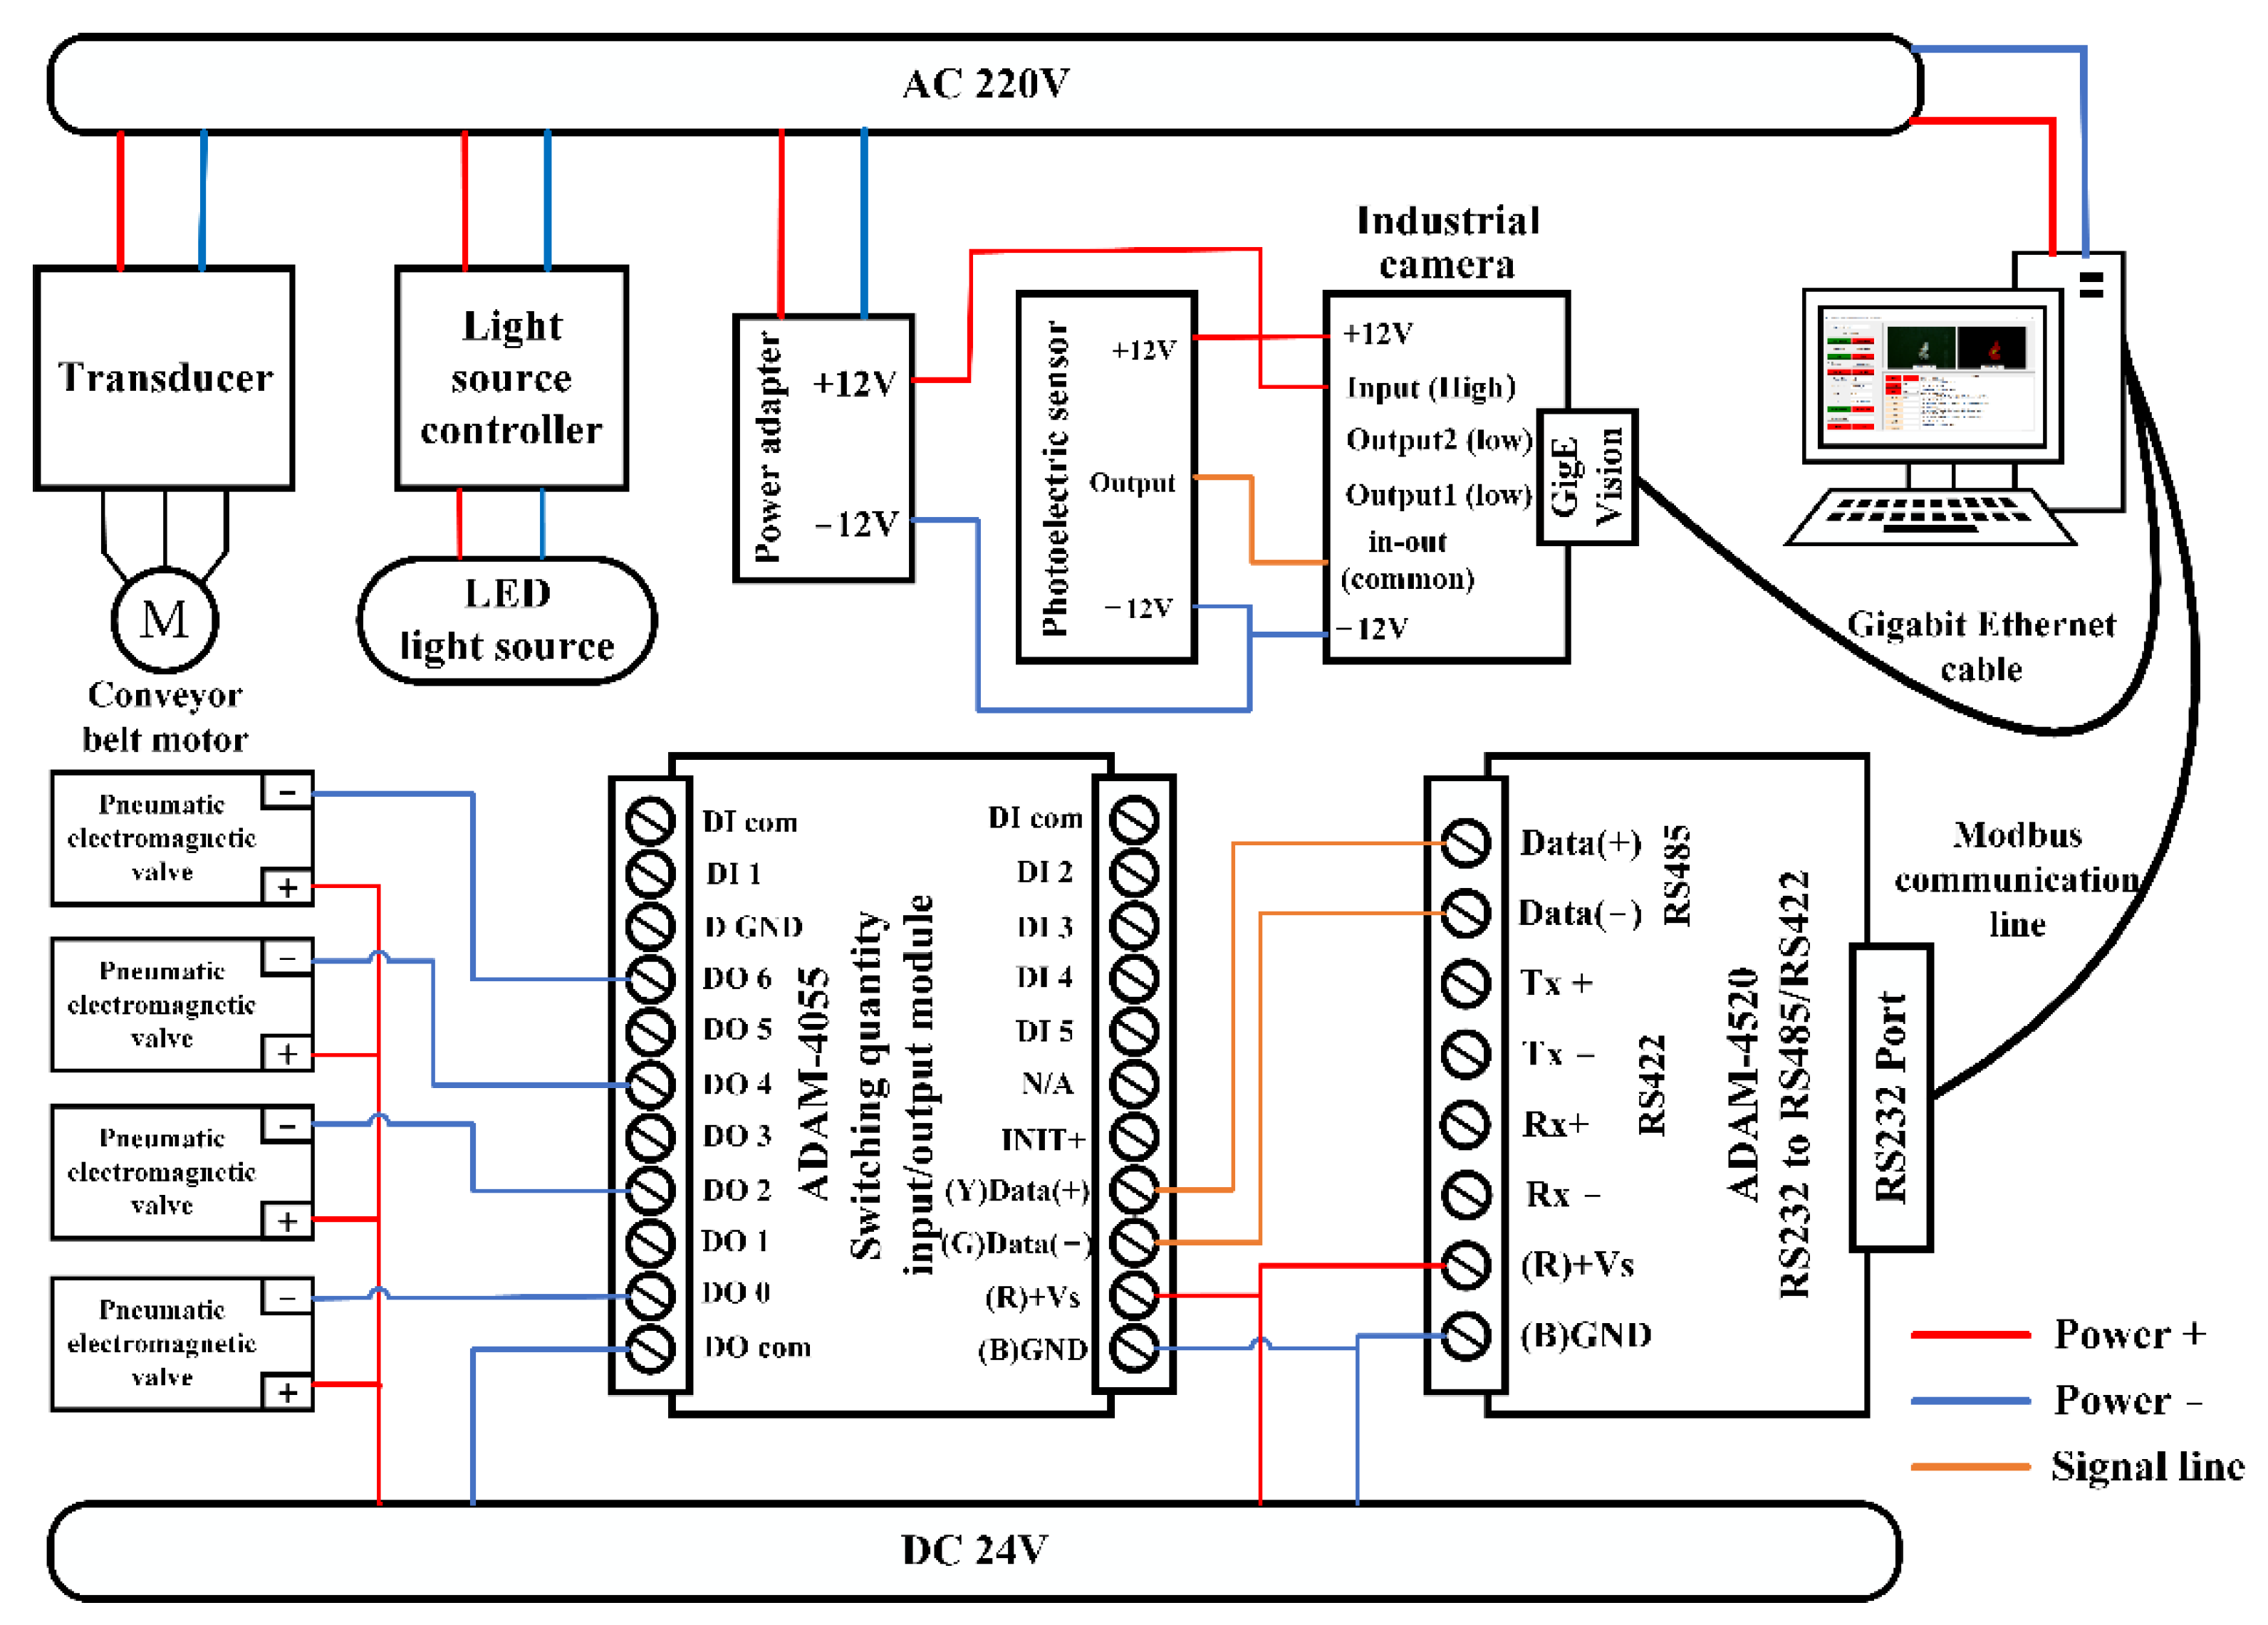
4.2.2. System Circuit Design

The circuit design of the system is shown in Figure 10. The devices used in this system test are powered by 220 and 24 V. The conveyor belt motor is a DC-geared motor, and the motor speed is controlled by a frequency converter. The image acquisition mechanism consists of industrial cameras, photoelectric sensors, four groups of strip light sources, and workstations. The workstation is connected to the industrial camera through the network port, and the camera parameters can be obtained and set by the software. The bar light source controls the light intensity through the light source controller. The lower computer control module includes the ADAM-4520 module, ADAM-4055 module, and solenoid valve. The ADAM-4520 module is connected to the serial port of the computer through a data cable, and they communicate through the Modbus protocol. The ADAM-4055 module receives the response signal of the ADAM-4520 module to drive the pneumatic solenoid valve to act. The pneumatic solenoid valve uses an external power supply of 24 V. The schematic diagram of the system circuit is shown in Figure 10.

4.2.3. Sorting Experiment

In this experiment, the taproots of Panax notoginseng fall from the feeding device and are transported to the image acquisition area through the conveyor belt in a single orderly arrangement. After the Panax notoginseng material is triggered by the photoelectric sensor, the upper computer software triggers the camera to collect images. The main thread judges whether there is a complete Panax notoginseng object in the current image and determines whether to start the sorting thread. The sorting thread runs the Panax notoginseng sorting model based on I-Xce-DeepLabv3+ for online detection, and it determines the grade and position information of the taproots of Panax notoginseng. The tracking thread receives the predicted grade and position of the sorting thread, calculates the delay time according to the running speed of the conveyor belt, and judges whether the Panax notoginseng has reached the sorting position. The air pump provides air pressure of 0.6 mpa for the sorting system, and the pneumatic solenoid valve controls the opening and closing of the sorting port. The workstation sends the sorting signal to the ADAM control module through the serial port and they communicate with the Modbus RTU protocol. The ADAM control module drives the pneumatic solenoid valve to blow various materials to each collection area through the sorting port, thereby realizing the sorting of Panax notoginseng. The human–computer interaction interface displays the current Panax notoginseng material image and the recognition result image in real-time, adjusts various parameters of the camera, sets the parameters of each actuator of the lower computer, and counts the current number of sorting and other functions. The whole experiment flow is illustrated in Figure 11.

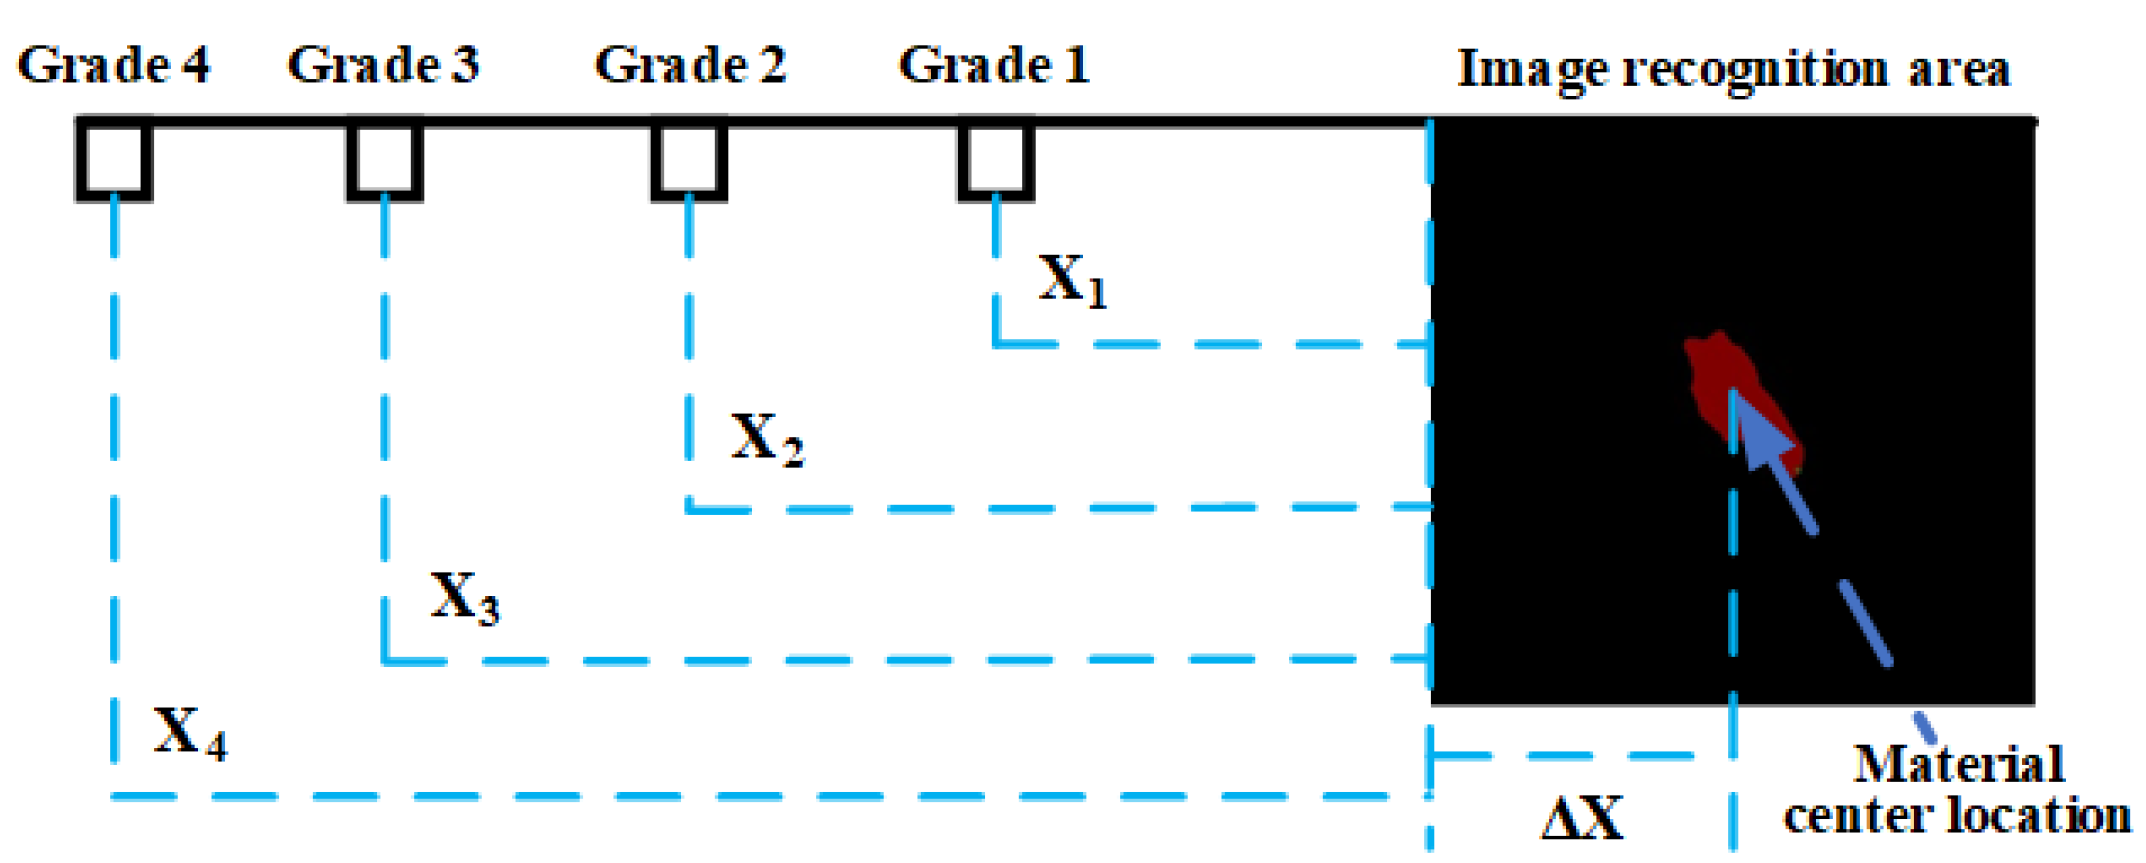
4.2.4. Positioning Delay Calculation

The system adopts time-delayed positioning to achieve precise positioning. The calculation of the delay time ( Δ t i ) of the sorting ports at all grades is shown in Formula (8):
Δ t i = Δ X v + t i t s
where i is the current material grade (i = 1, 2, 3, 4); t i is the delay time from the current material out of the image recognition area border to the air jet port ( t i = X i / v ); t s is the real-time recognition time of the current material; Δ X is the real-time distance from the center point of the current material to the left border of the image recognition area, as shown in Figure 12; v represents the speed of the current conveyor belt.
In the delay positioning, since the transmission of hardware information also takes time, the actual delay time needs to be fine-tuned for the above-mentioned delay time. In the single-channel test, when the conveyor belt speed was 1.81 m/s, the conveyor belt shook violently, which has a huge impact on image acquisition and sorting. Therefore, this paper set the conveyor belt frequency to be 50 Hz and the speed to 1.55 m/s to conduct the test. It takes about 0.25 s for the hardware equipment to acquire and recognize one image, so the material feeding spacing in the test is about 35 cm. At this time, the test sorting speed can reach four Panax notoginseng taproots per second. In this case, about 200–300 kg of Panax notoginseng taproots can be sorted within one hour in a single channel, which can replace three workers. With the continuous optimization of the hardware in the later stage and the continuous improvement in efficiency, the equipment will have better practical application value.

4.3. Experimental Evaluation Index

In the static recognition test, the recognition rate s and the misrecognition rate w of the sample are used as evaluation indicators. The recognition rate s of the sample refers to the ratio of the number m of the taproots of Panax notoginseng at this grade identified by the machine to the number M of the taproots of Panax notoginseng of this grade actually contained in the test material. The calculation formula is shown in Formula (9):
s = m M
The misrecognition rate w refers to the ratio of the number n of the taproots of Panax notoginseng recognized as the taproots of this grade and the total number k + n of the taproots of Panax notoginseng of this grade recognized by the machine. The calculation formula is shown in Formula (10):
w = n k + n
In the dynamic sorting test, the sorting rate u and the mis-selecting rate t of the samples are used as evaluation indicators. The sorting rate u of the sample refers to the ratio of the number a of Panax notoginseng taproots of this grade sorted by the machine to the number b of Panax notoginseng taproots of this grade actually contained in the test material. The calculation formula is shown in Formula (11):
u = a b
The mis-selection rate t refers to the ratio of the number v of the taproots of Panax notoginseng at this grade to the number of taproots of Panax notoginseng at this grade c + v recognized by the machine. The calculation formula is shown in Formula (12):
t = v c + v

4.4. Experimental Results and Analysis

4.4.1. System Static Recognition Experiment

To better evaluate the recognition accuracy of the I-Xce-DeepLabv3+ model for Panax notoginseng taproots, there were 50 test samples for each grade of Panax notoginseng taproots, a total of 200 samples. When the conveyor belt was stationary, the images of Panax notoginseng materials were collected and identified, and the recognition accuracy and error rate of the Panax notoginseng sorting model under static conditions were counted. The results are presented in Table 3.
It can be seen from Table 3 that the average recognition accuracy of the test is 81%, and the average error rate is 19%. Additionally, the model achieves the best recognition effect on the taproots of Panax notoginseng of grade 1, followed by the recognition effect of grade 4, and the sorting effect on the taproots of grades 2 and 3 is poor. Some grade 2 Panax notoginseng taproots were mistakenly classified as grade 1. Some grade 3 taproots of Panax notoginseng were mistakenly classified into grade 4. In the experiment, the taproots of Panax notoginseng between different grades were easy to sort incorrectly, and this is because they are too similar in shape and size. In the later stage, the recognition effect between different grades will be improved to further improve the model.

4.4.2. System Dynamic Sorting Experiment

In this experiment, the dynamic test samples of Panax notoginseng taproot were the same as those in the static test, with 50 samples of each type and a total of 200 samples. After all the samples were mixed, individual and orderly feeding was conducted through the feeding device. When the system was running dynamically, the camera exposure time was set to 650 us, and the gain was set to 10 dB. The taproots of Panax notoginseng entered the image recognition area in turn for recognition. The sorting mechanism sorted the current material according to the identification result. The statistical sorting test results of different grades of Panax notoginseng taproot are shown in Table 4.
It can be seen from Table 4 that the average sorting accuracy of the test is 77%, and the average false detection rate is 21.97%. Compared with the average recognition rate and the average false recognition rate of the static test, the average sorting accuracy of the notoginseng taproot samples of different grades decreased by about 4%, and the average false detection rate increased by about 2.97%. There are three main reasons for the decrease in sorting accuracy and the increase in false detection rate during the dynamic test. First, the material shakes due to the high speed of the conveyor belt, which causes the images collected by the camera to be blurred. Second, the camera exposure time was set to 650 us. The third is that the materials of Panax notoginseng are extremely irregular, and the state of Panax notoginseng was different each time it was detected, resulting in different sorting results. The test results indicate that the system initially meets the requirements of processing enterprises at this stage, and the production efficiency of a single channel can reach 2–3 times that of manual labor. In future work, we will optimize the hardware structure design of the system, reduce inaccurate sorting caused by hardware problems, improve the recognition accuracy and efficiency of the model, and further improve the system sorting efficiency of the taproots of Panax notoginseng.

5. Discussion

In recent years, automatic and intelligent production has become a development trend in sorting agricultural products, such as apples, lychees, and oranges. However, because Panax notoginseng is extremely irregular and difficult to identify and sort, it is challenging for the sorting production line to achieve efficient sorting, and manual sorting is still used. In previous studies on the sorting system of Araliaceae ginseng, only Seokhoon Jeong et al. used the combination of weight and vision to sort fresh ginseng [34]. The ginseng automatic sorting machine they built needs to go through two inspections, one is weighing, and the other is traditional image morphological processing and classification by the SVM algorithm. The sorting accuracy of the system is high, up to 93%. The judging standard of ginseng grade is weight, so the sorting accuracy of this system is high. Since it takes a certain amount of time for the weight sensor to weigh stably, the way the system uses weighing will limit the overall sorting speed. The traditional machine learning SVM algorithm has high sorting accuracy for small sample data, and its generalization ability is poor, making it difficult to achieve practical production applications. At the same time, the shape of the taproot of Panax notoginseng used in this study is more irregular than that of fresh ginseng. After the weighing is cancelled, it is more difficult it is to identify the taproot of Panax notoginseng only by image processing.
This study applied the DeepLabv3+ semantic segmentation model to the difficulty of notoginseng level recognition. The recognition accuracy and efficiency of the model are improved by improving the DeepLabv3+ network structure. The transfer learning ability of deep learning is used to solve the problem that the traditional Panax notoginseng image processing model has poor generalization ability and is difficult to be applied in practice. The control system of Panax notoginseng real-time sorting robot system is built by pure software. This method has no limitation of hardware structure, so that the sorting efficiency of the system has great potential to improve. Meanwhile, a real-time sorting robot system is built to realize automatic sorting of Panax notoginseng. This system can upgrade the current mode of notoginseng sorting and reduce its cost, which is significant for promoting the development of the Panax notoginseng sorting industry. However, the system also has some shortcomings, e.g., it can only detect the taproots of Panax notoginseng in order, and the sorting efficiency is not high enough. Multiple channels can be added to improve the sorting efficiency, but the equipment cost will be increased. In the future research, we will investigate the multi-target recognition and tracking algorithm of the taproots of Panax notoginseng to achieve multi-objective sorting of the taproots of Panax notoginseng and further improve the sorting efficiency.

6. Conclusions

This paper developed a real-time sorting robot system for Panax notoginseng taproots with an improved Deeplabv3+ model, which realizes fast and accurate sorting of Panax notoginseng taproots of different grades. The study results provide a reference for the sorting of Panax notoginseng taproots and irregular Chinese medicinal materials. The specific research conclusions are as follows:
(1) In this study, a classification model of Panax notoginseng taproots based on the improved Xce-Deeplabv3+ was established. The results show that compared with Xce-U-Net, Xce-PSPNet, and Xce-DeepLabv3+ models, the improved I-Xce-DeepLabv3+ achieves the best segmentation accuracy, with an MPA of 85.72% and an MIoU of 90.32% on the test set. By visualizing the segmentation effects of different models, it can be seen that the segmentation effect of I-Xce-Deeplabv3+ is closest to the original image labeling result. Therefore, the improved I-Xce-DeepLabv3+ model is used as the sorting model of the system.
(2) Compared with the static average recognition rate, the dynamic average recognition rate of the Panax notoginseng sorting robot system decreases by about 4–77%. The average misidentification rate increased by 2.97–21.97%. This is mainly due to the extremely irregular shape and size of Panax notoginseng materials and the jitter of the system hardware structure, which causes the image to be blurred; thus, reducing the sorting accuracy of the system. Meanwhile, the test shows that under a single channel, the system achieves a sorting efficiency of 200–300 kg/h when the conveyor belt speed is 1.55 m/s, so it can replace the manual work of three workers and meet the current primary requirements of Panax notoginseng processing enterprises.

Author Contributions

All authors contributed to the research. Conceptualization, F.Z.; data curation, Y.Z.; funding acquisition, F.Z. and X.C.; investigation, F.Z.; project administration, L.L., X.C. and Y.G.; resources, F.Z., L.L. and Y.G.; software, Y.L.; supervision, L.L., X.C. and Y.G.; visualization, Y.L. and Y.Z.; writing—original draft, Y.L. and Y.Z.; writing—review and editing, F.Z., Y.L. and L.L. All authors have read and agreed to the published version of the manuscript.

Funding

This study was supported by the Major Science and Technology Project of Yunnan Province (202102AA310048).

Institutional Review Board Statement

Not applicable.

Informed Consent Statement

Not applicable.

Data Availability Statement

The raw data required to reproduce these findings cannot be shared at this time as the data also form part of an ongoing study.

Acknowledgments

The authors would like to thank all the reviewers who participated in the review. We are thankful to the Department of Science and Technology of Yunnan Provincial for funding the project. We thank Yunnan Key Laboratory of Sustainable Utilization of Panax Notoginseng support in conducting the experiment.

Conflicts of Interest

Y.G. is an employee of Yixintang Pharmaceutical Group Ltd. The other authors declare that the research was conducted in the absence of any commercial or financial relationships that could be construed as a potential conflict of interest. No potential conflict of interest was reported by the authors. We declare that we have no conflict of interest.

References

  1. Que, Z.L.; Pang, D.Q.; Chen, Y.; Chen, Z.J.; Li, J.Z.; Wei, J.C. Current Situation of Planting, Harvesting and Processing of Panax notoginseng. Jiangsu Agric. Sci. 2020, 48, 41–45. (In Chinese) [Google Scholar] [CrossRef]
  2. Liu, D.-H.; Xu, N.; Guo, L.-P.; Jin, Y.; Cui, X.-M.; Yang, Y.; Zhu, X.-Y.; Zhan, Z.-L.; Huang, L.-Q. Qualitative characteristics and classification study on commodity specification and grade standard of Panax notoginsen. Chin. J. Chin. Mater. Med. 2016, 41, 776–785. [Google Scholar] [CrossRef]
  3. Prabhakar, M.; Raja, P.; Apolo, O.E.; Pérez-Ruiz, M. Intelligent Fruit Yield Estimation for Orchards Using Deep Learning Based Semantic Segmentation Techniques—A Review. Front. Plant Sci. 2021, 12, 684328. [Google Scholar] [CrossRef]
  4. Saleem, M.H.; Potgieter, J.; Arif, K.M. Automation in Agriculture by Machine and Deep Learning Techniques: A Review of Recent Developments. Precis. Agric. 2021, 22, 2053–2091. [Google Scholar] [CrossRef]
  5. Jia, W.; Zhang, Z.; Shao, W.; Hou, S.; Ji, Z.; Liu, G.; Yin, X. FoveaMask: A fast and accurate deep learning model for green fruit instance segmentation. Comput. Electron. Agric. 2021, 191, 106488. [Google Scholar] [CrossRef]
  6. Boogaard, F.P.; Rongen, K.S.A.H.; Kootstra, G.W. Robust node detection and tracking in fruit-vegetable crops using deep learning and multi-view imaging. Biosyst. Eng. 2020, 192, 117–132. [Google Scholar] [CrossRef]
  7. Rong, D.; Xie, L.; Ying, Y. Computer vision detection of foreign objects in walnuts using deep learning. Comput. Electron. Agric. 2019, 162, 1001–1010. [Google Scholar] [CrossRef]
  8. Zhao, J.Q.; Zhang, X.H.; Yan, J.W.; Qiu, X.L.; Yao, X.; Tian, Y.C.; Zhu, Y.; Cao, W.X. A Wheat Spike Detection Method in UAV Images Based on Improved YOLOv5. Remote Sens. 2021, 13, 3095. [Google Scholar] [CrossRef]
  9. Lee, U.; Islam, M.P.; Kochi, N.; Tokuda, K.; Nakano, Y.; Naito, H.; Kawasaki, Y.; Ota, T.; Sugiyama, T.; Ahn, D.H. An Automated, Clip-Type, Small Internet of Things Camera-Based Tomato Flower and Fruit Monitoring and Harvest Prediction System. Sensors 2022, 22, 2456. [Google Scholar] [CrossRef]
  10. Alam, M.S.; Alam, M.; Tufail, M.; Khan, M.U.; Güneş, A.; Salah, B.; Nasir, F.E.; Saleem, W.; Khan, M.T. TobSet: A New Tobacco Crop and Weeds Image Dataset and Its Utilization for Vision-Based Spraying by Agricultural Robots. Appl. Sci. 2022, 12, 1308. [Google Scholar] [CrossRef]
  11. Tufail, M.; Iqbal, J.; Tiwana, M.I.; Alam, M.S.; Khan, Z.A.; Khan, M.T. Identification of Tobacco Crop Based on Machine Learning for a Precision Agricultural Sprayer. IEEE Access 2021, 9, 23814–23825. [Google Scholar] [CrossRef]
  12. Arshaghi, A.; Ashourin, M.; Ghabeli, L. Detection and Classification of Potato Diseases Potato Using a New Convolution Neural Network Architecture. Trait. Du Signal 2021, 38, 1783–1791. [Google Scholar] [CrossRef]
  13. Zhou, H.Y.; Zhuang, Z.L.; Liu, Y.; Liu, Y.; Zhang, X. Defect Classification of Green Plums Based on Deep Learning. Sensors 2020, 20, 6993. [Google Scholar] [CrossRef] [PubMed]
  14. Fang, L.; Wu, Y.; Li, Y.; Guo, H.; Zhang, H.; Wang, X.; Xi, R.; Hou, J. Ginger Seeding Detection and Shoot Orientation Discrimination Using an Improved YOLOv4-LITE Network. Agronomy 2021, 11, 2328. [Google Scholar] [CrossRef]
  15. Kateb, F.A.; Monowar, M.M.; Hamid, M.A.; Ohi, A.Q.; Mridha, M.F. FruitDet: Attentive Feature Aggregation for Real-Time Fruit Detection in Orchards. Agronomy 2021, 11, 2440. [Google Scholar] [CrossRef]
  16. Li, D.; Sun, X.; Lv, S.; Elkhouchlaa, H.; Jia, Y.; Yao, Z.; Lin, P.; Zhou, H.; Zhou, Z.; Shen, J.; et al. A novel approach for the 3D localization of branch picking points based on deep learning applied to longan harvesting UAVs. Comput. Electron. Agric. 2022, 199, 107191. [Google Scholar] [CrossRef]
  17. Tian, Y.; Yang, G.; Wang, Z.; Li, E.; Liang, Z. Instance segmentation of apple flowers using the improved mask R–CNN model. Biosyst. Eng. 2020, 193, 264–278. [Google Scholar] [CrossRef]
  18. Gené-Mola, J.; Sanz-Cortiella, R.; Rosell-Polo, J.R.; Morros, J.-R.; Ruiz-Hidalgo, J.; Vilaplana, V.; Gregorio, E. Fruit detection and 3D location using instance segmentation neural networks and structure-from-motion photogrammetry. Comput. Electron. Agric. 2020, 169, 105165. [Google Scholar] [CrossRef]
  19. Minaee, S.; Boykov, Y.Y.; Porikli, F.; Plaza, A.J.; Kehtarnavaz, N.; Terzopoulos, D. Image Segmentation Using Deep Learning: A Survey. IEEE Trans. Pattern Anal. Mach. Intell. 2021, 44, 3523–3542. [Google Scholar] [CrossRef]
  20. Liu, M.; Jia, W.; Wang, Z.; Niu, Y.; Yang, X.; Ruan, C. An accurate detection and segmentation model of obscured green fruits. Comput. Electron. Agric. 2022, 197, 106984. [Google Scholar] [CrossRef]
  21. Su, D.; Kong, H.; Qiao, Y.; Sukkarieh, S. Data augmentation for deep learning based semantic segmentation and crop-weed classification in agricultural robotics. Comput. Electron. Agric. 2021, 190, 106418. [Google Scholar] [CrossRef]
  22. Kang, J.; Liu, L.; Zhang, F.; Shen, C.; Wang, N.; Shao, L. Semantic segmentation model of cotton roots in-situ image based on attention mechanism. Comput. Electron. Agric. 2021, 189, 106370. [Google Scholar] [CrossRef]
  23. Sun, K.; Wang, X.; Liu, S.; Liu, C. Apple, peach, and pear flower detection using semantic segmentation network and shape constraint level set. Comput. Electron. Agric. 2021, 185, 106150. [Google Scholar] [CrossRef]
  24. Hu, G.; Zhang, E.; Zhou, J.; Zhao, J.; Gao, Z.; Sugirbay, A.; Jin, H.; Zhang, S.; Chen, J. Infield Apple Detection and Grading Based on Multi-Feature Fusion. Horticulturae 2021, 7, 276. [Google Scholar] [CrossRef]
  25. Anh, P.T.Q.; Thuyet, D.Q.; Kobayashi, Y. Image classification of root-trimmed garlic using multi-label and multi-class classification with deep convolutional neural network. Postharvest Biol. Technol. 2022, 190, 111956. [Google Scholar] [CrossRef]
  26. Deng, L.; Li, J.; Han, Z. Online defect detection and automatic grading of carrots using computer vision combined with deep learning methods. LWT 2021, 149, 111832. [Google Scholar] [CrossRef]
  27. Baigvand, M.; Banakar, A.; Minaei, S.; Khodaei, J.; Behroozi-Khazaei, N. Machine vision system for grading of dried figs. Comput. Electron. Agric. 2015, 119, 158–165. [Google Scholar] [CrossRef]
  28. Sofu, M.M.; Er, O.; Kayacan, M.C.; Cetişli, B. Design of an automatic apple sorting system using machine vision. Comput. Electron. Agric. 2016, 127, 395–405. [Google Scholar] [CrossRef]
  29. Wu, Z.; Luo, K.; Cao, C.; Liu, G.; Wang, E.; Li, W. Fast location and classification of small targets using region segmentation and a convolutional neural network. Comput. Electron. Agric. 2020, 169, 105207. [Google Scholar] [CrossRef]
  30. Thuyet, D.Q.; Kobayashi, Y.; Matsuo, M. A robot system equipped with deep convolutional neural network for autonomous grading and sorting of root-trimmed garlics. Comput. Electron. Agric. 2020, 178, 105727. [Google Scholar] [CrossRef]
  31. Beeche, C.; Singh, J.P.; Leader, J.K.; Gezer, S.; Oruwari, A.P.; Dansingani, K.K.; Chhablani, J.; Pu, J. Super U-Net: A modularized generalizable architecture. Pattern Recognit. 2022, 128, 108669. [Google Scholar] [CrossRef] [PubMed]
  32. Chen, S.; Song, Y.; Su, J.; Fang, Y.; Shen, L.; Mi, Z.; Su, B. Segmentation of field grape bunches via an improved pyramid scene parsing network. Int. J. Agric. Biol. Eng. 2021, 14, 185–194. [Google Scholar] [CrossRef]
  33. Chen, Z.; Ting, D.; Newbury, R.; Chen, C. Semantic segmentation for partially occluded apple trees based on deep learning. Comput. Electron. Agric. 2021, 181, 105952. [Google Scholar] [CrossRef]
  34. Jeong, S.; Lee, Y.-M.; Lee, S. Development of an automatic sorting system for fresh ginsengs by image processing techniques. Hum.-Cent. Comput. Info 2017, 7, 41. [Google Scholar] [CrossRef] [Green Version]
Figure 1. Panax notoginseng real-time sorting robot system. 1—actuation system; 2—conveyor belt; 3—photoelectric sensor; 4—taproots of Panax notoginseng; 5—bar light source; 6—industrial camera; 7—computer; 8—low-level controller; 9—jet mouth.
Agriculture 12 01271 g001
Figure 2. Images of the four grades of Panax notoginseng taproot.
Agriculture 12 01271 g002
Figure 3. Schematic diagram of image enhancement in the dataset.
Agriculture 12 01271 g003
Figure 4. The network structure of the I-Xce-DeepLabv3+ model. Note: “Image” represents the original image, “Prediction” represents the predicted image, “DCNN” is the backbone feature extraction network, “Atrous Conv” is the atrous convolution, “f1, f2, f3, f4, f5” are the feature sizes output by the backbone feature network, and 1 × 1, 3 × 3 are the sizes of the convolution kernel.
Agriculture 12 01271 g004
Figure 5. The change in loss value with the number of iterations.
Agriculture 12 01271 g005
Figure 6. Loss curves of four different models.
Agriculture 12 01271 g006
Figure 7. Visualization of segmentation effects of different models.
Agriculture 12 01271 g007
Figure 8. The physical exploded view of the system. 1—control module; 2—image acquisition module; 3—pneumatic sorting module.
Agriculture 12 01271 g008
Figure 9. Flow chart of system software control strategy.
Agriculture 12 01271 g009
Figure 10. Schematic diagram of the system circuit.
Agriculture 12 01271 g010
Figure 11. System schematic diagram of the system experiment flow.
Agriculture 12 01271 g011
Figure 12. Schematic diagram of delayed positioning of material sorting.
Agriculture 12 01271 g012
Table 1. Comparison of three different semantic segmentation networks.
ModelModel Size/MTraining Time/hMPA/%MIoU/%
VGG16-U-Net52710 h60.275.34
ResNet50-PSPNet1787 h72.7883.67
Xception-DeepLabv3+1589 h78.9888.98
Table 2. Performance of different segmentation networks.
ModelModel Size/MDetection Time/sMPA/%MIoU/%
Xce-PSPNet2341.3573.9881.97
Xce-U-Net1050.6565.2175.89
Xce-DeepLabv3+1580.3478.9888.98
I-Xce-DeepLabv3+1520.2285.7290.32
Table 3. Recognition accuracy and error rate of the system under static conditions.
GradeRecognition Result
Grade 1Grade 2Grade 3Grade 4Recognition AccuracyAverage Value
Grade 14811096%81%
Grade 210355070%
Grade 30438876%
Grade 40454182%
Error rate17.2%20.4%22.4%16.3% 19%
Table 4. Sorting accuracy and false detection rate of the system under dynamic sorting.
GradeSorting Results
Grade 1Grade 2Grade 3Grade 4Sorting AccuracyAverage Value
Grade 14730094%77%
Grade 253213064%
Grade 301335270%
Grade 40284080%
False detection rate 9.62%36%37.5%4.76% 21.97%
Publisher’s Note: MDPI stays neutral with regard to jurisdictional claims in published maps and institutional affiliations.

