1. Introduction
Decision-making in Precision Agriculture (PA) everyday practices is progressively becoming more reliant on data, which can be periodically acquired from both environment and crop alike. Indeed, knowing the value of parameters that may have some bearing in crops’ phytosanitary condition and their development throughout a season, but that also enable a characterisation on both spatial and temporal variabilities with different degrees of granularity, can only be considered a great asset toward sustainable PA practices.
Data is usually acquired through remote and/or proximity sensing. Remote sensing data consists mostly of aerial imagery acquired by sensors that are coupled to one of three platforms: satellites, manned aircrafts and unmanned aerial vehicles (UAVs). Both sensors and platforms enable a multitude of application scenarios: while the former are able to acquire several types of data on different spectra ranges—e.g., RGB, near-infrared (NIR), thermal, multispectral, hyperspectral, LiDAR, ground penetrating radar (GPR)—, the latter provide options with regard to coverage, autonomy, cost, payload capacity (whose restrictions have been largely put aside due to the miniaturisation of sensors), geographic and atmospheric contexts, detail level, access, and the temporal frequency of data acquisition. It is fair to recognise the meaningful role that unmanned aerial systems (UAV + sensor + ground station) have had in PA in the last few years. Conversely, proximity sensing data derives from in-field sensors, able of acquire agrometeorological parameters’ samples—e.g., temperature, relative humidity, solar radiation, precipitation—, but also of those that characterise plants’ development, through the so-called phytosensors—e.g., dendrometers, granier probes to estimate sap flow. Deploying electronics in both harsh and remote environments has its own set of challenges, such as power, robustness, data transmission and granularity [
1]. While the latter directly affects cost—more spatial detail usually means placing additional sensors—, power requirements are a direct consequence of the number and type of parameters to be measured, but also from the temporal detail intended (i.e., more readings mean more power).
Either in remote or in proximity sensing, image sensors have been proven to provide rigorous qualitative and quantitative assessments of plants’ phenological development, as well as of their context [
2,
3]. Indeed, valuable information can be extracted from this imagery, including plants’ phenological status—upon which many cultural practices are based of—, and morphological/other changes that may indica the existence of several anomalies, such as nutritional deficiencies [
4,
5], diseases manifestation [
6], thermal stress [
7], water stress [
8], among others. However, there are still many contexts—geographical, environmental, crop-related, socio-economic and technological—where the trained human eye is critical in evaluating parameters in the field, so simply technological approaches are not yet able to mimic a trained human eye. Therefore, image sensors are capable of acquiring data that can potentially become useful in training automated approaches to measure parameters traditionally assessed by the trained human eye.
Viticulture has been steadily knowing significant technological advances from research & development work done worldwide [
9]. Whereas the technology integration rate could be better in Precision Viticulture (PV), both the food and wine markets remain very relevant in the world’s economy and social structure. However, viticulture continues to be perceived as largely traditional and reliant on human’s experience has a support to the decision-making process. All things considered, using image sensors able to capture different spectra coupled together with monitoring systems dully scattered in the field can be particularly relevant in vineyard management practices. In fact, they will enable the training of artificial intelligence (AI) systems capable of mimicking the human eye and therefore of somehow incorporating acquired experience. This approach is presented herein and it will change today’s reality in viticulture regarding periodic trips that experts need to do to the vineyard—e.g., in the harvesting season, a daily in situ assessment is needed to determine following day operations—when just one observation could eventually be enough to support the decision-making process. Some examples of practices that require an expert’s direct and frequent observation in the vineyard are the budding of vines, checking for signs of diseases, assessing vines phenological status and also their evolution.
Current technological development in electronics, communications and embedded systems provides solutions to master both in-field data acquisition processes and devices [
10]. Furthermore, these solutions are compatible with an autonomous operation, have a low energy consumption that enables them to function by harvesting power from the environment, can be integrated in the landscape so that the impact in both the culture and also in the cultural practices is minimised, and often present a very low cost [
11]. These solutions can incorporate image sensors enabling the assessment of parameters that would otherwise be very difficult to quantify. VineInspector system is presented in this paper. It is based on a low-cost, autonomous single-board computer (SBC), which can easily be installed in a vineyard. It has a set of RGB cameras whose sole purpose is to enable the early detection of vine diseases incidence. Two example applications were developed within this study: downy mildew incidence risk calculation and the counting of grape moth, captured in insect traps. Image analysis through AI is used in both applications. The potential risk of downy mildew infection occurrence can be estimated through the automatic detection of vines’ phenological state [
12]—specifically sprouting, as grapevine shoots’ size is key to estimate the potential risk of downy mildew infection—based on the well-known 3–10 rule [
13]. The rule is called 3–10 because it assumes that primary infections are likely to happen when the following conditions occur simultaneously: air temperature is equal or higher than 10 °C during the previous 24–48 h, at least 10 mm of continuous rain has fallen during the previous 24–48 h, and grapevine shoots measure at least 10 cm long [
14]. As for grape moth, the analysis, classification and tally of insects that contain a pheromone to attract grape moth males and that were captured in traps, enable an automatic risk assessment and the triggering of both preventing and mitigating interventions.
The paper is organised as follows:
Section 2 presents the state-of-the-art of image classification with regard to grapevine downy mildew detection and prediction, as well as to the evolution of trapped insects automatic tally.
Section 3 has a detailed description of Vineinspector’s hardware and software components. Moreover, the methodology followed to implement an experimental AI-based classification engine is also presented, together with the two case-study applications developed.
Section 4 presents the results and a detailed discussion. Lastly,
Section 5 finishes the paper with some conclusions drawn from practical infield evaluations and presents future work.
2. Image Classification
Having still images or video captured by in-field data acquisition devices represents (i) an added cost of equipping them with cameras; and (ii) the ability to transmit larger data files to a digital structure locate elsewhere. The upside is that crops’ dynamics may be monitored using proximity image-based approaches, provided that acquired images’ features are (automatically) detected and classified. While well-known computer vision techniques—such as feature descriptors for object detection—may be used to this purpose, they mostly require that important features are to be chosen in each image. Given both the complexity and heterogeneity present in in-field crop-related images—e.g., there are not two plants that develop exactly the same way—, together with the environmental context—e.g., lighting conditions—the number of classes to classify is bound to increase. Therefore, image’ features classification becomes more and more cumbersome, requiring more resources to be accomplished in a timely manner. An end-to-end learning concept was introduced with Machine Learning (ML). Indeed, the most common approach in PA (supervised learning) is to have a set of annotated images—where different object classes that may be present in each image are outlined—processed by learning algorithms to train neural networks. After that, the latter should be capable of automatically classifying these same object classes in other images. Since each solution is trained rather than programmed, applications such as image classification, semantic segmentation and object detection have become faster, more accurate, highly flexible and require less intervention from experts.
Image classification in PA is currently being extensively researched and has already some applications deployed. However, this paper deals specifically on proximity images acquired by in-field data acquisition devices to support PV practices. Both case studies—one to predict primary downy mildew infection by determining the size of the very first grapevines’ shoots (one of the required parameters in the 3–10 rule); and the other to tally grapevine moth males captured in sex traps—address key issues in vineyard management. As such and for the sake of conciseness, this section will only present published work that is somewhat related with these two case studies.
2.1. Downy Mildew
Downy mildew is a disease originating in the American continent and accidentally brought to Europe in the 1870s, through French territory [
15,
16]. It spread quickly and is now the most destructive pathogen in wine growing regions with rainy springs/summers [
17]. Downy mildew is caused by the
Plasmopara viticola (Berk. & M.A. Curtis) fungus [
18]: an endoparasite that develops inside grapevine’ organs and can infect virtually each and every green organ, particularly the shoots, leaves, inflorescences, tendrils and even the petioles [
19,
20]. With favourable weather conditions, this disease can cause heavy losses for grape growers. Indeed, in extreme situations it can lead to a total production loss [
21]. Early detection is not simple, given that observable symptoms usually appear 7 to 10 days after the infection. However, it is key in controlling the spread of downy mildew [
22]. This is the main reason why the potential risk of infection is determined by government agricultural agencies in many countries, through prediction models that are based on weather forecasts and in data acquired from meteorological stations [
23,
24,
25]. Monitored regions’ variability associated with data granularity coming from weather stations, makes forecasts often less accurate and timely. Furthermore, to the best of our knowledge all readily available monitoring techniques make use only common agrometeorological data, such as air temperature and accumulated precipitation. They may also include data from leaf wetness sensors, among others. However, the beginning of the vegetative cycle—bud break—varies in different agrometeorological contexts, as well as with the grapevines’ varieties. Indeed, it is usually detected by in-field direct visual observation, even though it can be predicted considering the evolution of climatic conditions.
This section reviews the most relevant published research work on the prediction and/or detection of downy mildew in crops, especially those that use images to assess the existence of early symptoms of the disease.
The 3–10 rule is used by Pérez-Expósito et al. [
14,
26] in their VineSens system: a platform to provide decision support in vineyard management. This work is relevant mainly because it provides further validation on the use of the 3–10 rule in downy mildew risk assessment. VineSens relies on a wireless sensor network made up of autonomous sensor nodes that acquire and store meteorological data. Through this data and using epidemiological models—specifically the 3–10 rule—the system alerts when the downy mildew infection risk reaches a certain threshold and therefore preemptive measures must be taken. Resorting to image processing, Sobolu et al. [
27] developed a technique for the automatic detection of downy mildew. Segmentation techniques were applied in various colour spaces and the experimental results showed that in HSV colour space the disease was quite correctly recognised. The authors state that this technique can detect leaf symptoms even in the onset phase and is therefore able to help prevent the spread of infection throughout the whole vineyard.
Both Lloret et al. [
28] and Kim et al. [
29] approaches rely on images acquired from fixed spots within the field. The former presents a wireless sensor network in which each node has the capability not only to acquire images, but also to detect any abnormal state in plant’ leaves through image processing techniques. If a deficiency is identified, the sensor node notifies the farmer by sending a message. Although no images are transmitted to outside the sensor nodes, this approach resorts to proximity images and local processing to extract useful information for decision support systems. Indeed, the authors suggest that it will be possible to add a database with images of symptoms, together with a trained neural network to provide accurate diagnosis from a local perspective. As for Kim et al. [
29], the authors have developed an automatic real-time disease monitoring system, for the early detection of downy mildew symptoms in onions. Images are acquired using a PTZ (pan, tilt, zoom) camera and leaves’ infected regions are identified by using a DNN (deep neural network) model, based on the VGG16 architecture. Hence, both works enable to identify the infection as soon as it onsets on leaves’ color and/or shape.
As for Abdelghafour et al. [
30,
31], they studied the potential of using proximity colour images to detect downy mildew symptoms in grapevines. Images are acquired through an in-field imaging sensor coupled to a tractor. Furthermore, an algorithmic strategy for the detection of various forms of leaf symptoms in high-resolution proximal images is also presented. The authors concluded that this approach enables both the reliable detection of downy mildew symptoms and is able to estimate affected tissues’ area.
2.2. Insect Tally
A possible way to deal with some crop’ pests is by installing pheromone diffusers in fields. They work by saturating the nearby atmosphere with pests’ female sex pheromones, thus creating sexual confusion in males. This technique aims at mislead the adult moth male by hindering chemical communication between sexes, therefore preventing moth females from laying fertile eggs and significantly reduce pests impact on crops [
32]. These pheromones are used in sticky traps, where males are captured.
Therefore, traps yield information about the timing of the appearance and activity of certain pests and auxiliaries, allowing treatments to be carried out at the right time. However, the tally of captured insects is still mainly done visually through field work, which is time consuming, expensive and can always introduce delays in the decision-making process. There are a few more papers to address in this application, when comparing with downy mildew detection and/or infection risk prediction.
Espinoza et al. [
33] proposed an approach to detect and monitor two of the most aggressive pests affecting tomato-producing greenhouses on southern Spain: the whitefly (
Bemisia tabaci—Gennadius, 1889) and thrips (
Frankliniella occidentalis—Pergande, 1895). Both are caught using sticky traps. This detection and monitoring is carried out based on the combination of image processing and artificial neural networks. Digital images of sticky traps are obtained using an image acquisition system and the detection of objects in the images, segmentation and estimation of morphological and colour properties are performed by an image processing algorithm for each of the detected objects. Classification is performed using a feed-forward multi-layer artificial neural network. The proposed whitefly identification algorithm achieved an accuracy of 96% and thrips identification an accuracy of 92%. Song et al. [
34] proposed a method that can be applied to noisy images from sticky traps to identify and classify three insect species—
Harpalus affinis (Schrank, 1781),
Sternolophus rufipes (Fabricius, 1792), and
Hydrophilidae spp. (Latreille, 1802)—, also enabling the tally of each species’ individuals. The authors’ aim was not to propose a method that stood out from the existing ones with regard to general performance, but rather to develop a method that had the best performance for the considered species. These species have the particularity that individuals’ body reflects light, which is key to the insect identification process. Individual insects are distinguished through the light points created by the light reflection on their backs. Accuracy was of 99.47%, 96.41% and 89.91% when identifying
Harpalus affinis,
Sternolophus rufipes, and
Hydrophilidae spp., respectively. Ramalingam et al. [
35] proposed a remote and real-time monitoring system for insect sticky traps, as well as an insect detection method using Deep Learning (DL) techniques. The monitoring system consists of end nodes with a smart wireless camera oriented to the sticky trap. Insects detection and classification is done by using a Faster Region-based Convolutional Neural Network (R-CNN) ResNet-50 that was trained using images of built environment insects and farm field insects. According to the experimental results, the authors found that the proposed system can automatically identify insects present in the traps with an average accuracy of 94%. Liu et al. [
36] featured a new end-to-end convolutional neural network-based automatic pest detection architecture called PestNet. It consists of three main parts: automatic resource extraction is performed using a channel-spatial attention (CSA) module; the second part is called the region proposal network (RPN), which is adopted to provide region proposals such as positions of potential pests based on feature maps extracted from images; lastly, the third part consists of using a position-sensitive score map (PSSM) that was used instead of fully connected layers to reduce the classification computational cost. In addition, the authors also applied contextual regions of interest (RoIs) as contextual information of pest characteristics to improve detection accuracy. The authors tested this approach using a 10-year dataset they created (Multi-class Pests Dataset 2018—MPD2018) and the experimental results show that PestNet performs well in detecting multi-class pests, achieving an average accuracy of 75.46%. Ding et al. [
37] proposed an automatic detection system based on DL for identifying and counting pests in images obtained from field traps. The pest detection method is based on a convolutional neural network (ConvNet), which offers the advantage of being accurate and fast, requiring minimal data pre-processing. Qualitative and quantitative experiments demonstrate the effectiveness of the proposed method on a codling moth dataset. Compared to other insect detection approaches, this method does not use pest-specific engineering, which allows it to be easily extended to other species and environments.
These last few works are even more closely related to VineInspector. Rustia et al. [
38] developed and tested a system based on a wireless sensor network that uses camera modules and environmental sensors to simultaneously and continuously acquire insect traps images and measure temperature, relative humidity and light intensity in greenhouses. Each wireless sensor network node is based on a Raspberry Pi 3, to which a Raspberry Pi Camera v2 module and add-on environmental sensors are connected. An image processing algorithm was developed to automatically detect and count insects present in sticky traps with 93% average temporal detection accuracy, when compared with manual counting. The developed processing algorithm runs on a remote server and aims to segment objects from the background and filter non-insect objects. For this, the authors use colour space change and colour segmentation techniques to isolate potential insects. Then, a Support Vector Machine (SVM) classifies data to verify if it is actually an insect or not. Bakkay et al. [
39] developed a method to detect, recognise and tally insects, more precisely European grapevine moth (
Lobesia botrana, Denis & Schiffermüller), in trap’ images. This approach aims to analyse the tally’s evolution to adapt treatments and thus avoid whenever possible the application of pesticides. The segmentation process involves two main contributions: (i) the use of an adaptive k-means clustering that is able to eliminate different types of noise, i.e., artefacts or non-insect elements; and (ii) the use of a region merging algorithm for separating touching insects. The authors state that quantitative evaluations show that the proposed method can detect insects with higher accuracy than other commonly used approaches. Zhong et al. [
40] presented an image-based system to detect, classify and tally six species of flying insects: bees, flies, mosquitoes, moths, chafers and fruit flies. The system is composed of a yellow sticky trap installed in the insect monitoring area, which in turn is observed by a camera that collects images in real time. The detection and coarse counting method is based on YOLO object detection system. With regard to the training stage, it was carried out using a single class containing all the six insect species. Classification and fine counting of insects was performed using a SVM. Based on the YOLO and SVM combination, the need for training data is minimised. This system has been implemented on a Raspberry Pi and test results can be sent to an agricultural monitoring service platform, which is the basis for providing accurate prevention and treatment methods based on a combination of pest information and other environmental data. An average counting accuracy of 92.50% and an average classification accuracy of 90.18% were obtained, thus showing a promising performance.
In Lima et al. [
41], Preti et al. [
42] and Júnior et al. [
43] several other works developed in the scope of insects identification, classification and tally in traps can be found.
This small set of reference research work does unequivocally show that the use of proximity images in PA is swiftly progressing. Furthermore, image classification is being done by using different artificial intelligence approaches. The next section will present in detail VineInspector: a system designed to be able to capture images by multiple local cameras, acquire agro-meteorological data, and use an artificial intelligence approach with this heterogeneous data to extract valuable knowledge for PV practices.
3. The VineInspector
This section presents the VineInspector system in all it’s dimensions: (i) hardware setup to manage, acquire and transmit data from both sensors and cameras; (ii) software to self-manage and to handle acquired data; and (iii) the interaction with a remote cloud-based platform (mySense [
44]) through web-services, whose aim is to classify field-acquired images. The experimental setup and the two case-study applications are also presented.
3.1. Hardware Architecture
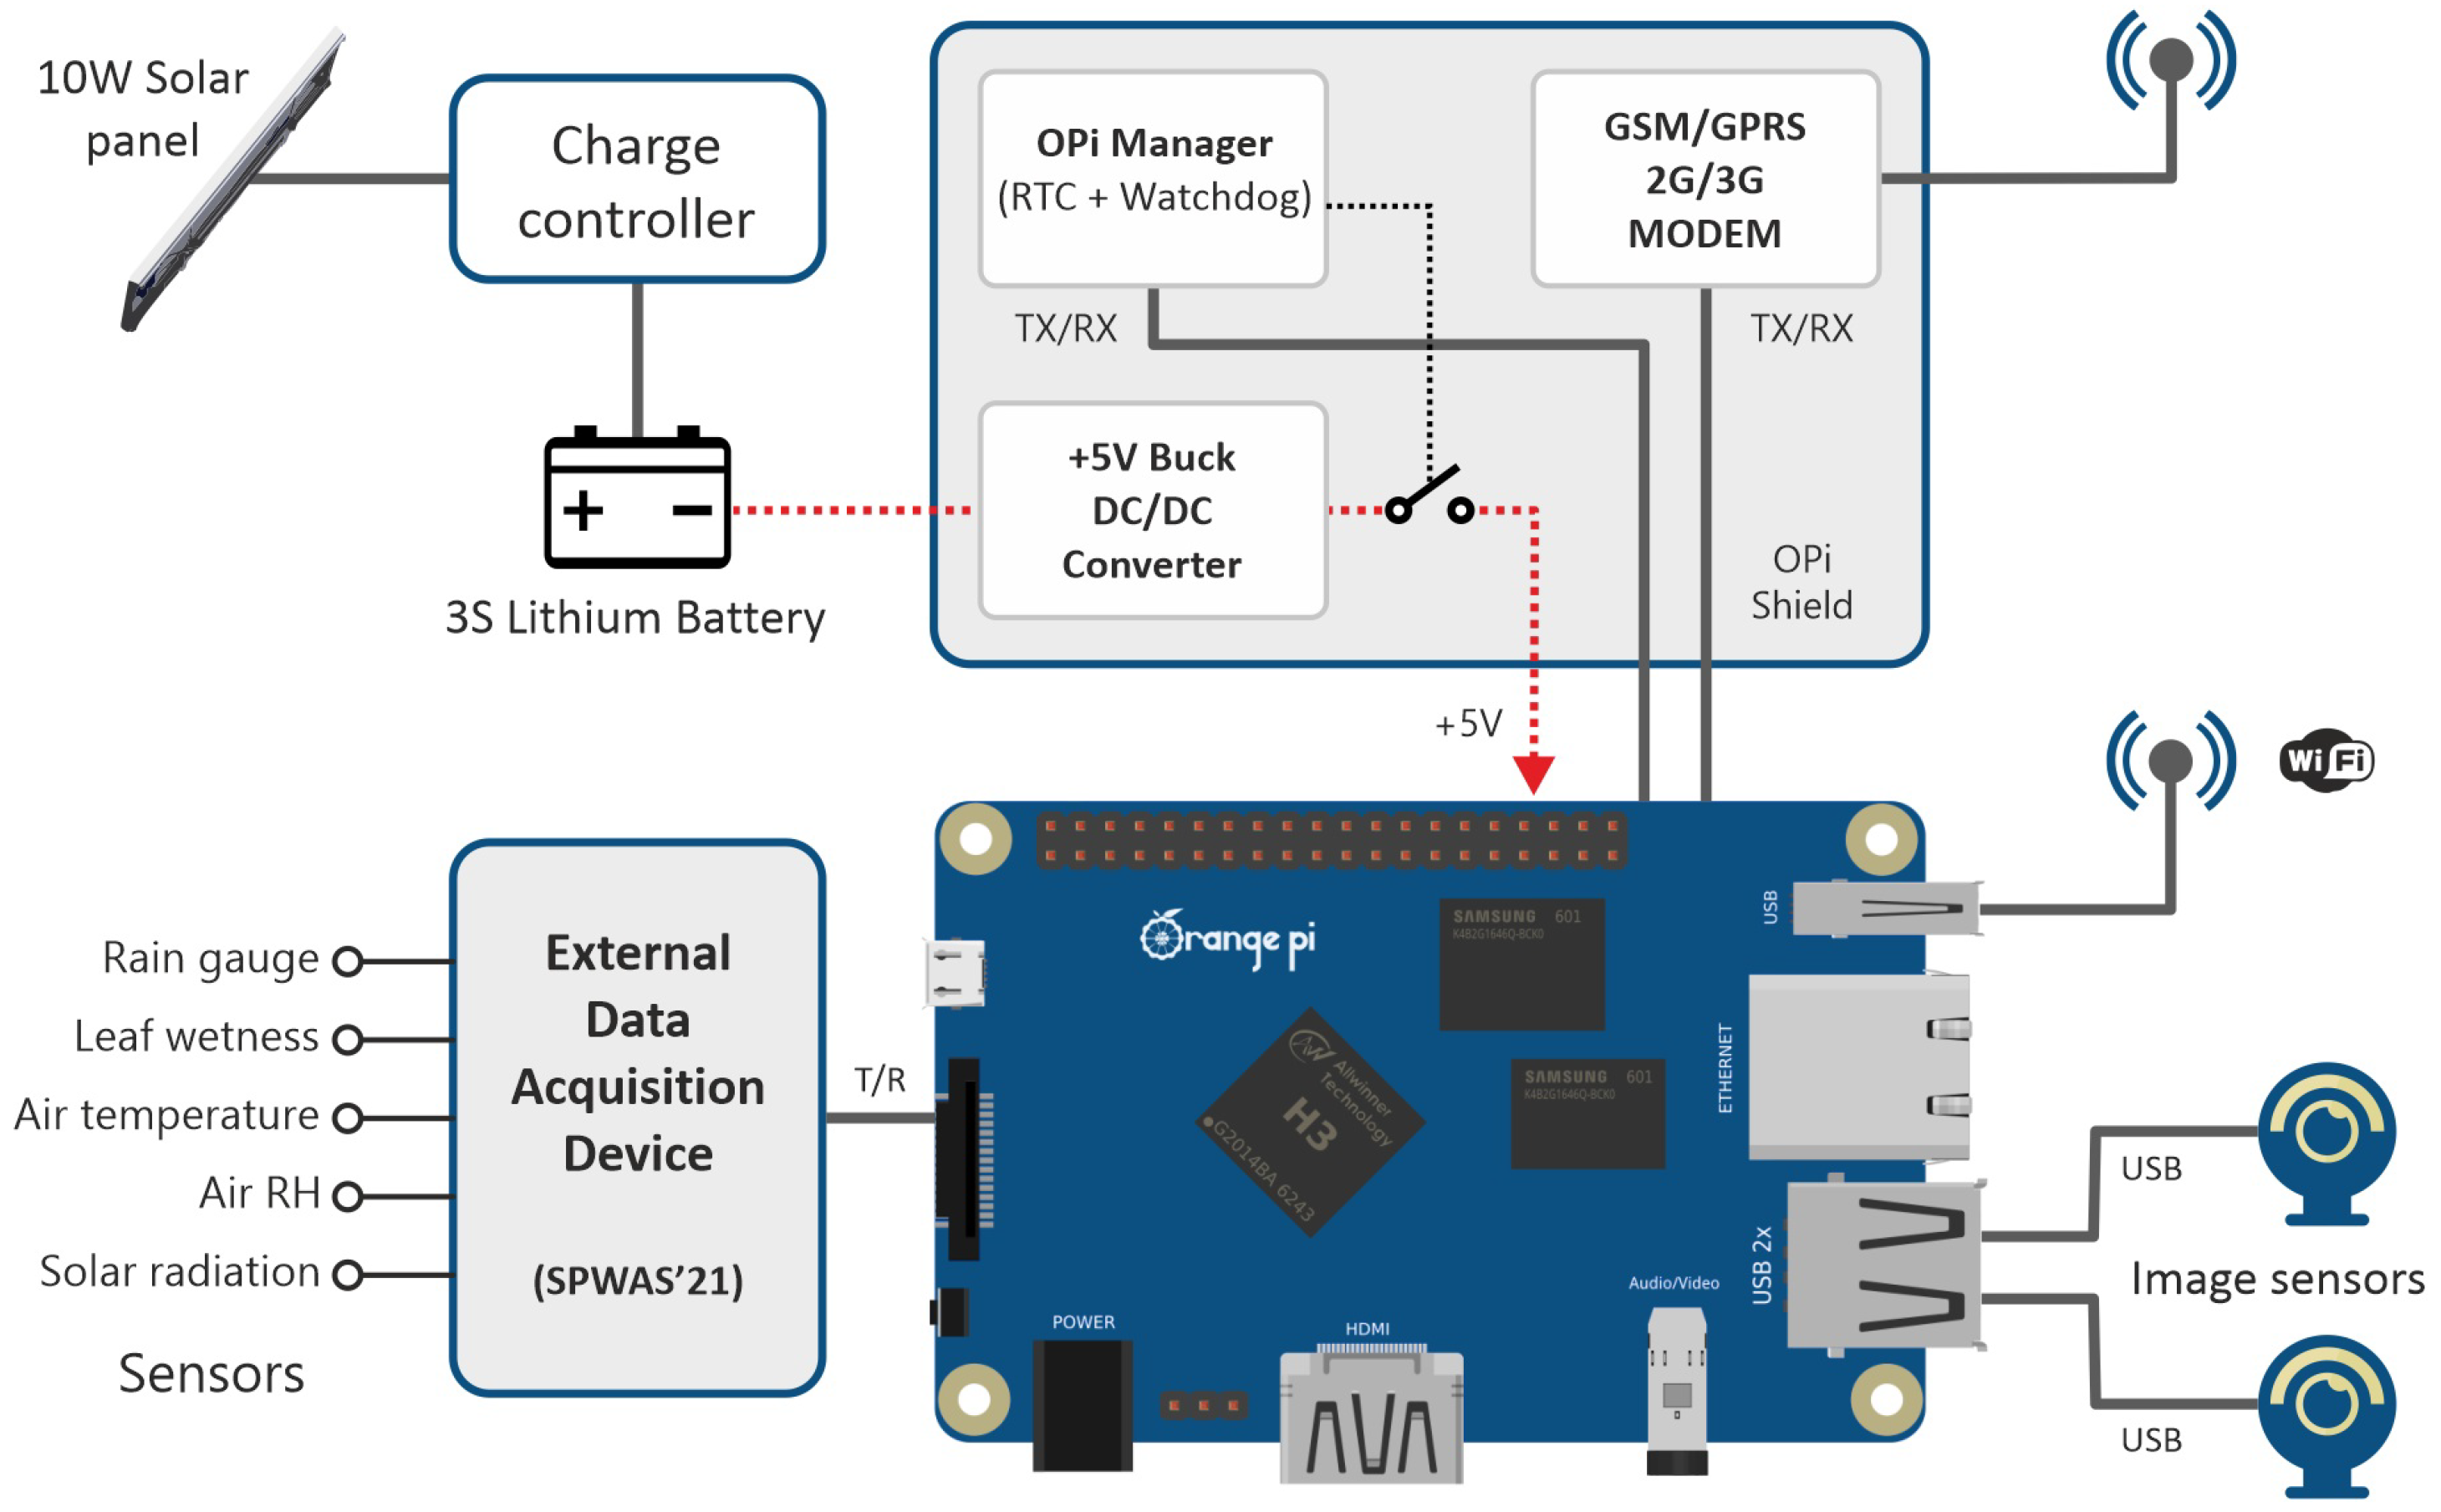
VineInspector was built around a low-cost Single Board Computer (SBC) Orange Pi PC Plus, OPi, (Shenzhen Xunlong Software Co., Ltd., Shenzhen, China) and a shield specifically designed to accommodate auxiliary power control circuits for the entire system, as well as to provide a GSM/GPRS 2G/3G connection with a remote cloud-based platform. Furthermore, a 3S 18650 lithium battery charger and balance protection board (Sure Electronics, George Town, Malaysia) is used to recharge three 3000 mAh batteries with energy harvested from the sun through a 10 W solar panel. A simplified hardware diagram is presented in
Figure 1.
The shield has a low-power microcontroller (PIC32MM0064GPL028 from Microchip Technology Inc., Chandler, AZ, USA) responsible for managing OPi’s power supply. Communication between the shield and the OPi is done through a serial communication interface (RX/TX). To ensure that the OPi is never left permanently on, a watch-dog timer (WDT) function has been implemented in this microcontroller. The WDT timeout is reset always that the OPi changes the state of a control pin. If this change does not occur within 20 s, the WDT causes a system restart by a power cycle. With regard to communication with the cloud-based remote platform, the shield uses a GSM/GPRS 2G/3G Telit GL865-QUAD-V3 modem (Telit Wireless Solutions, London, UK). As for local connections, an IEEE 802.11x (Wi-Fi) network is also available. Through this local network, VineInspector can both be configured and/or have it’s data accessed, via a smartphone app. This connection is turned on and off by a push button on the shield (not shown in
Figure 1).
Orange Pi PC Plus was chosen because it is one of the best price/features ratio SBCs. Moreover, it also includes an embedded Multi-Media Card (eMMC) memory, where the entire file system can be kept. This solution makes it less vulnerable to failures such as those that occur with the traditional microSD flash memory card and corresponding mechanical contact/spring interface. One last reason to have chosen OPi is that it has a sleep mode that saves power when not in use. To extend OPi’s capability to interact with different types of sensors and also to be able to have them acquire data during the long periods in which OPi is turned off, an external data acquisition system—SPWAS’21—was used. It is important to mention that this low-cost and low-power system has a fully OPi-compatible serial interface and was developed in a previous work. It can be found at [
45]. With regard to image acquisition, low-cost USB cameras are used. Each has associated an image channel.
3.2. Software Architecture
VineInspector has three software components worth to mention: (i) firmware embedded in the shield’s microcontroller, which ensures the system’s correct operation; (ii) OPi’s software that fundamentally enables data gathering, temporary storage and transmission; and (iii) remote cloud-based platform application, developed based on an AI approach. It enables the classification of visual elements present in the transmitted images. These three software components are succinctly explained in the following subsections.
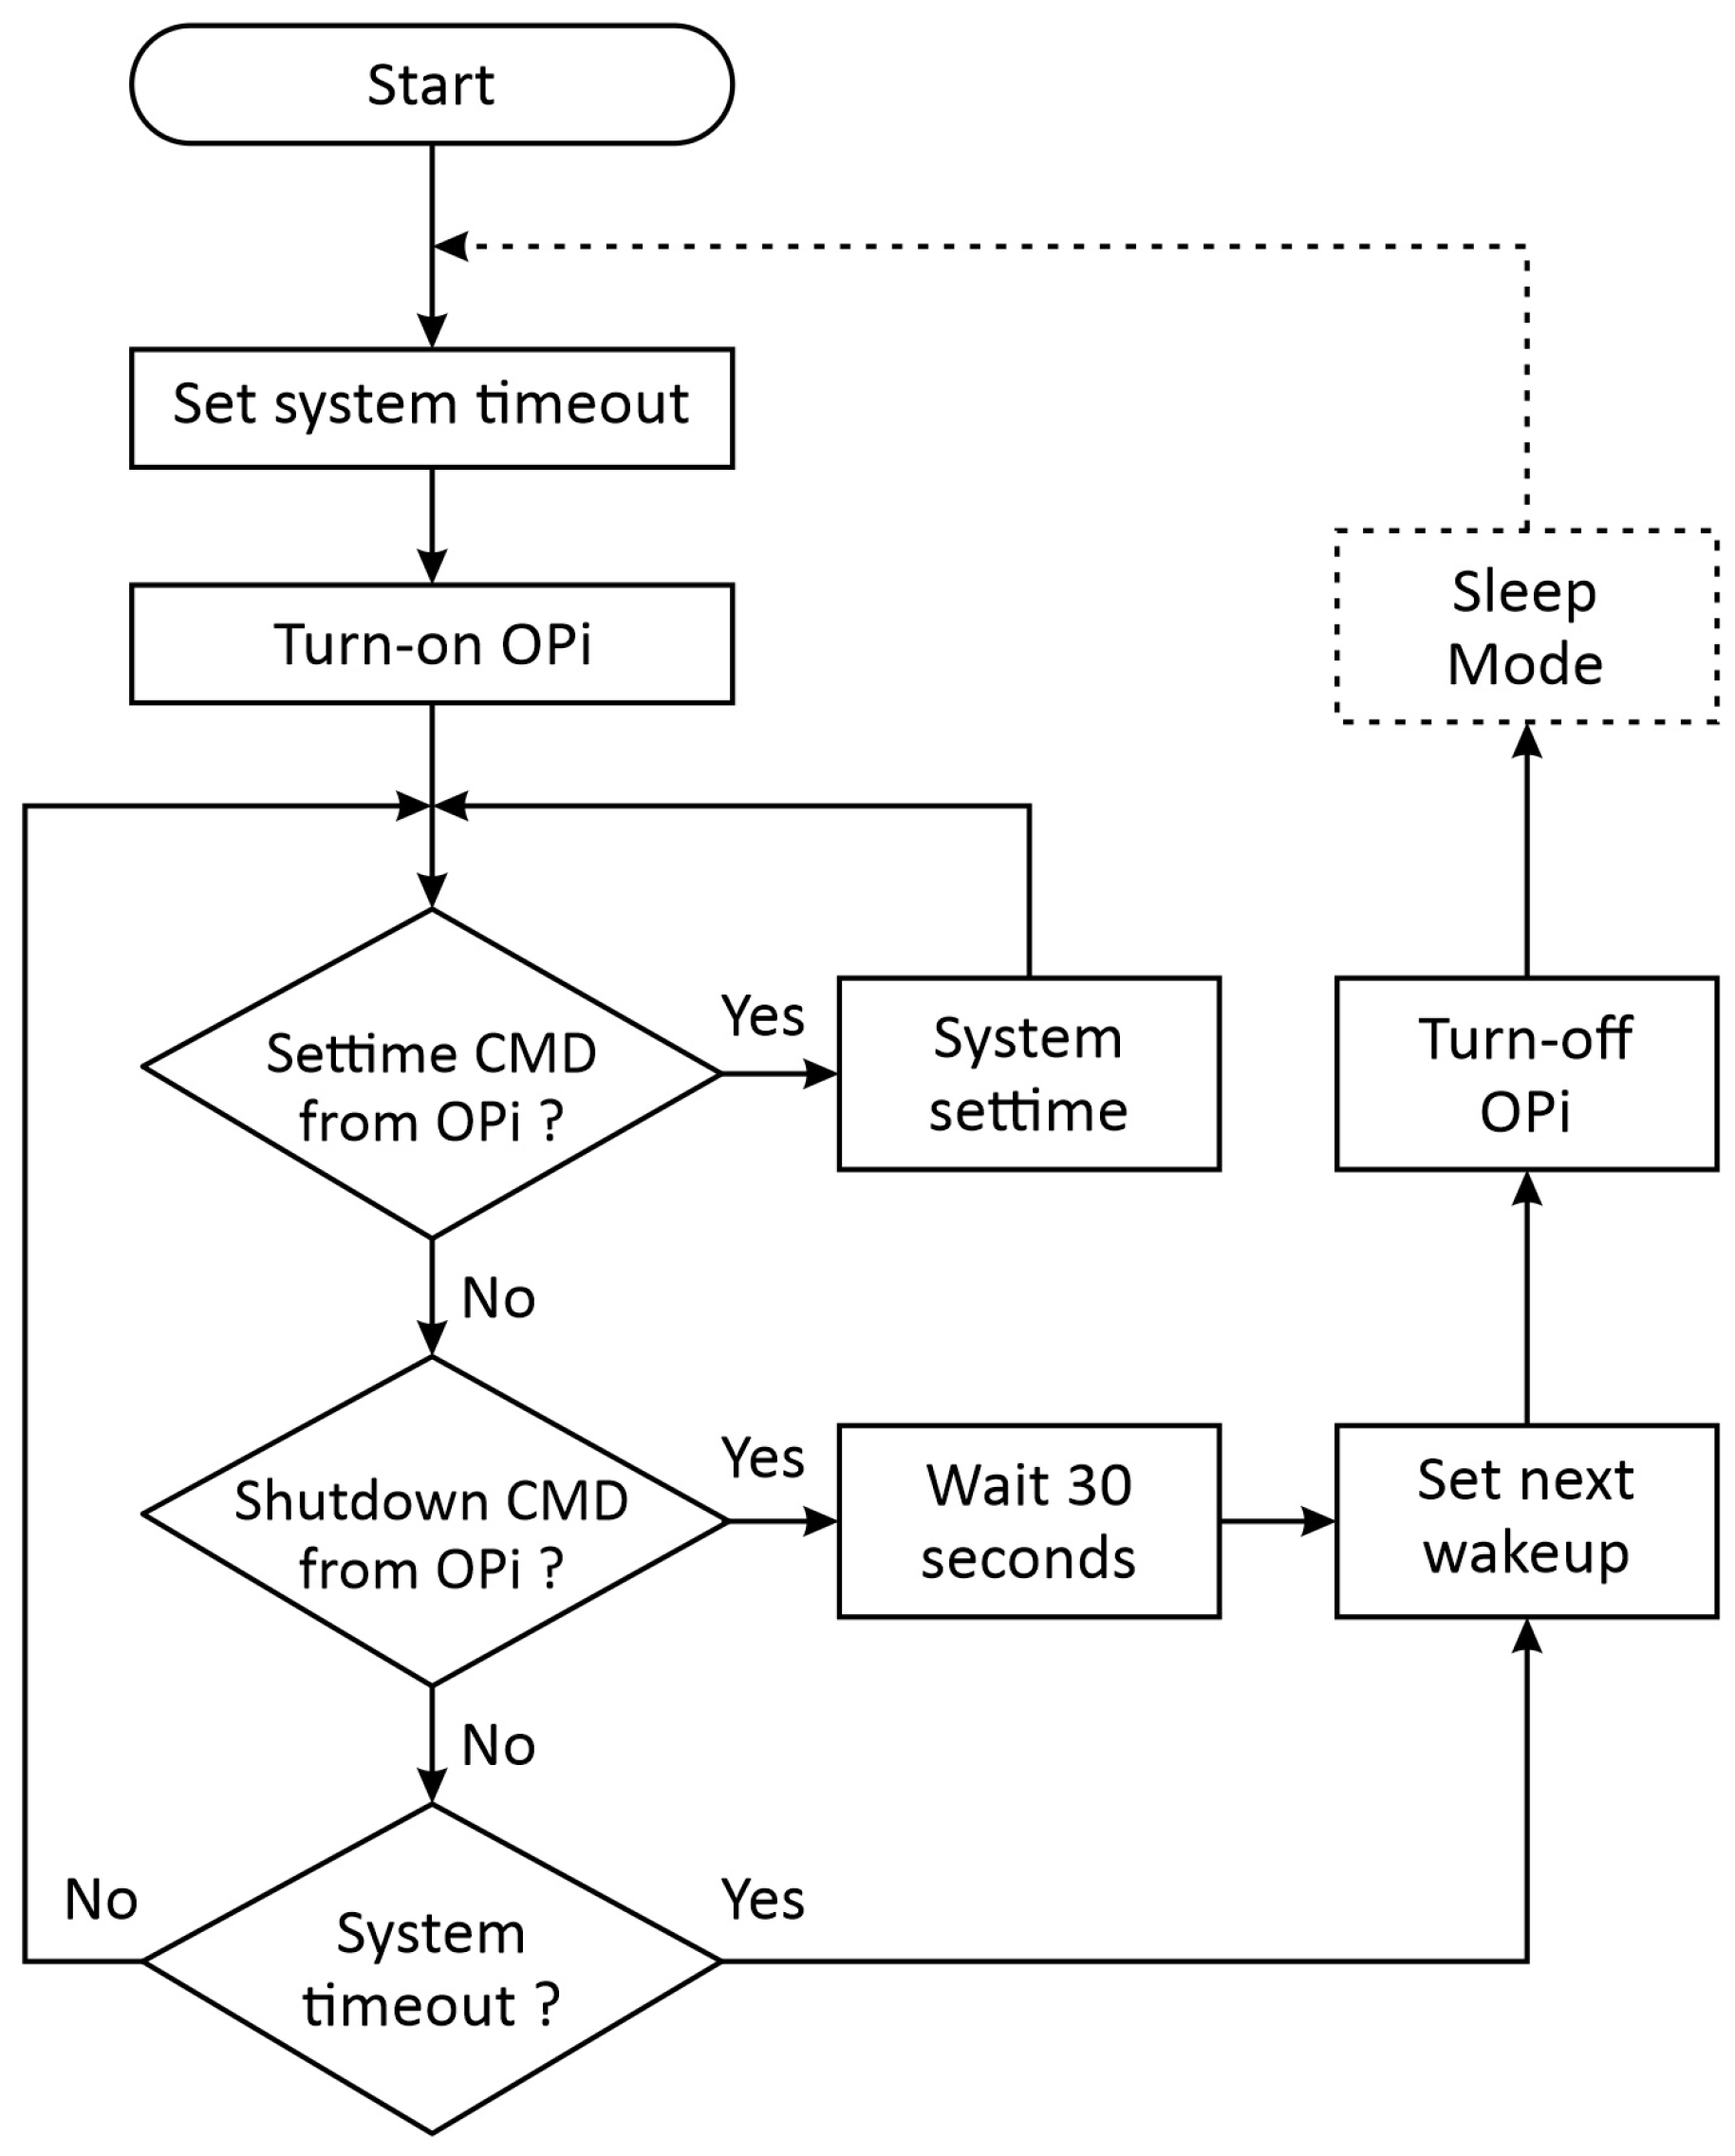
3.2.1. Shield Microcontroller’s Firmware
The shield’s microcontroller is essentially used to manage OPi’s power supply at regular intervals or at a specific time. To this end, it has a real-time clock that is programmed by the OPi. Therefore, this very low-power consumption device is continuously powered on. When the microcontroller boots up for the first time, it enables OPi’s power supply long enough to have it establish an internet connection. Then, it sends the correct date/time to the shield, via the TX/RX serial connection. Whenever OPi’s software finishes doing it’s tasks, it sends a command to the microcontroller instructing it to turn off the power. It will be turned on again only at the next pre-set time. Firmware’s flowchart is illustrated in
Figure 2.
3.2.2. Opi’s Software
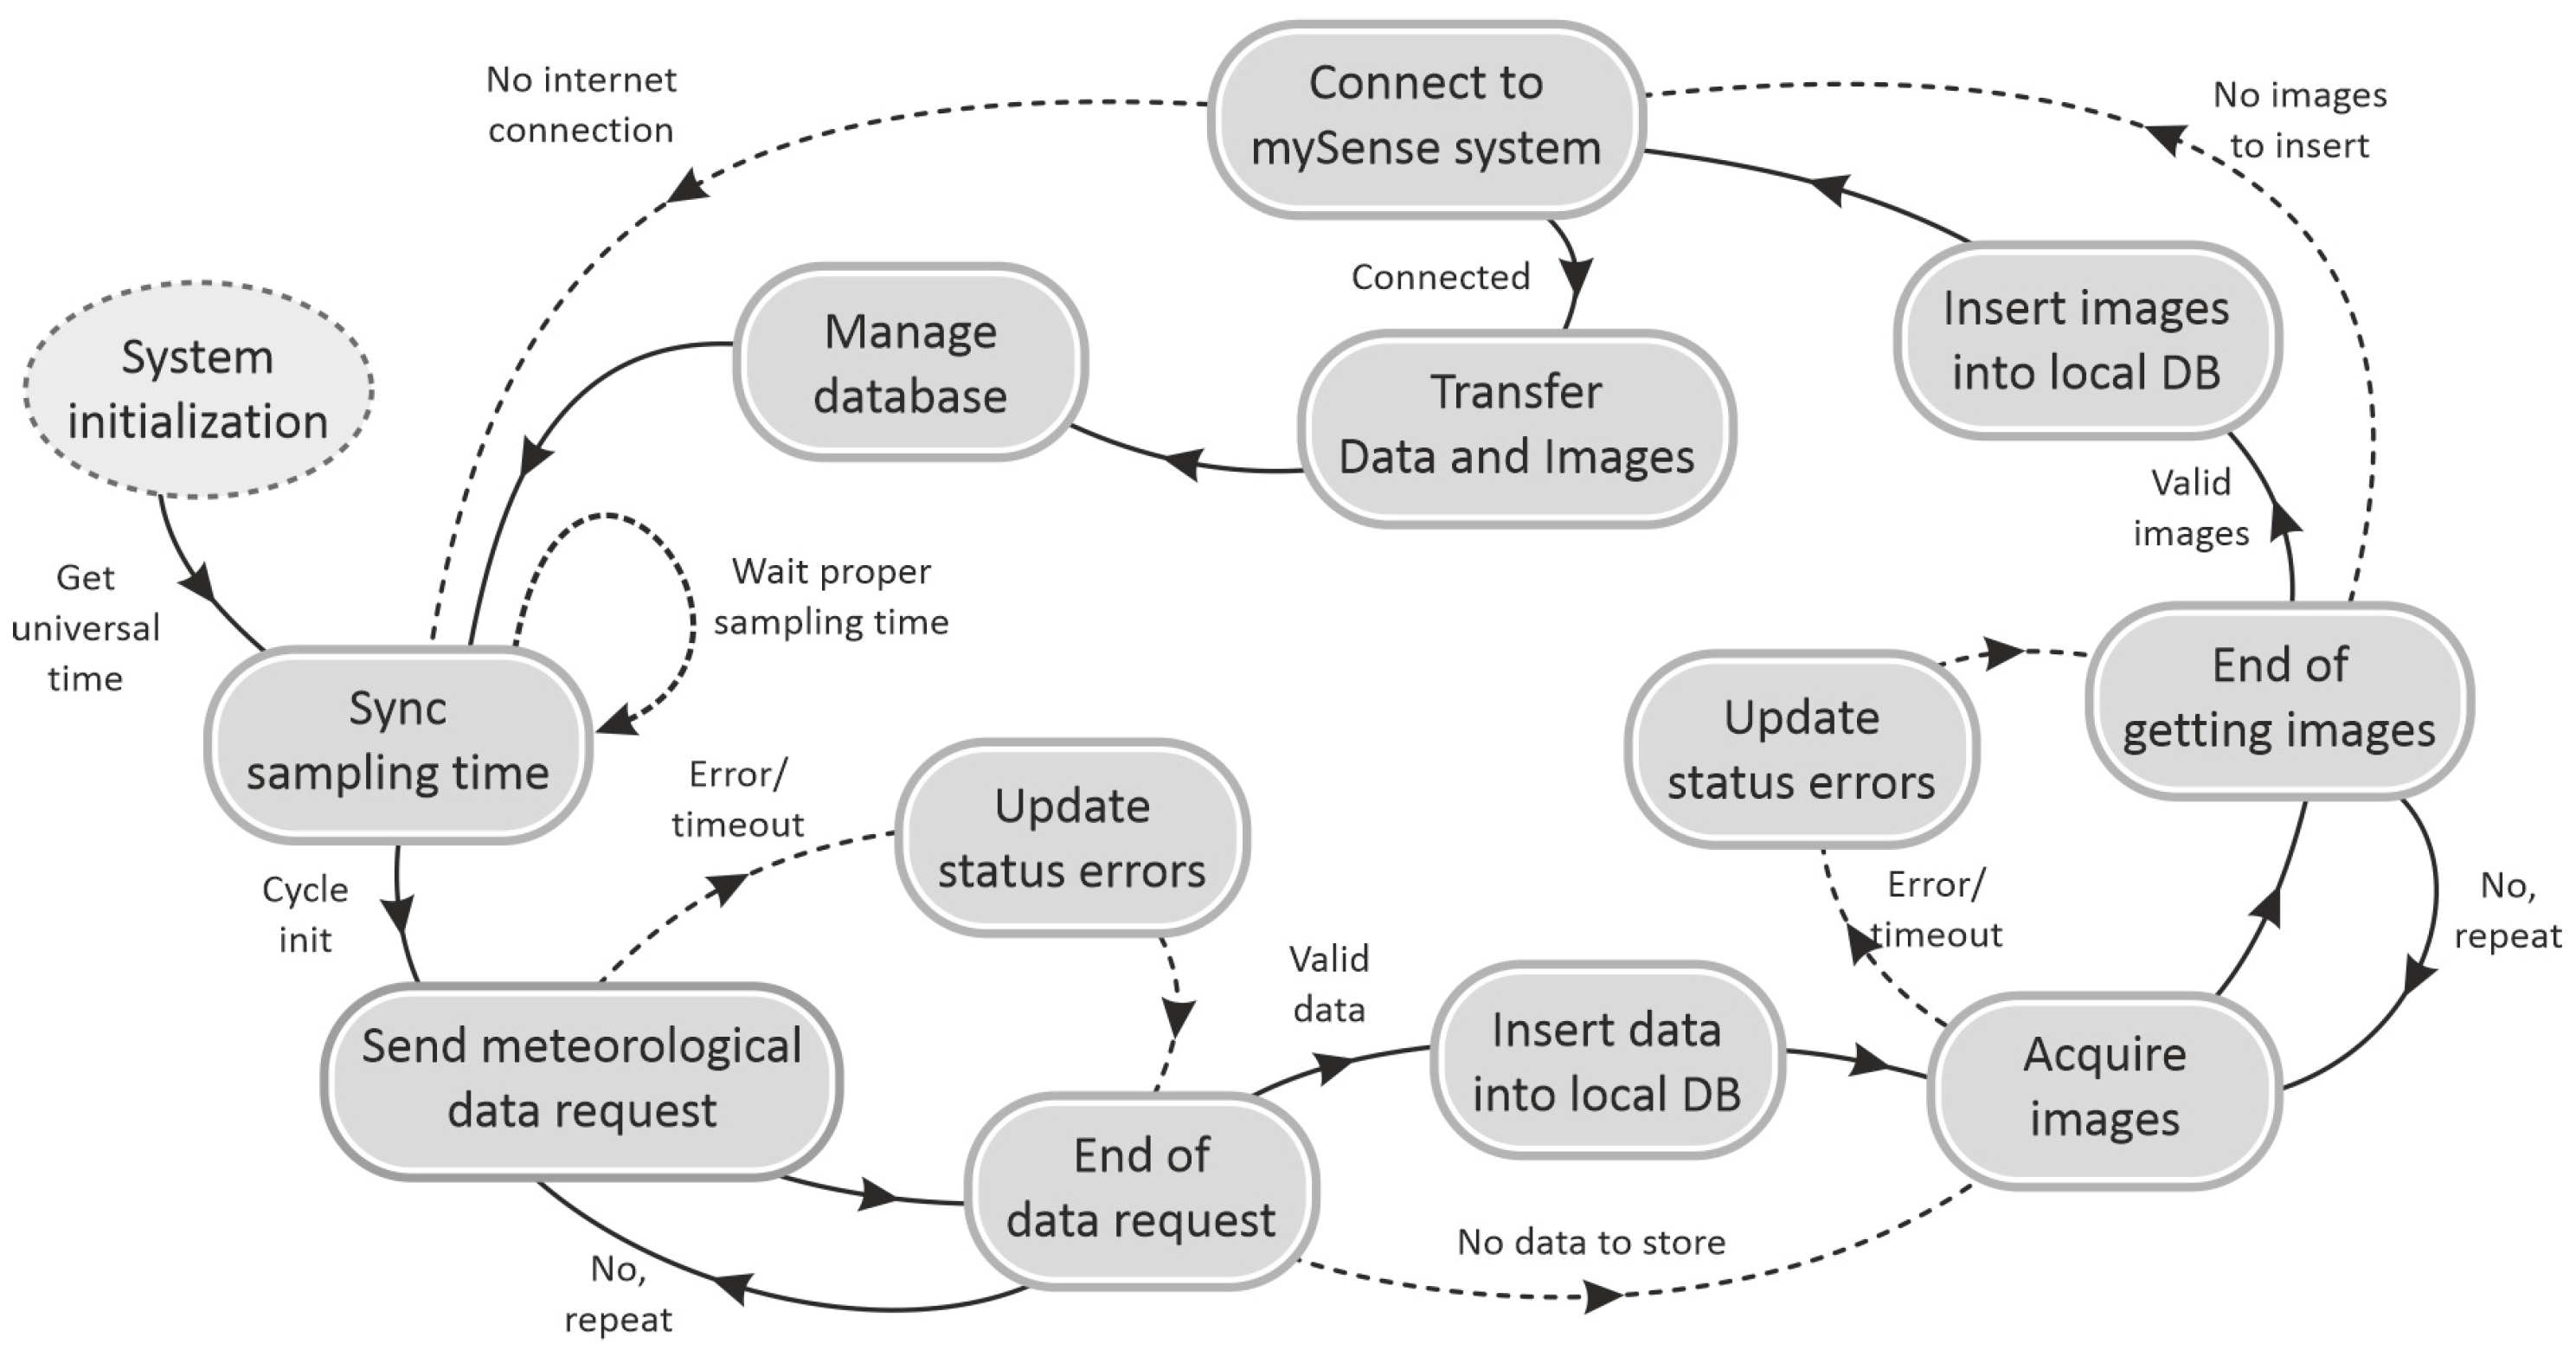
As previously stated, VineInspector is responsible for gathering data, storage it temporarily, and transmit it to a remote cloud-based platform. A script in Python—started at boot time—automatically executes this process. Typically, OPi is powered up at pre-programmed occasions in the shield’s microcontroller, as already mentioned. Therefore, as soon as the system is started, an internet connection to the remote cloud-based platform is established using the shield’s 2G/3G modem. Then, instructions are requested by using the remote platform’s API. This request returns the remote platform’s date and time, as well as any configuration commands that may be queued for sending. The specific date and time received are used to set this parameters on both the OPi and on the shield’s microcontroller.
As soon as the date and time setting process is complete, the image acquisition procedure by the available cameras begins. Images are then stored locally and registered into a local mySQL database. SPWAS’21 is the external device responsible for acquiring data from the remainder available sensors. It operates independently. The process to retrieve this data involves a simple download command from the flash memory. Then, data—both numeric and images—are sent to the remote cloud-based platform through an HTTP POST request.
Request’s body has a JSON data envelope or the image data, base64 encoded, depending on the type of data being sent. The HTTP POST request header may optionally include Global Positioning System (GPS) coordinates to update device’s location. All requests are acknowledged by the cloud-based platform. If the acknowledgement message is received, data is deleted from the local database. Otherwise, data will be re-transmitted at the next opportunity.
When data exchange between VineInspector and the remote cloud-based platform (mySense) ends, the python script will signal the shield’s microcontroller that a system shutdown will soon follow and that therefore the power can be shut-off within just a few seconds. VineInspector is left idle—with a very reduced power consumption—and will wake up upon the shield’s microcontroller real-time clock’ (RTC) signal. A simplified OPi’s software flowchart is presented in
Figure 3.
3.2.3. Remote Cloud-Based Platform
Whilst the use of in-field sensors’ data in a wide array of applications for AP is firmly established and is well-known, VineInspector’s contribution lies in it’s ability to capture images from multiple channels, classify them and automatically extract relevant features. This subsection describes with detail the procedure followed to classify and extract elements of interest from acquired images.
mySense environment (
https://mysenseapi.utad.pt, accessed on 17 May 2022) is an IoT platform specifically tailored to support a range of different applications and services within the scope of PA/PV practices [
44].
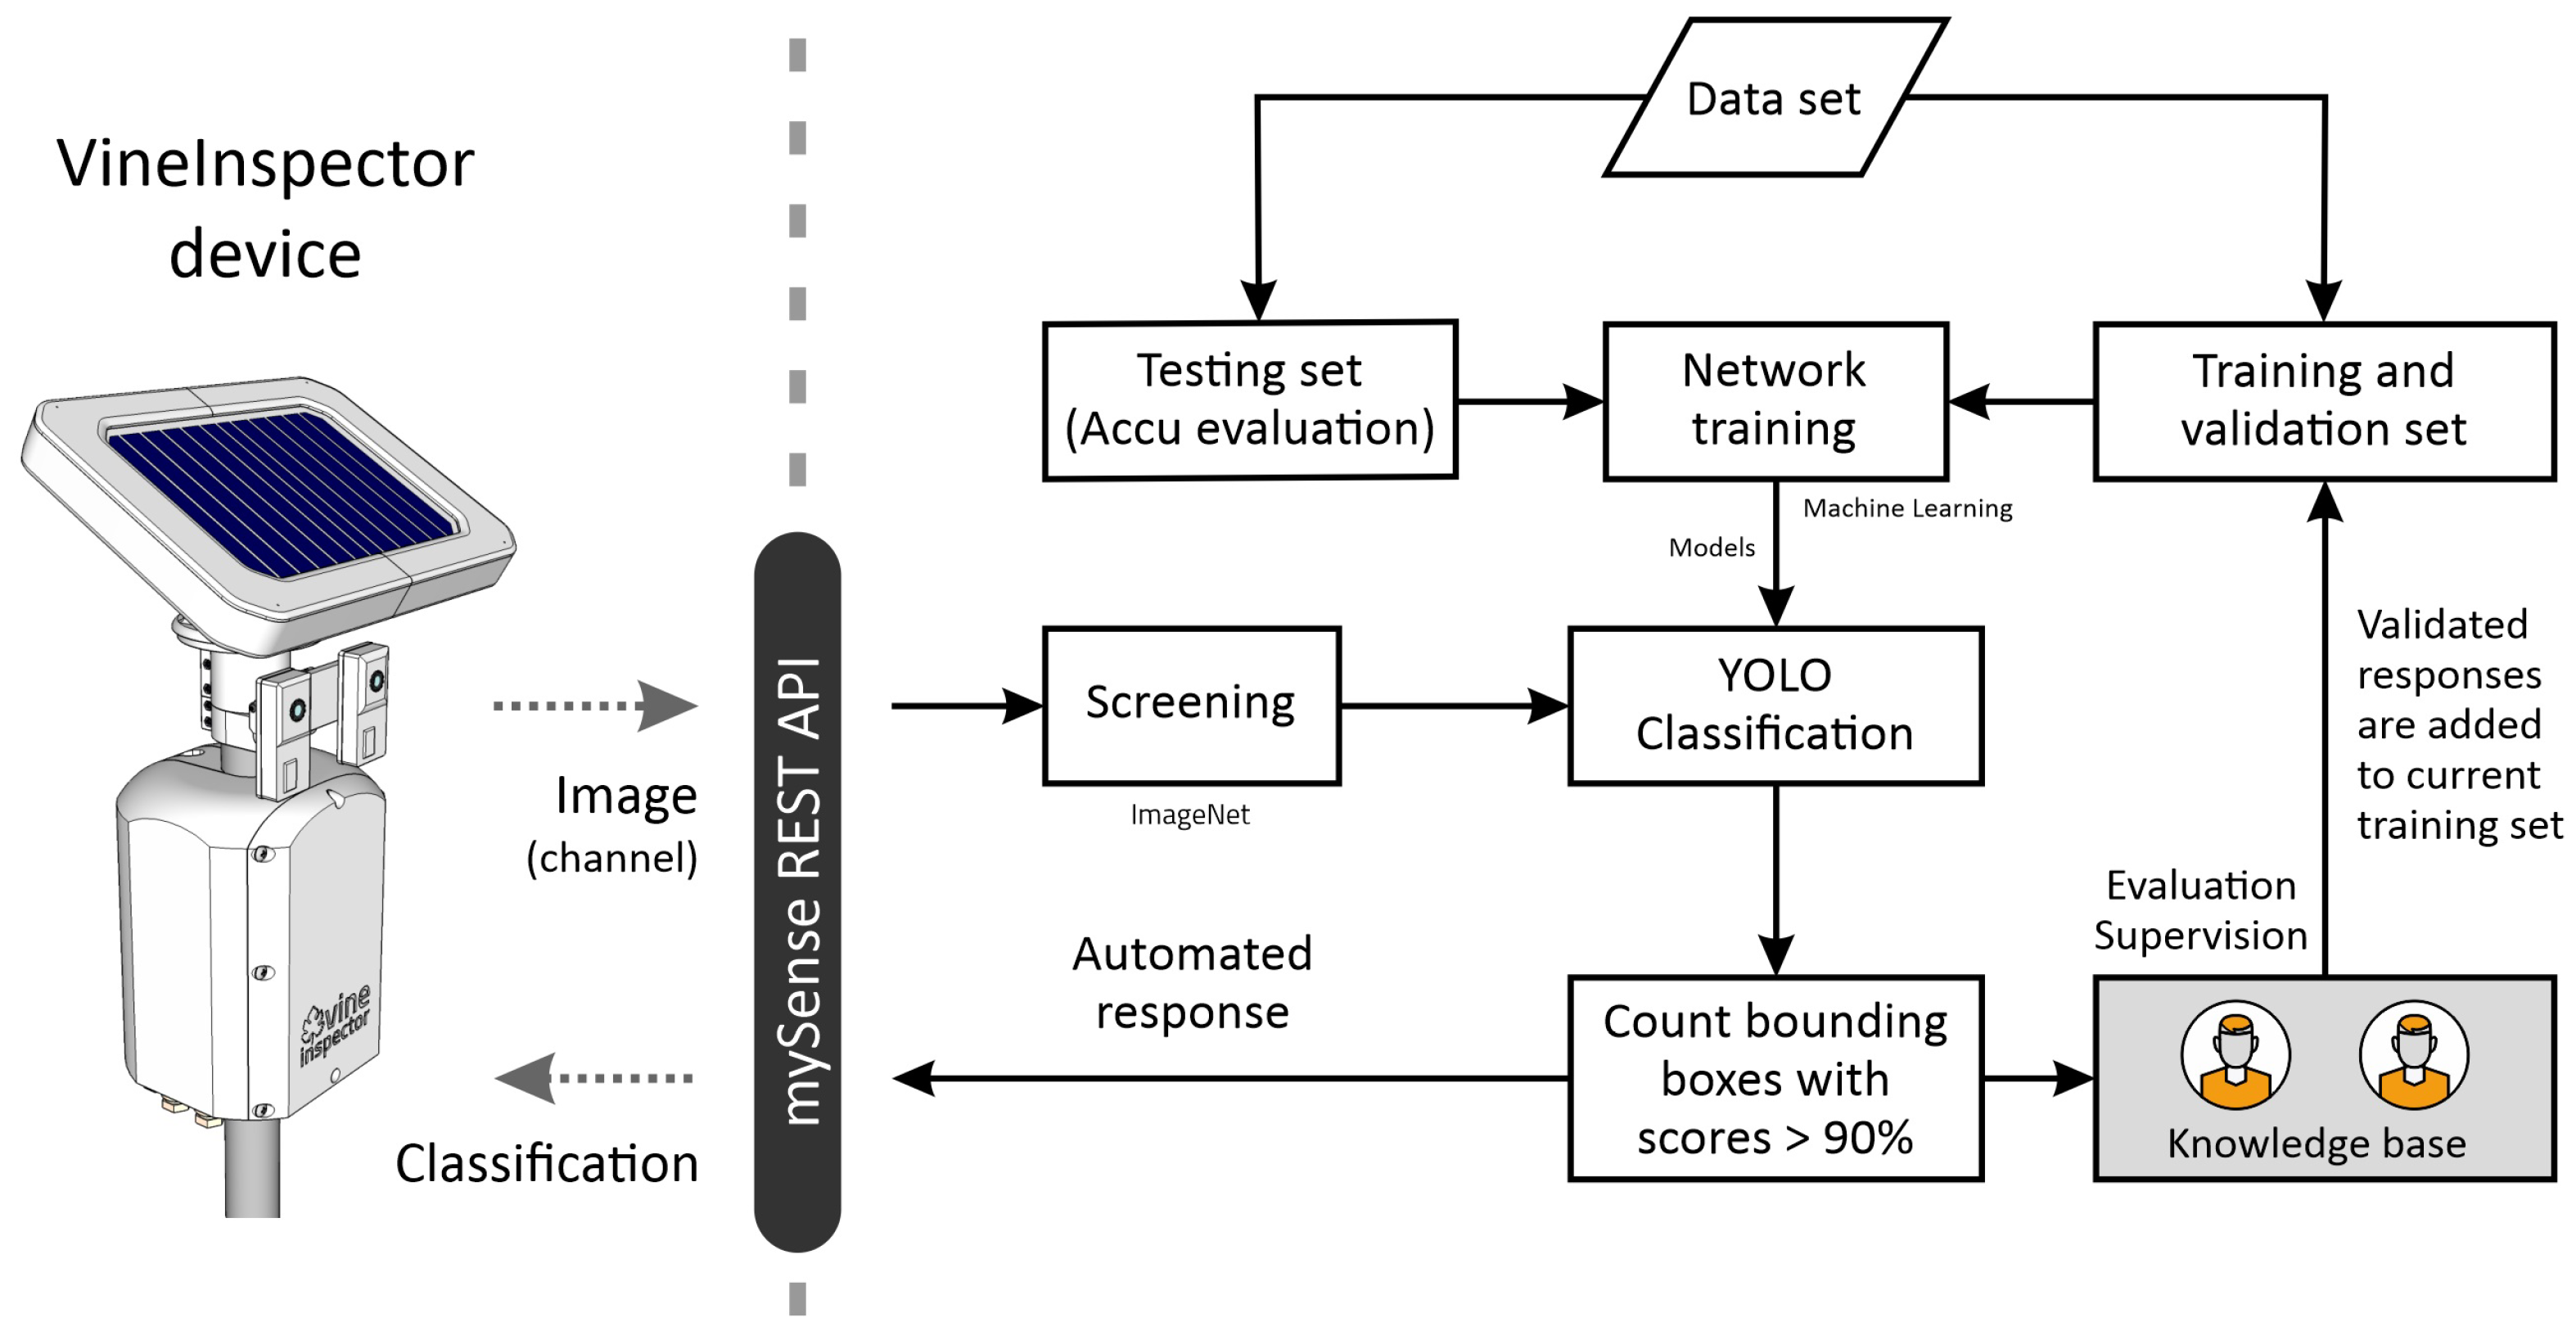
Figure 4 depicts the sequence of steps followed each time an image is sent to mySense by a VineInspector. It should be noted that in each request the HTTP POST identifies VineInspector’s imaging channel, thus enabling the possibility to effectively choose which classification model should be used. Therefore, each and every imaging channel will have associated a classification model in mySense.
The main purpose of this work revolves around the VineInspector as a whole system, able to acquire both in-field sensor data and also crops’ proximity images that will support visual inspection applications. Whilst two case-study applications were developed to prove that VineInspector is able to reliably perform in harsh field contexts and obtain accurate information for viticulturists, there was no special concern about the most proper AI approaches to use in each situation. Indeed, the suitability, accuracy and general performance of AI approaches is not the focus of this work. Furthermore, it was already stated that each imaging channel may have a different AI approach assigned so that every PA application can reach higher efficiency and accuracy levels. As such, future research will aim at establishing a relation between PA applications and the most suitable AI approaches, considering the available dataset, computational resources, communications and socio-economical contexts in which they are deployed. The common denominator will be VineInspector. Bearing this in mind, the AI approach chosen to implement the two case study applications—Scaled-YOLOv4 [
46]—resulted not only from previous works, were it performed well in different situations, but also from the knowledge that it is a more generic approach that may be used in diverse contexts, with good results. Scaled-YOLOv4 is the new state-of-the-art in object detection and emerged from the YOLOv4 model by efficiently scaling the network design and scale (width, depth and number of stages in the convolutional neural network backbone and neck). For now that will more than suffice in proving that VineInspector is able to render quality information to viticulturists.
The training process is more complex, as it involves a dataset that should be as extensive and diversified as possible to improve classification’ accuracy. Looking at
Figure 4 flowchart, whenever an image is submitted and classified with the previously trained model, it is also subjected to a supervision process (knowledge base). This enables increasing the dataset to be used in a subsequent training process and also of the dataset that will evaluate accuracy. In YOLOv4, the classification model is applied to an image at multiple locations and scales and the image’s high scoring regions are considered detections. The image is divided into multiple regions and a bounding box prediction is made. Then, the probabilities for each of these regions are weighed in [
47]. This approach yields much faster classification than traditional R-CNN networks.
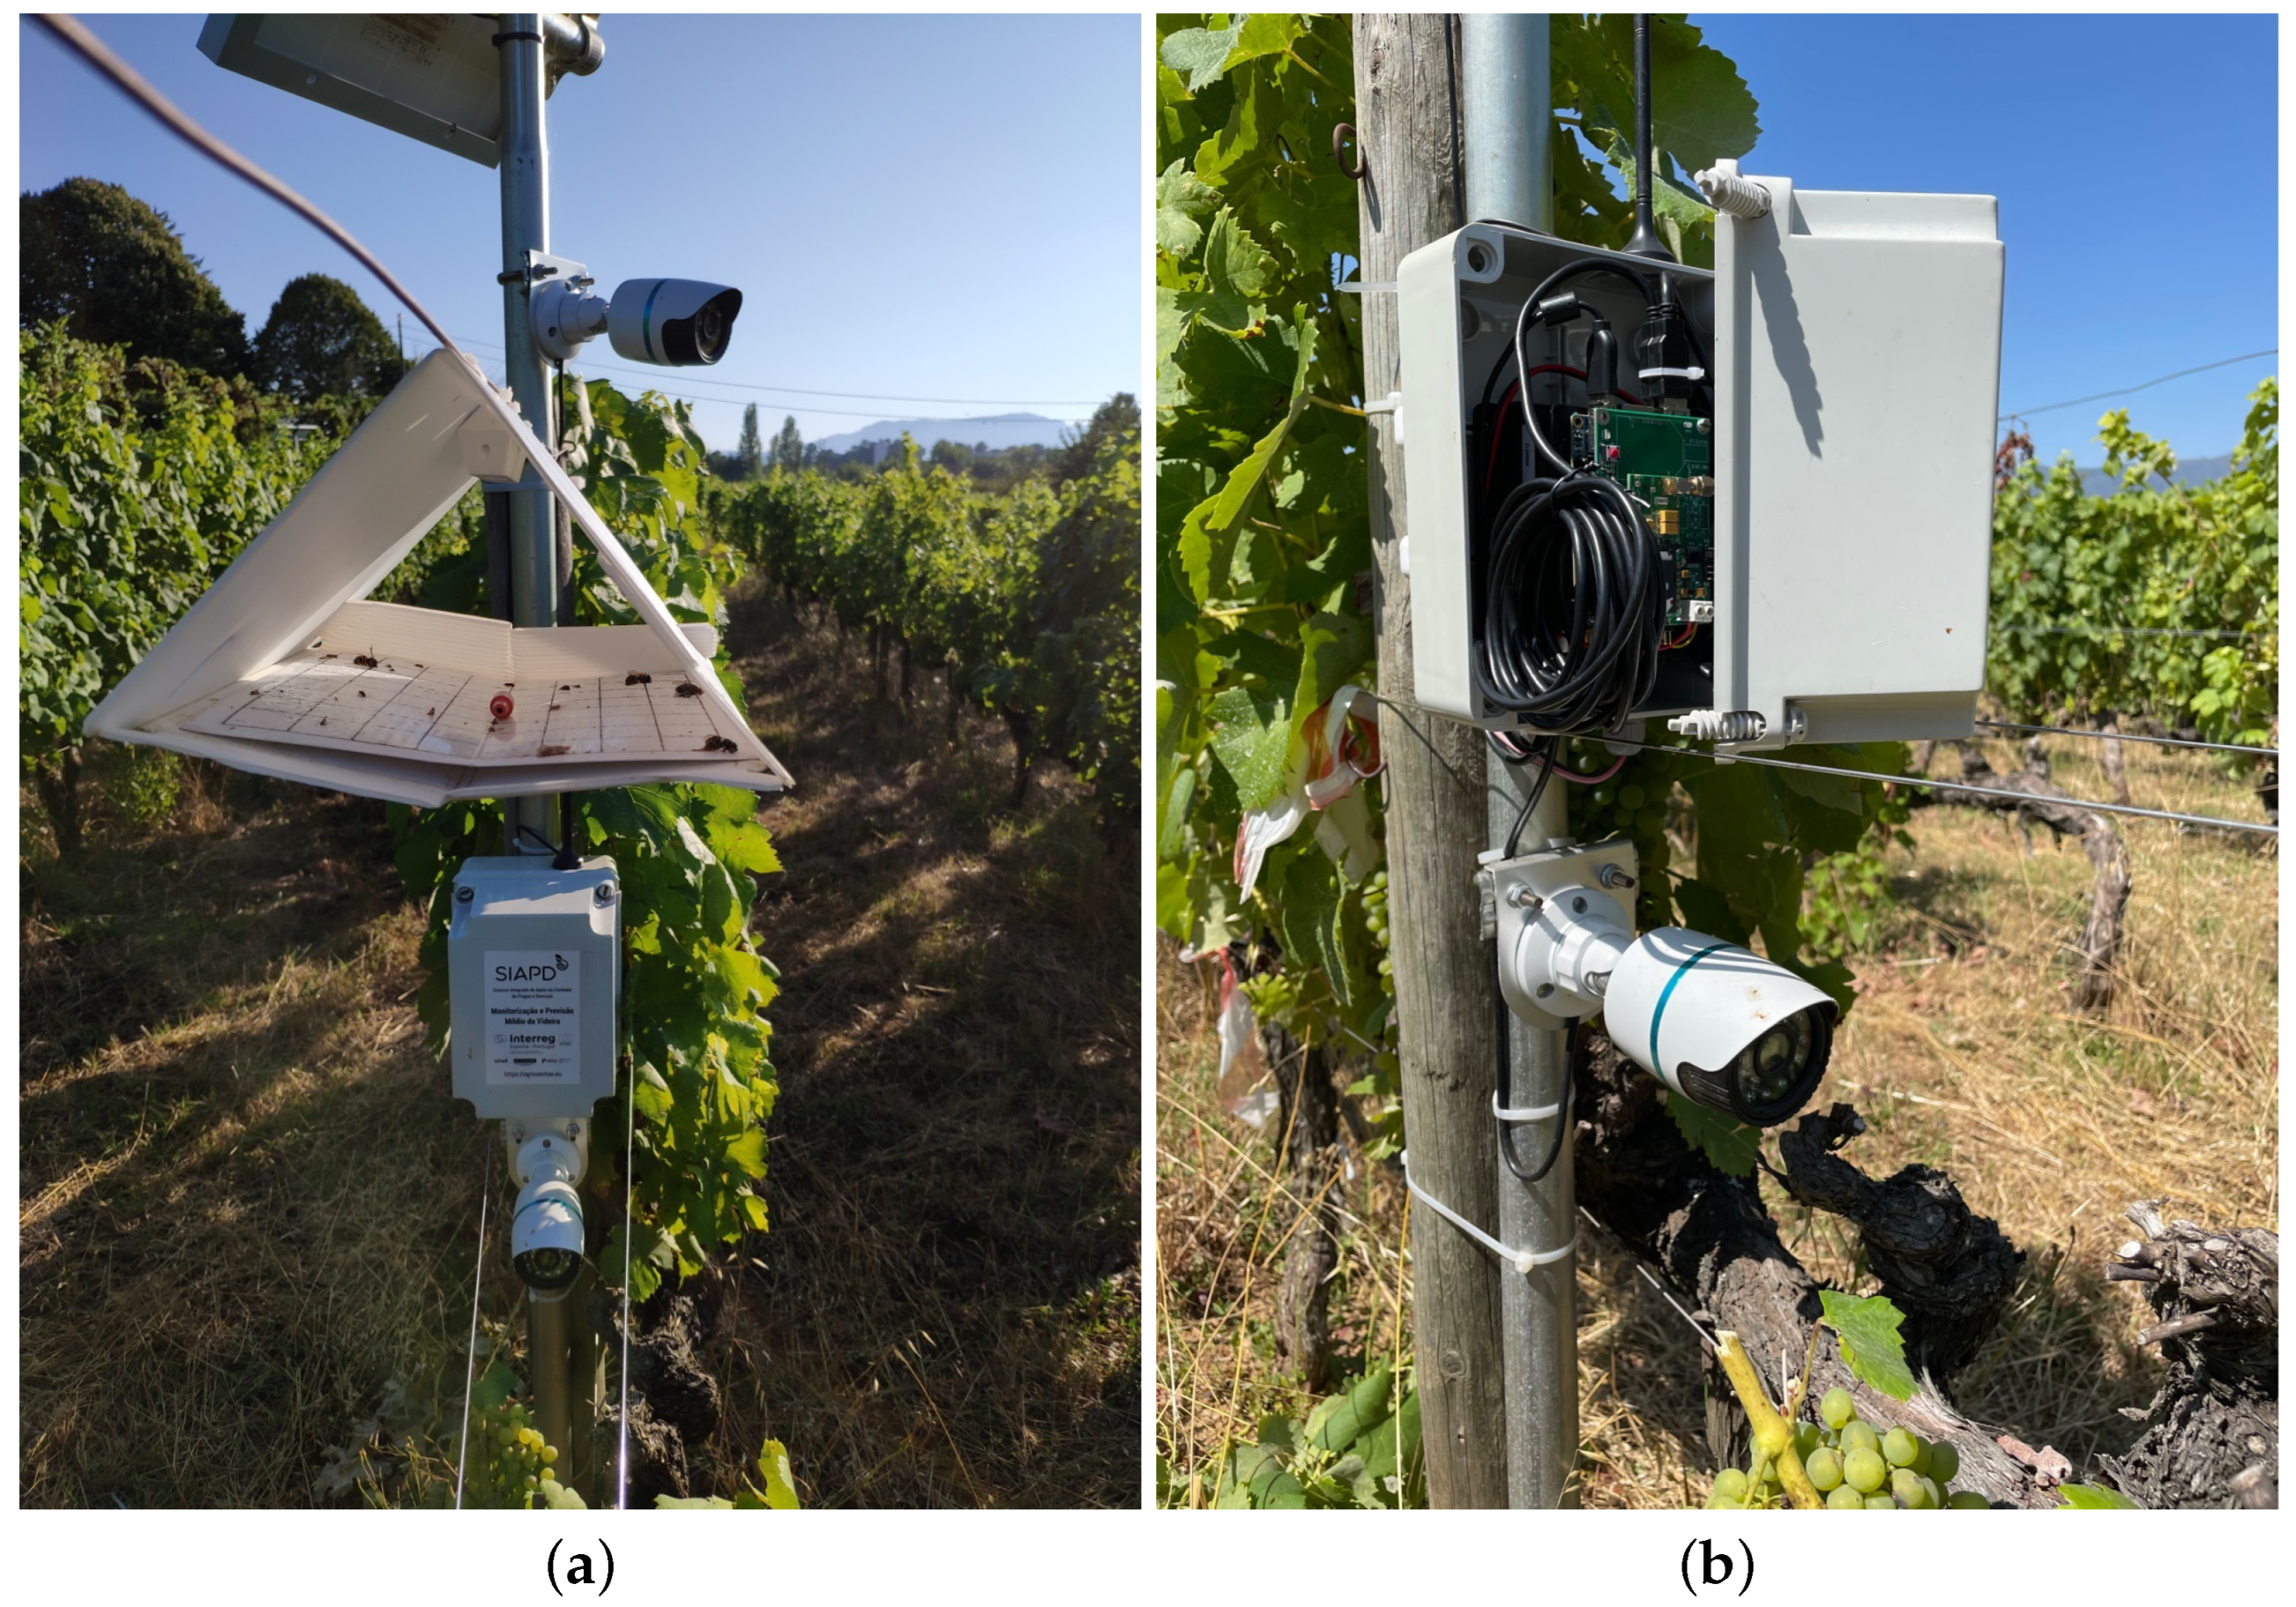
3.3. Experimental Setup
A VineInspector equipped with three cameras—one pointing to a grapevines’ row (ELP 2.2MP USB Camera 2.8 mm focal length with water proof case, Shenzhen Technology Co., Ltd., Shenzhen, China), another one pointing to a grapevine with greater detail (ELP 2.2MP USB Camera 3.6 mm focal length with water proof case), and the third one inside a common delta sticky trap (HVBCAM 5.0MP USB Camera with a 160-degree fish-eye lens, Huiber Vision Technology Co., Ltd., Shenzhen, China)—was placed in a 2 ha Malvasia Fina (white grape variety) vineyard located at the University of Trás-os-Montes e Alto Douro (UTAD) Campus, in Vila Real, Portugal (41.286875, −7.735219), as depicted in
Figure 5. The VineInspector device was installed in the vineyard by direct fastening it to one of the bale stakes and the cameras pointed at the elements of interest. Through its Wi-Fi connection (activated by a button), it is possible to check the correct position of the cameras using a specific smartphone application where the images can be accessed in real time. Both the VineInspector and the two developed applications were assessed over 2021.
VineInspector’s standard operation mode is to have four images acquired by each of the three cameras throughout the day, in different moments: sunrise, noon, mid-afternoon, and late afternoon. Each image is then made readily available to viticulturists through mySense platform.
It is at this stage that artificial intelligence approaches come into play to further process each image. Automatic classification is then done considering the established requirements for crop monitoring. Taking the two example applications developed, the aim was to tally grapevine moth males captured in the sticky trap, and to determine the size of the grapevine’s shoots to assess downy mildew incidence probability based on the 3–10 rule. A Scaled-YOLOv4 implementation using PyTorch framework provided by Wong Kin-Yiu [
48] was used for both applications. Training was done on a cloud-based machine using the Gradient Paperspace platform. This machine is equipped with an octa-core Intel
® Xeon
® CPU E5-2623 v4 @ 2.60 GHz, 30 GB of RAM and a NVIDIA Quadro P5000 GPU, with 16 GB GDDR5 memory and 2560 CUDA cores. Mish-CUDA [
49], a PyTorch CUDA implementation of the Mish activation function, was used to run processes on the NVIDIA GPU.
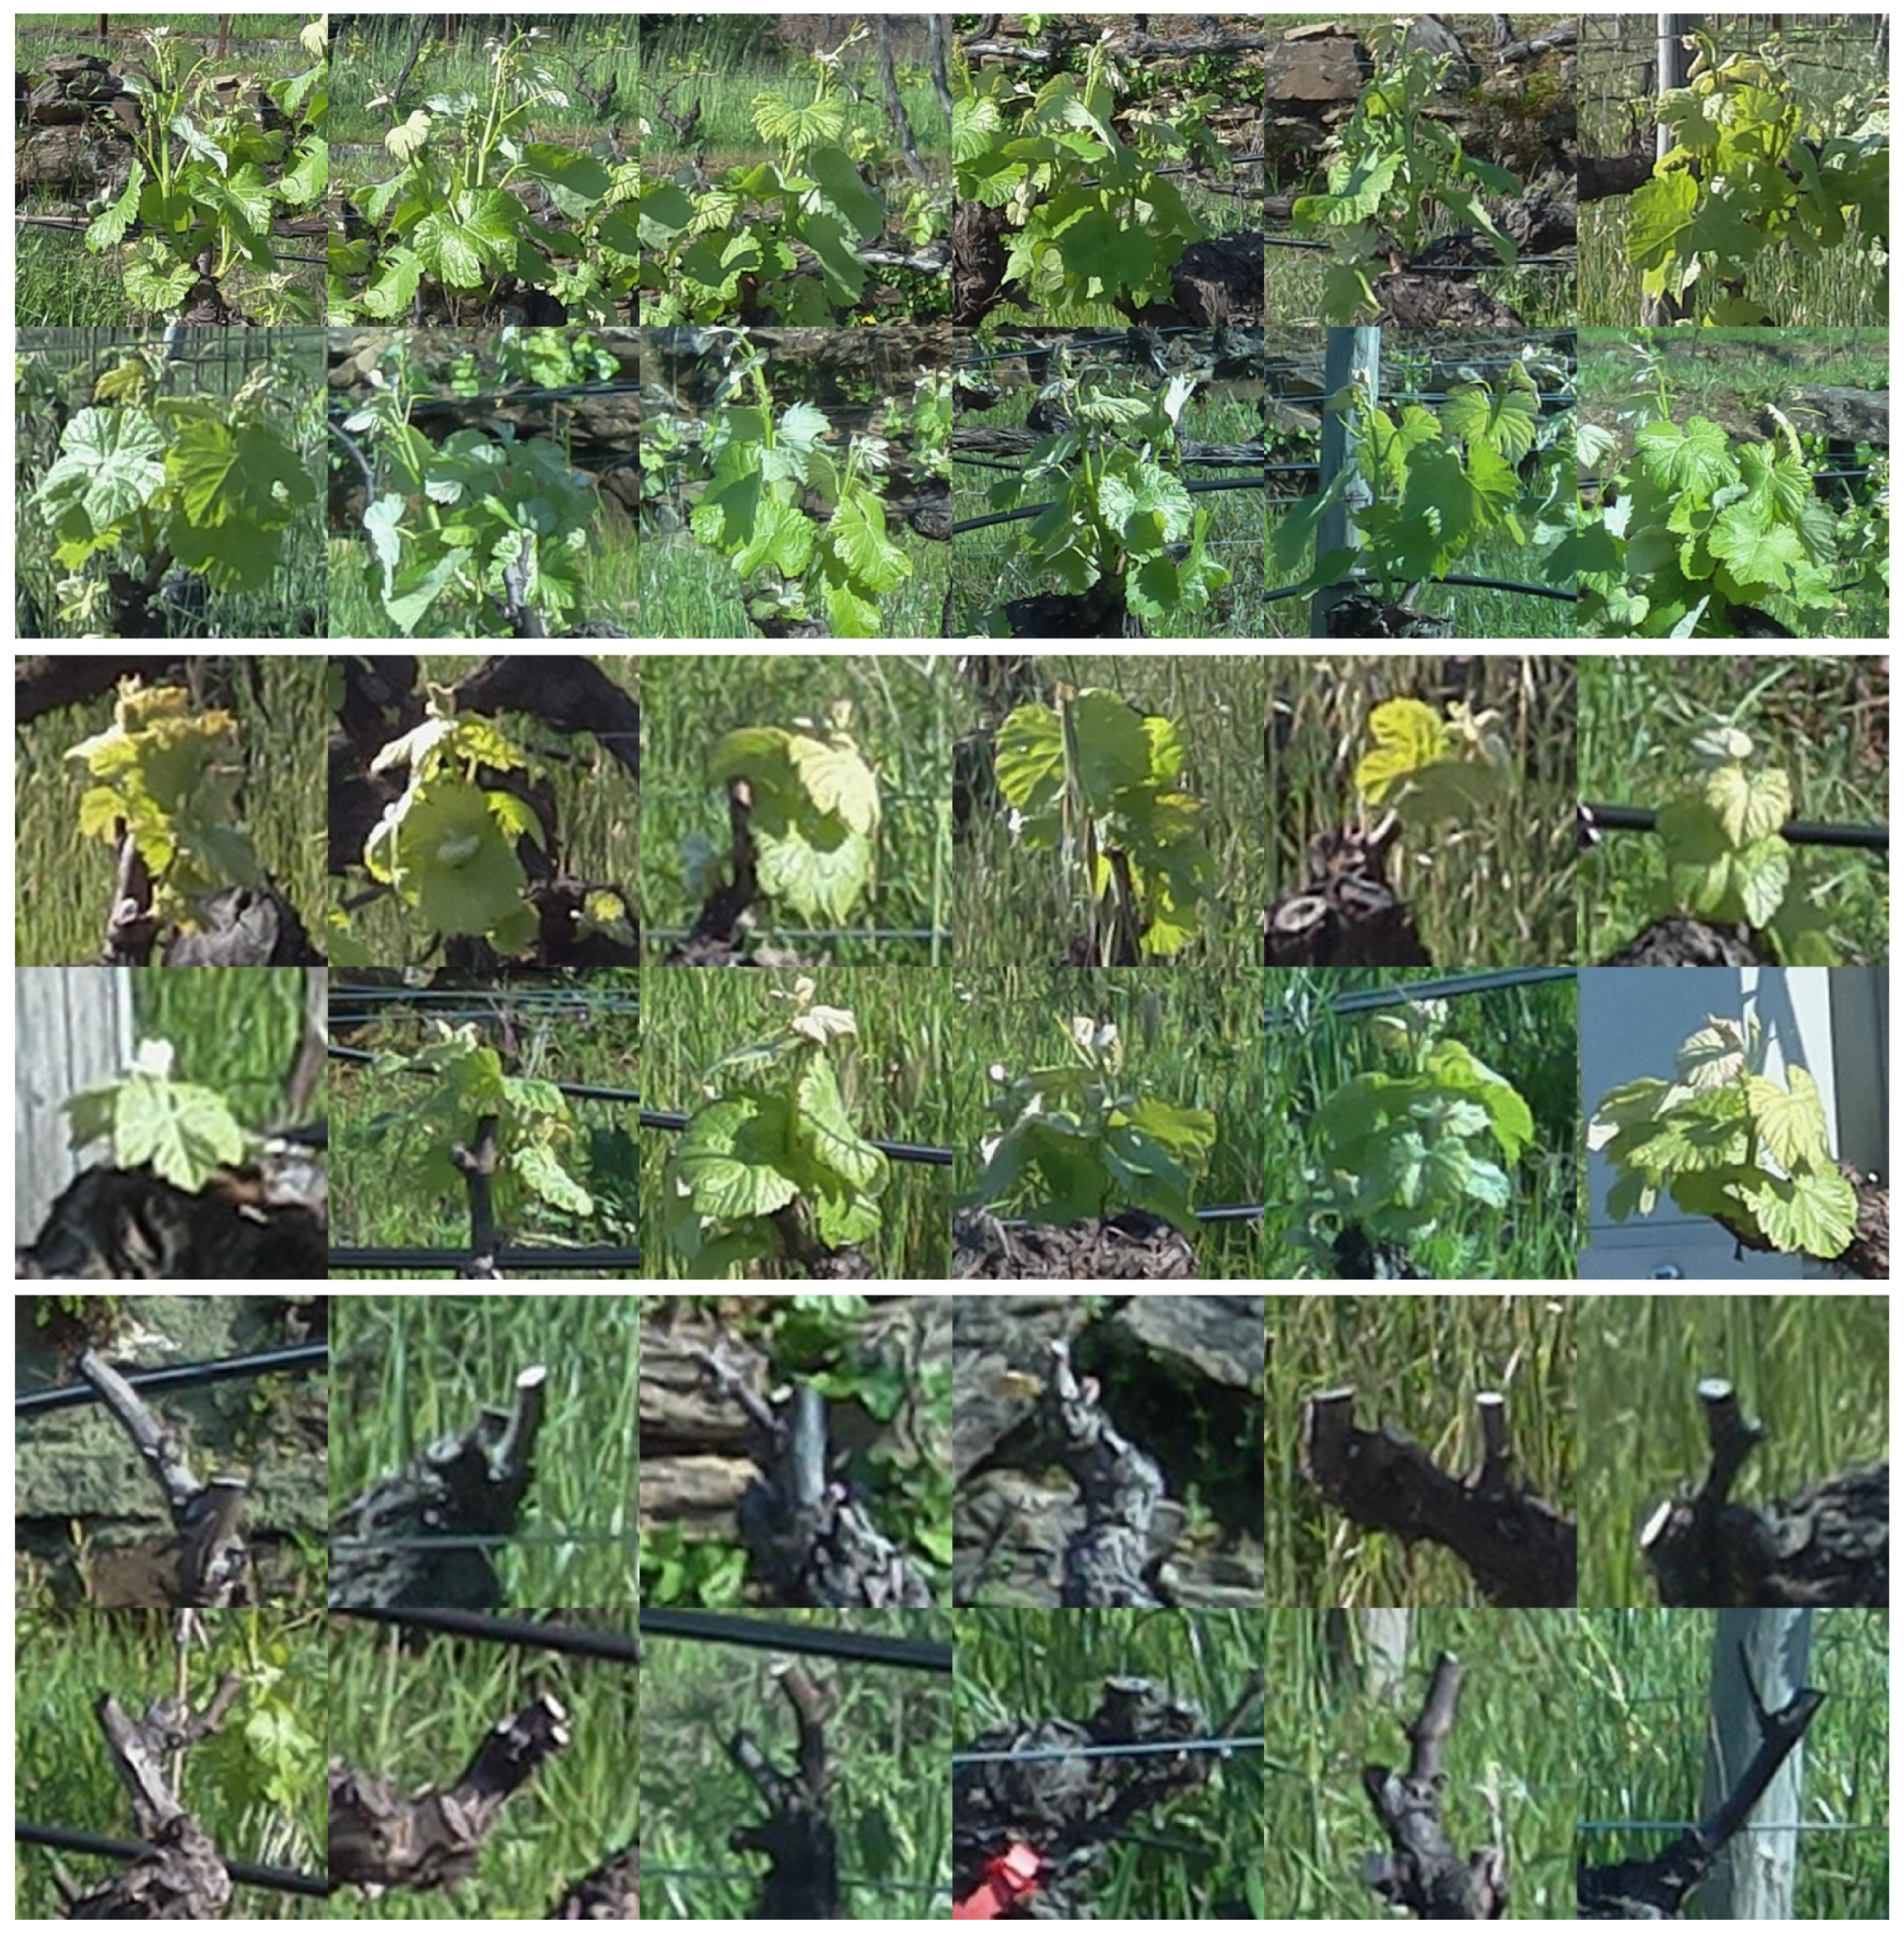
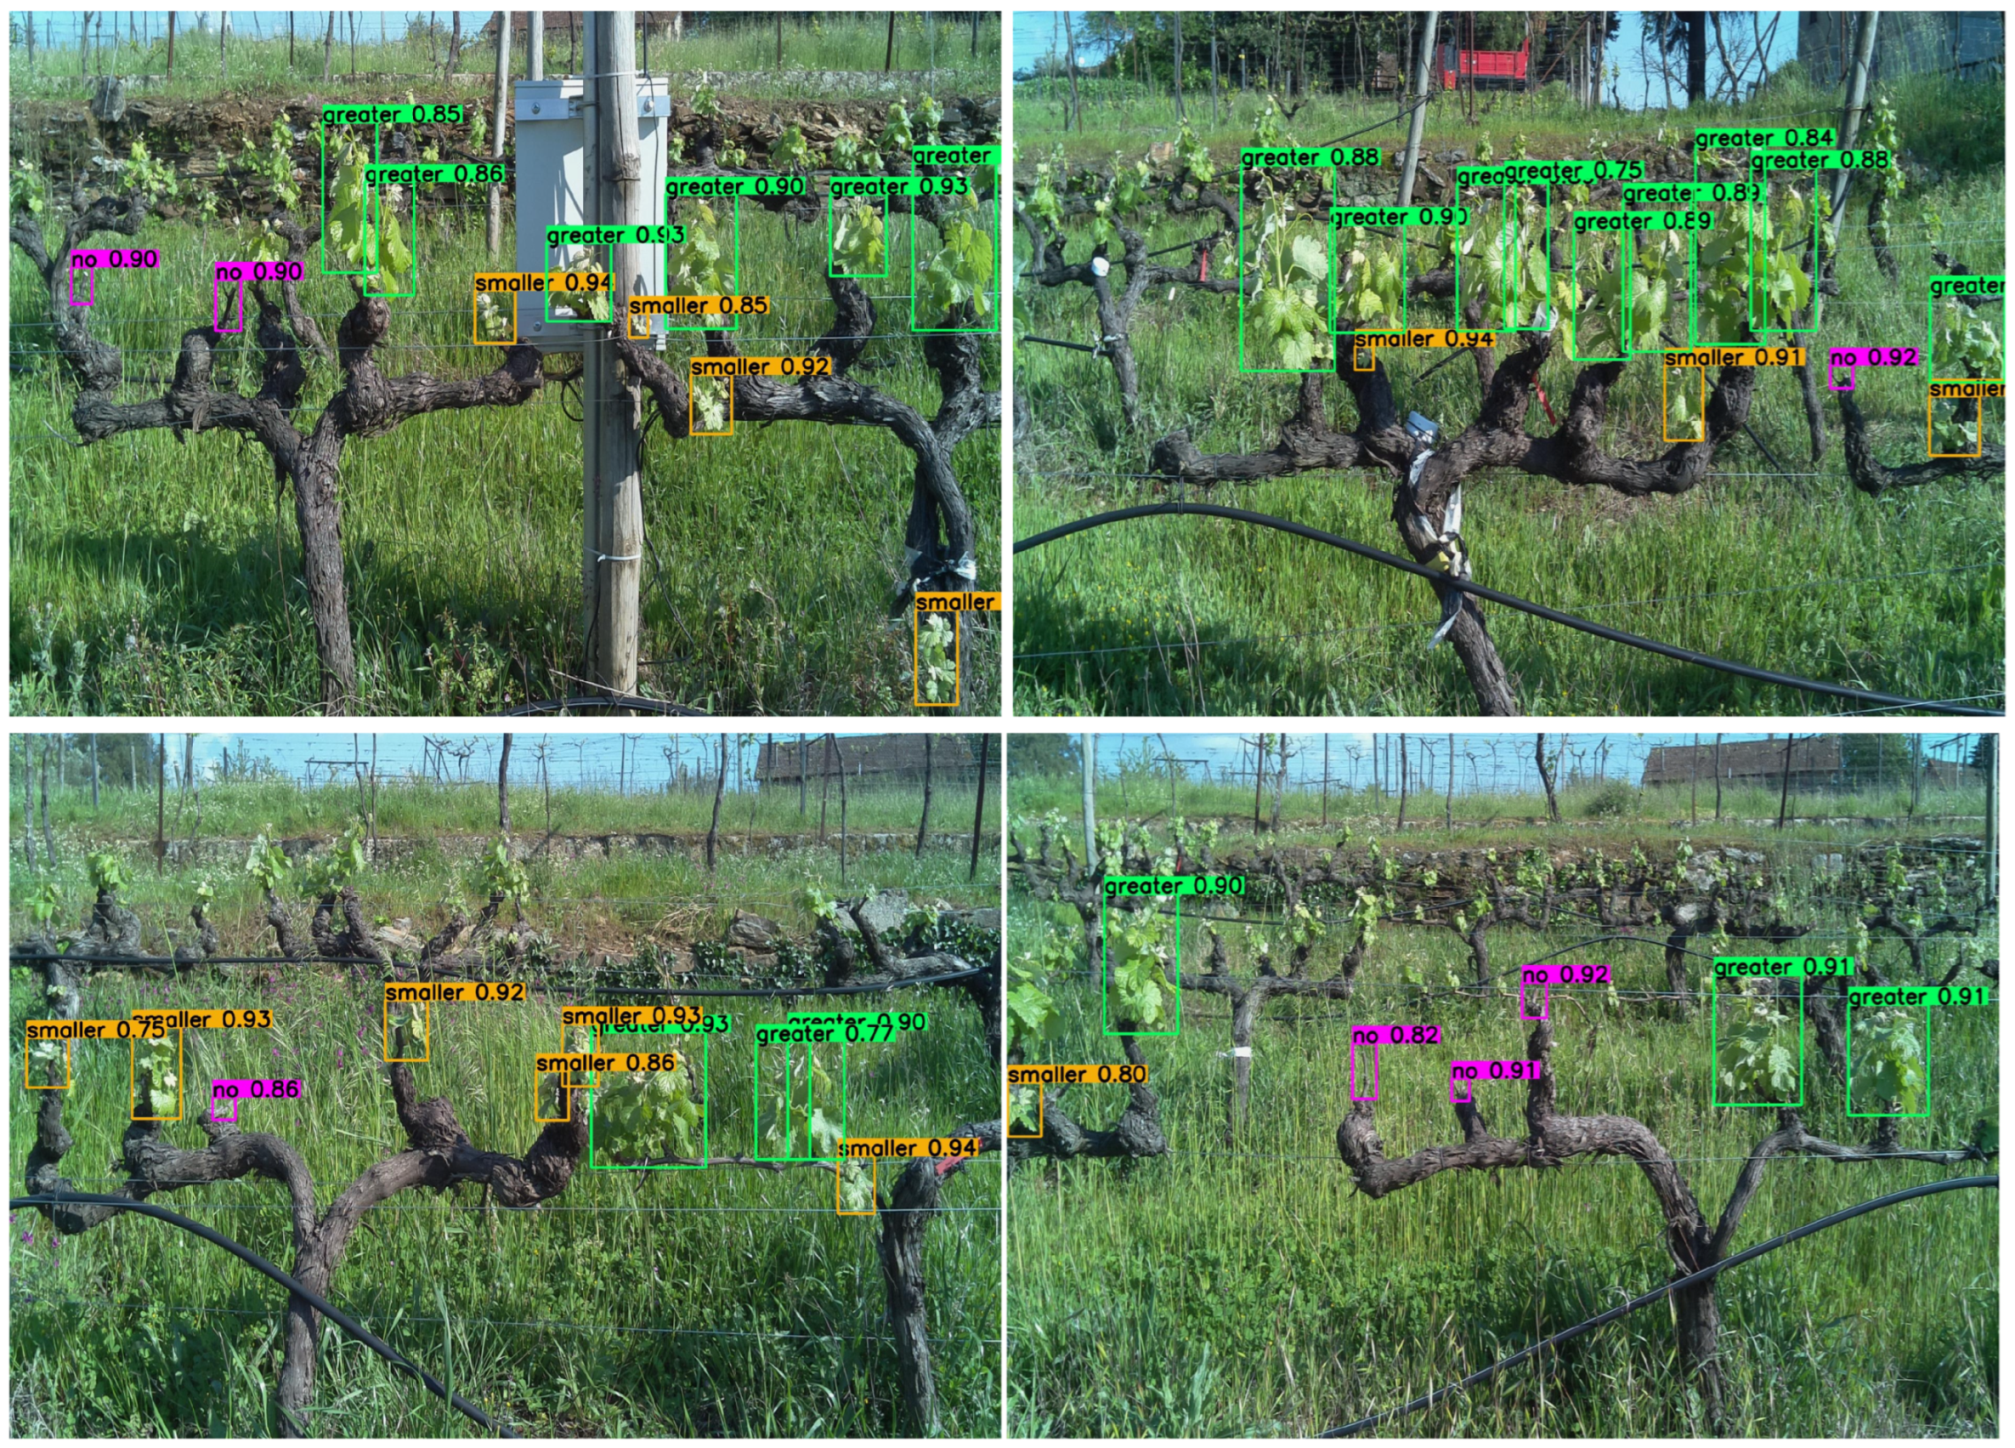
3.4. Grapevine’ Shoots Application
An initial dataset of grapevine’ shoots images was built within a time frame in which grapevines (i) had no shoots growing; (ii) shoots were developing, but their size is still under 10 cm; and (iii) shoots were already developed beyond a 10 cm size. All of these images had grapevine’ shoots regions annotated and divided into three distinct classes, respectively: “no_shoots”, “shoots_smaller_than_10”, and “shoots_greater_than_10”. Annotations were made using Label-Images-Tool [
50] that enables to save them in a YOLOv4 compatible format in .txt files.
Figure 6 depicts some examples of grapevines’ shoots images that resulted from the annotation process.
The artificial intelligence approach was trained based on this dataset, composed of 238 grapevine images. Furthermore, the annotation process rendered 2489 images, from which 1230 are from shoots smaller than 10 cm, 985 bigger than 10 cm, and 274 of regions where shoots have not yet grow. Roboflow platform—a development tool for building computer vision-based applications—was then used to divide the dataset in 70% for training, 20% for validation, and 10% for testing, to apply data augmentation techniques, as well as to create three versions of the initial dataset to further assess the impact of images’ quantity and resolution on the accuracy of both detection and classification processes. While one version has the original images with their resolution scaled down from 2592 × 1944 px to 1900 × 1900 px, a data augmentation process was carried out to create the other two versions. Indeed, it replicated existing training images with transformations that included different rotations between
° and +5°, brightness variations between
% and +20%, and horizontal flipping and blurring up to 1 px. The result was a total of 3849 images with grapevine’ shoots smaller than 10 cm, 4734 images where they are bigger than 10 cm, and 982 images without visible shoots at the time. Images’ resolution is the difference between these two versions: one has the original resolution scaled-down to 1024 × 1024 px and the other one to 512 × 512 px. It should be noted that whilst the images that compose the initial dataset have been acquired when all the three classes—“no_shoots”, “shoots_smaller_than_10”, and “shoots_greater_than_10”—could be represented, to have grapevines with shoots bigger than 10 cm means that the natural phenological development dictates that the non-existence of shoots is rarer within that time frame. For that reason alone, the “no_shoots” class has less images that the other two.
Table 1 sums up dataset’ versions data.
Two YOLOv4 architectures—YOLOv4-CSP and YOLOv4-P7—were used in five different training studies done with the three versions of the dataset, as described in
Table 2. Besides training with three classes, the cloud-based machine GPU allowed a batch size of 8 for the dataset versions with 512 × 512 px and 1024 × 1024 px images’ resolution. As for the version with the 1900 × 1900 px resolution images, only a batch size of 2 was possible. Furthermore, hyperparameters—e.g., learning rate = 0.01, momentum = 0.938, decay = 0.0005—were kept at their default values and the number of epochs was set to 500, since from this value onward precision stabilized.
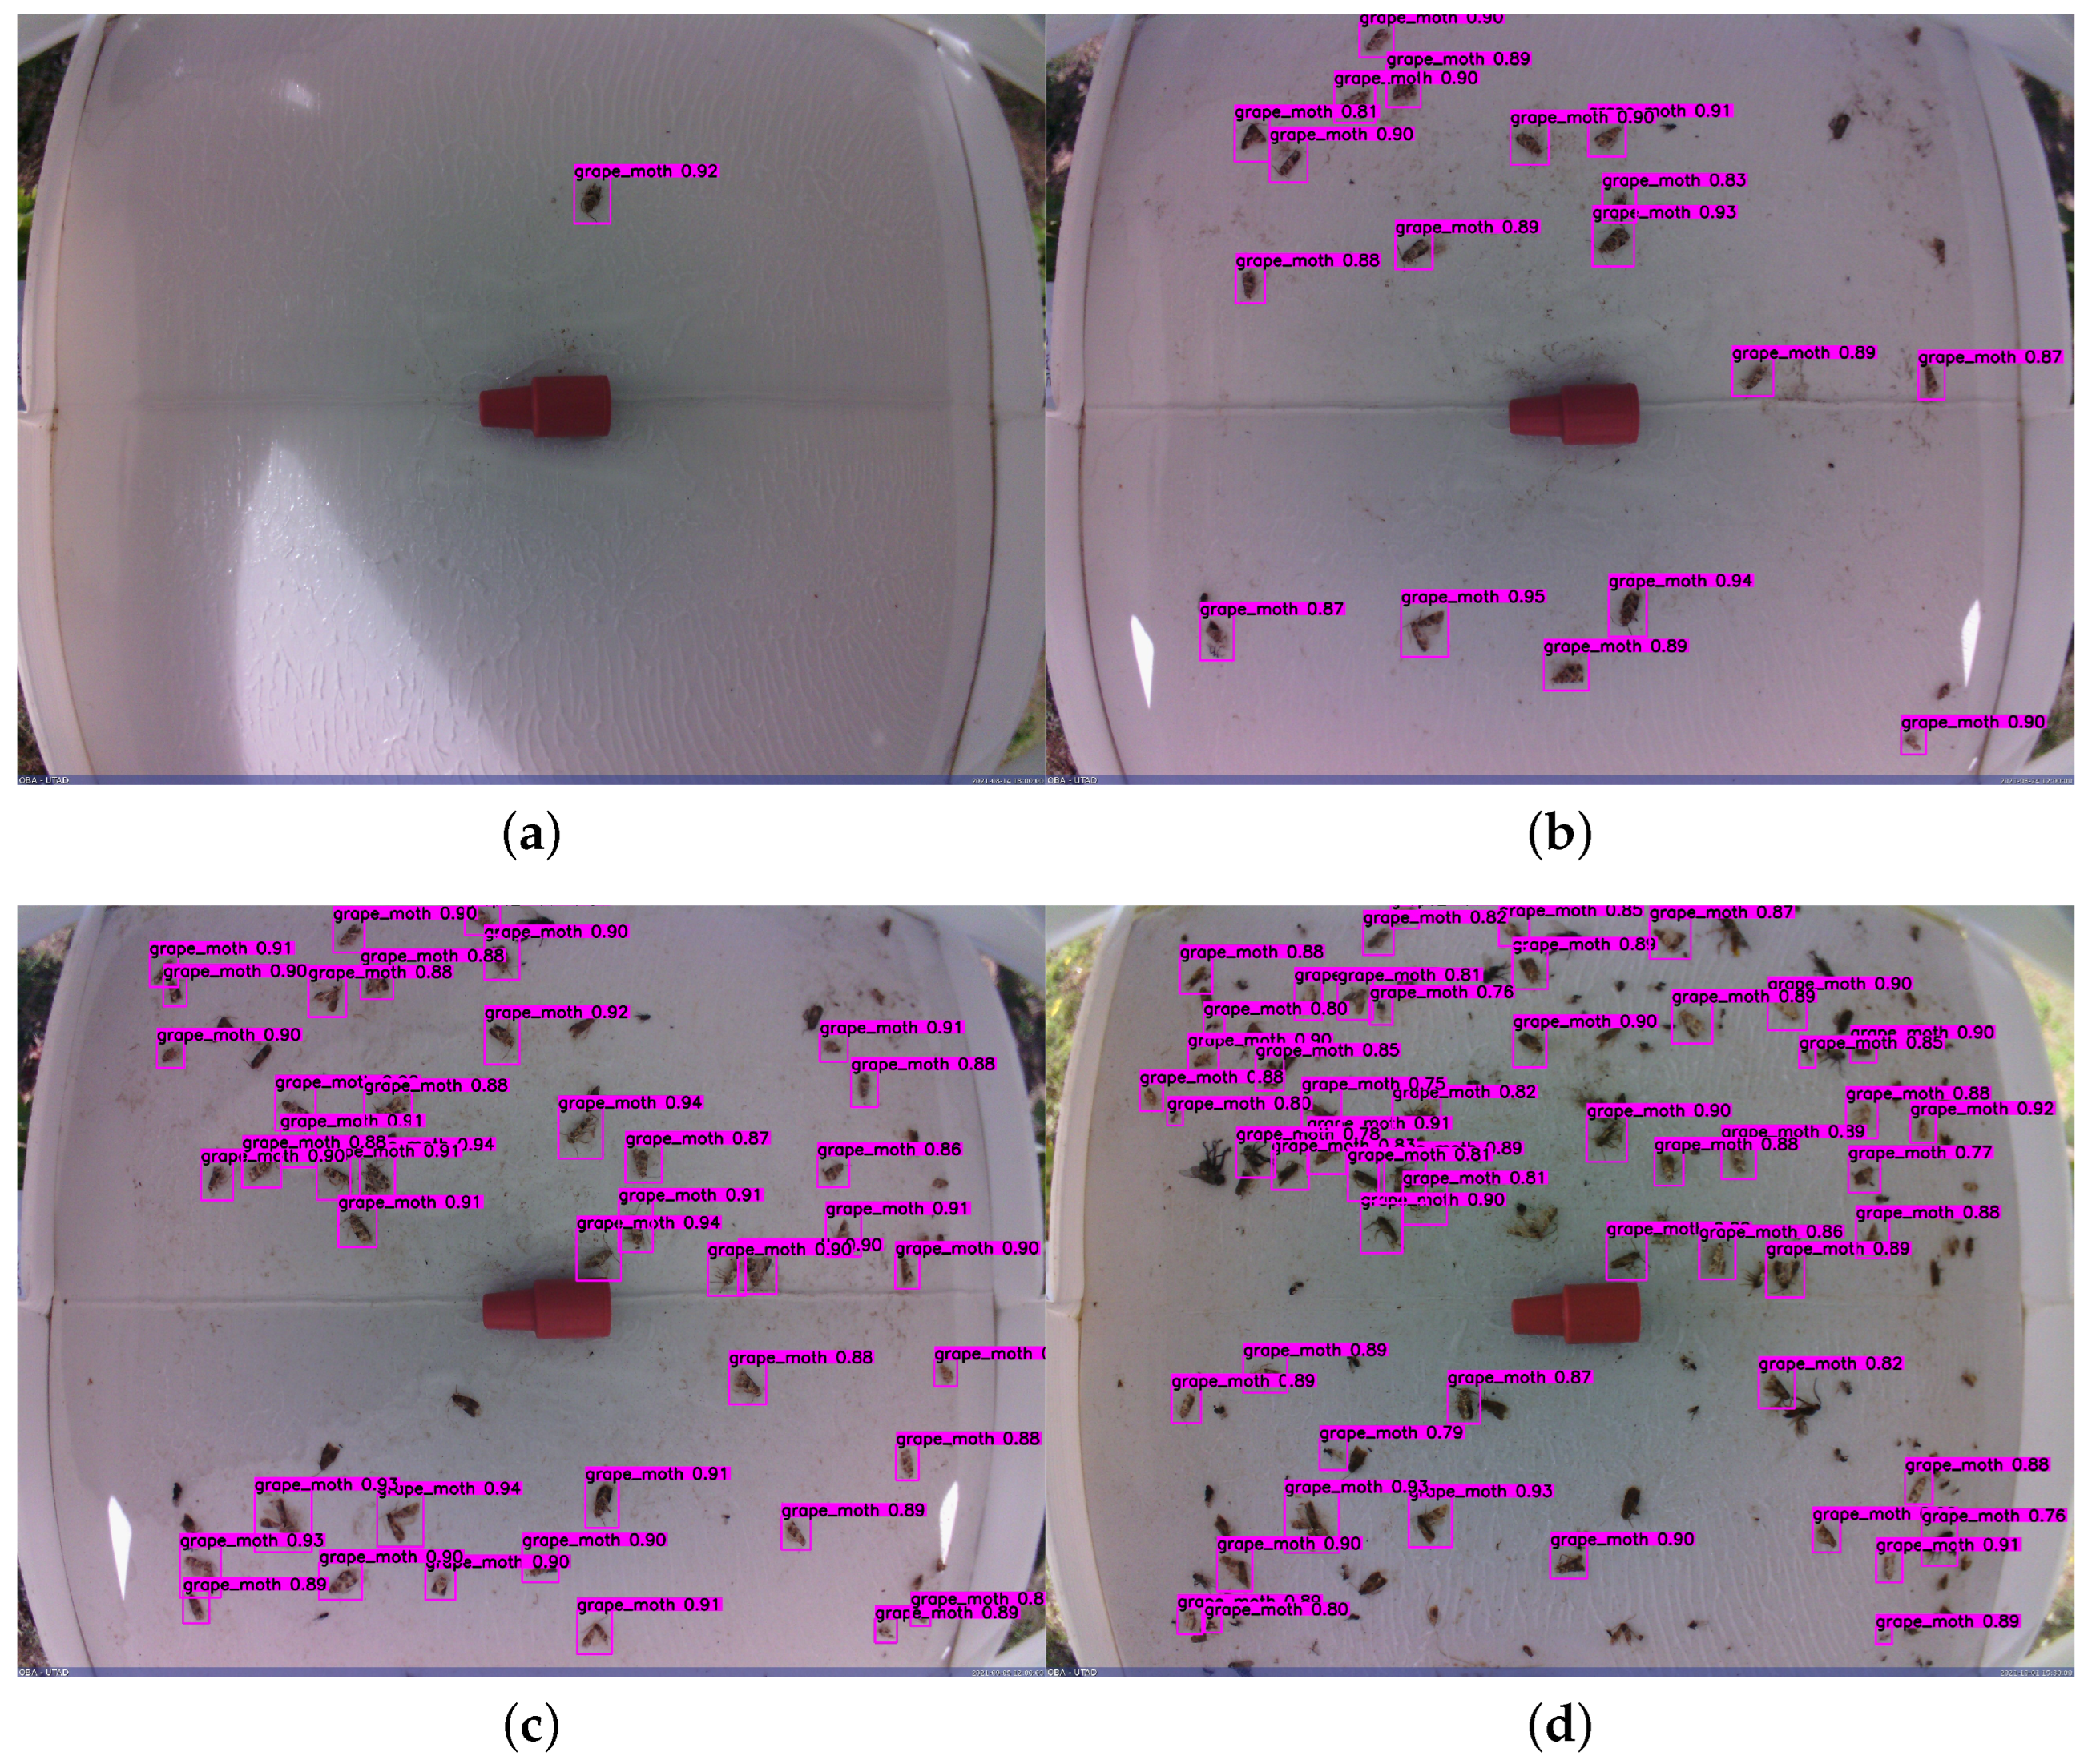
3.5. Grapevine Moth Males Tally Application
Grapevine moth
Lobesia botrana is one of the pests that has a relevant economic impact in some of the Portuguese wine regions. Hence, it made perfect sense to develop and test an application capable to detect, classify and tally grapevine moth males captured by field traps. This was achieved using the same approach described in the previous subsection. Indeed, a small camera equipped with a fish-eye lens was fitted inside a field sticky trap as presented in
Figure 5a. All acquired images were analysed and every existing grapevine moth male was dully annotated.
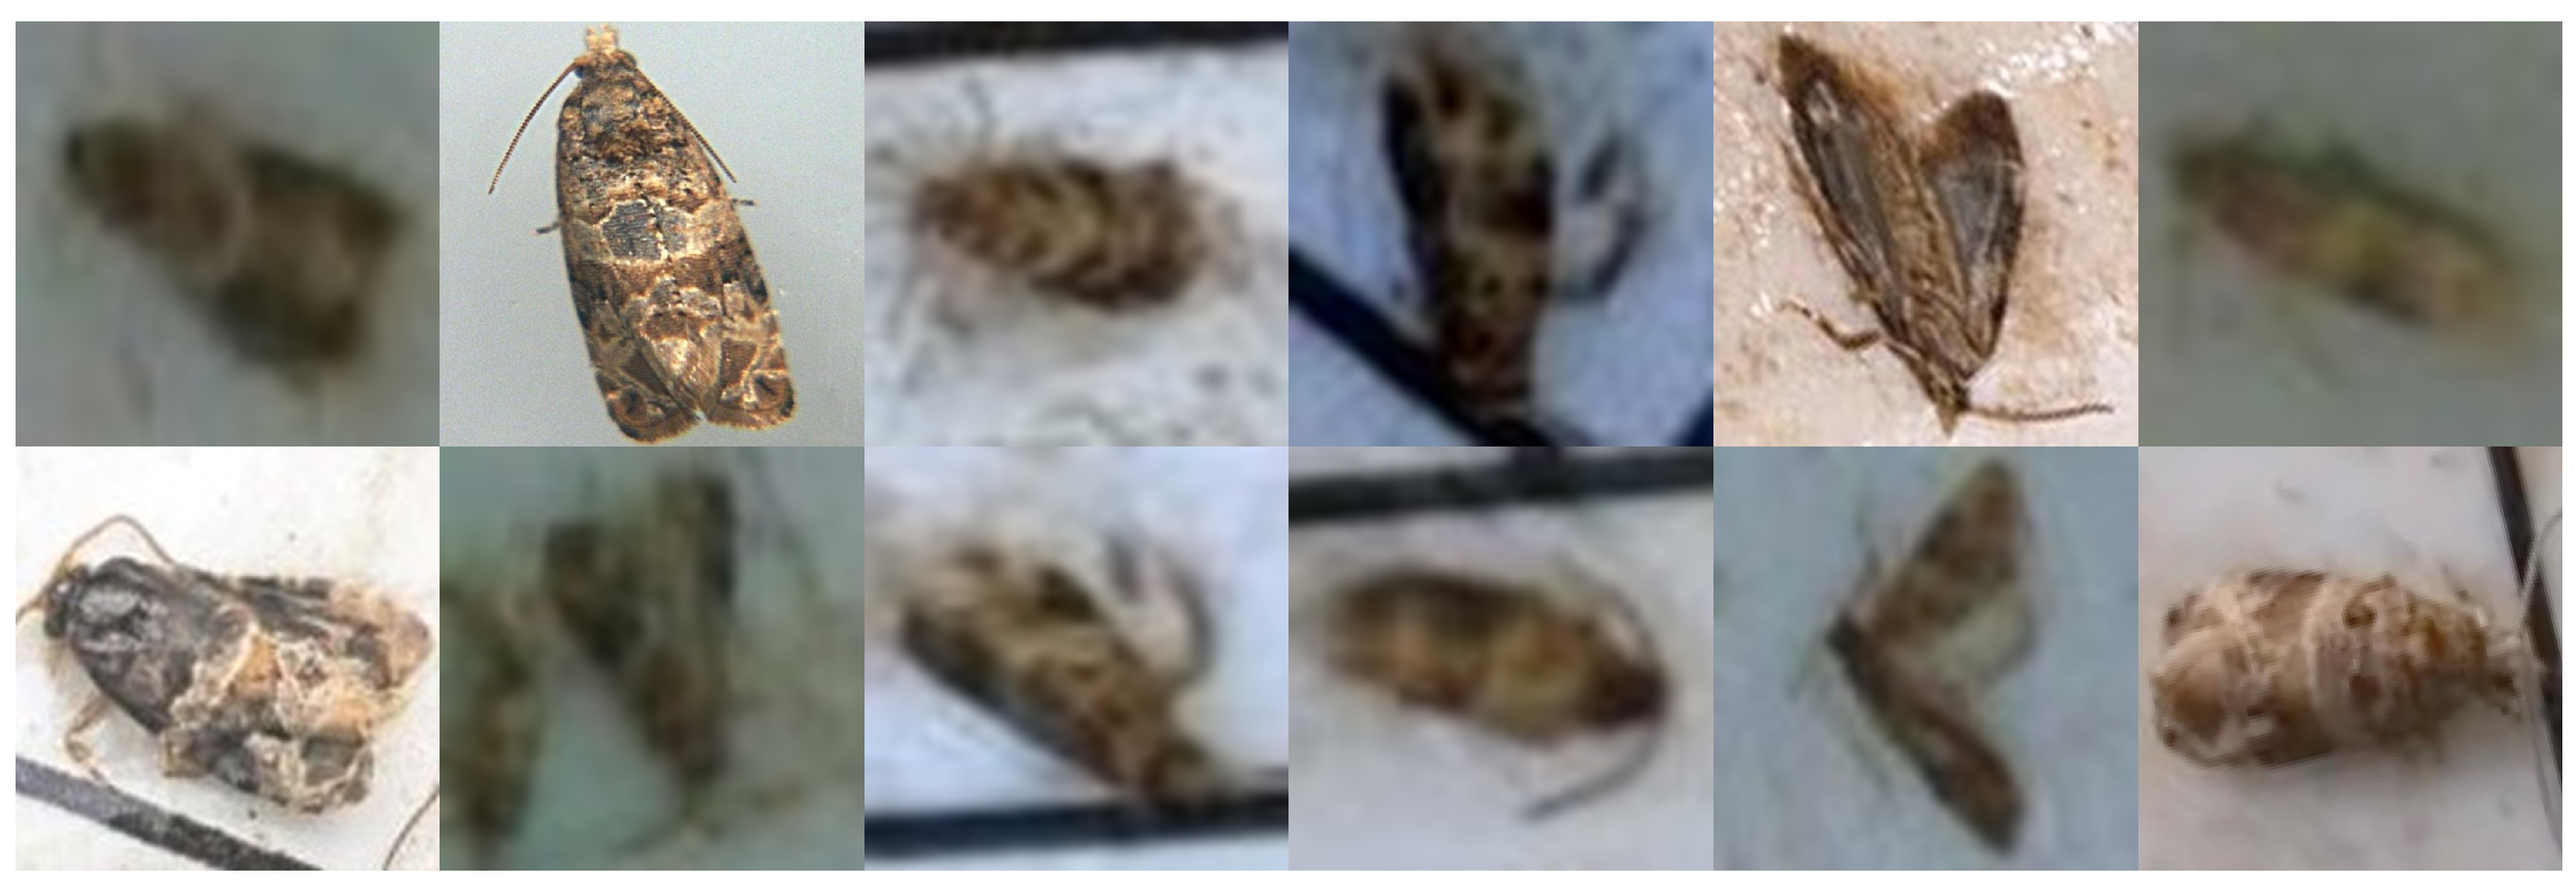
The initial dataset of captured insects is composed of 36 images. After properly annotated, it yielded 1014 images of grapevine moth males. Again, Roboflow platform was not only used to divide the dataset in 70% for training, 20% for validation, and 10% for testing, but also to create a new version of the dataset, by means of a data augmentation process. Indeed, it replicated existing training images with transformations that included different rotations between
° and +45 °, varying brightness between
% and +25%, exposure variation between
% and +15%, and blurring up to 0.25 px. This dataset version resulted in a total of 146 trap images with a 1024 × 1024 px resolution, where 3239 grapevine moth males were annotated.
Figure 7 depicts some examples of grapevine moth images obtained after the annotation process. Considering that the initial dataset had yet a reduced number of images, this augmented version was the one used to train the AI approach.
Table 3 sums up dataset-related data.
Training was done considering one class only and using a batch size of 8. As in the grapevine’ shoots approach, hyperparameters—e.g., learning rate = 0.01, momentum = 0.938, decay = 0.0005—were also kept at their default values. The number of epochs was set to 500, since precision did stabilised from then on.
Unlike the approach used in the grapevine’ shoots application and considering that the existing dataset was still quite small, there were no different training configurations compared. Indeed, the aim was just to validate this approach as an automatic way to tally grapevine moth males captured in field traps, and assess it’s performance as a viable VineInspector service. Therefore, training was done using images with a 1024 × 1024 px resolution. Moreover, YOLOv4-CSP architecture was selected as it was one of which presented the best overall results in detecting and classifying grapevine shoots, as will be shown in the results section.
VineInspector acquired images from a coupled field trap between 13 August and 27 September 2021. Each had their grapevine moth males tallied by this application and the results sent to mySense platform. This rendered them available to users, allowing a remote monitoring of the tally process evolution.
4. Results and Discussion
This section presents the results from both the case study applications, as well as the classification algorithm training process evaluation. With regard to the downy mildew infection prediction application, occurrences—days in which warnings were generated—during the year 2021 are compared with those issued by Direcção Regional de Agricultura e Pescas—Norte (DRAPN), an official government entity who is responsible for generating these type of warnings for the north of Portugal. For the other case study, and as for keeping tabs on the number of grapevine moth males captured in sticky traps, the application returned the tallies over the several days in which the a trap was monitored. Finally, VineInspector device operation is analysed to better characterise the power consumption profile, as well as data exchange with the remote platform.
4.1. Grapevine’ Shoots Application
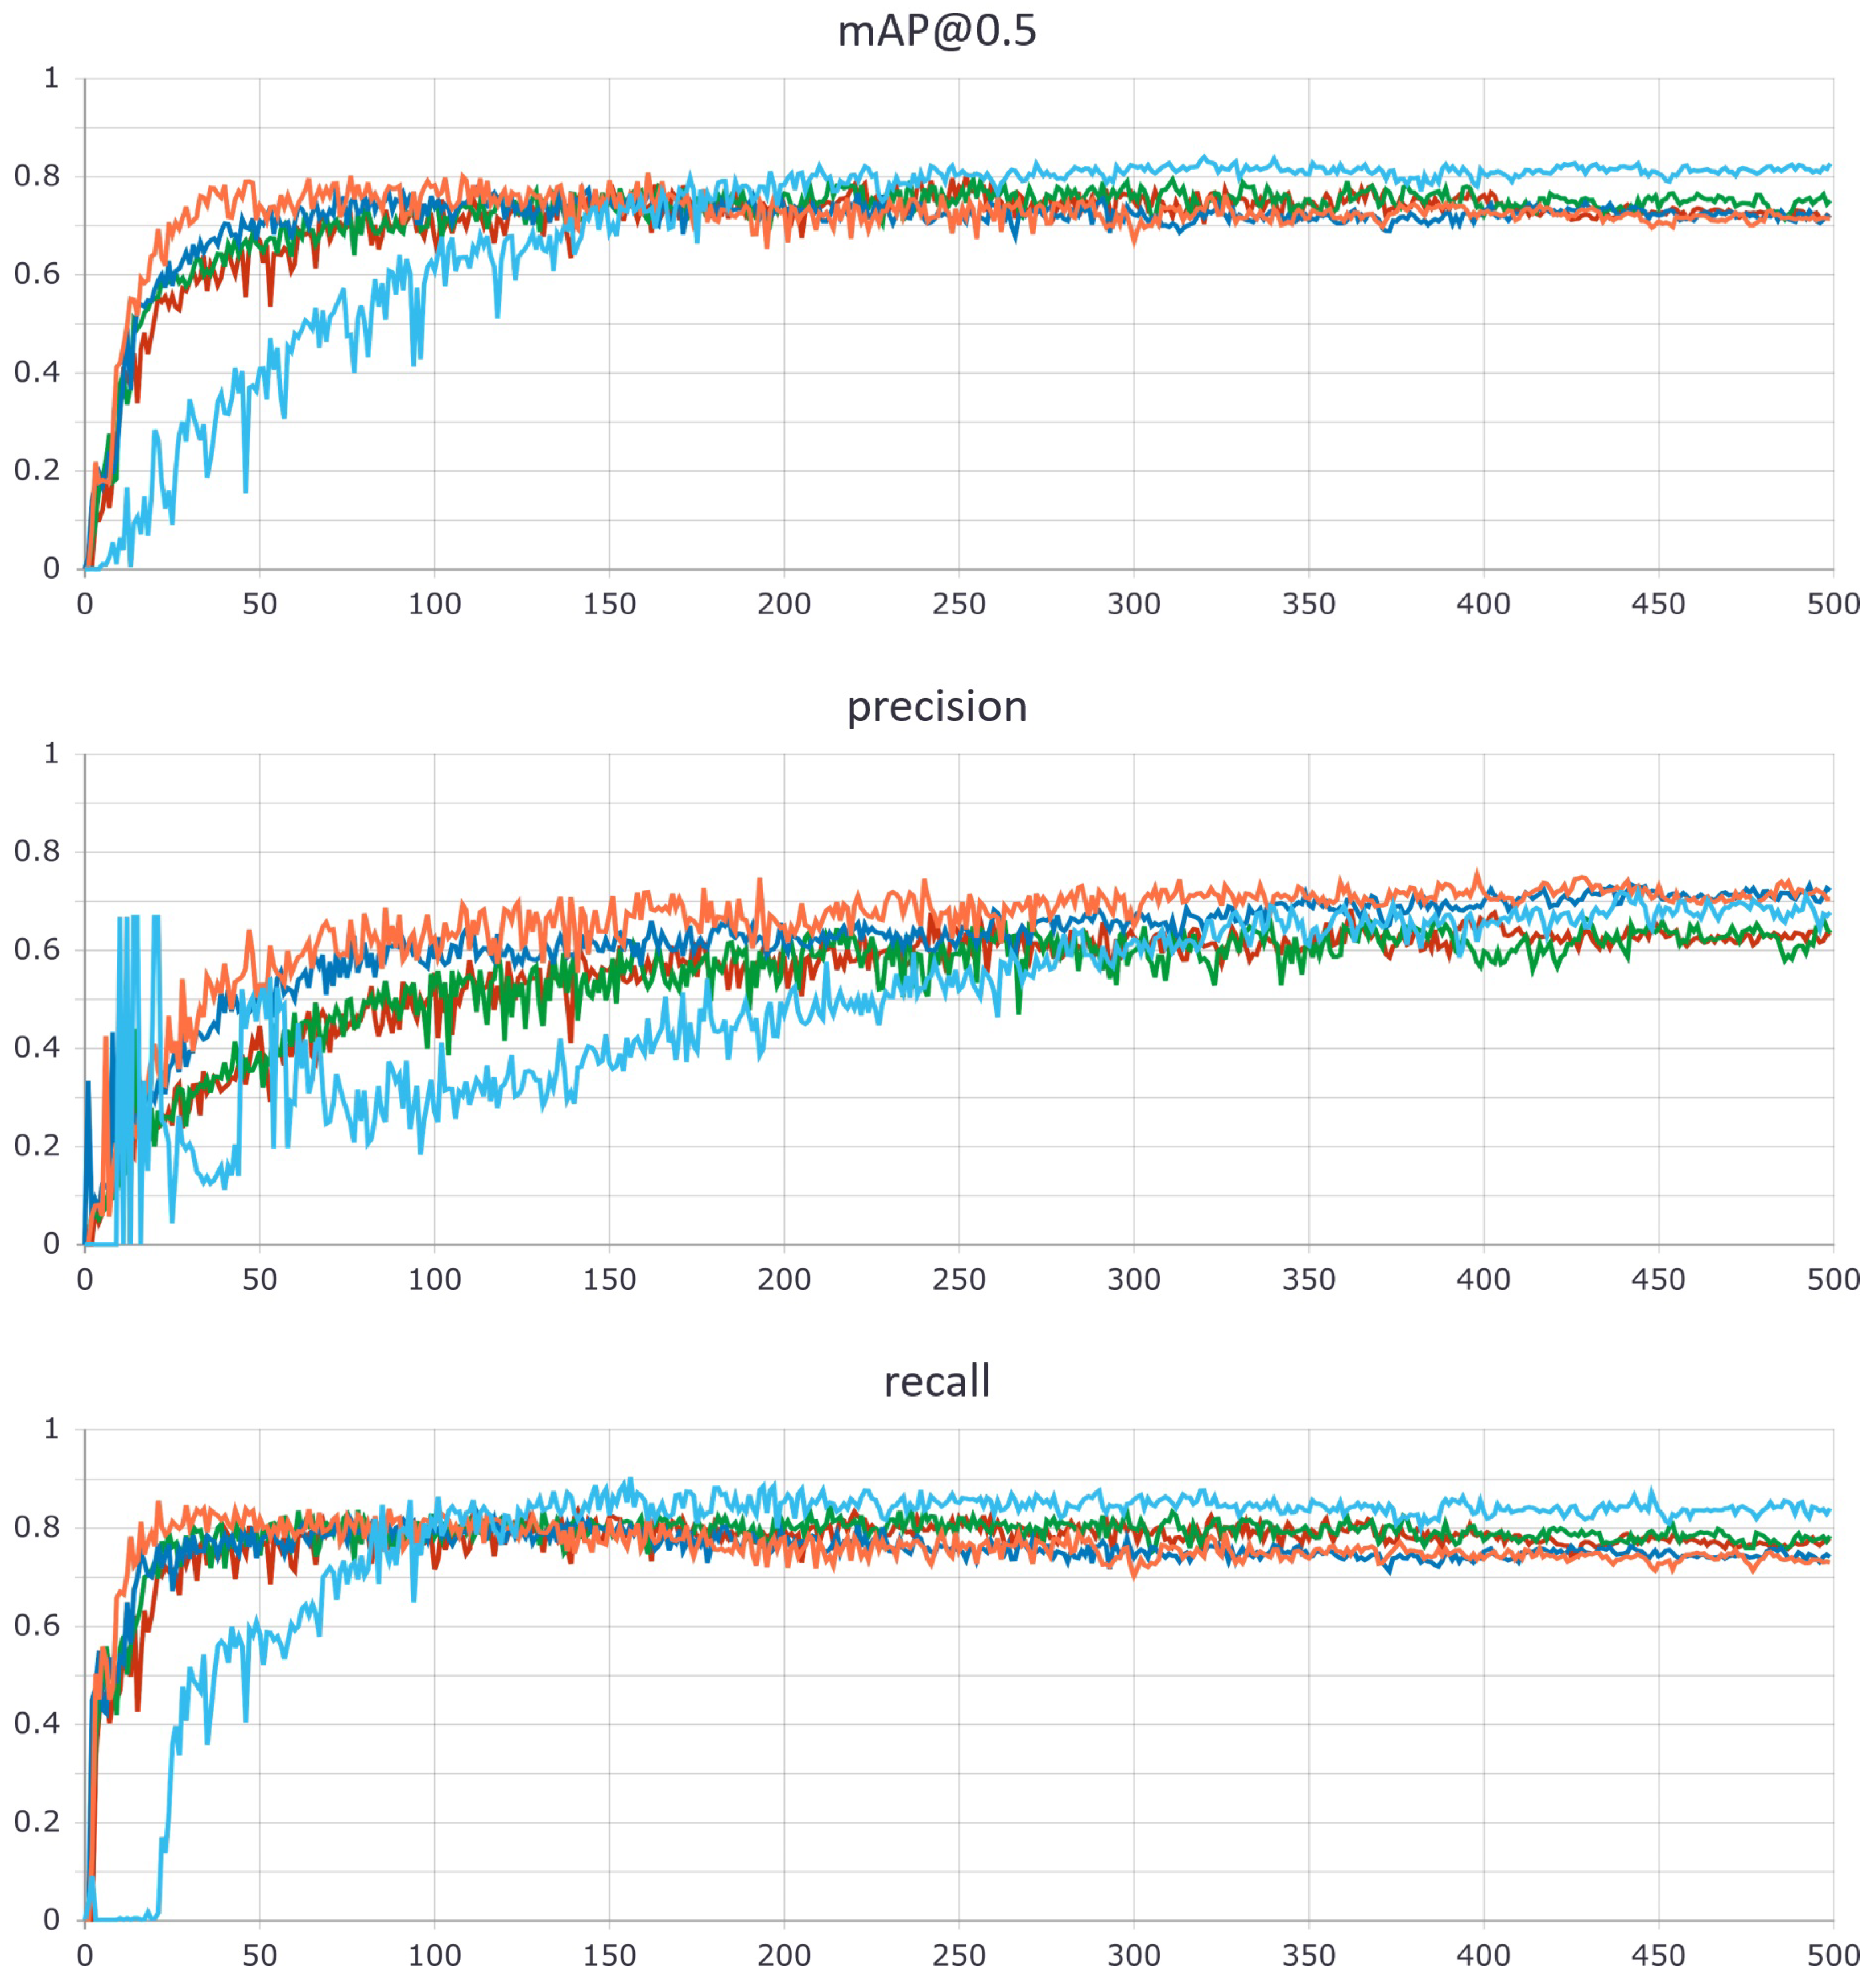
Training assessment was done using a mean Average Precision of 0.5 (mAP@0.5), precision, recall and F1-score. While
Figure 8 depicts the mAP@0.5, precision and recall curves,
Table 4 shows the best results obtained for each training study.
Results support that image resolution has a direct bearing in each model training process performance. Indeed, the training studies carried out with the lowest resolution images (512 × 512 px) where those that had the worst overall performance, even when resorting to a more complex architecture (YOLOv4-P7). It happens because these lowest resolution images portrait an highly complex natural environment, where no two grapevine shoots are similar. As for the training studies in which higher resolution images—1024 × 1024 px and 1900 × 1900 px—were used, they presented the best overall performance results: “0da_1900px_cps” had both a higher mAP@0.5 and recall with only less 0.03% precision, when compared with “4da_1024px_csp”. Still, “0da_1900px_cps” precision curve shows an upward tendency. As such, training it during more epochs may eventually lead up to have it surpass “4da_1024px_csp” precision value. Lastly, the training study with the worst performance with regard to precision and F1-score was the one that used pre-trained weights (“4da_512px_csp_pretrained”). Considering these results, the chosen model to run with the testing portion of the dataset was the one from “0da_1900px_csp” training study.
Figure 9 shows the detection results in four grapevine shoots images.
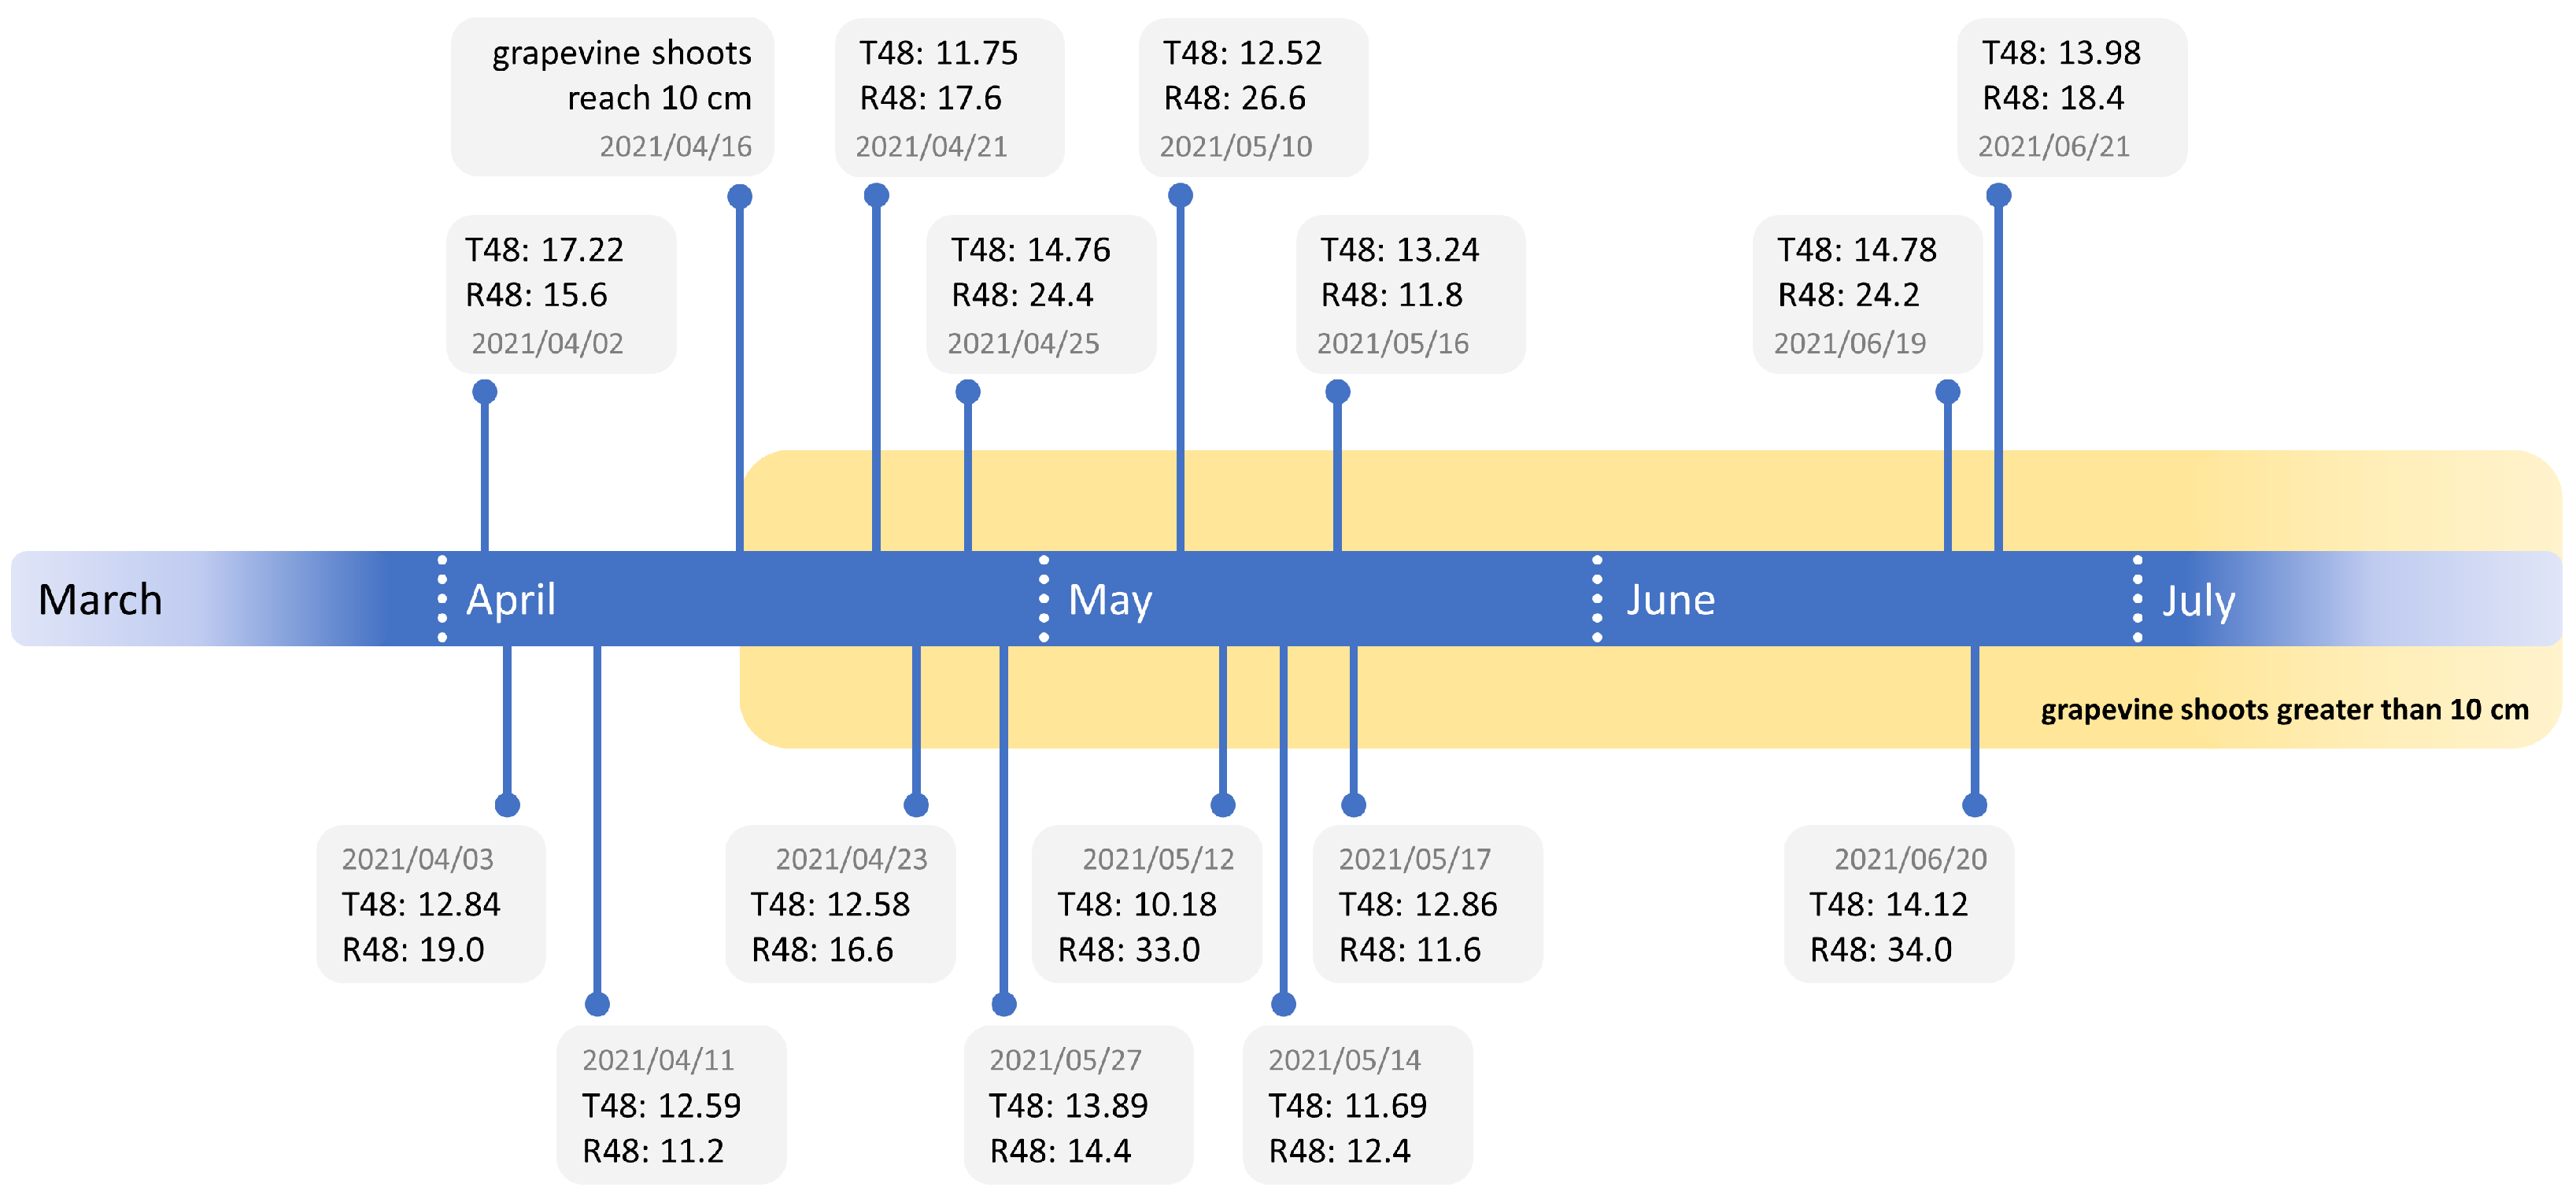
By automatically identifying grapevine’ shoots measuring more than 10 cm and an environmental context with an average air temperature greater than 10 ° C and rainfall above 10 mm within a 24–48 h period, a system is capable of issuing alerts in a timely manner to a setting favourable to the development of grapevine downy mildew. Action can therefore be taken swiftly to reduce or even completely avoid damage caused by the disease. Between March and July 2021—months of interest for downy mildew monitoring—these three parameters were monitored and the generated events are presented in
Figure 10 timeline.
On 2, 3 and 11 April, temperature and rainfall conditions were favourable for downy mildew development. However, as grapevine’ shoots had not yet exceeded 10 cm in length, no warning was issued. On 16 April, shoots began to exceed 10 cm and from that point onward, whenever there were favourable temperature and rainfall conditions, warnings were generated: it happened on 22, 23, 25 and 27 April; 10, 12, 14, 16 and 17 May, and finally 19, 20 and 21 June. These dates were compared with those of official warnings issued by DRAPN. For the same region in which VineInspector was installed, DRAPN generated warnings on 1 April—advising treatment only if grapevine’ shoots had exceeded 10 cm—, 10th, 21st and 25th. Hereinafter, DRAPN advised continuous treatment for mildew prevention without stating specific days, as weather conditions remained unstable during the following months. By comparing VineInspector and DRAPN warning dates, the former was spot on. Indeed, warnings were even more precise as they enabled knowing downy mildew risk for a specific parcel and not for an extended region. Moreover, VineInspector issues warnings continuously and throughout all season, specifying each day were risk exists, so that prevention and treatment interventions can be managed in the best possible way. Warnings issued after 25 April meet DRAPN’s continuous treatment advice.
4.2. Grapevine Moth Males Tally
Figure 11 depicts the mAP@0.5, precision and recall curves obtained by the training process. The highest mAP@0.5, precision and recall values were 0.93, 0.73, 0.97, respectively. They are quite acceptable considering the dataset size.
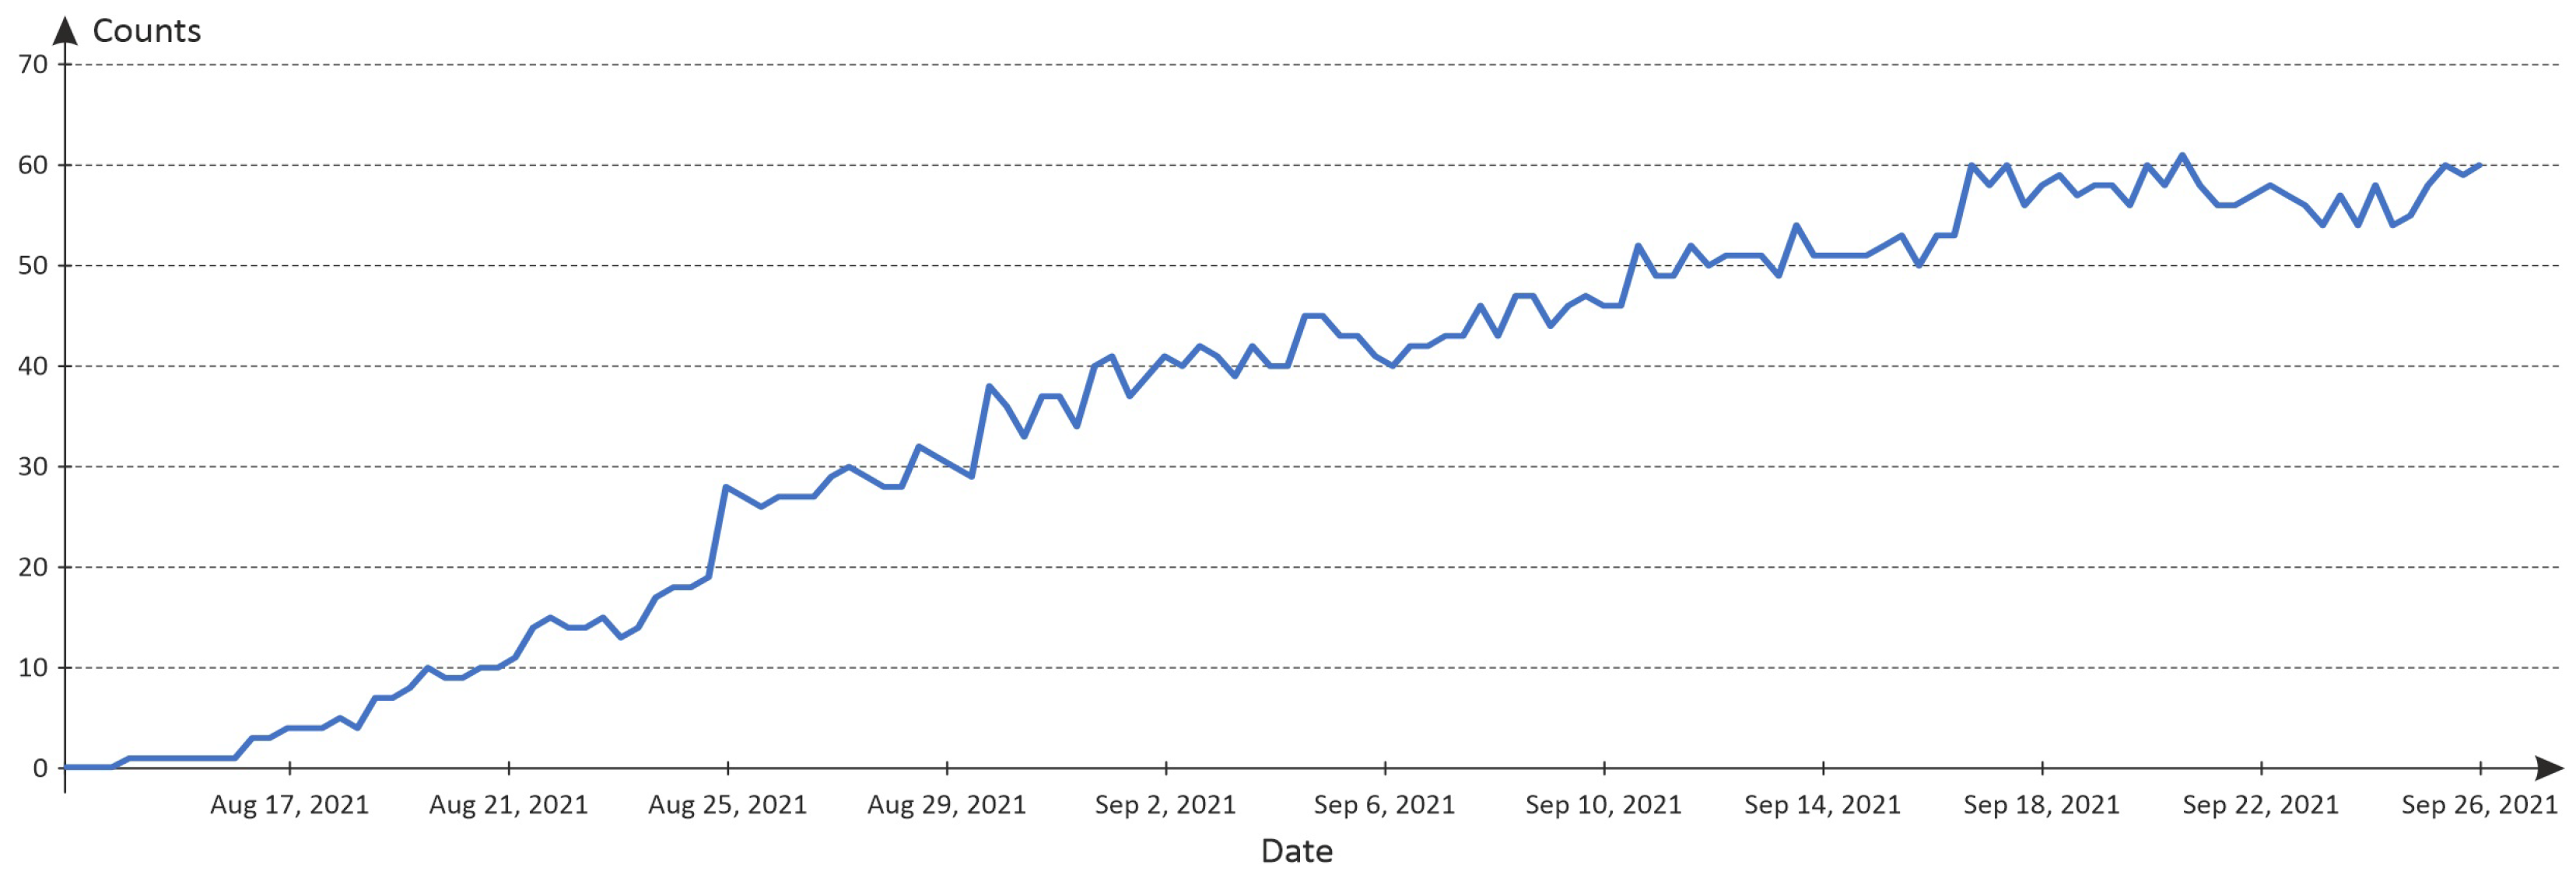
Figure 12 presents the classification process in four example images and
Figure 13 depicts the tally evolution throughout the entire monitoring period.
By paying a closer look at
Figure 13, the first grapevine moth males were captured and classified only one day after placing the field trap. Late August, around 40 moth males were tallied, and at the end of September, 60. It is also clear that 25 August, 30 August and 16 September were the days that had a steeper climb in the number of moth males captured and classified. A fact worth noting is that the tally value happens to decrease several times during the monitoring period. This can be explained by the time in the day when some images were acquired. Indeed, late afternoon acquired images have a portion directly affected by the sun. As a consequence, some captured grapevine moth males are not identified. Furthermore, another reason may be that in the first few days after being captured, grapevine moths are still alive, even tough stuck on the trap’s glue. In fact, they remain capable of small movements and changing positions, which may lead to not being detected. Increasing the training dataset with more images and having some acquired in roughly these same conditions will probably solve these issues. It will be done next year, rendering the grapevine moth males tally application even more reliable and accurate.
4.3. Operating Record
VineInspector is based on a low-cost autonomous SBC, as presented in
Section 3.1. While power consumption can be considered reduced within a regular operating context, it cannot be discarded as it represents an important limitation when configuring the overall system’s operation, and when selecting (and developing) power harvesting and storing solutions in the field (in this case, the source is exclusively the sun).
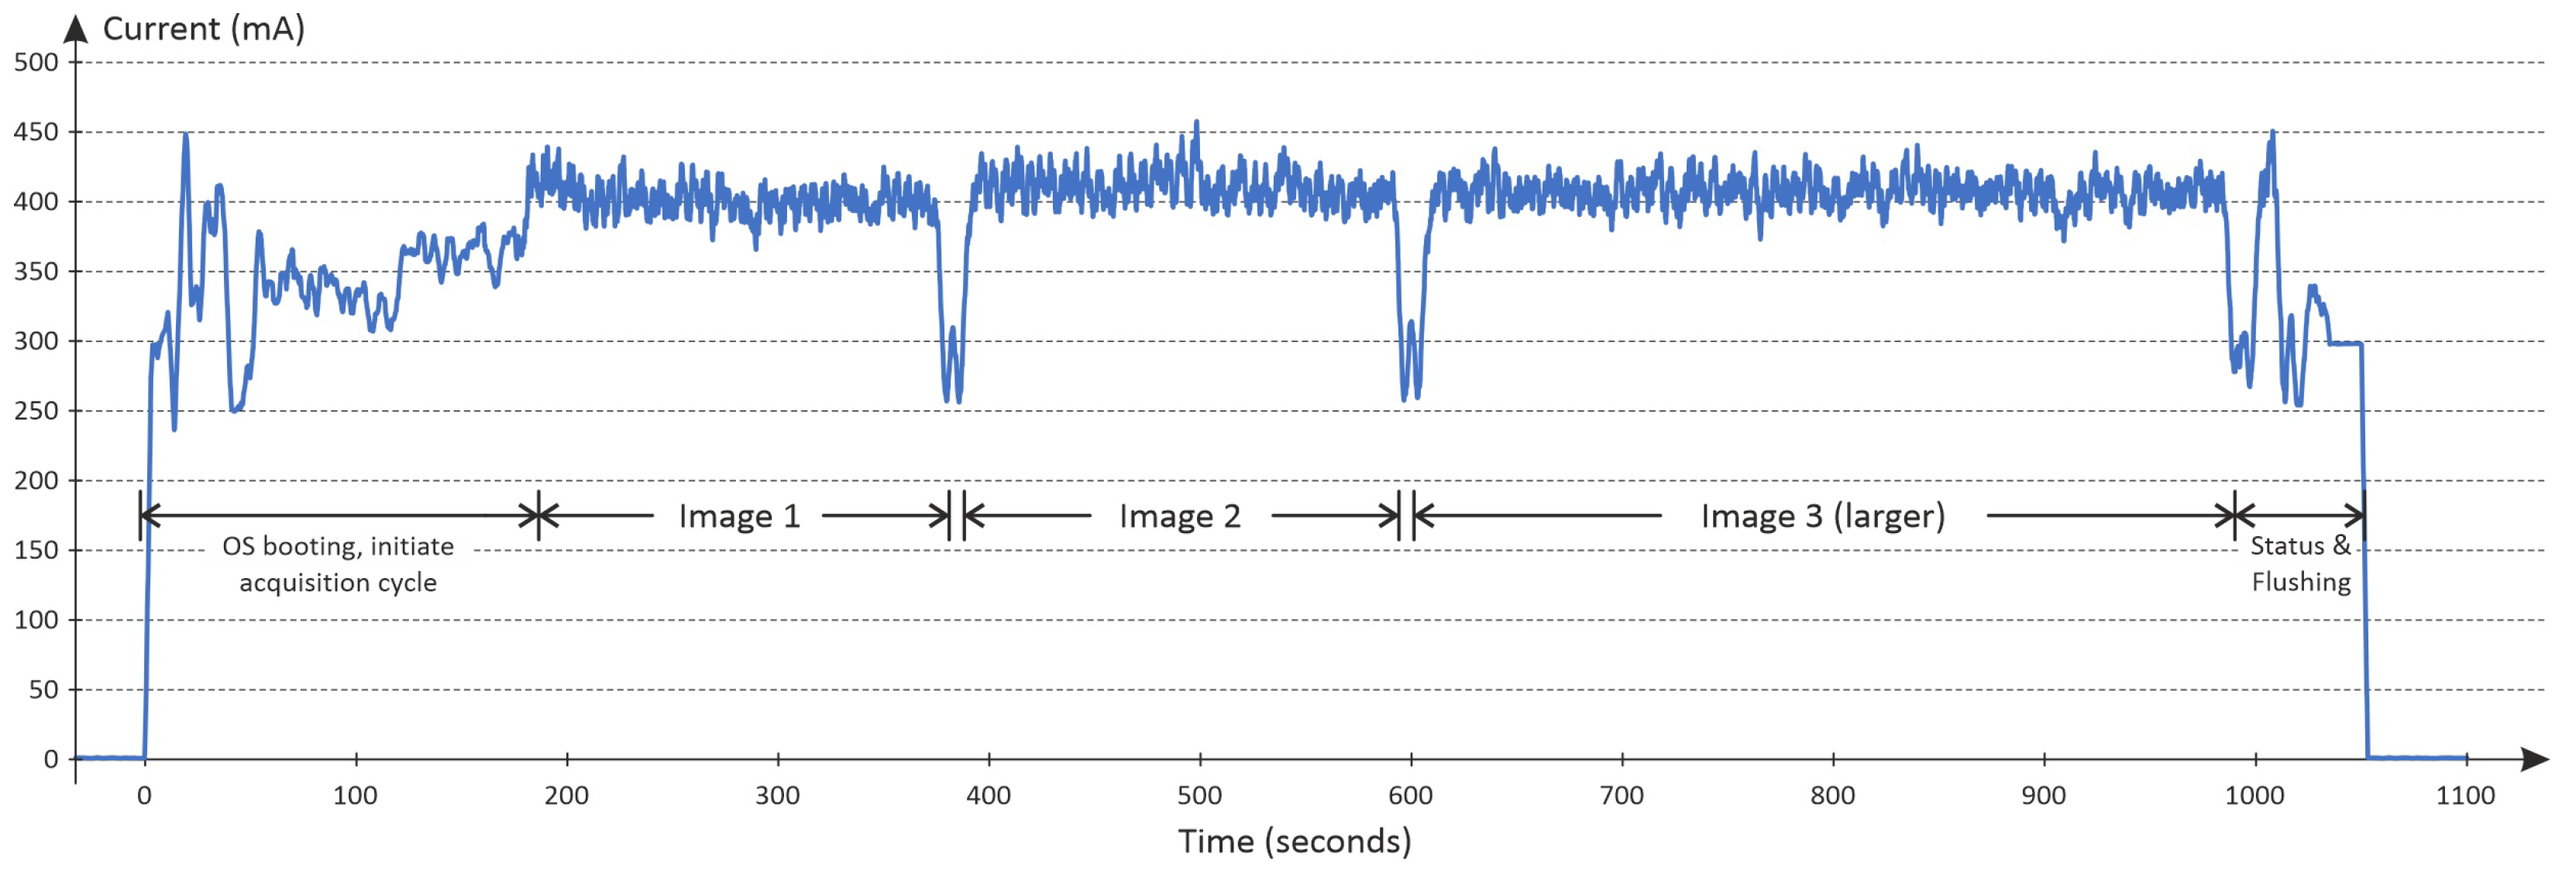
Figure 14 depicts a common operation cycle that begins right when the shield’s microcontroller powers on the VineInspector system. VineInspector had an average current consumption of 386.51 mA during the 18 min and 10 s that it took to complete this cycle. Outside the active period, current consumption is about 1 mA. Considering the consumption profile and that this operation cycle is repeated four times a day, the average power consumption is of 20.45 mA.
Acquired images transmission is undoubtedly the process in which most of the VineInspector operation time—and thus energy budget—is spent. Indeed, the modem used (2G version) has an upload rate of around 64 kbps, which means a lengthy transmission time for an image whose size can be around 1 MB. Low-bandwidth and poor network coverage are also very common issues in PV applications that require data to be transmitted from the field. This can also weight in when considering limiting factors that may restrict the reduction of the VineInspector power consumption profile. Even so, reducing this long upload time is a mandatory improvement in an upcoming version of VineInspector.
VineInspector was thoroughly tested in the field in real operation conditions, during a year. No bugs or malfunctions that could have resulted in a data loss were detected. In about 3.9% of the operating period, data link was loss during the image upload process. However, in each case data was successfully transmitted in a second attempt. This comes to show both the robustness and reliability achieved with VineInspector.
5. Conclusions and Future Work
Data is becoming increasingly important within PA/PV context. Indeed, getting to know the context—both physical and environmental—in which a crop grows is key to have sustainable management practices, to optimise development, and to improve yield and quality. Whilst reliability and precision are often sold as two of the most important characteristics in a crop monitoring system (and they really are), spatial and temporal granularity are also equally important to have a continuous feel on what goes on with a crop in the field. Plagues and diseases are of particular relevance due to their seasonal phytosanitary and economic impacts: to be able to identify plant characteristics and/or environmental conditions favourable to their development can trigger localised and timely treatments to mitigate losses. Early detection can also do the same, while in a more advanced stage as there are already visible signs in the plants. To include proximity image sensors in the (already) wide array of monitoring technologies available enables a more realistic perception on crop dynamics, but also the use of AI/ML algorithms with locally captured images, which can render valuable automatic information for decision support systems.
The VineInspector is a mature approach on acquiring, storing and transmitting proximity field data, featuring detection/classification in captured images by means of AI/ML techniques. While data is undoubtedly important to have, information is what really matters when managing a crop—in this instance, vineyards—efficiently and in a more sustainable way. Therefore, this paper presents not only a VineInspector operating record throughout a monitoring period within a harsh field context, but also two applications that directly address (i) environmental & plant favourable conditions to the onset of diseases; and (ii) early detection of plagues. Grapevine’ shoots detection and classification was able to successfully isolate shoots bigger than 10 cm, which is particularly useful in determining the beginning of grapevines’ vegetative cycle—in turn very useful to trim grapevine phenology prediction models—, but also to the 3–10 rule, widely used for the detection of primary infections of grapevine downy mildew. In fact, the 10 cm measurement is related to an average leaf area of 6 to 8 cm
2 [
13]. So, this approach becomes particularly useful to evaluate the area exposed to the first primary infection. The second application successfully tallies grapevine moth males captured in field traps. It enables not only to determine when they first show up, but also to assess the intensity of the attack and the timeline. As such, it is also possible to understand in which days—and even the part of the day—more grapevine moths appeared, and thus apply the proper treatment more effectively.
One of the major VineInspector advantages is the fact that it is a very flexible system with regard to remote applications supported by AI/ML-based algorithms. Indeed, they are independent of the n existing image channels. In addition to both case study applications presented in this work and as VineInspector collects both meteorological data and images, it has potential to be used in numerous other applications and cultures. Examples are apple orchards, olive groves, tomato plantations, blueberry plantations. In fact, the monitoring of olive fruit fly through traps placed in the olive groves is being presently worked on.
As future work, we intend to press on some important issues. One of them will be tracking grapevines’ phenological states using images that are continuously acquired and sent by the VineInspector. It will be necessary to expand the training dataset and increase the number of classes. The automatic detection of these phenological states is of utmost relevance since many cultural operations in the vineyard rely on phenological changes. More accurate predictions will contribute to have more efficient and sustainable decision support systems and vineyard management practices. The idea will be to later extend this functionality to other crops, such as apple orchards. Another issue to tackle in the future is related to traps monitoring. It is intended to develop models that correlate the environmental data collected with the insect tallies to be able to predict when the insects will appear with more intensity and thus perform the necessary treatments to prevent or minimise damages.


 ,
, 


