Article

In Situ Measurement of Stemflow, Throughfall and Canopy Interception of Sprinkler Irrigation Water in a Wheat Field

1
Beijing Key Laboratory of Urban Hydrological Cycle and Sponge City Technology, College of Water Sciences, Beijing Normal University, Beijing 100875, China
2
School of Water Conservancy and Environment, Zhengzhou University, Zhengzhou 450001, China
*
Author to whom correspondence should be addressed.
Agriculture 2022, 12(8), 1265; https://doi.org/10.3390/agriculture12081265
Submission received: 10 July 2022 / Revised: 17 August 2022 / Accepted: 17 August 2022 / Published: 19 August 2022
(This article belongs to the Special Issue Water-Saving Irrigation Technology and Strategies for Crop Production)

Abstract

:
The sprinkler irrigation method has been widely used in agricultural fields due to its high water productivity and microclimate regulation traits. Quantitative analysis of the water distribution of sprinkler irrigation water by considering canopy influence is critical to evaluate crop growth and water use efficiency. In this study, stemflow was measured by collecting the water flowing down along stems using a high-adsorption sheet, throughfall water was measured by contains placed between wheat rows, and canopy interception was measured by the mass difference of plants between before and after sprinkler irrigation during wheat anthesis and grain-filling stages in the North China Plain. The results showed that the canopy interception water was between 0.6 and 1.3 mm, with a mean of 0.9 mm per sprinkler irrigation event for a leaf area index of approximately 4. Stemflow water was linearly related to the irrigation water and approximately 30% of the irrigation water. The throughfall water was also linearly related to the irrigation water above the canopy and accounted for approximately 60% of the irrigation water. The three components of sprinkler water are weakly influenced by the plant leaf area index, wind conditions and sprinkler irrigation system layouts in this study.

1. Introduction

The sprinkler irrigation method has been widely used in agricultural fields due to its high water productivity and microclimate regulation traits [1,2,3,4]. It has been reported that in developed countries (for example, the USA, Spain, France, and Australia), sprinkler irrigated fields account for 47.1% of the total irrigated area and decrease to 10.5% for developing countries (for example, China, India, Brazil and Turkey) (accessed on 1 January 2021 at https://icid-ciid.org/icid_data_web/sprinklerandmircro.pdf). In China, the sprinkler irrigated field in 2020 was 4.61 Mha and approximately 12% of the national total irrigated area. The North China Plain, as the main wheat and maize production region, has 0.74 Mha area with a sprinkler irrigation system, which accounts for 16% of the total in China. The development of sprinkler irrigation is regarded as a practical and efficient irrigation method to improve water productivity, realize the transformation from traditional agriculture to modern agriculture, and promote the development of green agriculture in China [5,6].
With a sprinkler irrigation system, water first reaches the crop canopy and is then divided into three parts: canopy interception water (CI), throughfall water (TF) and stemflow water (SF) [7]. The water amount and portion of each part mainly depend on crop structure, plant density, irrigation systems and microclimate conditions. Generally, CI amount first increases with irrigation/rainfall time [8]. When all leaves are wetted, the CI reaches its maximum value, which is called canopy interception capacity. It has been reported that CI ranges from 0.4 to 1.6 mm and generally increases with increasing leaf area [8,9,10]. The reported CI in forests ranges from 0.4 to 1.1 mm [11,12] and 0.4–0.6 mm per unit leaf area for xerophytic shrubs [13]. Yu, et al. [12] further reported that rainfall interception values of the two coniferous forests (25–26%) were greater than those of the two broadleaved forests (17–18%). Large water droplets could impose a strong energy to leaves and enhance leaf vibration, which finally reduces the CI amount [9]. Similarly, strong wind also reduces CI because of leaf vibration [9]. Kang, et al. [9] found that the CI under sprinkler irrigation is exponentially related to drop size and linearly related to leaf area index (LAI) and the square of wind speed. Reducing CI means a high portion of irrigation water falls into the soil, which may increase irrigation water use efficiency.
Throughfall (TF) water is very important for crops’ growth in agricultural system and plants’ survive in arid regions because this water directly infiltrates the soil layer and can be adsorbed by the root system [7,14,15]. The TF water is mostly directly measured by gauges placed under the crop canopy. Butler and Huband [16] measured the TF water after wheat tillering based on the water inter row and open field and reported TF was approximately 60% of water above canopy. Ma, et al. [17] investigated the TFs of maize, soybeans, millets and winter wheat under rainfall densities of 40 and 80 mm h−1 for 30 min and found that the corresponding TFs were 65, 85, 80 and 72% of the total rainfall. They also found that TF increased with canopy development and was closely related to rainfall density. The reported TF in forest and shrub canopies varied greatly from 60% to 90%, depending on plant density, canopy structure, LAI, growth period, measured methods and climatic conditions [18,19]. Throughfall water under forest canopies varies greatly, and this variability tends to decrease with increases in rainfall amount, intensity and duration [14].
The stemflow water (SF) is the irrigation water that is first collected by crop leaves and then flows to the stem and finally flows down to the soil along the stem [7]. SF directly enters the main root zone and is critical to crop growth [20]. Further, the dissolved chemicals (pesticides and pollutants) will flow down to root zone with the stem flow, and finally pollute the soil and may harm crop growth and food quality [16]. Great SF also cause much water flow in surface and could result in soil and water erosion [21]. Glover and Gwynne [22] investigated the SF of maize in East Africa and reported that maize survived under dry conditions mainly because of the SF under light rainfall. The SF is generally measured with a water collection system, in which a cup is adhered to the main stem and used to collect the water that flows down along the stems, and a pipe that is connected to the cup is used to transfer the water in the cup to a container. Finally, the water in the container is measured by a volumetric flask [15]. SF can also be measured using water-adsorbed material that is adhered to the plant stem [23]. Mostly, the SF is measured for plants and crops with relatively large stems and low plant density, for example, maize crops and big-stem trees [15,21]. For dense and small diameter crops, such as wheat, the two methods mentioned are rarely used because of the small space between stems and the small stem diameter. Therefore, there is no report on the measured SF amount of wheat crops. Yuge and Anan [20] developed a model to estimate the crop stem flow of single leaf mustard under sprinkler irrigation conditions and found that SF accounted for 30% of the water applied. However, this model requires more parameters, including leaf area, leaf inclination angles, contact angles, droplet diameters and irrigation intensity, and is not validated for wheat crops.
Throughfall water and canopy interception under sprinkler irrigation in wheat field have been investigated [9,24,25]. However, the stemflow water in wheat field has not been studied. This lack information influences the evaluation on the under-canopy water distribution and water use efficiency in wheat field with sprinkler irrigation. Therefore, to accurately investigate the water distribution of sprinkler irrigation, especially the stem flow amount, we measured the water above the canopy, canopy interception, stemflow and throughfall water simultaneously in a sprinkler irrigated field under three sprinkler irrigation system layouts in situ. The related crop and climate factors that influence these three water portions were analyzed.

2. Materials and Methods

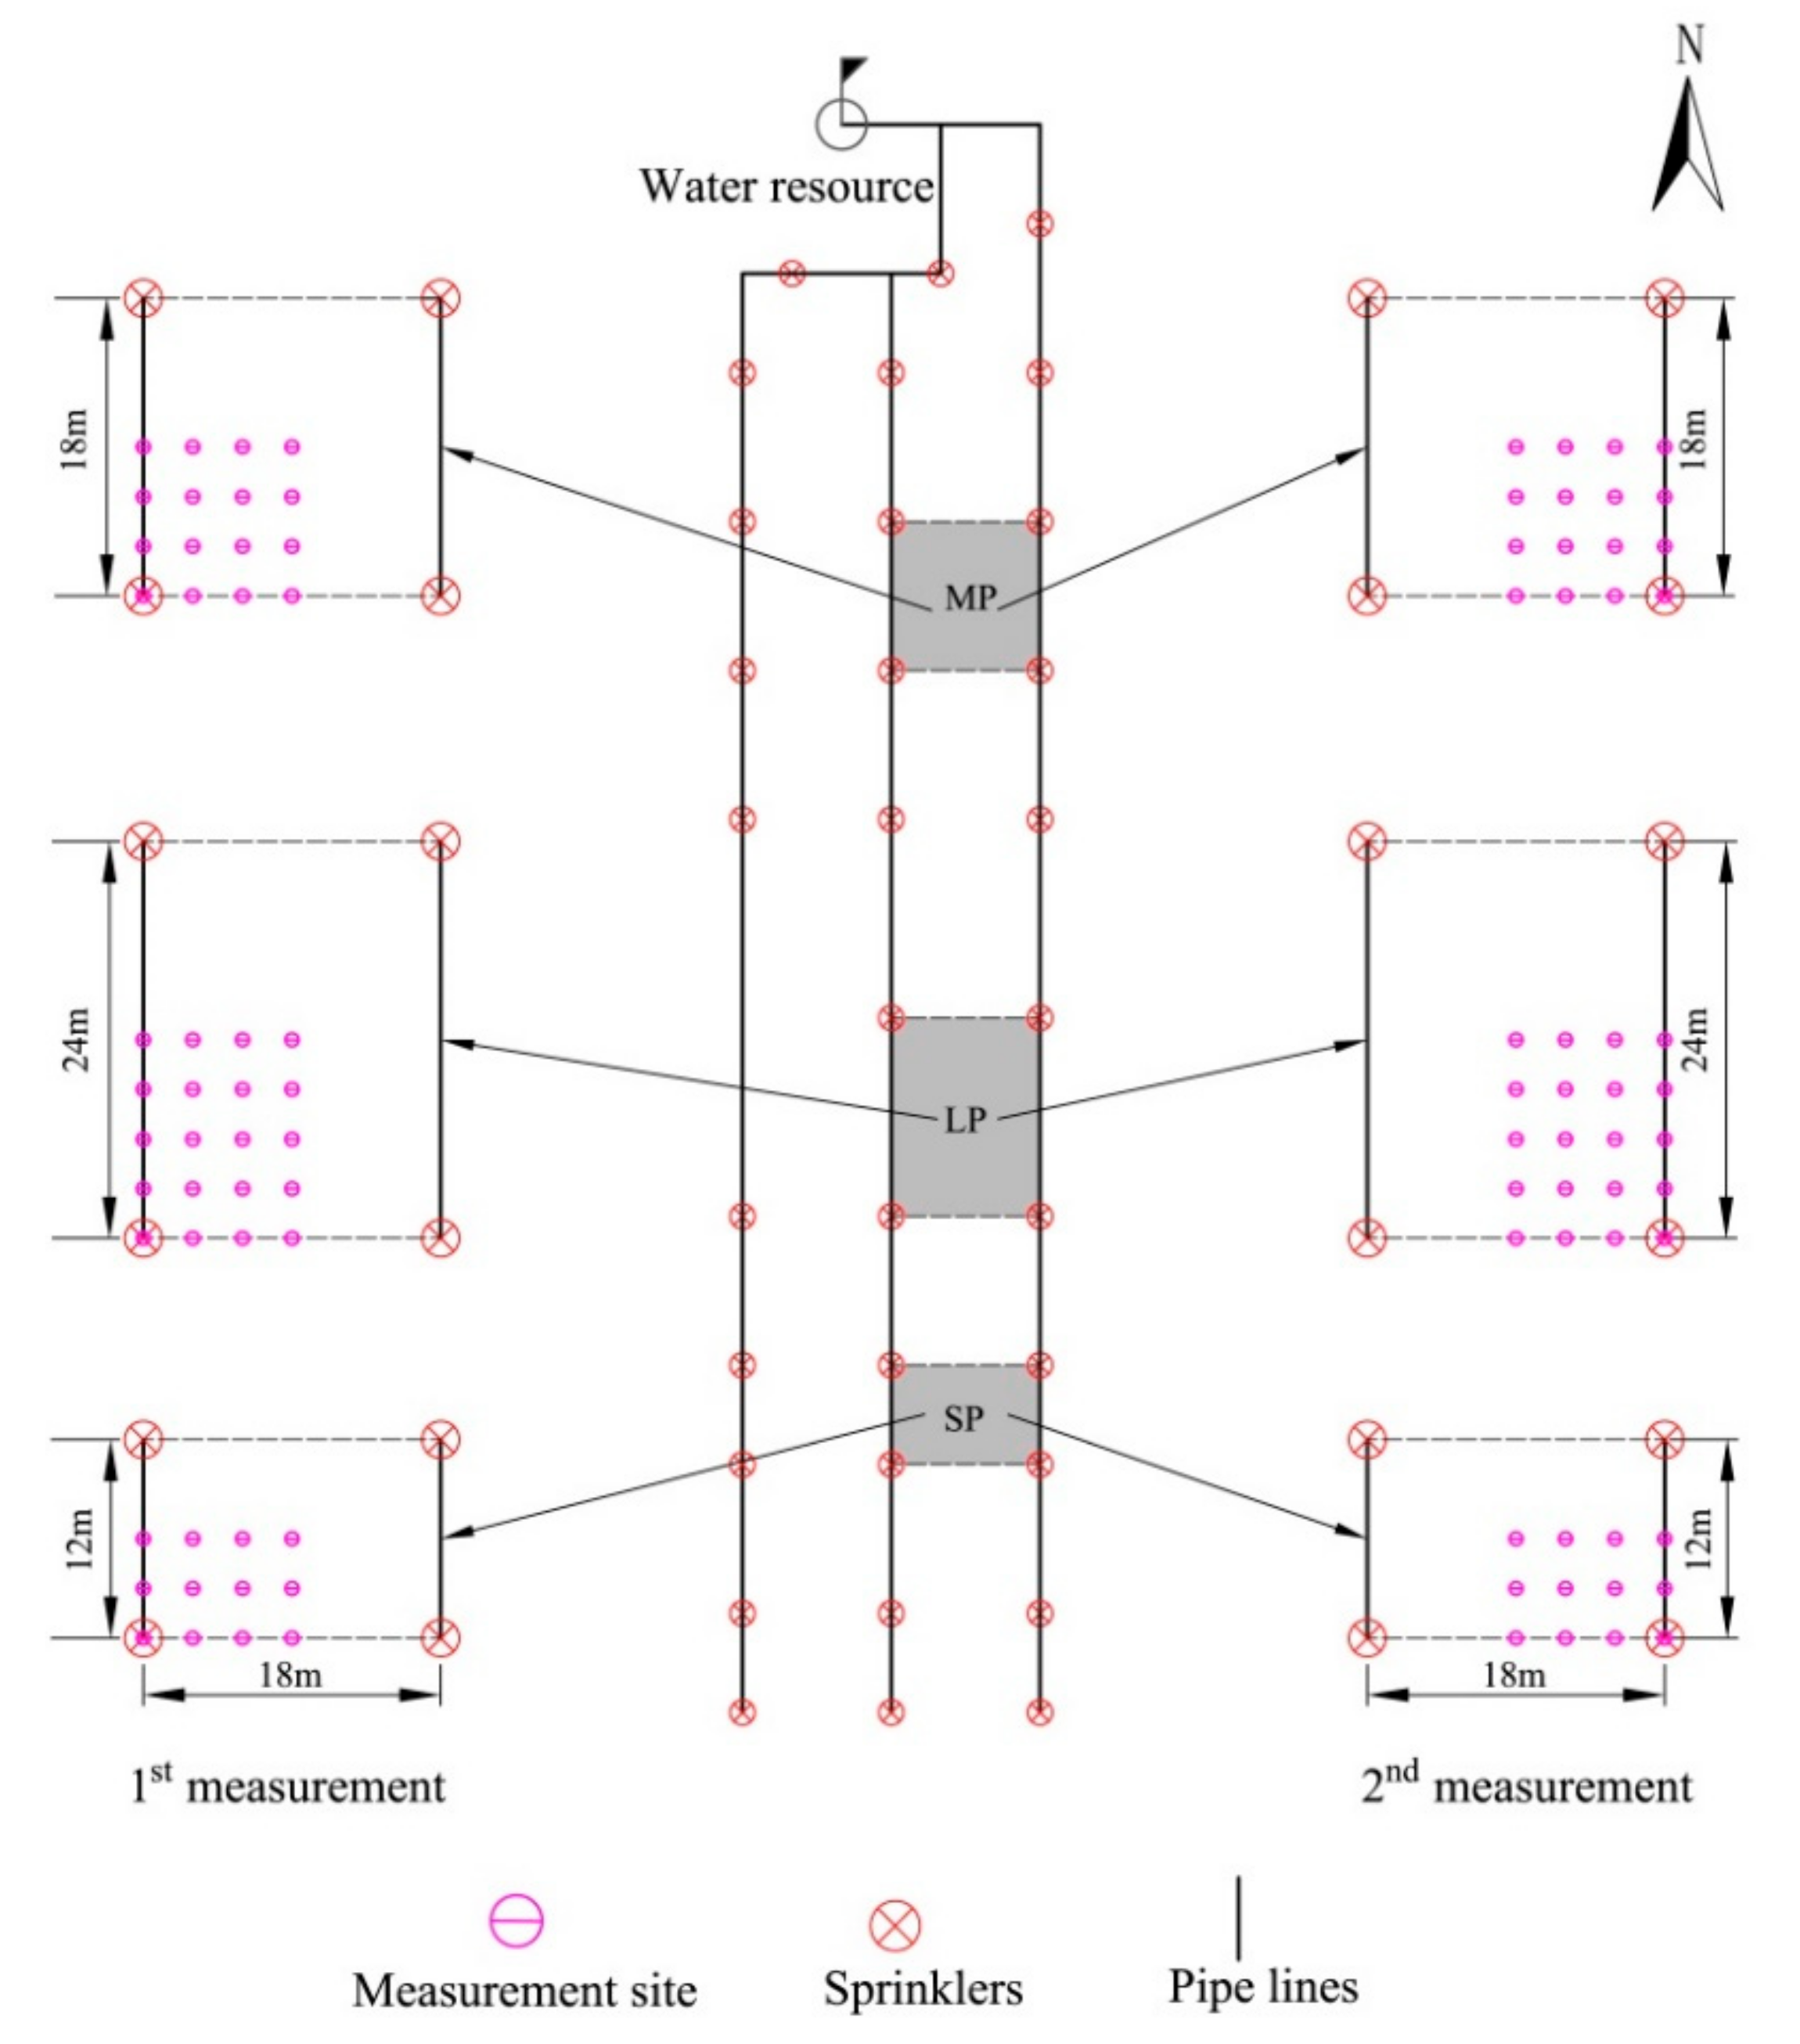
2.1. Field Description

The experiment was conducted at Dacaozhuang Seed Experimental Station, located in Ningjin County, Hebei Province in the North China Plain (NCP, 37°30′ N latitude, 114°56′ E longitude, 26 m altitude). The station has a typical temperate continental monsoon climate. The precipitation in this region averaged 450 mm, with 70% distributed from July to September. The winter wheat-summer maize double cropping system is the predominant planting pattern in this region. Winter wheat is mostly sown in October and harvested in mid-June. In the wheat season, the average temperature is 7.9 °C, the sunshine duration is 1632 h, and the precipitation is 130 mm. The Dacaozhuang region is a typical sprinkler irrigation zone. A total of 4000 ha of farmland has been irrigated with sprinkler irrigation systems since the 1970s. The main soil texture of the topsoil (0–60 cm) is silty loam, consisting of 11% clay, 63% silt, and 26% sand. The soil field capacity is 0.36 cm−3 cm−3, and the bulk density is 1.45 g cm−3 [26].

2.2. Irrigation System, Agronomic Practice and Climatic Condition

There were three system layouts based on the spacings between sprinklers; they were 12, 18 and 24 m and were correspondingly named SP, MP and LP, respectively (Figure 1). The spacing between laterals was 18 m for all three layouts. These three layouts resulted in three water distribution conditions. The sprinkler model used was PXS20-D (Tonghua Zhenyu Sprinkler Irrigation Equipment Factory, Zhenzhou, China), with a wetted radius of 18 m and a flow rate of 2.2 m3 h−1 under 0.25 MPa working pressure. Irrigation water was groundwater and pumped from a well with a static groundwater level of approximately 40 m. The irrigation water amount was measured with a flow meter (Model LXLC-100, Ningbo WaterMeter Co., LTD., Ningbo, China) deployed on the main pipe. The working pressure of the sprinkler system was regulated to approximately 0.25 MPa using a pressure regulator on the main pipe to maintain a uniform water flow during the sprinkler irrigation process.
A widely used winter wheat variety, Yingbo 700, with high yield potential and good anti-water stress trait, was adopted in this study. The winter wheat was sown on 20 October 2020. On 17 November 2020, an amount of 40 mm water was applied using a sprinkler system to improve the soil water condition to help wheat overwinter. The wheat was regreen in late February and elongated in late March. The maximum leaf area index (LAI) of 4–5 was reached after heading and anthesis stages (Zadok’s scale of 5 and 6) at the beginning of May. The first measurement was performed between May 6 and 8, during which the LAI was between 4.1 and 4.6 in the anthesis stage (Zadok’s scale of 6). The second measurement was performed between May 23 and 25 with LAI between 2.8 and 3.5 in the grain-filling stage (Zadok’s scale of 7). The detailed information on the sprinkler irrigation layout and the measurements for each time are listed in Table 1.
A total amount of nitrogen of 200 kg ha−1 was applied, in which 40 kg ha−1 was applied during soil preparation before sowing, and the remaining 160 kg ha−1 (using urea) was applied in the reviving, elongation and anthesis stages with the same amount each time using a sprinkler-fertigation system. The amounts of 60 kg ha−1 K2O and 90 kg ha−1 P2O5 (using a compounded fertilizer) were applied during soil preparation before sowing. Other field managements were performed by the farmers at the station following local practices, mainly including spraying herbicide on soil surface just after sowing to control weeds and spraying pesticide to control aphid from heading to grain-filling stage (i.e., Zadok’s scale from 5 and 7).
The field microclimate was measured at the experimental station with approximately 50 m away from the experimental field. The air temperature and humidity probe (model HMP45C, Vaisala Inc., Woburn, MA, USA) deployed at 2 m height was used to measure air temperature and relative humidity. The net radiation (Rn) was measured by a net radiometer (model NR-LITE, Kipp & Zonen, Delft, The Netherlands) deployed at 2 m height. The wind speed was measured with a 3-cup anemometer (model EC-9S, Jinzhou Sunshine Meteorological Instrument Corporation, Jinzhou, China) at 2 m height. All these sensors were connected to a data logger (model CR1000, Campbell Scientific, Inc., Logan, UT, USA) for data acquisition and storage. The sampling intervals were 10 s and 30-minus averages were stored and used in data processing.

2.3. Water Distribution Measurement

In situ measurement of water distribution will destroy wheat plants. Therefore, each irrigation plot was divided into four same-size subplots, separated by the two axle lines. One subplot was used once for the measurement of canopy interception (CI), stemflow (SF) and throughfall (TF). The detailed layout information for each item measurement is shown in Figure 1.

2.3.1. Water above the Wheat Canopy

The water above the wheat canopy was measured using round stainless cans 20 cm in diameter and 12 cm in height. These cans were placed on 1-m height stands, and the spacings between two cans were 3 m. In the three sprinkler systems SP (12 m between sprinklers and 18 m between pipe laterals), MP (18 m between sprinklers and 18 m between pipe laterals) and LP (24 m between sprinklers and 18 m between pipe laterals), the numbers of cans used were 12, 16 and 20, respectively. After sprinkler irrigation, the water in the cans was immediately measured using a volumetric flask.

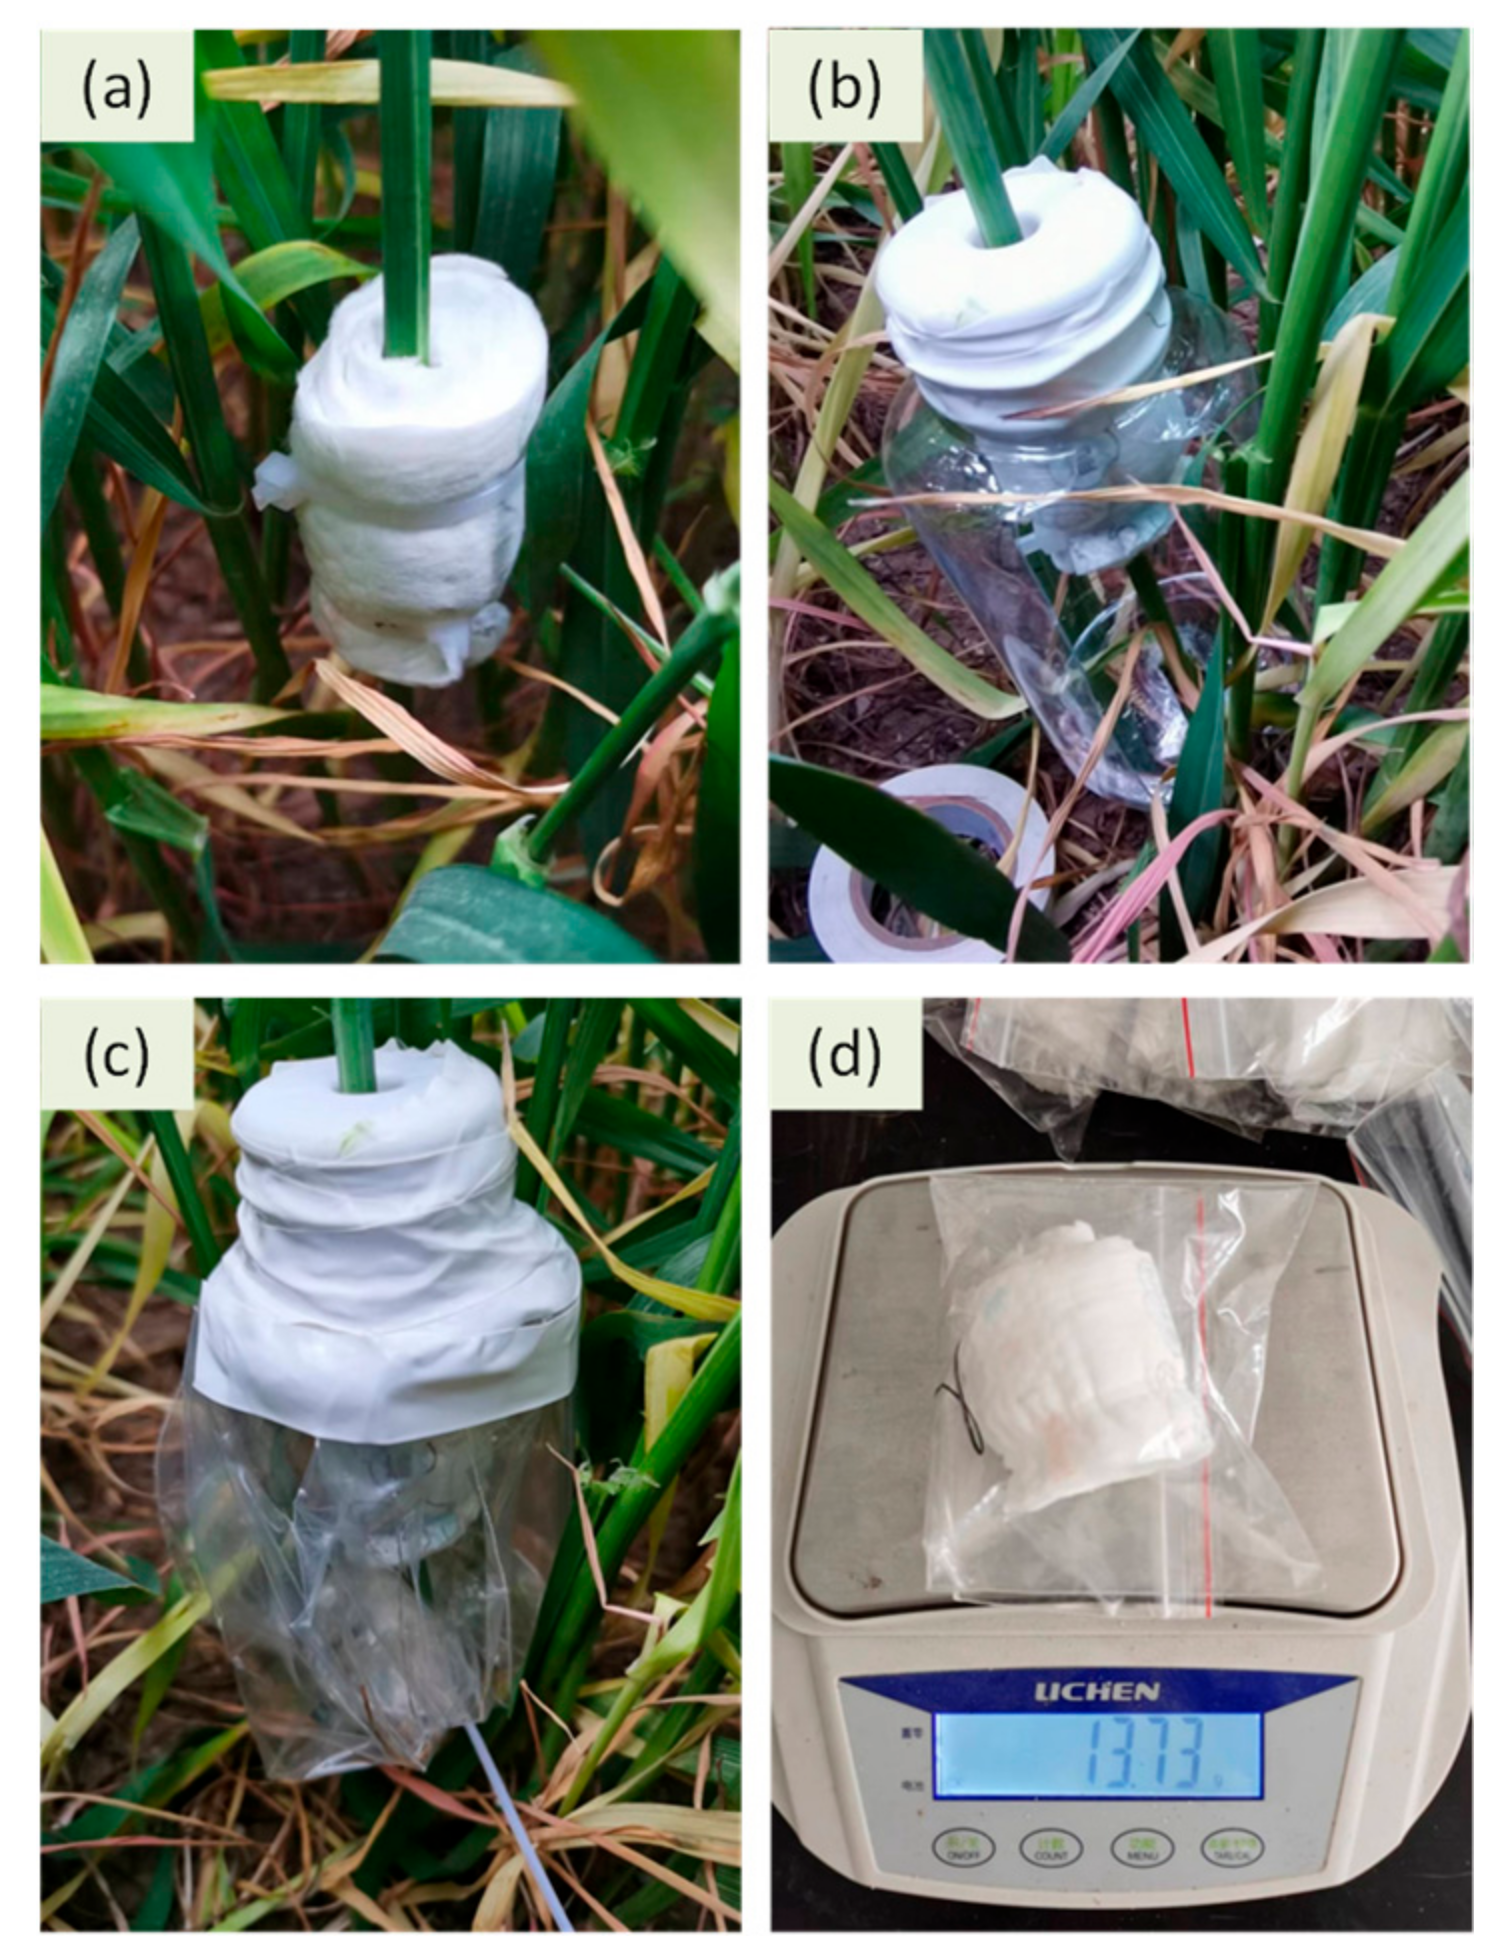
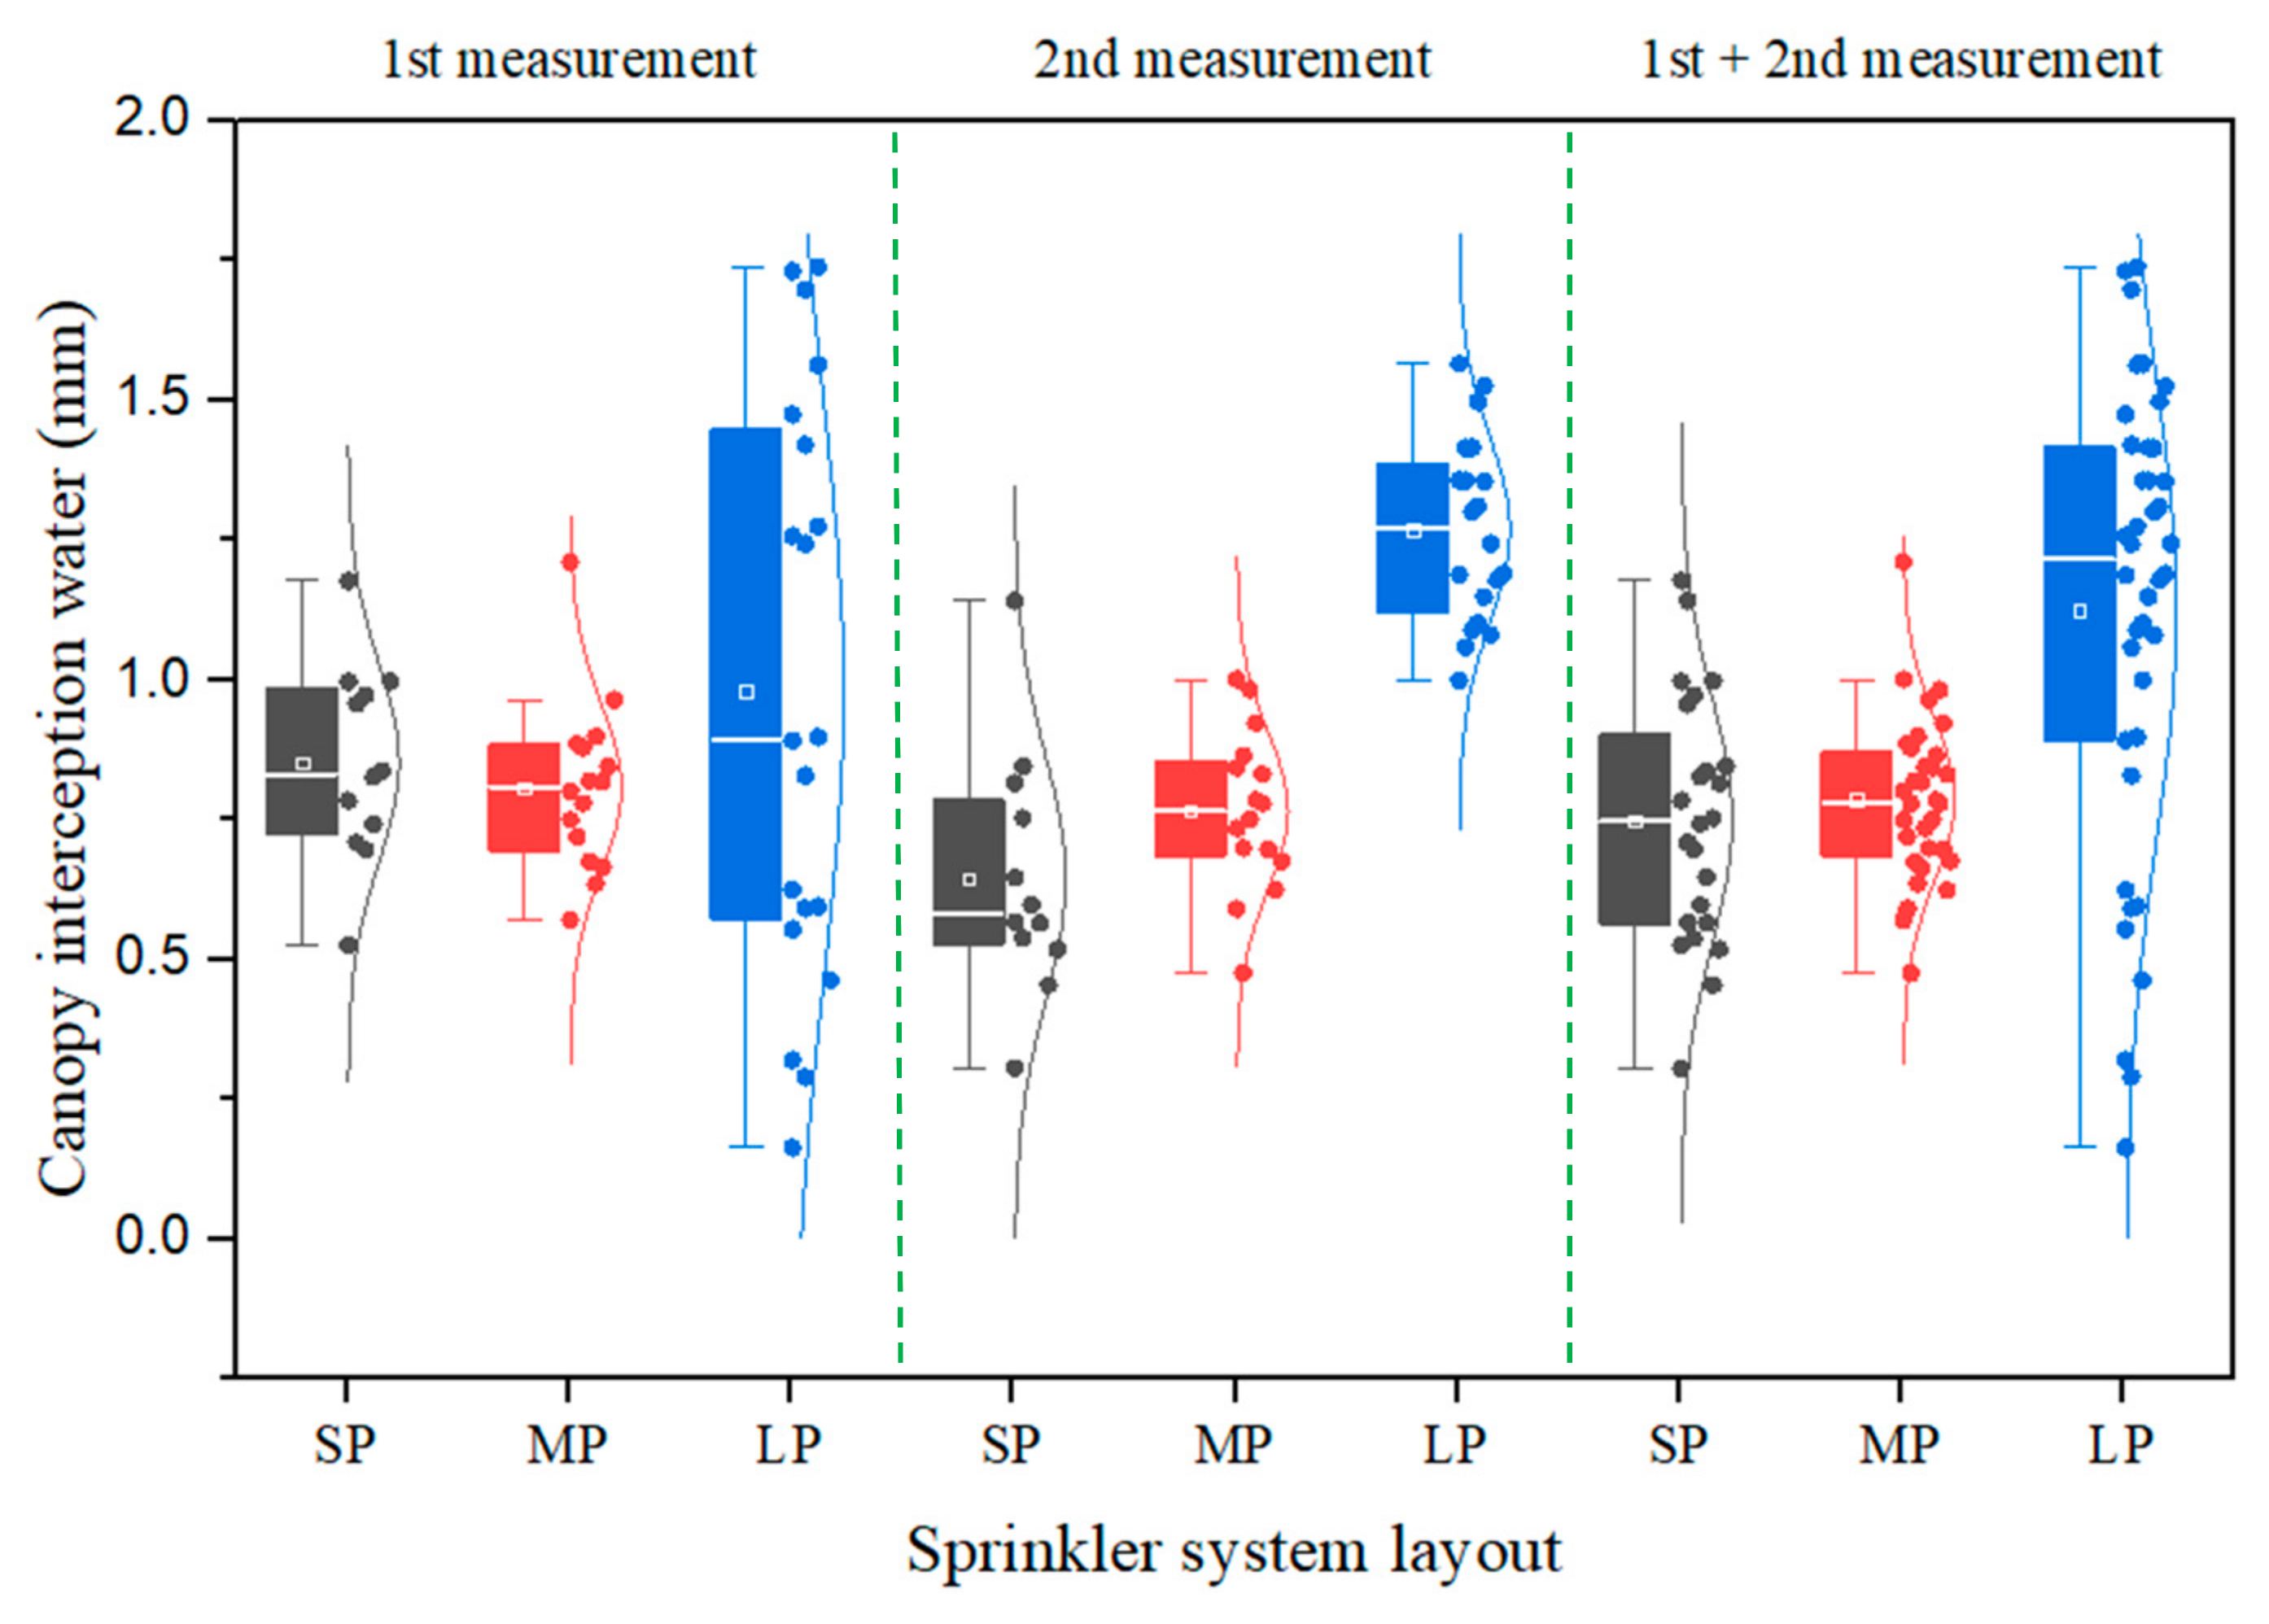
2.3.2. Canopy Interception Water

Canopy interception water was determined as the difference between the canopy masses before and after sprinkler irrigation. The measurement process was: (1) determining water content of wheat canopy before irrigation, first, approximately 20 wheat stems were cut at the stem base above ground surface, then the total fresh and oven-dried masses were measured, last, the water content of the fresh plant was calculated as θ = f r e s h   m a s s d r y   m a s s d r y   m a s s ; (2) in each selected site, plants in the 15-cm length row were kept, and other plants in the 20-cm length right and left side of the selected samples were cut to reduce their effects on the plant samples’ measurement; (3) after sprinkler irrigation, the plant samples were immediately covered by large plastic bags (0.6 m in width and 0.8 m in height) from up down and then cut at the stem base, when all plants were put into the bags, the bags were sealed tightly, finally the total mass of the wet stems (W1, g) were measured by a 0.01-g solution balance; (4) the number (n) of the sampled plants was recorded, then all leaves were cut and all leaf area (LA, cm2) was measured using LI-3000C portable leaf area meter (LI-COR, Inc., Lincoln, NE, USA), and last, all sampled plants were dried and the dried mass were measured as W2; (5) given the water content of plant stem being the same before and after sprinkler irrigation, the total water interception (W3, g) of the sampled plants was calculated by the equation W 3 = W 1 1 + θ W 2 ; (6) last, theCI (mm) in the field after a sprinkler irrigation was calculated as C I = 10 3 × W 3 n N , where N is the plant density in plants m−2. The LAI at each measurement was calculated as L A I = 10 4 × L A n N , where LA is the total active leaf area of the sampled plants in cm2.

2.3.3. Stemflow Water

Stemflow water was directly measured at stems using high water-adsorption material (HWAM). The measurement process was as follows: (1) preparing the HWAM (i.e., baby diaper in this study) and measuring its mass (m1, g); (2) selecting normal-growth plants and wrapping the HWAM around the stem base with the down side tied tightly to prevent water flowing out; (3) covering the wrapped HWAM with a plastic sheet to prevent outside water from dropping into the inside (Figure 2); (4) after sprinkler irrigation, carefully removing the wrapped HWAM and putting it into plastic bags and sealing the bags to prevent the adsorbed water loss from evaporation; and (5) measuring the masses (m2, g) of HWAM with adsorbed water, and the SF (mm) was calculated by considering the plant density (N, plants m−2) using the equation S F = 10 3 × m 2 m 1 × N .

2.3.4. Throughfall Water

The spacing between wheat rows was 15 cm. Then, custom-ordered square boxes were used, which had dimensions of 12 cm in side length and 10 cm depth. This size was large enough to collect the penetrated water through the canopy on the ground. The boxes were placed in the interrow with a spacing of 3 m. After sprinkler irrigation, the water amount (V, ml) in each box was measured using a volumetric flask, and the TF water depth (TF, mm) was calculated by considering the box surface of 144 cm2 using the equation: TF = V 14.4 . Under the layouts of SP, MP and LP, the site numbers for TF measurement were 12, 16 and 20, respectively.

2.4. Data Processing

The distribution coefficients of water above and under the canopy were evaluated using the Christian uniformity coefficient (CU) based on the Chinese standard “Technical code for sprinkler irrigation” [27]:
C U = 1 Δ h h
Δ h = 1 n i 1 n h i h
where h is the mean water depth over all measurements, mm; Δ h is the absolute difference between the measured water depth at the ith site and the mean water depth h, mm; and n is the total water samples, which are 12, 16 and 20 in the SP, MP and LP layouts, respectively.
To calculate the CU on the crop canopy, the water depth at each site was the measured value. For the CU calculation under the canopy, the water depth at each site was the total water of the measured TF at each site plus the SF measured in the same site.
The differences in mean CI, SF and TF among the three system layouts were analyzed based on “Analysis of Variance” (ANOVA) and tested at the 0.05 statistical level. The Pearson’s correlations coefficient between factors of CI, SF and TF and variables of plant (LAI) and climatic condition (wind) were calculated. Both statistical analysis and the correlations coefficient calculation were done using SPSS 20.0 (IBM, New York, NY, USA). All data and figures were prepared using Microsoft Excel 2013 (Microsoft Co., Seattle, WA, USA) and Origin 2022b (OriginLab Co., Northampton, MA, USA).

3. Results

The basic experimental information, including sprinkler irrigation layouts, irrigation day and period, irrigation intensity, climatic condition and LAI in each measurement, is listed in Table 1. The measured SF, CI and TF and their percentages to the water above the canopy, and the water distribution uniformity above canopy and under canopy are listed in Table 2.
The measured water depth above the wheat canopy ranged from 6.99 to 31.08 mm, depending on the measurement site, irrigation time, and irrigation system. The irrigation intensity ranged from 6.2 to 10.2 mm h−1, and their differences were significant (p < 0.05) among the three sprinkler system layouts. The CU above the canopy ranged from 0.65 to 0.92, with higher CU in the SP layout and lower CU in the MP layout (Table 2). The CU under the canopy ranges from 0.65 to 0.80. In the four events of the total six, CU values under the canopy were 0.02–0.12 lower than those above the canopy.
The canopy interception over the three layouts was between 0.65 and 1.27 mm, with a mean value of 0.89 mm. The CI values in approximately 85% of the measurements were distributed from 0.5 to 1.5 mm (Figure 3). In the first measurement, all CIs among the three layouts were not significantly (p > 0.05) different. In the second measurement, the CIs in the SP and MP layouts were not significantly (p > 0.05) different; however, both were significantly (p < 0.05) lower than that in the LP layout.
The measured SF ranged from 2.5 to 8.0 mm depending on the irrigation water above the canopy. Figure 4 shows that the SF percentage, the rate of SF to the irrigation water above the canopy, was mainly distributed in the range from 2% to 55%. Mostly, the SF percentages were not significantly (p > 0.05) different among the three layouts. The SF was closely related to the irrigation water above the canopy, with a coefficient of 0.83–0.85, and their relationship can be linearly fitted (Figure 5). Based on the line regression shown in Figure 5, the SF accounted for approximately 24–27% of the water depth above the canopy.
The measured TF ranged from 4.4 to 10.6 mm and depended on the irrigation water above the canopy. Approximately 80% of the TF percentage, the TF water depth to the water depth above the canopy, was distributed within the range from 45% to 80% (Figure 6). All TF percentages were not significantly (p > 0.05) different among the three system layouts and between the two measurements. The TF was closely related to the irrigation water above the canopy, with a coefficient of 0.97–0.98, and their relationship can be linearly fitted (Figure 7). Based on the line regression in Figure 7, the TF accounted for approximately 56–61% of the water depth above the canopy.
When the water depths of CI, SF and TF were summed up, its total was 0.87–1.1 with a mean of 0.96 times the water depth above the canopy.

4. Discussion

4.1. Canopy Interception Water and Influencing Factors

The measured CI from 0.65 to 1.27 mm was not closely related the irrigation water above the canopy which was from 3 to 20 mm. The Pearson’s correlations coefficient between CI and water amount above canopy was 0.10 and their relationship was not significant (p > 0.05). This indicts that irrigation amount did not greatly influence the CI (Supplementary Figure S1) when CI reaches it’s maximum value. The CI value of 0.65–1.27 mm was close to the range of 0.3–1.0 mm for winter wheat measured by the water wiping method and microwave method [9,10,24], and 0.3–1.4 mm for maize and alfalfa crops [8,28,29]. The similar CI values obtained from different methods show that the water balance of plants between before and after sprinkler irrigation can be used to measure the CI in wheat plants. Most CIs will lost through evaporation and finally reduce irrigation water use efficiency. This CI amount should be considered by farmers for calculating irrigation amount, especially when irrigation amount is small.
Canopy interception is directly related to the canopy surface, and a higher leaf area generally results in a greater CI [8,9]. We found that the CI was linearly related to LAI (Figure 8). The determination coefficient (R2) of the regression line between CI and LAI is 0.78, indicating a much more closely positive relationship. Similarly, the linear relationship between CI and LAI has been reported in other studies [8,9]. With this positively relationship, the CI will be increase with wheat growth because LAI generally increase with the plant growth. The great amount of pubescence/trichomes distributed in wheat leaves could enhance the CI compared to those with wax or without trichomes leaves [30,31].
Leaves generally vibrate greatly under strong wind speed, and then the water on the leaf can easily flow toward the stem through the leaf tunnel or directly drop down, finally resulting in low CI [9]. We found that CI was negatively related to wind speed, although the linear regression was weak (R2 = 0.23). Furthermore, we found that CI was not directly related to vapor pressure deficit with Pearson’s correlations coefficient of 0.10, although a higher vapor pressure deficit could cause high evaporation potential and reduce CI.

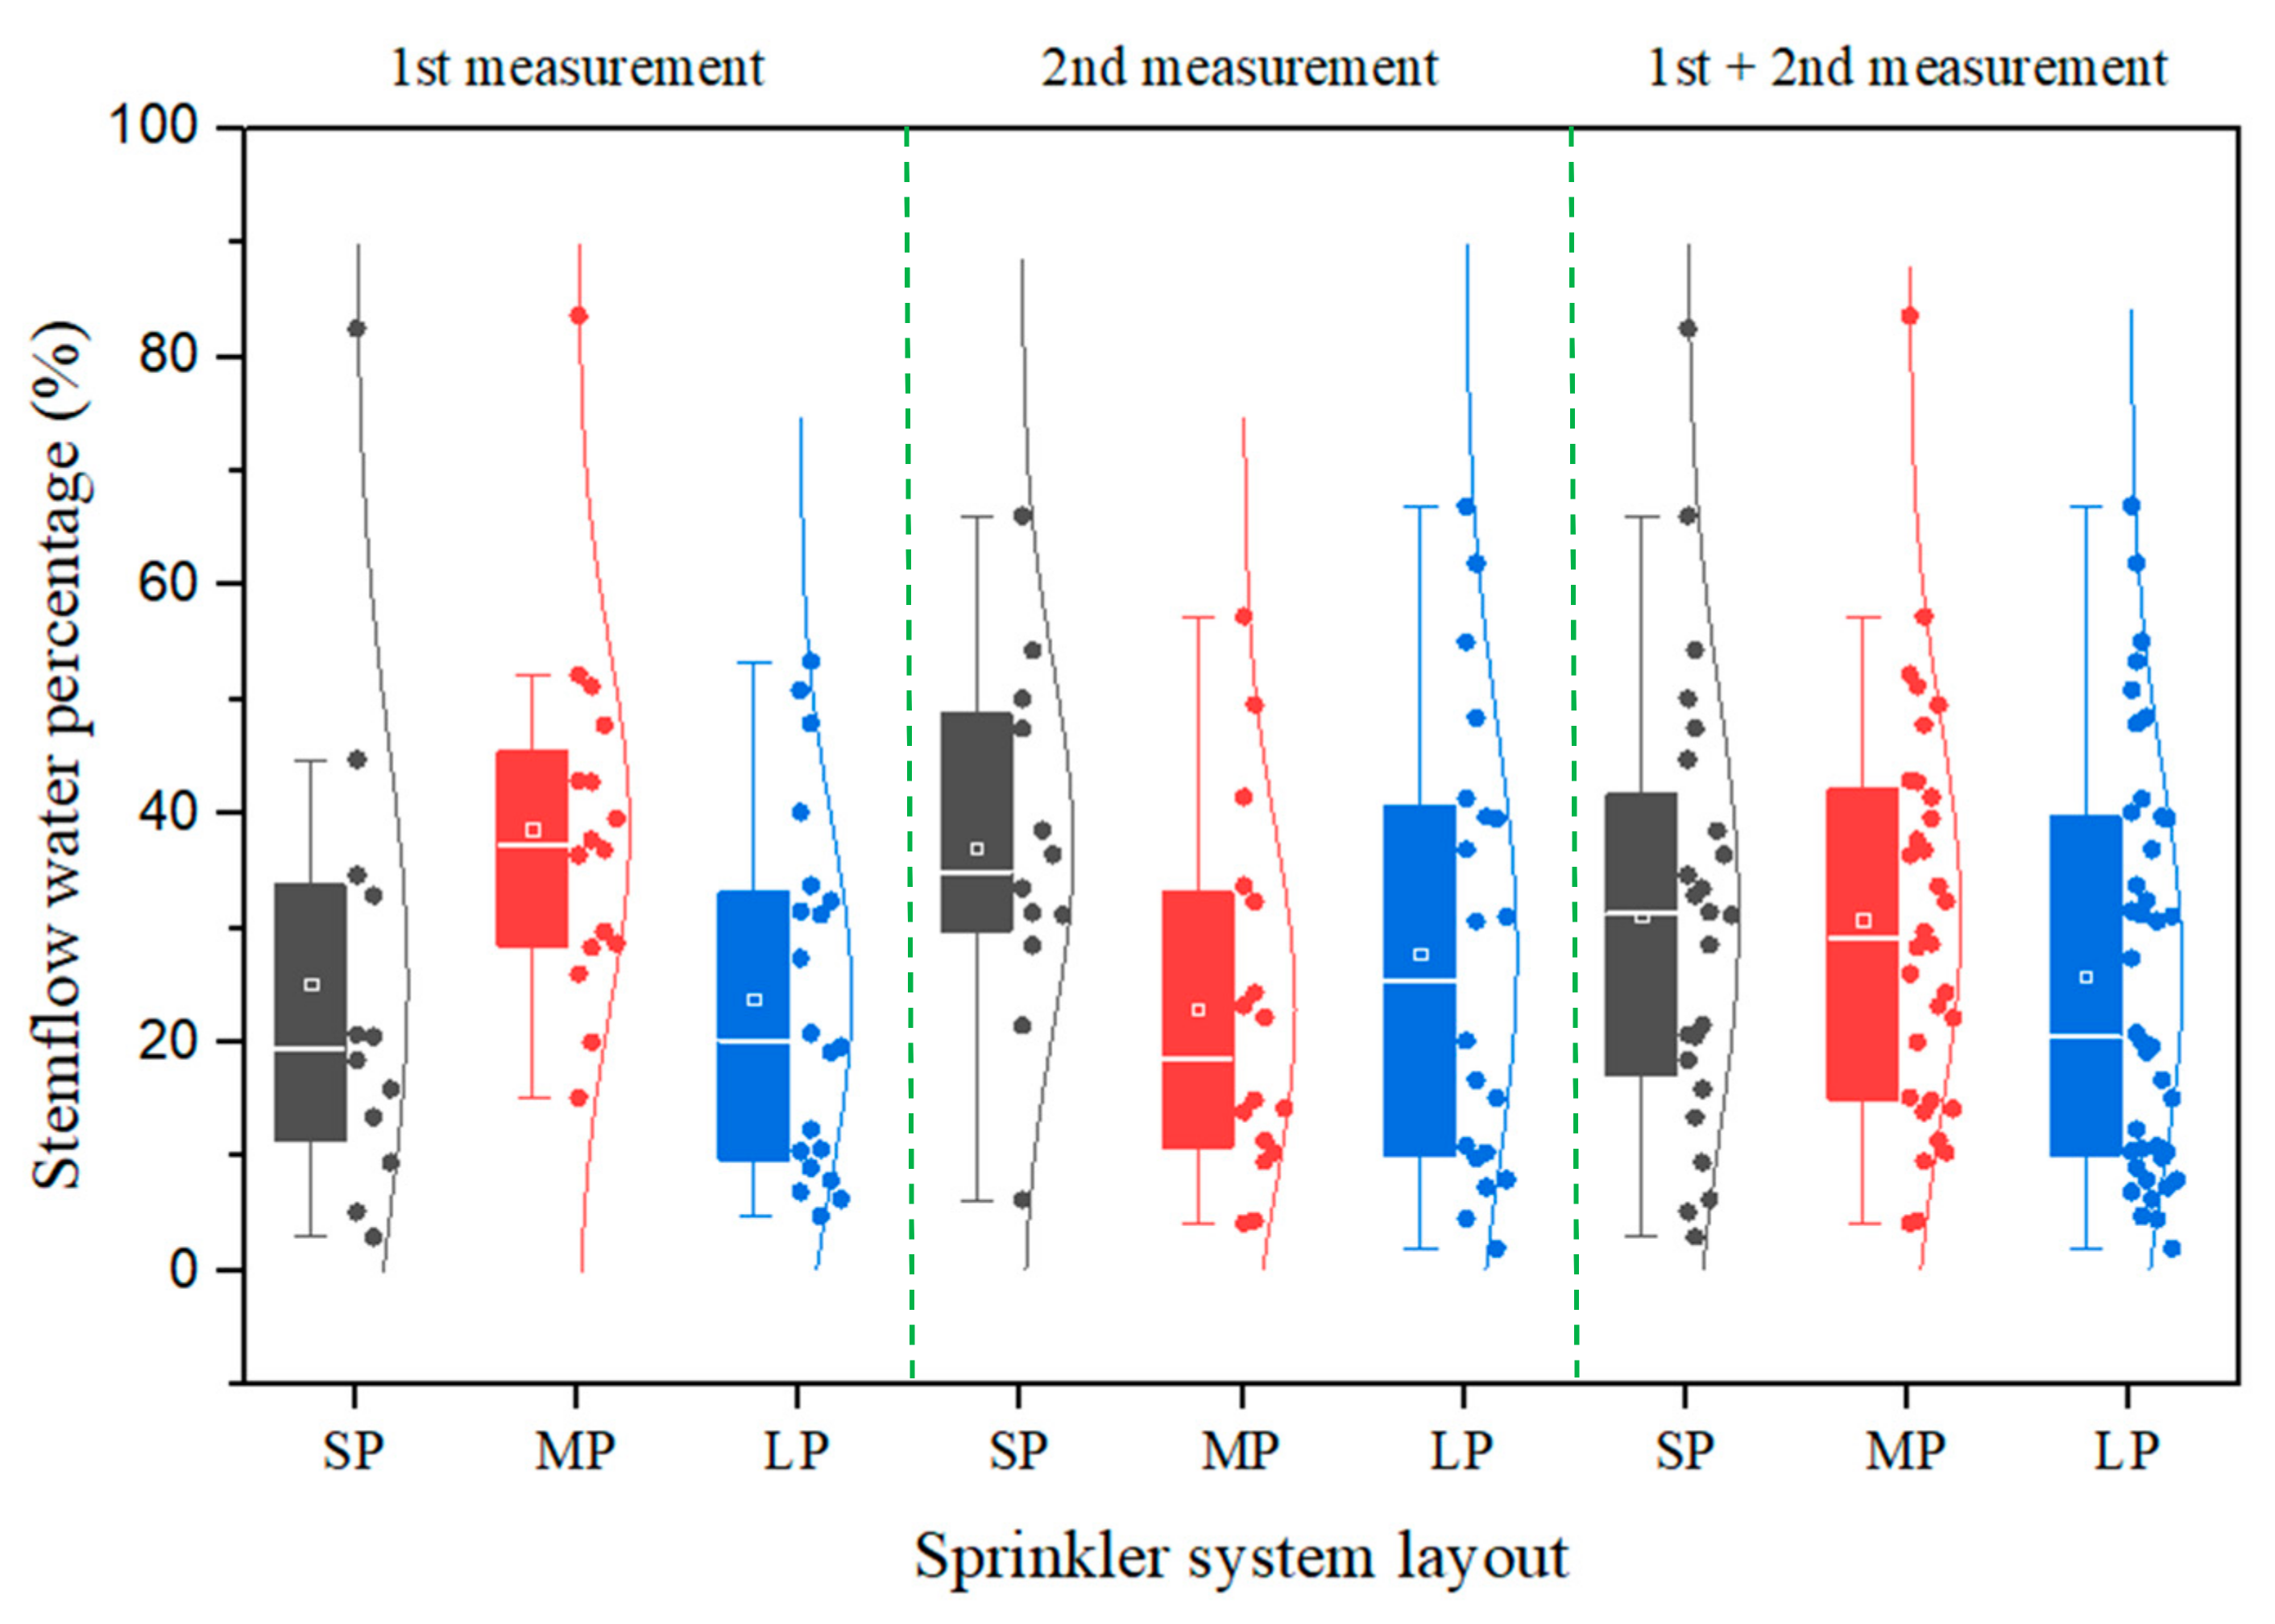
4.2. Stemflow Water and Related Factors

Stem flow is significantly determined by the leaf structure and leaf area [20] because sprinklering or rainfall water is first intercepted by canopy leaves, then concentrates and flows to the stem along the leaf tunnel, and finally flows down to the ground following the crop stem. Compared to the spare leaves, the crops with tunnel leaves, such as wheat, maize and banana, could collect much water and finally result in a high SF amount [32]. For maize crops, Liu, et al. [23] found SF amounts ranged from 10 to 70 mm when the total rainfall amounts ranged from 30 to 135 mm, with a mean SF rate of 0.42. Average SF rates of 0.43–0.46 in maize fields were reported by Lamm and Manges [7]. Lamm and Manges [7] further reported that SF was the predominant flow path for sprinkler irrigation water after maize tasseling, which accounted for 53% of the irrigation water. This great SF rate for the crops with tunnel leaves could provide precious water for crop growth and survive in light rainfall condition. However for spraying pesticide and herbicide, the great amount of SF with high concentrated solution could harmful for the tunnel-leaves crops. With sparse leaves in forest and orchard trees, the SF is 2–5%, which is much smaller than that in maize plants [33,34]. In this study, the percentage of stem flow to the sprinkler water above the canopy ranged from 22% to 37% with a mean value of 29% (Table 2). This value is 10–15% lower than those reported for maize crops, mainly because of the smaller-size leaves. Both SF rates for wheat and maize are higher than those (2–5%) reported in forest and shrubs, mainly because of the dispersedly distributed leaves and no tunnel in leaves that deliver the water collected to the main stem for forest trees.
These measured SF percentages are weakly related to LAI and wind speed, with correlation coefficients of 0.47 and 0.45, respectively (Supplementary Figure S2). Based on the results of Liu, et al. [23], a higher LAI could intercept more water and then greater SF. Although the LAI decreased from a mean value of 4.4 in the first measurement to 3.2 in the second measurement, the SF percentages increased from 27.3% to 30.8%. However, the differences in the SF percentage between the two measurements were not significant (p > 0.05). This indicates that LAI is not a good indicator to evaluate SF during the later wheat growth period. In the later growth period, this dying leaf is not considered in calculating LAI; however, it can intercept water and produce stem flow and last, results in small and no significant difference in SF in the wheat anthesis and grain-filling period.
Based on the sprinkler designed standard of China [27], sprinklers are allowed to operate when the wind speed is lower than 5.4 m s−1. This wind condition requirement can maintain designed water distribution uniformity and reduce water droplet evaporation and drifting out of the sprinkler irrigated field [35]. The measured stemflow rate in this study was weakly related to wind speed because of the low wind condition (0.4–2.8 m s−1) during experiment (Table 1).

4.3. Throughfall Water and Related Factors

Throughfall water is the most important water because it directly reaches the soil layer. The measured TF was linearly and positively related to the water above the canopy (Figure 7). The percentage of TF to water above the canopy ranged from 56% to 65% with a mean value of 60% (Table 2). We found that there were no significant (p > 0.05) differences in the TF percentages between the three sprinkler layouts among the two measurements. This indicates that when the wheat canopy is fully growing, the TF percentage will be stable and is approximately 60% of the irrigation water on the canopy. Similarly, Li and Rao [25] reported that the TF percentage was approximately 60% and that the total SF and CI were 40% of the water above the wheat canopy under sprinkler irrigation. And Butler and Huband [16] reported that the TF water after wheat tillering was approximately 60% of the irrigation or precipitation amount above the canopy. In maize fields, the TF accounted for 40–80% of the irrigation water amount [7,23,29], which is close to the result in this study after considering that both are monocots with similar canopy structures. For wheat crops with small spacing between rows (15–20 cm), the 60% irrigation water as SF could directly infiltrate into root zone and enhance wheat growth. However for maize crop, the spacing between rows mostly is between 50–80 cm. The 60% irrigation water as TF distributing in wide row could result in large soil evaporation loss. In forests and shrubs, the TF accounted for 70–96% of the incident rainfall amount during the leaf period [15,18,33,36,37]. The higher TF percentage in forests could be mainly due to their spare leaves. In this case, the water intercepted by leaves is difficult to transfer to the stem but easily drops down, finally increasing the portion of throughfall [36].
The Pearson coefficients of TF percentage to wind speed and LAI were 0.53 and 0.67, respectively (Supplementary Figure S3). However, neither relationship was significant (p > 0.05). The measurements were performed when the canopy was fully developed and finally resulted in a smaller TF difference. This result is similar to the stemflow performance among the three layouts and the two measurements (Table 2).
Based on the determination coefficients of the fitted lines and the Pearson coefficients of SF and TF to the irrigation water above the canopy (Figure 5 and Figure 7), TF was more dependent on the water above the canopy compared to the SF. The reason could be that irrigation water penetrates the crop canopy and then becomes the throughfall water. Therefore, both waters are directly related. The SF depends on the water-collection area and the potential of transferring the collected water to the crop stem, which could be greatly influenced by the leaf-stem angle, leaf area and leaf structure [15,20,36]. Therefore, all these factors influence the stemflow amount and ultimately reduce the relationship between stemflow and the water above the canopy.

4.4. Water Distribution Uniformity above and under the Canopy

The measured CU of the water above the canopy was higher than those under the canopy in four events out of the total six (Table 2). For the SP layout, the CU above the canopy was 0.11–0.12 higher than that under the canopy in both measurements. However, for the MP and LP layouts, the CUs above the canopy were 0.03–0.08 lower than those under the canopy in the first measurement and 0.04–0.06 higher in the second measurement. Therefore, it may be concluded that a dense canopy, such as a wheat canopy, may decrease the water distribution uniformity when the water distribution above the canopy is much higher (~>0.85) [38]. However, it is difficult to estimate how the canopy influences the water distribution under a canopy when CU is smaller than 0.8, indicating a much more complicated effect of the crop canopy on the water distribution. Li and Rao [25] reported that the CU below the wheat canopy under sprinkler irrigation was greater than that above canopy when the above CU was less than 0.8. And Ayars, et al. [39] investigated the CU above and below a cotton canopy with sprinkler irrigation systems and reported that the CU below the canopy was higher than that above the canopy. However, they noted that this conclusion may not be similar for monocots that partition more of the applied water to stemflow. Canopy structure, leaf distribution and size, plant height, spacings between row and plants, angle of trajectory of water and droplets applied, angle between leaves and stems, and sprinkler system should be considered to fully evaluate the CU changes above and below the crop canopy [25,38,39].

5. Conclusions

In this study, the water distribution of sprinkler irrigation above and under canopy was investigated in a wheat field when the wheat canopy was fully developed. The factors influencing water distribution were analyzed. The main results are as the followings:
(1)
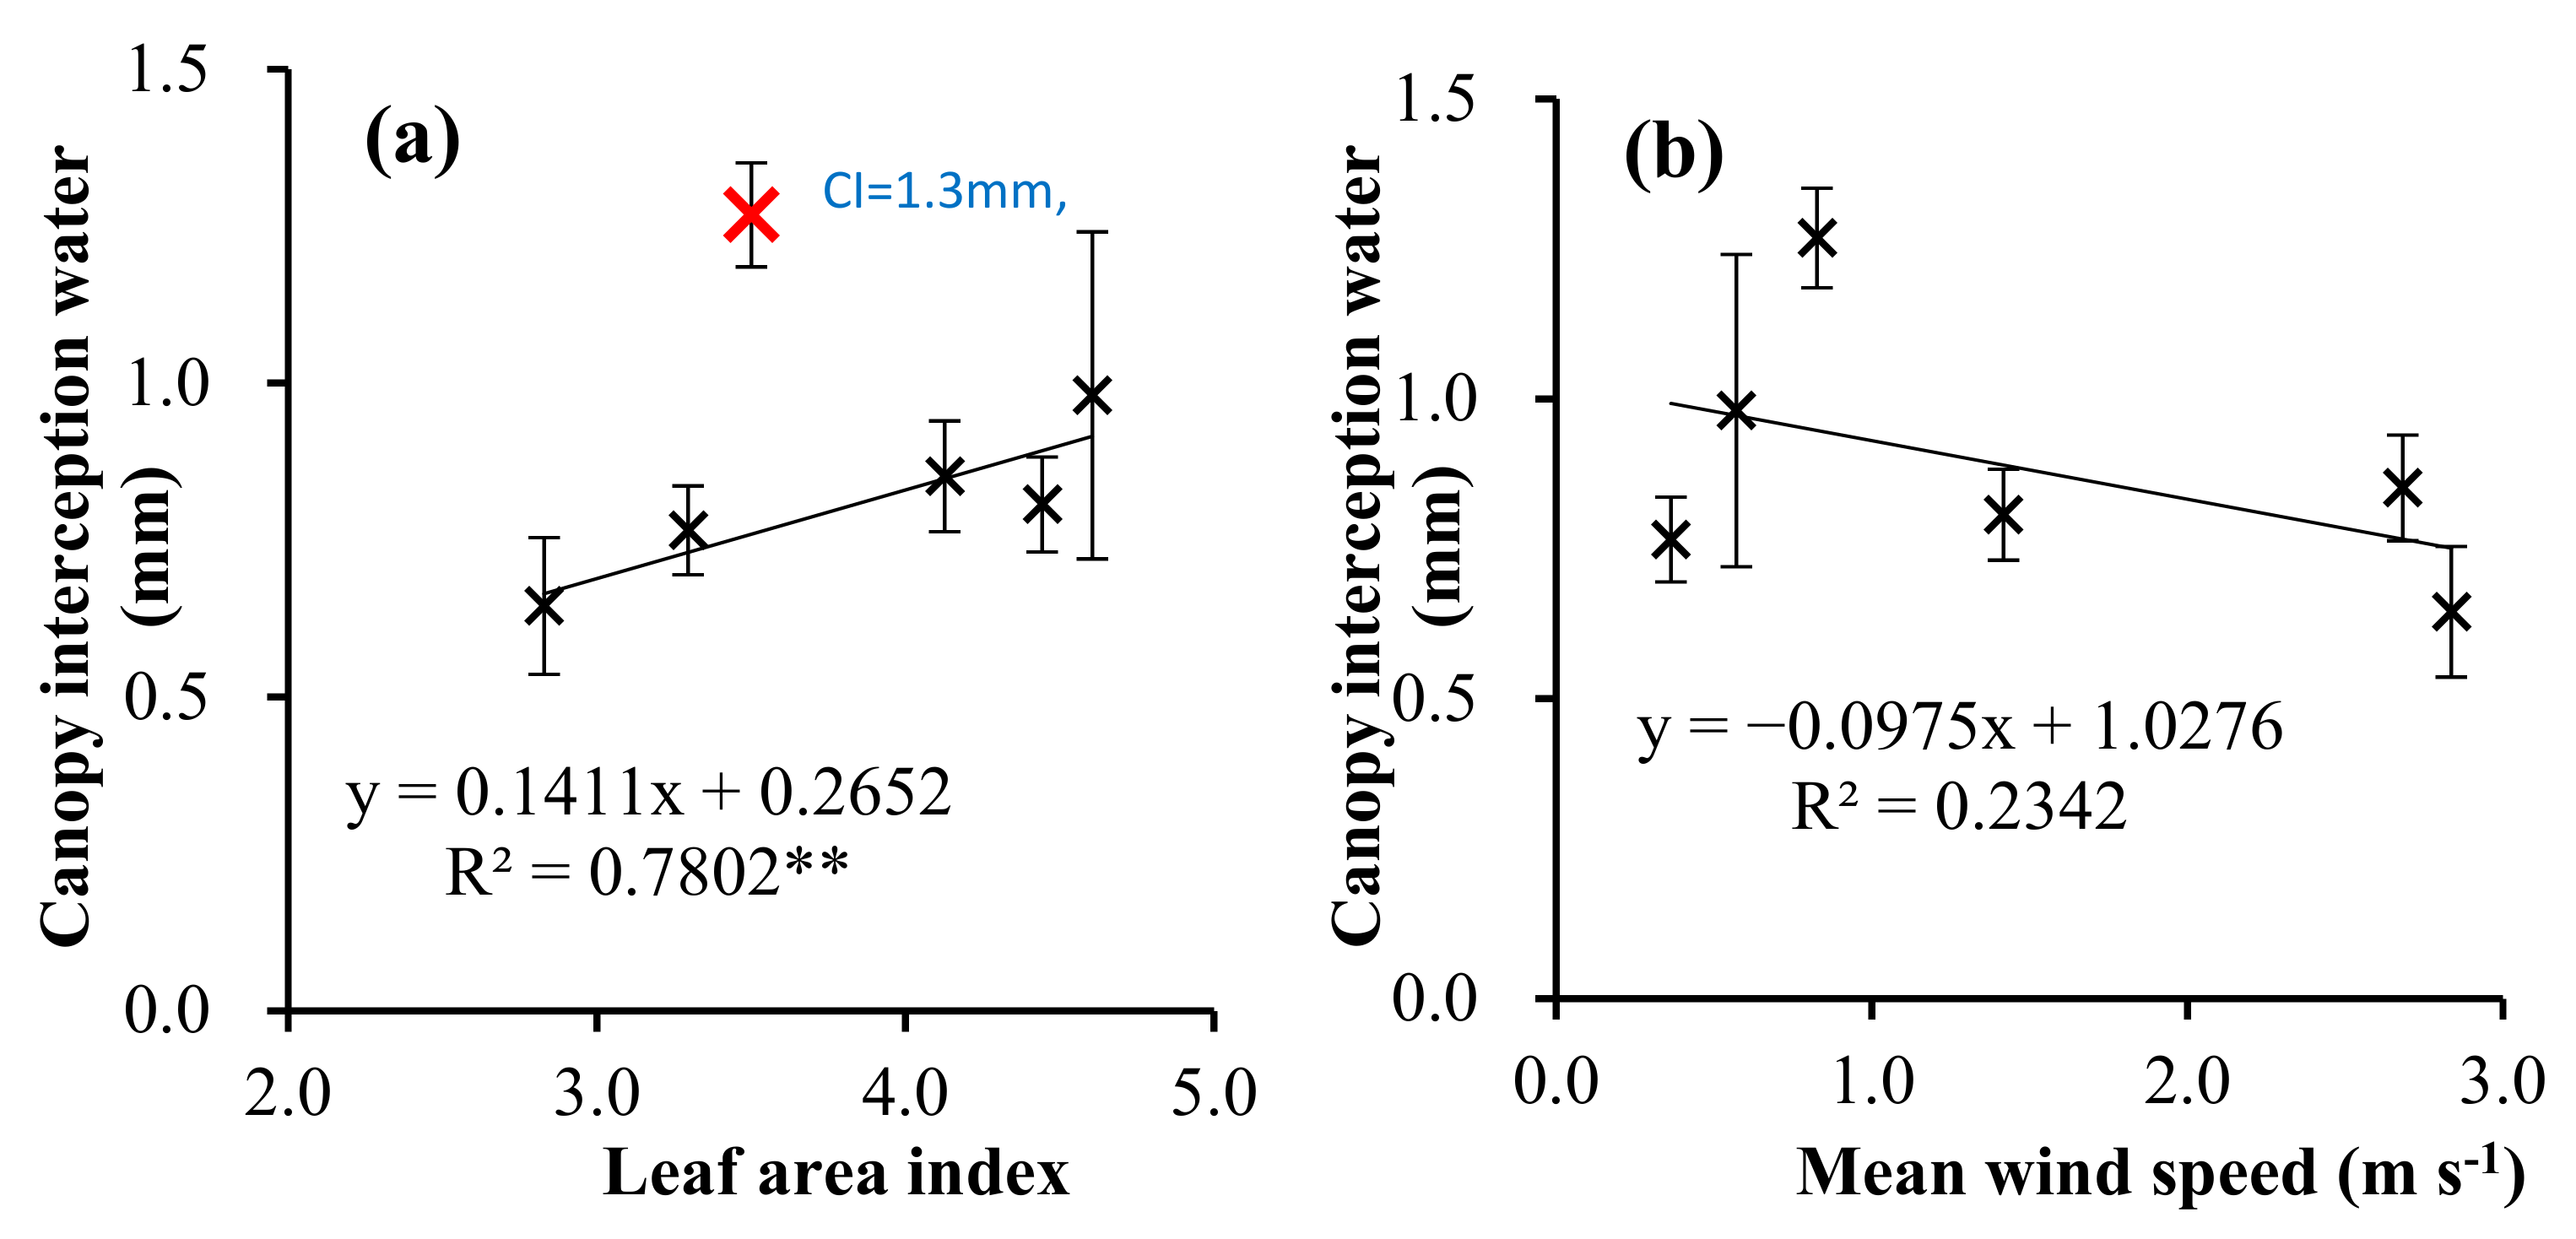
The measured canopy interception mainly ranged from 0.6 to 1.3 mm with a mean of 0.9 mm in the wheat anthesis and grain-filling stages. The canopy interception was positively related to the leaf area index and negatively related to wind speed.
(2)
The stemflow water was positively and linearly related to the water above the canopy. The stemflow water percentage ranged from 22% to 37% with a mean of approximately 30%.
(3)
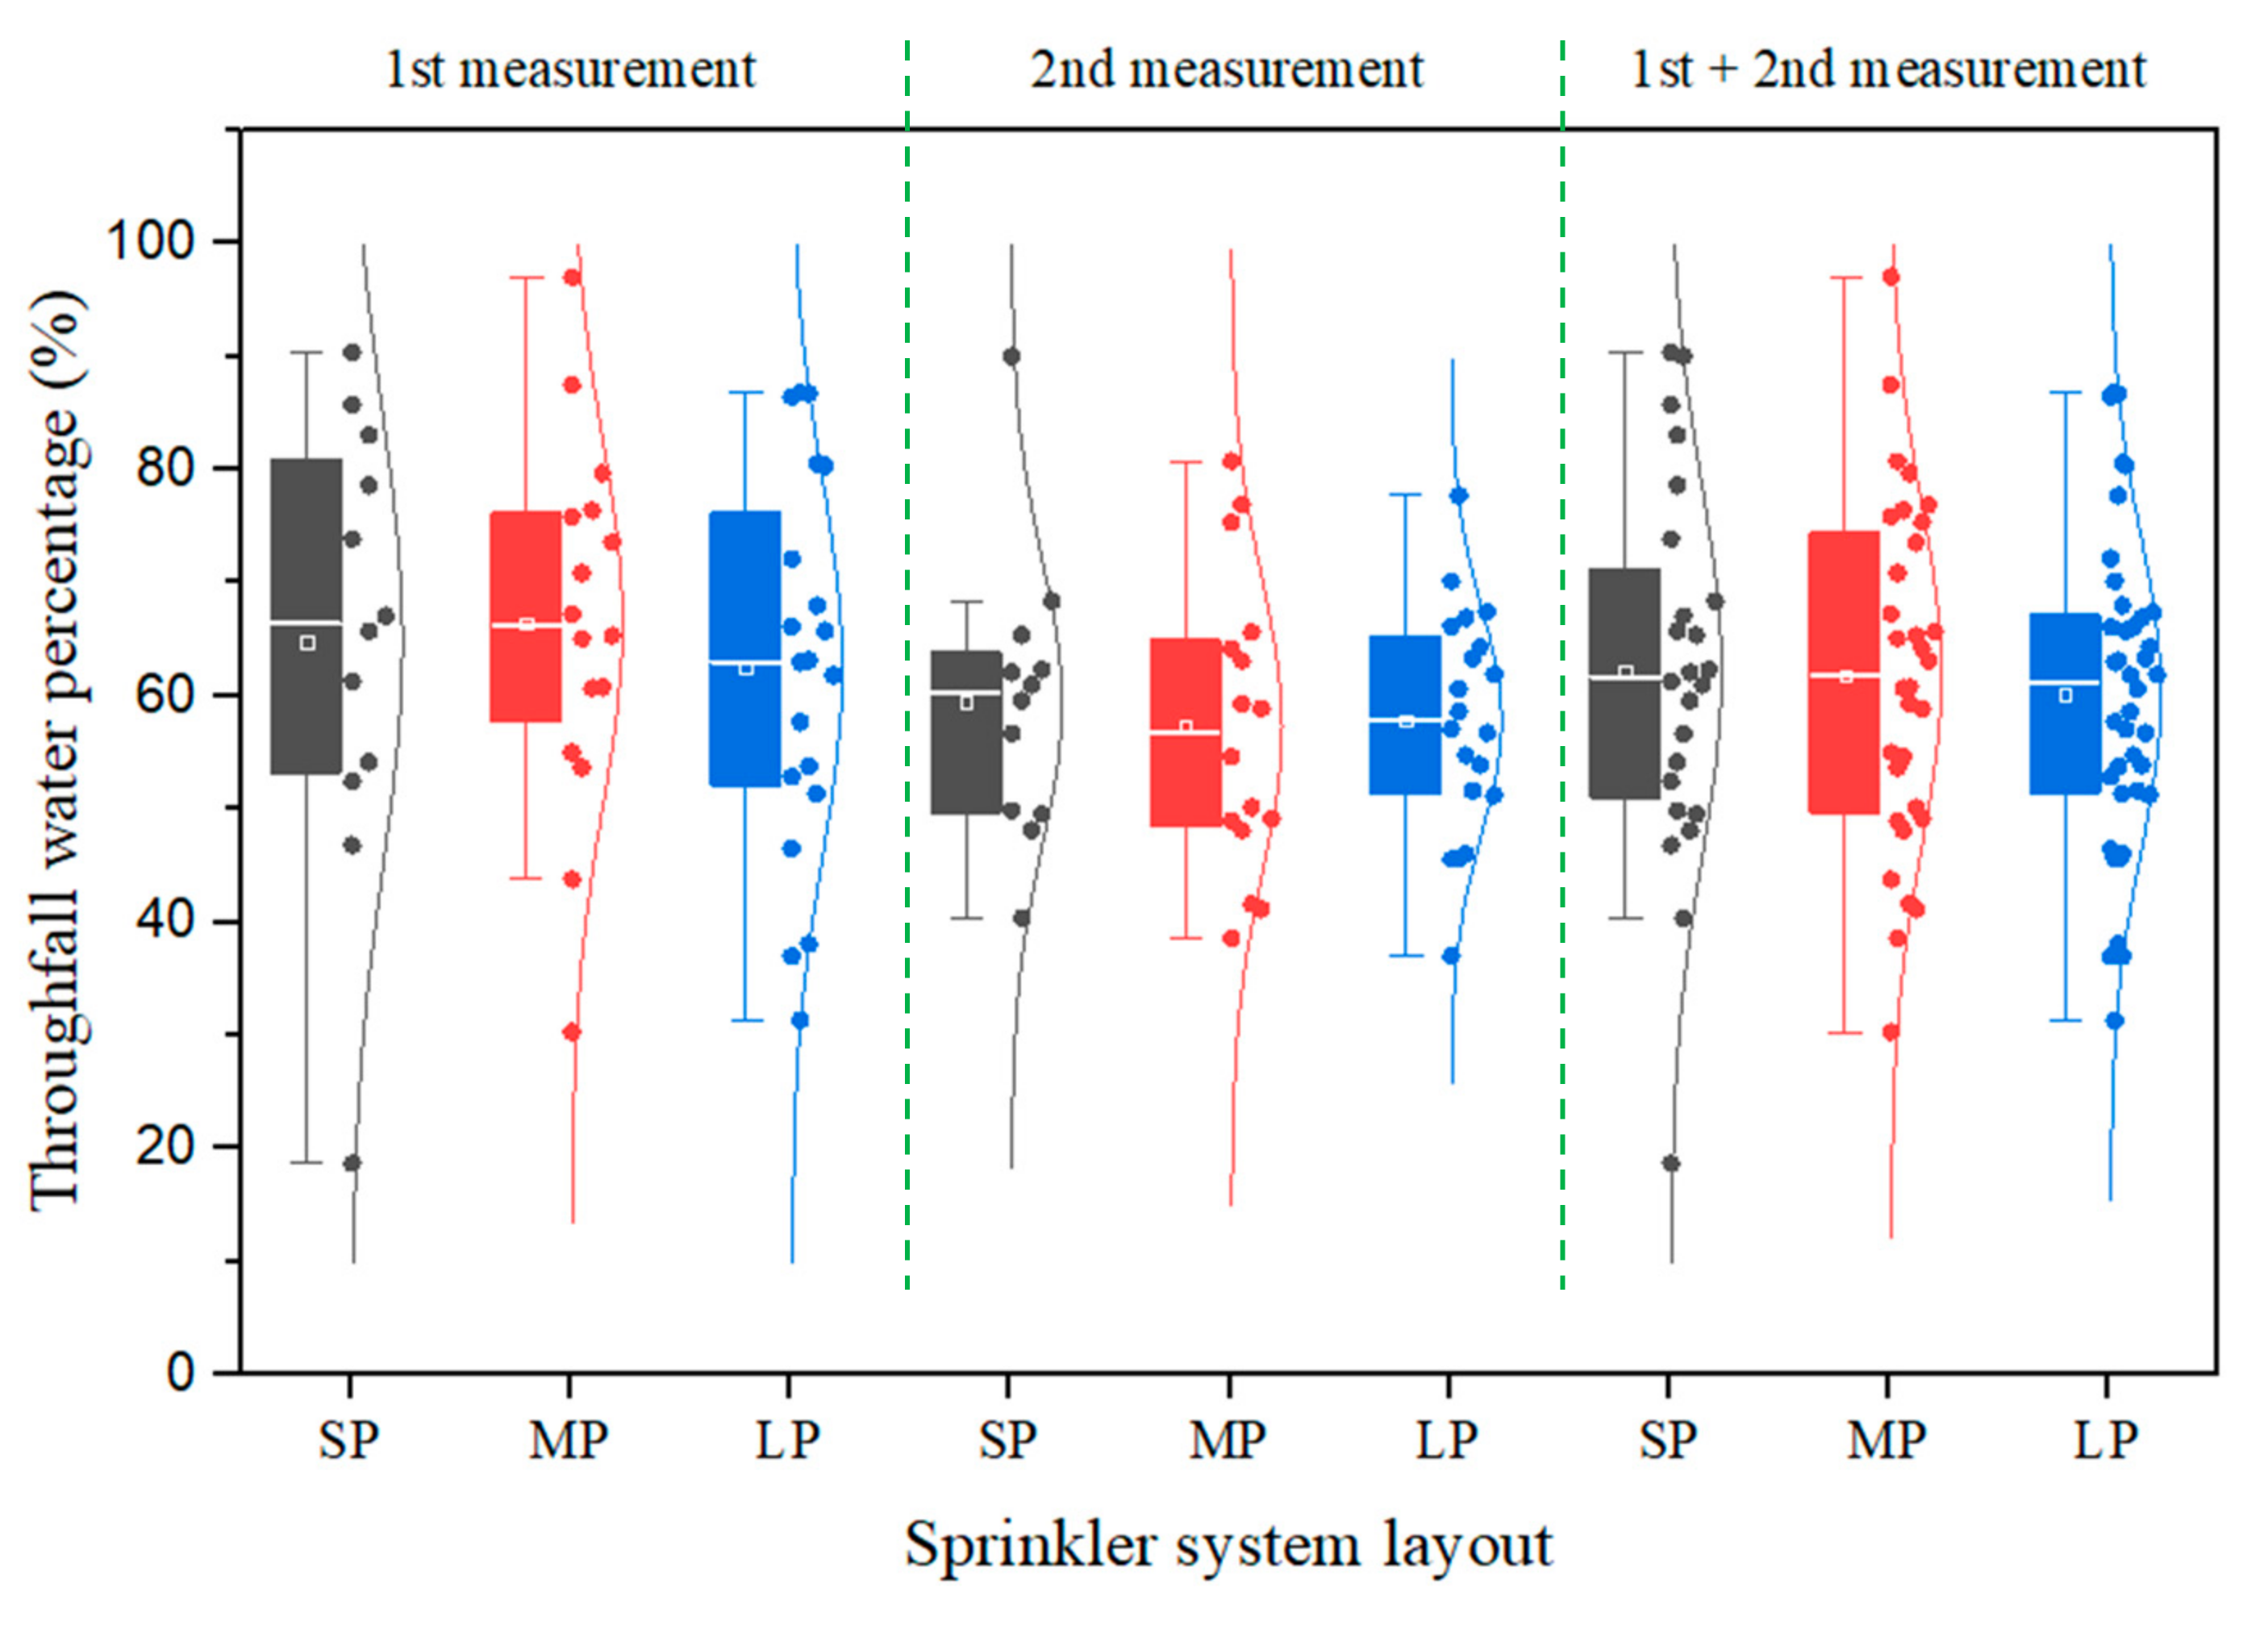
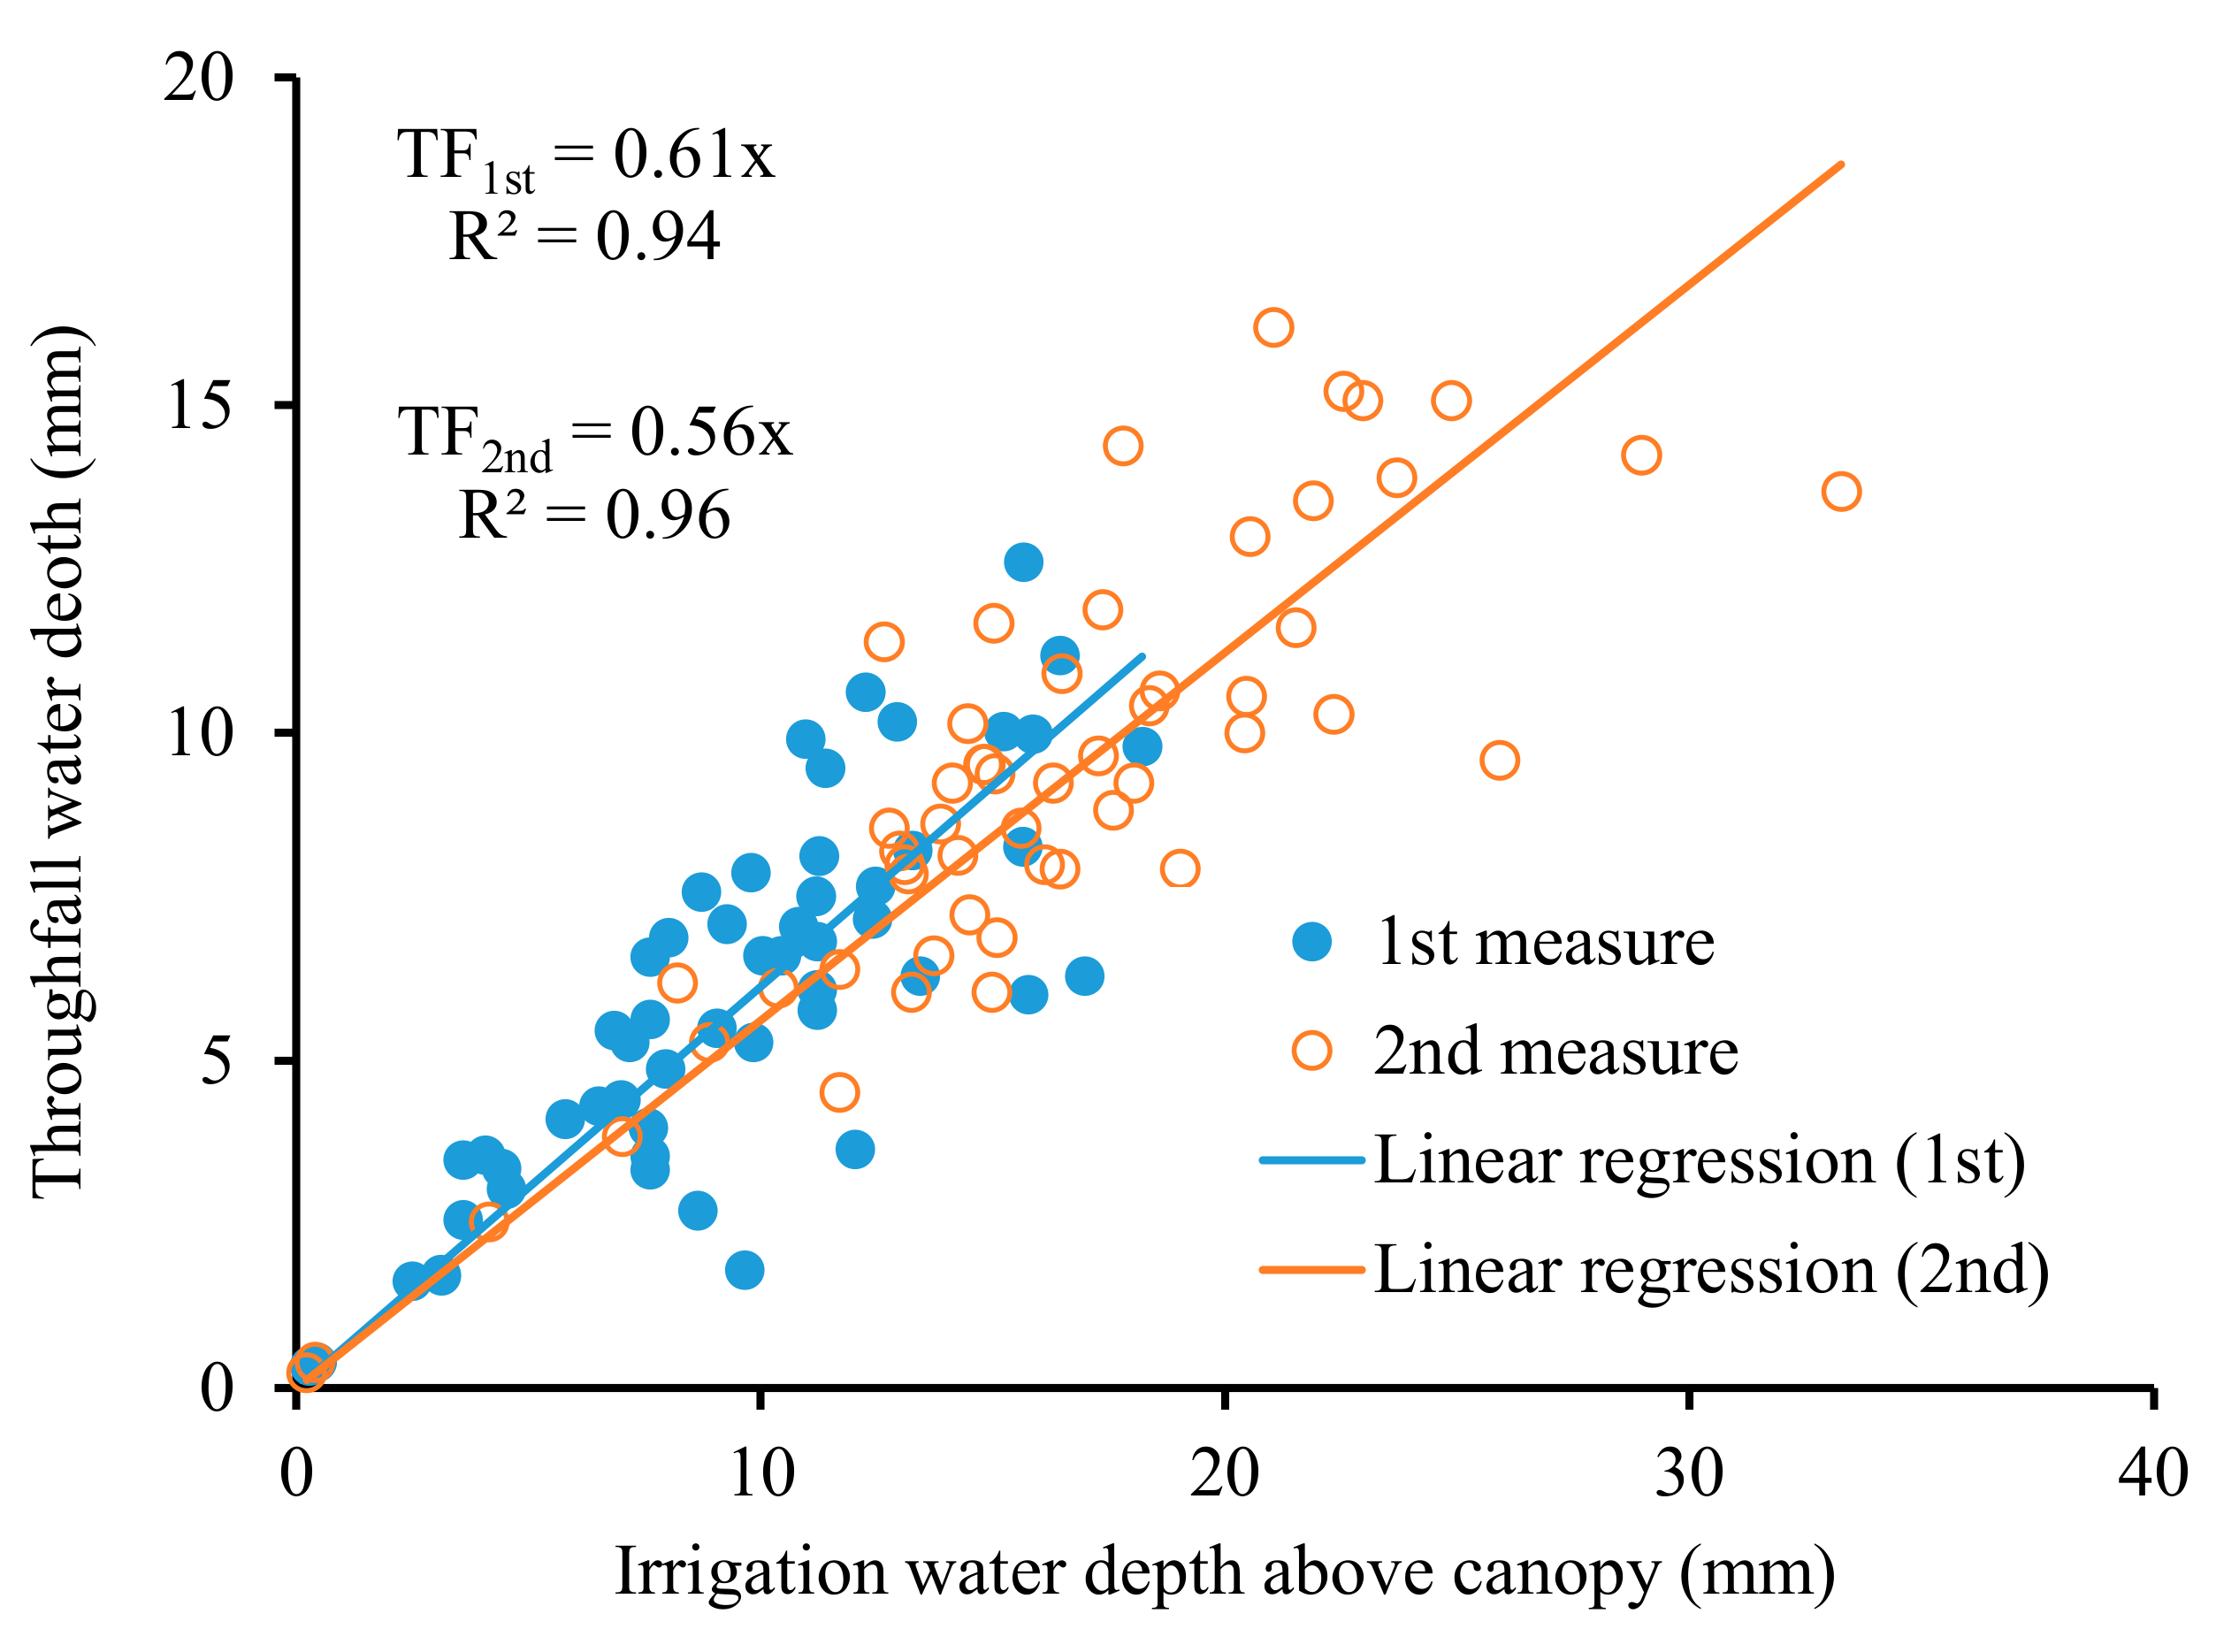
The throughfall water was also linearly related to the water above the canopy. The throughfall water percentage was on average 60% and was less related to wind speed and leaf area index in this study.
(4)
The water distribution coefficient CU above the canopy was higher than those below the canopy in four events out of the total six and lower in two events, indicating a much more complicated interaction between water distribution and related factors of crop structure, climatic condition and sprinkler system characteristics.
(5)
The three sprinkler layouts showed slight effects on canopy interception, stemflow and throughfall percentage. However, the highest CUs both above (0.83–0.92) and below the canopy (0.73–0.80) were found with small sprinkler spacing in the SP layout.

Supplementary Materials

The following supporting information can be downloaded at: https://www.mdpi.com/article/10.3390/agriculture12081265/s1, Figure S1: Canopy interception water and the corresponding irrigation water depth above the canopy at the same site in the first and second measurements; Figure S2: Relationships between stemflow water percentage and leaf area index (a) and wind speed during measurement (b); Figure S3: Relationships between throughfall water percentage to leaf area index (a) and wind speed during measurement (b).

Author Contributions

Conceptualization, H.L.; investigation, J.C. and X.T.; methodology, H.L. and J.C.; writing—original draft preparation, H.L.; writing—review and editing, H.L. and J.Z. All authors have read and agreed to the published version of the manuscript.

Funding

This research was funded by National Natural Science Foundation of China (NO. 51939005) and the 111 Project (B18006).

Institutional Review Board Statement

Not applicable.

Informed Consent Statement

Not applicable.

Data Availability Statement

The data presented in this study are available on request from the authors.

Acknowledgments

We greatly appreciated Wenjie Zhang for his kind support in the field experiments.

Conflicts of Interest

The authors declare no conflict of interest.

References

  1. Cai, D.; Shoukat, M.R.; Zheng, Y.; Tan, H.; Meng, F.; Yan, H. Optimizing center pivot irrigation to regulate field microclimate and wheat physiology under dry-hot wind conditions in the North China Plain. Water 2022, 14, 708. [Google Scholar] [CrossRef]
  2. Liu, H.; Kang, Y.; Yao, S.M.; Sun, Z.Q.; Liu, S.P.; Wang, Q.G. Field evaluation on water productivity of winter wheat under sprinkler or surface irrigation in the north china plain. Irrig. Drain. 2013, 62, 37–49. [Google Scholar] [CrossRef]
  3. Sarwar, A.; Peters, R.T.; Mehanna, H.; Amini, M.Z.; Mohamed, A.Z. Evaluating water application efficiency of low and mid elevation spray application under changing weather conditions. Agric. Water Manag. 2019, 221, 84–91. [Google Scholar] [CrossRef]
  4. Zhao, W.; Li, J.; Li, Y. Modeling sprinkler efficiency with consideration of microclimate modification effects. Agric. For. Meteorol. 2012, 161, 116–122. [Google Scholar] [CrossRef]
  5. Yan, H.; Hui, X.; Li, M.; Xu, Y. Development in sprinkler irrigation technology in China. Irrig. Drain. 2020, 69, 75–87. [Google Scholar] [CrossRef]
  6. Zhu, X.; Chikangaise, P.; Shi, W.; Chen, W.-H.; Yuan, S. Review of intelligent sprinkler irrigation technologies for remote autonomous system. Int. J. Agric. Biol. Eng. 2018, 11, 23–30. [Google Scholar] [CrossRef]
  7. Lamm, F.; Manges, H. Partitioning of sprinkler irrigation water by a corn canopy. Trans. ASAE 2000, 43, 909. [Google Scholar] [CrossRef]
  8. Wang, Y.; Li, M.; Hui, X.; Meng, Y.; Yan, H. Alfalfa canopy water interception under low-pressure sprinklers. Agric. Water Manag. 2020, 230, 105919. [Google Scholar] [CrossRef]
  9. Kang, Y.; Wang, Q.-G.; Liu, H.-J. Winter wheat canopy interception and its influence factors under sprinkler irrigation. Agric. Water Manag. 2005, 74, 189–199. [Google Scholar] [CrossRef]
  10. Wigneron, J.-P.; Calvet, J.-C.; Kerr, Y. Monitoring water interception by crop fields from passive microwave observations. Agric. For. Meteorol. 1996, 80, 177–194. [Google Scholar] [CrossRef]
  11. Tao, W.; Wang, Q.; Guo, L.; Lin, H.; Chen, X.; Sun, Y.; Ning, S. An enhanced rainfall–runoff model with coupled canopy interception. Hydrol. Process. 2020, 34, 1837–1853. [Google Scholar] [CrossRef]
  12. Yu, Y.; Gao, T.; Zhu, J.; Wei, X.; Guo, Q.; Su, Y.; Li, Y.; Deng, S.; Li, M. Terrestrial laser scanning-derived canopy interception index for predicting rainfall interception. Ecohydrology 2020, 13, e2212. [Google Scholar] [CrossRef]
  13. Wang, X.-p.; Zhang, Y.-f.; Hu, R.; Pan, Y.-x.; Berndtsson, R. Canopy storage capacity of xerophytic shrubs in Northwestern China. J. Hydrol. 2012, 454–455, 152–159. [Google Scholar] [CrossRef]
  14. Zhang, Y.-f.; Wang, X.-p.; Hu, R.; Pan, Y.-x. Throughfall and its spatial variability beneath xerophytic shrub canopies within water-limited arid desert ecosystems. J. Hydrol. 2016, 539, 406–416. [Google Scholar] [CrossRef]
  15. Magliano, P.N.; Whitworth-Hulse, J.I.; Florio, E.L.; Aguirre, E.C.; Blanco, L.J. Interception loss, throughfall and stemflow by Larrea divaricata: The role of rainfall characteristics and plant morphological attributes. Ecol. Res. 2019, 34, 753–764. [Google Scholar] [CrossRef]
  16. Butler, D.R.; Huband, N.D.S. Throughfall and stem-flow in wheat. Agric. For. Meteorol. 1985, 35, 329–338. [Google Scholar] [CrossRef]
  17. Ma, B.; Ma, F.; Li, Z.; Wu, F. Effect of crops on rainfall redistribution processes under simulated rainfall. Trans. Chin. Soc. Agric. Eng. 2014, 30, 136–146. [Google Scholar] [CrossRef]
  18. Zhang, H.-x.; Wu, H.-w.; Li, J.; He, B.; Liu, J.-f.; Wang, N.; Duan, W.-l.; Liao, A.-m. Spatial-temporal variability of throughfall in a subtropical deciduous forest from the hilly regions of eastern China. J. Mount. Sci. 2019, 16, 1788–1801. [Google Scholar] [CrossRef]
  19. Fathizadeh, O.; Sadeghi, S.M.M.; Holder, C.D.; Su, L. Leaf phenology drives spatio-temporal patterns of throughfall under a single quercus castaneifolia C.A.Mey. Forests 2020, 11, 688. [Google Scholar] [CrossRef]
  20. Yuge, K.; Anan, M. Quantification of the crop stem flow in the sprinkler irrigated field. Paddy Water Environ. 2010, 9, 229–236. [Google Scholar] [CrossRef]
  21. Antoneli, V.; Jesus, F.C.d.; Bednarz, J.A.; Thomaz, E.L. Stemflow and throughfall in agricultural crops: A synthesis. Rev. Ambiente Água 2021, 16, e2528. [Google Scholar] [CrossRef]
  22. Glover, J.; Gwynne, M. Light rainfall and plant survival in East Africa I. Maize. J. Ecol. 1962, 50, 111–118. [Google Scholar] [CrossRef]
  23. Liu, H.; Zhang, R.; Zhang, L.; Wang, X.; Li, Y.; Huang, G. Stemflow of water on maize and its influencing factors. Agric. Water Manag. 2015, 158, 35–41. [Google Scholar] [CrossRef]
  24. Wang, Q.-G.; Kang, Y.; Liu, H.-J.; Liu, S.-P. Method for measurement of canopy interception under sprinkler irrigation. J. Irrig. Drain. Eng. 2006, 132, 185–187. [Google Scholar] [CrossRef]
  25. Li, J.; Rao, M. Sprinkler water distributions as affected by winter wheat canopy. Irrig. Sci. 2000, 20, 29–35. [Google Scholar] [CrossRef]
  26. Tang, X.; Liu, H.; Yang, L.; Li, L.; Chang, J. Energy balance, microclimate, and crop evapotranspiration of winter wheat (Triticum aestivum L.) under sprinkler irrigation. Agriculture 2022, 12, 953. [Google Scholar] [CrossRef]
  27. Ministry of Water Resources of the People’s republic of China. Technical Code for Sprinkler Irrigation; Chinese Plan Press: Beijing, China, 2007. [Google Scholar]
  28. Jiao, J.; Su, D.; Han, L.; Wang, Y. A rainfall interception model for alfalfa canopy under simulated sprinkler irrigation. Water 2016, 8, 585. [Google Scholar] [CrossRef]
  29. Zapata, N.; Salvador, R.; Latorre, B.; Paniagua, P.; Medina, E.T.; Playán, E. Effect of a growing maize canopy on solid-set sprinkler irrigation: Kinetic energy dissipation and water partitioning. Irrig. Sci. 2021, 39, 329–346. [Google Scholar] [CrossRef]
  30. Yan, T.; Wang, Z.; Liao, C.; Xu, W.; Wan, L. Effects of the morphological characteristics of plants on rainfall interception and kinetic energy. J. Hydrol. 2021, 592, 125807. [Google Scholar] [CrossRef]
  31. Pshenichnikova, T.A.; Doroshkov, A.V.; Osipova, S.V.; Permyakov, A.V.; Permyakova, M.D.; Efimov, V.M.; Afonnikov, D.A. Quantitative characteristics of pubescence in wheat (Triticum aestivum L.) are associated with photosynthetic parameters under conditions of normal and limited water supply. Planta 2019, 249, 839–847. [Google Scholar] [CrossRef]
  32. Sansoulet, J.; Cabidoche, Y.-M.; Cattan, P.; Ruy, S.; Simunek, J.J. Spatially distributed water fluxes in an andisol under banana plants: Experiments and three-dimensional modeling. Vadose Zone J. 2008, 7, 819–829. [Google Scholar] [CrossRef]
  33. Valente, F.; Gash, J.H.; Nóbrega, C.; David, J.S.; Pereira, F.L. Modelling rainfall interception by an olive-grove/pasture system with a sparse tree canopy. J. Hydrol. 2020, 581, 124417. [Google Scholar] [CrossRef]
  34. Livesley, S.J.; Baudinette, B.; Glover, D. Rainfall interception and stem flow by eucalypt street trees—The impacts of canopy density and bark type. Urban For. Urban Green. 2014, 13, 192–197. [Google Scholar] [CrossRef]
  35. Sarwar, A.; Peters, R.T.; Shafeeque, M.; Mohamed, A.; Arshad, A.; Ullah, I.; Saddique, N.; Muzammil, M.; Aslam, R.A. Accurate measurement of wind drift and evaporation losses could improve water application efficiency of sprinkler irrigation systems—A comparison of measuring techniques. Agric. Water Manag. 2021, 258, 107209. [Google Scholar] [CrossRef]
  36. Ghimire, C.P.; Bruijnzeel, L.A.; Lubczynski, M.W.; Ravelona, M.; Zwartendijk, B.W.; van Meerveld, H. Measurement and modeling of rainfall interception by two differently aged secondary forests in upland eastern Madagascar. J. Hydrol. 2017, 545, 212–225. [Google Scholar] [CrossRef]
  37. Mair, A.; Fares, A. Throughfall characteristics in three non-native Hawaiian forest stands. Agric. For. Meteorol. 2010, 150, 1453–1466. [Google Scholar] [CrossRef]
  38. Hui, X.; Zheng, Y.; Yan, H. Water distributions of low-pressure sprinklers as affected by the maize canopy under a centre pivot irrigation system. Agr Water Manag. 2021, 245, 106646. [Google Scholar] [CrossRef]
  39. Ayars, J.E.; Hutmacher, R.B.; Schoneman, R.A.; Dettinger, D.R. Influence of cotton canopy on sprinkler irrigation uniformity. Trans. ASAE 1991, 34, 890–0896. [Google Scholar] [CrossRef]
Figure 1. Measurement layout for water depth above and under the canopy, canopy interception, stemflow and throughfall water in the experiment. SP, MP and LP indicate the plots used for measurement in the three layouts.
Agriculture 12 01265 g001
Figure 2. Pictures of the stemflow water measurement in the field, (a) wrapping a high-water-adsorption sheet (HWAS) around the wheat stems, (b) placing plastic sheets to cover the HWAS to prevent irrigation water from falling into the inside materials, (c) sealing the upside opening, and (d) measuring the HWAS mass to calculate the stemflow water.
Agriculture 12 01265 g002
Figure 3. Distribution of canopy interception water under the three sprinkler system layouts in the two measurements.
Agriculture 12 01265 g003
Figure 4. Distribution of the stemflow water percentage under the three sprinkler system layouts in the two measurements.
Agriculture 12 01265 g004
Figure 5. Stemflow water and the corresponding irrigation water depth above the canopy at the same site in the first and second measurements. SF1st and SF2nd represent the sap flow variable in the first and second measurements in the regression lines, respectively.
Agriculture 12 01265 g005
Figure 6. Distribution of throughfall water percentage under the three sprinkler system layouts in the two measurements.
Agriculture 12 01265 g006
Figure 7. Throughfall water and the corresponding irrigation water depth above the canopy at the same site in the first and second measurements. TF1st and TF2nd represent the throughfall variable in the first and second measurements in the regression lines, respectively.
Agriculture 12 01265 g007
Figure 8. Relationships between canopy interception water and leaf area index (a) and wind speed during measurement (b). Symbol (**) after value of 0.7802 in (a) indicates this regression line is significant at 0.01 level.
Agriculture 12 01265 g008
Table 1. Experimental date and corresponding climatic conditions in each measurement.
MeasurementSiteSystem
Layout
Sprinklering Start TimeDurationIrrigation
Intensity
Mean Air
Temperature
Mean Relative HumidityMean Wind SpeedMaximum Wind SpeedLAI
Hoursmm/h°C%m s−1m s−1
1stSP18X12 *6 May, 05:191.010.2 a **15.052.12.76.94.13
MP18X187 May, 06:041.07.0 b8.841.01.12.64.44
LP18X248 May, 07:172.06.2 b18.962.70.62.34.61
2ndSP18X1225 May, 06:371.559.4 a16.355.22.86.62.83
MP18X1824 May, 06:022.08.6 ab13.060.30.41.03.30
LP18X2423 May, 05:552.457.6 b15.994.80.82.63.50
Mean of 1st and 2ndSP18X12 9.8 a15.753.72.86.83.48
MP18X18 7.8 b10.950.70.81.83.87
LP18X24 6.9 b17.478.80.72.54.06
* in the system layout column, “18X12” indicates that the lateral pipe space is 18 m and the sprinkler space is 12 m. ** Significant analysis on irrigation intensity difference in the three sprinkler layouts was done for each measurement using the collected water depth above the canopy. Different letters means significant difference in irrigation density at 0.05 level, and the same letter means no significant at 0.05 level.
Table 2. The measured water above crop canopy, water distribution uniformity above and below the canopy, stemflow (SF), canopy interception (CI) and throughfall (TF) and their percentages and the rate of the total SF, CI and TF to the water measured above the canopy (Ic).
MeasurementSiteWater above the Canopy
(Ic)
Water Distribution
Uniformity above
Canopy
Water
Distribution Uniformity on Ground
Stemflow Water (SF)Canopy
Interception Water (CI)
Throughfall Water (TF)Stemflow PercentageCanopy
Interception Percentage
Throughfall PercentageRate of Sum of SF, CI and TF to Water Measured above Canopy
mm mmmmmm%%%
1stSP10.170.830.732.50 a0.85 a *6.59 b24.6 b8.4 b64.9 a0.98 **
MP6.990.650.742.46 a0.81 a4.39 c35.2 a11.5 a62.8 a1.10
LP12.480.750.782.76 a0.98 a7.66 a22.1 b7.9 b61.4 a0.91
Mean14.580.920.80---0.88---27.39.363.01.00
2ndSP17.270.690.655.42 a0.65 b8.62 c37.1 a4.4 b59.1 a1.01
MP18.600.800.744.67 b0.77 b9.65 b27.1 b4.4 b55.9 a0.87
LP24.750.880.765.23 a1.27 a10.64 a28.1 ab6.8 a57.2 a0.92
Mean24.260.670.69---0.90---30.85.257.40.93
Mean of 1st and 2ndSP---0.780.76---0.75 b---31.1 a6.4 b62. 0a0.99
MP---0.830.73---0.79 b---30.8 a8.0 a59.3 a0.98
LP---0.650.74---1.13 a---25.8 a7.3 ab59.3 a0.92
Mean ---0.77 ± 0.100.74 ± 0.05---0.89 ± 0.20---29.0 ± 5.97.2 ± 2.760.2 ± 3.40.96 ± 0.08
* Significant analysis was done for canopy interception, throughfall and stemflow water among the three system layouts in each measurement. Different letters means significant difference in the corresponding variable at 0.05 level, and the same letter means no significant at 0.05 level. ** the rate was calculated by rate = (SF + CI + TF)/Ic.
Publisher’s Note: MDPI stays neutral with regard to jurisdictional claims in published maps and institutional affiliations.

