Article

Effects of Irrigation Method and Water Flow Rate on Irrigation Performance, Soil Salinity, Yield, and Water Productivity of Cauliflower

by
Abdelaziz M. Okasha
1,
Nehad Deraz
1,
Adel H. Elmetwalli
2,
Salah Elsayed
3,
Mayadah W. Falah
4,
Aitazaz Ahsan Farooque
5,6,* and
Zaher Mundher Yaseen
7,8,*
1
Department of Agricultural Engineering, Faculty of Agriculture, Kafrelsheikh University, Kafr El-Sheikh 33516, Egypt
2
Department of Agricultural Engineering, Faculty of Agriculture, Tanta University, Tanta 31527, Egypt
3
Agricultural Engineering, Evaluation of Natural Resources Department, Environmental Studies and Research Institute, University of Sadat City, Sadat City 32897, Minufiya, Egypt
4
Building and Construction Engineering Technology Department, AL-Mustaqbal University College, Hillah 51001, Iraq
5
Faculty of Sustainable Design Engineering, University of Prince Edward Island, Charlottetown, PE C1A 4P3, Canada
6
School of Climate Change and Adaptation, University of Prince Edward Island, Charlottetown, PE C1A 4P3, Canada
7
Department of Earth Sciences and Environment, Faculty of Science and Technology, Universiti Kebangsaan Malaysia, Bangi 43600, Selangor, Malaysia
8
New Era and Development in Civil Engineering Research Group, Scientific Research Center, Al-Ayen Unversity, Thi-Qar 64001, Iraq
*
Authors to whom correspondence should be addressed.
Agriculture 2022, 12(8), 1164; https://doi.org/10.3390/agriculture12081164
Submission received: 5 July 2022 / Revised: 27 July 2022 / Accepted: 30 July 2022 / Published: 5 August 2022
(This article belongs to the Special Issue Water-Saving Irrigation Technology and Strategies for Crop Production)

Abstract

:
Water scarcity is a major constraint for food production, particularly in arid and semi-arid environments. In this regard, selecting the best irrigation technique is crucial to overcome water scarcity and enhance water productivity (WP) with no significant yield loss. This study aimed to assess the impact of irrigation techniques of every furrow irrigation (EFI), alternate furrow irrigation (AFI), and drip irrigation (DI), as well as the flow rate, on irrigation system performance parameters, yield, water productivity of cauliflower crop and soil salinity during the two successive growing seasons of 2017/2018 and 2018/2019 under field conditions. The treatments comprised three different irrigation inflow rates: Q1 = 0.47 L/s, Q2 = 0.95 L/s, and Q3 = 1.43 L/s. For both investigated seasons, the AFI + Q3 treatment produced the best water distribution uniformity (DU) and water application efficiency (AE) of 85.10% and 72.73%, respectively, of the surface irrigation, and DI methods across the two growing seasons produced the highest DU of 95%. DI produced the highest cauliflower curd yield (18.12 Mg/fed), followed by EFI + Q3 (12.285 Mg/fed) and AFI + Q3 (11.905 Mg/fed). The maximum mean WP value of 10.6 kg/m3 was recorded with DI, followed by AFI + Q3 (6.24 kg/m3), across the two growing seasons. DI, AFI + Q3, AFI + Q2, AFI + Q1, EFI + Q3, and EFI + Q2 saved irrigation water by 32.63, 28.71, 21.22, 18.04, 10.48, and 3.18%, respectively, compared with EFI + Q1 across the two growing seasons. During both seasons, the average value using the drip irrigation system was 3.60 dS/m. Considering the annual leaching requirements of soil, climate change conditions, and fixed costs, we recommend the use of a drip irrigation system in clayey soil to produce cauliflower, followed by the use of the alternative furrow irrigation method to enable the aeration of the same soil for a lower cost.

1. Introduction

The increasing demand for water by a variety of non-agricultural users, as well as climate unpredictability, has had negative impacts on the water supply, prompting society to look for ways to conserve water in irrigated agriculture, particularly in water-scarce places [1]. Cauliflower (Brassica oleracea L. var. botrytis) is one of the most extensively grown [2] and extensively consumed vegetables in the Mediterranean region thanks to its excellent nutritional and commercial value [3]. Cauliflower is a prominent winter vegetable crop in Egypt, which produced 118,041 Mg from a cultivated area of 4197 ha in 2020 [4]. Cauliflower is often regarded as a water-stress-sensitive crop, and such susceptibility has been documented in many previous investigations [5]. Cauliflower, a member of the Brassica genus, is additionally considered one of the most extensively consumed vegetables worldwide because of its aforementioned significant nutritional and commercial value, despite its sensitivity to water deficits [6,7]. Growing cauliflower typically necessitates the use of large amounts of irrigation water and nitrogen fertilizers [8], but it sells for high prices in neighbouring urban markets, where vegetables are the most commonly irrigated crops with low-quality water [9].
Vegetable productivity is highly impacted by water limitations, and this obstacle requires comprehensive investigation. Egypt’s agricultural production mainly depends on irrigation for growing crops because of the country’s dry climate, with an annual rainfall of less than 25 mm [10,11]. Egypt’s annual per capita water use for various purposes has fallen below the water poverty threshold (1000 m3) and is expected to fall below 500 m3 in the near-future as a result of rapid population growth and limited water supplies [10]. Agriculture consumes most of a country’s total water budget, accounting for about 85% of the total supply [12]. Water scarcity has become a major issue in the world’s arid and semi-arid regions, including the Mediterranean [13,14]. Water demand is anticipated to rise in the future as the world’s population expands, agricultural areas expand, and climate changes occur [15,16]. There is a contradictory relationship between the efficiency of water use and irrigation water-use values, as they increase with decreasing irrigation regimes [17]. Producing vegetables normally requires a significant amount of irrigation water and nitrogen fertilizers [8,18]. A few researchers previously demonstrated that using a design for optimal flow in each border or furrow could improve the water efficiency and increase the production of the three crops irrigated by gravity. Although the water-use efficiency (WUE) of pressurized irrigation systems (sprinkler or drip) is higher, this optimal flow design allows for better resource utilization, increased productivity, and improved crop output [19].
Despite being one of the least efficient techniques compared with other irrigation systems, EFI is one of the most extensively employed forms of surface irrigation [20]. Efficient irrigation water use is crucial, particularly in arid and semi-arid conditions. The improvement to existing surface furrow irrigation and management practices is necessary to guarantee highly efficient water use. AFI can be a water-saving irrigation technique and does not require additional costs or highly advanced technology. Its crop-dependent reduction in applied water is usually accompanied by a small yield loss, which leads to increased WP [21]. AFI has greater advantages in the field than micro-irrigation and spraying irrigation. Farmers can use AFI with fewer investments and less difficulty. As a result, AFI has higher application potential in the field [22]. The AFI method was found to result in a 15% higher application efficiency in clay loam soil compared with other furrow irrigation methods, as it requires a smaller wetted perimeter for potato (Solanum tuberosum L.) crop [23]. Smaller amounts of irrigation water are normally applied with the AFI technique, so it can apply water in a way that remarkably decreases the wetted soil surface, resulting in less evapotranspiration and deep percolation.
Drip irrigation directly delivers water to the root zone of plants via emitters, ensuring adequate moisture levels throughout all growth phases of a crop’s life cycle [24]. Drip irrigation system research has aided in identifying the proper operating pressure range, emitter type, emitter distance, and emitter discharge. If discharge information for each emitter is available, irrigation timing can be calculated based on a crop’s needs [25]. The use of suitable irrigation levels can help improve the economic return and WUE [26]. This approach can solve water-scarcity problems and increase crop yields in arid and semi-arid regions [27]. A drip irrigation system was shown to boost the final yield by 30–40% while saving water by 50–60% compared with traditional irrigation methods [28,29]. Drip irrigation levels have a significant impact on curd yield and water productivity [30,31]. Using DI for watering cauliflower was shown to not only increase crop yield, but also significantly enhance WUE [32]. In sandy loam soil, subsurface DI was shown to significantly increase cauliflower yield and WUE by 13% and 45.96 kg ha−1 mm−1, respectively, in comparison with surface drip irrigation [33]. When DI levels in clay soil are inadequate, many growth parameters and the total yield are significantly reduced. With an average total yield of 39.15 Mg ha−1 and a yield shortage of 14.1% of cauliflower (Brassica oleracea var. botrytis, L.) crop, nearly 15% of the water used in Egypt can be saved using this irrigation method [34].
Soil salinity is affected by differences in water discharge rates, as a 44.40 L/min inflow rate can lead to a higher soil salinity. This may be caused by fast water movement, and thus little retention time on the surface of the soil, leading to reductions in the infiltration rate and salt leaching. Thus, the increased water discharge can lead to increases in soil salinity [35].
Under the conditions of the Nile Delta region, little attention has paid to the response of cauliflower to varying water inflow rates using different irrigation methods. Our research study was based on the hypothesis that cauliflower yield, and thus water-use efficiency, can be enhanced with AFI. From this perspective, it is critical to evaluate the irrigation performance and yield production of cauliflower under different water levels in order to select the appropriate irrigation application method and inflow rate in clay soil. Thus, the main objective of this research was to evaluate the effects of different irrigation methods and inflow rates on water distribution uniformity (DU), water application efficiency (AE), water productivity (WP), and cauliflower yield under the conditions of Egypt’s Nile Delta to select the appropriate combination.

2. Materials and Methods

2.1. Experimental Site

Two field experiments were undertaken during two successive growing seasons of 2017–2018 and 2018–2019 at the Experimental Farm, Faculty of Agriculture, Kafrelsheikh University, North Delta, Egypt, which is located at a latitude of 31°05′47″ N and longitude of 30°57′14″ E and an elevation of 6 m above sea level. With an average bulk density of 1.23 gcm−3, pH of 8.97, and electrical conductivity (EC) of 3.42 dS/m, the soil at this site is classified as clay in texture (58.8% clay, 22.83% silt, and 16.36% sand). The average values of field capacity, wilting point, and available water were found to be 40.66, 21.33, and 19.33%, respectively. The irrigation and drainage water had EC values of 0.6 and 5.3 dS/m, respectively. The average amount of readily available water (RAW) for the experimental soil (0–45 cm depth) was calculated using the following formula [36].
R A W = M A D D R r z F C P W P 100
where RAW is the readily available water, cm; MAD is the maximum allowed deficiency, 0.50; Drz is the root zone depth, cm; FC is the field capacity, %; and PWP is the permanent wilting point, %.
During both growing seasons, meteorological data were collected from an agro-meteorological weather station located about 150 m from the experimental plots, as shown in Table 1.

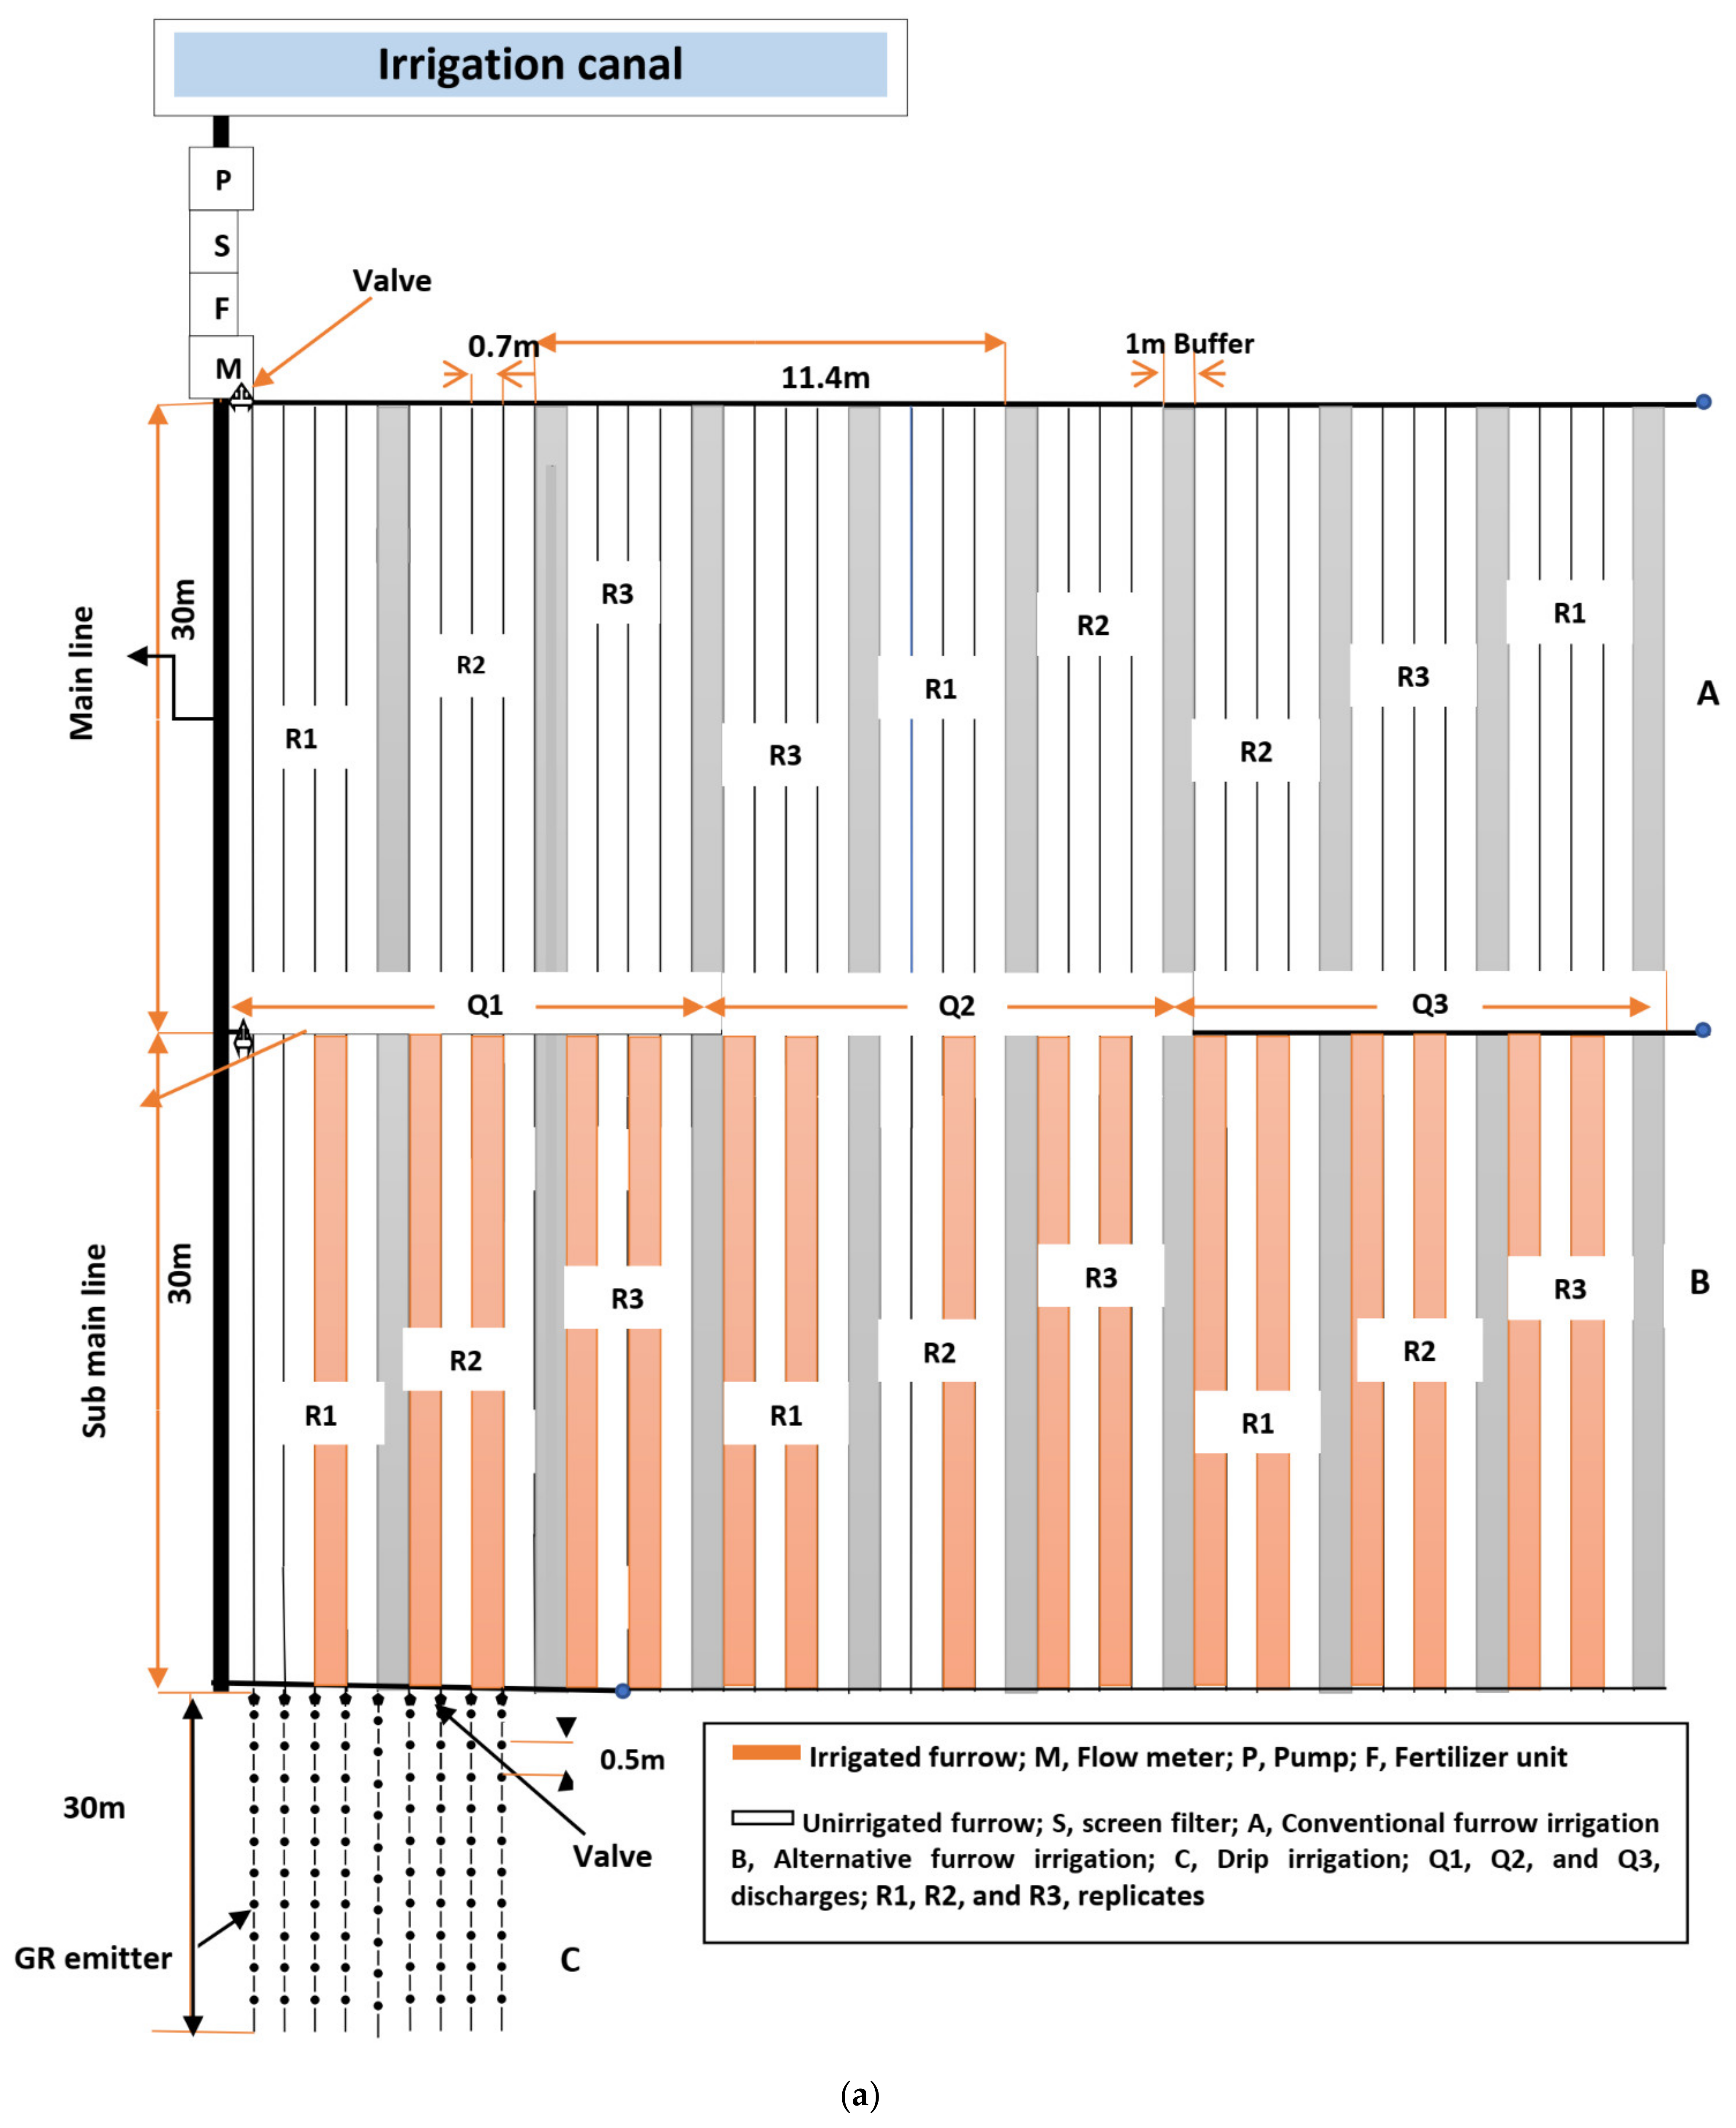
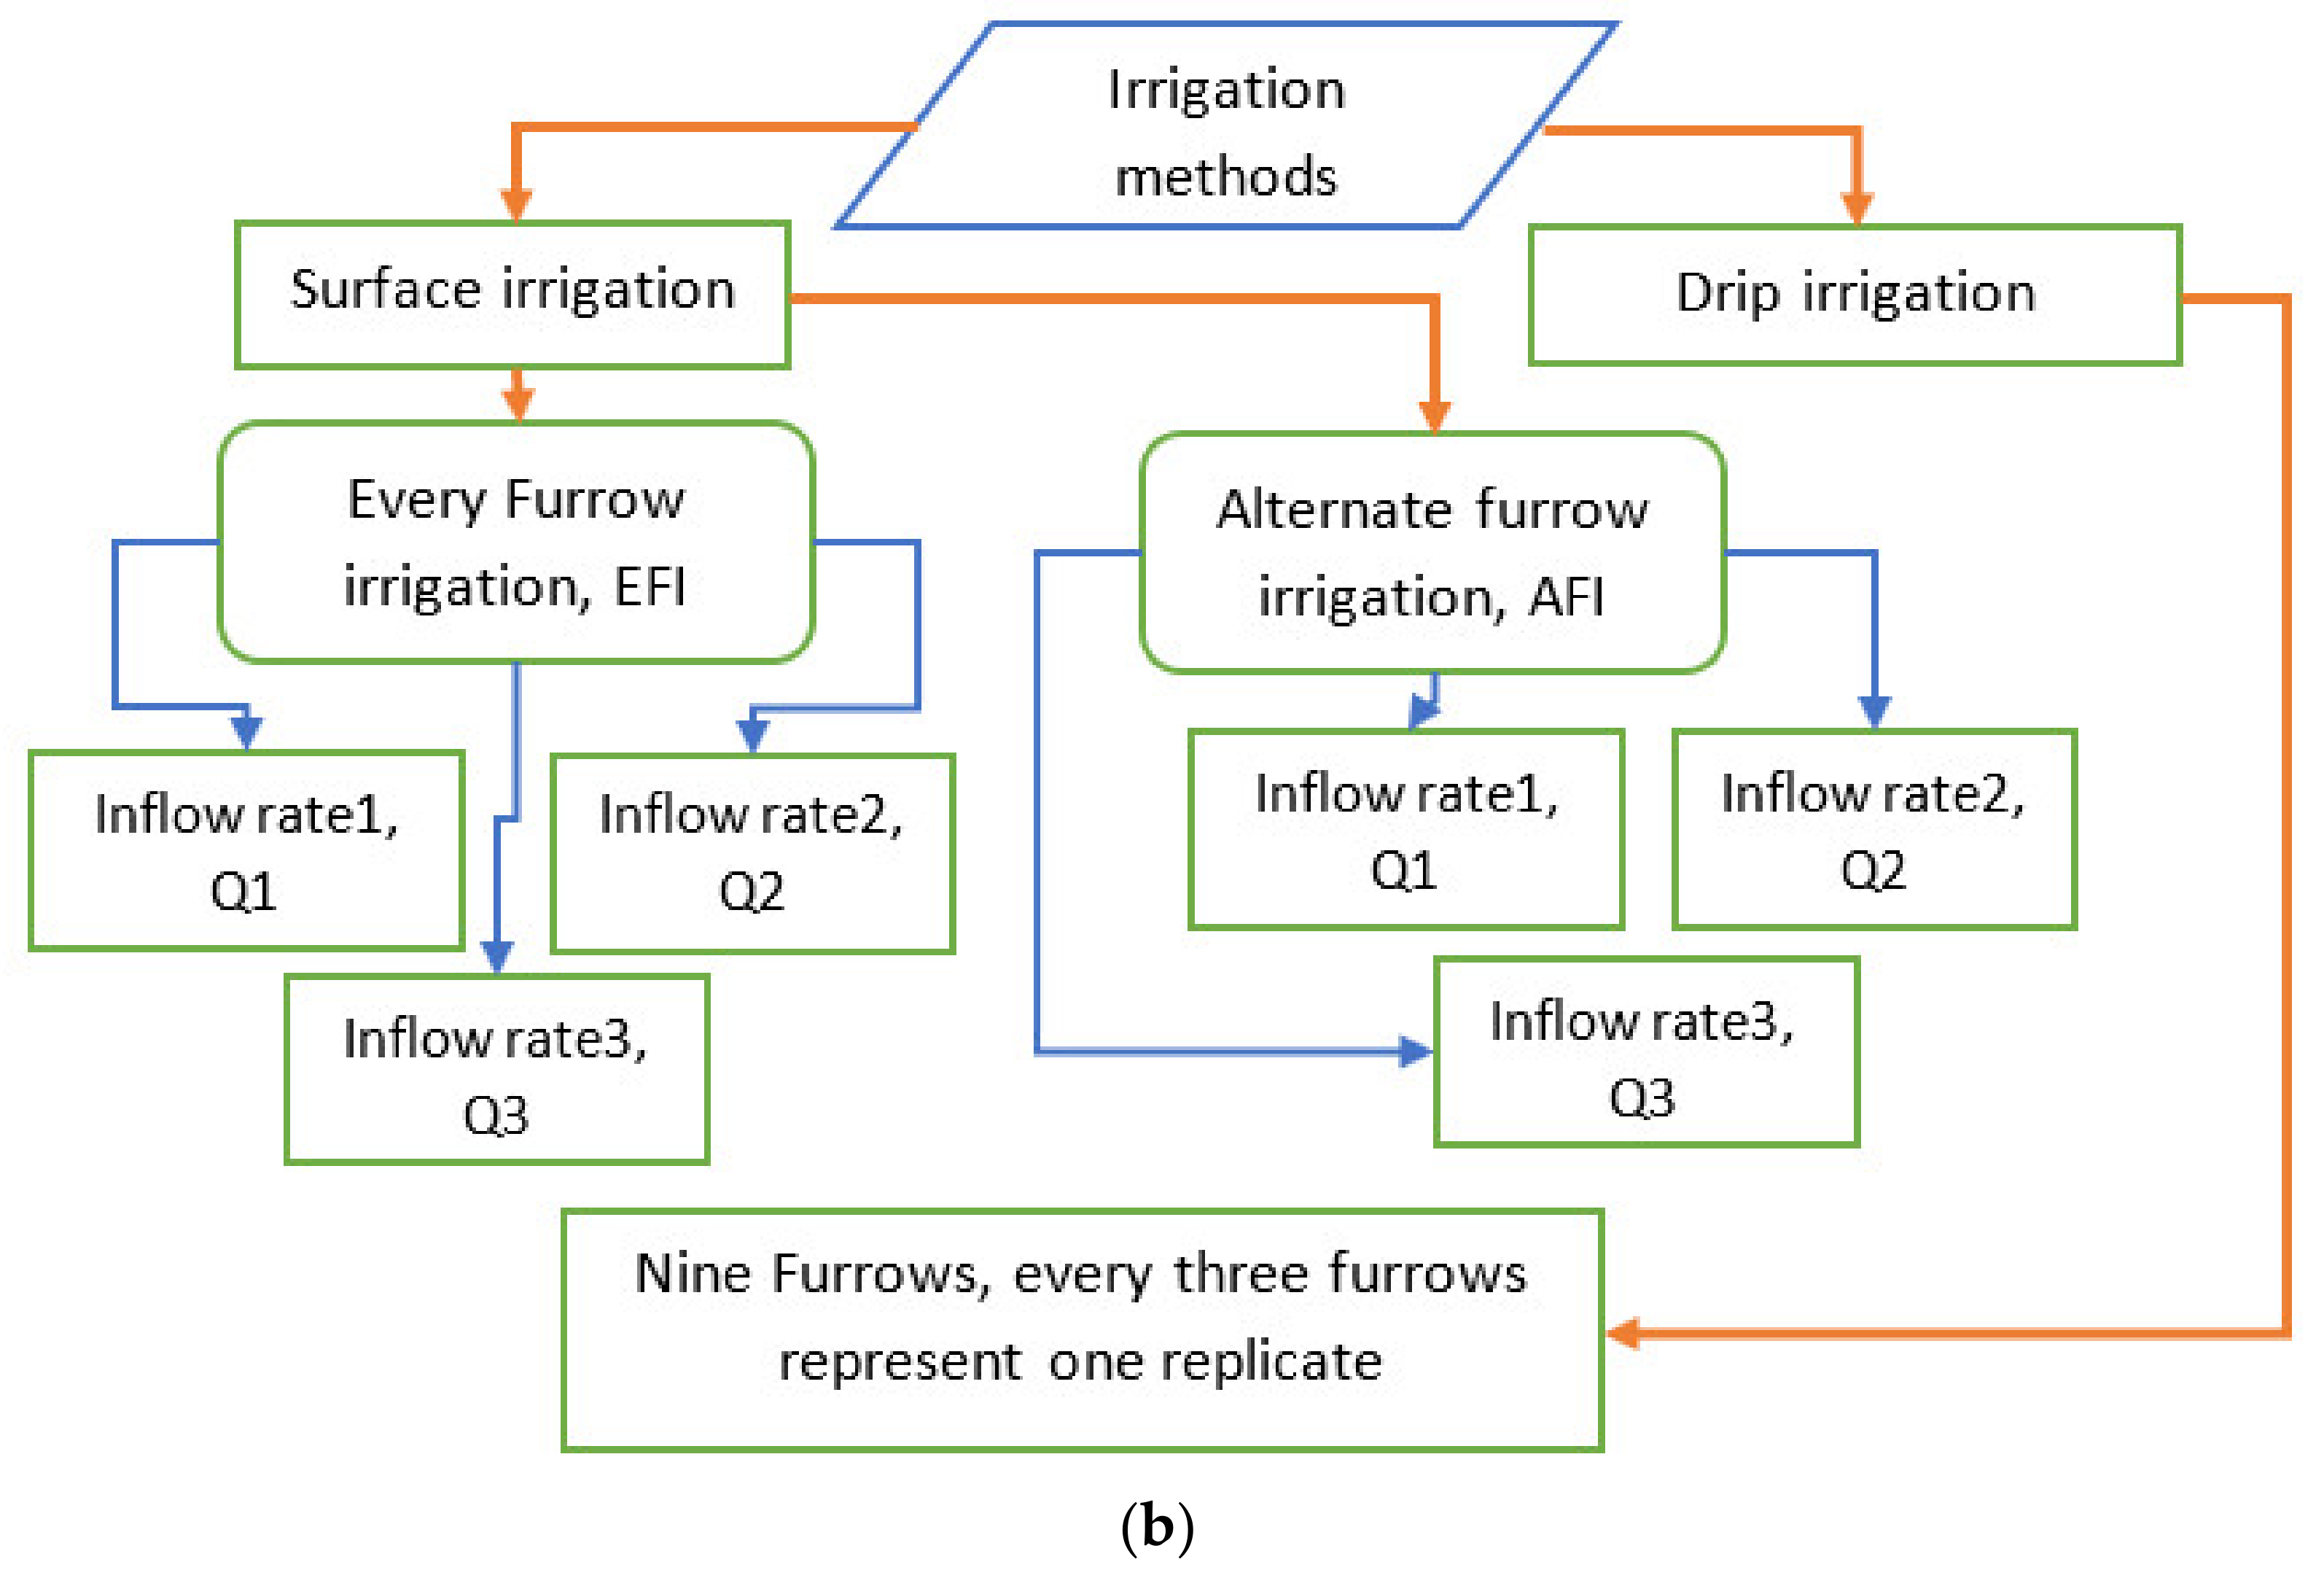
2.2. Experimental Design

The experiments were set up as a split plot design with three replicates. The main plots were allocated to the irrigation method, and the sub-plots were allocated to the inflow rate (as shown in Figure 1a,b). We tested the impact of three irrigation methods—AFI, EFI, and DI—and three inflow rates—0.47 (Q1), 0.95 (Q2), and 1.43 L/s (Q3)—based on soil properties such as infiltration rate (8.57 mm/h), water requirements for cauliflower, and soil erosion. These three rates were adjusted through check valves connected to the exits of irrigation water (flow-meter and control valves) and calibrated by the volumetric method. The EFI + Q1 combination was used as a control. Before starting the experiment, the plots were ploughed twice using a seven-mounted share chisel plough. The soil was levelled at zero slope using LASER levelling equipment. The cauliflower (Syngenta18 variety) was manually transplanted on 1 and 3 October and harvested on 1 and 3 January in the two growing seasons. Cauliflower seedlings were transplanted at a row and plant spacing of 70 × 50 cm, respectively. The agriculture practices followed the main regulations of the Egyptian ministry. Each plot area of the AFI and EFI treatments was 2.8 × 30 m, with a buffer strip of one meter to separate them from each other. The EFI method required two times more irrigated furrows than the AFI treatment. For the drip irrigation network, the main unit comprised a centrifugal pump, screen filter, pressure regulator, pressure gauges, flow-meter, control valves, and chemical injection unit. The main and sub-main lines had diameters of 63 mm and 50 mm, respectively, and were connected with a control valve to regulate the inflow rate to the furrow through flexible pipes. Polyethylene (PE) lateral lines of 16 mm in diameter with built-in drippers (GR of 4 L/h) were also used.

2.3. Irrigation Water Requirements

Water consumption is defined as the total amount of water used in evapotranspiration according to the following formula [37]:
E T c r o p = E T O × K C
where ETcrop is crop water consumptive use (mm/day); ETO is reference evapotranspiration (mm/day); and Kc is the crop coefficient (dimensionless).
FAO CROPWAT 8 was used to calculate the evapotranspiration of cauliflower based on the average of climate data gathered from Sakha meteorological station according to the Penman-Monteith method [38]. The irrigation water requirement for cauliflower was determined using the following equation [39].
W R =   i = N i = 3   θ 2 θ 1 100 × ρ × A × D
where WR is the water requirement (mm); θ 1 is gravimetric soil moisture before the next irrigation; θ 2 is the gravimetric soil moisture percentage 48 h after the irrigation event; D is the soil layer depth; ρ is the soil bulk density (g/cm3); A is the irrigated area; and I is the number of soil layers (1–3).
A time-domain reflectometer (TDR) was used to measure the soil moisture before each irrigation event and 2 days after irrigation. The irrigation water requirement for the drip irrigation system (IR) was calculated using the following equation:
I R = W R × R
where WR is the water requirement and R is the reduction factor, which was recommended by [37] and was estimated to be between 0.25 and 0.90 for the drip initiation system.

2.4. Irrigation Frequency

For the furrow irrigation method, the irrigation frequency was calculated using the following equation:
F = W R E T C
where F is the irrigation frequency; WR is the water requirement (mm); and ETC is crop water consumptive use (mm/day).

2.5. Water Productivity (WP)

WP can be expressed as a physical ratio between yields and water use [40] or between the value of the product and water use [41,42]. Because these concepts can be applied to different scales, it was critical to properly define the measurements used in our experiments. In our research study, WP was defined as the ratio between the actual crop yield and the total water use, in kg·m−3 [43], as follows:
W P = Y a T W U
where WP is the water productivity, kg·m−3; Ya is the total yield, kg; and TWU is the total water use, m3. Water applied before planting was not considered in the total amount, following the work of [44].

2.6. Determination of Performance Indicators for AFI and EFI

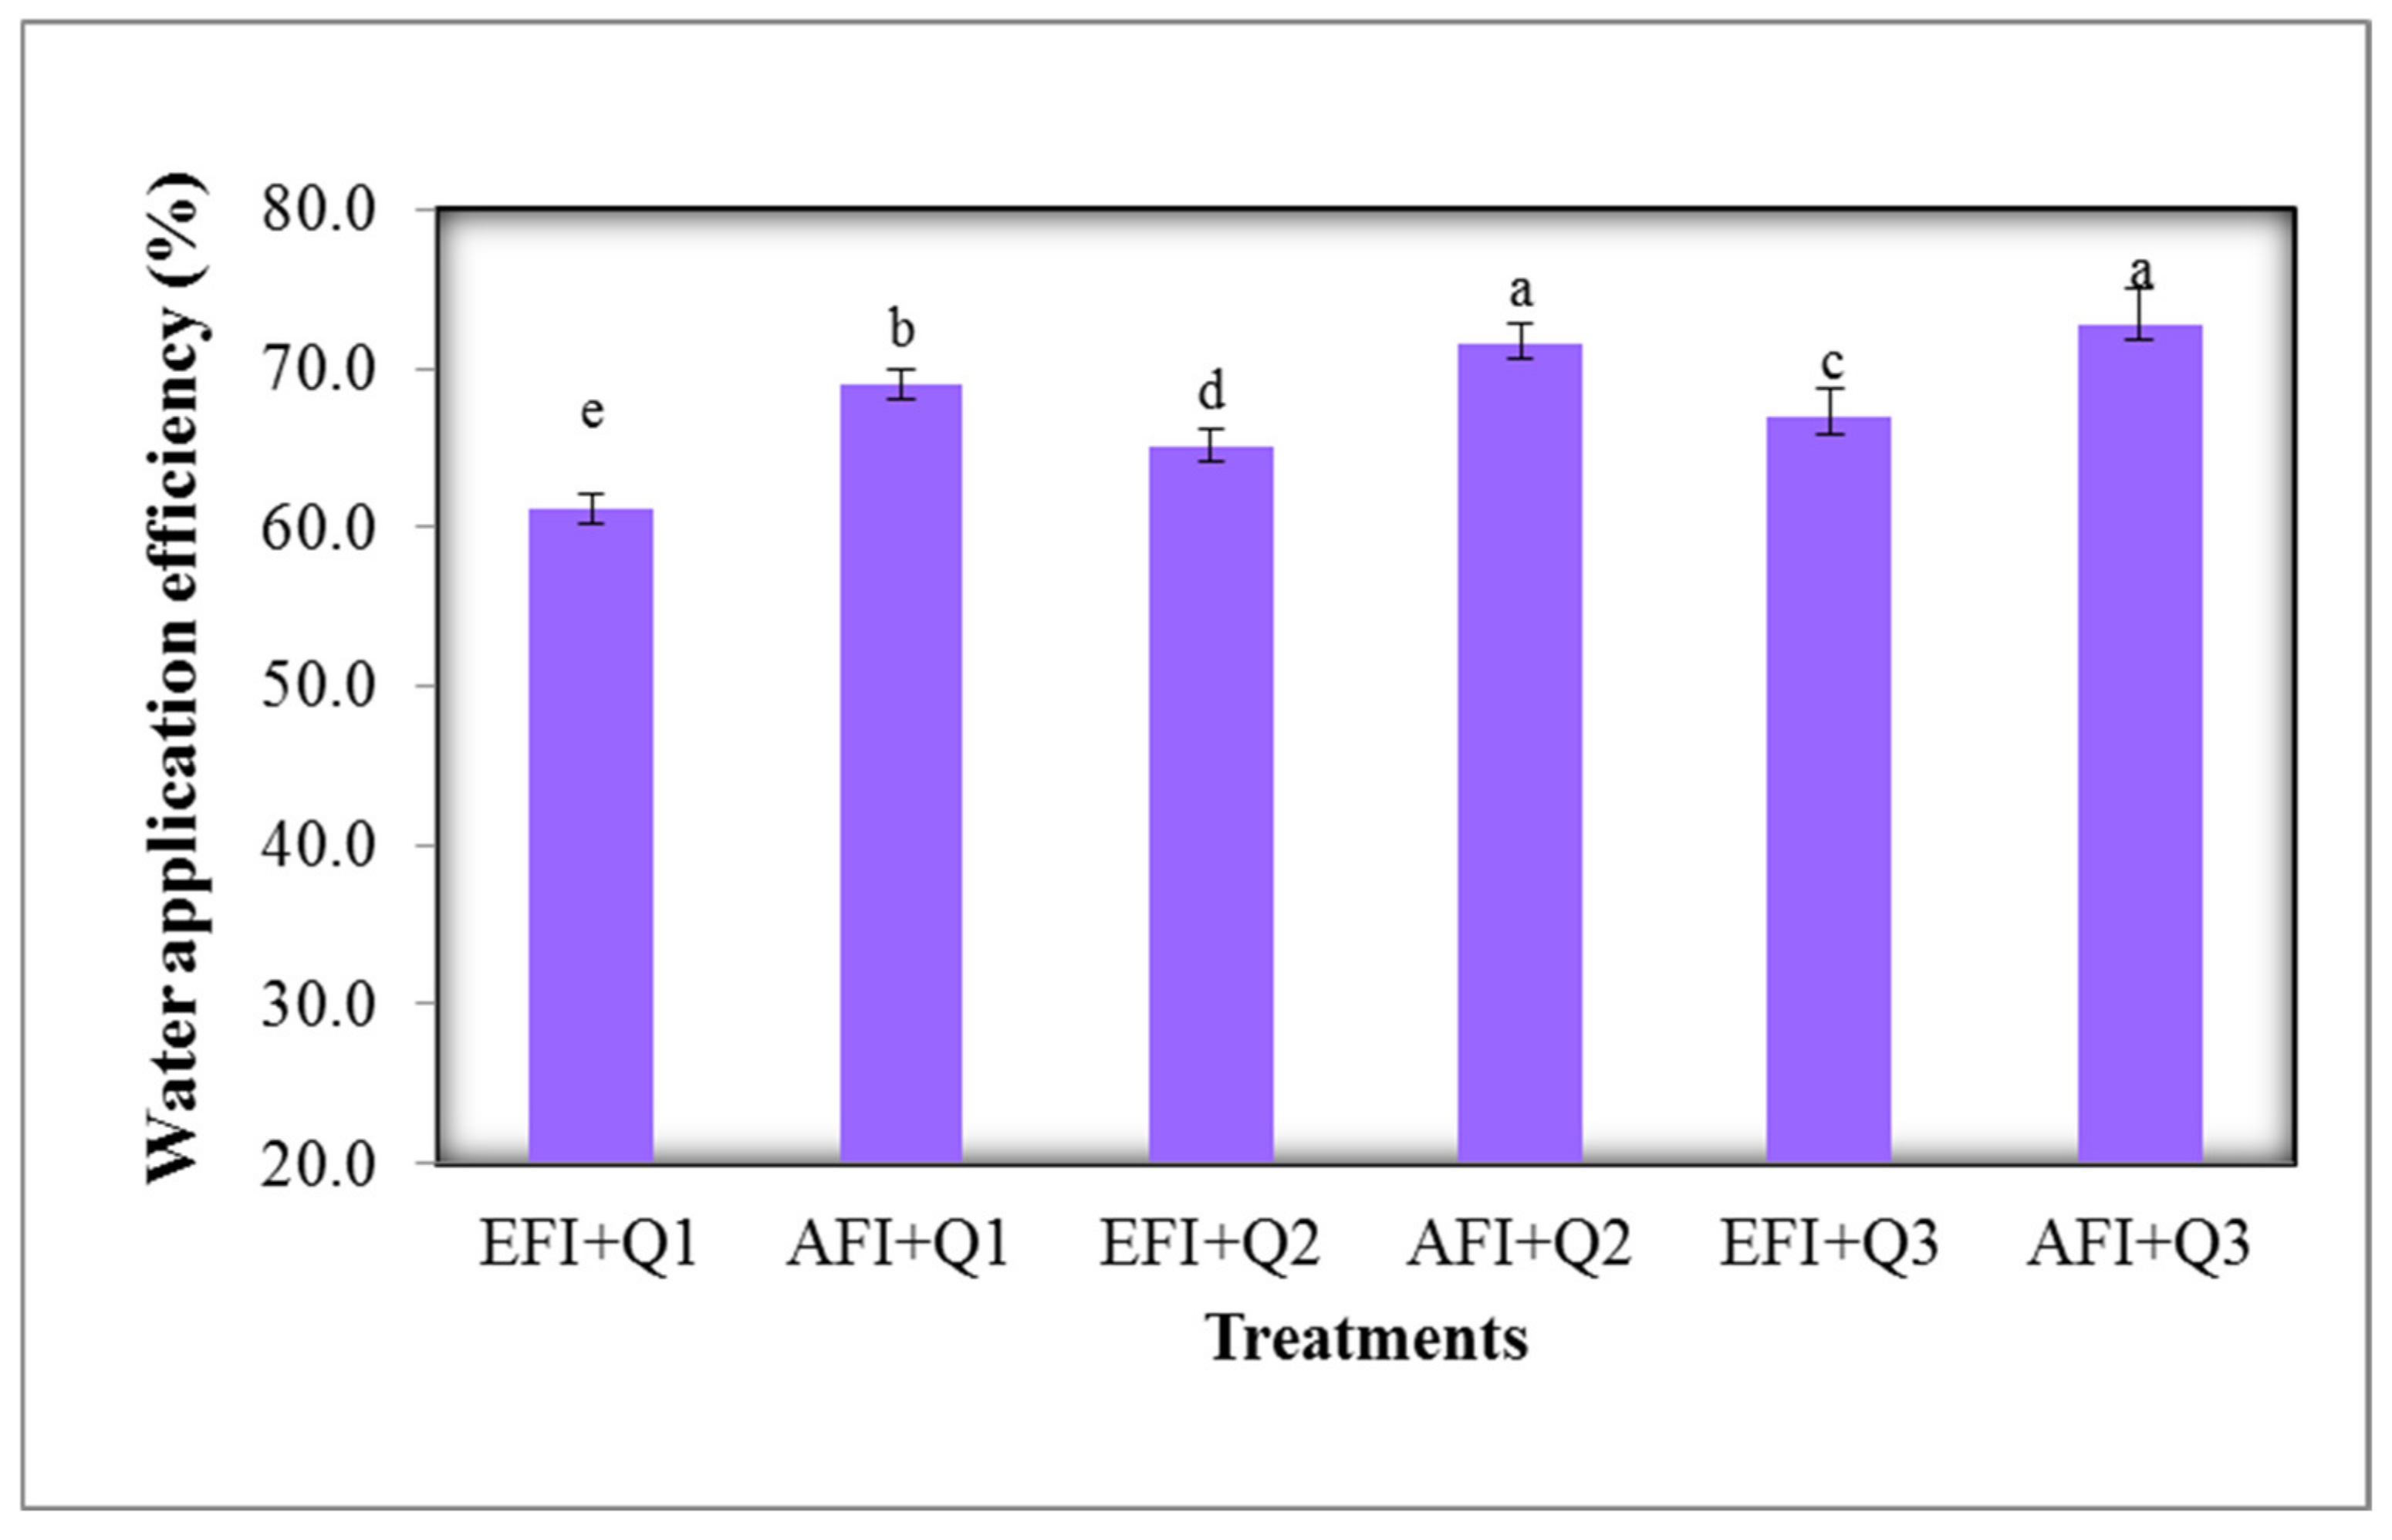
2.6.1. Water Application Efficiency (AE)

AE is the percentage of water stored in the root zone relative to the amount of water applied to the soil. The water application efficiency was determined based on [45] as follows:
A E = W S W F
where AE is the water application efficiency, %; WS is the amount of water stored in the crop root zone, m3; and WF is applied water to the irrigated area in m3.

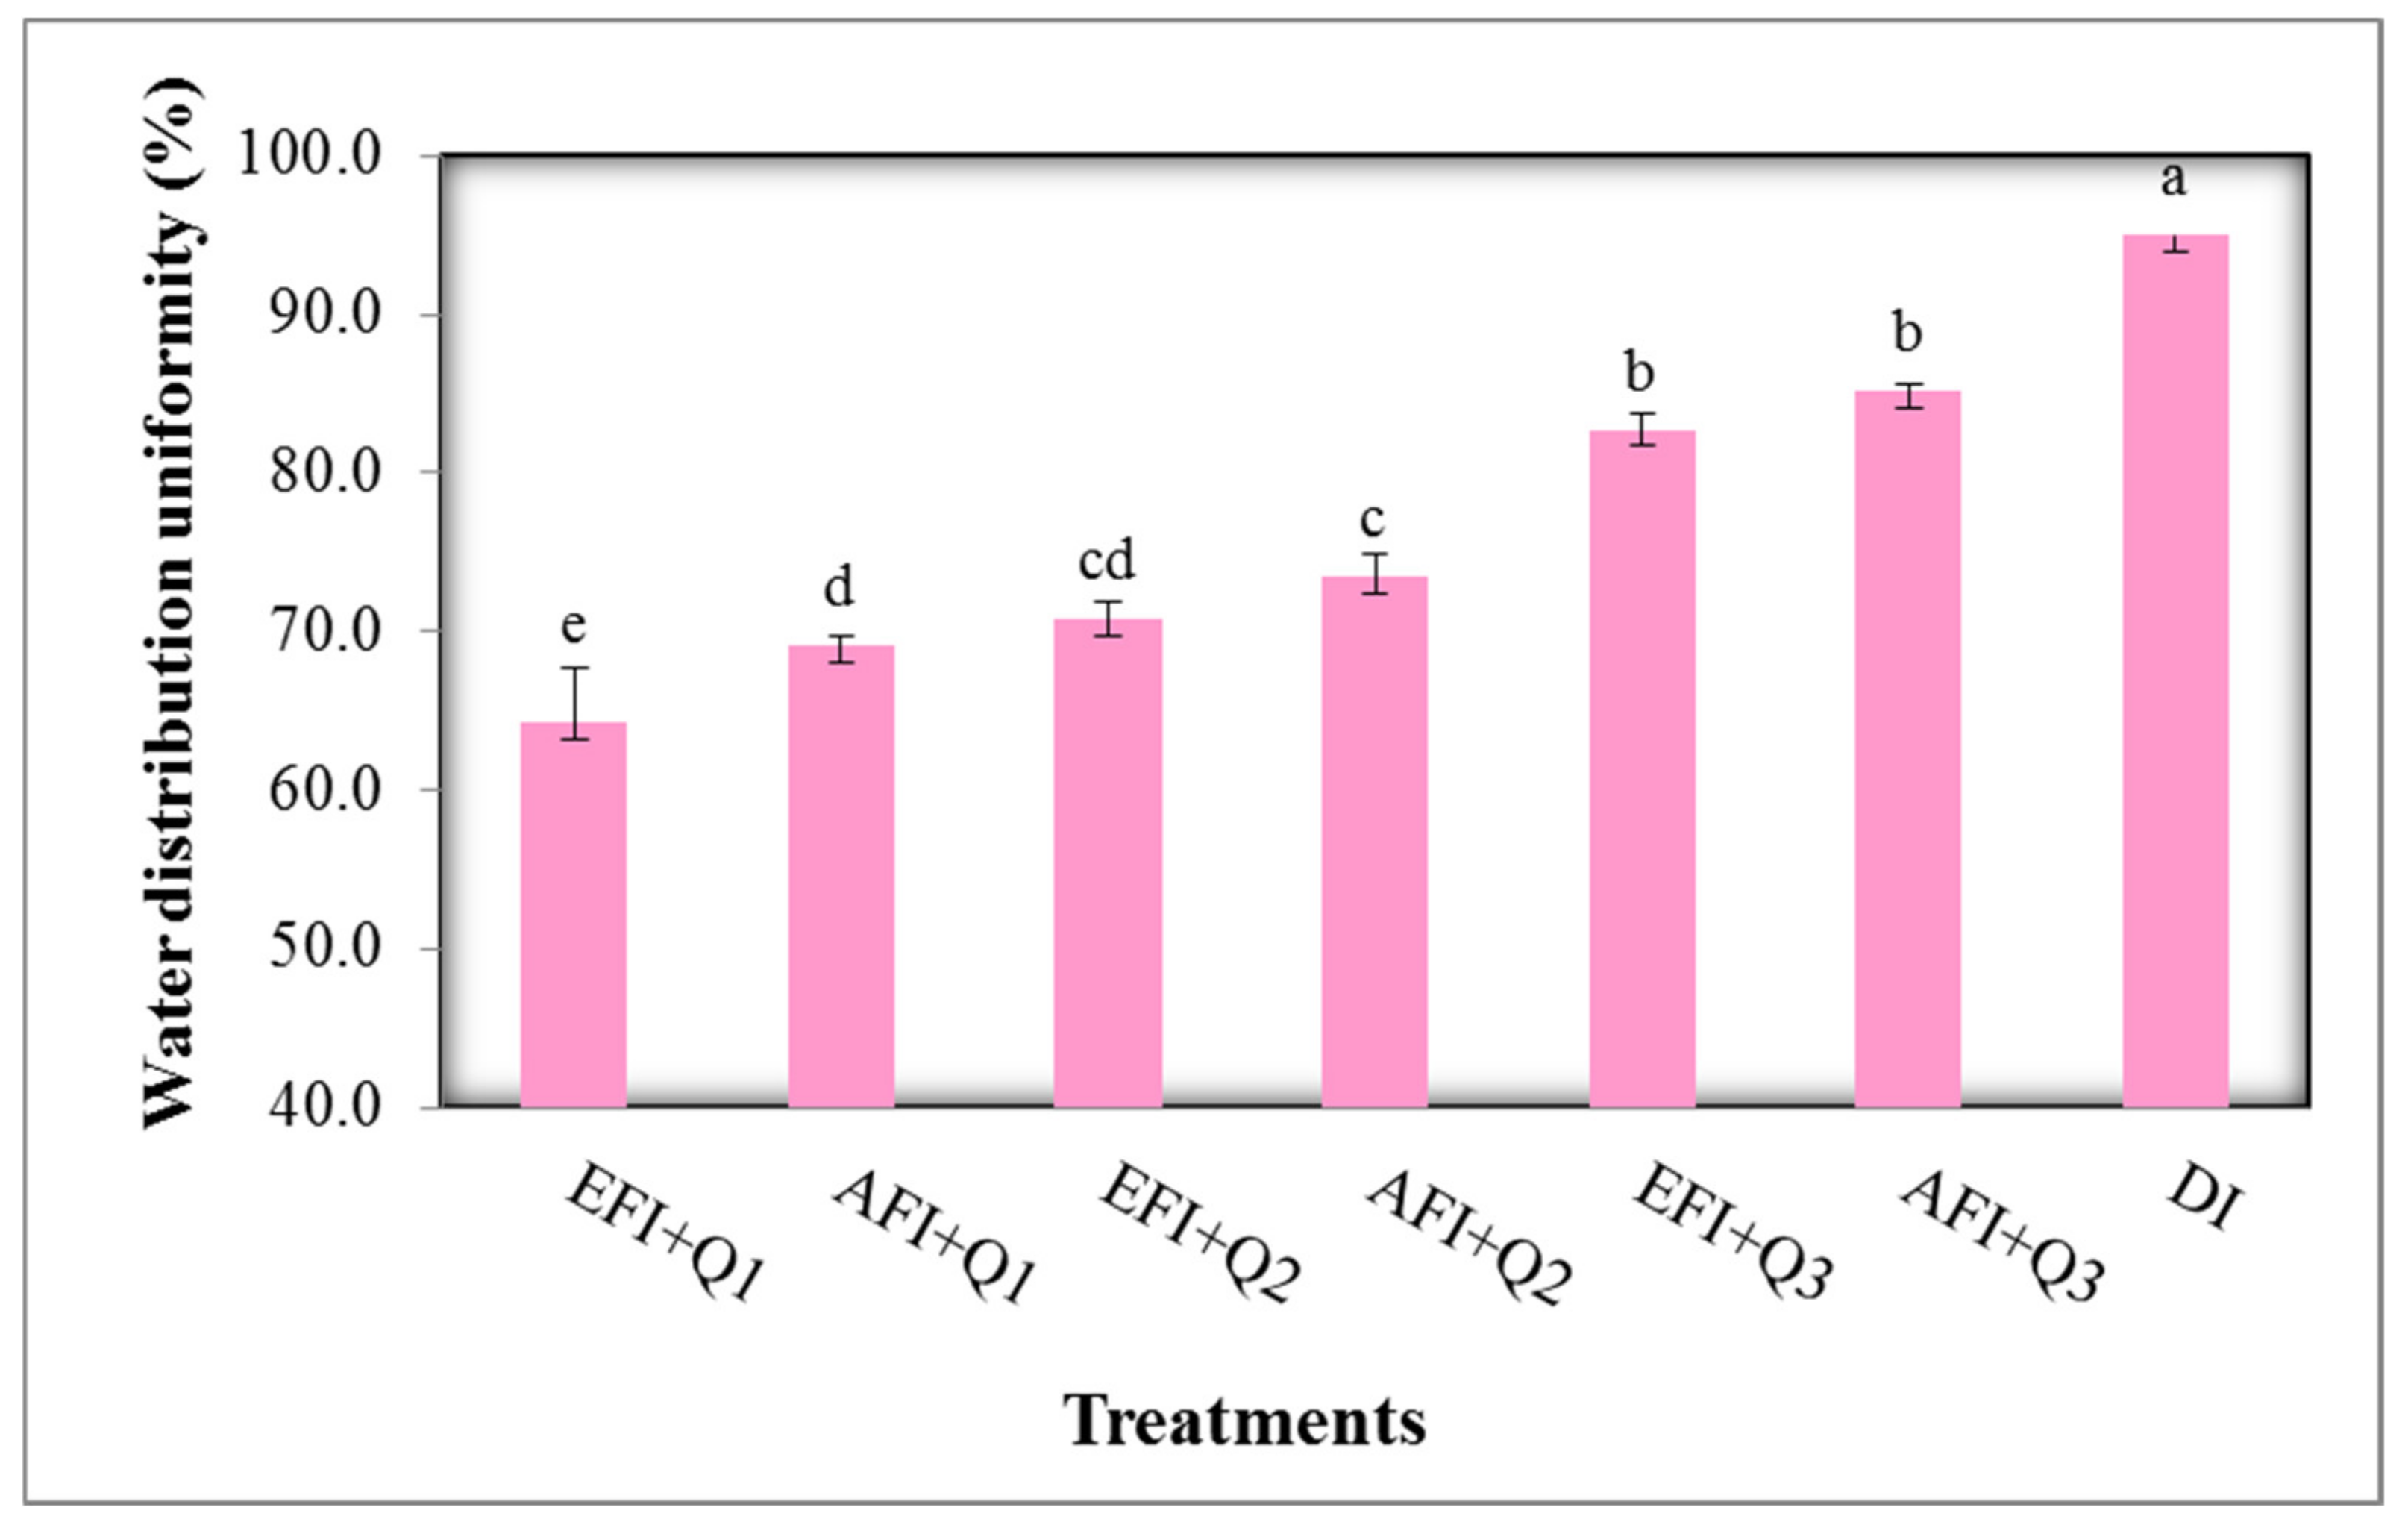
2.6.2. Water Distribution Uniformity (DU)

DU was calculated based on [46] as follows:
D U = X ¯ L Q X ¯
where DU is the distribution uniformity, %; Χ ¯ LQ is low-quarter average depth infiltrated, mm; and Χ ¯ is average depth infiltrated, mm.

2.7. Drip Irrigation Performance

2.7.1. Manufacturer’s Coefficients of Variation

The quality of the processes used to manufacture these emission devices was calculated based on [36] using the following equation:
C V = q 1 2 + q 2 2 + + q n 2 n q ¯ 2 0.5 q ¯ n 1 0.5
where CV is the manufacturer’s coefficient of variation (dimensionless); q1, q2qn represent the discharge rate of emission devices, L/h; n is the number of emitters tested; and q ¯ is the average discharge of the emission devices tested, L/h.

2.7.2. Emission Uniformity (EU)

Emission uniformity is a relative index of the variability between emitters in an irrigation block and is determined based on the following equation according to [36]:
E U = 100 ( 1.0 1.27 N e   C V Q min Q ave
where EU is the emission uniformity, %; Ne is the number of point source emitters per emission point; CV is the manufacturer’s coefficient of variation; Qmin is the minimum emitter discharge rate, L/h; and Qave is the average or design emitter discharge rate; L/h.

2.7.3. Christiansen Uniformity Coefficient

The Christiansen uniformity coefficient (CU) is the difference between the average depth of applied irrigation water and the average absolute deviation from this depth, all divided by the average depth. The uniformity of application was determined with the CU according to the work of [47] as follows:
C U = 1 i = 1 i = n q i q ¯ q ¯ × n × 100
where CU is the Christiansen uniformity coefficient; N is the number of observed emitters or cans; qi is the emitter flow rate, L/h; and q ¯ is the average discharge of the emission devices tested/h.

2.7.4. Water Distribution Uniformity for Drip Irrigation

The distribution uniformity (DU) of drip irrigation is a measure of how uniformly the water is applied to the area being irrigated. DU can be calculated by measuring the flow rate from the sample emitters according to [20] using the following equation:
D U = Q e a t 25 % Q ¯ e × 100 %
where DU is the distribution uniformity, %; Qe at 25% is the average flow rate in the lowest quarter of all the flow rates, L/min; and Q ¯ e is the average flow rate, L/min.

2.8. Determination of Soil Salinity

Using a 1:5 volume-to-volume (EC 1:5 v/v) technique, soil salinity was tested to investigate the influence of irrigation systems on soil salt concentration. We combined 1 part (20 g) soil with 5 parts (100 g) distilled water to form the soil mix. Before the calibrating process, the soil samples were thoroughly ground (scooping). The soil samples were combined in an electric shaker for 30 min before being filtered with filtration sheets. A conductivity metre device (type 4520) was used to test the electrical conductivity (EC) of the final soil extract.

2.9. Statistical Analysis

The experimental data were statistically analysed with a split plot design using CoStat v6. According to Duncan’s test, the treatment mean differences were compared using the least significant difference (LSD) at a probability level of 0.05.

3. Results

3.1. Water Distribution Uniformity of Irrigation Methods

The analysis of variance (ANOVA) revealed that the inflow rate had a significant impact on the DU (p < 0.05), as DU increased as the inflow rate increased. In the first season, the mean values of DU were 66.7, 72.3, and 83.95% for Q1, Q2, and Q3, respectively. In the second season, the mean values were 66.5, 71.85, and 83.80% for Q1, Q2, and Q3, respectively. The effect of the irrigation method on DU was not significant. In the first season, the DU mean values for AFI and EFI were 75.94% and 72.73%, respectively, and in the second season, their mean values were 75.78% and 72.32%, respectively. The interaction between the irrigation method and inflow rate had no significant effect on DU. The maximum value of the DU in the first season was 85.13 for the AFI + Q3 treatment, while the minimum value was 64.53% for the EFI + Q1 treatment when using surface irrigation methods. Similar outcomes were also observed in the second season, as shown in Table 2, and across the two growing seasons as a whole (as shown in Figure 2). However, the maximum value of about 95% was reached with the DI method. Additionally, significant differences were observed between the DU for drip irrigation and other surface irrigation methods.

3.2. Water Application Efficiency of Irrigation Methods

The effect of the inflow rate on AE was highly significant (p < 0.05). The AE increased as the inflow rate increased. In the first season, the mean values of AE were 65.32%, 68.55%, and 69.97% for Q1, Q2, and Q3, respectively. In the second season, the mean values of AE were 64.92%, 68.10%, and 69.68% for Q1, Q2, and Q3, respectively. The differences in AE values between EFI and AFI were highly significant (p < 0.05). The mean values of AE for AFI and EFI were 71.30 and 64.59%, respectively, in the first season and 70.91 and 64.22%, respectively, in the second season. The effects of the interaction between the irrigation method and the inflow rate on AE were not significant. The AFI + Q3 treatment produced the highest AE values in the first and second seasons (72.93 and 72.53%, respectively), whereas the EFI + Q1 treatment produced the lowest values (61.43 and 61.00%, respectively) in both investigated seasons. The mean AE values for both tested seasons are listed in Table 2 and shown in Figure 3.

3.3. Performance of Drip Irrigation Network

Nine lateral lines were used to assess the performance of the drip irrigation network, as shown in Table 3. The manufacturer’s coefficient of variation, emission uniformity, Christiansen uniformity coefficient, and DU had average values of 0.05, 89.26%, 96.00%, and 95.00%, respectively. The highest DU value indicates that enough water was distributed to the lateral lines in the experimental field, implying that the drip irrigation system was properly designed and implemented.

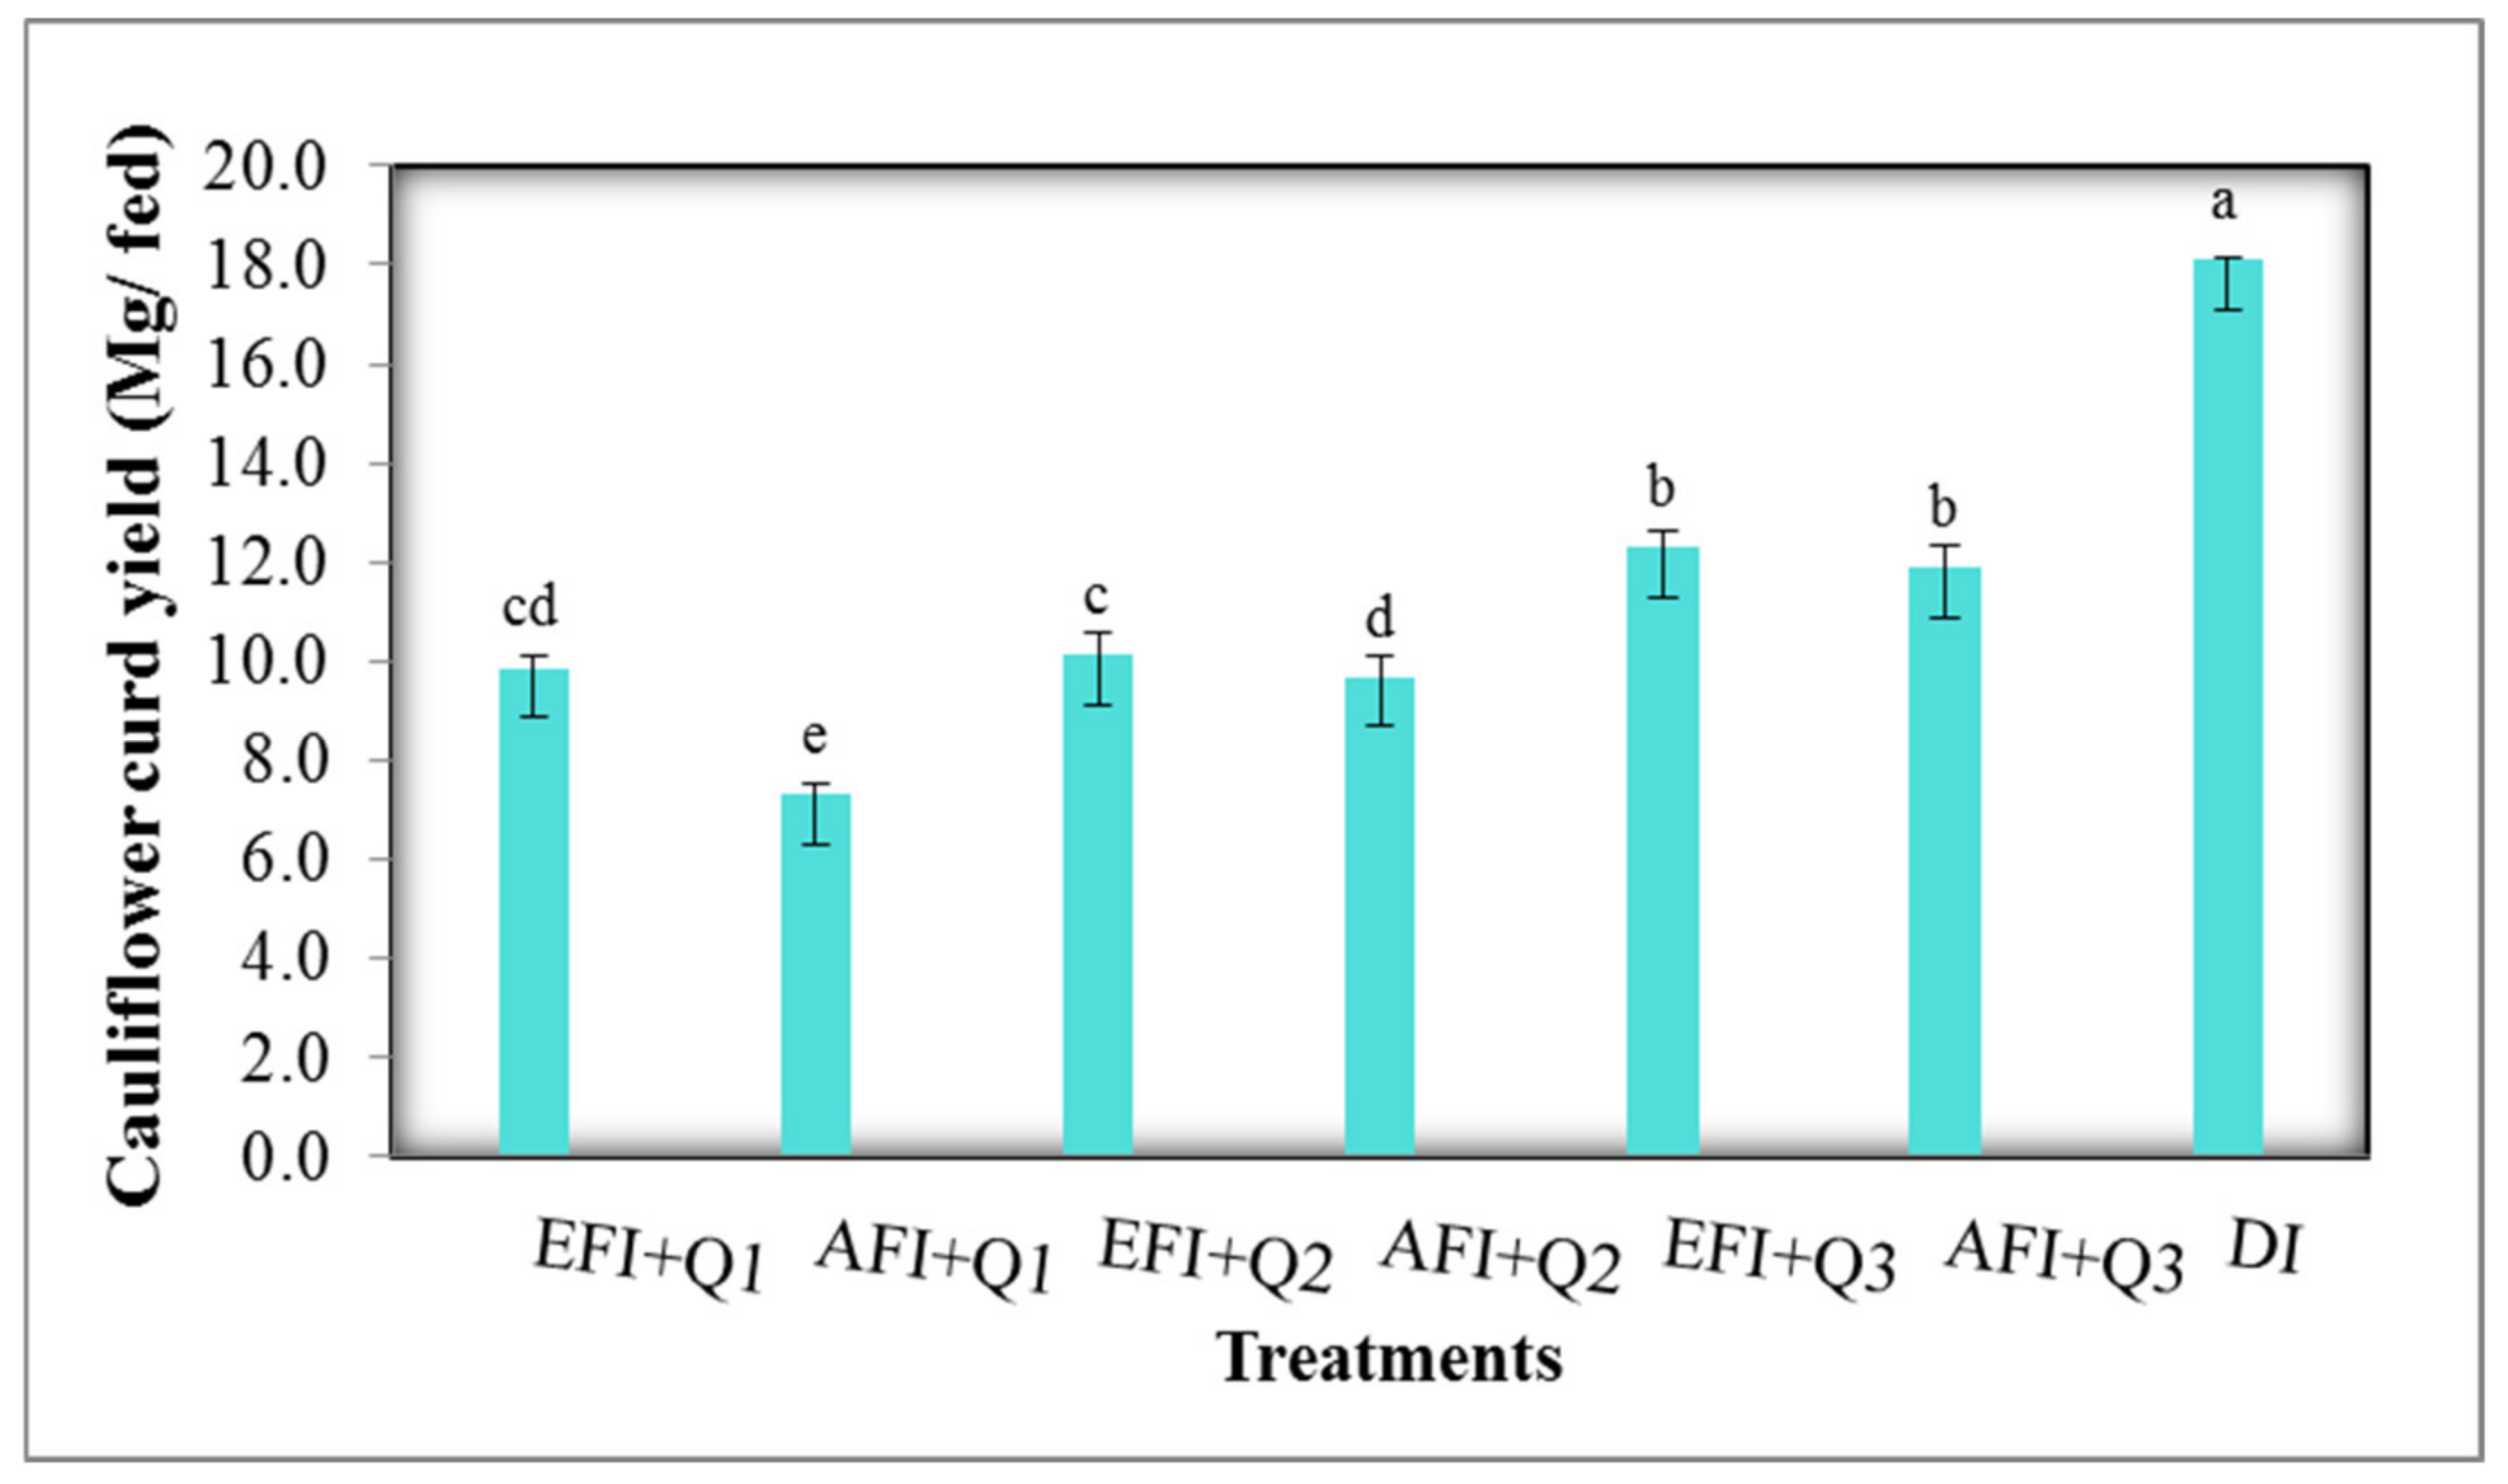
3.4. Cauliflower Curd Yield

The water flow rate had a significant impact on cauliflower curd yield in the first and second seasons (p < 0.05) according to the statistical analysis. Generally, cauliflower curd yield increased as the flow rate increased as a result of the enhanced irrigation uniformity [46]. The results demonstrated that the mean curd yields in the first season were 8.65, 9.84, and 12.06 Mg·fed−1 for Q1, Q2, and Q3, respectively. A similar pattern was observed in the second season, with curd yields of 8.54, 9.96, and 12.13 Mg·fed−1 for Q1, Q2, and Q3, respectively. The difference in the curd yield between EFI and AFI was significant (p < 0.05), with respective values of 10.68 and 9.68 Mg·fed−1 in the first season and 10.84 and 9.58 Mg·fed−1 in the second season (Table 4). Cauliflower yield was also influenced by the interaction between the watering method and flow rate. In the second season, the EFI + Q3 combination treatment yielded the greatest output of 12.24 Mg·fed−1, followed by the AFI + Q3 combination treatment, which produced 11.87 Mg·fed−1. The use of the AFI + Q1 treatment resulted in the lowest yield of 7.16 Mg·fed−1 (Table 4). The mean yield values for the two investigated seasons are shown in Figure 4, with maximum mean values of 18.12, 12.285, and 11.905 Mg·fed−1 for DI, EFI + Q3, and AFI + Q3, respectively.

3.5. Water Productivity (WP) of Cauliflower

WP was significantly (p < 0.05) impacted by the various flow rates for both investigated seasons, as shown in Table 4 and Figure 5. In the first season, the WP values for Q1, Q2, and Q3 were 3.54, 5.07, and 5.67 kg/m3, respectively. In the second season, the WP values were 3.48, 4.29, and 5.70 kg/m3 for Q1, Q2, and Q3, respectively. The WP values observed with EFI and AFI were 4.47 and 5.05 kg/m3 in the first season and 4.28 and 4.70 kg/m3 in second season, respectively. The interaction between the irrigation method and flow rate had a highly significant (p < 0.05) impact on WP values. The AFI + Q3 treatment resulted in the highest WP values of 6.22 and 6.26 kg/m3 for the first and second seasons, respectively, whereas the AFI + Q1 treatment led to the lowest values of 3.41 and 3.27 kg/m3 for the first and second seasons, respectively. The drip irrigation system produced the highest WP value because the amount of applied irrigation water was less than that of the every furrow and AFI methods.

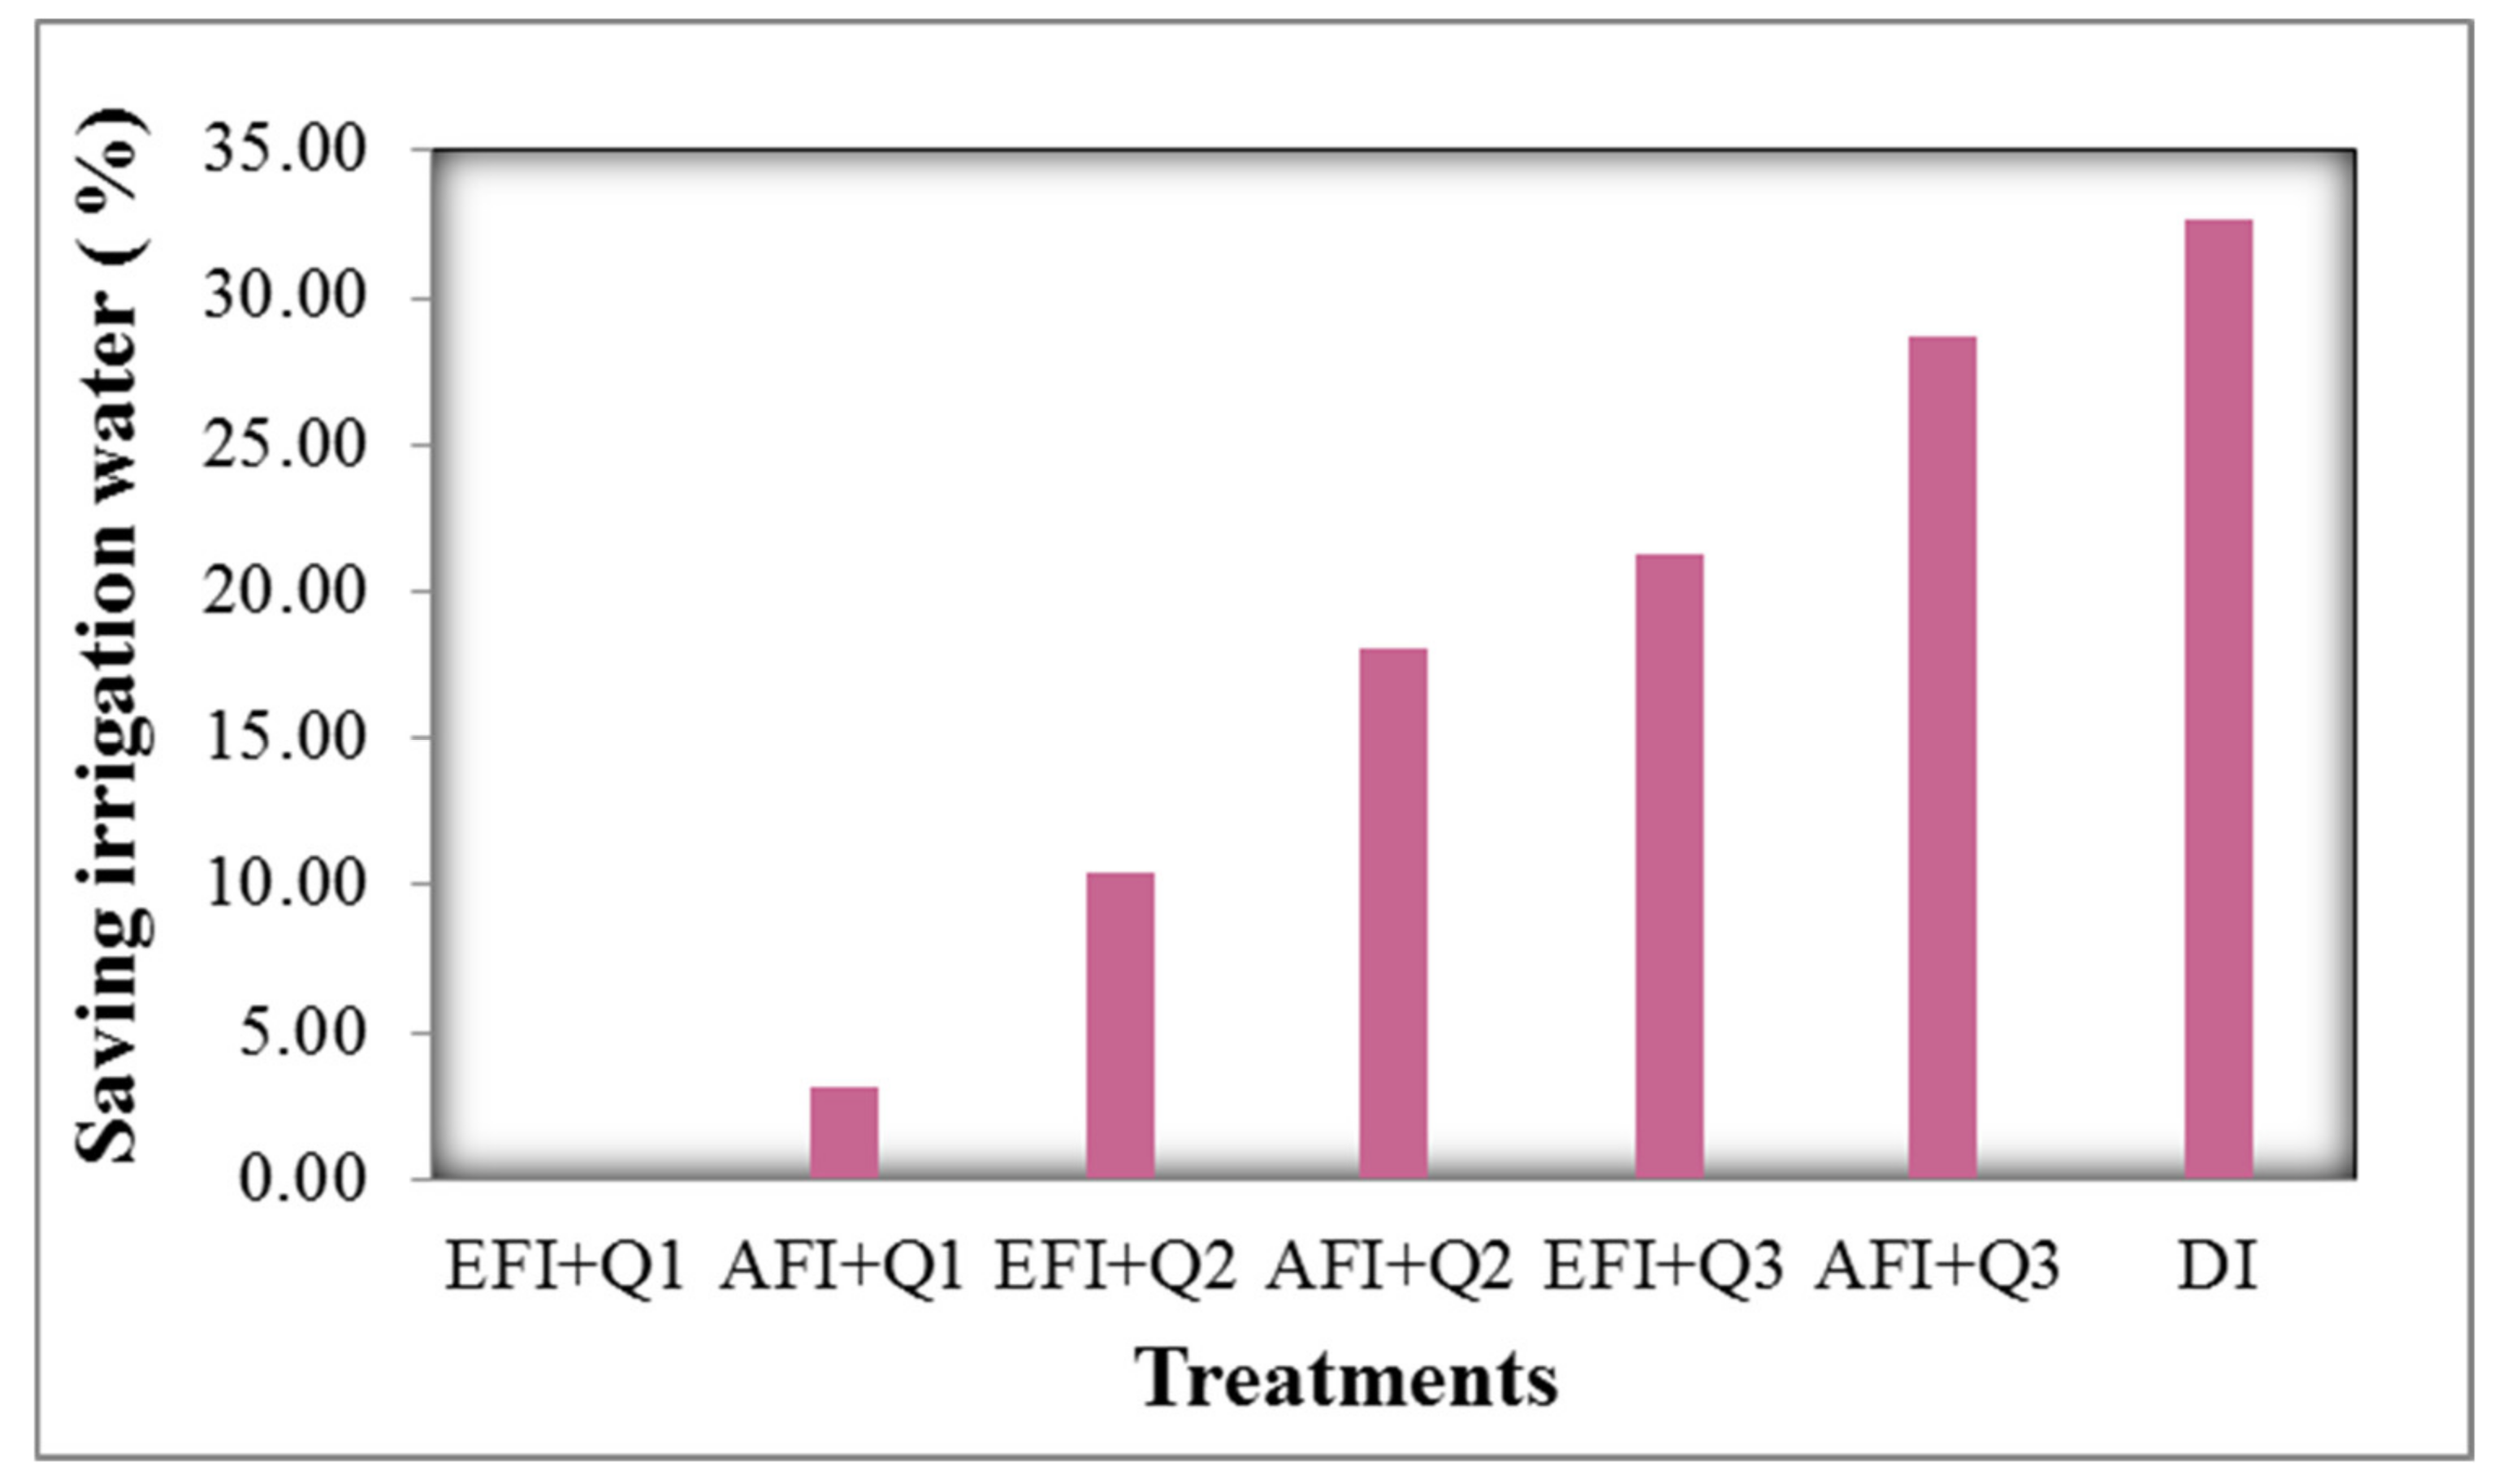
3.6. Applied Irrigation Water
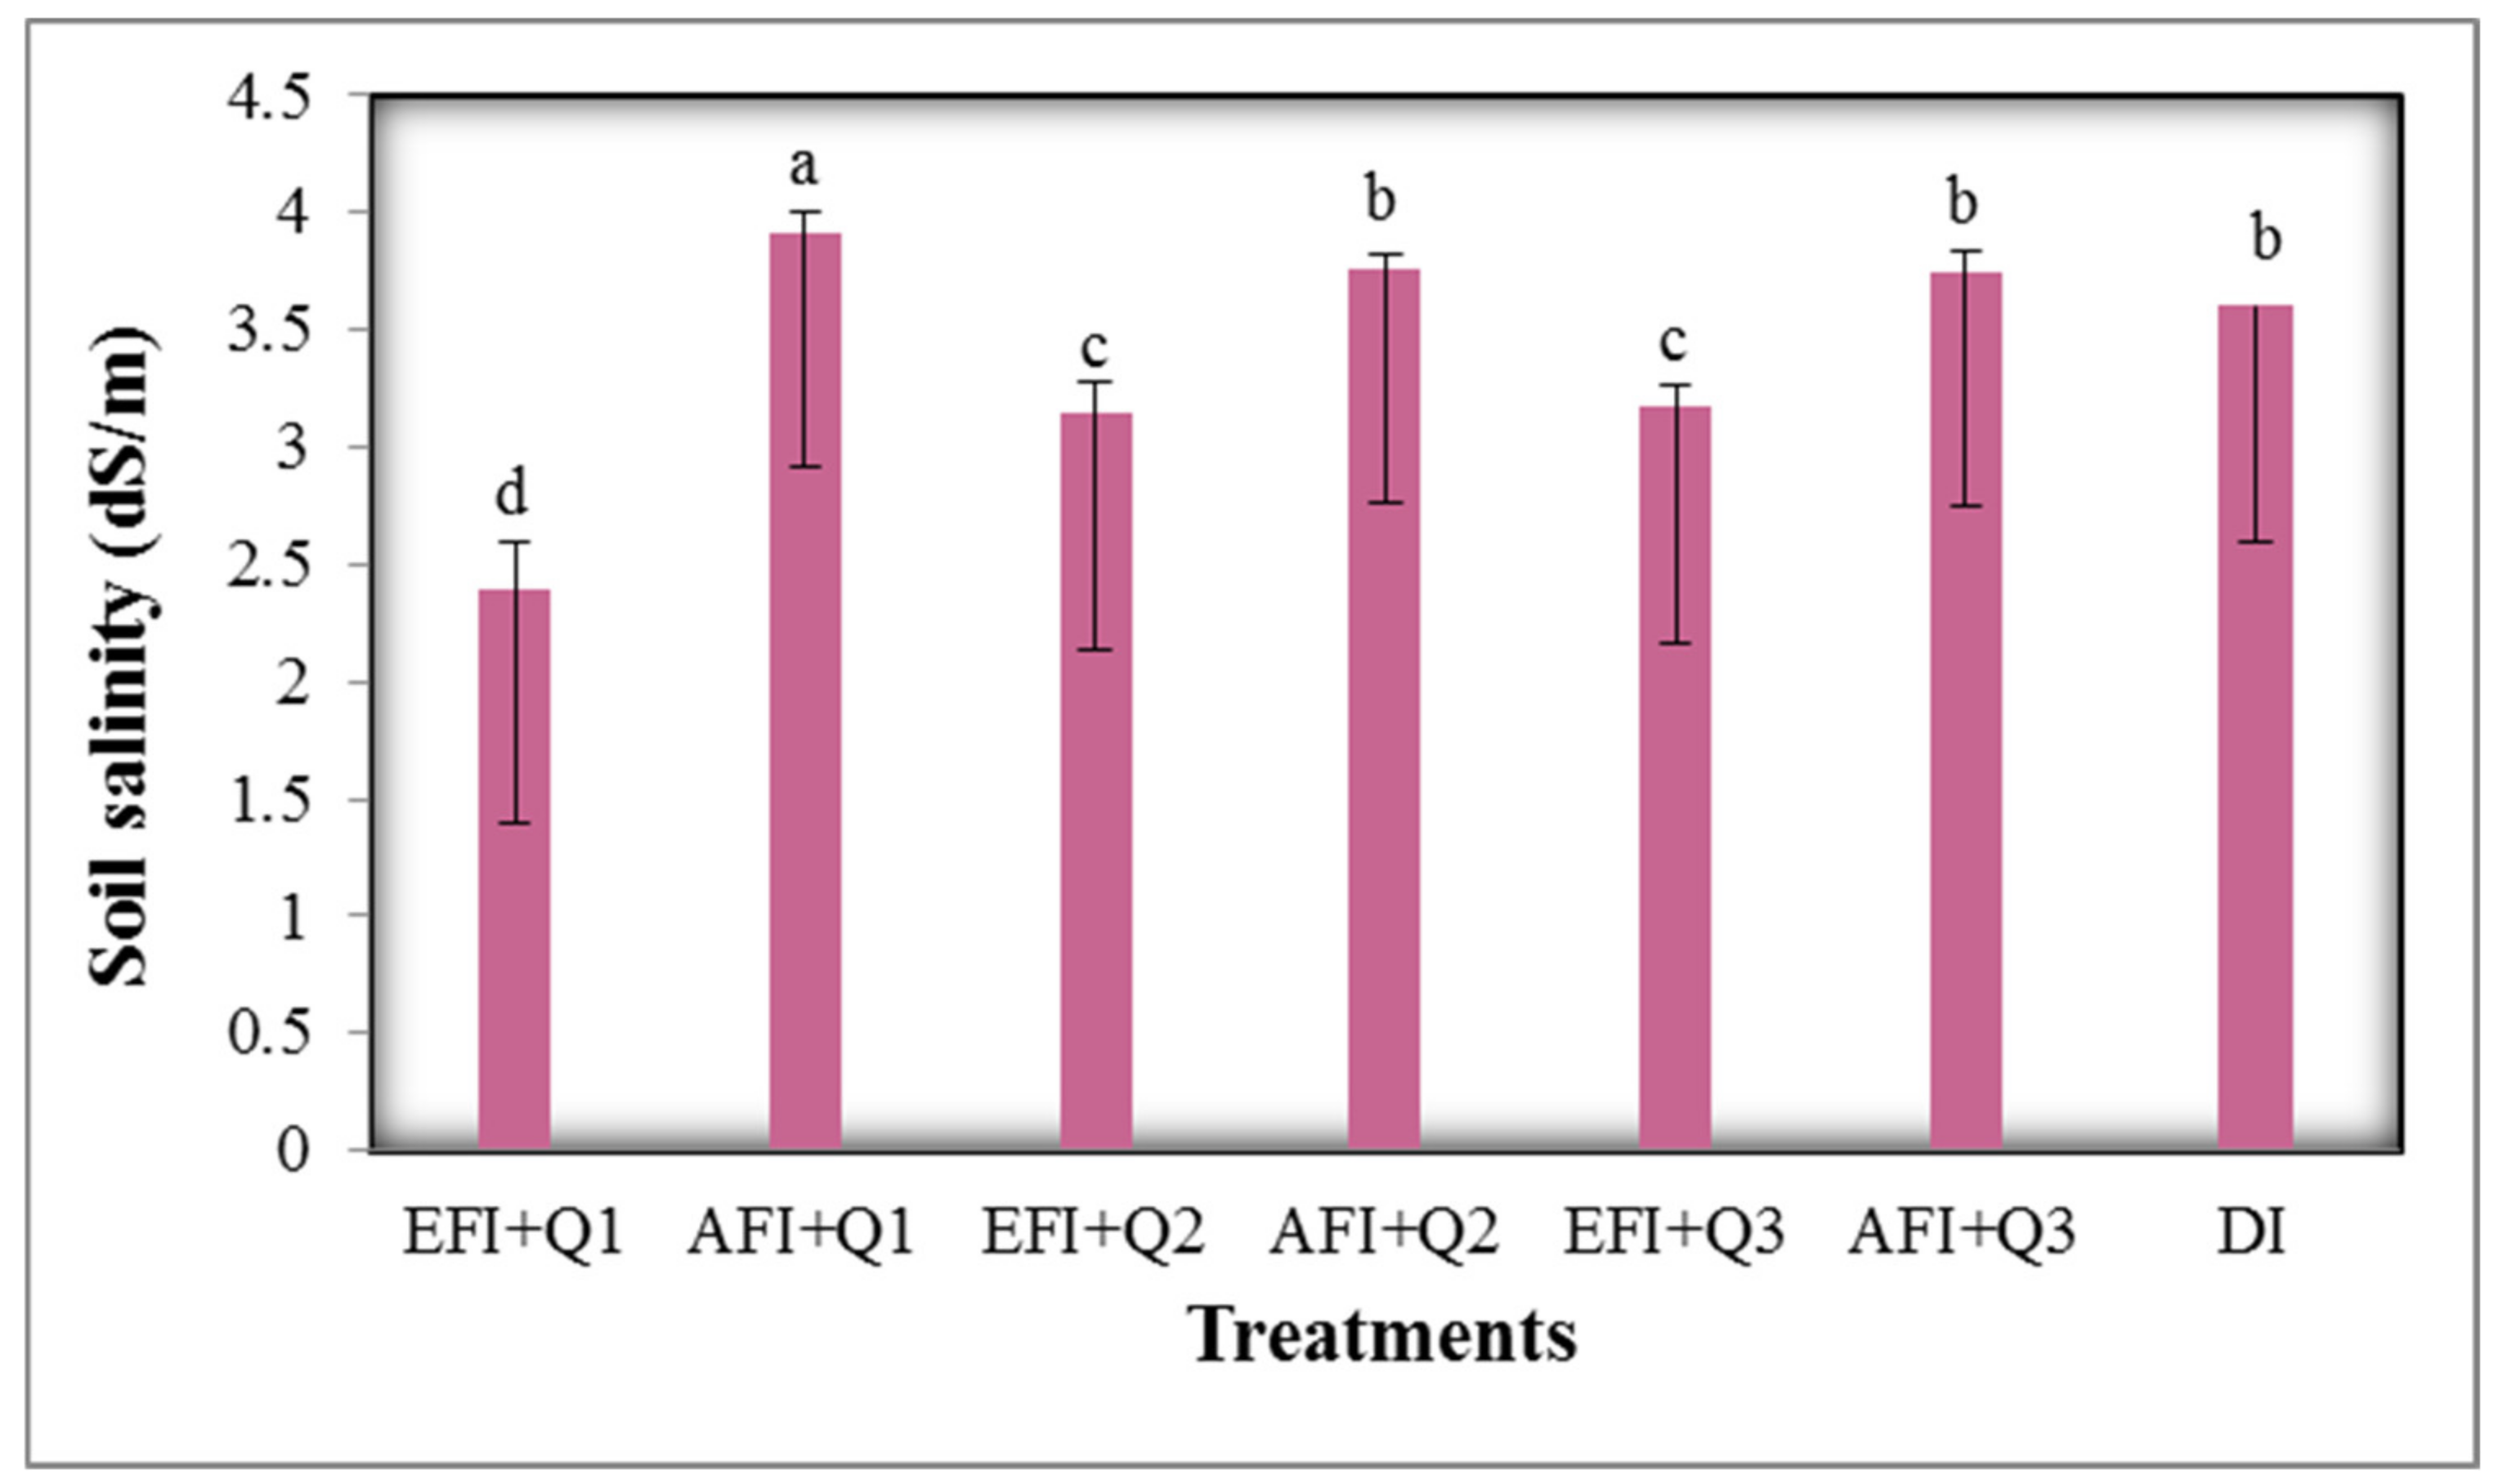
The amounts of applied irrigation water were 2672, 2190, 2587, 2105, 2392, 1905, and 1800 m3/fed for the EFI + Q1, AFI + Q1, EFI + Q2, AFI + Q2, EFI + Q3, AFI + Q3, and DI methods, respectively. During the early stages of growth, excess water can limit root and crop development. Cauliflower’s vulnerability to water stress requires proper watering rates. The amount of irrigation water applied to the field varied based on the irrigation method and flow rates. Excess irrigation water can induce water logging, water leaching, and lower yields, whereas insufficient irrigation rates can cause water stress and reduced yields. Our results showed that the percentages of irrigation-water-saving were 32.63, 28.71, 21.22, 18.04, 10.48, and 3.18% when using the DI, AFI + Q3, AFI + Q2, AFI + Q1, EFI + Q3, and EFI + Q2 treatments, respectively, compared with the control (EFI + Q1) treatment, as shown in Figure 6.

3.7. Soil Salinity

Analyses of variance revealed that the effect of flow rate on soil salinity was highly significant (p < 0.05). Soil salinity increased as the flow rate increased. In the first season, the mean soil salinity levels were 3.16, 3.45, and 3.46 dS/m for Q1, Q2, and Q3, respectively, but the soil salinity values for Q2 and Q3 were not significant (Table 5). During the second season, a similar trend was observed. In the first and second seasons, the mean soil salinity levels were 3.82 and 3.81 dS/m and 2.89 and 2.91 dS/m for AFI and EFI, respectively (Table 5). The interaction between the irrigation methods and flow rates resulted in a highly significant effect on soil salinity (p < 0.05). The mean values of soil salinity for the two tested seasons are shown in Figure 7. The minimum soil salinity of 2.39 dS/m was observed with the EFI + Q1 treatment. During both seasons, the average value using the drip irrigation system was 3.60 dS/m. Regardless of the irrigation method used, the Q2 and Q3 flow rates led to higher soil salinity. These changes could have been due to faster water movements in shorter periods of time, resulting in less infiltration and, consequently, less salt leaching.

4. Discussion

Water scarcity is one of the most limiting factors for crop productivity in any region worldwide, and enhancing the WP of various agricultural crops is essential to sustain rapid population growth. Traditional furrow irrigation techniques should be improved in many arid and semi-arid areas because of the fast depletion of water resources [8]. In this sense, reliable irrigation techniques (e.g., alternate furrow irrigation and AFI) that reduce irrigation regimes are of considerable interest and should be examined. In our experiments, the DU values increased with the increasing water inflow rates, because increasing the inflow rate could lead to a decrease in the difference in soil moisture content along the furrow. Because the soil moisture content was higher in the horizontal direction than the vertical direction, the DU values of the alternative irrigation method were greater than the conventional irrigation method, as the moisture content in the vertical direction was subject to more water loss due to deep infiltration with the EFI method [48]. This indicates that the root system may partially compensate for the increasingly limited water availability on the non-irrigated side of alternative furrow irrigation due to increased water conductivity within the roots. The DU along the furrow was found to increase as a result of these adjustments when comparing AFI to fixed row irrigation, and greater hydraulic gradients have been observed at the soil-roots interface [27]. Thus, DU increases as the inflow rate falls. As the inflow rate decreases, it takes a longer time for irrigation water to advance along a furrow, and this longer advance time leads to more homogeneous water infiltration into the soil along the furrow [49]. According to a previous study [50], a DU of greater than 87% implies that a drip network is functioning excellently. In our work, the DU values fell above this value, and the highest DU value indicates that enough water was distributed to the lateral lines in the experimental field, thus implying that the drip irrigation system was properly designed and implemented. These findings, which were interpreted in terms of water inflow rate, must be determined for each field condition based on various indicators including slope, advance phase, intake opportunity time, furrow length, and application depth, according to Mintesinot et al. [51]. Irrigation management can use alternately blocked furrows to enhance water distribution uniformity, contributing to better furrow irrigation performance through the examination of the effect of the water infiltration profile on blocked furrow irrigation performance under field conditions. Variations in water-advance time along a furrow are primarily responsible for infiltration-opportunity time variations, which lead to non-uniform water infiltration profiles according to [52]. In our study, the water DU in alternately blocked furrows increased and the infiltrated water depths at the end of the field were larger than at the beginning of the field, allowing for a more adequate management strategy with a shorter water application time [53]. The soil moisture contents of the two adjoining furrows in AFI remained different until the next irrigation, with the previously irrigated furrow having a higher water content. As a result of this soil moisture distribution pattern in the crop root zone, the uniformity of soil moisture distribution in the AFI treatments did not noticeably change when irrigation amounts were reduced [53]. The difference in wetting time between the head and tail of the furrow was reduced as inflow rates increased [54].
When the inflow rate is high, the water reaches the end of a furrow faster, and vice versa. Under these conditions, less water penetrates into soil layers and will be lost through deep infiltration. Our study suggests that the AFI method is more efficient than the EFI method, because the amount of water added was shown to reduce the area of the wetted perimeter. Our findings are consistent with those obtained by Assefa et al. [54] and other previously published reports [55]. The water application efficiency values for the EFI method were within the acceptable ranges described by Rogers et al. [56]. Shorter lengths of water contact with the soil surface and smaller volumes of water held in the furrow led to limited water infiltration and, consequently, smaller deep percolation losses along the furrow, thus resulting in improved application efficiency.
Generally, cauliflower curd yield increased as the inflow rate increased due to the enhanced irrigation uniformity achieved by higher inflow rates [49]. A small decrease in cauliflower yield with AFI compared with EFI was also reported by Assefa et al. [54], who found that AFI may result in lower yields because a small amount of water is applied, particularly when evaporation rates are high. A key cause could be that AFI results in the aeration of roots in the soil, as well as improved soil structure and moisture content [57]. Though irrigation water ponds at the furrow ends after irrigation events were blamed for the EFI system’s lower yield, too much water may have contributed to the poor aeration of roots and soil nutrient-leaching [58]. We found in our study that the DI presented a higher cauliflower curd yield than AFI and EFI.
It was obvious that AFI produced the highest WP values following the use of DI because the amount of applied irrigation water was less than that of the every furrow and AFI methods. The water savings obtained with our efficient design helped us increase crop productivity. Although the WP of pressurised irrigation systems (sprinkler or drip) is higher than that of conventional surface irrigation methods, the optimum selection of irrigation methods allows for better resource utilisation, increased productivity, and improved crop output [19].
Using the AFI technique was shown to save irrigation water by reducing the wetted surface area, which leads to less evapotranspiration and deep percolation. Our findings are in agreement with those of previous studies [59,60]. Water can be applied in amounts and rates sufficient to meet maximum evapotranspiration demands while saving more irrigation water after drip irrigation was used. The AFI technique was previously shown to be able to save water by about 60% (in a two-year experiment) compared with conventional furrow irrigation. It was found that the lowest amount of applied irrigation water in comparison with that in the conventional furrow method may have been a result of large decreases in the wetted surface area. In this context, the AFI irrigation technique can be robust when applying irrigation water because of its ability to remarkably reduce the size of wetted surfaces, thus resulting in less evaporation and deep percolation [61].
Drought and high salinity are among the most important environmental factors that severely limit plant growth, plant development, and (hence) agricultural productivity, following plant water status [62]. Regardless of the irrigation method used, the Q2 and Q3 flow rates led to higher soil salinity in our study. These changes could have been due to faster water movement, leading to less infiltration and, consequently, less salt leaching. These results are consistent with the findings obtained by Abid et al. [63]. When the flow rate decreases, it takes longer for irrigation water to flow past a furrow. More water infiltration into a soil profile along furrows can be achieved with longer flow times, which may help in reducing the harm impact of salinity [49]. With the EFI method in our study, salt was transported to the middle of the ridges, resulting in a marked increase in mid-ridge salinity after the second irrigation. Salts tended to accumulate at the centre of the ridges owing to the pressure gradient, which could have adversely impacted plant growth. Previous researchers have also revealed that using AFI, which prevents salts accumulation in the middle of the ridge, can reduce the effects of salinization on the middle ridges of plants [64]. In drip irrigation, soil salinity rises as the distance from emitters increases, so higher salinity may be detected near the ridges of wetted areas.

5. Conclusions

Our results demonstrated that different irrigation methods and water flow rates significantly affected cauliflower productivity. It was found that the AFI method could (i) reduce furrow infiltration, thus enabling water conservation of up to 28.71% compared with the EFI method; (ii) radically improve cauliflower WP; (iii) remarkably enhance surface irrigation performance; and (iv) be used as a practical management tool for saving irrigation water. The results further revealed that drip irrigation could increase crop yields and significantly reduce water use for growing vegetable crops and produce higher cauliflower yield (WP), water application efficiency, and water DU compared with conventional surface irrigation. By applying only 67.37% of irrigation water, significant water savings could be achieved with significant increases in yield. Considering the annual leaching requirements of soil, climate changes conditions, and fixed costs, we recommend the use of a drip irrigation system in clayey soil to produce cauliflower, followed by the use of the alternative furrow irrigation method to enable the aeration of the same soil.

Author Contributions

Conceptualization, A.M.O., N.D., A.H.E., S.E. and A.A.F.; Data curation, A.M.O. and S.E.; Formal analysis, A.M.O., A.H.E., S.E., A.A.F., Z.M.Y. and M.W.F.; Investigation, N.D., A.A.F., Z.M.Y. and M.W.F.; Methodology, N.D. and A.H.E.; Resources, A.M.O., A.H.E., S.E. and Z.M.Y.; Software, A.H.E.; Supervision, S.E. and Z.M.Y.; Validation, A.A.F., Z.M.Y. and M.W.F.; Visualization, S.E., A.A.F., Z.M.Y. and M.W.F.; Writing—original draft, A.M.O., N.D., A.H.E., S.E., A.A.F., Z.M.Y. and M.W.F.; Writing—review and editing, N.D., A.A.F., Z.M.Y. and M.W.F. All authors have read and agreed to the published version of the manuscript.

Funding

This research received no external funding.

Institutional Review Board Statement

Not applicable.

Informed Consent Statement

Not applicable.

Data Availability Statement

Data are presented in the article.

Acknowledgments

The authors thank and acknowledge the assistance and consultation for our reported study by Said Mohamed Khalifa, Agric. Engineering Dept., Faculty of Agriculture, Kafrelsheikh University. In addition, the authors would like to thank Al-Mustaqbal University College for providing technical support for this research.

Conflicts of Interest

The authors declare no conflict of interest.

References

  1. Gonçalves, J.M.; Miao, Q.; Duarte, I.M.; Shi, H. Water-saving techniques and practices for on-farm surface irrigation systems. Biol. Life Sci. Forum 2021, 3, 46. [Google Scholar]
  2. Abdelkhalik, A.; Pascual, B.; Nájera, I.; Baixauli, C.; Pascual-Seva, N. Deficit irrigation as a sustainable practice in improving irrigation water use efficiency in cauliflower under Mediterranean conditions. Agronomy 2019, 9, 732. [Google Scholar] [CrossRef] [Green Version]
  3. Becker, R.G.; Gregianin, L.J.; Galia, C.R.; Jesus-Garcia Filho, R.; Toller, E.A.; Badell, G.; Brunetto, A.L. What is the impact of local control in Ewing sarcoma: Analysis of the first Brazilian collaborative study group—EWING1. BMC Cancer 2017, 17, 420. [Google Scholar] [CrossRef] [PubMed]
  4. Emadi, M.H.; Rahmanian, M. Commentary on challenges to taking a food systems approach within the food and agriculture organization (FAO). In Food Security and Land Use Change under Conditions of Climatic Variability; Springer: Cham, Switzerland, 2020; pp. 19–31. [Google Scholar]
  5. Sarkar, S.; Paramanick, M.; Goswami, S.B. Soil temperature, water use and yield of yellow sarson (Brassica napus L. var. glauca) in relation to tillage intensity and mulch management under rainfed lowland ecosystem in eastern India. Soil Tillage Res. 2007, 93, 94–101. [Google Scholar] [CrossRef]
  6. Kochler, M.; Kage, H.; Stützel, H. Modelling the effects of soil water limitations on transpiration and stomatal regulation of cauliflower. Eur. J. Agron. 2007, 26, 375–383. [Google Scholar] [CrossRef]
  7. Sarkar, S.; Nanda, M.K.; Biswas, M.; Mukherjee, A.; Kundu, M. Different indices to characterize water use pattern of irrigated cauliflower (Brassica oleracea L. var. botrytis) in a hot sub-humid climate of India. Agric. Water Manag. 2009, 96, 1475–1482. [Google Scholar] [CrossRef]
  8. Sarkar, S.; Biswas, M.; Goswami, S.B.; Bandyopadhyay, P.K. Yield and water use efficiency of cauliflower under varying irrigation frequencies and water application methods in Lower Gangetic Plain of India. Agric. Water Manag. 2010, 97, 1655–1662. [Google Scholar] [CrossRef]
  9. Pereira, M.E.M.; de Lima Junior, J.A.; de Souza, R.O.R.M.; de Gusmão, S.A.L.; Lima, V.M. Irrigation management influence and fertilizer doses with boron on productive performance of cauliflower. Eng. Agrícola 2016, 36, 811–821. [Google Scholar] [CrossRef] [Green Version]
  10. Ibrahim, M.A.M.; Emara, T.K. Water saving under alternative furrows surface Irrigation in clay soils of north Nile delta. In Proceedings of the Fourteenth International Water Technology Conference (IWTC), Cairo, Egypt, 21–23 March 2010; pp. 811–821. [Google Scholar]
  11. El-Rawy, M.; Abdalla, F.; El Alfy, M. Water resources in Egypt. In The Geology of Egypt; Springer: Cham, Switzerland, 2020; pp. 687–711. [Google Scholar]
  12. Chai, Q.; Gan, Y.; Zhao, C.; Xu, H.L.; Waskom, R.M.; Niu, Y.; Siddique, K.H.M. Regulated deficit irrigation for crop production under drought stress. A review. Agron. Sustain. Dev. 2016, 36, 3. [Google Scholar] [CrossRef] [Green Version]
  13. Ghazouani, H.; Rallo, G.; Mguidiche, A.; Latrech, B.; Douh, B.; Boujelben, A.; Provenzano, G. Assessing hydrus-2D model to investigate the effects of different on-farm irrigation strategies on potato crop under subsurface drip irrigation. Water 2019, 11, 540. [Google Scholar] [CrossRef] [Green Version]
  14. Salman, S.A.; Shahid, S.; Afan, H.A.; Shiru, M.S.; Al-Ansari, N.; Yaseen, Z.M. Changes in Climatic Water Availability and Crop Water Demand for Iraq Region. Sustainability 2020, 12, 3437. [Google Scholar] [CrossRef] [Green Version]
  15. Lee, J.L.; Huang, W.C. Impact of climate change on the irrigation water requirement in Northern Taiwan. Water 2014, 6, 3339–3361. [Google Scholar] [CrossRef] [Green Version]
  16. Guiot, J.; Cramer, W. Climate change, the Paris Agreement thresholds and Mediterranean ecosystems. Sci. Am. Assoc. Adv. Sci. 2016, 354, 465–468. [Google Scholar]
  17. Bozkurt, S.; Uygur, V.; Agca, N.; Yalcin, M. Yield responses of cauliflower (Brassica oleracea L. var. Botrytis) to different water and nitrogen levels in a Mediterranean coastal area. Acta Agric. Scand. Sect. B—Soil Plant Sci. 2011, 61, 183–194. [Google Scholar]
  18. Yu, D.; Lane, S.N. Urban fluvial flood modelling using a two dimensional diffusion wave treatment, part 2: Development of a sub grid scale treatment. Hydrol. Process. Int. J. 2006, 20, 1567–1583. [Google Scholar] [CrossRef]
  19. Chávez, C.; Limón-Jiménez, I.; Espinoza-Alcántara, B.; López-Hernández, J.A.; Bárcenas-Ferruzca, E.; Trejo-Alonso, J. Water-use efficiency and productivity improvements in surface irrigation systems. Agronomy 2020, 10, 1759. [Google Scholar] [CrossRef]
  20. Burt, C.M.; Clemmens, A.J.; Strelkoff, T.S.; Solomon, K.H.; Bliesner, R.D.; Hardy, L.A.; Howell, T.A.; Eisenhauer, D.E. Irrigation performance measures: Efficiency and uniformity. J. Irrig. Drain. Eng. 1997, 6, 423–442. [Google Scholar] [CrossRef] [Green Version]
  21. Ahmadi, S.H.; Andersen, M.N.; Plauborg, F.; Poulsen, R.T.; Jensen, C.R.; Sepaskhah, A.R.; Hansen, S. Effects of irrigation strategies and soils on field grown potatoes: Yield and water productivity. Agric. Water Manag. 2010, 97, 1923–1930. [Google Scholar] [CrossRef]
  22. Pan, Y.H.; Kang, S.Z. Irrigation water infiltration in furrows and crop water use of alternative furrow irrigation. Trans. Chin. Soc. Agric. Eng. 2000, 16, 39–43. [Google Scholar]
  23. Eba, A.T. The impact of alternate furrow irrigation on water productivity and yield of potato at small scale irrigation, Ejere District, West Shoa, Ethiopia. J. Plant Sci. Agric. Res. 2018, 2, 16. [Google Scholar]
  24. Tiwari, K.N.; Singh, A.; Mal, P.K. Effect of drip irrigation on yield of cabbage (Brassica oleracea L. var. capitata) under mulch and non-mulch conditions. Agric. Water Manag. 2003, 58, 19–28. [Google Scholar] [CrossRef]
  25. Sharu, E.H.; Ab Razak, M.S. Hydraulic performance and modelling of pressurized drip irrigation system. Water 2020, 12, 2295. [Google Scholar] [CrossRef]
  26. Kadasiddap, K.K.; Rao, V.P. Irrigation scheduling through drip and surface methods- A critical review on growth, yield, nutrient uptake and water use studies of rabi maize. Agric. Rev. 2018, 39, 300–306. [Google Scholar] [CrossRef]
  27. Han, M.; Zhao, C.Y.; Feng, G.; Yan, Y.Y.; Sheng, Y. Evaluating the effects of mulch and irrigation amount on soil water distribution and root zone water balance using Hydrus-2D. Water 2015, 7, 2622–2640. [Google Scholar] [CrossRef] [Green Version]
  28. Yadav, B.S.; Singh, G.R.; Mangal, J.L.; Srivastava, V.K. Drip irrigation in vegetable production. J. Agric. Res. 1993, 14, 75–82. [Google Scholar]
  29. Magar, S.S.; Nandgude, S.B. Micro-irrigation status and holistic strategy for evergreen revolution. J. Water Manag. 2005, 13, 106–111. [Google Scholar]
  30. Sidhartha, G.; Pasha, M.L.; Devi, M.U.; Ramulu, V. Study of Varied Drip Irrigation and Fertigation Regimes on Curd Yield and Water Productivity of Cauliflower. Curr. J. Appl. Sci. Technol. 2021, 40, 105–110. [Google Scholar] [CrossRef]
  31. Akbari, M.; Dehghanisanij, H.; Mirlatifi, S.M. Impact of irrigation scheduling on agriculture water productivity. Iran. J. Irrig. Drain. 2009, 1, 69–79. [Google Scholar]
  32. Popale, P.G.; Khedkar, D.D.; Bhagyawant, R.G.; Jadhav, S.B. Response of cauliflower to irrigation schedules and fertilizer levels under drip irrigation. Int. J. Agric. Eng. 2012, 5, 62–65. [Google Scholar]
  33. Khodke, U.M.; Patil, D.B. Effect of subsurface drip irrigation on moisture distribution, root growth and production of cauliflower. In Proceedings of the Soil and Water Engineering International Conference of Agricultural Engineering—CIGR-AgEng 2012: Agriculture and Engineering for a Healthier Life, Valencia, Spain, 8–12 July 2012. [Google Scholar]
  34. Shams, A.S.; Farag, A.A. Implications of water stress and organic fertilization on growth, yield, and water productivity of cauliflower (Brassica oleracea var. botrytis, L.). J. Plant Prod. 2019, 10, 807–813. [Google Scholar] [CrossRef]
  35. Khalifa, E.S.; Okasha, A.; Shawat, S. Development of surface irrigation using surge irrigation technique. Fresenius Environ. Bull. 2019, 28, 3121–3130. [Google Scholar]
  36. James, L.G. Principle of Farm Irrigation System Design; Irrigation Requirements and Scheduling; John Willey and Sons: New York, NY, USA, 1988; p. 277. [Google Scholar]
  37. Doorenbos, J.; Pruitt, W.O. Guidelines for Predicting Crop Water Requirements; FAO: Rome, Italy, 1977. [Google Scholar]
  38. Allen, R.G.; Pereira, L.S.; Raes, D.; Smith, M. Crop Evapotranspiration-Guidelines for Computing Crop Water Requirements; FAO Irrigation and Drainage Paper 56; FAO: Rome, Italy, 1998; Volume 300, p. D05109. [Google Scholar]
  39. Hansen, V.E.; Israelsen, O.W.; Stringham, G.E. Irrigation Principles and Practices; (No. 04; S613. I75, H3 1980); Wiley: New York, NY, USA, 1980. [Google Scholar]
  40. Zwart, S.J.; Bastiaanssen, W.M.G. SEBAL for detecting spatial variation of water productivity and scope for improvement in eight irrigated wheat systems. Agric. Water Manag. 2007, 89, 287–296. [Google Scholar] [CrossRef]
  41. Teixeira AHde, C.; Bastiaanssen, W.G.M.; Moura, M.S.B.; Soares, J.M.; Ahmad, M.D.; Bos, M.G. Energy and water balance measurements for water productivity analysis in irrigated mango trees, Northeast Brazil. Agric. For. Meteorol. 2008, 148, 1524–1537. [Google Scholar] [CrossRef] [Green Version]
  42. Vazifedoust, M.; van Dam, J.C.; Feddes, R.A.; Feizi, M. Increasing water productivity of irrigated crops under limited water supply at field scale. Agric. Water Manag. 2008, 95, 89–102. [Google Scholar] [CrossRef]
  43. Pereira, L.S.; Cordery, I.; Iacovides, I. Improved indicators of water use performance and productivity for sustainable water conservation and saving. Agric. Water Manag. 2012, 108, 39–51. [Google Scholar] [CrossRef]
  44. Ali, M.A.; Hoque, M.R.; Hassan, A.A.; Khair, A. Effects of deficit irrigation on yield, water productivity and economic return of wheat. Agric. Water Manag. 2007, 92, 151–161. [Google Scholar] [CrossRef]
  45. Pereira, L.S.; Oweis, T.; Zairi, A. Irrigation management under water scarcity. Agric. Water Manag. 2002, 57, 175–206. [Google Scholar] [CrossRef]
  46. Michael, A.M. Irrigation Theory and Practice; Vikas Publishing House Pvt. Ltd.: New Delhi, India, 2008; pp. 455–516. [Google Scholar]
  47. American Society of Agricultural and Biological Engineers. Test Procedure for Determining the Uniformity of Water Distribution of Center Pivot and Lateral Move Irrigation Machines Equipped with Spray or Sprinkler Nozzles; ANSI/ASAE Standard 2001, S436.1; American Society of Agricultural Engineers: St. Joseph, MI, USA, 2000. [Google Scholar]
  48. Okasha, A.M.; EL Metwally, W.F.; Attaffey, T.M. Effect of different types of irrigation systems on soybean production under clayey soil conditions. Misr J. Agric. Eng. 2016, 33, 43–62. [Google Scholar] [CrossRef]
  49. Wu, D.; Xue, J.; Bo, X.; Meng, W.; Wu, Y.; Du, T. Simulation of irrigation uniformity and optimization of irrigation technical parameters based on the SIRMOD model under alternate furrow irrigation. Irrig. Drain. 2017, 6, 478–491. [Google Scholar] [CrossRef]
  50. Haman, D.Z.; Smajstrla, A.G.; Pitts, D.J. Uniformity of Sprinkler and Microirrigation Systems for Nurseries; Cooperative Extension Service, Institute of Food and Agricultural Sciences: BUL321; University of Florida: Gainesville, FL, USA, 1997; pp. 1–8. [Google Scholar]
  51. Mintesinot, B.; Verplancke, H.; Van Ranst, E.; Mitiku, H. Examining traditional irrigation methods, irrigation scheduling and alternate furrows irrigation on vertisols in northern Ethi pia. Agric. Water Manag. 2004, 64, 17–27. [Google Scholar] [CrossRef]
  52. Pordeus, R.V.; de Azevedo, C.A.V.; de Lima, V.L.A.; Neto, J.D.; Azevedo, M.R.Q.A. Field evaluation of water infiltration profile in opened and closed furrow irrigation with continuous flow. In Proceedings of the 2003 ASAE Annual Meeting, Las Vegas, NV, USA, 27–30 July 2003. ASAE Paper No. 032244. [Google Scholar]
  53. Kang, S.Z.; Shi, P.; Pan, Y.H.; Liang, Z.S.; Hu, X.T.; Zhang, J. Soil water distribution, uniformity and water-use efficiency under alternate furrow irrigation in arid areas. Irrig. Sci. 2000, 19, 181–190. [Google Scholar] [CrossRef]
  54. Assefa, S.; Kedir, Y.; Alamirew, T. Effects of slopes, furrow lengths and Inflow rates on irrigation performances and yield of sugarcane plantation at metehara, Ethiopia. Irrig. Drain. Syst. Eng. 2017, 6, 2. [Google Scholar]
  55. Sepaskhah, A.R.; Ghasemi, M. Every other furrow irrigation with different intervals for sorghum. Pak. J. Biol. Sci. 2008, 11, 1234–1239. [Google Scholar] [CrossRef] [PubMed] [Green Version]
  56. Rogers, D.H.; Lamm, F.R.; Alam, M.; Trooien, T.P.; Clark, G.A.; Philip, L.; Barnes, P.L.; Mankin, K. Irrigation and Water Losses of Irrigation Systems; Irrigation Management Series; Cooperative Extension Service; Kansas State University: Manhattan, NY, USA, 1997. [Google Scholar]
  57. Pandey, C.; Shukla, S. Effects of Soil Organic amendment on Water and Nutrient Movement in a Sandy Soil. In Proceedings of the 2006 ASAE Annual Meeting, Portland, OR, USA, 9–12 July 2006. [Google Scholar] [CrossRef]
  58. Xiao, J.; Lei, T.W.; Jiang, P.F.; Yu, Y.D. Effects of water quality in furrow irrigation on corn yield and soil salinity. In Proceedings of the 2004 ASAE Annual Meeting, Ottawa, ON, Canada, 1–4 August 2004. Presentation Paper No. 042037. [Google Scholar]
  59. Graterol, Y.E.; Eisenhauer, D.E.; Elmore, R.W. Alternate-furrow irrigation for soybean production. Agric. Water Manag. 1993, 24, 133–145. [Google Scholar] [CrossRef]
  60. Kumar, A.; Kwatra, J.; Sharma, H.C.; Sharma, A.K.; Singh, A.K. Feasibility study of gravity-fed drip irrigation system on hilly terrace land in mid-Himalayan regions. Indian J. Soil Water Conserv. 2012, 40, 202–206. [Google Scholar]
  61. Sepaskhah, A.R.; Khajehabdollahi, M.H. Alternate furrow irrigation with different irrigation intervals for maize (Zea mays L.). Plant Prod. Sci. 2005, 8, 592–600. [Google Scholar] [CrossRef] [Green Version]
  62. Liu, X.; Baird, W.V. Differential expression of genes regulated in response to drought or salinity stress in sunflower. Crop Sci. 2003, 43, 678–687. [Google Scholar]
  63. Abid, M.; Qayyum, A.; Dasti, A.; Wajid, R. Effect of salinity and sar of irrigation water on yield, physiological growth parameters of maize (Zea mays L.) and properties of the Soil. J. Res. Sci. 2001, 12, 26–33. [Google Scholar]
  64. Onishi, J.; Okuda, Y.; Paluashova, G.K.; Shirokova, Y.I.; Kitamura, Y.; Fujimaki, H. Salt pushing effect to the side of the ridge by fixed skip furrow irrigation-case study in the Republic of Uzbekistan. J. Arid. Land Stud. 2018, 28, 155–158. [Google Scholar]
Figure 1. (a) The experimental set-up; (b) flowchart of the experimental design.
Agriculture 12 01164 g001aAgriculture 12 01164 g001b
Figure 2. The effect of irrigation systems (EFI, AFI, and DI) and flow rates (0.47 (Q1), 0.95 (Q2), and 1.43 L/s (Q3)) on the water distribution uniformity across two seasons. Mean values followed by the same letter were not significantly different at the 5% level between treatments.
Agriculture 12 01164 g002
Figure 3. Effect of irrigation systems (EF and AF) and flow rates (0.47 (Q1), 0.95 (Q2), and 1.43 L/s (Q3)) on water application efficiency across the two seasons. Mean values followed by the same letter were not significantly different at the 5% level between treatments.
Agriculture 12 01164 g003
Figure 4. Effect of irrigation method (EFI, AFI, and DI) and flow rate (0.47 (Q1), 0.95 (Q2), and 1.43 L/s (Q3)) on cauliflower curd yield across two seasons. Mean values followed by the same letter were not significantly different at the 5% level between treatments.
Agriculture 12 01164 g004
Figure 5. Effect of irrigation method (EF, AF, and DI) and flow rate (0.47 (Q1), 0.95 (Q2), and 1.43 L/s (Q3)) on the water productivity of cauliflower across the two seasons. Mean values followed by the same letter were not significantly different at the 5% level between treatments.
Agriculture 12 01164 g005
Figure 6. Effect of irrigation method (EF, AF, and DI) and flow rate (0.47 (Q1), 0.95 (Q2), and 1.43 L/s (Q3)) on irrigation-water-saving percentage across two years.
Agriculture 12 01164 g006
Figure 7. Effect of irrigation method (EF, AF, and DI) and flow rate (0.47 (Q1), 0.95 (Q2), and 1.43 L/s (Q3)) on soil salinity after cauliflower harvesting across the two years. Mean values followed by the same letter were not significantly different at the 5% level between treatments.
Agriculture 12 01164 g007
Table 1. Average values of some meteorological date regarding the experimental area during growing seasons (two seasons).
SeasonMonthTemperature, °CRelative Humidity, %Wind Velocity (km/Day)Pan Evaporation
(mm/Day)
Rainfall, mm/Month
Max.Min.MeanMax.Min.Mean
Season 2017/2018October35.421.128.2596406873.23.26-
November23.719.921.884.758.671.6553.52.069.3
December21.518.419.988.264.876.542.91.471.8
January18.913.616.189.464.476.944.92.6335.8
Season 2018/2019October29.520.625.0582.549.666.0557.93.243.5
November2517.421.286.654.670.624.21.6-
December19.513.916.788.762.475.5524.50.83-
January18.912.315.682.353.367.833.11.1414.9
Table 2. Effect of irrigation method (EFI, AFI, and DI) and flow rate (0.47 (Q1), 0.95 (Q2), and 1.43 L/s (Q3)) on the distribution uniformity (DU) and application efficiency (AE) of water in the first and second growing seasons.
TreatmentSeason (2017/2018)Season (2018/2019)
DU, %SD, %AE, %SD, %DU, %SD, %AE, %SD, %
EFI + Q164.53 e3.8761.43 e0.9063.90 e3.9061 e0.90
AFI + Q169.00 d0.8969.20 bc1.0869.10 d0.6068.8 bc0.95
EFI + Q270.90 cd1.3965.33 d1.1170.53 cd1.3464.83 d1.26
AFI + Q273.70 c1.4771.70 ab1.4273.17 c1.5371.3 ab1.52
EFI + Q382.77 b1.0367.00 cd2.1482.54 b1.3566.8 cd2.02
AFI + Q385.13 b0.3272.93 a2.6385.07 b0.6472.53 a2.60
DI94.94 a0.03- 95.05 a0.03-
EFI, every furrow irrigation; AFI, alternate furrow irrigation; DI, drip irrigation. Numbers within a column with different letters are significantly different according to LSD. SD is standard deviation.
Table 3. Evaluation of drip irrigation system at an operating pressure head of one bar for the GR emitter.
Drip Lines CV, DimensionlessEU, %CU, %DU, %
Parameters
1 × 30.0687.9495.7894.94
1 × 30.0588.6895.9595.05
1 × 30.0591.1696.2795.01
Average0.0589.2696.0095.00
CV: manufacturer’s coefficient of variation; EU: emission uniformity; CU: Christiansen uniformity coefficient; DU: distribution uniformity.
Table 4. Effect of irrigation methods (EFI, AFI, and DI) and flow rates (0.47 (Q1), 0.95 (Q2), and 1.43 L/s (Q3)) on yield and water productivity in the first and second growing seasons.
TreatmentsSeason 2017/2018Season 2018/2019
Yield, Mg/fedSD, Mg/fedWater Productivity, kg/m3SD, kg/m3Yield, Mg/fedSD, Mg/fedWater Productivity, kg/m3SD, kg/m3
EF1 + Q19.83 cd0.313.67 f0.189.92 c0.123.71 f0.07
AFI + Q17.47 e0.113.41 f0.237.16 d0.053.27 g0.11
EFI + Q29.98 c0.434.64 e0.4810.27 c0.153.99 e0.20
AFI + Q29.71 d0.545.50 c0.429.66 c0.204.59 d0.20
EFI + Q312.24 b0.255.12 d0.4412.33 b0.115.14 c0.18
AFI + Q311.87 b0.626.22 b0.3311.94 b0.326.26 b0.18
DI18.13 a0.0210.07 a0.0118.11 a0.0110.07 a0.01
EFI, every furrow irrigation; AFI, alternate furrow irrigation; DI, drip irrigation. Numbers within a column with different letters are significantly different according to LSD. SD is standard deviation.
Table 5. Effect of irrigation method (EF, AF, and DI) and flow rate (0.47 (Q1), 0.95 (Q2), and 1.43 L/s (Q3)) on soil salinity in the first and second growing seasons.
TreatmentsSeason (2017/2018)Season (2018/2019)
Soil Salinity, dS/mSD, dS/mSoil Salinity, dS/mSD, dS/m
EFI + Q12.39 d0.202.39 c0.19
AFI + Q13.93 a0.093.91 a0.14
EFI + Q23.12 c0.143.15 b0.13
AFI + Q23.78 ab0.063.74 a0.11
EFI + Q33.16 c0.103.18 b0.16
AFI + Q33.76 b0.083.75 a0.15
DI3.59 b0.013.61 ab0.02
EFI, every furrow irrigation; AFI, alternate furrow irrigation; DI, drip irrigation. Numbers within a column with different letters are significantly according to LSD. SD is standard deviation.
Publisher’s Note: MDPI stays neutral with regard to jurisdictional claims in published maps and institutional affiliations.

