Article

Detection of Unripe Kernels and Foreign Materials in Chickpea Mixtures Using Image Processing

1
Mechanical Engineering of Biosystems Department, Ilam University, Ilam 69315-516, Iran
2
Department of Biosystems Engineering, University of Manitoba, Winnipeg, MB R3T 5V6, Canada
*
Authors to whom correspondence should be addressed.
Agriculture 2022, 12(7), 995; https://doi.org/10.3390/agriculture12070995
Submission received: 17 June 2022 / Revised: 4 July 2022 / Accepted: 6 July 2022 / Published: 10 July 2022
(This article belongs to the Special Issue The Application of Machine Learning in Agriculture)

Abstract

:
The existence of dockage, unripe kernels, and foreign materials in chickpea mixtures is one of the main concerns during chickpea storage and marketing. Novel algorithms based on image processing were developed to detect undesirable, foreign materials, and matured chickpea kernels in the chickpea mixture. Images of 270 objects including 54 sound samples and 36 samples of each undesired object were prepared and features of these acquired images were extracted. Different models based on linear discriminant analysis (LDA), support vector machine (SVM), and artificial neural networks (ANN) methods were developed by using MATLAB. Three classification algorithms based on LDA, SVM, and ANN methods were developed. The classification accuracy in training, testing, and overall detection showed the superiority of ANN (99.4, 92.6, and 94.4%, respectively) and LDA (91.1, 94.0, and 91.9%, respectively) over the SVM (100, 53.7, and 88.5%, respectively). The developed image processing technique can be incorporated with a vision-based real-time system.

1. Introduction

Chickpea (Cicer arietinum) is the third most widely cultivated pulse in the world planted in arid and semi-arid regions [1,2]. Iran produced 71,580 tons of chickpea in 2015 and is the fourth largest chickpea producer in the world after India, Pakistan, and Turkey [3]. The main production provinces in Iran are East Azarbaijan, West Azarbaijan, Ardebil, Isfahan, Alborz, Kermanshah, and Ilam. When harvesting, chickpea seeds at different locations of a plant have different maturities and moisture contents. The naturally ripped seeds have a milky white color, while unripe seeds have different colors from green to brown, depending on their maturity (Figure 1). After near ambient (natural air) drying in stores, chickpea seeds shrink and wrinkle on the surface of unripe seeds due to loss of moisture content (Figure 1). The harvested chickpeas are usually mixed with foreign materials (other grain kernels and the stone of the same size and shape as a chickpea kennel) and dockage which include unripe, shrunken, damaged, and broken kernels and stalks, stems, leaves, stone, and fines. Segregation of dockage and foreign materials during chickpea handling causes storage problems such as high airflow resistance and hot spot development [4]. Chickpeas with a high percentage of unripe seeds, damaged, and foreign materials have a low market value. Therefore, it is necessary to remove those before storage.
Dockage can be removed by mechanical methods such as sieves or roller separators while these mechanical methods cannot separate unripe kernels and foreign materials from the chickpea bulk because these particles have a similar shape and size as the chickpea kernels. In this article, the particles with the same size and shape as a matured chickpea kernel but not chickpea kernels were referred to as impurities. Manual sorting of impurities is time consuming and costly [5]. Therefore, developing a fast and low-cost universal method to separate these impurities from sound kernels is required.
Machine vision separation is one of the widely used tools to separate undesirable particles due to its high accuracy and speed. Image processing algorithms coded inside a machine vision system can distinguish targets due to their difference in colors [6,7], textures, shapes [8,9,10,11,12,13,14,15], and sizes [16,17]. Therefore, using a machine vision system, the impurities such as unripe and broken seeds and foreign materials can be separated from the sound chickpea kernels.
Different classification methods have been used to distinguish different groups [18]. Çakmak and Boyac [19] used the artificial neural networks (ANN) method for quality inspection of chickpeas based on color, morphology, and shape while Ghamari [20] used the ANN method to identify four varieties of chickpea by classifying some morphological data measured by a micrometer. Sabzi et al. [21] used the ANN method to distinguish five chickpea varieties using image processing. Pourdarbani et al. [22,23] applied image processing and ANN method to detect five and three different varieties of chickpea, respectively. Shahin and Symons [17] developed a machine vision system to determine the size distribution of chickpea samples. Sankaran et al. [24] identified chickpea phenotyping based on seed size. LeMasurier et al. [16] applied image processing to determine lentil size. Venora et al. [25] used the image processing method to identify lentil cultivars based on those differences in size, shape, and color. The detection of unripe and broken kernels and foreign materials has not been conducted in abovementioned studies.
Impurity detection is one of the main functions of a developed machine vision system [26]. Chen et al. [27] developed an image processing system to detect impurity in a rice combine harvester. Rong et al. [28] used a decision tree algorithm to classify foreign materials from walnuts. Shen et al. [29] detected impurity or wheat samples using the terahertz spectral imaging and convolutional neural networks. There is no study to detect impurities of chickpea samples. There are differences between crops and between other impurities in color, texture, and shape. Therefore, a specified algorithm is needed for the detection of impurities for each crop.
To reduce the extracted features [30] and consequently increase the classification accuracy, researchers usually use principal component analysis (PCA) [18]. As PCA combines the features, the efficient features are not specified so this PCA method has the limitation in the application of automatic sorting. In this study, we proposed a sequential feature selection method for selecting efficient features.
The goal of this study was to develop a machine vision system that could distinguish impurities (including unripe and broken chickpea kernels and foreign materials) from the sound chickpea kernels. To achieve this goal, an image processing algorithm was developed to acquire the target images, extract the features, select the efficient features, and classify the efficient features. The artificial neural networks (ANN), linear discriminant analysis (LDA), and support vector machine (SVM) methods were used to classify and detect these undesired particles from the sound kernels. The classifier models were developed to compare the classification accuracies by using the confusion matrix, accuracy for the training and testing step, individually, and then total confusion matrix and accuracy.

2. Materials and Methods

The chickpea (Azad variety) sample was purchased from the local markets located in Ilam Province, Iran. The purchased chickpea bulk was the mixture of impurities (unripe kernels, damaged, and foreign materials) and sound kernels. The mixture was manually separated into seven groups: sound (Figure 1a), wrinkled (greenish) (Figure 1b), unripe (Figure 1c), brownish (Figure 1d), and split (Figure 1e) chickpea kernels, and stone (Figure 1f) and stalk (Figure 1g). Sound kernels were mature chickpea seeds with normal color. Wrinkled kernels had normal color but had wrinkles due to the loss of their initial high moisture contents during storage and drying. Immature kernels had green color and were wrinkled. Brown kernels had not wrinkled but had a brown color. A split kernel was a broken or split seed (the unbroken part is the same as a sound kernel). Stalks were the chickpea stems (Figure 1f). Stones were those impurities with high kernel densities but had a similar shape and size as sound kernels (Figure 1g). In total, 270 objects including 54 sound, 36 unripe (greenish), 36 brownish, 36 split, and 36 wrinkled chickpea kernels, 36 stones, and 36 stalks were prepared (Figure 1).

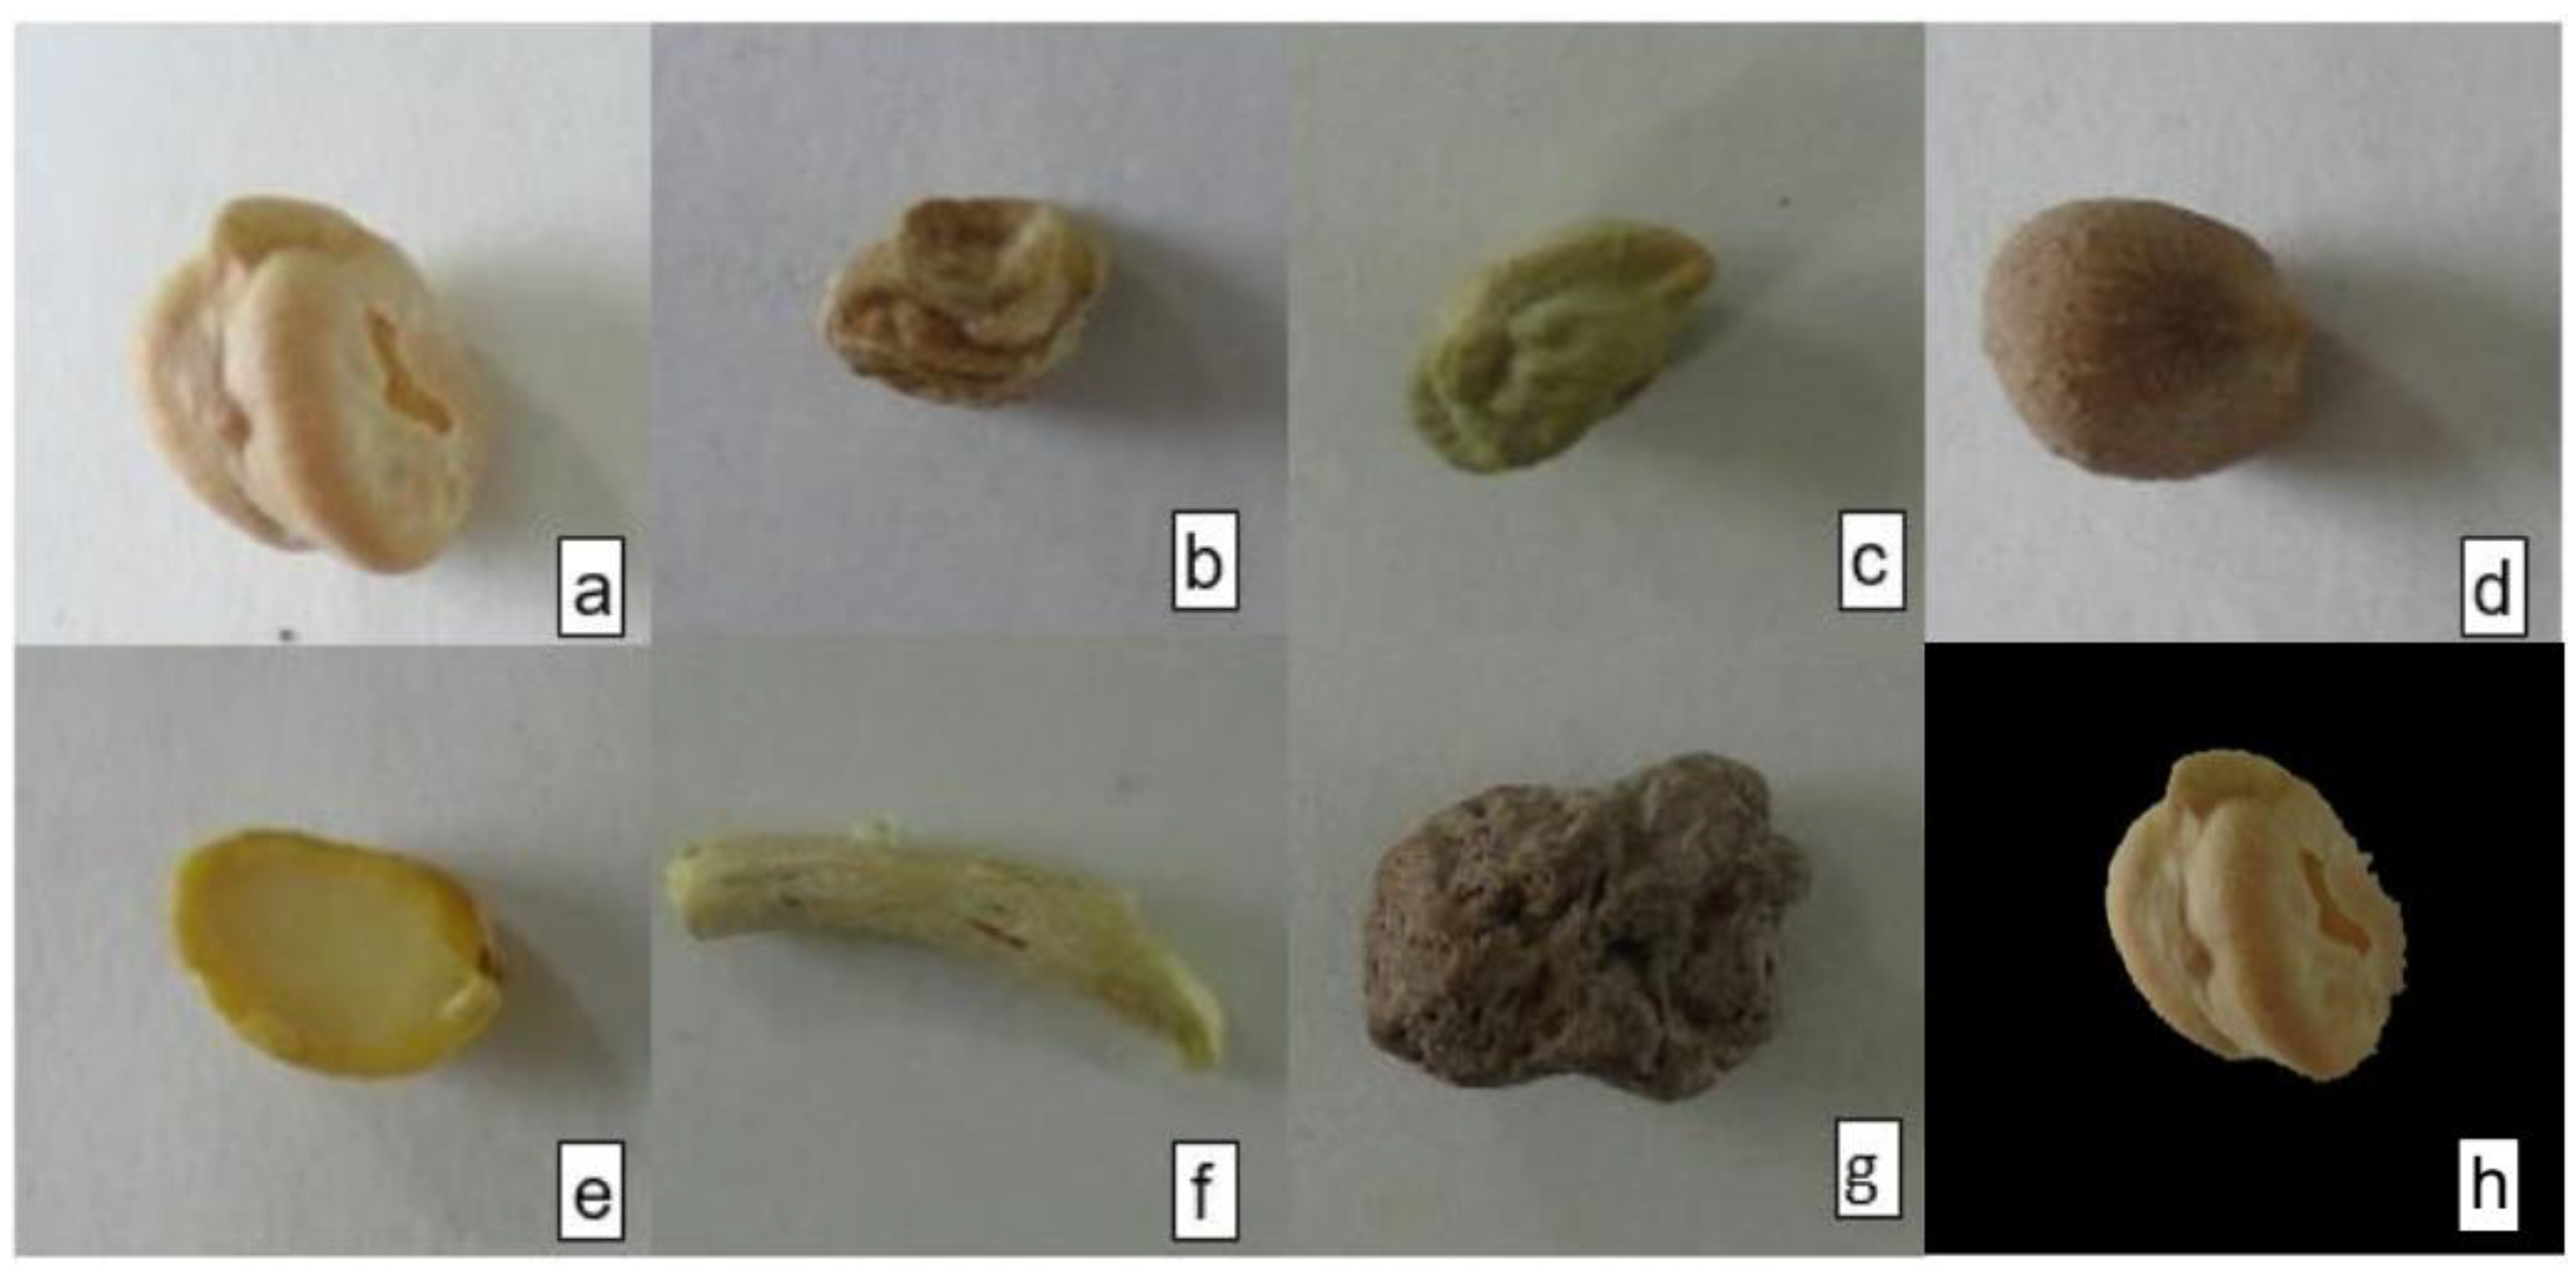
2.1. Image Acquisition

Images of the prepared 270 objects were acquired using an image processing system located in the lab of Ilam University. The imaging system had an imaging chamber, a digital RGB camera (Sony Cyber-Shot DSC-WX200, Minato, Japan), a laptop (2.40 GHz Core i5 CPU M520, 2.40 GHz processor), and four halogen lamps which provided the uniform and consistent illumination in the chamber. The resolution of the camera was 16.1 megapixels with a sensor format of 1/2.3 inch, an optical zoom of 10X, and a sensor size of 28.0735 mm2 (6.17 mm × 4.55 mm). The distance of the camera lens to the target sample was 10 cm. A white paper was used as the background of the samples in visible imaging. In this study, the lighting condition was fixed using the four halogen lamps. Different lighting conditions and angles were used for the deep learning method in our previous studies [31,32]. The number of samples was selected based on these previous studies. Nine objects from each prepared group were manually located under the camera lens at each image taking time, and their images were captured and recorded in jpeg format. Then, the image of the nine objects were separated. Therefore, a total of 270 individual (separated) images were obtained and each prepared object had one image.

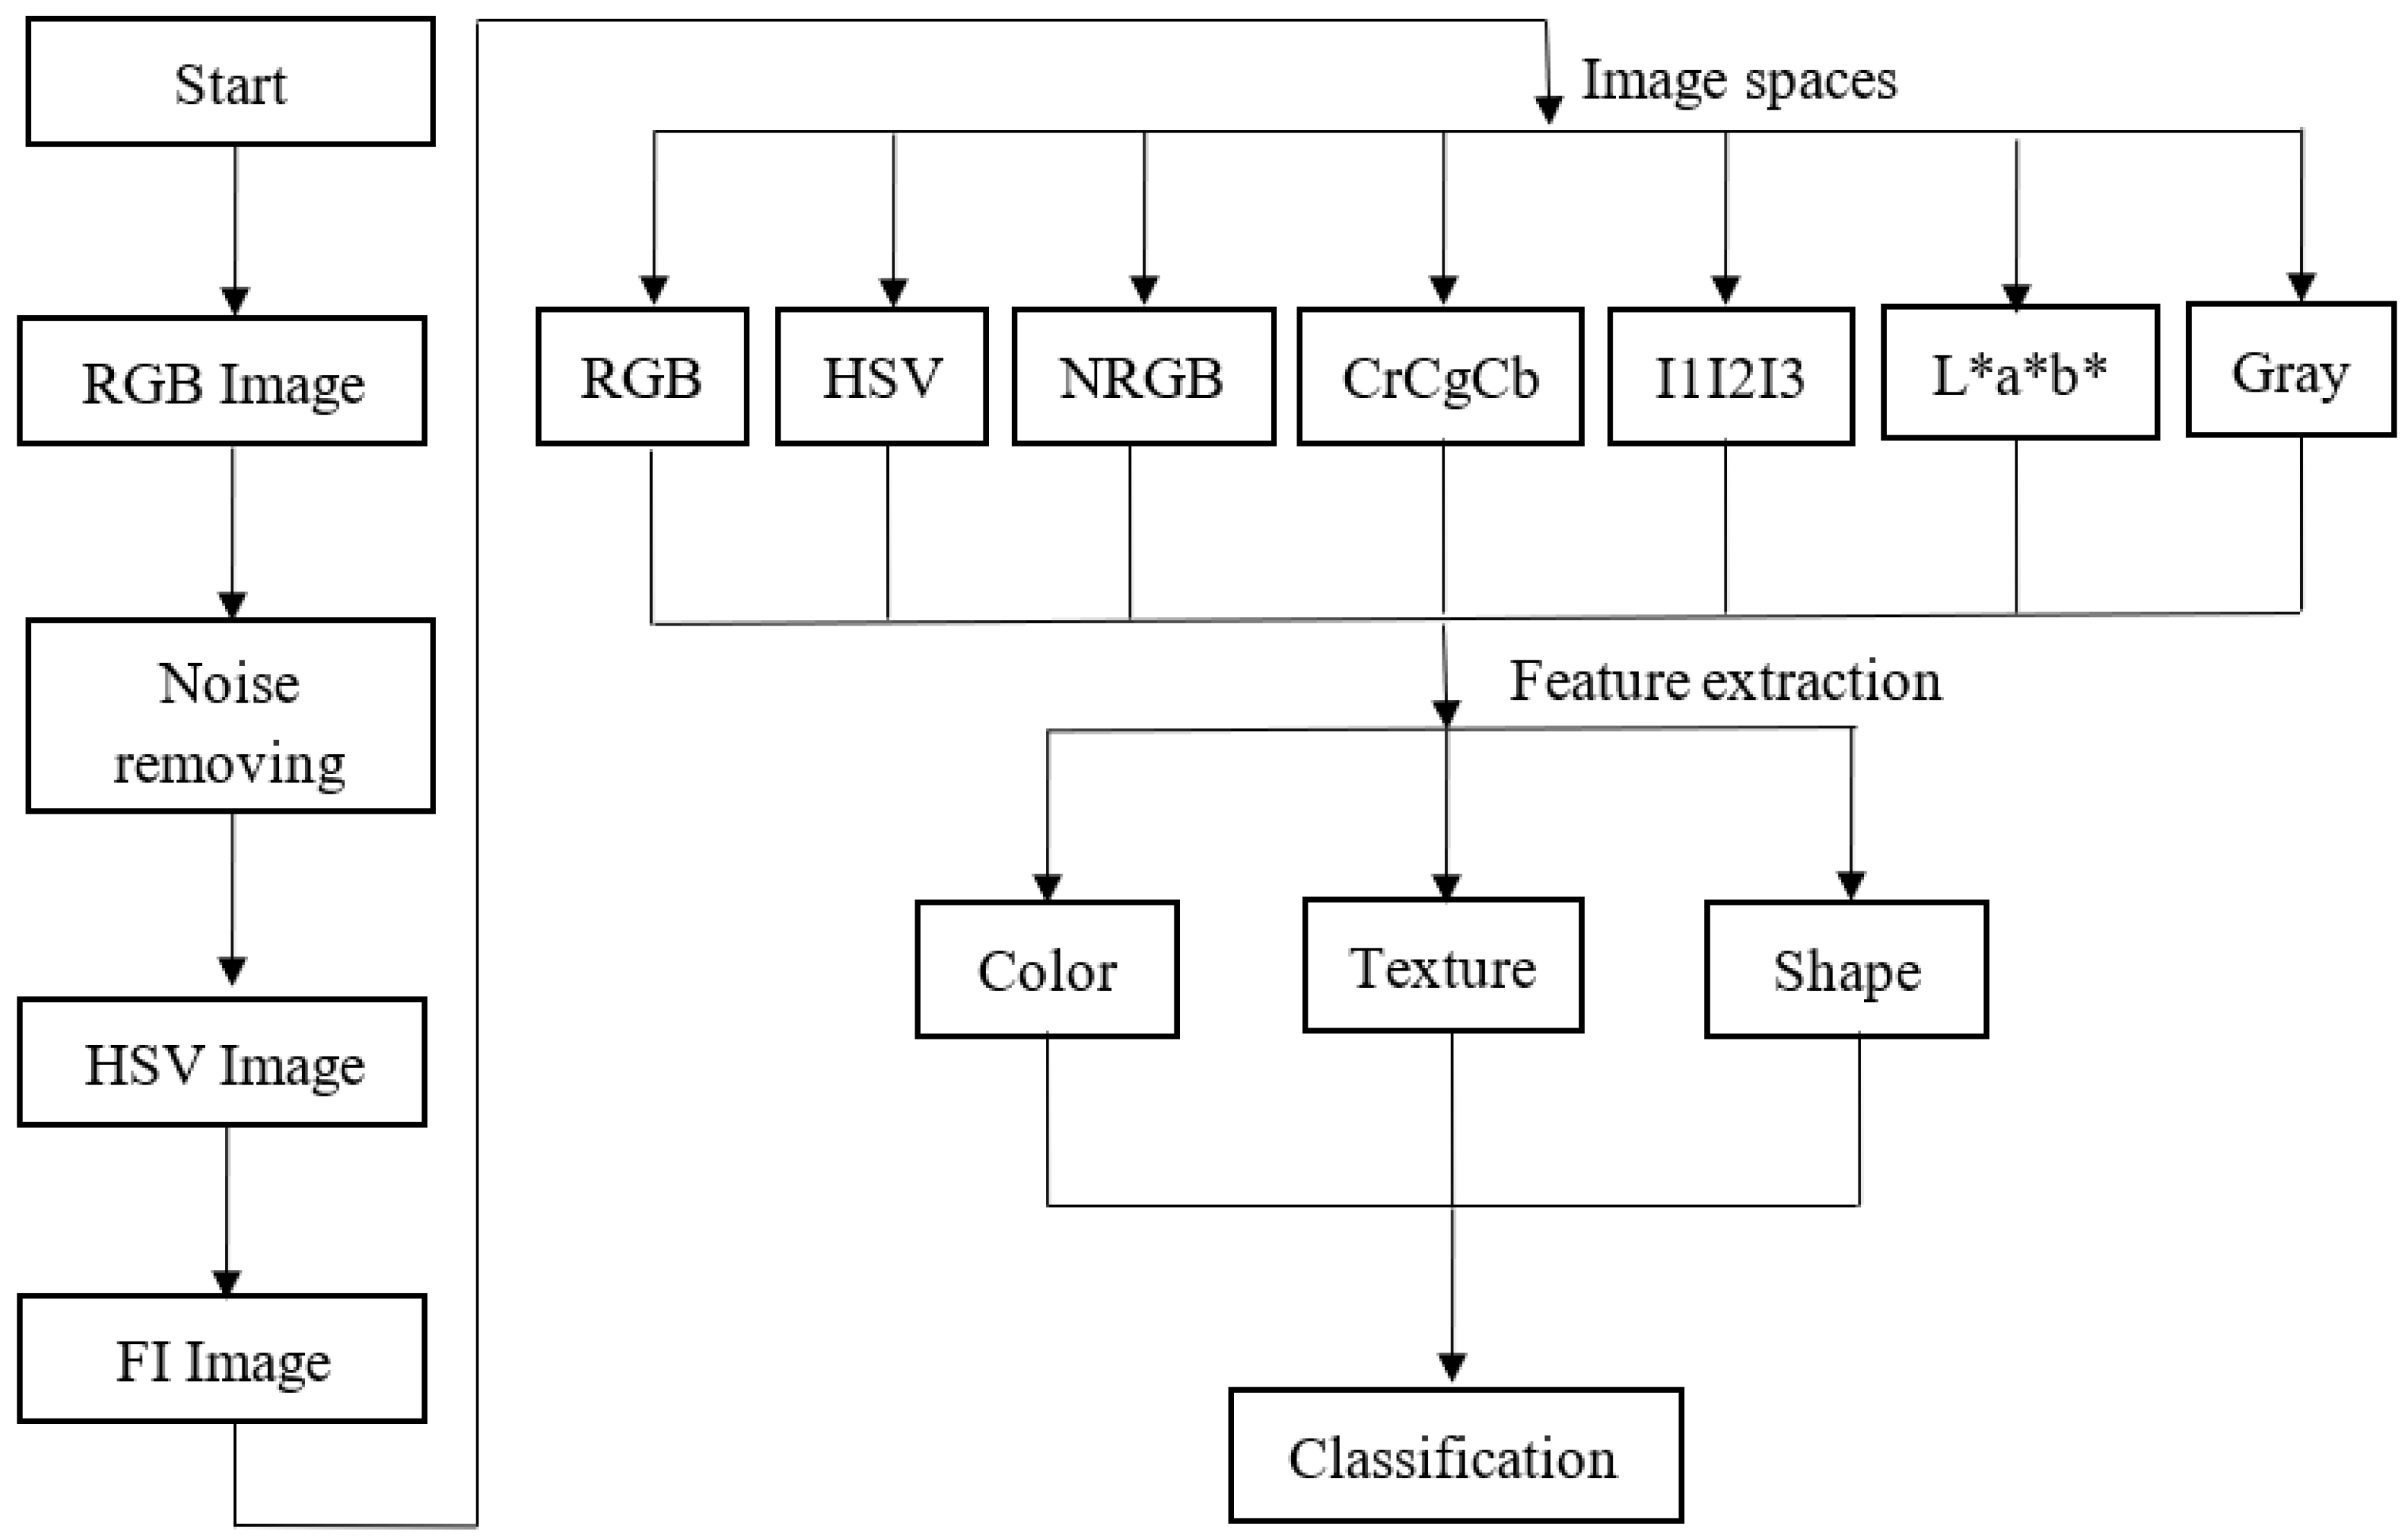
2.2. Image Preprocessing

An algorithm was developed and coded in MATLAB (R2015a, Natick, USA). The acquired RGB images were called by the algorithm at the beginning of the image processing (Figure 2).
To separate the object from the background, different channels of HSV color space were obtained and the object was separated from the background using Equation (1).
I = S V 0.4 H
where I is a mono color image [31], and H, S, and V are the different channels of HSV color space. Equation (1) was developed by the trial-and-error method. After the noises or unwanted small objects were removed with erosion operation, the I channel was converted to a binary image. Hence, the obtained binary image was multiplied in R, G, and B channels of the initial image, and the final image (Figure 1h) was the combination of them.
The processed image (in RGB color space) was transformed into different spaces including L * a * b *, HSV, NRGB, CrCgCb, I1I2I3, and gray (Figure 2) [31,32,33,34]. Nineteen image channels from each color space were obtained: R, G, B, L *, a *, b *, H, S, V, NR, NG, NB, Cr, Cg, Cb, I1, I2, I3, and gray.
After segmenting and filtering, the developed algorithm extracted the shape, color, and texture features from each image channel (Figure 2). To extract shape features, the image matrix was labeled using the Bwlabl function and then the Regionprops function was used to extract the length, width, surface center, area, centrifuge, extent, circumference, elongation, and the biggest and ellipse axis of the object. The values of mean, standard deviation, skewness, kurtosis, coefficient of variation [12,32,35], minimum, maximum, mode, middle, and covariance as color features were extracted from different image channels.
Mean ( μ ) = 1 MN i   = 1 M j   = 1 N P ( i ,   j )
Standard   Deviation ( σ ) = [ 1 MN i   = 1 M j   = 1 N ( P ( i , j ) μ ) ] 1 2
Variance = i   = 0 N g 1 ( i μ ) 2 P i
Skewness = 1 MN σ 3 i   = 1 M j   = 1 N [ ( P ( i , j ) μ ) ] 3
Kurtosis = 1 MN σ 4 i   = 1 M j   = 1 N [ ( P ( i , j ) μ ) ] 4
where μ is mean, M is the number of rows and N is the number of columns of the images, P ( i , j ) is the color values of i column and j row, σ is standard deviation, σ 2 is variance, and N g is the number of pixels.
To extract texture features, the statistical gray-level co-occurrence matrix (GLCM) was calculated at first. It provides the spatial relationship between image pixels. Then, the energy, entropy, correlation, homogeneity [31,32,33,34,35], and contrast features were extracted.
Homogeneity = i = 1 Ng j = 1 Ng P d ( i , j ) 1 + | i j |
Entropy = i = 0 Ng j = 0 Ng P d ( i , j ) log P d ( i ,   j )
Energy = i = 0 Ng j = 0 Ng P d 2 ( i , j )
Correlation = i = 1 Ng j = 1 Ng ( 1 μ i ) P d ( i , j ) σ i σ j
where P d is the co-occurrence matrix, P ( i , j ) is the color values at i column and j row, N g is the number of pixels, and σ i , j is the standard deviation associated with i column and j row.
The values of eccentricity, elongation, roundness, [31,32,33,34,35], centroid length, length of the small and large axes, and length of the large axes as shape features were calculated.
Eccentricity = 1 ( b a ) 2
Elongation = a b
oundness = 4 π A p 2
where a, b, A, and p are the length, width, area, and perimeter of the object, respectively.
After feature extraction, efficient features were selected among all extracted features based on a quadratic sequential feature selection method [36]. To do this, an algorithm was developed using MATLAB. The efficient features were considered as inputs of classifier models.

2.3. Classification

Different models based on linear discriminant analysis (LDA), support vector machine (SVM), and artificial neural networks (ANN) methods were developed by using MATLAB to classify the selected features [36,37,38]. The LDA is a statistical method that detects different groups by determining boundaries in the predicted space between the groups based on multivariate normal density with an estimated pooled covariance [39]. The SVM is a supervised non-parametric statistical method to achieve higher accuracy with fewer training samples for classification [40]. The ANN has a smart-learner dynamic system that transfers the knowledge or law behind the empirical data to a predictive or classified model [18].
To verify the developed LDA and SVM methods, 75% of the data (203 samples) were randomly selected for training the classifier, and the remaining 25% (67 samples) was used for testing the model. Sixty percent of the data (162 samples) was randomly selected for training the ANN classifier, 20% (54 samples) of the random selected data was used for validating the models, and the remaining 20% (54 samples) was used for testing the developed models. The data used for validating and testing were not used in the training. After the evaluation of the classification result, the optimum classifier model was selected based on the classification accuracy of the whole data for each processing step (training, validating, and testing). Different ANN structures based on feed-forward back propagation network with the tansig and purelin activation function for hidden and output layers, respectively [12], were evaluated. The Levenberg–Marquardt training algorithm was used due to its higher speed and prevention of over-training of the network which often leads to inappropriate model learning [12]. Different artificial neural network models were evaluated with different constructions to select the optimal network. For this purpose, the number of neurons in the hidden layer has varied from 2 to 20 in different ANN structures.
The classifier models were developed to compare the classification accuracies by using the confusion matrix. Confusion matrix is a popular measure used while solving classification problems and it is a well-accepted method in the field of machine learning and specifically the problem of statistical classification [41,42]. The model development was in such a way that they generated the confusion matrix for each training, testing, and validation step, individually. Additionally, the developed models generated a total classification rate.

3. Results

3.1. Efficient Features

The mean of the selected efficient features of the seven groups is given in Table 1.
The values of different features for most groups were different (Table 1). For example, the maximum value of the correlation feature was associated with the matured (sound and wrinkle) kernels, while the minimum value was associated with unripe and stones. The unripe kernels had a smaller major diameter than that of matured kernels, while the stalk had the longest major diameter. The value of the energy feature in the B channel for brown kernels was the highest, while other objects had a lower value. This result indicated that the correlation features could detect different objects. The values of these features for all images were used as the input of the developed classifiers.

3.2. Classification

The efficient features of the three groups were classified by using linear discriminant analysis, support vector machine, and artificial neural network methods. The three groups were desired kernel (sound kernel), the undesired kernel (wrinkled, immature, and brownish kernel), and foreign material (stalk and stone). Confusion matrices for training and testing the LDA and SVM method and those for training, validating, and testing the ANN method were calculated by the developed classification algorithms.

3.2.1. Linear Discriminant Analysis

The confusion matrices associated with the linear discriminant analysis classifier are presented in Table 2. The correct classification rates of the model in training and testing were 91.3 and 94.0%, respectively. Five sound kernels (12.2%), seven undesired kernels (6.5%), and six foreign materials (11.1%) were misclassified in training. During testing, 4 out of 18 foreign material objects (22.2%) were incorrectly detected as undesirable seeds. The overall accuracy of the linear discriminant method was 91.9%.

3.2.2. Support Vector Machine

The classification accuracy of the model for the train and test data was 100% and 53.8%, respectively (Table 2). All undesirable chickpea kernels were correctly classified but all desirable chickpea kernels and foreign materials were misclassified. During testing, 36 out of 67 objects (53.7%) were correctly identified and 31 objects (46.3%) were misclassified. The total accuracy of the SVM classifier was 88.5%.

3.2.3. Artificial Neural Network

The number of neurons in the input and output layer was 14 (efficient features) and 7 (output groups), respectively. The highest percentage of the correct classification rate was related to an ANN model with 14 neurons in the hidden layer. The accuracies of the optimal ANN classifier during training, validating, and testing were 98.8, 81.5, and 92.6%, respectively. The overall accuracy of the model based on the ANN method was 94.4% (Table 2).

3.3. Overall Accuracy

The higher detection rates in training were associated with the SVM (100.0%) and ANN (98.8%) model, while the LDA (91.3%) model had the lowest detection rate (Table 2). The classification accuracy in testing showed an opposite trend because the accuracy of the LDA model in testing was 94.0% and that of ANN and SVM was 92.6% and 53.8%, respectively (Table 2). As the test data for all classifiers were the same, this result indicated the higher ability of the LDA model in the testing step. During testing, the image was randomly selected and this resulted in different detection rates from that in the training.
The overall accuracy of the developed classifiers was dominated by the ANN model (94.4%), while the LDA (91.9%) and SVM (88.5%) were ranked after the ANN model.

4. Discussion

The classification accuracy in our study was higher than that in the impurity detection of rice [27]. Chen et al. [27] had a 76% classification accuracy and this low accuracy might be caused by the low detection rate of impurities in rice. The classification accuracy in our study was lower than that of the impurity detection in wheat reported by Shen et al. [29]. Shen et al. [29] achieved a 97.8% accuracy and the notable difference in color between wheat and impurities might be the main reason for their high accuracy. Chickpea kernels and impurities (unripe chickpeas and stalks) had a similar color which increased the detection difficulty and resulted in low detection accuracy. The same reason might be for the impurity detection in rice.
It is possible to develop a visual machine system quipped with a separating algorithm developed in this study and the system can extract the selected features for separating impurities from chickpeas as well as grading chickpeas based on the level of their ripeness. Therefore, image processing integrated with our developed ANN classifiers can be used as a simple, fast, and non-destructive method for the separation of undesirable chickpea kernels and impurities from chickpea kernels. The methods can be incorporated with a vision-based real-time system. To increase the accuracy of chickpea separation in the future, the developed algorithm in this study can be combined with algorithms based on the processing of hyperspectral images and the deep learning method.

5. Conclusions

In this study, chickpea seeds as the desired final product were distinguished from undesired chickpea kernels (wrinkled, immature, brown, and split) and impurities (stalk and stone) based on their difference in color, texture, and shape. The images of chickpeas, undesired chickpeas, and impurities were acquired and processed to extract the features of the images. The efficient features were selected among the extracted features and were classified by the developed linear discriminant analysis, artificial neural network, and support vector machine methods. The classification rate of linear discriminant analysis (94.0%) and artificial neural network (92.6%) was higher than that of support vector machine (53.7%) during testing. The overall accuracy of the ANN (94.4 %) model was higher than that of LDA (91.6 %) and SVM (88.5 %) classifiers. The image processing method can be used to upgrade the traditional separation, sorting, and grading methods, which can enhance product quality with decreasing operation costs.

Author Contributions

S.S., methodology and investigation. K.K., supervision, software, analysis, and writing. F.J., analysis, writing, and editing. All authors have read and agreed to the published version of the manuscript.

Funding

This research was funded by Ilam University.

Institutional Review Board Statement

Not applicable.

Informed Consent Statement

Not applicable.

Data Availability Statement

Data are contained within the article.

Acknowledgments

The authors thank Ilam University for partial funding of this study.

Conflicts of Interest

The authors declare no conflict of interest.

References

  1. Czuchajowska, Z.; Pomeranz, Y. Process for Fractionating Legumes to Obtain Pure Starch and a Protein Concentrate. Washington State University Research Fundation. U.S. Patent 5,364,471, 15 November 1993. [Google Scholar]
  2. Muehlbauer, F.I. Description and Culture of Chickpeas; Extension Bulletin 1112 Cooperative Extension Service Washington State University: Pullman, WA, USA, 1982. [Google Scholar]
  3. Sabaghpour, S.H. Major diseases of chickpea in Iran. In Proceedings of the Symposium on Grain Legumes in the Mediterranean. Agriculture, (LEGUMED), Rabat, Morocco, 25–27 October 2001. [Google Scholar]
  4. Jian, F.; Narendran, R.B.; Jayas, D.S. Segregation in stored grain bulks: Kinematics, dynamics, mechanisms, and minimization—A review. J. Stored Prod. Res. 2019, 81, 11–21. [Google Scholar] [CrossRef]
  5. Pandey, N.; Krishna, S.; Sharma, S. Automatic Seed Classification by Shape and Color Features using Machine Vision Technology. Int. J. Comput. Appl. Technol. 2013, 2, 208–213. [Google Scholar] [CrossRef]
  6. Mahajan, S.; Mittal, S.K.; Das, A. Machine vision based alternative testing approach for physical purity, viability and vigour testing of soybean seeds (Glycine max). J. Food Sci. Technol. 2018, 55, 3949–3959. [Google Scholar] [CrossRef]
  7. Kheiralipour, K.; Khazaee, Y.; Hosainpour, A.; Javadikia, H. Development of an algorithm based on image processing technique and sport vector machine to distinct potato from clod and stone. J. Res. Mech. Agric. Mach. 2019, 8, 1–11. [Google Scholar]
  8. Concha-Meyer, A.; Eifert, J.; Wang, H.; Sanglay, G. Volume estimation of strawberries, mushrooms, and tomatoes with a machine vision system. Int. J. Food Prop. 2018, 21, 1867–1874. [Google Scholar] [CrossRef]
  9. Guzmán, E.; Baeten, V.; Fernández Pierna, J.A.; García-Mesa, J.A. Determination of the olive maturity index of intact fruits using image analysis. J. Food Sci. Technol. 2015, 52, 1462–1470. [Google Scholar] [CrossRef] [Green Version]
  10. Kaur, H.; Sawhney, B.K.; Jawandha, S.K. Evaluation of plum fruit maturity by image processing techniques. J. Food Sci. Technol. 2018, 55, 3008–3015. [Google Scholar] [CrossRef]
  11. Kheiralipour, K.; Kazemi, A. A new method to determine morphological properties of fruits and vegetables by image processing technique and nonlinear multivariate modeling. Int. J. Food Prop. 2020, 23, 368–374. [Google Scholar] [CrossRef] [Green Version]
  12. Kheiralipour, K.; Pormah, A. Introducing new shape features for classification of cucumber fruit based on image processing technique and artificial neural networks. J. Food Process Eng. 2017, 40, e12558. [Google Scholar] [CrossRef]
  13. Linker, R.; Cohen, O.; Naor, A. Determination of the number of green apples in RGB images recorded in orchards. Comput. Electron. Agric. 2012, 81, 45–57. [Google Scholar] [CrossRef]
  14. Patel, K.K.; Kar, A.; Jha, S.N.; Khan, M.A. Machine vision system: A tool for quality inspection of food and agricultural products. J. Food Sci. Technol. 2012, 49, 123–141. [Google Scholar] [CrossRef] [Green Version]
  15. Surya Prabha, D.; Satheesh Kumar, J. Assessment of banana fruit maturity by image processing technique. J. Food Sci. Technol. 2015, 52, 1316–1327. [Google Scholar] [CrossRef] [PubMed] [Green Version]
  16. LeMasurier, L.S.; Panozzo, J.F.; Walker, C.K. A digital image analysis method for assessment of lentil size traits. J. Food Eng. 2014, 128, 72–78. [Google Scholar] [CrossRef]
  17. Shahin, M.A.; Symons, S.J. Seed sizing from images of non-singulated grain samples. Can. Biosyst. Eng. 2005, 47, 49–55. [Google Scholar]
  18. Kheiralipour, K.; Ahmadi, H.; Rajabipour, A.; Rafiee, S. Thermal Imaging, Principles, Methods and Applications, 1st ed.; Ilam University Publication: Ilam, Iran, 2018. [Google Scholar]
  19. Çakmak, Y.S.; Boyac, I.H. Quality evaluation of chickpeas using an artificial neural network integrated computer vision system. Int. J. Food Sci. Technol. 2011, 46, 194–200. [Google Scholar] [CrossRef]
  20. Ghamari, S. Classification of chickpea seeds using supervised and unsupervised artificial neural networks. Afr. J. Agric. Res. 2012, 7, 3193–3201. [Google Scholar]
  21. Sabzi, S.; Abbaspour Gilandeh, Y.; Razavi, M. Detection five varieties of Chickpea using image processing and hybrid artificial neural network particle swarm optimization classifier. In Proceedings of the 1st International and 5th National Conference on Organic vs. Conventional Agriculture, Ardabil, Iran, 16–17 August 2017. [Google Scholar]
  22. Pourdarbani, R.; Sabzi, S.; Kalantari, D.; Hernández-Hernández, J.L.; Ignacio Arribas, J. A computer vision system based on majority-voting ensemble neural network for the automatic classification of three chickpea varieties. Foods 2020, 9, 113. [Google Scholar] [CrossRef] [Green Version]
  23. Pourdarbani, R.; Sabzi, S.; García-Amicis, V.M.; García-Mateos, G.; Molina-Martínez, J.M.; Ruiz-Canales, A. Automatic classification of chickpea varieties using computer vision techniques. Agronomy 2019, 9, 672. [Google Scholar] [CrossRef] [Green Version]
  24. Sankaran, S.; Wang, M.; Vandemark, G.J. Image-based rapid phenotyping of chickpeas seed size. Eng. Agric. Environ. Food 2016, 9, 50–55. [Google Scholar] [CrossRef]
  25. Venora, G.; Grillo, O.; Shahin, M.A.; Symons, S.J. Identification of Sicilian landraces and Canadian cultivars of lentil using an image analysis system. Food Res. Int. 2007, 40, 161–166. [Google Scholar] [CrossRef]
  26. He, W.; Song, H.; Guo, Y.; Wang, X.; Bian, G.; Yuan, K. A Trajectory-based Attention Model for Sequential Impurity Detection. Neurocomputing 2020, 410, 271–283. [Google Scholar] [CrossRef]
  27. Chen, J.; Lian, Y.; Li, Y. Real-time grain impurity sensing for rice combine harvesters using image processing and decision-tree algorithm. Comput. Electron. Agric. 2020, 175, 105591. [Google Scholar] [CrossRef]
  28. Rong, D.; Wang, H.; Xie, L.; Ying, Y.; Zhang, Y. Impurity detection of juglans using deep learning and machine vision. Comput. Electron. Agric. 2020, 178, 105764. [Google Scholar] [CrossRef]
  29. Shen, Y.; Yin, Y.; Li, B.; Zhao, C.; Li, G. Detection of impurities in wheat using terahertz spectral imaging and convolutional neural networks. Comput. Electron. Agric. 2021, 181, 105931. [Google Scholar] [CrossRef]
  30. Mohd Ali, M.; Hashim, N.; Abdul Hamid, A.S. Combination of laser-light backscattering imaging and computer vision for rapid determination of oil palm fresh fruit bunches maturity. Comput. Electron. Agric. 2020, 169, 105235. [Google Scholar] [CrossRef]
  31. Khazaee, Y.; Kheiralipour, K.; Hosainpour, A.; Javadikia, H.; Paliwal, J. Development of a novel image analysis and classification algorithms to separate tubers from clods and stones. Potato Res. 2022, 65, 1–22. [Google Scholar] [CrossRef]
  32. Jahanbakhshi, A.; Kheiralipour, K. Evaluation of image processing technique and discriminant analysis methods in postharvest processing of carrot fruit. Food Sci. Nutr. 2020, 8, 3346–3352. [Google Scholar] [CrossRef]
  33. Azadnia, R.; Kheiralipour, K. Recognition of leaves of different medicinal plant species using a robust image processing algorithm and artificial neural networks classifier. J. Appl. Res. Med. Aromat. Plants 2021, 25, 100327. [Google Scholar] [CrossRef]
  34. Mohammadi, V.; Kheiralipour, K.; Ghasemi-Varnamkhasti, M. Detecting maturity of persimmon fruit based on image processing technique. Sci. Hortic. 2015, 184, 123–128. [Google Scholar] [CrossRef]
  35. Jahanbakhshi, A.; Kheiralipour, K. Carrot sorting based on shape using image processing, artificial neural network, and support vector machine. J. Agric. Mach. 2019, 9, 295–307. [Google Scholar]
  36. Kheiralipour, K.; Ahmadi, H.; Rajabipour, A.; Rafiee, S.; Javan-Nikkhah, M. Classifying Healthy and Fungal Infected-Pistachio Kernel by Thermal Imaging Technology. Int. J. Food Prop. 2015, 18, 93–99. [Google Scholar] [CrossRef]
  37. Kheiralipour, K.; Ahmadi, H.; Rajabipour, A.; Rafiee, S.; Javan Nikkhah, M.; Digvir, S.J.; Siliveru, K.; Malihipour, A. Processing the Hyperspectral Images for Detecting Infection of Pistachio Kernel by R5 and KK11 Isolates of Aspergillus flavus Fungus. Iran. J. Biosyst. Eng. 2021, 52, 13–25. [Google Scholar]
  38. Kheiralipour, K.; Ahmadi, H.; Rajabipour, A.; Rafiee, S.; Javan-Nikkhah, M.; Jayas, D.S.; Siliveru, K. Detection of fungal infection in pistachio kernel by long-wave near infrared hyperspectral imaging technique. Qual. Assur. Saf. Crops Foods 2016, 8, 129–135. [Google Scholar] [CrossRef]
  39. Chelladurai, V.; Jayas, D.S.; White, N.D.G. Thermal imaging for determining fungal infection in stored wheat. J. Stored Prod. Res. 2010, 46, 174–179. [Google Scholar] [CrossRef]
  40. Mountrakis, G.; Im, J.; Ogole, C. Support vector machines in remote sensing: A review. ISPRS J. Photogramm. Remote Sens. 2011, 66, 247–259. [Google Scholar] [CrossRef]
  41. Tharwat, A. Classification assessment methods. Appl. Comput. Inform. 2021, 17, 168–192. [Google Scholar] [CrossRef]
  42. Ting, K.M. Confusion Matrix. In Encyclopedia of Machine Learning, 1st ed.; Sammut, C., Webb, G.I., Eds.; Springer: New York, NY, USA, 2010. [Google Scholar]
Figure 1. Chickpea, dockage, and foreign materials: sound chickpea kernel (a), wrinkled chickpea kernel (b), immature chickpea kernel (c), brown chickpea kernel (d), split chickpea (e), stalk (f), stone (g), and sound chickpea kernel after background separation (h).
Agriculture 12 00995 g001
Figure 2. The developed image processing algorithm.
Agriculture 12 00995 g002
Table 1. The mean (±SE) efficient features of chickpea and impurities.
FeatureCh ȘChickpea KernelForeign Material
SoundWrinkleUnripeBrownishSplitStoneStalk
Correlation (pix ȘȘ)R0.99 ± 0.000.99 ± 0.010.97 ± 0.020.98 ± 0.010.99 ± 0.000.97 ± 0.010.98 ± 0.01
Energy (pix)R0.79 ± 0.050.89 ± 0.040.91 ± 0.050.90 ± 0.040.85 ± 0.020.83 ± 0.100.89 ± 0.06
Energy (pix)B0.79 ± 0.060.91 ± 0.320.92 ± 0.050.94 ± 0.030.88 ± 0.020.85 ± 0.090.90 ± 0.06
Energy (pix)a *0.82 ± 0.530.93 ± 0.370.97 ± 0.030.90 ± 0.040.91 ± 0.030.89 ± 0.070.93 ± 0.054
Mean (pix)I20.10 ± 0.010.10 ± 0.020.08 ± 0.010.08 ± 0.010.14 ± 0.010.04 ± 0.010.09 ± 0.01
Mean (pix)Cb−0.14 ± 0.13−0.14 ± 0.03−0.13 ± 0.01−0.09 ± 0.02−0.21 ± 0.02−0.06 ± 0.01−0.14 ± 0.02
Homogeneity (pix)H1.00 ± 0.001.00 ± 001.00 ± 0.001.00 ± 0.001.00 ± 0.001.00 ± 0.001.00 ± 0.00
Correlation (pix)V0.99 ± 0.000.98 ± 0.010.97 ± 0.150.98 ± 0.010.99 ± 0.000.97 ± 0.010.98 ± 0.01
Homogeneity (pix)V1.00 ± 0.001.00 ± 0.001.00 ± 0.001.00 ± 0.001.00 ± 0.001.00 ± 0.001.00 ± 0.00
Area (Kpix) 82.28 ± 16.1251.86 ± 16.4529.51 ± 21.9943.71 ± 21.07981.61 ± 12.5867.50 ± 48.0853.30 ± 37.54
Centroid (pix) 483.68 ± 77.35561.08 ± 70.31486.37 ± 100.64496.81 ± 93.48552.47 ± 84.54468.10 ± 100.34629.67 ± 138.65
Roundness (pix) 0.60 ± 0.150.49 ± 0.230.23 ± 0.110.31 ± 0.200.68 ± 0.080.20 ± 0.110.29 ± 0.16
Major diameter (pix) 359.55 ± 38.65299.62 ± 53.04242.92 ± 100.12288.820 ± 63.66362.66 ± 35.33346.36 ± 128.08518.65 ± 275.79
Elongation (pix) 1.22 ± 0.111.41 ± 0.451.67 ± 0.491.49 ± 0.361.26 ± 0.151.68 ± 0.583.82 ± 1.94
Ș Image channel, ȘȘ Pixel. * The a* color space.
Table 2. Confusion matrices associated with different classifiers.
ClassifierStep D aU bF cGA dSA eTA f
Linear discriminant analysis TrainingD a365087.891.391.9
U b5101293.5
F c064888.9
TestingD a1300100.094.0
U b0360100.0
F c041477.8
Support vector machineTrainingD a4100100.0100.088.5
U b01080100.0
F c0054100.0
TestingD a01300.053.8
U b0360100.0
F c01800.0
Optimal artificial neural networkTrainingD a330197.198.894.4
U b0860100.0
F c014297.7
ValidatingD a91090.081.5
U b124482.8
F c131173.3
TestingD a1100100.092.6
U b22700.0
F c021285.7
a D = Desired (sound) kernel, b U = undesired (undesired) kernel, c F = foreign materials, d GA = group accuracy, e SA = step accuracy, f TA = total accuracy.
Publisher’s Note: MDPI stays neutral with regard to jurisdictional claims in published maps and institutional affiliations.

