Article

Cannabis sativa L. Spectral Discrimination and Classification Using Satellite Imagery and Machine Learning

by
Fatih Bicakli
1,
Gordana Kaplan
2 and
Abduldaem S. Alqasemi
3,*
1
Institute of Graduate School, Eskisehir Technical University, 26555 Eskisehir, Türkiye
2
Institute of Earth and Space Sciences, Eskisehir Technical University, 26555 Eskisehir, Türkiye
3
Geography and Urban Sustainability, College of Humanities & Social Science, United Arab Emirates University, Al Ain P.O. Box 15551, United Arab Emirates
*
Author to whom correspondence should be addressed.
Agriculture 2022, 12(6), 842; https://doi.org/10.3390/agriculture12060842
Submission received: 26 April 2022 / Revised: 27 May 2022 / Accepted: 4 June 2022 / Published: 10 June 2022
(This article belongs to the Special Issue The Application of Machine Learning in Agriculture)

Abstract

:
Crops such as cannabis, poppy, and coca tree are used to make illicit and addictive drugs. Detection and mapping of such crops can be significant for the controlled growth of the plants, thus supporting the prevention of illegal production. Remote sensing has the ability to monitor areas for cannabis growing. However, in the scientific literature, there is relatively little information on the spectral features of cannabis. Here in this study, we aim to: (1) offer a literature review on the studies investigating Cannabis sativa L. using remote sensing data; (2) define the spectral features of cannabis fields and other plants found in areas where cannabis is produced in northern Turkey; (3) apply machine learning algorithms for distinguishing cannabis from non-cannabis fields. For the purposes of this study, high-resolution imagery from PlanetScope satellites was used. The investigation showed that the most significant difference between cannabis and the other investigated plants was noticed in May–June. The classification results showed that, with Random Forest (RF) cannabis, fields can be accurately classified with accuracy higher than 93%. Following these results, the investigations with machine learning techniques showed promising results for classifying cannabis fields.

1. Introduction

Drug use, especially cannabis, has increased significantly in the last two decades [1]. It is estimated that around 83 million, or 28.9%, of adults aged 15–64 in the European Union have used illicit drugs at least once in their lifetime [2]. Crops such as cannabis, poppy plant, and coca tree are used to manufacture illegal drugs and narcotic drugs [3]. These crops, which are very profitable financially, are grown in insecure areas, where rebellion is common and links with organized crime networks are strong. Cannabis, derived from the cannabis plant, is more of an illicit drug in demand worldwide than cocaine and heroin. Cannabis is one of the most common plants that can develop in any geography used for drug production. They are produced under the supervision of international organizations, subject to legal permission [4]. Mapping and monitoring cannabis crops and following their phenological developments are important in agricultural management.
In recent years, the photographing and monitoring of any region on the Earth has made great progress with satellite remote sensing technology. These developments have increased the use of remote sensing for agricultural purposes, and its economic benefits have been recognized in all developed countries [5]. Today, satellite remote sensing is used as an effective fighting method in drug smuggling beyond agricultural activities [6]. The increase in illegal cannabis cultivation worldwide has caused researchers to focus on this issue. The studies carried out have observed that the cannabis plant gives serious characteristic reflection values at 530–550, 670–680 and 705–720 nm wavelengths, taking into account the variable parameters [7]. Most of the studies are done using spectroradiometers [8]. However, the studies in the literature for mapping, monitoring and understanding the cannabis fields characteristic are limited. In this study, a detailed literature review has been presented.
For the purpose of the study, we have used Turkey as a study area. Industrial hemp production in Turkey can be done by obtaining the necessary permits and licenses in 19 provinces and all their districts. Apart from the permitted provinces in our country, especially in the eastern and southeastern provinces, marijuana, production of illegal narcotics poses a serious problem. For the purposes of the second part of the study, high-resolution satellite imagery (PlanetScope) has been used in order to analyze the monthly dynamics of cannabis fields compared to several different agricultural fields.
Thus, the first part of this study represents a detailed review of all of the papers published on the investigated topic. Considering the literature gap, a spectral investigation using high-resolution satellite remote sensing data was done in the second part of the study. Here, we compared Cannabis sativa L. spectral characteristics in different periods of the year and compared it with other plants that are grown nearby. Using the spectral differences, in the third part of this study, we used machine learning techniques in order to classify Cannabis sativa L. from other croplands.
The main objectives of this paper are: (i) Detailed literature review of remote sensing and narcotic plants; (ii) Investigating spectral phenological characteristics of Cannabis sativa L. and comparison with different plants; (iii) Using machine learning techniques for classifying Cannabis sativa L.

2. Literature Review

For the purpose of this study, a search in the Scopus database was done using the terms “remote sensing” and “hemp”, “remote sensing” and “cannabis”, “remote sensing” and “narcotics”. All of the research papers were research articles. The paper was done in different parts of the World (Figure 1). The articles were separated into three different groups (i) Cultivated Area Detection; (ii) Classification; (iii) Spectral research.

2.1. Cultivated Area Detection

Several investigations on remote sensing methods were conducted as part of policy measures to resolve illegal crop plantings in Afghanistan, where insecurity and riots are common in regions linked to organized crime networks [9]. The investigations were carried out in the main cannabis-growing areas in Afghanistan. The study aimed to obtain an estimation tool for image acquisition by testing the cannabis phenology in different regions of Afghanistan with satellite images to best describe the cannabis plant and whether it differs from the general vegetation at the end of the growing season using Landsat data. The results showed that the cannabis plant reaches its maximum number of senescence occurrences after active summer vegetation, confirming the experience of the United Nations Office on Drugs and Crime staff that cannabis is harvested after other crops. However, it has been stated that more extended time series are required to obtain more robust results. Another factor will increase the study’s accuracy in generating data on the phonological stages of crops in the region other than cannabis. In addition, it has been evaluated that increasing the accuracy of the study will be effective with the developing technology, high spatial resolution and satellite images with a high temporal resolution, which will be effective in more accurate calculation of phonological phases.
Based on the Cooperation Agreement signed in Tirana on 19 July 2007 between Italy and Albania, hyperspectral analyses have been carried out with aerial remote sensing methods to detect and monitor cannabis fields in Albania and aimed to locate the cannabis hidden areas. Within the scope of the research, Piaggio P180, Piaggio P166 DP1 and ATR 42 MP model aircraft configurations were made, and hyperspectral images were produced with Phase One iXA 180 digital camera and CASI 1500 sensor. In addition to these, digital satellite images of the EROS-B satellite were provided. As a result, hyperspectral data were produced by photographing 12.5% of the Albanian lands. The processing of these data led to 304 cannabis fields capable of producing 32 tons of narcotic substances to be presented to the European market.
Jia et al. [10] investigated the opium yield, main crop measurements and environmental parameters of poppy in an official farm in Gansu province in northwest China, where opium production is suitable. The study’s main aim was to find indicators that will enable to correlate opium yield estimations with remote sensing methods. In this direction, parameters related to opium yield, leaf area index, and plant height at different growth stages of opium poppy were collected from sample areas within the study areas every year. Firstly, the planting density of the poppy spruce was determined. In the second stage, the latex materials exposed by the scratches on the poppy capsules were collected. Thus, the opium yield obtained from the study areas was determined. LAI 2000 plant canopy analyzer was used for leaf area index estimation studies. Measurements were made for each region. The plant height was measured using a steel tape measure from the ground to the top of the plant, and the average length values were taken. As a result of these studies, plant height did not show a general trend with opium yield, and it was observed that it was not a determining factor. It has been observed that the leaf area index, on the other hand, has a significant relationship with opium yield, and leaf area indexes during flowering and harvest periods can be used in opium yield estimation studies. The fact that the leaf area index can be derived from remote sensing data is one of the research topics of the remote sensing technique [11]. Detection of poppy cultivation areas with remote sensing methods and collecting opium production information is essential because it poses a danger to natural (high mountains) and social (armed criminals) elements.
Portugal and Hwan [12] focused on the preliminary findings of a larger study by examining the compatibility of cannabis growers in combating illegal cannabis cultivation on private lands in forested watersheds of Northwest California. Their study used aerial imagery and GIS analysis, investigating several factors for cannabis field detection.
In their study, Demir and Başayiğit [13] aimed to detect opium poppy plants by remote sensing methods in the Gonen plain in the north of Isparta in the western Anatolian region of Turkey. For this purpose, an area of 4 km² was chosen for opium poppy detection, using QuickBird-2 high resolution (0.61 m) imagery. Along with opium poppy, seven different agricultural products were in the study area. For the analyses, both pixel-based and object-based classification have been performed, and the results showed high accuracy for both classifications. However, as expected, the object-based classification was slightly superior over the pixel-based classification. As a result of these studies, the object-based image analysis approach has proven to be effective for classifying agricultural land cover. However, many misclassifications have occurred in the study area of poppy and rose plants. However, it has been stated that the control of the cultivation of special plants, such as narcotic, can be followed together with remote sensing technologies.
A study in the southern part of the State of Pernambuco, located in the northeast of Brazil, aimed to determine the illegally grown cannabis plant areas in arid environments with object-based image analysis using SPOT-5 imagery [14]. In addition to the analysis studies, land cover classes, anthropogenic areas, slope, and distances to water resources were also used in object-based image analysis. The classification system identified more than 50% of the cannabis cultivated areas in the region.
A deep learning methodology for mapping the location and spatial distribution of plots of poppy plants in Phongsali province, located in the northernmost part of the Lao PDR, has been performed [15]. Unlike poppy, which is grown along river valleys in Afghanistan, most poppy crops in this region are planted on steep slopes, and the shape and size of poppy plots differ from agricultural plots. China’s ZiYuan-3 and GaoFen-2 satellite data were used within this scope. Actual data on the plots of poppy plants were provided by the National Narcotic Control Commission of China. The working model was trained using ZiYuan3 satellite data with two-meter spatial resolution. It has been observed that the model produced good predictions (over 80%) for both dense and sparse areas, and it also has good generalization ability for poppy parcel identification.
Experiments on multispectral images to distinguish widely grown soybeans and six different wild plant species in Starkville, Mississippi, have also been conducted [16]. To make comparisons of these experiments, plant species were planted in the soil at different densities. Therefore, multi-band aerial images were collected. The images were analyzed using supervised classification methods in all four spectral bands. The study aimed to distinguish vegetation and soil with a two-class system, soil, soybeans, and weeds with a three-class system, and soil, soybean, and six different weed species with an eight-class system. As a result, soil and soybean classification accuracies were evaluated positively with supervised classification methods. Although the accuracy rate of wild plants lags behind soil and soybean, it has been concluded that the accuracy can be increased with field studies.
Low-resolution imagery such as Moderate Resolution Imaging Spectroradiometry (MODIS) data has also been used to improve understanding of agriculture and crop production in Afghanistan [17]. Thus, field data’s NDVI (Normalized Difference Vegetation Index) has been used to track opium and grain crops in the Afghanistan region. Multi-temporal crop data were referenced from 47 field locations collected by UNODC in 2005, representing the wide geographical diversity of poppy-growing areas. Many locations determined with reference data from poppy production areas were compared within this scope. The highest vegetation activity, corresponding to the first cycle peak of the NDVI profile, was observed in the flowering stages of both poppy and wheat. In line with these observations, the timing of the flowering period has been evaluated as a critical piece of information within the scope of the fight against narcotics. In addition, when the profiles are examined, it is observed that there is a great variability in phenology caused by the latitude and altitude in Afghanistan. In addition, environmental factors such as the availability of water in the field are also one of the observations of this study. The results suggest that different subpixel crop mixes may exhibit different NDVI profiles, making this approach possible in other agricultural systems.

2.2. Classification

Researchers have tried to classify narcotic fields through image classification, such as hemp [18]. In their study, Tunca and Köksal [18] aimed to classify plant species from Sentıne-2 satellite images by using Random Forest (RF), Support Vector Machine (SVM) and K-Nearest Neighbor (K-NN) machine learning algorithms. The study was carried out within the scope of wheat, vetch, hemp, chickpea, alfalfa, and silage corn crops grown on agricultural production lands in Amasya, Turkey, in 2020. Sentinel-2 satellite images were used between April and September of 2020 in order to analyze the mentioned crops with the specified machine learning algorithms. The results showed that the classification made with RF was the most successful classification, with a success rate of 95.3%. However, it should be noted that the study area was relatively small, with less than thirty crop fields.

2.3. Spectral Research

Evaluation of the use of ground-based hyperspectral sensing to investigate and map cannabis cultivated areas has been done in the botanical garden of Tel Aviv University [19]. The research was based on the measurement of the reflectance values by analyzing the spectral characteristics of the plants through hyperspectral images that will distinguish the cannabis plants from other plants in their surroundings. AISA Eagle hyperspectral detector, a hyperspectral detector based on ground measurements in open air, was used to make the measurements, and measurements were made from a distance of 75 m. The spectral reflection signatures of cannabis, citrus and grasses were examined on hyperspectral images. It was ultimately revealed that the spectral properties of cannabis are unique only in the wavelength range of 500–750 nm.
A cross-referenced study with controlled field experiments was conducted in the south of England, as the cultivation of opium poppies is illegal in Afghanistan [20]. In 2004 and 2005, the NDVI values of the crops were examined by experiments on poppies grown for the pharmaceutical industry on the farm in Hampshire using areal imagery. The results showed that even though the poppy plants in Afghanistan developed similarly to the poppy plants grown in the UK, the growing conditions and varieties were different. In addition, it was stated that the satellite images (IKONOS, Worldview-2 and Quickbird-2) used to perform the current NDVI analyses in Afghanistan and the digital aerial photographs used in the UK field trials were different. Although the study’s initial results were promising, there were insufficient observations per image to validate the methodology, so more data are needed for targeted sampling of representative areas. Similar to this study, field experiments were carried out on commercially grown crops in the United Kingdom due to the security problems in Afghanistan within the scope of the fight against narcotics. In this study, MODIS images and NDVI profiles were used. Timing obtained from MODIS profiles was noted to assist experts in interpreting high-image images of possible crop types and current growth stages [21].
Using spectral information from Formosat-2, Sicre, Baup et al. [22] presented techniques for crop production forecasting and orientation of crop rows to improve soil erosion management in a field study near Toulouse in southwestern France. Five crops including wheat, barley, sunflower, corn and hemp plants were considered. Results showed that various factors such as plant geometry, vegetation cover, spacing between rows, tractor tire tracks, overlapping of agricultural implements can cause a radiometric change in plot line orientations.
Leaf area index estimation investigations were carried out in the Lebanese Bekaa Valley with a total cultivated area of 118,000 hectares, aiming to monitor crop development and growth. Hemp, mint, potatoes, beans, cabbage, and carrots are the main agricultural products in the study area. In the study, vegetation index analyses were carried out using Landsat-8 and Sentinel-2 data [23]. As a result, due to its temporal resolution, the limited number of Landsat images missed biophysical observations during the growth stages, demonstrating the importance of observations obtained with the combination of Sentinel-2 data.
Holmes et al. [24] used hyperspectral reflectance imaging to classify Cannabis sativa flowers, stems and leaves using statistical machine learning. Although the study is not geospatial, it presents the mean reflectances of Cannabis sativa, and the differences between the buds, leaves, and stems. The results showed promising results for developing a real-time monitoring system for supporting the optimal daily growing conditions for better crop management [25,26].

3. Materials and Methods

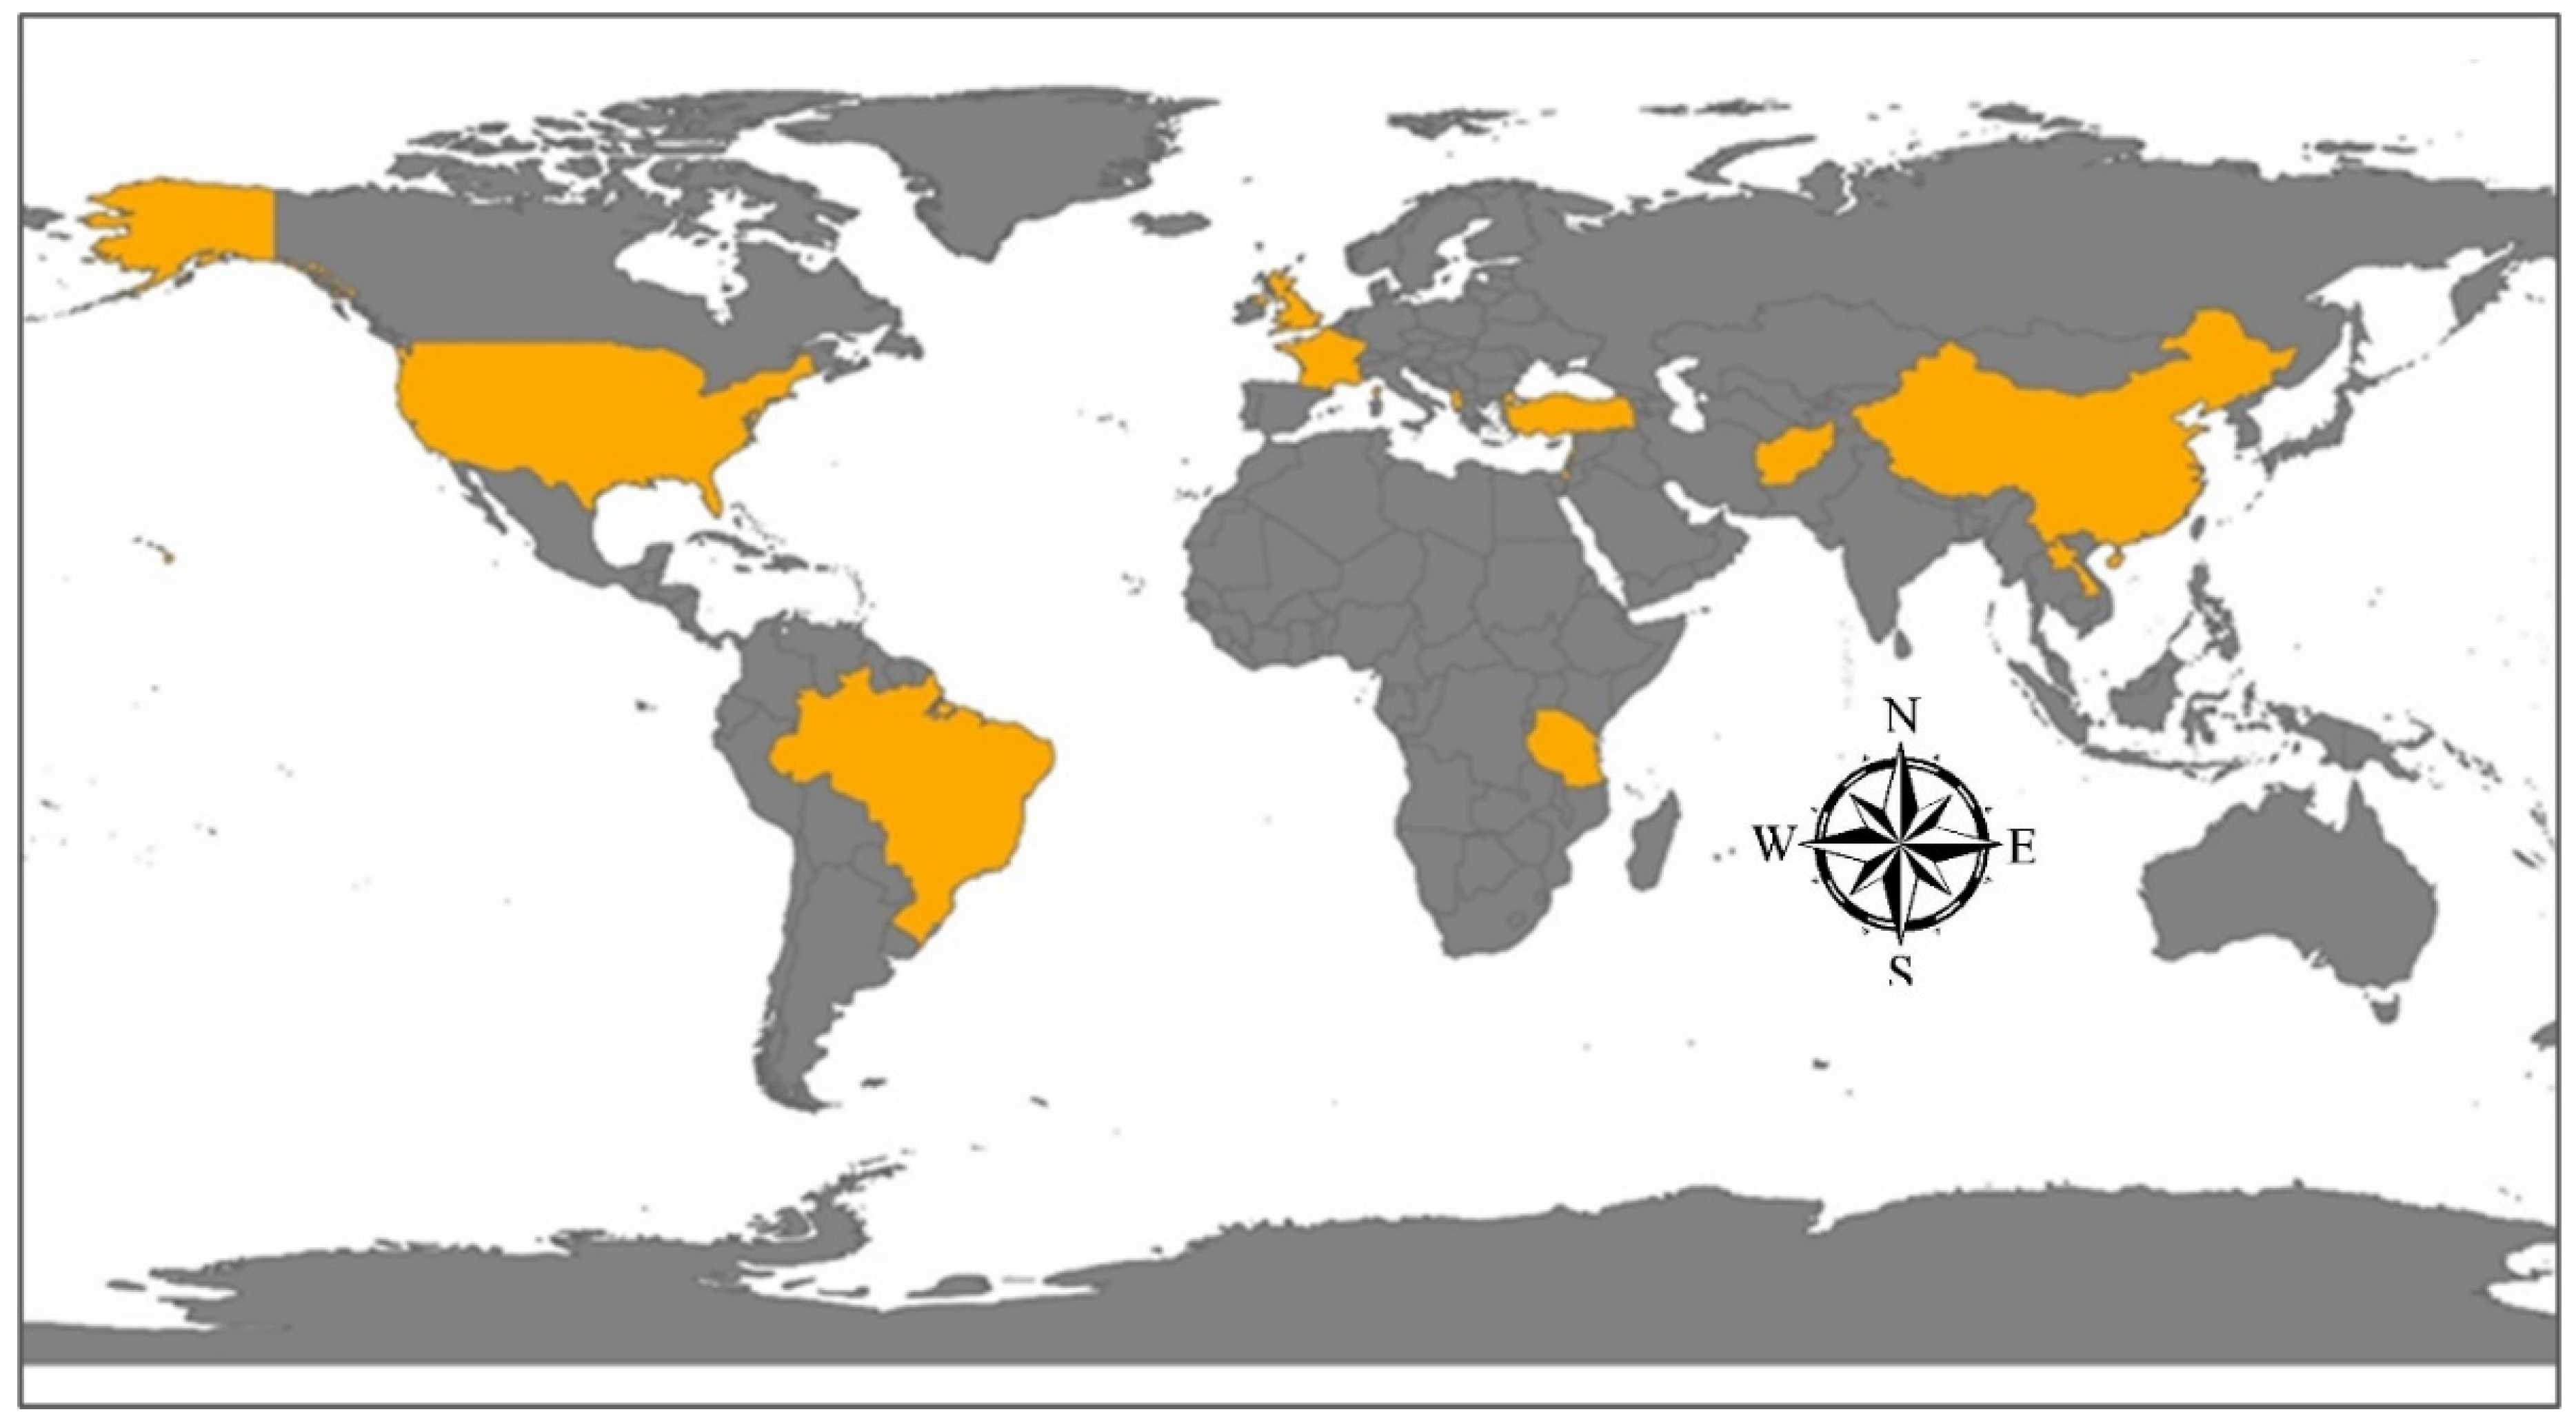
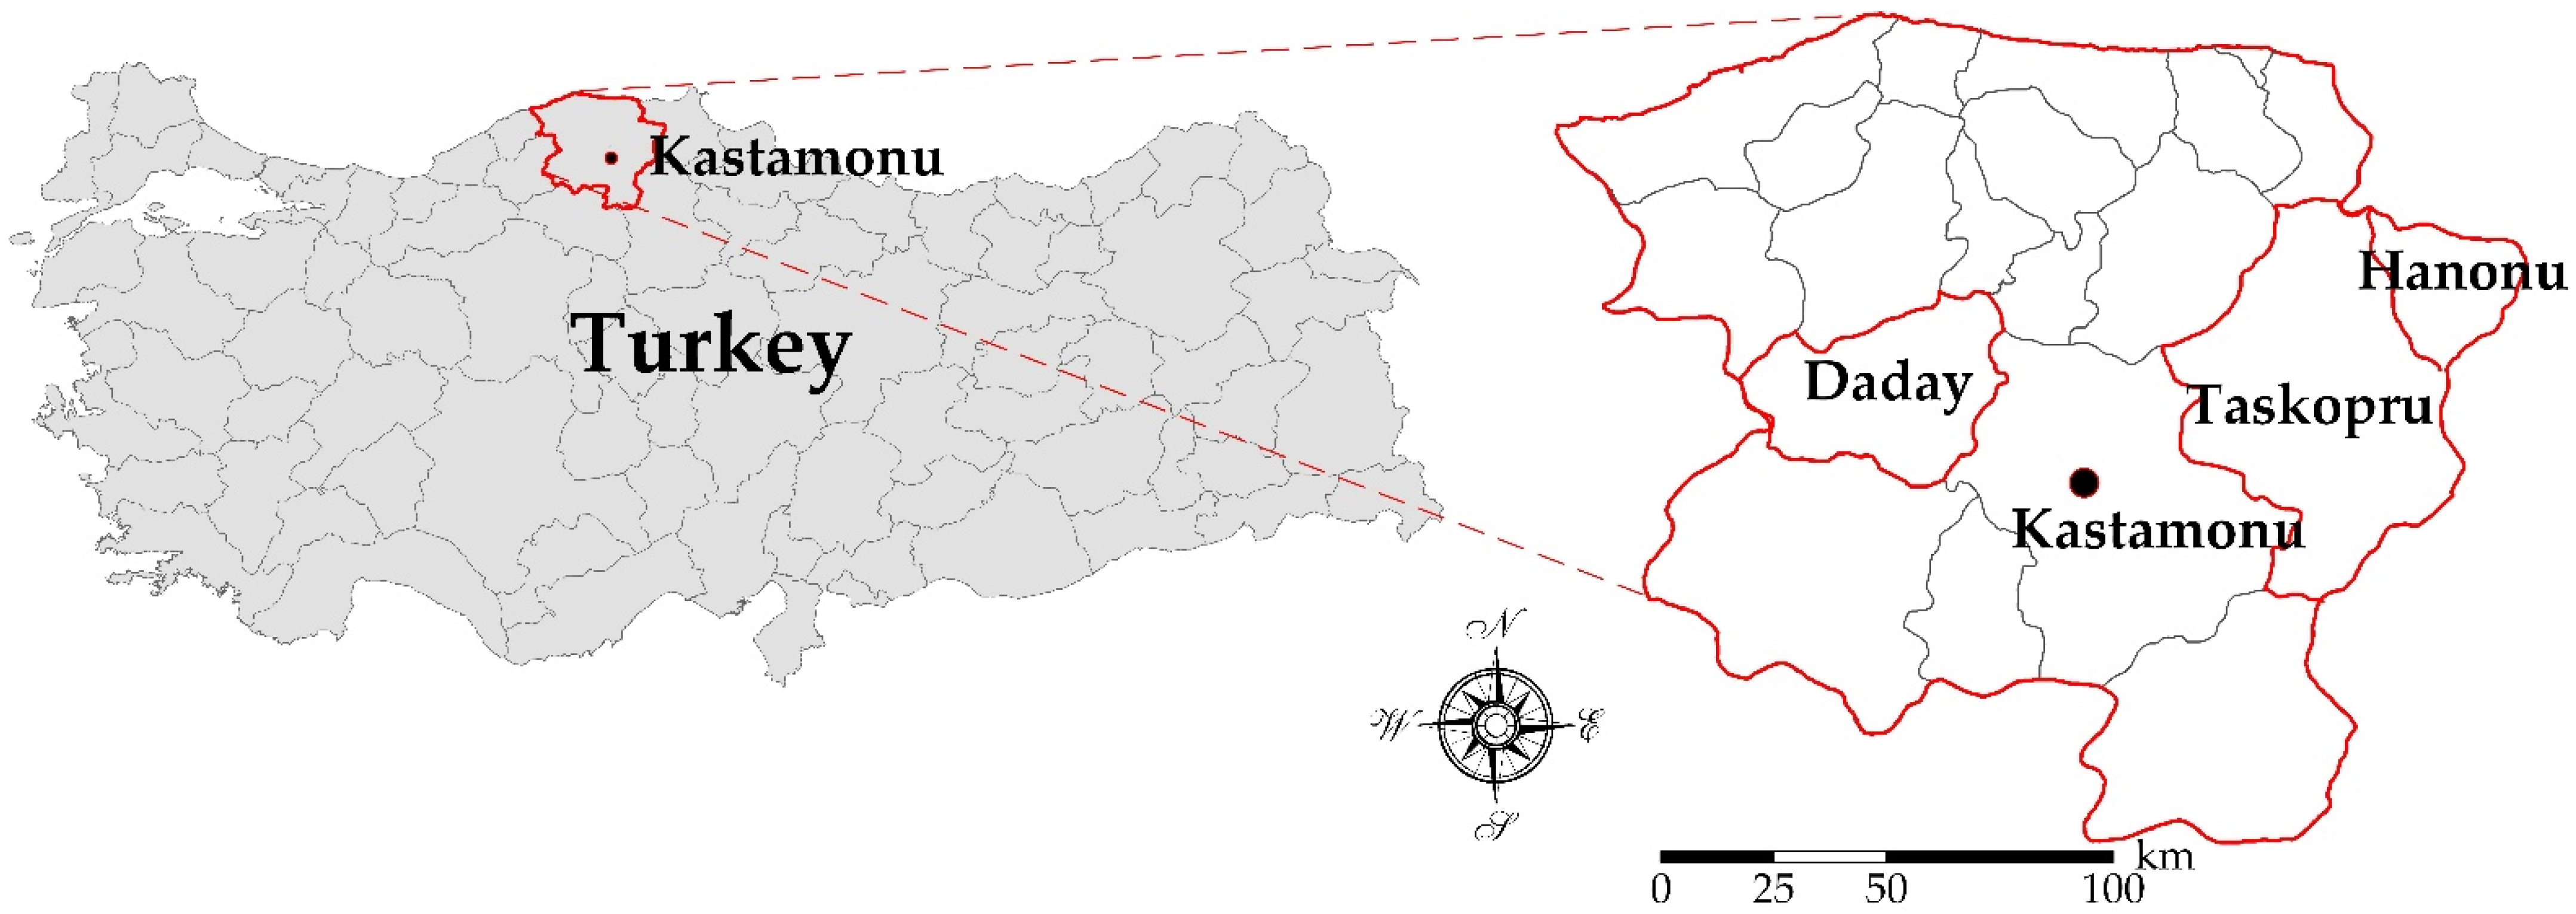
3.1. Case Study—Turkey

Here in this study, we investigated spectral values from legal Cannabis sativa L. in the Kastamonu province, over croplands in the towns Daday, Hanonu, and Taskopru. Kastamonu province is located in the Black Sea Region in Turkey (Figure 2). Kastamonu has a semi-humid climate, cold in winter, warm in summer, and an annual average temperature of 13.0 °C. The July average is 22.1 °C, and the January average is 4.2 °C. While the Black Sea climate is observed in the northern parts of the province, the continental climate is dominant in the south. Precipitation in the area is plentiful (average 842.6 mm), all seasons are rainy, and there is no dry period. The least precipitation in the province is in December–February, while the most precipitation falls between April and May.

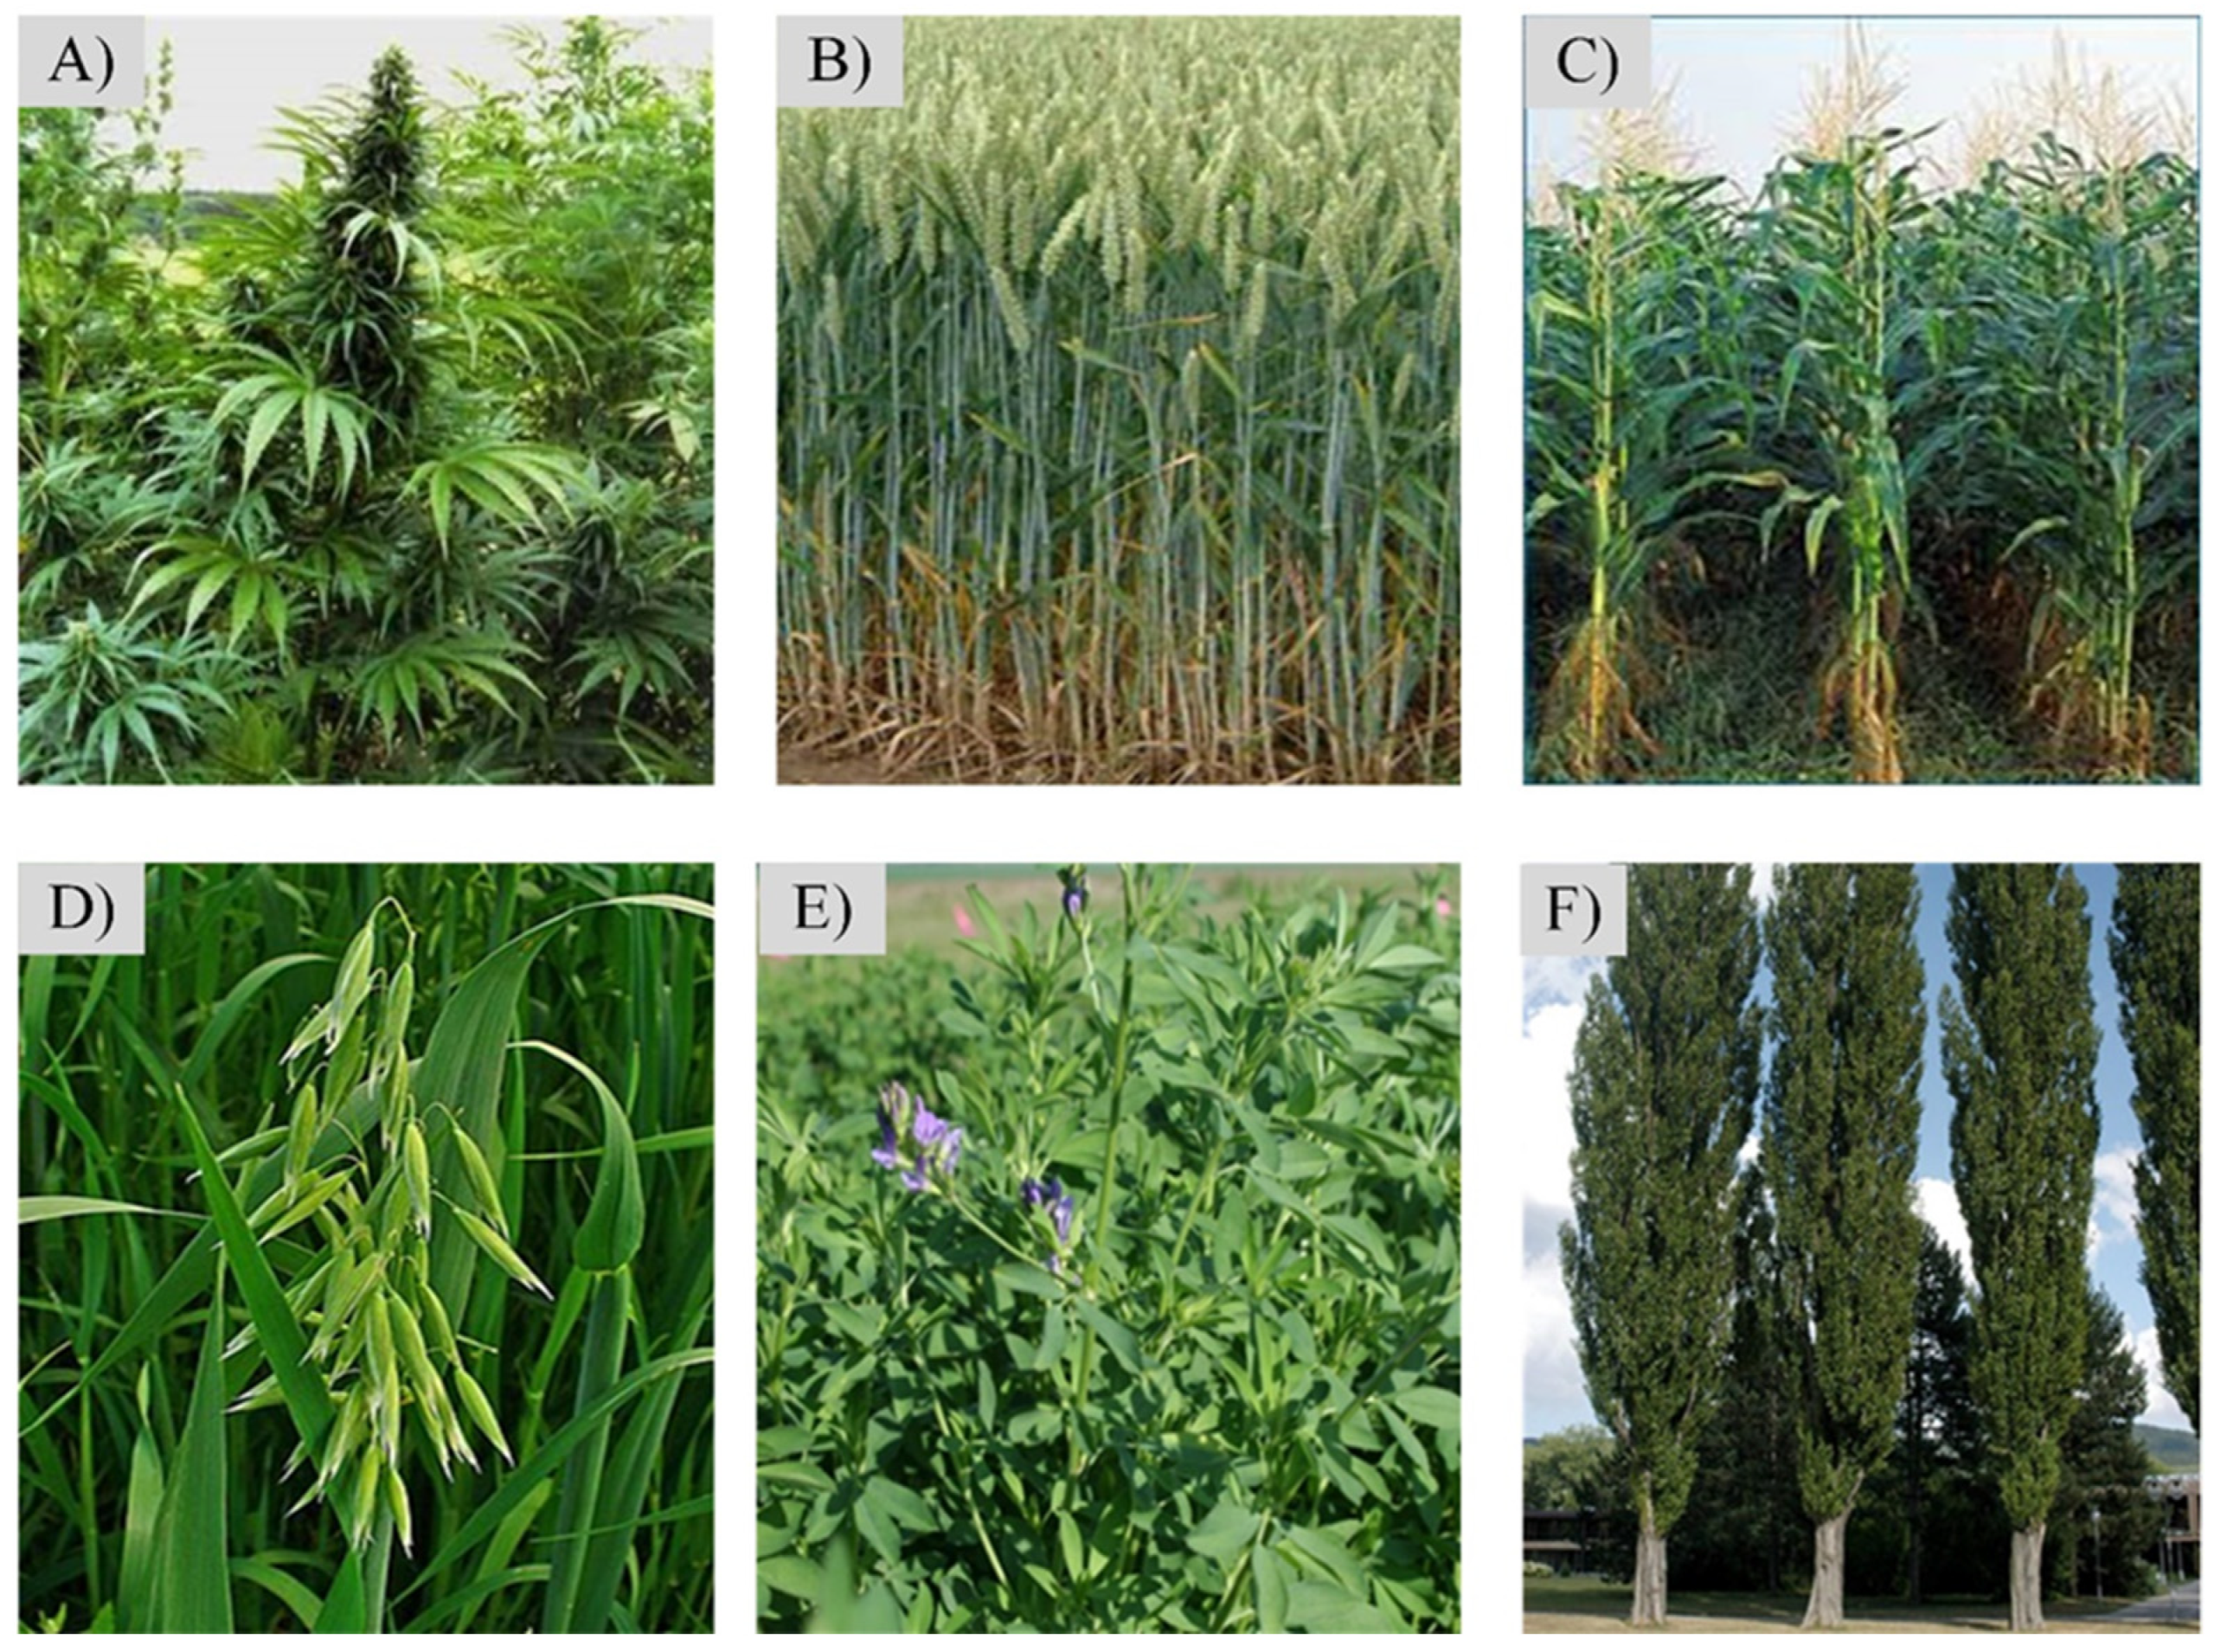
3.1.1. Specifics of the Investigated Plants

For the purpose of the study, we have obtained data from the Kastamonu Provincial Directorate of Agriculture and Forestry from eleven crop fields and the agricultural product grown on. Thus, besides Cannabis sativa L. data, crops from wheat, corn, oats, alfalfa, and cottonwood, were obtained. Thus, six parcels were from Cannabis sativa L., and one parcel was from the other products.
The homeland of the cannabis plant is estimated to be Central Asia and the Indian subcontinent, and it is an annual herbaceous plant that can grow from 50 cm to 3 m. The stem of the plant is upright and hollow, and its surface is rough due to the thorny hairs. It is cultivated in most temperate and tropical regions. The genus of plants is divided into male and female. While the male plants generally produce pollen, the female plant flowers and contains a high amount of tetrahydrocannabinol, the raw material of cannabis (Figure 3A).
Wheat plant (Figure 3B) is an annual herbaceous plant whose homeland is estimated to be Anatolia. Small granular fruit structure is usually made into flour and constitutes one of humans’ most important food sources.
The corn plant is an annual plant that thrives in warm climates and realizes its growth and development process on hot and sunny days. Although the trunk can grow from 60 to 80 cm to 3 m in length, it has a fringe root system (Figure 3C).
The oat plant is an annual agricultural plant and its homeland is west of Asia and the east of Europe. The leaves of the oat, whose stem length varies between 30 and 150 cm, are stripy, pointed and hairless (Figure 3D).
Alfalfa is a perennial herbaceous plant with a deep root system that can reach 50 to 80 cm in height (Figure 3E). It is estimated that alfalfa, which is generally used in animal husbandry, originates from the geography of Turkey. The soils in which alfalfa grows best are loamy, sandy–loamy and contain enough lime, but it is usually harvested in spring or autumn.
Cottonwood trees are dioecious woody plants from the willow family and all varieties exist as trees. Cottonwood trees that grow well on stream banks and in sunlight generally have a shallow root system. The leaves, which are mostly long-stalked, are in various forms and sizes, such as triangular, elliptical, egg-heart-shaped lobes or narrow stripes. Cottonwood trees, which show rapid growth, can reach up to 30 m in height (Figure 3F).

3.1.2. Satellite Remote Sensing Data
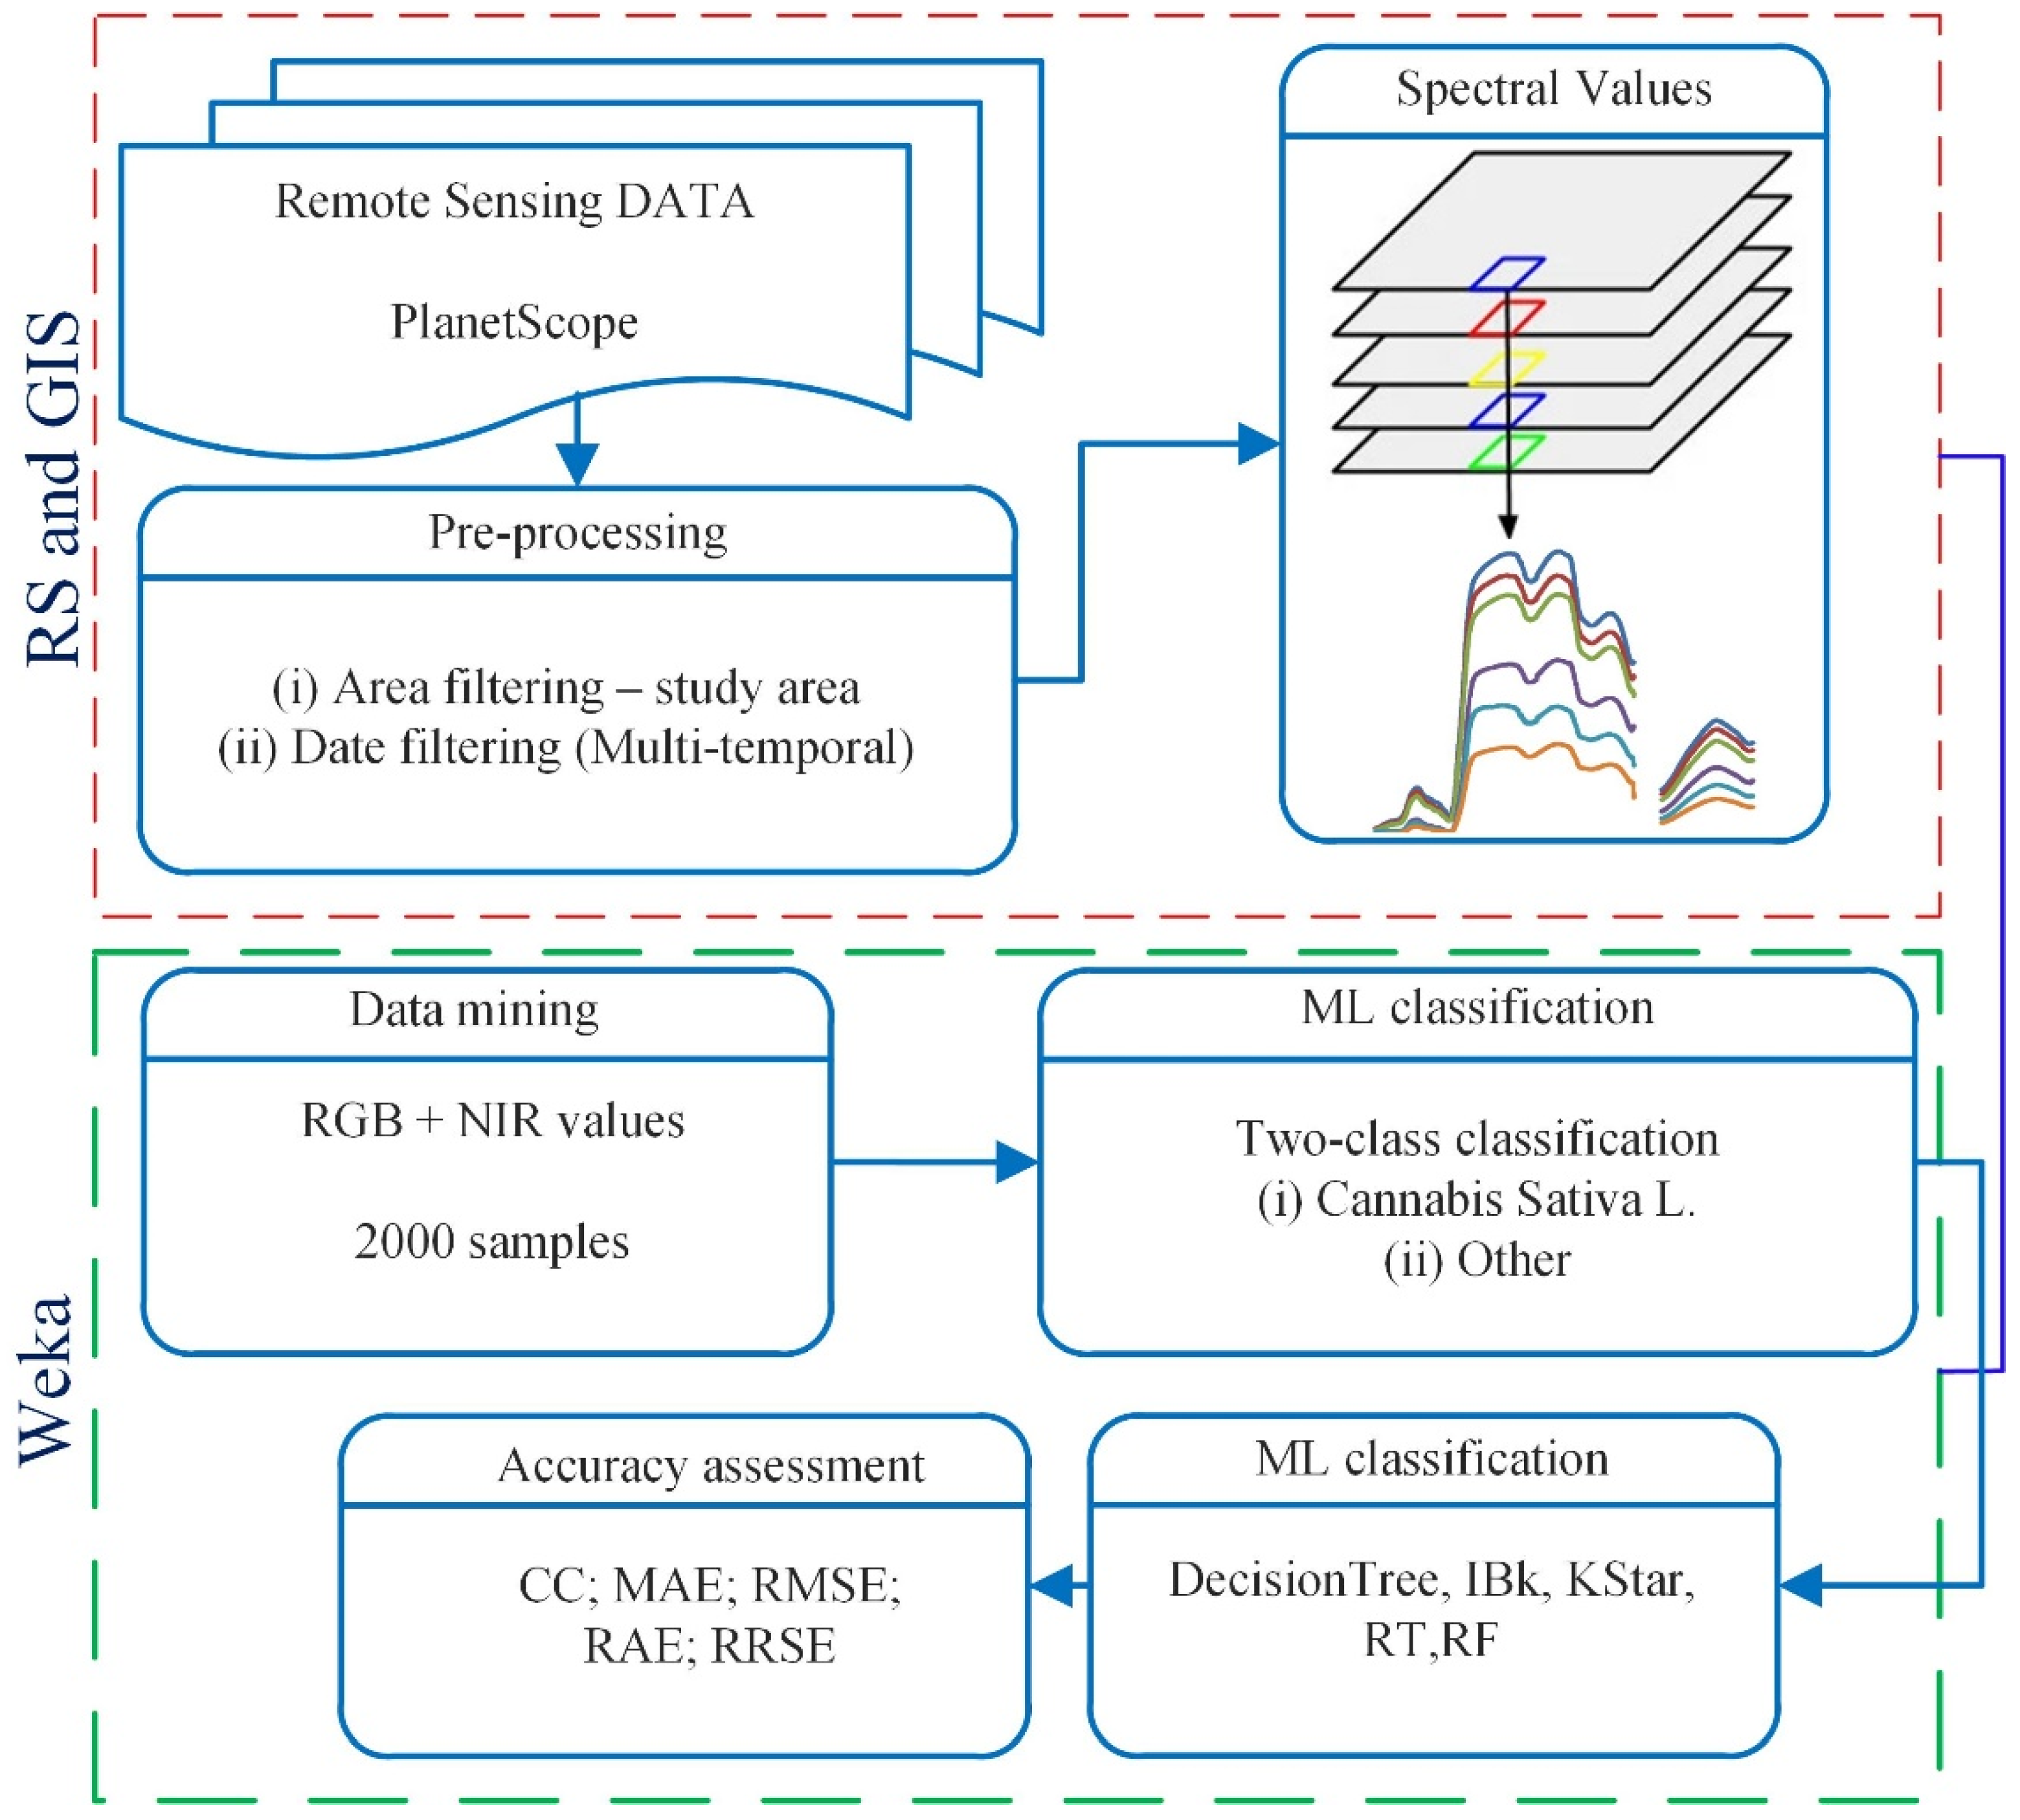
For the purpose of the study, we have used PlanetScope satellite imagery from nine months over three different study areas. The PlanetScope imagery offers daily data with 3.7 m spatial resolution. Besides the three visible bands (RGB), it also collects information in the near-infrared part of the electromagnetic spectrum. With the open-source data for research, PlanetScope has been widely used in many applications over the last few years, including soil salinity estimation [27], phenology studies [28], crop type mapping [29], etc. The PlanetScope data have also been used for enhancing the spatial resolution of middle-spatial resolution satellite data such as Landsat and Sentinel-2 for further investigation [30]. For the purpose of this study, PlanetScope Ortho Scene Product, Level 3B, a orthorectified surface reflectance image suitable for analytic applications was used. Detailed information about the PlanetScope data can be found in Table 1.

3.2. Methods

The study has been performed in five different steps. After determining the study area and acquiring data for the crop types, we have downloaded the PlanetScope satellite imageries from the Planet Explorer. Spectral values from every band for every available crop were extracted. As mentioned previously, we have compared Cannabis sativa L. with the following crop types, wheat, corn, oats, alfalfa, and cottonwood. In addition to the spectral band values, we also calculated the NDVI values for every crop. As a result of the literature research conducted in the study regions, the development processes of the phenological stages of the existing plants during the year were examined. According to the results of this research, satellite images of March, April, May, June, July, August, September, October and November of 2021 were selected, and the 10th and 20th day intervals of these months were taken into account. In the results section, we evaluated the investigated plants’ spectral differences and similarities. The period with most significant spectral differences between Cannabis sativa L. and the other plants was determined in this stage. A detailed flowchart of the methodology is given in Figure 4.
Using the spectral values from that period, machine learning techniques were used to investigate the possibility of classification of cannabis fields. Thus, 2000 point samples were collected from the Cannabis fields and the other fields. For this purpose, we used five different machine learning algorithms, namely, IBk, KStar, Decision Table, Random Tree and Random Forest.
The IBk method makes a forecast for a test case just-in-time rather than building a model. The IBk method employs a distance metric to choose k “close” instances in the training data for each test instance and then makes a prediction based on those selected instances [31].
The KStar classifier is an instance-based classifier that considers entropy as a measure of distance. Although it is similar to the nearest-neighbor classifier, the KStar algorithm differs in terms of processing steps. In addition to taking into account the entropy distance, it also includes probability sums in the solution [32].
RF, also known as random choice forests, is an ensemble learning approach for classification, regression, and other tasks that work by building many decision trees during training [33]. For classification problems, the RF output is the class chosen by the majority of trees. Similar to RF, RT is constructed from a single tree.
Decision Tables are an ordered collection of If-Then rules that have the potential to be more compact and hence more intelligible than decision trees and are an accurate way for quantitative prediction from decision trees. The decision-table-based technique was chosen because it is a simpler, less computationally costly algorithm than the decision-tree-based approach [34].
Of note, 70% of the data was used for training, while 30% for testing. The used models were evaluated using different accuracy assessment parameters. Thus, the Correlation Coefficient (CC) was used to estimate the merit of the variables. In addition, the results were evaluated using Mean Absolute Error (MAE) and Root Mean Square Error (RMSE), error-based analysis between the predicted and the observed values used to assess the model’s performance during the model processing [35].
MAE = i = 1 n | O i P i | n
RMAE = i = 1 n | O i P i | n
where O i is the observed and P i is the predicted value.
Relative Absolute Error (RAE) and Root Relative Squared Error (RRSR) were used to measure the performance of the predictive models [36].
RAE = i = 1 n | O i P i | i = 1 n | O i ¯ P i |
RRRSE = i = 1 n | O i P i | i = 1 n | O i ¯ P i |
where O i ¯ is a mean value of O i .
In addition, for the accuracy analyses, common evaluation statistics for binary classification were used. Namely, True Positives (TP) (a class correctly identified), False Positives (FP) (a class incorrectly identified; a commission error), and False Negatives (FN) (a class is missed; an omission error) parameters were taken into consideration. TP, FN, and FP indicate perfect identification, under-identification, and over-identification, respectively. Then the Precision (P), Recall (R), and F-score (F) were calculated. Precision (i.e., positive predictive value) describes the correctness of detected cannabis fields and how well the algorithm dealt with FP (Equation (5)), Recall (i.e., sensitivity) describes the building detection rate and how well the algorithm dealt with FN (Equation (6)), and the F-score is the harmonic mean of Recall and Precision and reports the overall accuracy considering both commission and omission errors (Equation (7)) [37]. From the confusion matrix, kappa statistics were also calculated.
P = TP/(TP + FP)
R = TP/(TP + FN)
F-score = 2 × ((P × R)/(P + R))
The data were separated into 70% for training the model and 30% for testing the model. As a result, the accuracy was evaluated using 600 independent points that were not part of the training set.

4. Results

The results of the study have been evaluated in three different parts, spectral signatures, NDVI results, and machine learning results.

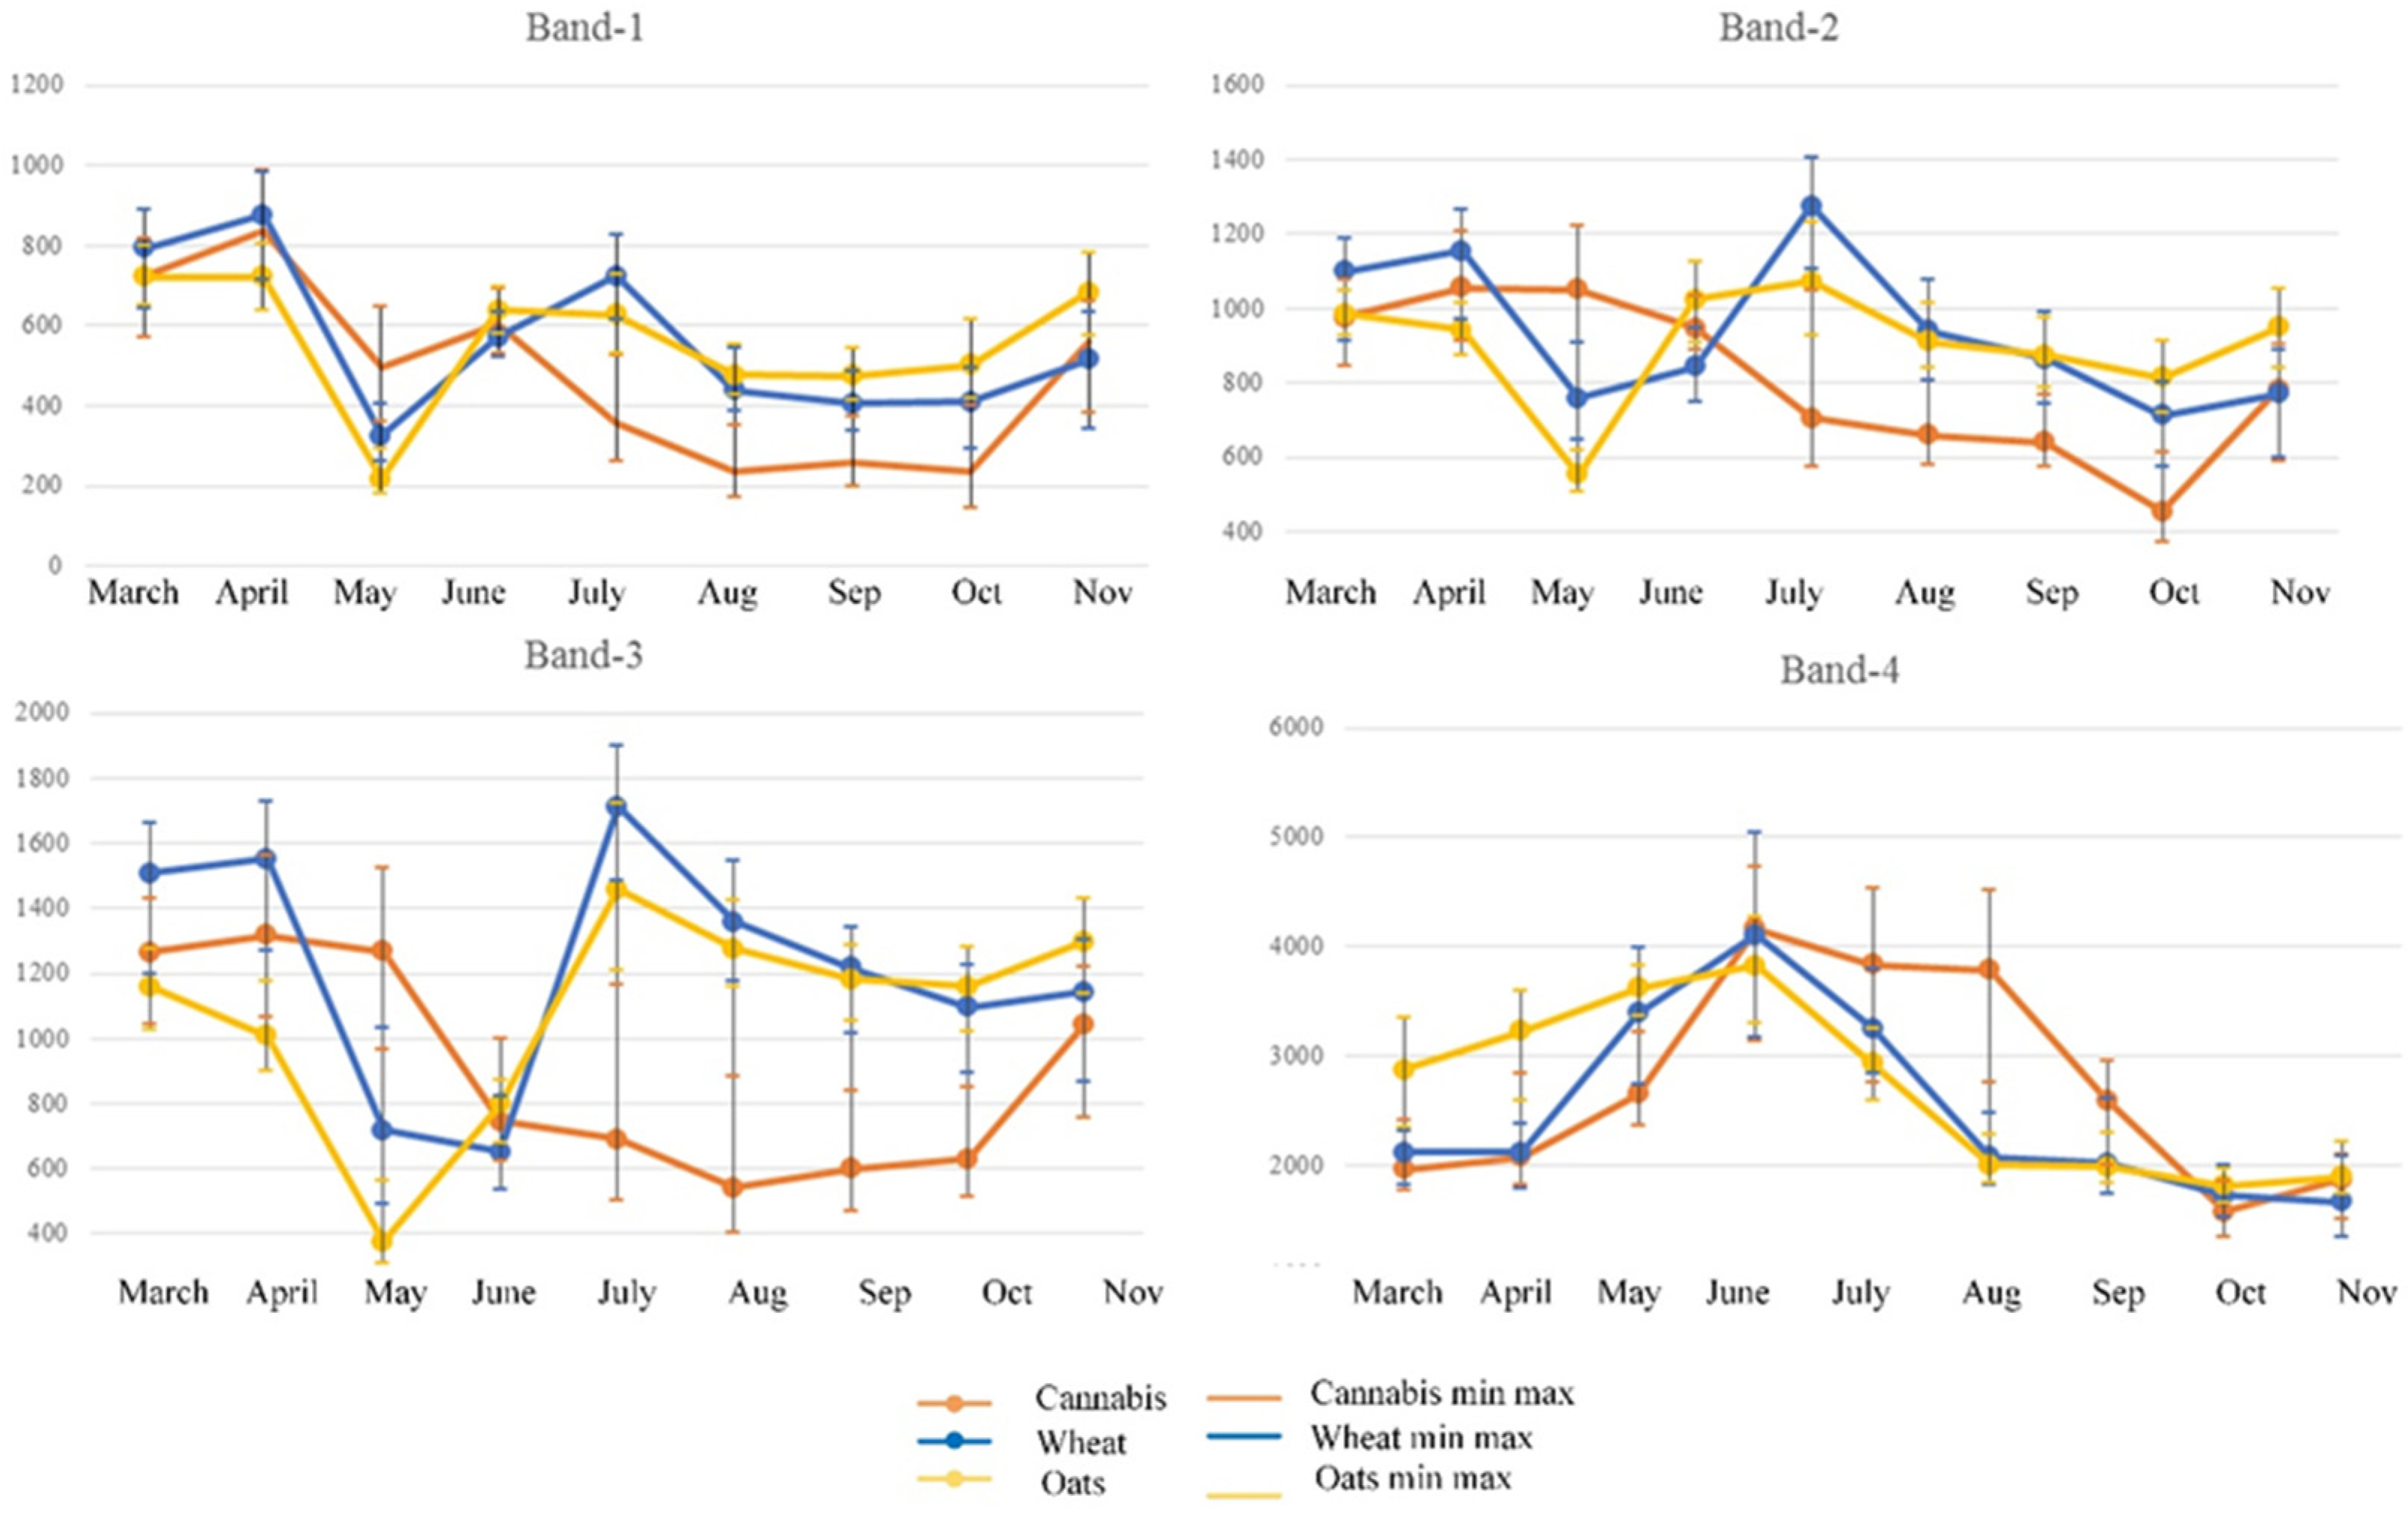
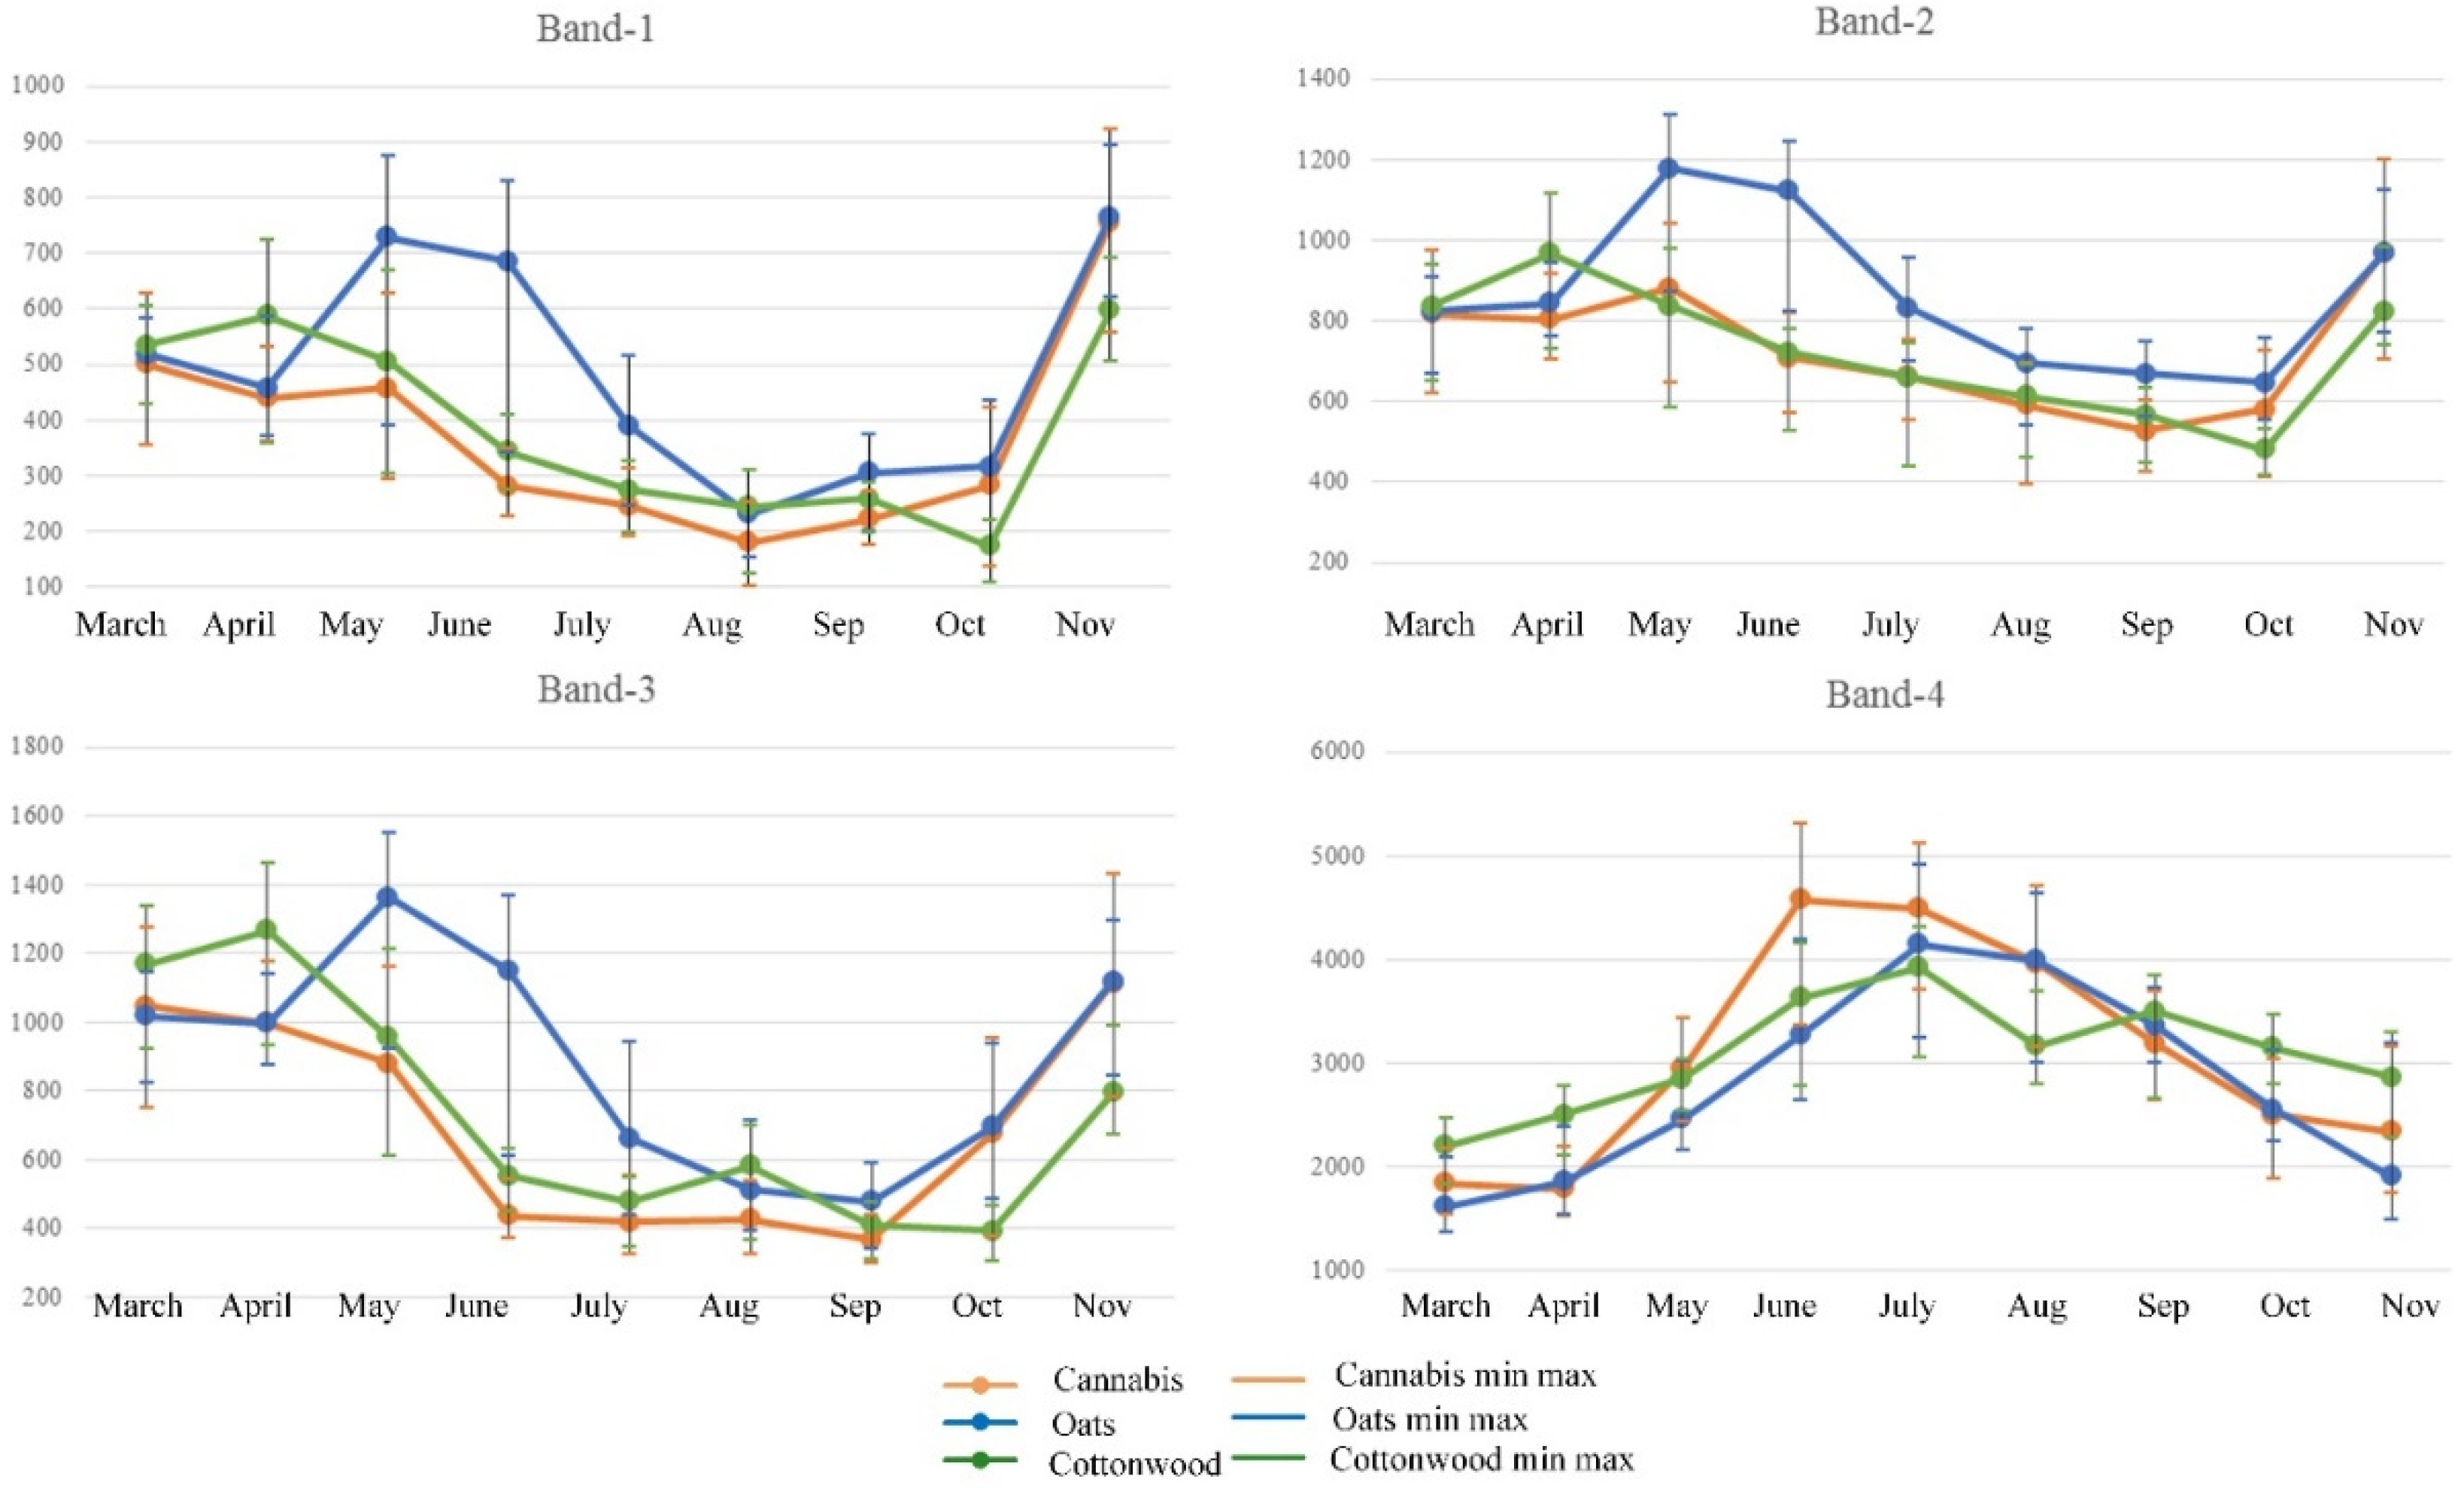
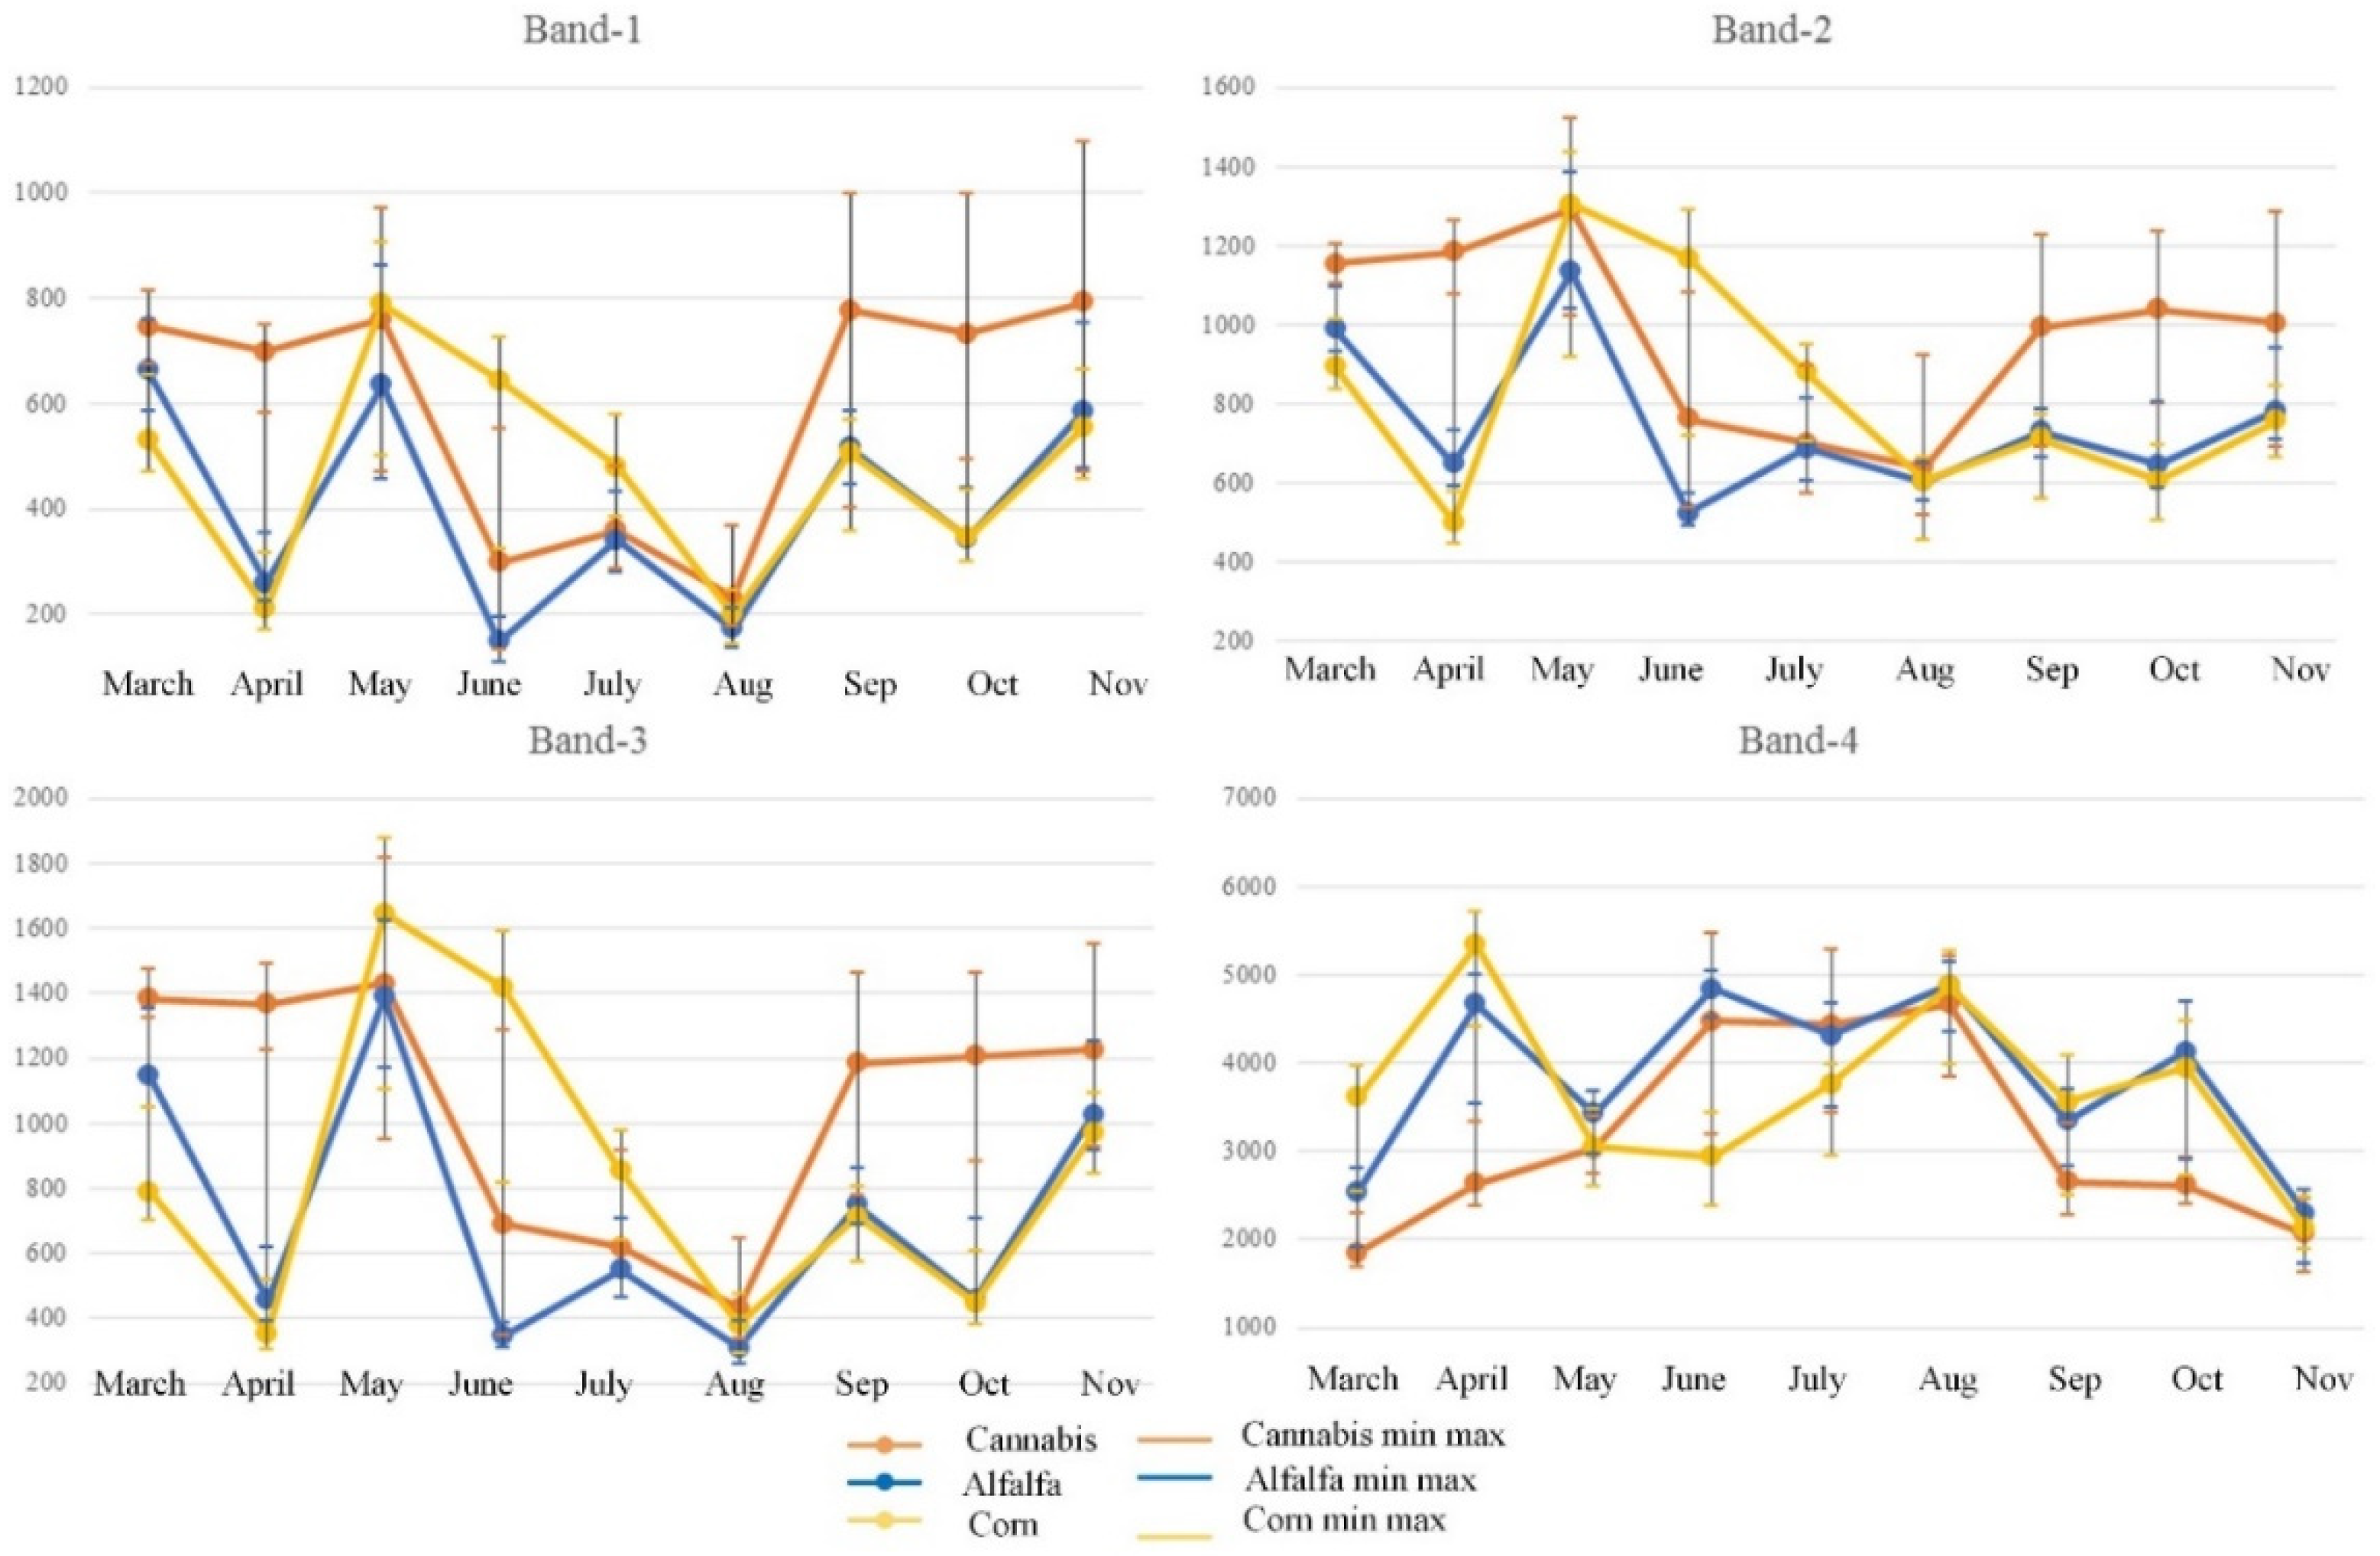
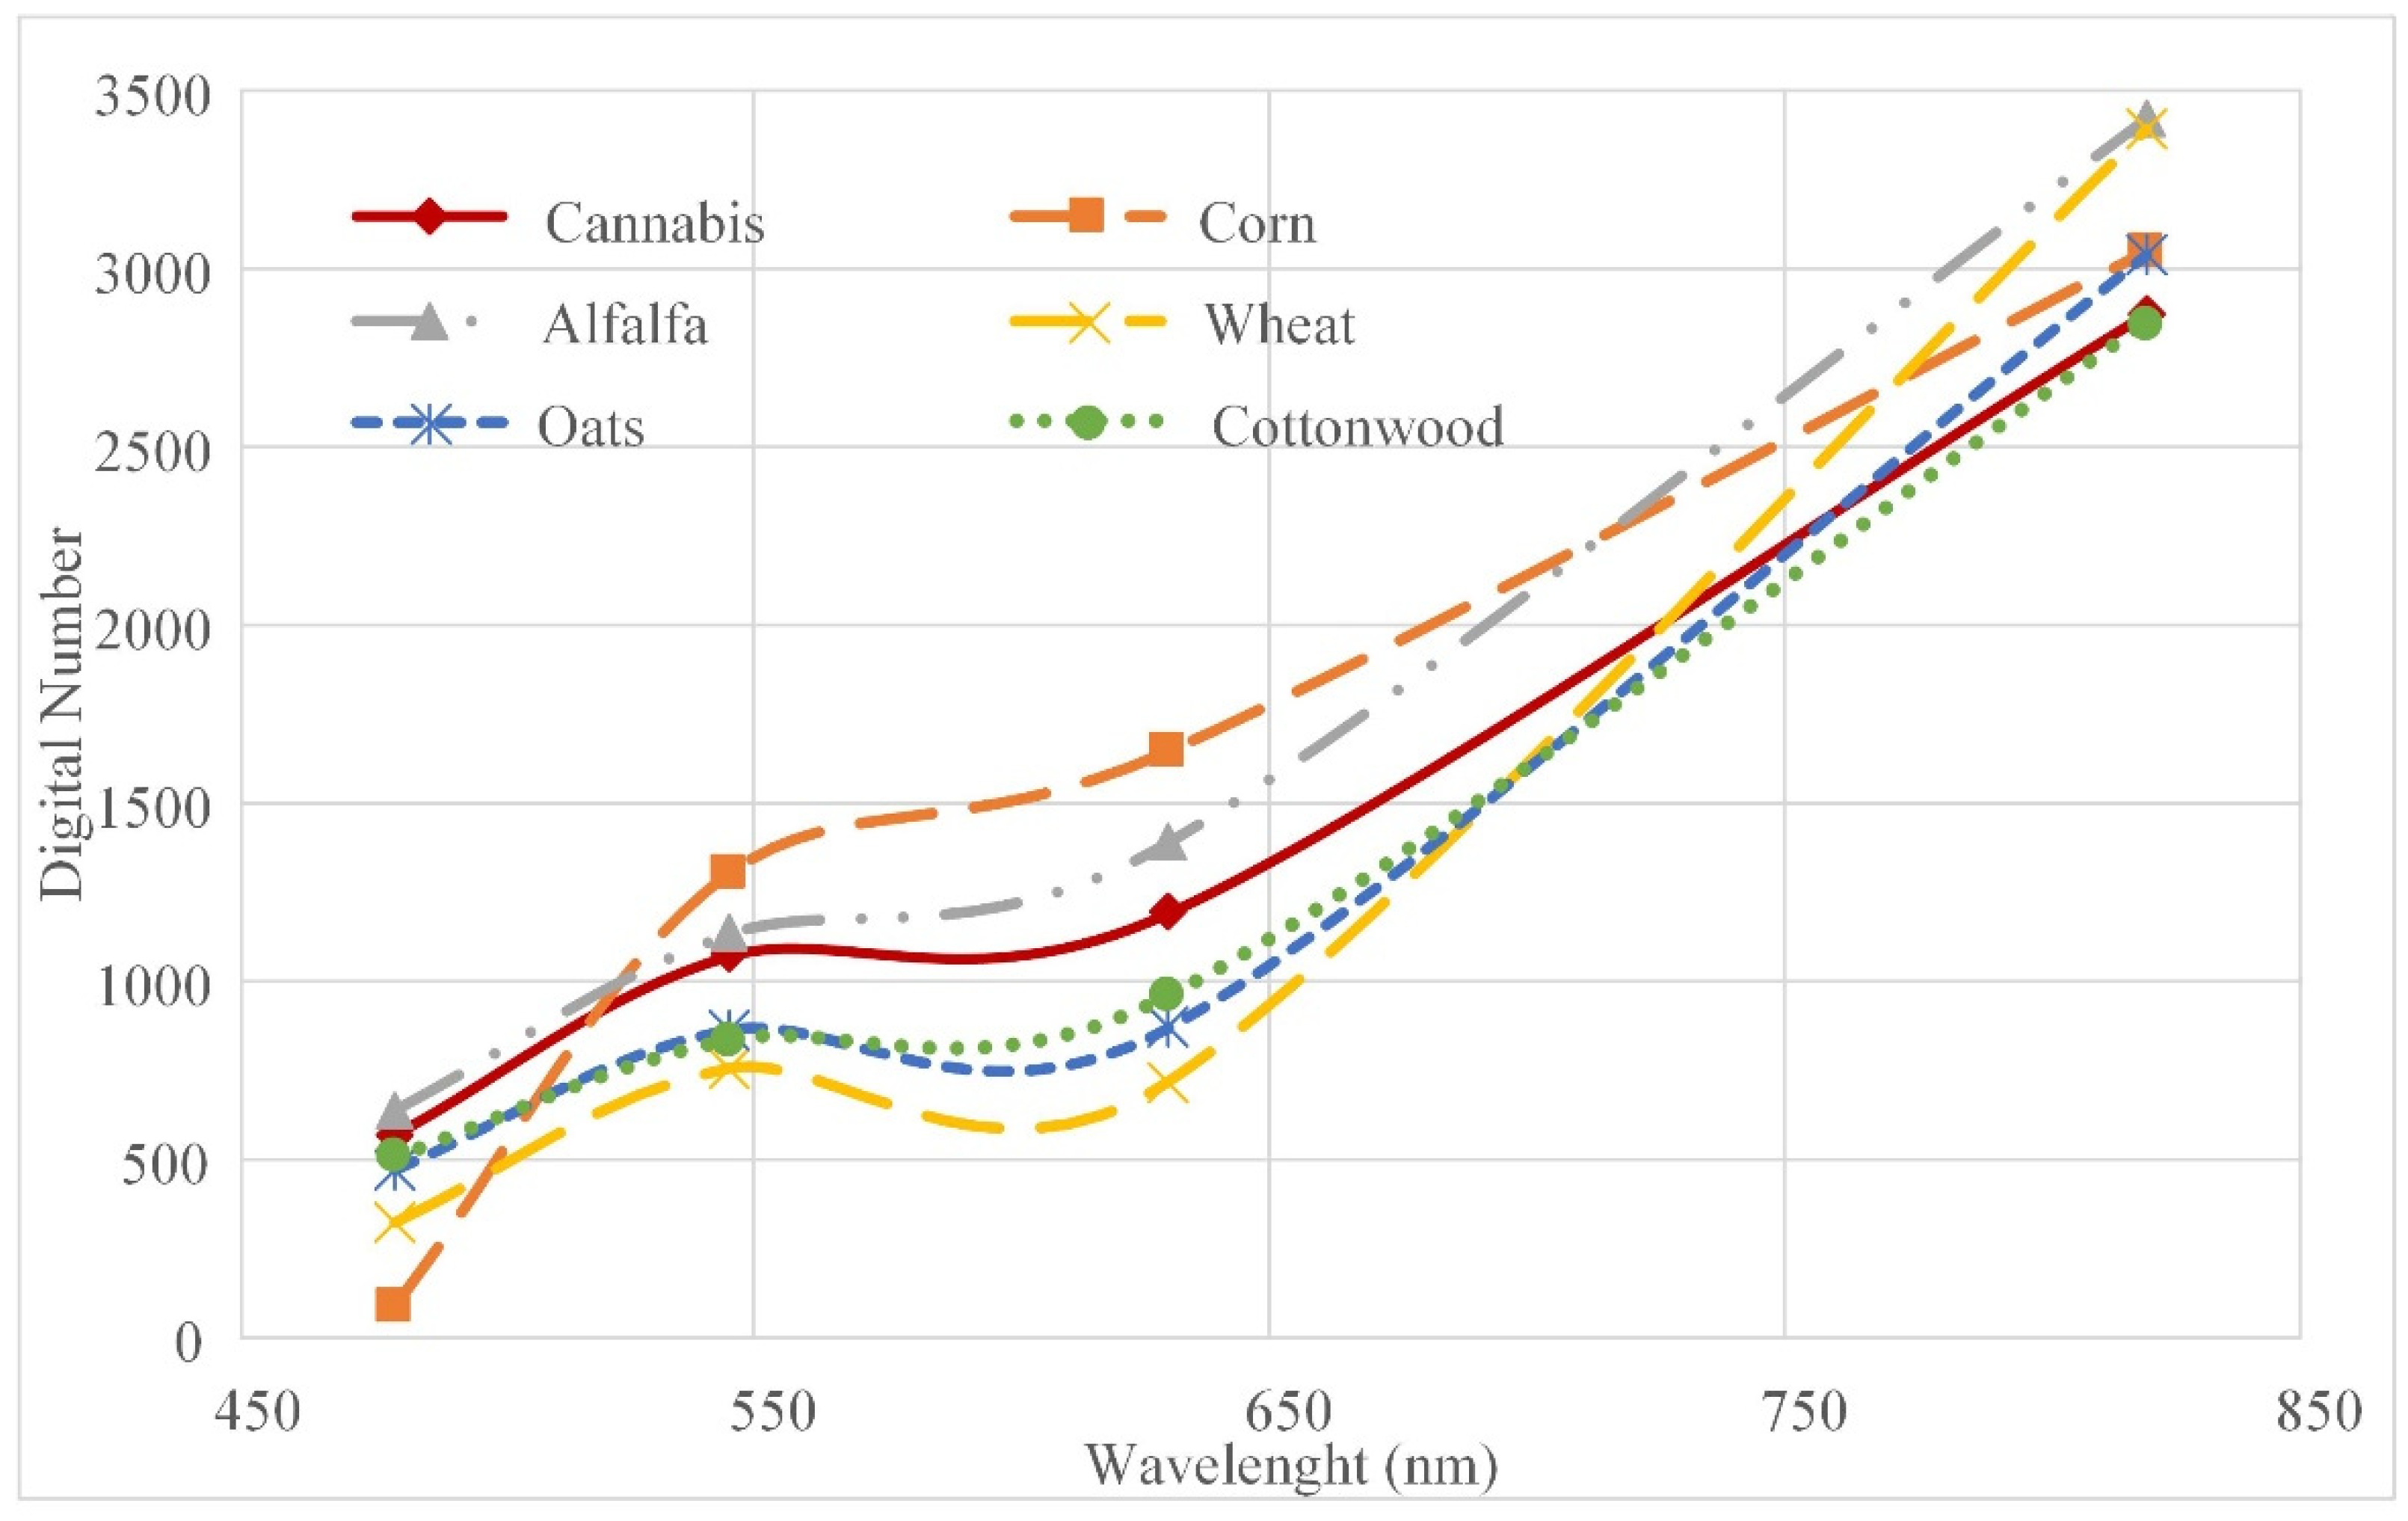
4.1. Spectral Signatures
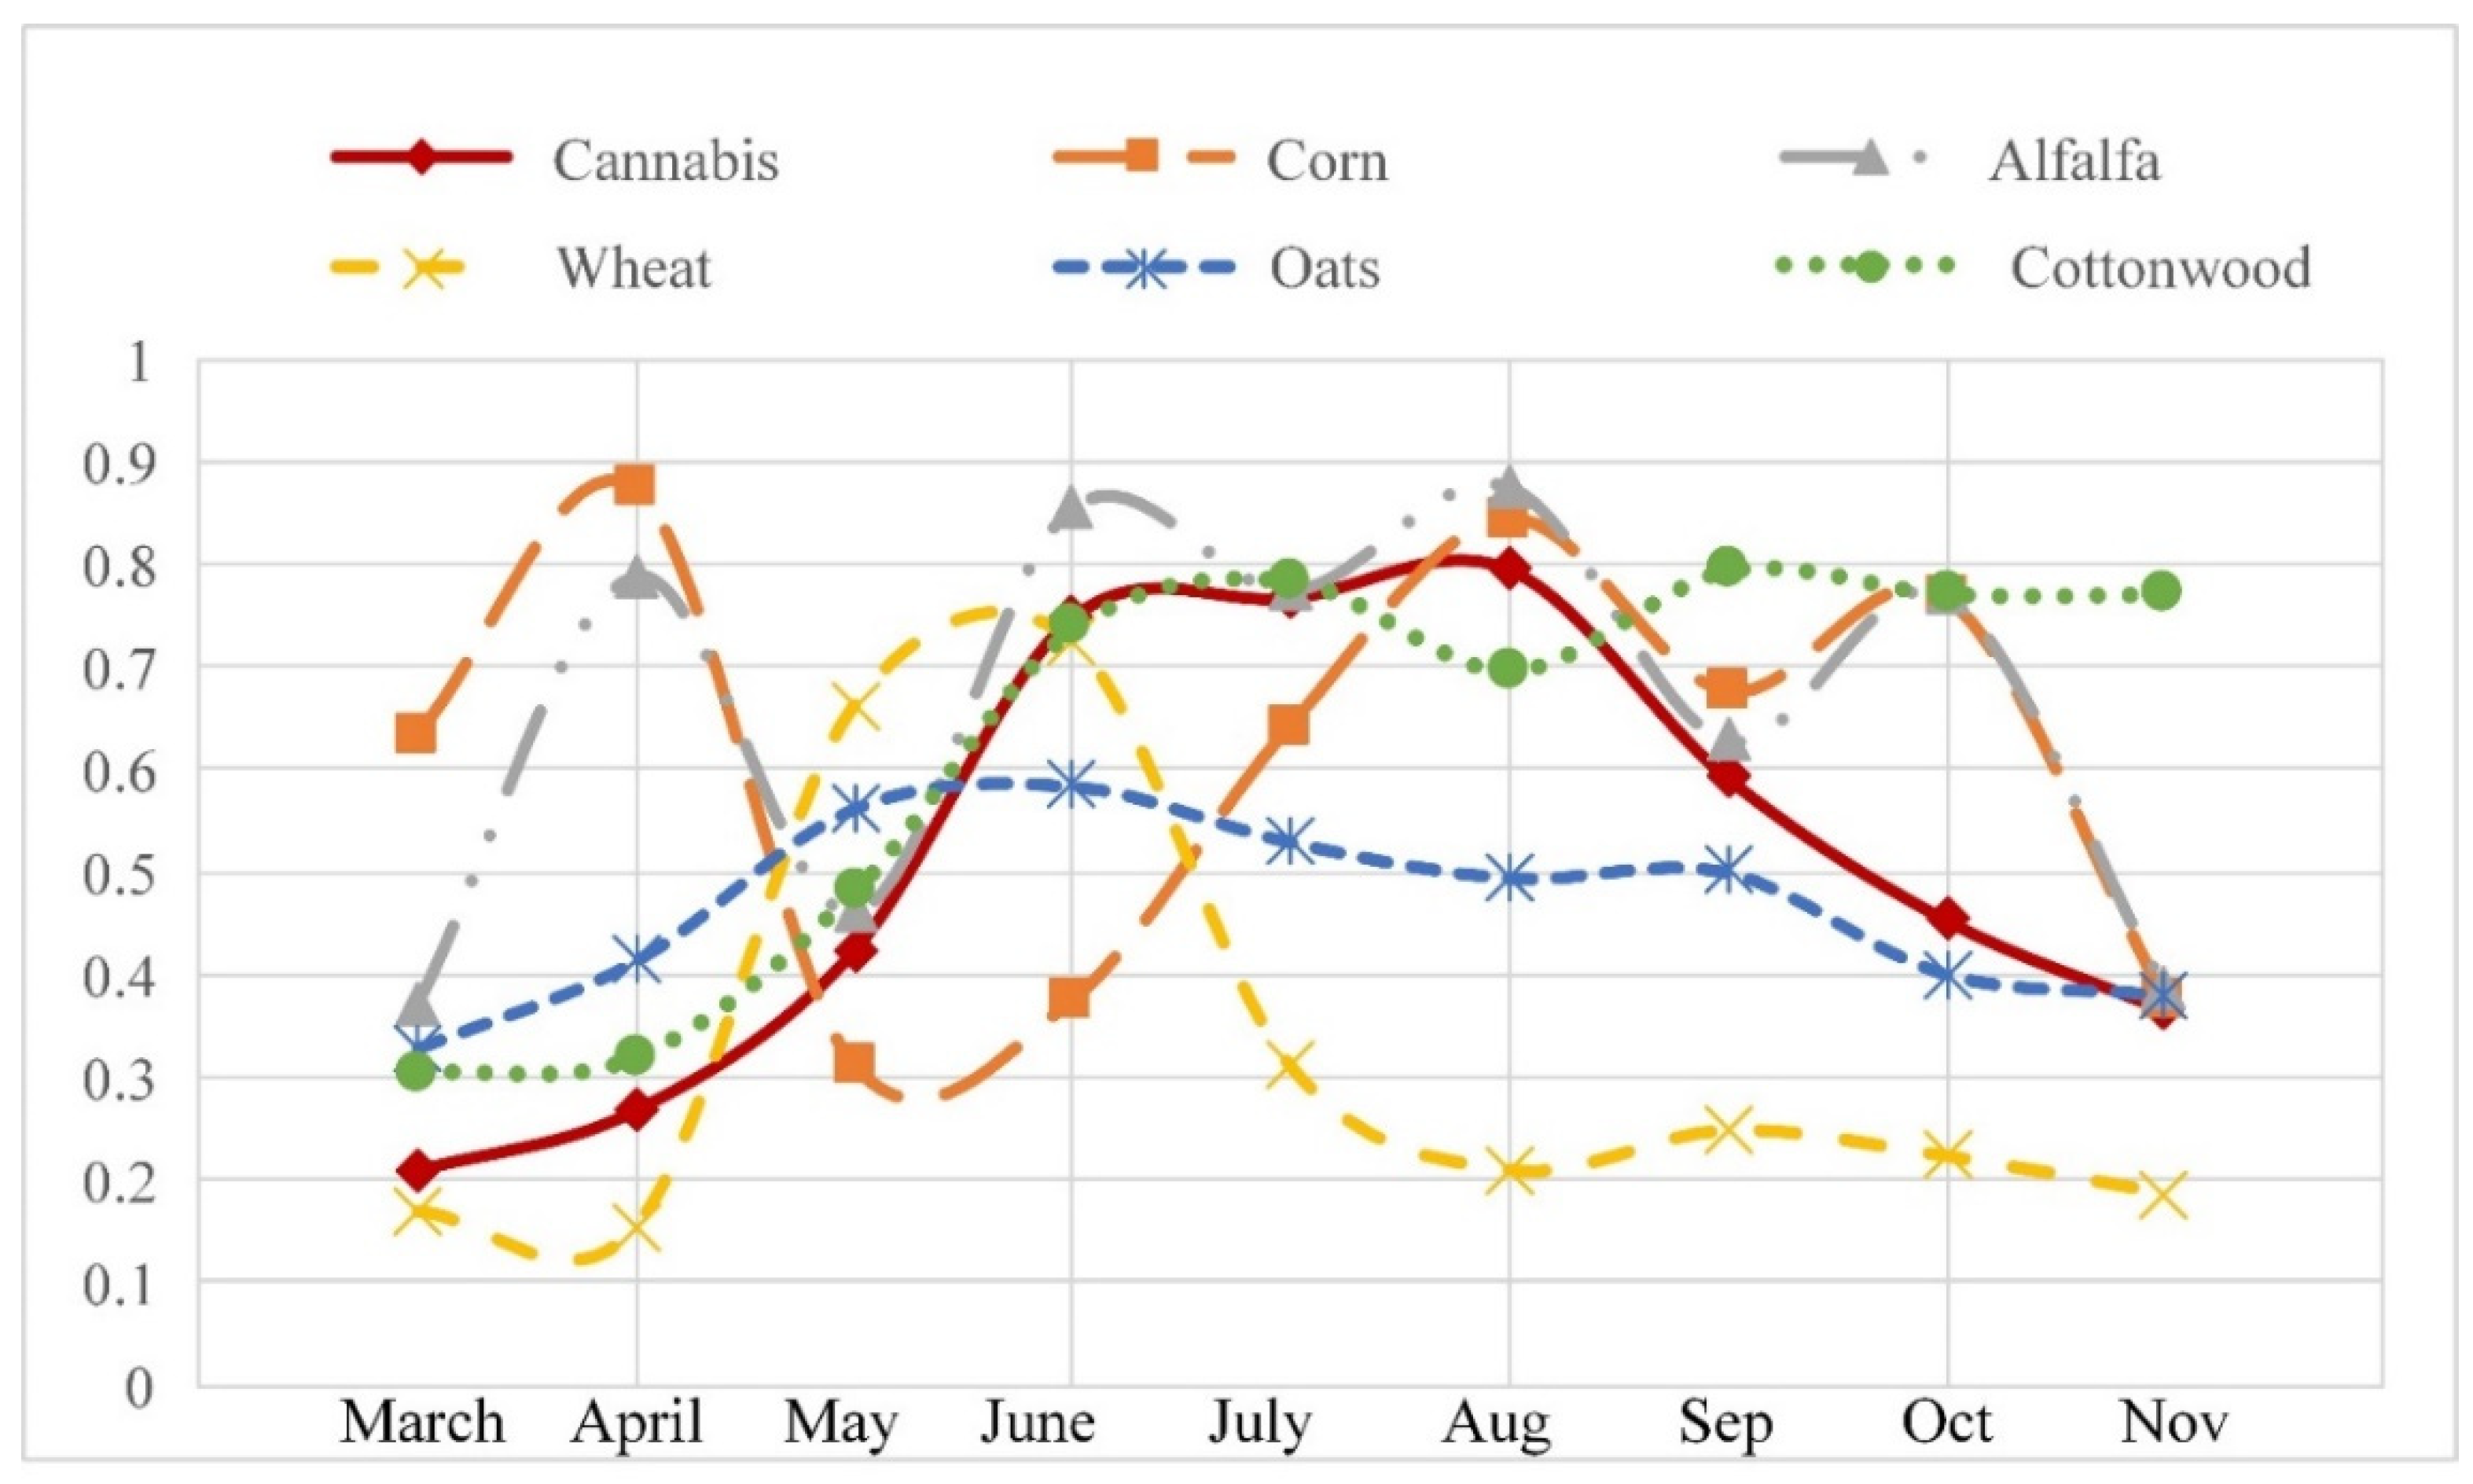
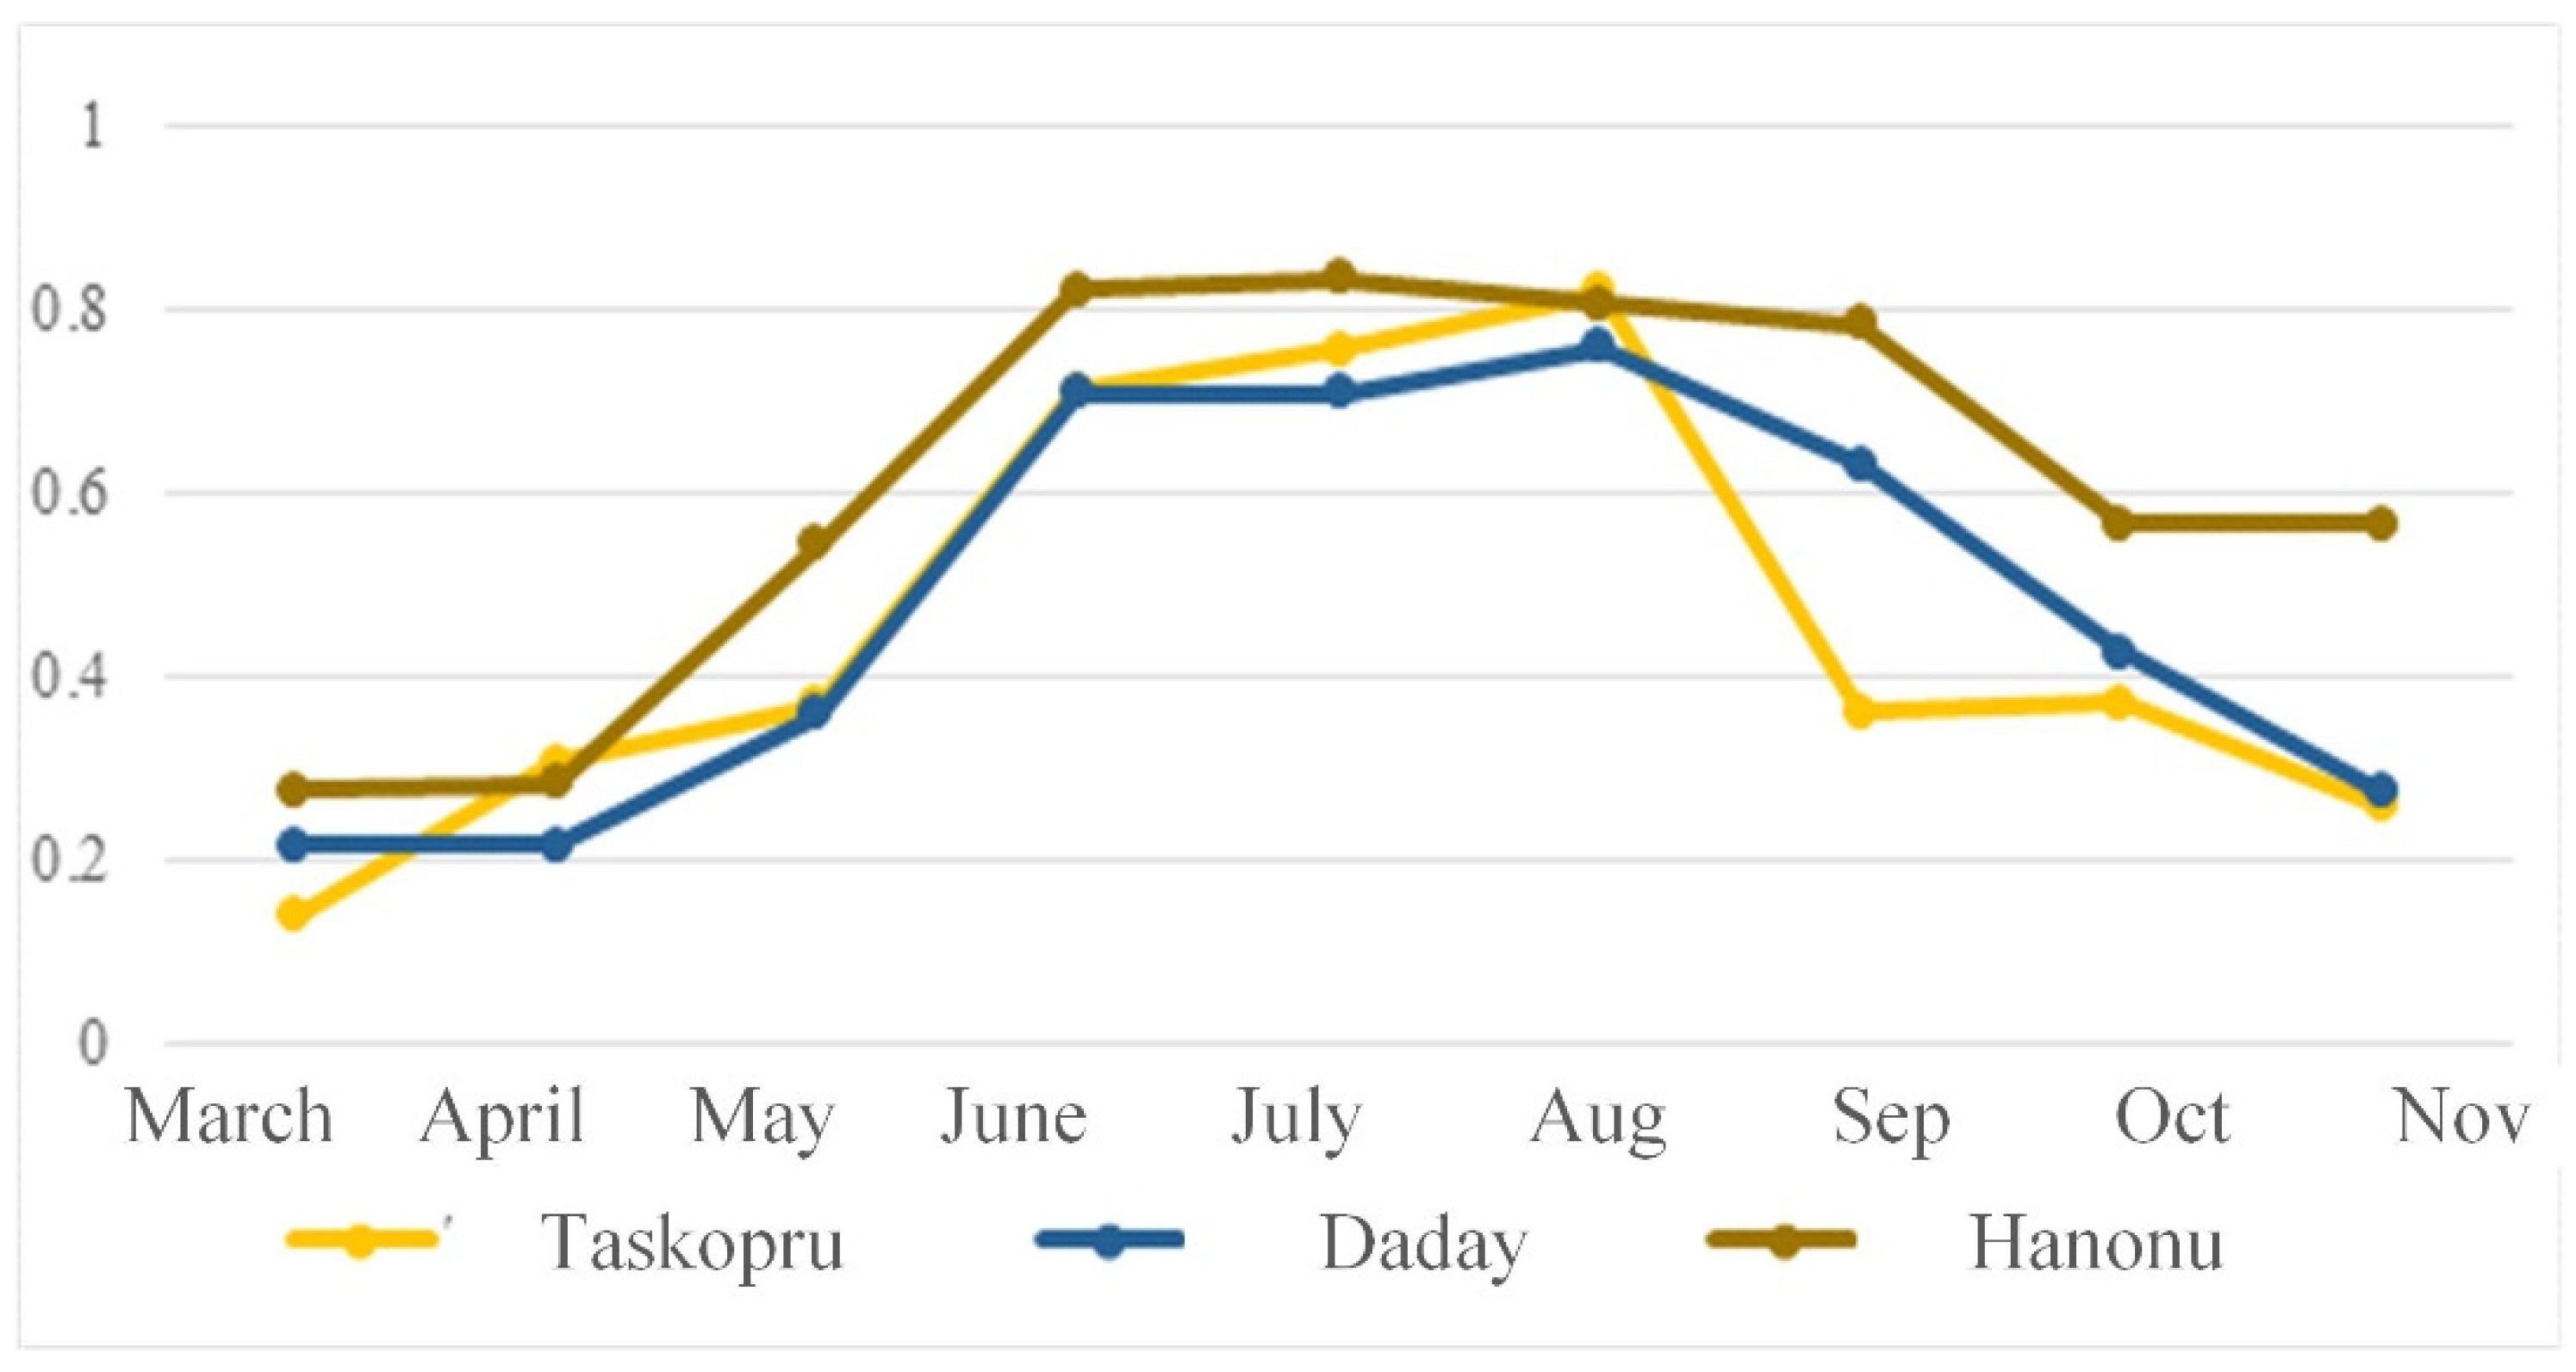
The spectral signatures of the investigated products were extracted for nine months from March to November. Here we present the results from the three different study areas. In the first study area, Daday, we have cannabis, wheat, and oats. The spectral signatures were extracted for every band separately. From the spectral values of Band 1 (blue) (Figure 5), it can be seen that the cannabis values drop significantly in July, while the values of wheat and oats are significantly higher in the same period. Cannabis reached its maximum value in the blue band in April, the same for the other products. The values in the green band in May are highest for cannabis, while lowest for wheat and oats. There is a significant overlap of the values in June; other than that, the values are quite different. The most significant difference between cannabis and wheat and oats is noticed in the red band where the values of band 3 are significantly lower after May. The cannabis band 3 values are low in the period between June and October, while significantly higher for wheat and oats. While cannabis and wheat follow the same values in the near-infrared part from March to June, in the following months, the near-infrared values are significantly higher than wheat and oats, and wheat and oats follow the same values until October. It should be noted that, in all four bands, the similarity of the spectral values can be noticed in June.
In Hanononu, cannabis, oats, and cottonwood have been investigated (Figure 6). While cannabis and oats showed different spectral characteristics, cottonwood follows a similar spectral pattern to cannabis plants. However, in the NIR region, cannabis plants showed significantly higher values in June and July. In Taskorpu, together with cannabis, corn and alfalfa plants have been investigated and compared (Figure 7). While there were significant differences in most of the investigated months, the spectral characteristics showed similarities in May. The spectral values in band 1 and 2 were similar for Cannabis sativa L. and corn, while band 3 and 4 for alfalfa. However, generally looking, in comparison with the other investigated plants, cannabis showed most significant spectral differences in May, especially for wheat, oats, and cottonwood. Considering these differences, all plants in May were investigated (Figure 8). As shown in Figure 8, in the blue region, the cannabis plants showed higher values than the other investigated plants, except alfalfa. In the green and red region, both alfalfa and corn has higher values than cannabis, while in the NIR region, cannabis has the lowest values, similar to cottonwood.

4.2. NDVI Values

The NDVI values of the investigated plants were also taken into consideration. The results show a clear difference between corn and cannabis, as corn NDVI values are significantly high in March and April, and cannabis NDVI values are lowest in March and start rising until June. Corn’s lowest NDVI values are in May and June. Alfalfa NDVI values are also significantly different compared to cannabis, especially in April, where the average NDVI value of alfalfa is 0.8 and of cannabis 0.25. The NDVI values of oats do not vary as much as the other plants, and thus, they have a maximum value of 0.6 in the period May–July. Cottonwood followed the same pattern as cannabis in the period between March and August. Afterward, the cannabis values start dropping, while cottonwood values continue to be high. Wheat has significantly higher values than cannabis in May, while it has similar values in June. After June, the wheat NDVI values start to drop significantly and stay low until April next year (Figure 9).

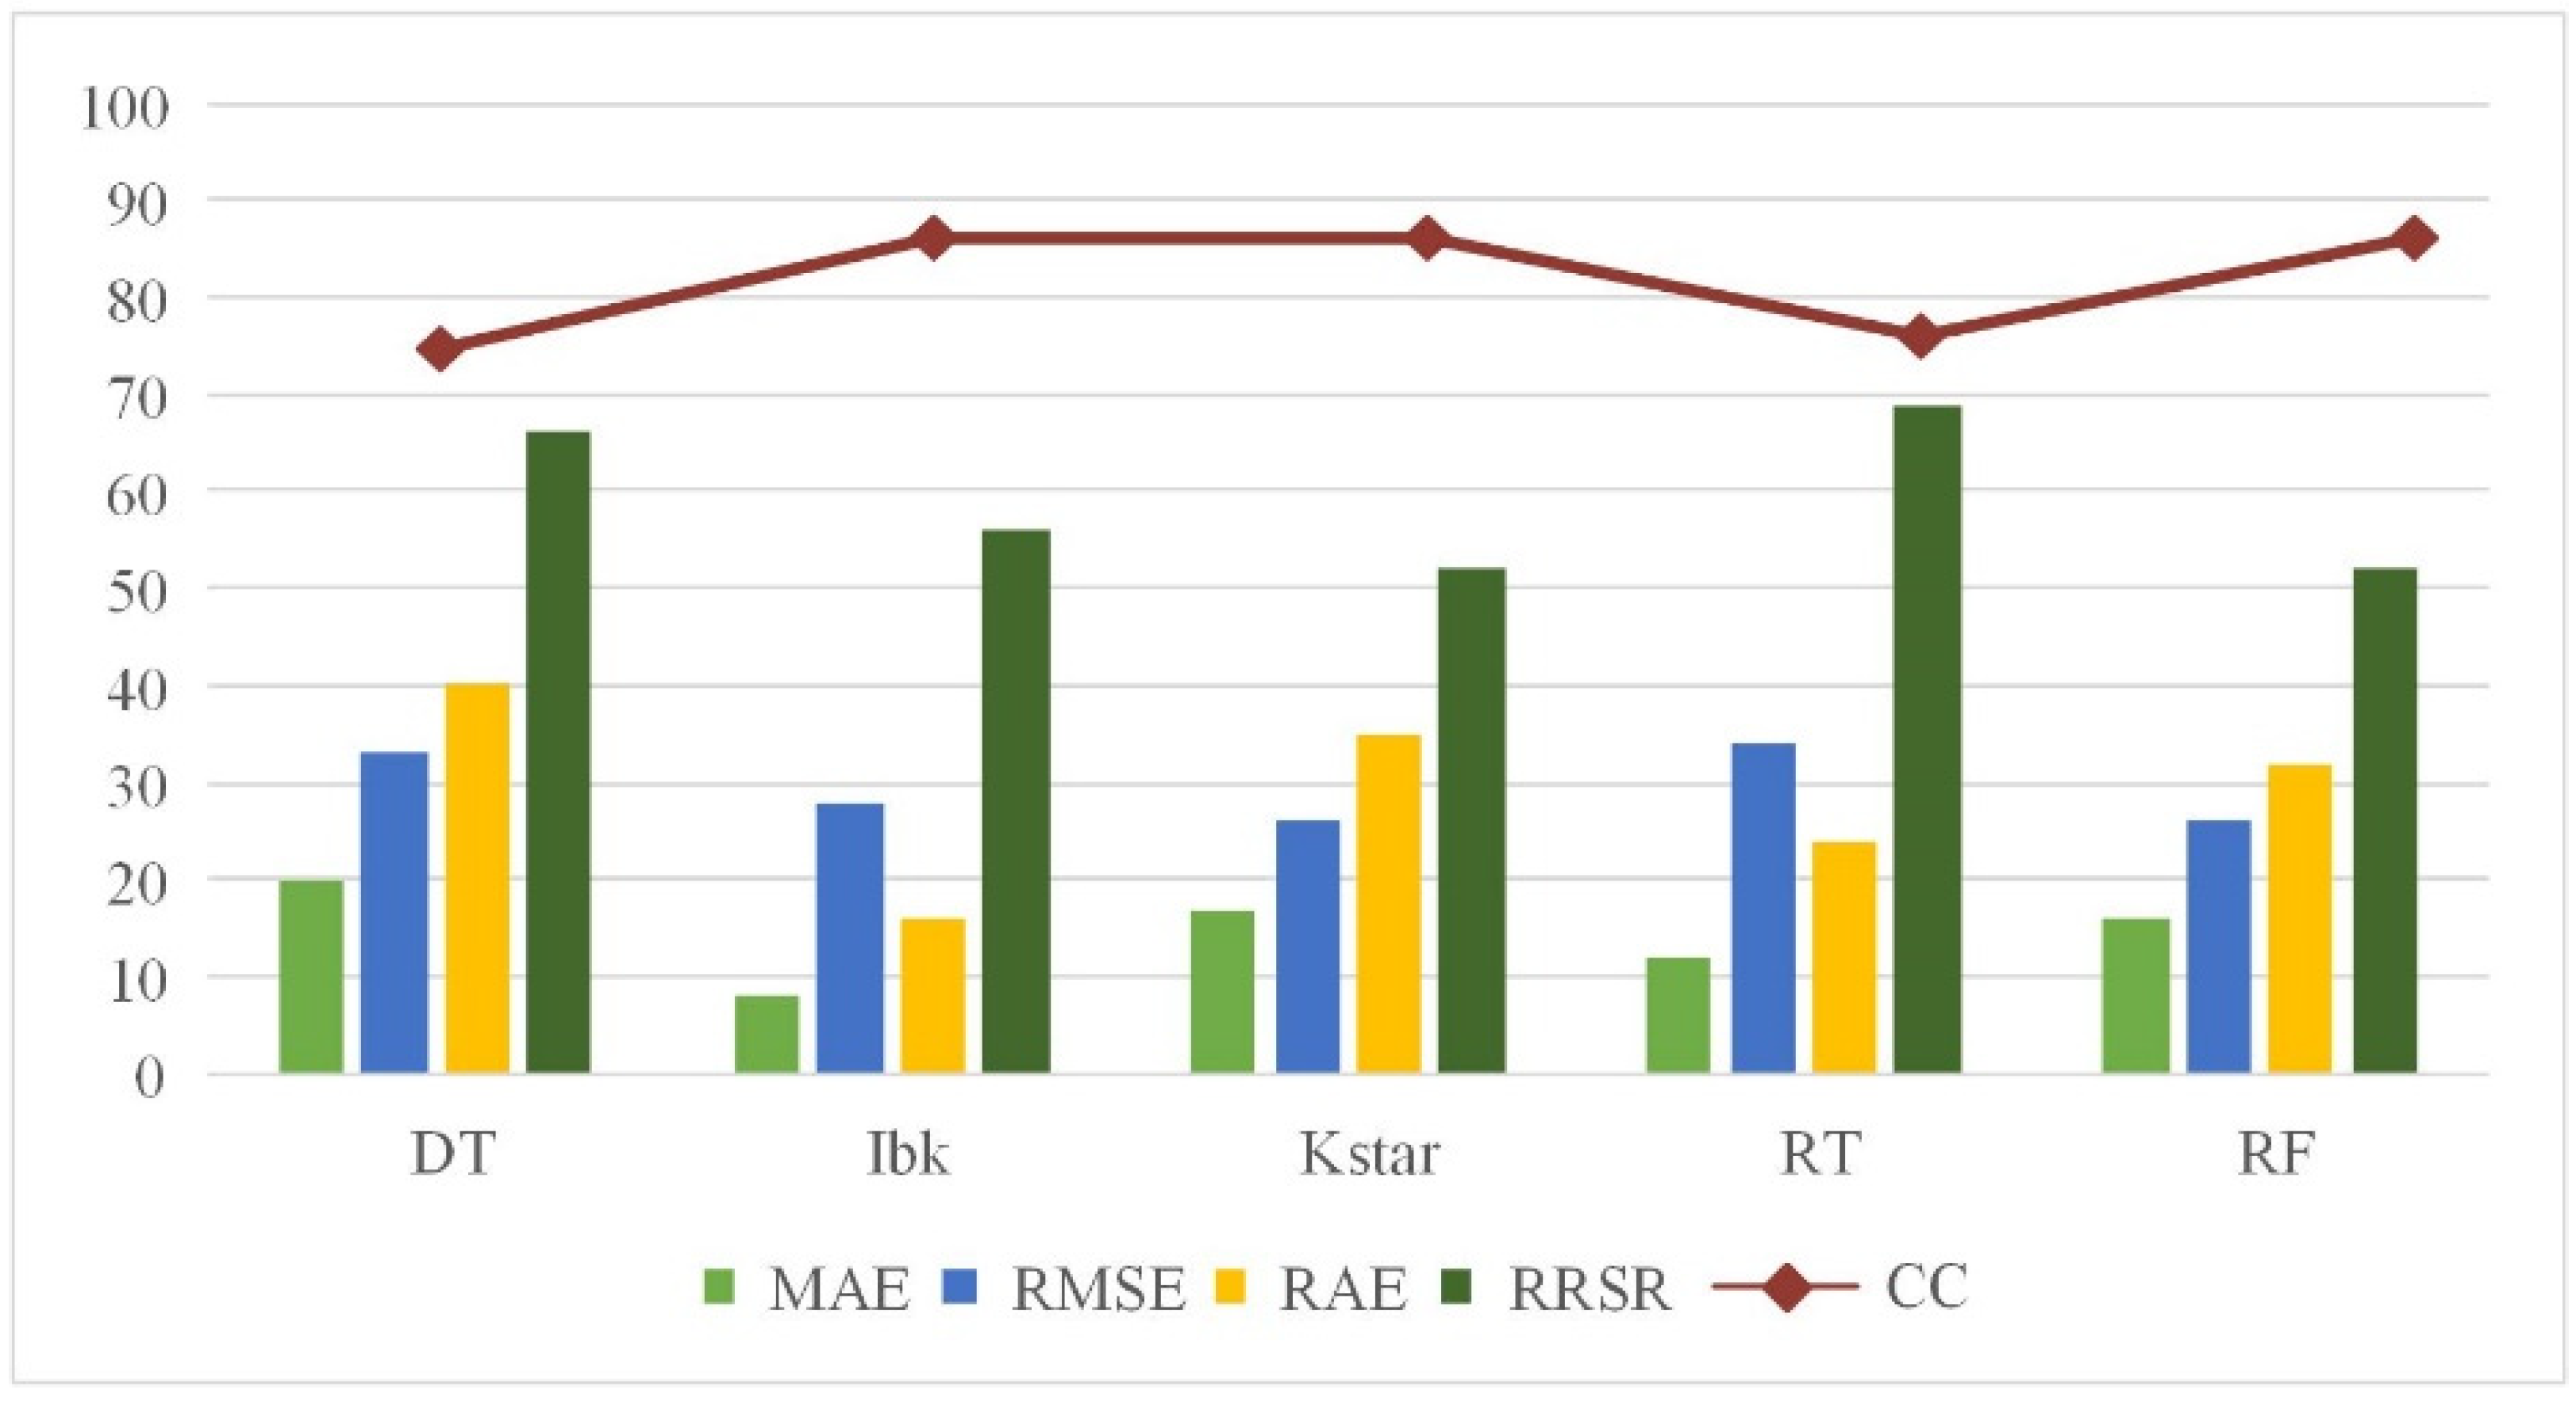
4.3. Cannabis Classification Using Machine Learning

The results of the machine learning classification showed high correlation values, where IBk, KStar, and RF algorithms performed significantly better than DT and RT (Figure 10). The error values showed similar results, where the highest RRSR values were noticed in the DT and RT. IBk showed the lowest MAE and RAE, and the RMSE was similar to KStar and RF.
However, the accuracy assessment parameters for binary classification showed slightly different results (Table 2). Here, DT had the lowest correctly classified instances, followed by RT. The other algorithms showed similar results (over 90%) where RF performed best. The kappa statistics of RF were significantly higher than the lowest-ranked DT. KStar and IBk showed similar results in all parameters, while RF slightly outperformed them.

5. Discussion

The main purpose of this study was to monitor the development process of the cannabis plant in different regions and to detect anomalies in terms of distinguishing it from other plants in line with the data obtained from satellite images. In light of the spectral signature investigations, several machine learning approaches were also utilized to classify the Cannabis sativa L. plant from the other investigated plants. The detailed literature review was another significant contribution to this paper.
Ferreira et al. (2019) [38] calculated the average histogram of the near-infrared channel in regions with and without cannabis plants. This study aimed to examine whether there are any spectral differences between hemp and non-hemp products. The conducted study showed that the cannabis plant has distinctiveness in the near-infrared channel, and it was emphasized that the average values of cannabis crops in the near-infrared band were higher than other crops.
Yiğitoğlu (2019) [39] graphically presented the NDVI values of the cannabis plant in different periods in Burdur. The results from our study correspond to the Cannabis sativa L. NDVI values in Burdur.
Bilecik (2019) [40] measured the developmental stages of the cannabis plant with the terrestrial portable ASD FieldSpec HandHeld Spectroradiometer device and created its spectral records. The early period graphics obtained by terrestrial measurements showed that sunflower gives the highest reflectance value in the near-infrared region, but cannabis and poppy plants form similar curves. The early and rapid development of the sunflower plant was associated with the observations made in the field, as the reason for the high reflectance value of the sunflower plant in the early period. Field studies confirm that the development process of the cannabis plant is slower than other plants. The cannabis plant, which gave high reflectance values during and after the maturation period, continued to develop in the experimental area and had more leaves at the time of measurement compared to other plants affected by this situation.
Remote sensing data can be efficiently used in Cannabis sativa L. monitoring. This study benefits from PlanetScope, commercial satellite imagery, but open-source data can also be beneficial. Satellite imagery such as Landsat and Sentinel have also been used. Results from the literature show that the use of radar imagery, in addition with optical imagery, can significantly improve the accuracy of crop classification [41]. However, the spatial resolution is limited; thus, small areas cannot be detected. The use of UAV (Unmanned Aerial System) can provide higher spatial resolution [42] to ensure the possibility of a better outcome in managing Cannabis sativa L. The UAV imagery may be limited due to the low spectral resolution; however, this challenge can be resolved with image fusion, thus ensuring wider spectral range with high spatial resolution.
Although all of the cannabis fields were in the same district, Kastamonu, they were in three different provinces. The mean NDVI values showed that cannabis plants grown in the Daday, Hanonu and Taskopru districts of Kastamonu gave similar spectral and NDVI values in different months of the year (Figure 11).
The findings obtained in Kastamonu province as a result of these studies showed that, in May and June, the cannabis plant gave different values from other observed plants. It has been evaluated that the classification of the values obtained here by machine learning is important in giving information about the study’s accuracy. The results showed that different algorithms that the cannabis plant can be distinguished from other plants with high accuracy rates. The best results were obtained with RF, where 93% of the test data were correctly classified.
As a result of the investigations, it can be concluded that high-resolution remote sensing can be used in the control of narcotic production plants and will provide an advantage in the follow-up of illegal crops grown worldwide.
One of the biggest problems encountered while carrying out the study was to provide information on cultivated areas of cannabis plants. A limited number of parcel information could be obtained in line with the provincial directorates of agriculture and forestry permission for the cannabis plant produced in provinces subject to permission in our country.
In addition, since the cultivated areas are small areas, our preferences for satellite platforms required us to work with satellites with high resolution. Another disadvantage of our work with satellite images was that the clouds caused by the weather conditions on the ground did not allow us to work on fixed dates in the work areas. In this context, the high spatial and temporal resolution of PlanetScope satellite belonging to Planet company has been beneficial and effective for our study. It is evaluated that, together with the developing technological opportunities, satellite platforms will provide convenience in the research activities carried out on earth.
In future studies, it is planned to support the findings obtained by remote sensing techniques with field studies. More detailed investigation of the morphological development processes of plants and the collection of findings about their phenological stages in different climatic conditions are considered to increase the accuracy of the study.

6. Conclusions

In this study, spectral values of the cannabis plant, which is the raw material of cannabis, were collected from PlanetScope satellite images of 2021 and NDVI analyses were performed. In the study, the differences were evaluated by comparing the reflectance values of wheat, corn, alfalfa, oat and cottonwood plants, which are other plant species growing in the region. By examining the studies in the literature, it was determined that the cannabis plant has distinctive features in the near-infrared band in the current study. In this study, the reflection values of the cannabis plant in May and June were compared with the reflectance values of different plant species in the other region and anomaly changes were taken into account. During these months, test data of cannabis and non-cannabis fields were produced and classified using different machine learning algorithms. The results showed that high-resolution satellite imagery can be successfully used for monitoring cannabis phonological changes, and in addition, for classifying them with high accuracy.

Author Contributions

Conceptualization, F.B. and G.K.; methodology, G.K.; software, F.B.; validation, A.S.A., G.K. and F.B.; formal analysis, F.B.; data curation, F.B.; writing—original draft preparation, F.B.; writing—review and editing, A.S.A. and G.K.; visualization, F.B.; supervision, A.S.A. and G.K. All authors have read and agreed to the published version of the manuscript.

Funding

This research was funded by the United Arab Emirates University.

Institutional Review Board Statement

Not applicable.

Informed Consent Statement

Not applicable.

Data Availability Statement

The datasets generated during the current study are available from the corresponding author on reasonable request.

Acknowledgments

The authors acknowledge the Planet research program for allowing us to obtain the necessary satellite imagery for research purposes. The authors thank Levent Başayiğit, Aliihsan Şekertekin, and Fuat Kaya for their valuable comments. The authors are also grateful to the United Arab Emirates University for funding this research.

Conflicts of Interest

The authors declare that they have no known competing financial interest or personal relationships that could have appeared to influence the work reported in this paper.

References

  1. Mauro, P.M.; Carliner, H.; Brown, Q.L.; Hasin, D.S.; Shmulewitz, D.; Rahim-Juwel, R.; Sarvet, A.L.; Wall, M.M.; Martins, S.S. Age Differences in Daily and Nondaily Cannabis Use in the United States, 2002–2014. J. Stud. Alcohol Drugs 2018, 79, 423–431. [Google Scholar] [CrossRef] [PubMed]
  2. Peacock, A.; Leung, J.; Larney, S.; Colledge, S.; Hickman, M.; Rehm, J.; Giovino, G.A.; West, R.; Hall, W.; Griffiths, P.; et al. Global statistics on alcohol, tobacco and illicit drug use: 2017 status report. Addiction 2018, 113, 1905–1926. [Google Scholar] [CrossRef] [PubMed] [Green Version]
  3. Potter, G.R.; Bouchard, M.; Decorte, T. The Globalization of Cannabis Cultivation, in World Wide Weed; Routledge: London, UK, 2016; pp. 21–40. [Google Scholar]
  4. Earleywine, M. Understanding Marijuana: A New Look at the Scientific Evidence; Oxford University Press: Oxford, UK, 2022. [Google Scholar]
  5. Wójtowicz, M.; Wójtowicz, A.; Piekarczyk, J. Application of remote sensing methods in agriculture. Commun. Biometry Crop Sci. 2016, 11, 31–50. [Google Scholar]
  6. Mee, C.; Siva, K.B.; Ahmad, H.M.H. Detecting and monitoring plant nutrient stress using remote sensing approaches: A review. Asian J. Plant Sci. 2017, 16, 1–8. [Google Scholar]
  7. Walthall, C.; Daughtry, C.; Pachepsky, L.; Erbe, E.; Lydon, J.; Higgins, M.; Vanderbilt, V.; Bobbe, T. Detection of Illegal Cannabis Cultivation Using Remote Sensing. In Proceedings of the 2006 IEEE International Symposium on Geoscience and Remote Sensing, Denver, CO, USA, 31 July–4 August 2006; pp. 2281–2284. [Google Scholar] [CrossRef]
  8. Daughtry, C.; Walthall, C. Spectral Discrimination of Cannabis sativa L. Leaves and Canopies. Remote Sens. Environ. 1998, 64, 192–201. [Google Scholar] [CrossRef]
  9. Mattiuzzi, M.; Bussink, C.; Thomas Bauer, V. Analysing Phenological Characteristics Extracted from Landsat NDVI Time Series to Identify Suitable Image Acquisition Dates for Cannabis Mapping in Afghanistan. PFG Photogramm. Fernerkund. Geoinf. 2014, 5, 383–392. [Google Scholar]
  10. Jia, K.; Wu, B.; Tian, Y.; Li, Q.; Du, X. An effective biophysical indicator for opium yield estimation. Comput. Electron. Agric. 2011, 75, 272–277. [Google Scholar] [CrossRef]
  11. Fang, X.; Zhang, W. The application of remotely sensed data to the estimation of the leaf area index. Remote Sens. Land Resour. 2003, 3, 58–62. [Google Scholar]
  12. Portugal, E.; Hwan, J. Applied Science to Inform Management Efforts for Cannabis Cultivation, Humboldt, County, California. Calif. Fish Game 2020, 106, 13–30. [Google Scholar]
  13. Demir, S.; Başayiğit, L. Determination of Opium Poppy (Papaver Somniferum) Parcels Using High-Resolution Satellite Imagery. J. Indian Soc. Remote Sens. 2019, 47, 977–987. [Google Scholar] [CrossRef]
  14. Lisita, A.; Sano, E.E.; Durieux, L. Identifying potential areas of Cannabis sativa plantations using object-based image analysis of SPOT-5 satellite data. Int. J. Remote Sens. 2013, 34, 5409–5428. [Google Scholar] [CrossRef]
  15. Liu, X.; Tian, Y.; Yuan, C.; Zhang, F.; Yang, G. Opium Poppy Detection Using Deep Learning. Remote Sens. 2018, 10, 1886. [Google Scholar] [CrossRef] [Green Version]
  16. Gray, C.J.; Shaw, D.R.; Gerard, P.D.; Bruce, L.M. Utility of Multispectral Imagery for Soybean and Weed Species Differentiation. Weed Technol. 2008, 22, 713–718. [Google Scholar] [CrossRef]
  17. Simms, D.M.; Waine, T.W.; Taylor, J.C.; Juniper, G.R. The application of time-series MODIS NDVI profiles for the acquisition of crop information across Afghanistan. Int. J. Remote Sens. 2014, 35, 6234–6254. [Google Scholar] [CrossRef] [Green Version]
  18. Tunca, E.; Köksal, E. Sentinel 2 Uydu Görüntülerinden Bitki Türlerinin Makine Öğrenmesi ile Belirlenmesi. Çomü Ziraat Fakültesi Derg. 2021, 9, 189–200. [Google Scholar] [CrossRef]
  19. Azaria, I.; Goldschleger, N.; Ben-Dor, E. Identification of Cannabis plantations using hyperspectral technology. Isr. J. Plant Sci. 2012, 60, 77–83. [Google Scholar] [CrossRef]
  20. Waine, T.W.; Simms, D.M.; Taylor, J.C.; Juniper, G.R. Towards improving the accuracy of opium yield estimates with remote sensing. Int. J. Remote Sens. 2014, 35, 6292–6309. [Google Scholar] [CrossRef]
  21. Taylor, J.C.; Waine, T.; Juniper, G.R.; Simms, D.; Brewer, T. Survey and monitoring of opium poppy and wheat in Afghanistan: 2003–2009. Remote Sens. Lett. 2010, 1, 179–185. [Google Scholar] [CrossRef] [Green Version]
  22. Sicre, C.M.; Baup, F.; Fieuzal, R. Determination of the crop row orientations from Formosat-2 multi-temporal and panchromatic images. ISPRS J. Photogramm. Remote Sens. 2014, 94, 127–142. [Google Scholar] [CrossRef] [Green Version]
  23. Mourad, R.; Jaafar, H.; Anderson, M.; Gao, F. Assessment of Leaf Area Index Models Using Harmonized Landsat and Sentinel-2 Surface Reflectance Data over a Semi-Arid Irrigated Landscape. Remote Sens. 2020, 12, 3121. [Google Scholar] [CrossRef]
  24. Holmes, W.S.; Ooi, M.P.-L.; Kuang, Y.C.; Simpkin, R.; Lopez-Ubiria, I.; Vidiella, A.; Blanchon, D.; Gupta, G.S.; Demidenko, S. Classifying Cannabis sativa Flowers, Stems and Leaves using Statistical Machine Learning with Near-Infrared Hyperspectral Reflectance Imaging. In Proceedings of the 2020 IEEE International Instrumentation and Measurement Technology Conference (I2MTC), Dubrovnik, Croatia, 25–28 May 2020; pp. 1–6. [Google Scholar] [CrossRef]
  25. Pereira, J.F.Q.; Pimentel, M.F.; Amigo, J.M.; Honorato, R.S. Detection and identification of Cannabis sativa l. Using near infrared hyperspectral imaging and machine learning methods. A feasibility study. Spectrochim. Acta Part A Mol. Biomol. Spectrosc. 2020, 237, 118385. [Google Scholar] [CrossRef] [PubMed]
  26. Lu, Y.; Young, S.; Linder, E.; Whipker, B.; Suchoff, D. Hyperspectral Imaging With Machine Learning to Differentiate Cultivars, Growth Stages, Flowers, and Leaves of Industrial Hemp (Cannabis sativa L.). Front. Plant Sci. 2022, 12, 810113. [Google Scholar] [CrossRef] [PubMed]
  27. Avdan, U.; Kaplan, G.; Avdan, Z.Y.; Matci, D.K.; Erdem, F.; Mizik, E.T.; Demirtas, I. Comparison of Remote Sensing Soil Electrical Conductivity from PlanetScope and Ground Measured Data in Wheat and Beet Yields. Biol. Life Sci. Forum 2021, 3, 48. [Google Scholar] [CrossRef]
  28. Cheng, Y.; Vrieling, A.; Fava, F.; Meroni, M.; Marshall, M.; Gachoki, S. Phenology of short vegetation cycles in a Kenyan rangeland from PlanetScope and Sentinel-2. Remote Sens. Environ. 2020, 248, 112004. [Google Scholar] [CrossRef]
  29. Kpienbaareh, D.; Sun, X.; Wang, J.; Luginaah, I.; Kerr, R.B.; Lupafya, E.; Dakishoni, L. Crop Type and Land Cover Mapping in Northern Malawi Using the Integration of Sentinel-1, Sentinel-2, and PlanetScope Satellite Data. Remote Sens. 2021, 13, 700. [Google Scholar] [CrossRef]
  30. Kaplan, G. Assessing the effectiveness of PlanetScope synthesized panchromatic bands for spatial enhancement of Sentinel-2 data. J. Appl. Remote Sens. 2020, 14, 036504. [Google Scholar] [CrossRef]
  31. Jamali, A. Evaluation and comparison of eight machine learning models in land use/land cover mapping using Landsat 8 OLI: A case study of the northern region of Iran. SN Appl. Sci. 2019, 1, 1448. [Google Scholar] [CrossRef] [Green Version]
  32. Doğaner, A. Topluluk Öğrenme Yöntemleri ile Renal Hücreli Karsinom’un Tahmin Edilmesi. 2020. Available online: http://161.9.164.68/xmlui/handle/11616/18218 (accessed on 10 April 2022).
  33. Desai, S.; Ouarda, T.B. Regional hydrological frequency analysis at ungauged sites with random forest regression. J. Hydrol. 2020, 594, 125861. [Google Scholar] [CrossRef]
  34. Kalmegh, S.R. Comparative Analysis of the WEKA Classifiers Rules Conjunctiverule & Decisiontable on Indian News Dataset by Using Different Test Mode. Int. J. Eng. Sci. Invent. (IJESI) 2018, 7, 2319–6734. [Google Scholar]
  35. Pham, B.T.; Jaafari, A.; Nguyen-Thoi, T.; Van Phong, T.; Nguyen, H.D.; Satyam, N.; Masroor; Rehman, S.; Sajjad, H.; Sahana, M.; et al. Ensemble machine learning models based on Reduced Error Pruning Tree for prediction of rainfall-induced landslides. Int. J. Digit. Earth 2020, 14, 575–596. [Google Scholar] [CrossRef]
  36. Moayedi, H.; Jamali, A.; Gibril, M.B.A.; Foong, L.K.; Bahiraei, M. Evaluation of tree-base data mining algorithms in land used/land cover mapping in a semi-arid environment through Landsat 8 OLI image; Shiraz, Iran. Geomat. Nat. Hazards Risk 2020, 11, 724–741. [Google Scholar] [CrossRef]
  37. Kaplan, O.; Kaplan, G. Response Spectra-Based Post-Earthquake Rapid Structural Damage Estimation Approach Aided with Remote Sensing Data: 2020 Samos Earthquake. Buildings 2021, 12, 14. [Google Scholar] [CrossRef]
  38. Ferreira, A.; Felipussi, S.C.; Pires, R.; Avila, S.; Santos, G.; Lambert, J.; Huang, J.; Rocha, A. Eyes in the Skies: A Data-Driven Fusion Approach to Identifying Drug Crops From Remote Sensing Images. IEEE J. Sel. Top. Appl. Earth Obs. Remote Sens. 2019, 12, 4773–4786. [Google Scholar] [CrossRef]
  39. Yiğitoğlu, H. Kenevir (cannabis) Ekili Alanlarının Yüksek Çözünürlüklü Uydu Verileri ile Belirlenebilirliği. Master’s Thesis, Isparta University of Applied Sciences, Isparta, Turkey, 2019. [Google Scholar]
  40. Gülper Bilecik, S. Haşhaş ve Kenevirin Spektral Imzalarının Belirlenmesi ve Kayıt Kütüklerinin Oluşturulması. Master’s Thesis, Isparta University of Applied Sciences, Isparta, Turkey, 2019. [Google Scholar]
  41. Sujud, L.; Jaafar, H.; Hassan, M.A.H.; Zurayk, R. Cannabis detection from optical and RADAR data fusion: A comparative analysis of the SMILE machine learning algorithms in Google Earth Engine. Remote Sens. Appl. Soc. Environ. 2021, 24, 100639. [Google Scholar] [CrossRef]
  42. Roslim, M.H.M.; Juraimi, A.S.; Che’Ya, N.N.; Sulaiman, N.; Manaf, M.N.H.A.; Ramli, Z.; Motmainna, M. Using Remote Sensing and an Unmanned Aerial System for Weed Management in Agricultural Crops: A Review. Agronomy 2021, 11, 1809. [Google Scholar] [CrossRef]
Figure 1. Study areas of the reviewed papers.
Agriculture 12 00842 g001
Figure 2. Study area, Kastamonu district, Turkey.
Agriculture 12 00842 g002
Figure 3. Investigated plants; (A) Cannabis sativa L.; (B) Wheat; (C) Corn; (D) Oats; (E) Alfalfa; (F) Cottonwood.
Agriculture 12 00842 g003
Figure 4. Flowchart of the followed methodology.
Agriculture 12 00842 g004
Figure 5. Spectral values for cannabis, wheat and oats, in Daday, Turkey.
Agriculture 12 00842 g005
Figure 6. Spectral values for cannabis, oats and cottonwoods, in Hanonu, Turkey.
Agriculture 12 00842 g006
Figure 7. Spectral values for cannabis, alfalfa and corn, in Taskopru, Turkey.
Agriculture 12 00842 g007
Figure 8. Spectral signatures from the investigated crop types from May.
Agriculture 12 00842 g008
Figure 9. NDVI value of the investigated plants.
Agriculture 12 00842 g009
Figure 10. Accuracy assessment parameters for cannabis classification.
Agriculture 12 00842 g010
Figure 11. Mean NDVI values in different districts.
Agriculture 12 00842 g011
Table 1. PlanetScope data description.
Properties PlanetScope (PS)
Number of satellites 200+
Orbit 475 km
Overpass time over the equator 9:30–11:30 a.m.
Bands wavelengths (nm)Blue455–515
Green500–590
Red590–670
NIR780–860
Ground Sample Distance (nadir) 3.7 m
Pixel resolution (Orthorectified) 3.7 m
Frame 24.6 km × 16.4 km
Temporal resolution Daily
Radiometric resolution 12 bit
Table 2. Accuracy assessment parameters for binary classification for Cannabis sativa L.
ML AlgorithmCorrectly Classified InstancesKappaTPFPPrecisionRecallF-Score
DT75.2%0.510.750.250.750.750.75
RT87.1%0.740.870.130.870.870.87
KStar91.6%0.830.920.080.920.920.92
IBk92.1%0.840.920.080.920.920.92
RF93.1%0.860.930.070.930.930.93
Publisher’s Note: MDPI stays neutral with regard to jurisdictional claims in published maps and institutional affiliations.

