1. Introduction
Conservation tillage has been popularized in the middle and lower reaches of the Yangtze River in China. It refers to a method of soil conservation and fertilizer increase based on straw mulching [
1,
2]. As the core technology of mechanized conservation tillage, no-tillage sowing with straw mulch is beneficial to the formation of the ecological microenvironment for crop growth, which mainly includes: Improving soil organic matter, improving soil structure, promoting microbial activity and root development of crops, helping to form water-stable aggregate structure, solving the problems of grass blocking, and planting and drying of the soil-entering parts of machines and tools [
3,
4,
5,
6].
The core of no-tillage sowing with straw mulch is the straw crushing and throwing system, which mainly throws materials by the combined action of mechanical cutting force generated by a high-speed rotating knife and high-speed airflow. It has the advantages of simplicity, reliability, strong conveying capacity, and so on, and is now widely used in various grasses, cotton stalk crushing harvesters, and straw crushing and returning machines in China. However, in the experiment of rice–wheat rotation in the middle and lower reaches of the Yangtze River in China in 2018–2021, our team found that there were some problems in the operation of no-tillage sowing equipment in rice straw mulching, such as low power consumption, insufficient crushing of rice straw, and poor uniformity of straw mulching, which would further lead to the problems of high power consumption, sowing of wheat seeds on rice straw (drying seeds), and unfavorable growth of wheat in the later period. The reason was the unreasonable configuration of structural parameters and motion parameters of its straw crushing and scattering system [
7]. The test showed that it has an increasing dual influence on the straw treatment quality of the previous crop and the sowing quality of the next crop. Therefore, the research on the straw crushing and scattering system was of great significance to the rice–wheat rotation area [
8].
In the past years, international scholars have conducted fruitful research on straw crushing and throwing, including: Ma et al. [
9], in whose study an image-processing technology using a novel overlapping region analysis was proposed to overcome the inefficiency and low precision resulting from the manual identification of the strawuniformity. Zhai et al. [
10] optimized the structure and motion parameters of the blower by combining theoretical analysis with numerical calculation. Luo et al. [
11,
12] conducted a theoretical analysis of the motion law of the straw dropping and sliding-cutting coupling with the straw deflector during operation. The guide device not only realizes the function of guiding and distributing straw, but also has the function of fixing the knife, forming the effect of shearing with the grinding moving knife. Yan et al. [
13] designed a pull rod mechanism, which was installed in the straw pulverizer, so that the overlapping length of the fixed knife and the grinding moving knife could be adjusted in real time, and the overlapping length could be adjusted according to the actual situation at work to improve the quality of grinding and returning to the field. Zhang et al. [
14,
15] designed a crushing device that can change the crushing length. The crushing length can be changed by changing the feed amount of straw. There was a fixed knife at the entrance, and the straw can be cut when it enters. In addition, the crushing device was equipped with a metal sensor. If metal enters the crushing chamber, the device will automatically stop working and wait for a certain time to restart to prevent the damage of metal to the device. In Zhai et al.’s [
16] study, using CFD (Computational fluid dynamics) technology, the gas–solid two-phase flow in the throwing blower was numerically simulated, and the internal two-phase flow of the device during throwing materials was studied and analyzed, and its working parameters were analyzed and optimized.
From the current international research situation, the current research in the field of straw crushing and throwing focuses on two directions, one was to obtain the mathematical model of straw by simulating the movement of straw by numerical calculation method, and the other was to reveal the movement law of straw in the machine system by combining theoretical analysis and structural optimization [
17]. Both studies had achieved important results, but there was still a certain gap with the actual material throwing law. This was because the straw crushing and throwing system was a whole composed of a straw crushing system, a screw conveying system, and a throwing system, and the structure of the straw crushing and throwing system was also different from that of the traditional straw crushing and throwing system of pasture and grain, and there is no systematic research on the straw crushing and throwing system of the no-tillage planter at present.
On the basis of previous studies, this paper innovatively carries out experimental analysis on rice straw through the test-bed of the crushing and scattering system to simulate the crushing and scattering process of rice straw after harvest in a rice–wheat rotation area. Firstly, the structure and principle of the straw crushing and scattering system are analyzed, and on this basis the specific power consumption (representing the utilization rate of power consumption) and coverage uniformity are taken as evaluation indexes. The single factor experiment and Box–Behnken experiment were used to study the factors affecting the system, in order to obtain the scientific data of the straw crushing and scattering system, and to obtain the best motion and structural parameters, which provided the basis for the performance optimization of the straw crushing and scattering system of the no-tillage planter.
It should be pointed out that, at present, Chinese scholars’ research on the no-tillage planter focuses on the field test of the prototype; until now, no one had conducted a complete and scientific test of the straw crushing and scattering system test stand. The straw crushing and scattering system we developed needed to solve some scientific problems [
18]. The first one was to analyze its structure at first, and then analyze the influence rules of different factors, horizontal contrast power consumption and coverage uniformity through single factor experiment, and determine the reasonable interval of each factor. The second research task was to use the Box–Behnken design method to conduct experimental research on specific power consumption and throwing uniformity under different combinations of conveying and feeding speed, cutter shaft speed, and straw moisture content, in order to obtain the best scientific parameters of the straw crushing and throwing system and provide a basis for performance optimization of the straw crushing and throwing system of the no-tillage planter. The last research task was to prove the scientificity, reliability, and practicability of the crushing and scattering system test-bed by mounting the sowing system behind the straw crushing and scattering system for field verification test.
2. Materials and Methods
2.1. Straw Preparation
The selected rice variety “Ning 3818” was planted in the Nanjing Lishui experimental base (31°62′ “north latitude, 118°19′” east longitude) and harvested by a rice combine harvester, with initial moisture content of 40% and average length of 0.402 m. After manual collection, it was sent to Nanjing key laboratory of agricultural machinery, short straws were removed, all straws were trimmed to 0.4 ± 0.01 m, and then manually packed into 15 bags (every bag of 20 kg, the test samples were kept fresh in the fresh-keeping laboratory, and then straw samples with different moisture contents were prepared according to different test requirements. The test was conducted in Nanjing Key Laboratory of Agricultural Machinery (31°05′ “north latitude, 118°87′” east longitude) in November 2021. The ground in the test area was flat and the wind speed was suitable.
2.2. Test Platform of Straw Crushing and Throwing System
Working Principle of Straw Crushing, Scattering, and Sowing System
Straw content in the field was an important factor affecting the smoothness and reliability of conservation tillage [
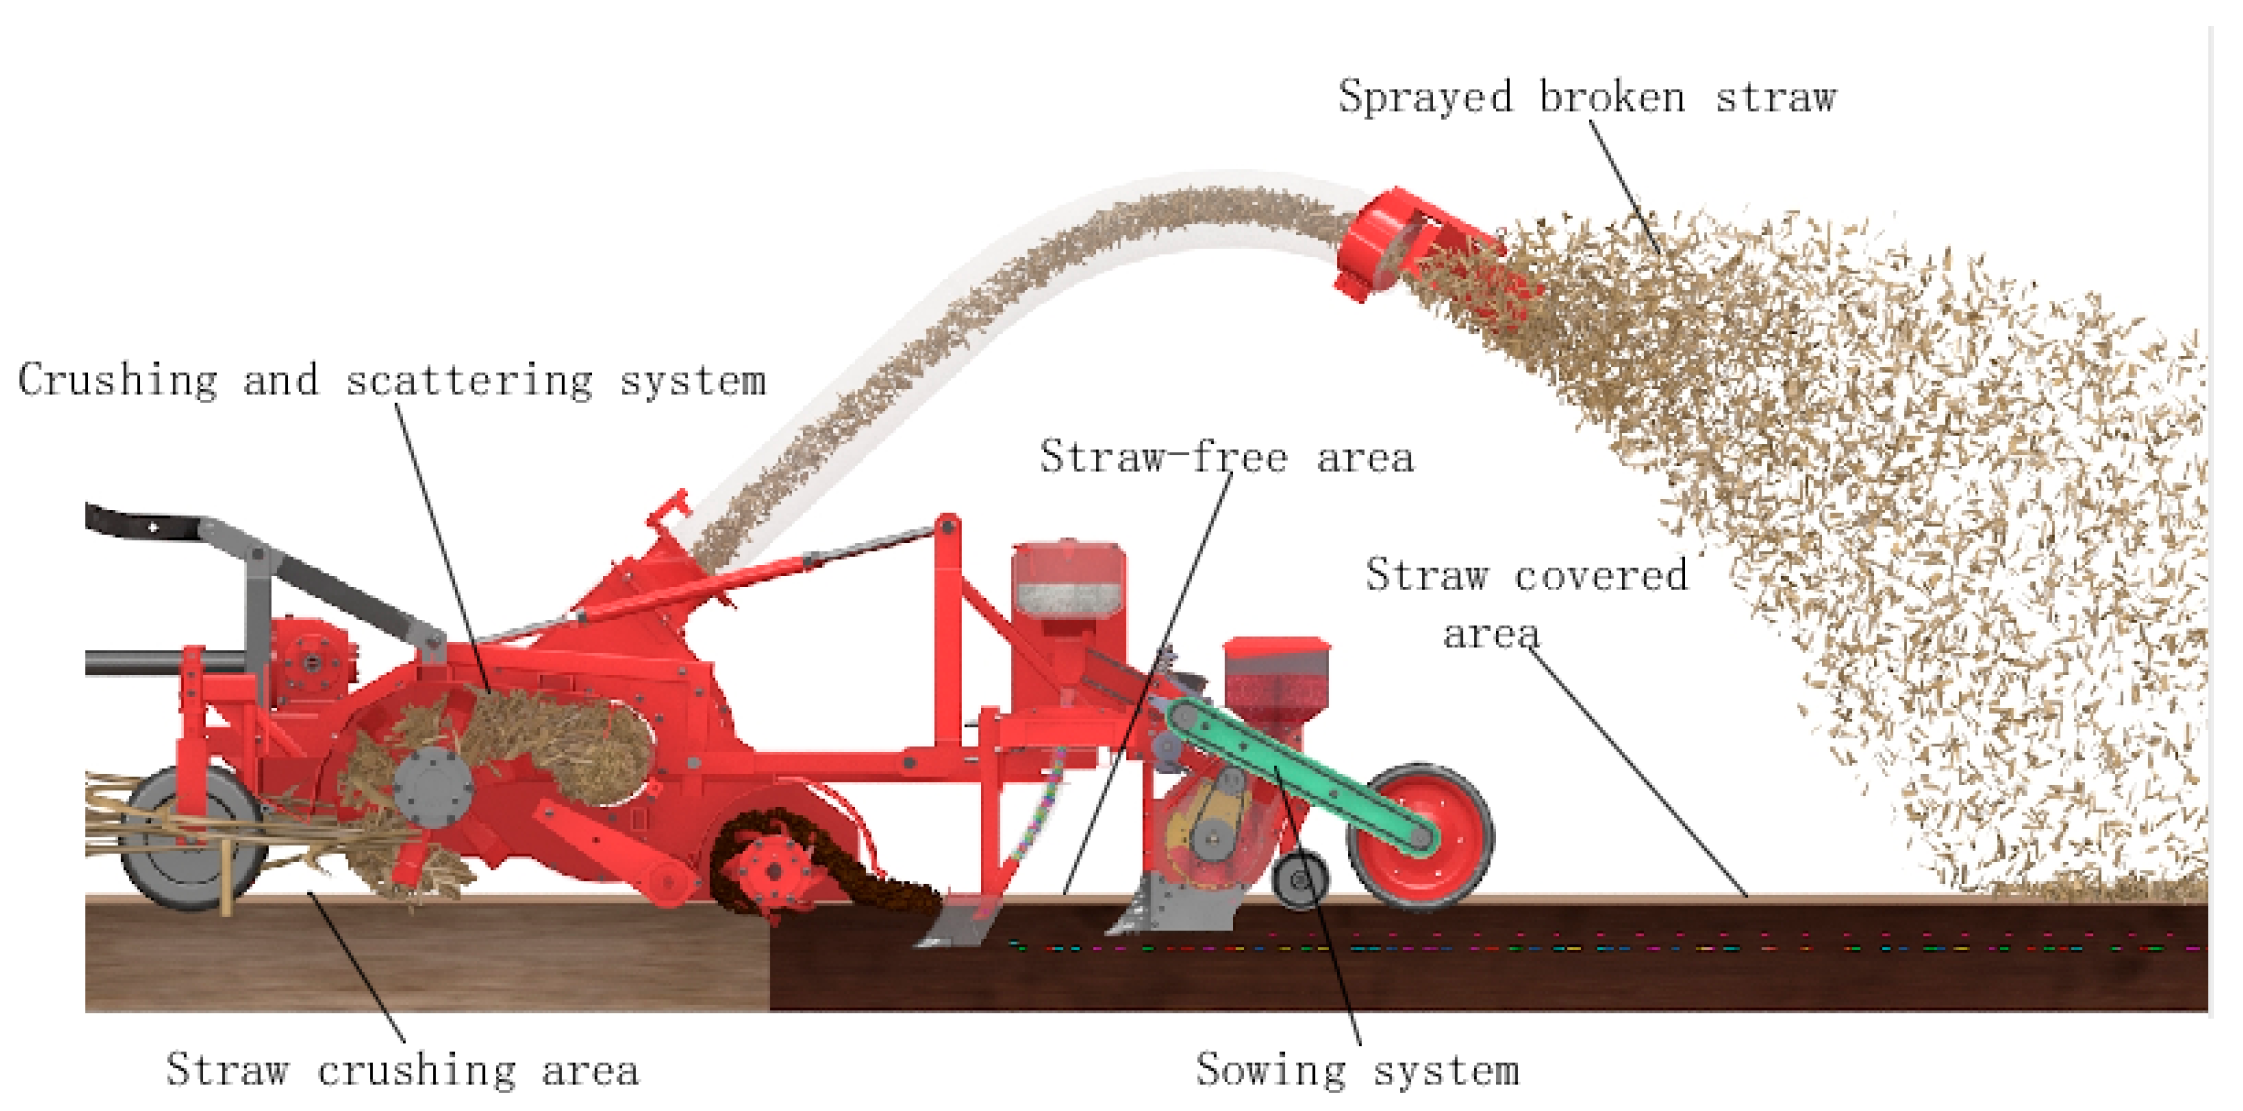
19]. The fundamental problem faced by the existing no-tillage machines and tools is that excessive straw residues on the ground entangle the machines and tools and hinder the seeds from entering the soil, which leads to the problems of seeding (seeds are easily sown on straw without emergence), drying (seeds are not covered with soil completely after sowing, without emergence) and missing sowing. The working process of the straw crushing and scattering sowing system shown in
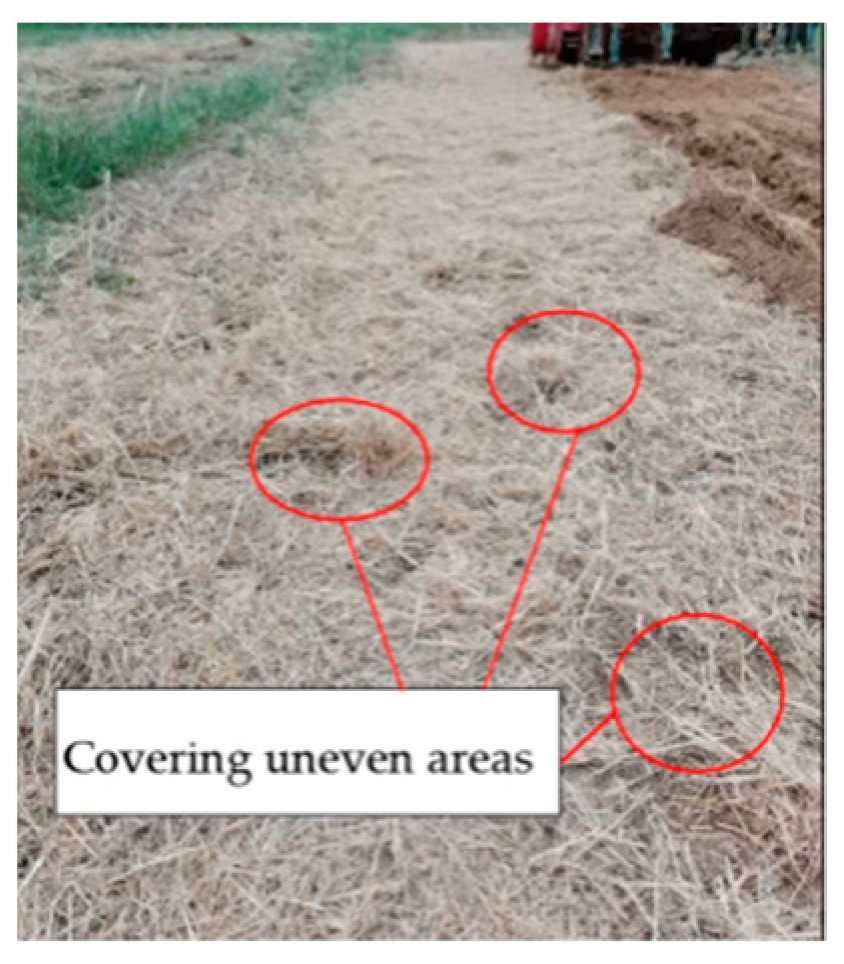
Figure 1 creatively solves this fundamental problem. Its solution strategy is as follows: The physical change and spatial transfer of straw, leveling the surface plough layer, creating a clean seedbed, and other functions are completed through the links of straw crushing, transverse transportation, air throwing, rotary scattering, multi-directional landing, uniform covering, etc., so as to provide the best environment for seed implantation, while the sowing system smoothly sows and fertilizes the straw in the process of “spatial transfer” of straw, and at the same time uniformly covers the ground straw after sowing plays a role of heat preservation and moisture preservation for the smooth growth of seeds in the later stage. This system has fundamentally solved the problems of planting, drying, and missing sowing, and has the advantages of green sustainable farming. However, due to the differences in moisture content of straw, unreasonable structural parameters, complex spatial movement characteristics of straw and other reasons, the existing uniform scattering system has the problems of high specific power consumption and low uniformity of straw coverage (
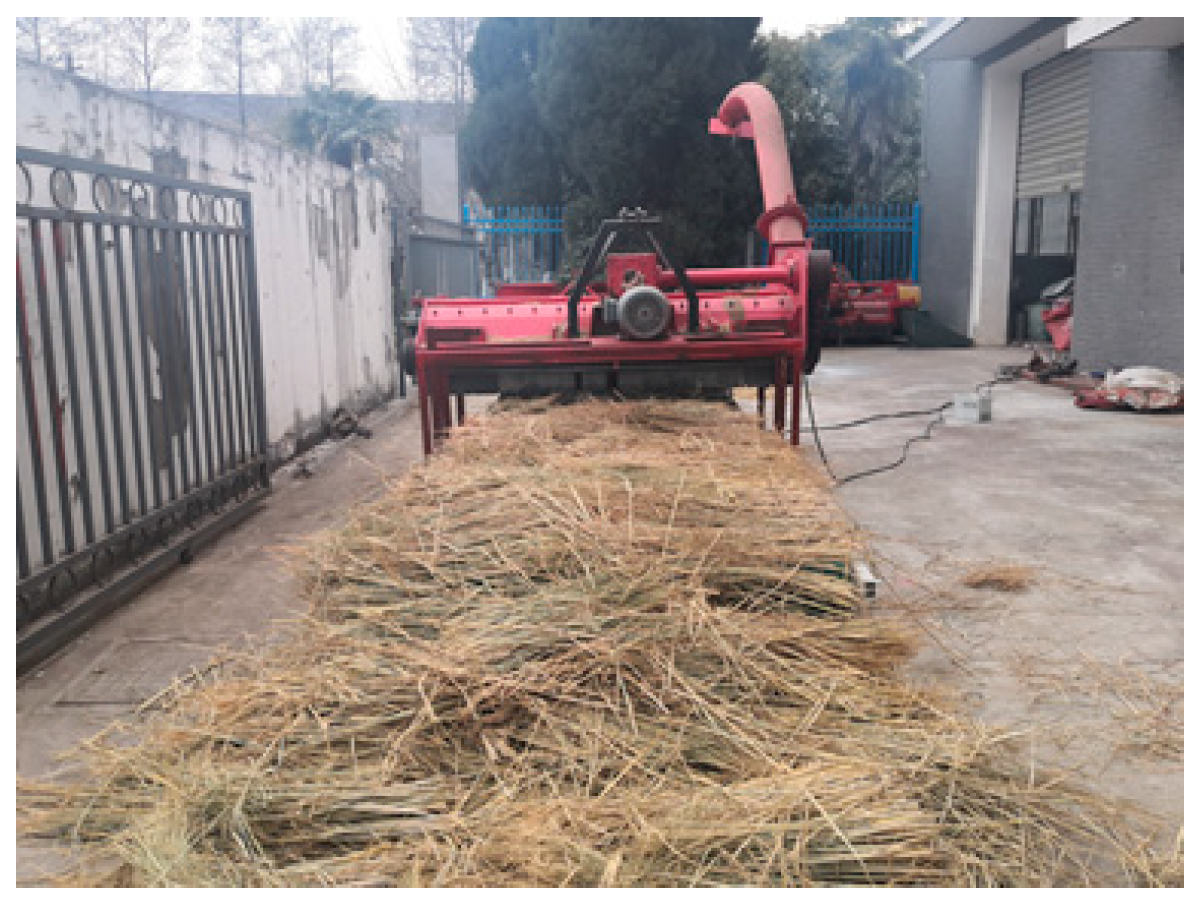
Figure 2). Because of the simple structure, maturity, and reliability of the sowing system, the influencing factors are found out by developing a uniform scattering system test stand.
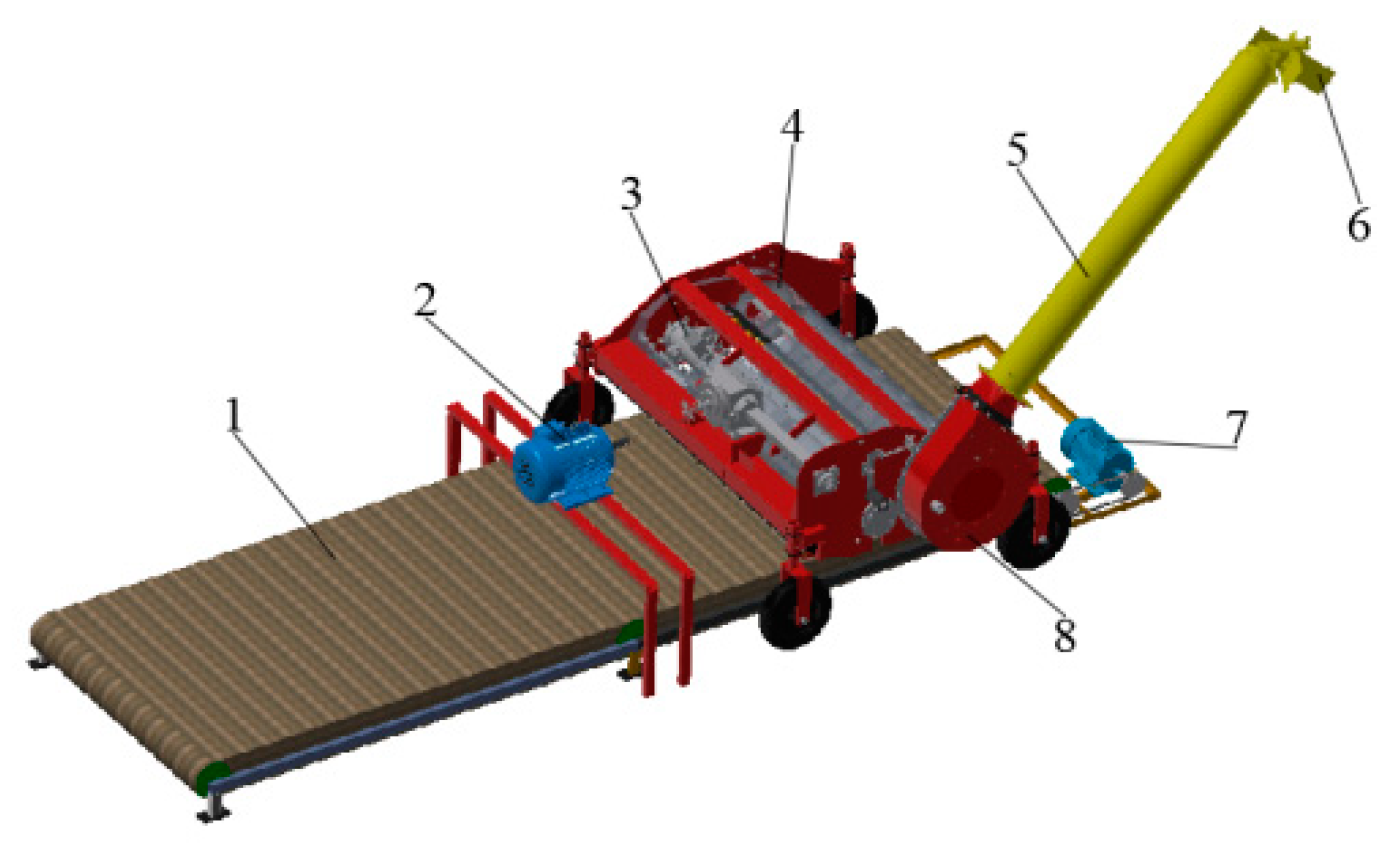
Figure 3 shows the overall structure of the straw crushing and scattering system, which consists of conveying and feeding device, frequency conversion motor, torque sensor, screw conveying device, crushing device, blade scattering device, etc.
The design principle of the whole test system was modular assembly, adjustable feeding speed, controllable rotating speed of grinding cutter shaft, convenient power consumption measurement, and easy hooking of seeding mechanism. The PTO (power take off) output of the frequency conversion motor provided driving force for the whole device, which was connected with the straw crushing cutter shaft through the universal shaft and the torque sensor. The movable cutter group was hinged on the crushing cutter shaft, and rotates reversely after the speed increase of the variable speed transmission mechanism, and the fixed cutter was welded in the die cavity. The straw crushing device mainly consisted of a straw pressing roller, a straw protecting curtain, a crushing knife shaft, a movable knife set, a fixed knife, a die cavity, etc. In order to overcome the problems of large amount of rice straw and strong toughness in practical operation, this design adopted the crushing method of movable knife group cutting and fixed knife support to improve the straw crushing effect and reduce the operation power consumption [
20].
When in operation, the rice straw was evenly laid on the conveyor belt, the conveyor belt fed the rice straw into the crushing system at a certain speed driven by the frequency conversion auxiliary motor, the frequency conversion motor PTO drove the crushing device to run, the movable knife set cooperated with the fixed knife in the cavity to cut, hit, tear, and rub the rice straw picked up into the cavity, and the crushed straw in pieces and fibers was sprayed to the screw conveyor at a certain speed after being thrown out by airflow along the protective cover under the centrifugal force. Then, under the action of the screw conveyor, the pulverized straw was conveyed to the throwing channel by the throwing blower at the end, and finally, under the action of the blade scattering device at the end of the throwing channel, the pulverized straw was evenly scattered and thrown to the rear area.
The test-bed of the crushing and scattering system completed the physical change and spatial transfer of rice straw through the links of straw crushing, transverse conveying, air throwing, rotary scattering, multi-directional landing, uniform covering, etc. Therefore, the parameters of moving parts in contact with the straw flow all affected the scattering unevenness and specific power consumption. For example, conveying and feeding speed, rotating speed of crushing straw cutter shaft, throwing angle, blade inclination angle, rotating speed of crushing straw cutter shaft, straw feeding amount, throwing pipe area, etc., all affected the throwing unevenness and specific power consumption to a certain extent. Based on the previous experiments and the operation characteristics of machines and tools, it was preliminarily determined that the main factors were feeding speed, rotating speed of crushing straw cutter shaft, and straw moisture content [
21].
2.3. Specific Power Consumption Test System
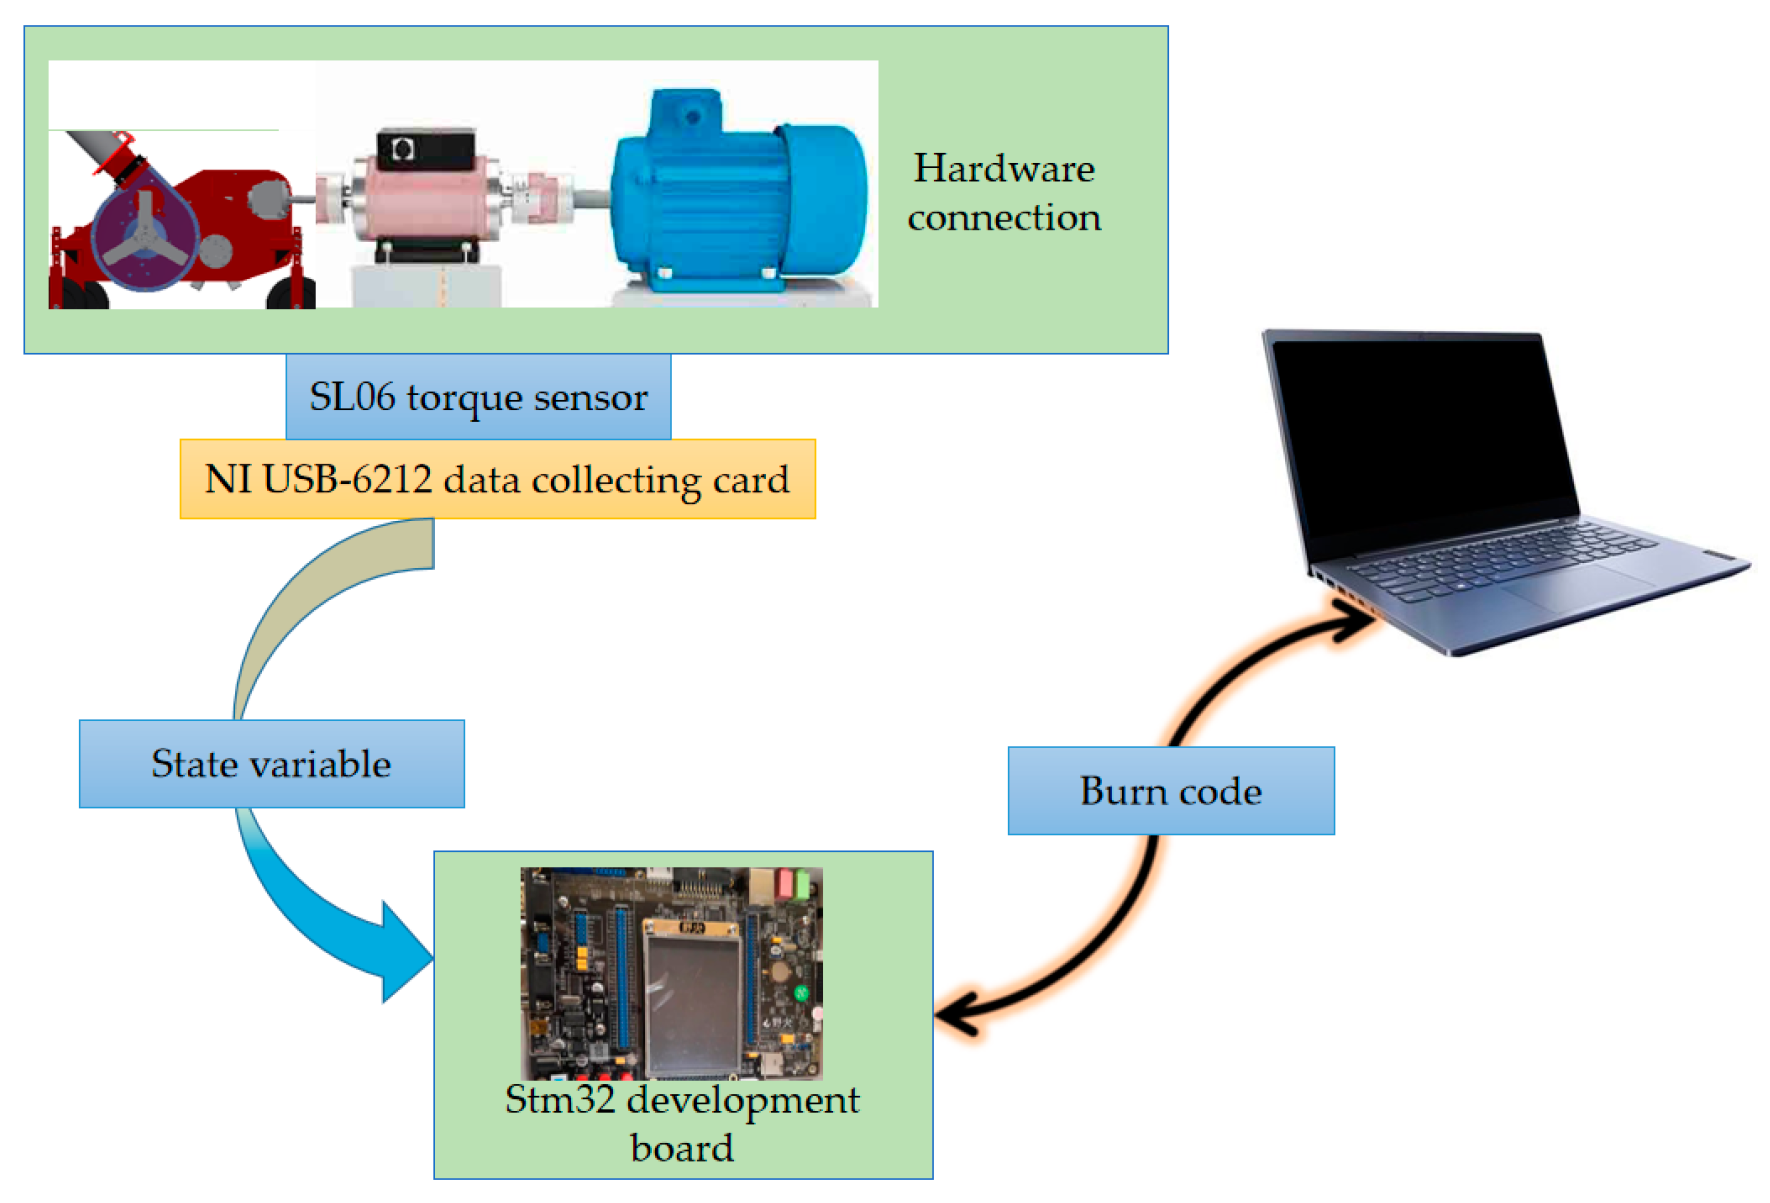
The specific power consumption test system of the straw crushing and throwing system consists of two parts: The instrument hardware platform and the software platform (
Figure 4). The hardware platform of the instrument included: ① YP2-280S variable frequency motor; ② SL-06 dynamic torque sensor, working voltage ±15 V, accuracy 0.5% f s, frequency signal output: 5~10 kHz, level 5 V; ③ NI USB-6212 acquisition card, with 16 analog input channels (16-bit resolution, sampling rate of 400 KS/s), 2 analog output channels (16-bit resolution, sampling rate of 250 KS/s); ④ 12 V battery, rated capacity C of 5 ah; ⑤ HDP05-12D15 DC-DC converter, which converts the 12 V DC supplied by the battery into 15 V and supplies power to the torque sensor; ⑥ Notebook computer with driver and data acquisition program.
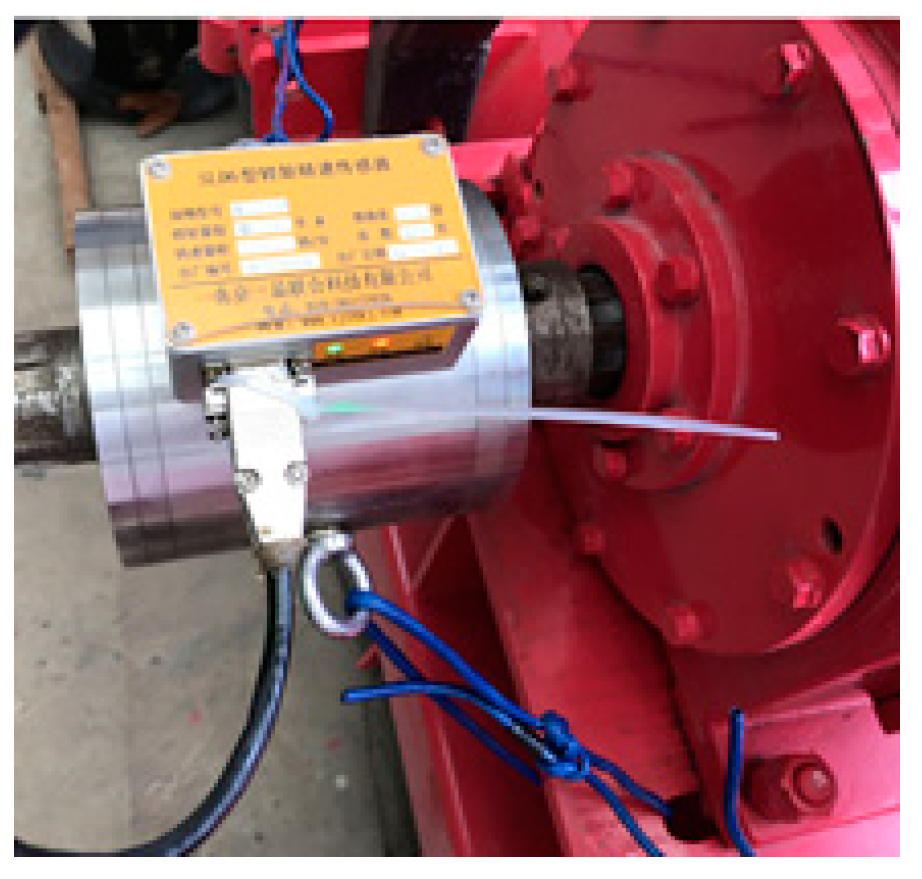
According to the structural characteristics of the test-bed, this project used an SL-06 torque sensor to measure the torque. During the test, the SL-06 torque sensor was installed at the real shaft end of the universal joint connected with the frequency conversion motor shaft through the flange plate to measure the torque, and then the torque data measured by this test method was converted into the specific power consumption data of the test-bed of the crushing and scattering system.
The experiment was divided into two parts: Single factor experiment and combination experiment. First, the influence rule of each factor on the test index was established by the single factor experiment, and then the optimal combination was obtained by the combination experiment. In the experiment, the rice straw with a certain moisture content was laid on the conveyor belt. In the single factor experiment, three kinds of conveying and feeding speeds (F1), cutter shaft rotation speed (F2), and straw moisture content (F3) were set.
Table 1 shows different level settings and corresponding environmental conditions. According to the early experiments and experiences, the conveying and feeding speeds were set at 0.8 m/s (T1), 1.1 m/s (T2), 1.4 m/s (T3), and 1.7 m/s (T4). The rotary speed of the cutter was set at four test levels: 1700 r/min (K1), 1900 r/min (K2), 2100 r/min (K3), and 2300 r/min (K4), and the moisture content of straw was set at 20% (M1), 25% (M2), 30% (M3), and 33% (M4).
Test steps referred to T/CAMA 21-2019 “Whole straw stubble sower in clean area”, NY/T1768-2009 “No-tillage sower quality evaluation technical specification”, JB/T6678-2001 “Straw crushing and returning machine” and other standards. The test site was shown in
Figure 5, installation of torque sensor was shown in
Figure 6, and the test steps were: Firstly, the measuring system run at idle speed, and torque data was recorded. In order to imitate the effect of the field test, each test cycle ran for 10 s, and then the torque data was imported into the software for calculation [
22]. The specific power consumption of the straw crushing and scattering system was as follows [
23]:
Here, Pa is the specific power consumption of straw crushing and scattering system, J/s2; T1 is without load torque data, N·m; T2 is torque data at different levels, N·m; n1 is the speed of the down-conversion motor at different levels, r/s; v is the conveying and feeding speed at different levels, m/s; L is the width of the transmission belt, m; hj is the laying height of straw at different levels, m; ρj is the density of straw at different levels, kg/m3.
2.4. Measuring Method of Coverage Uniformity
In order to reduce repeated tests, measure the coverage uniformity immediately after measuring the specific power consumption after each shutdown. The basic steps were as follows: Take an effective scattering coverage area of 2 × 2 m at the back and lower part of the blade device, then divide this area into 400 measuring cells of 0.1 × 0.1 m
2, measure the central position of each cell with a depth measuring ruler, and immediately clean and tidy up the site after each measurement and statistics recording, so as to prepare for the next test level. The evaluation formula of coverage uniformity is as follows.
Here Fb is the coverage uniformity, %; hi is the straw coverage depth of the measuring point, m;
is the average depth of straw mulching, m.
3. Results
3.1. Single Factor Test Results
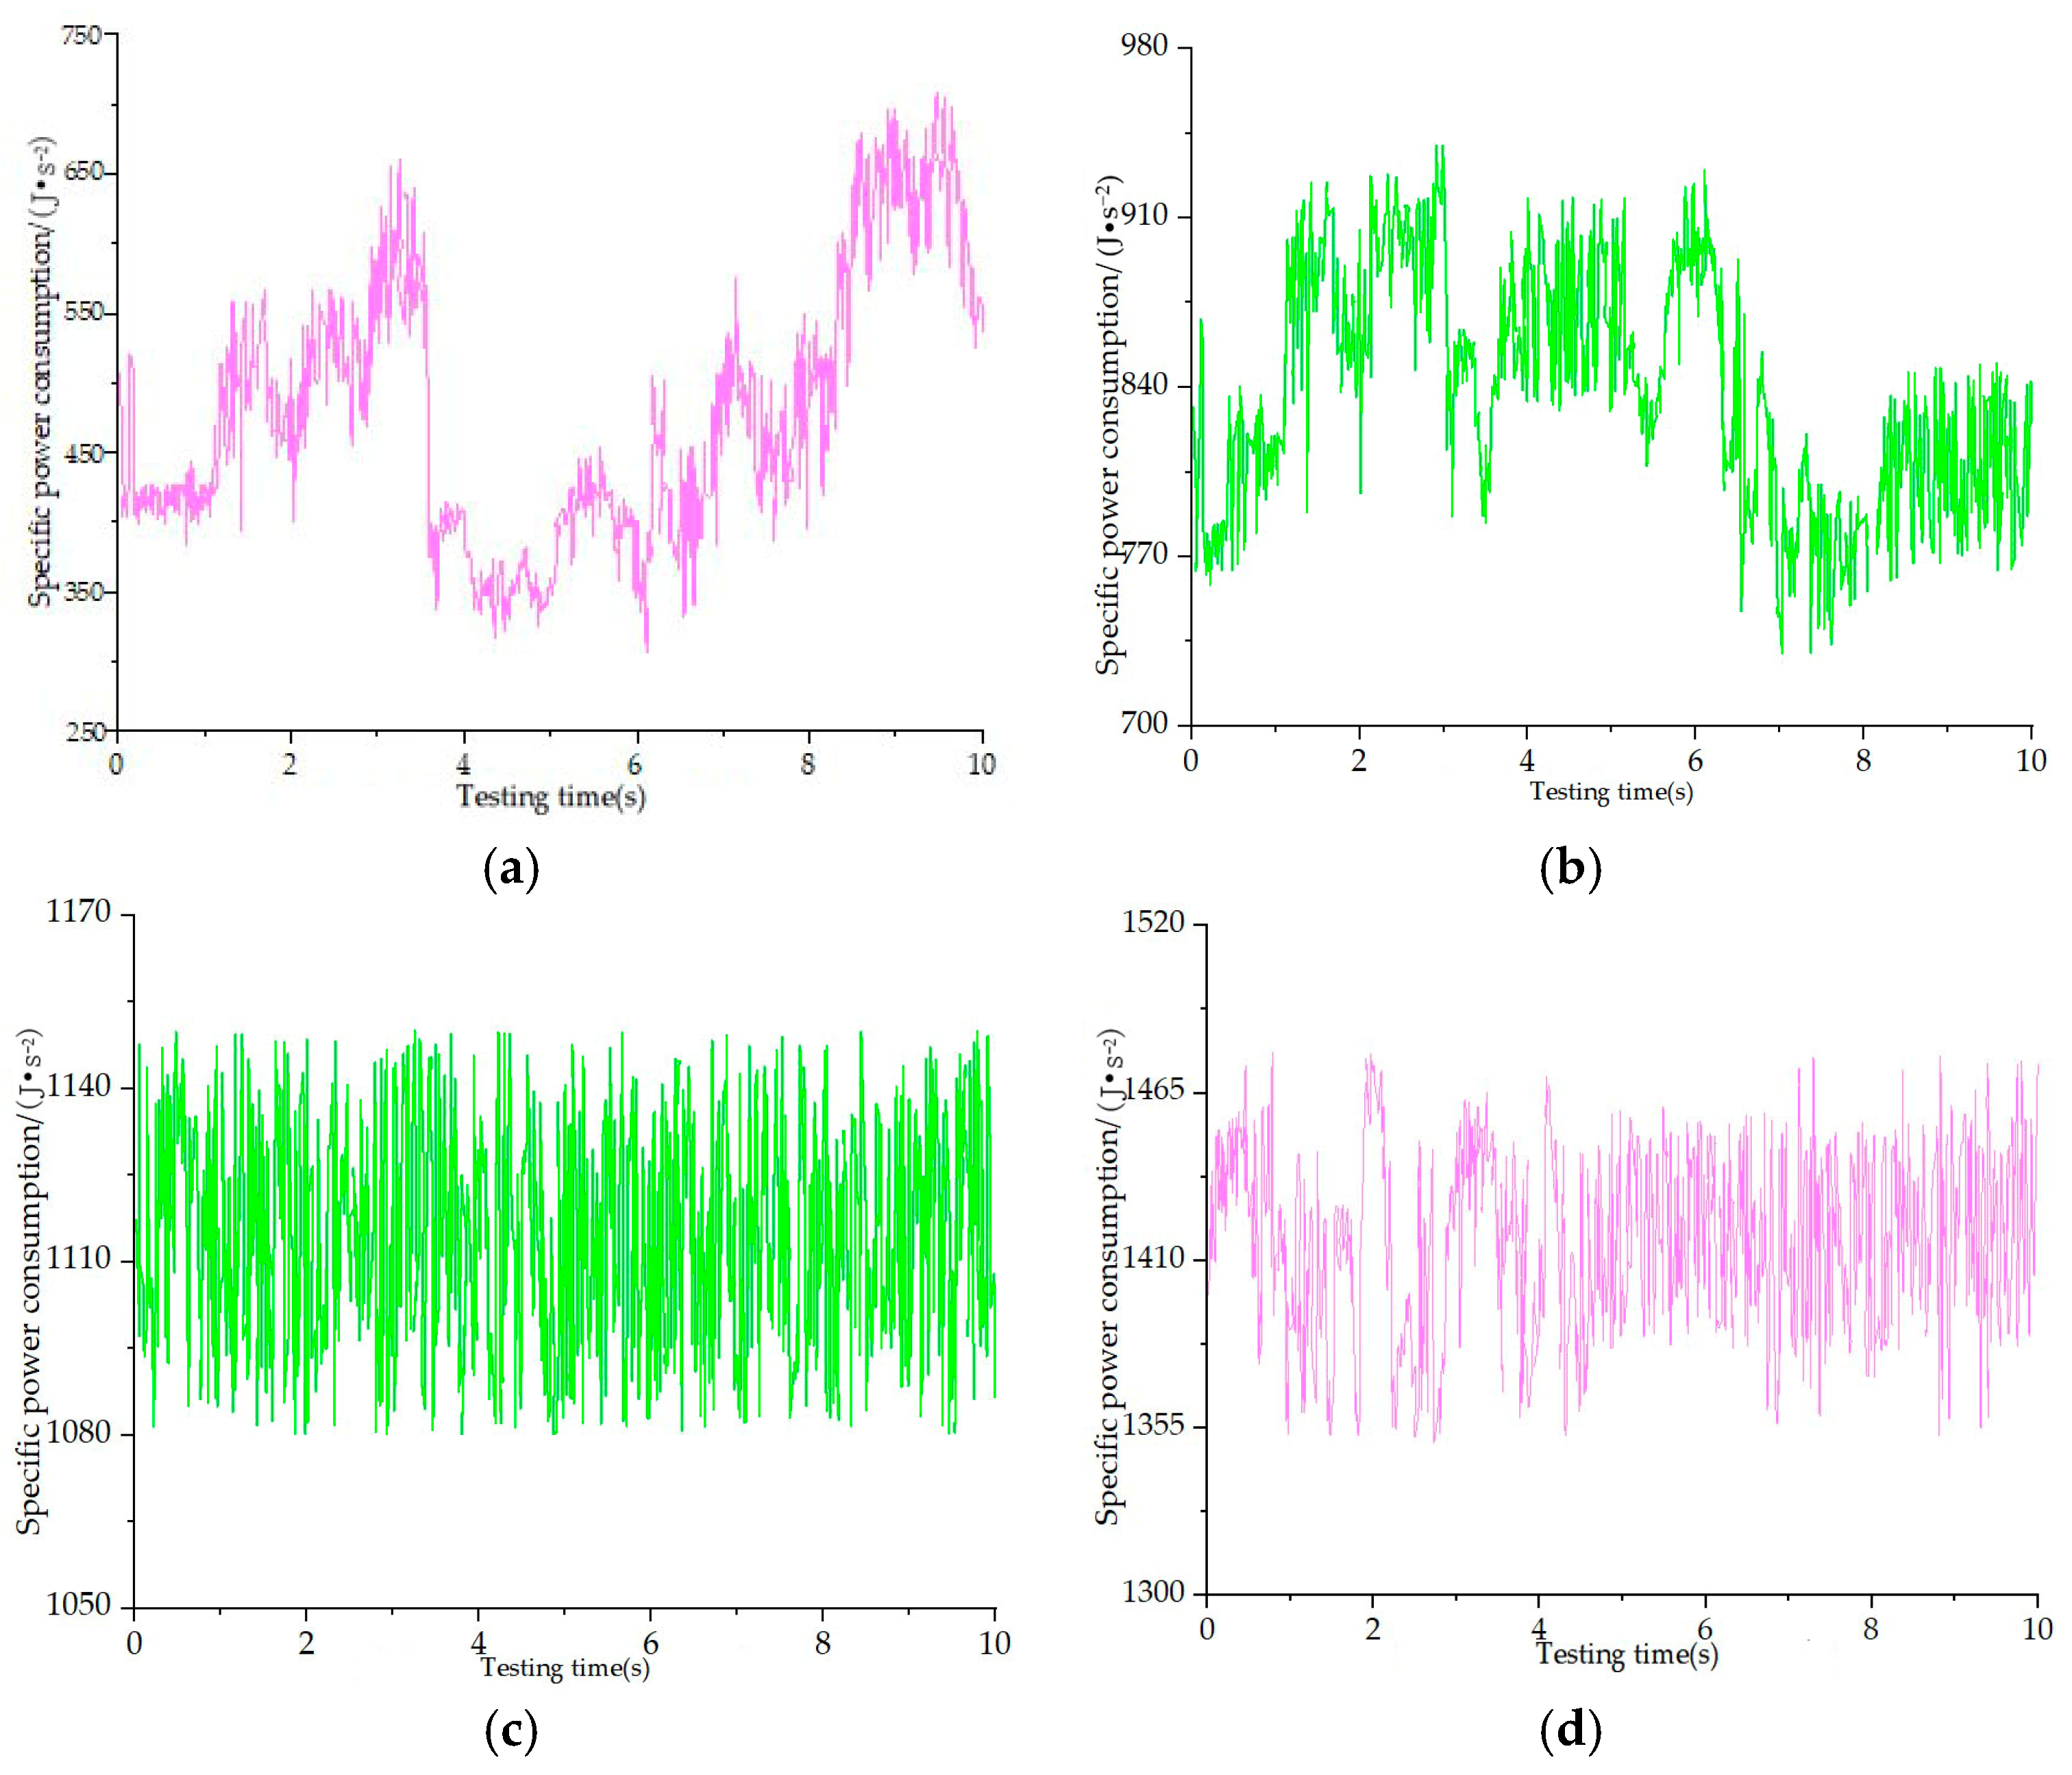
3.1.1. Influence of Different Conveying and Feeding Speeds on Indexes
In this single factor experiment, the moisture content of the selected straw was 30.2%, and the rotating speed of the grinding cutter shaft was kept at 1900 r/min.
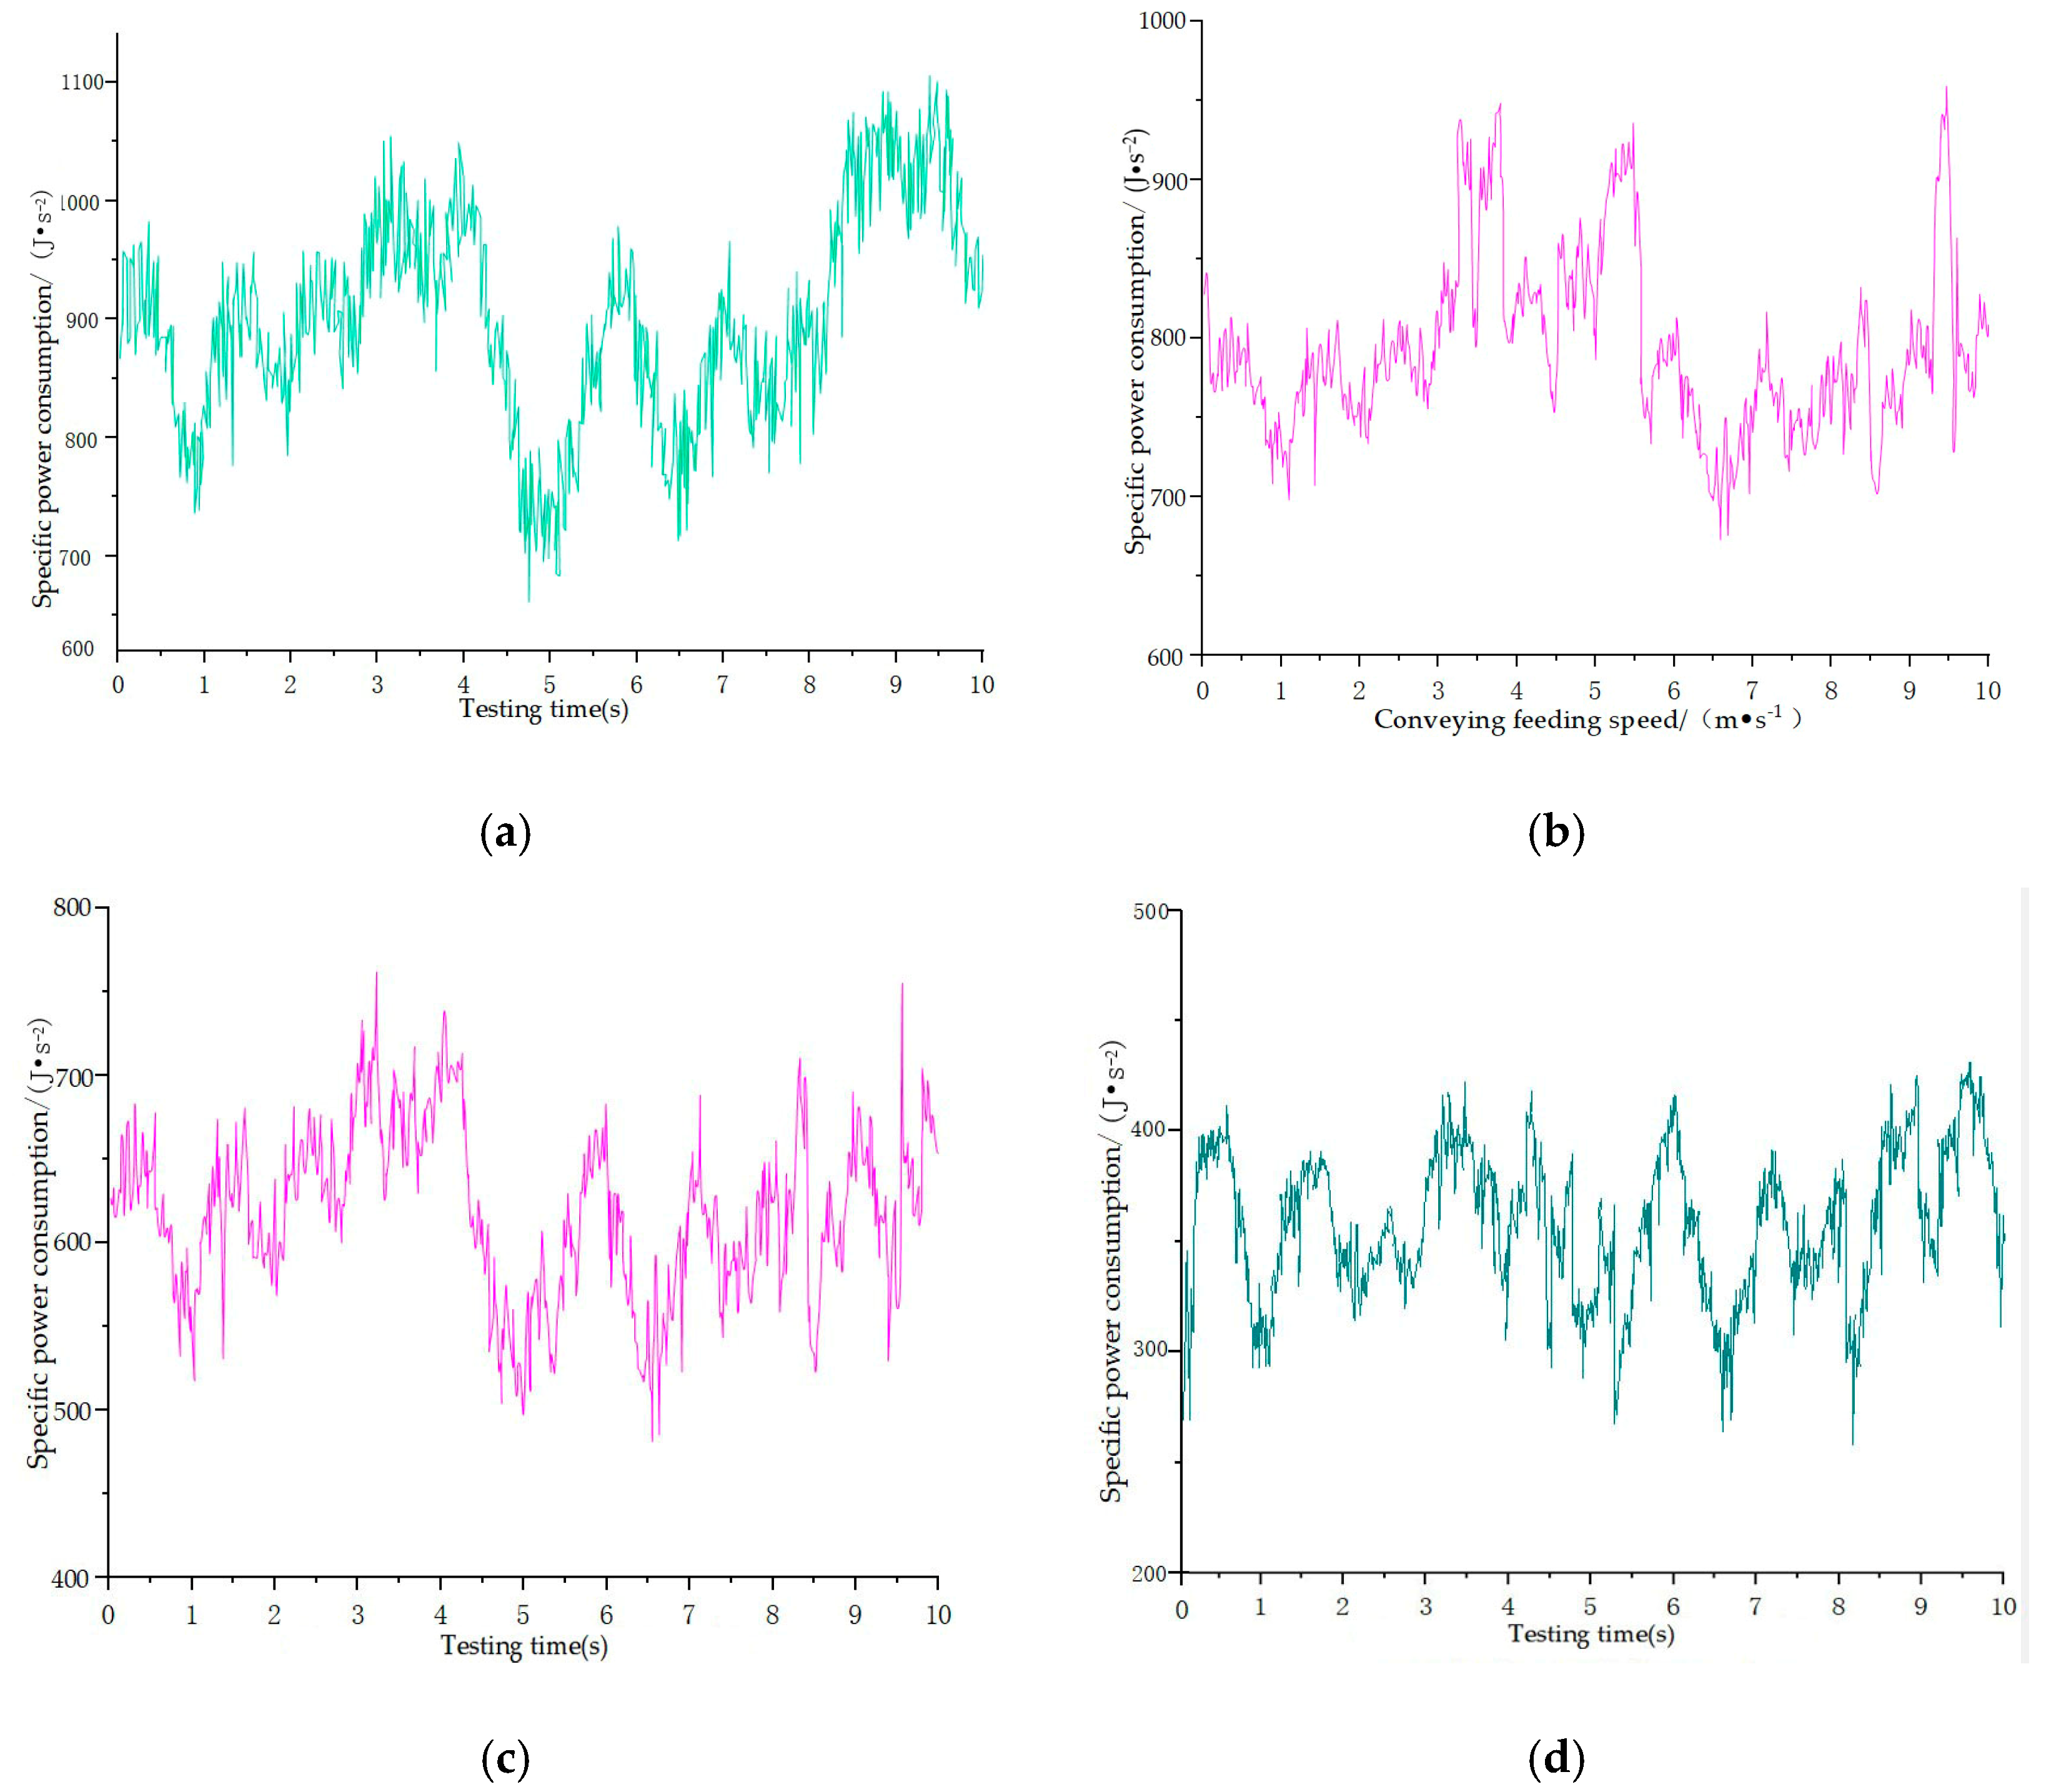
Figure 7 showed the changes of specific power consumption with time in the test period at four levels, with the corresponding average specific power consumption of 870.2, 780.7, 620.1, and 340.8 J/s
2, and the corresponding peak-valley differences of 400, 300, and 400, respectively.
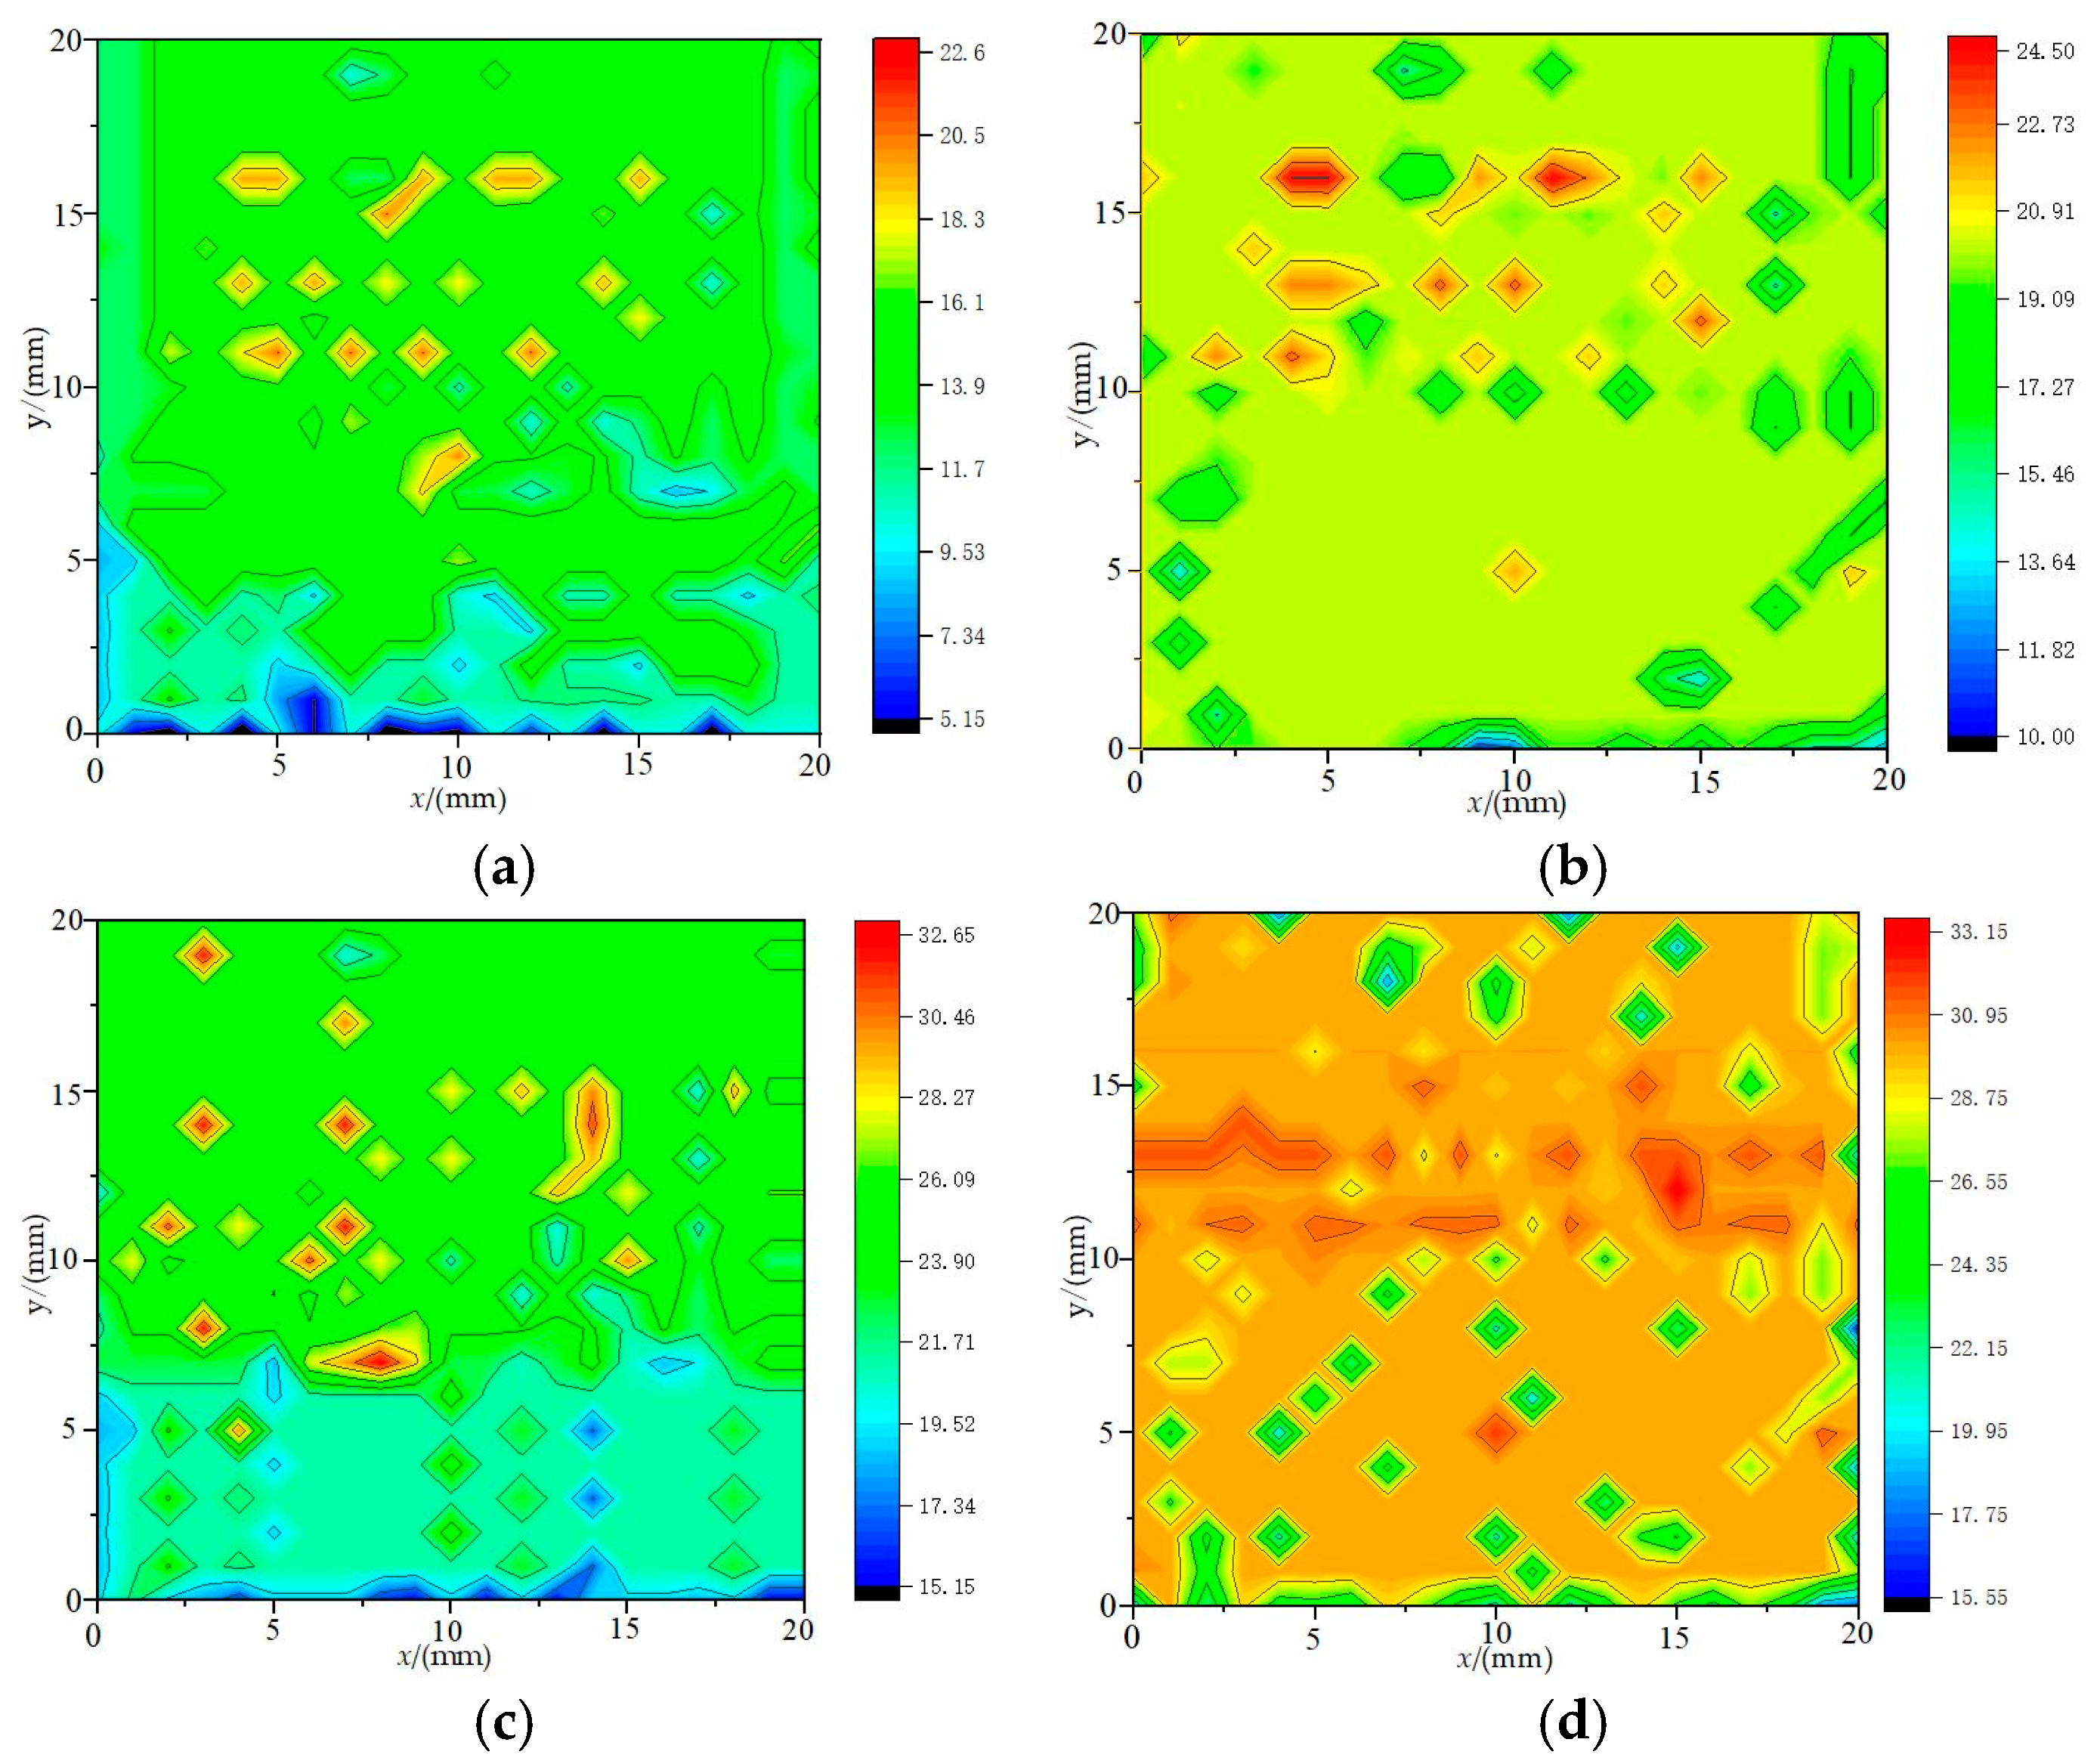
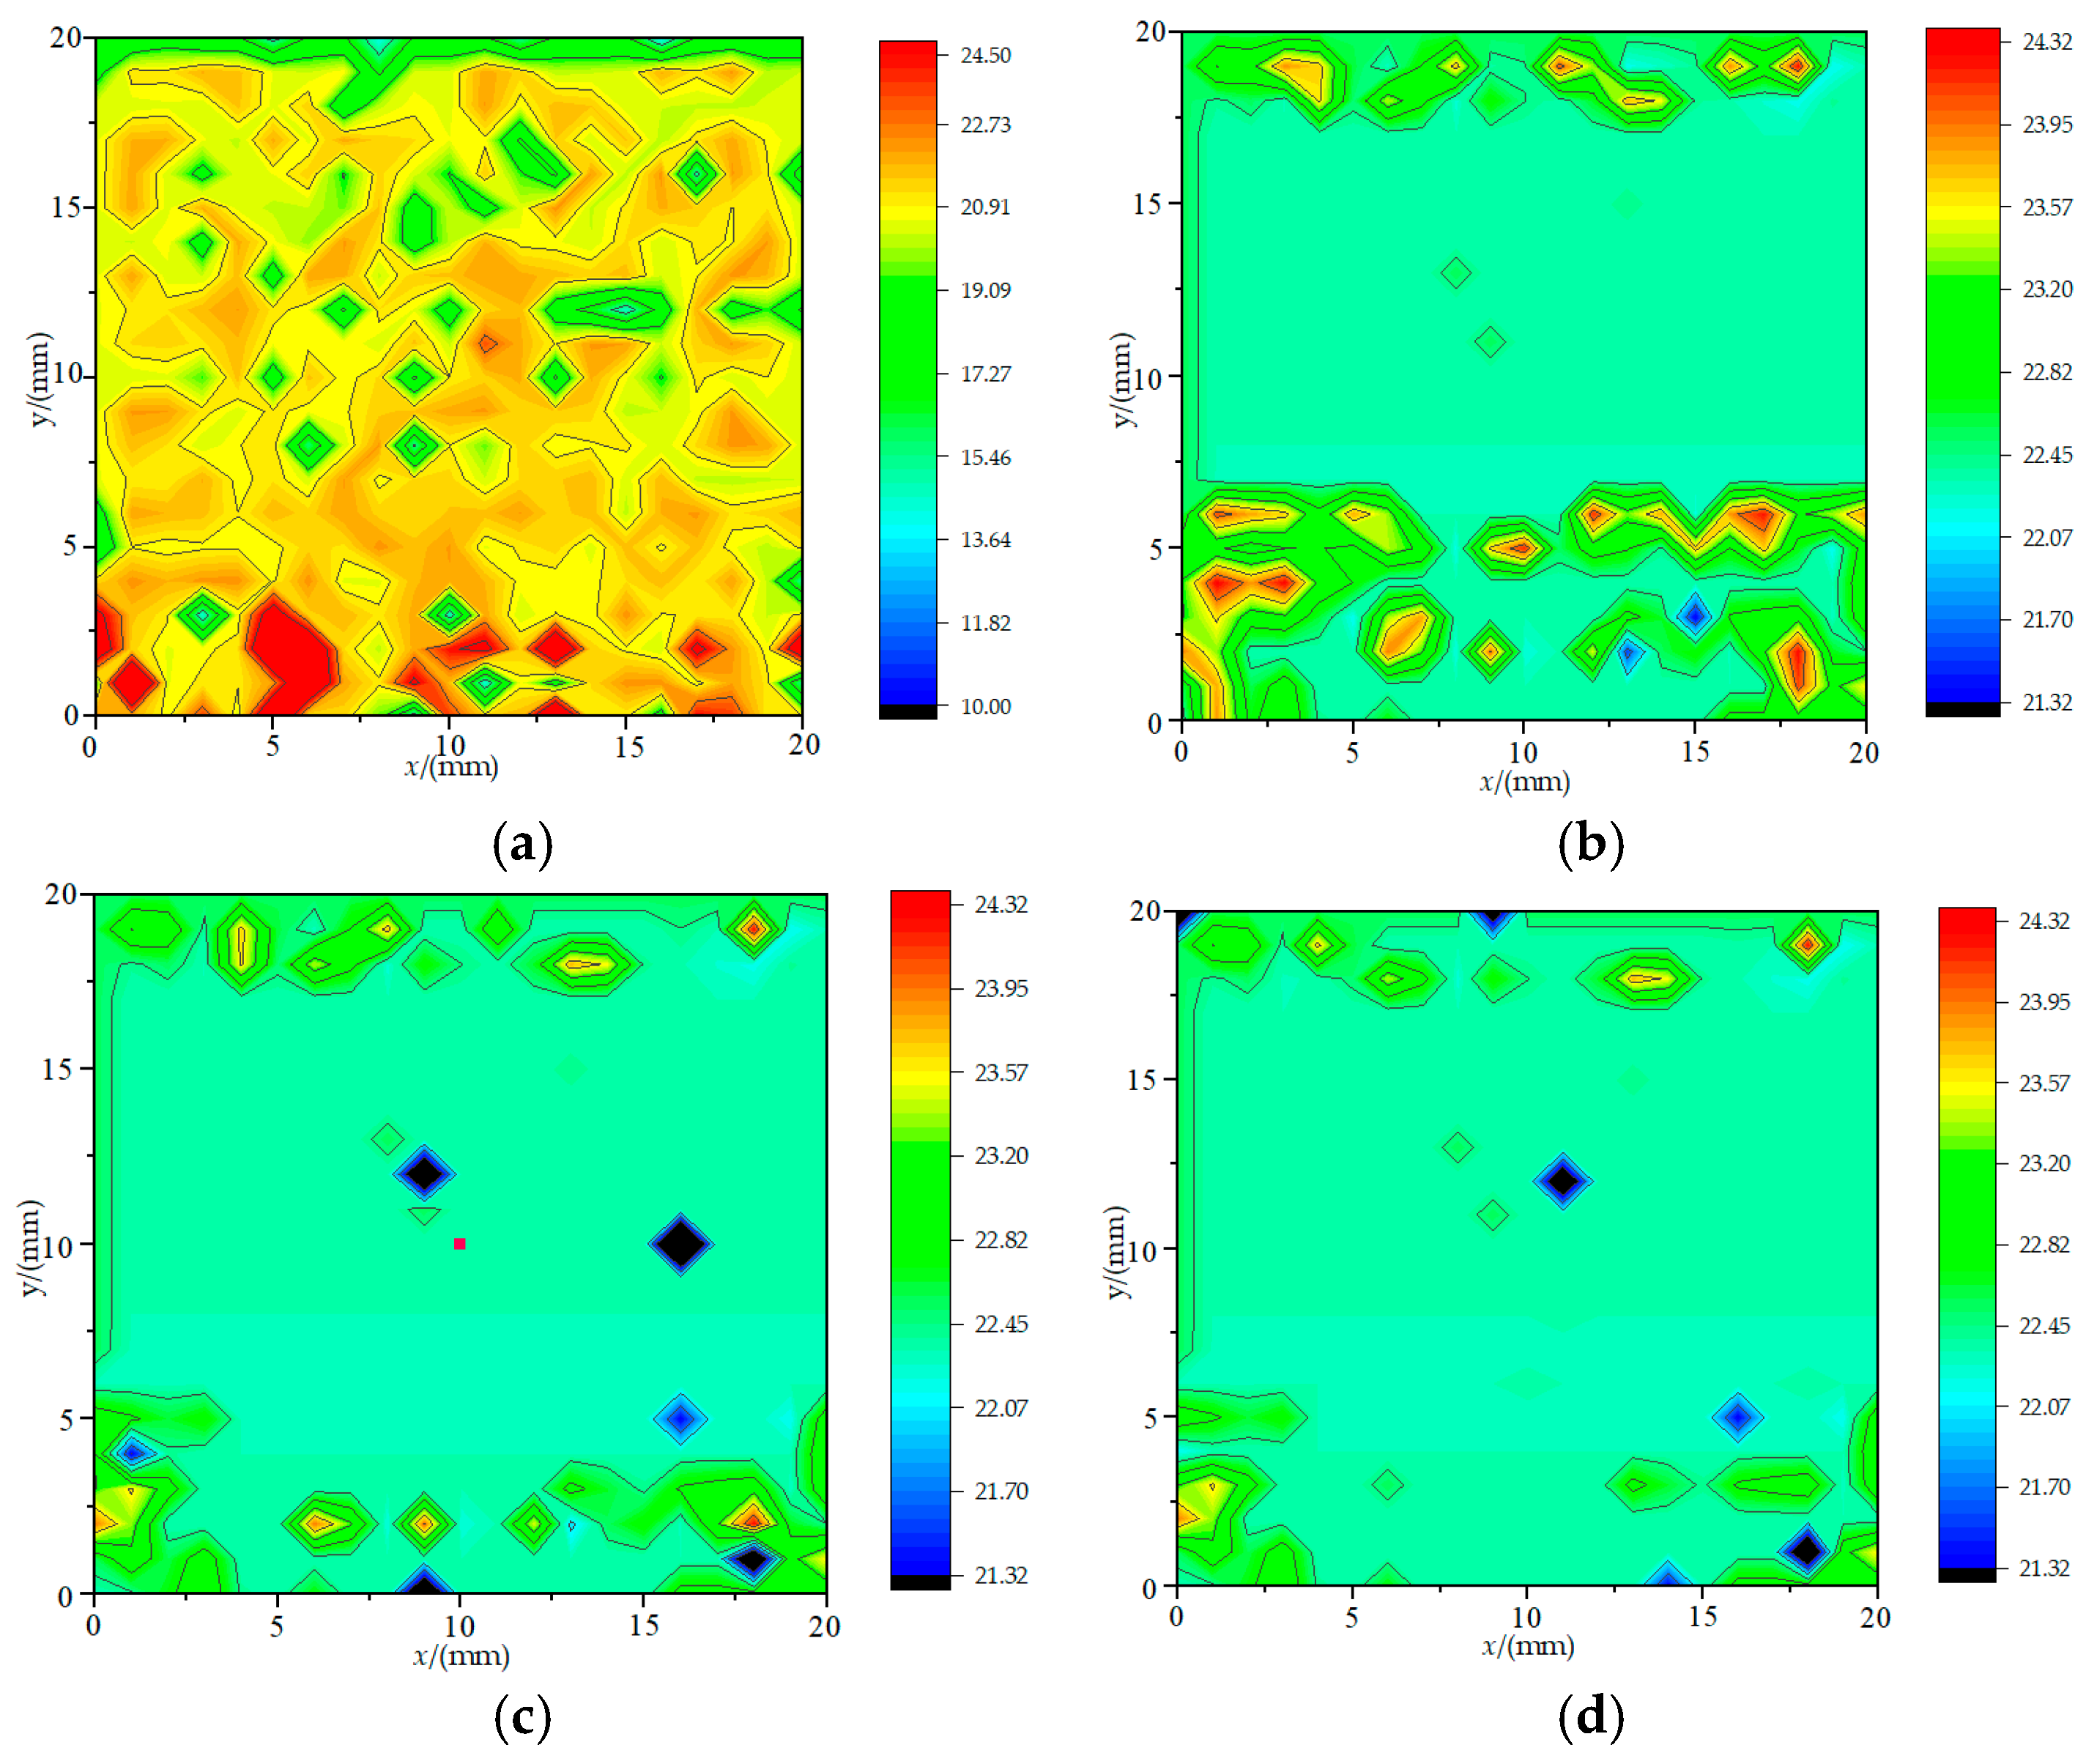
Figure 8 showed the change of coverage uniformity with time in the test period at four levels, and the corresponding average coverage uniformity was 76.54%, 93.14%, 90.47%, and 87.65%, respectively, which indicates that the coverage uniformity first increased and then decreased with the increase of conveying and feeding speed. The corresponding coverage thickness ranges were 0.0515~0.2038 m (F1T1), 0.1587~0.2545 m (F1T2), 0.1639~0.3202 m (F1T3), and 0.1962~0.3335 m (F1T4); and the corresponding average coverage thicknesses were 0.1538 m, 0.2145 m, 0.2586 m, 0.3035 m, F1T1, F1T2.
Figure 8a showed that the coverage uniformity first increases and then decreases with the increase of conveying and feeding speed. The reasons were: When conveying and feeding speed was low, the feeding amount was small, and the broken straw blown out from the channel was scattered randomly in the air, which cannot achieve effective coverage;
Figure 8b shows that with the increase of conveying and feeding speed, enough straw can fully contact the crushing knife in the crushing cavity, and the crushing and tearing effect was good, and can be relatively evenly scattered to the target area under the action of fans and blades, so the coverage uniformity was achieved.
Figure 8c shows that with the further increase of conveying and feeding speed, the coverage uniformity tended to decrease, because some straws were not crushed, resulting in uneven distribution in the air;
Figure 8d shows that with the further increase of conveying and feeding speed, the coverage uniformity obviously decreases, the amount of straw fed into the crushing device per unit time increases, the straw to be crushed by the crushing device per unit time increases, and the straw layer thickens; the average action time and times between the movable knife set and the straw decrease, which weakened the cutting effect, and the straw mass was not easily fully torn and cut in the tearing process, so the coverage uniformity of the straw will decrease.
The importance of coverage uniformity was higher than specific power consumption. From the point of view of giving priority to improving coverage uniformity and then reducing average specific power consumption, the transmission and feeding speed range was 0.9~1.5 m/s.
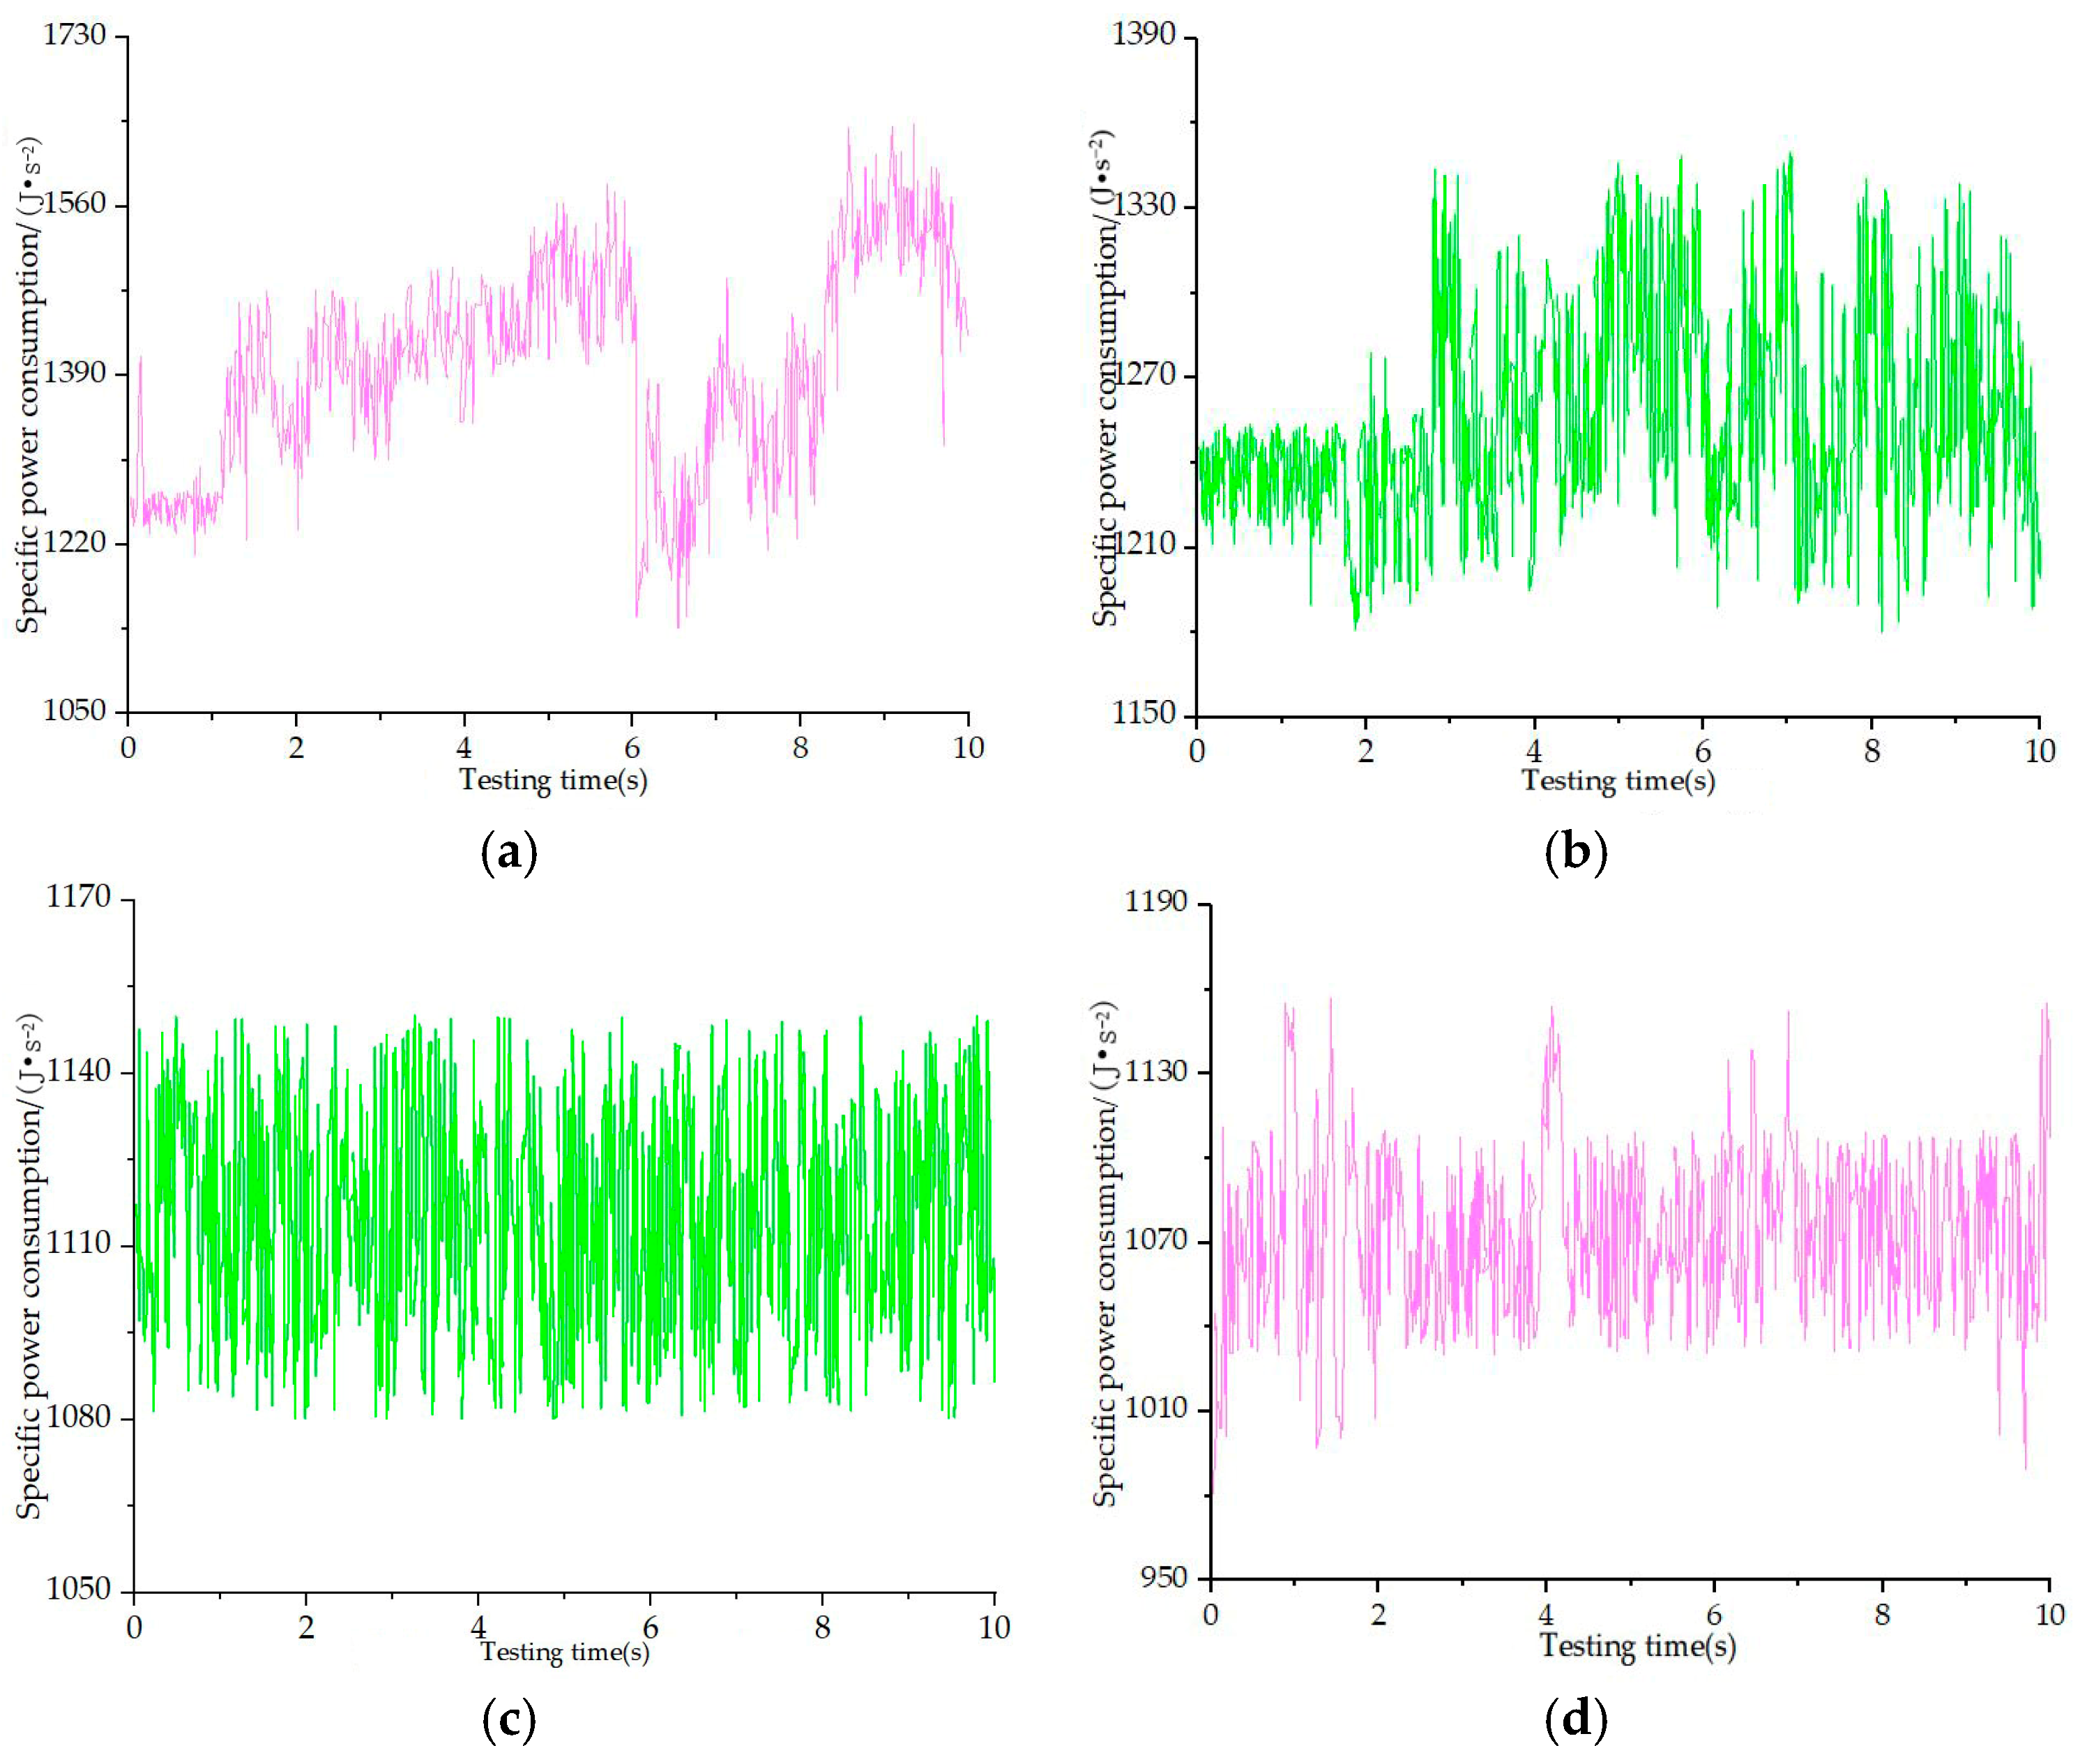
3.1.2. Influence of Different Cutter Shaft Speeds on Indexes
In order to ensure a scientific and smooth experiment and reduce the uncertainty, the same rotational speed of the shaft of the blower and the shaft of the crushing knife was adjusted in the experiment to keep the consistency between the air throwing efficiency and the crushing efficiency. In this experiment, the moisture content of straw was 30.5%, and the conveying and feeding speed was kept at 1.35 m/s in the experiment. During the experiment, different cutter shaft speeds can be obtained through frequency conversion motor speed [
24].
Figure 9 showed the change of specific power consumption with time at four levels, the corresponding average specific power consumption was 545.2, 860.7, 1121.7, and 1422.8 J/s
2, and the specific power consumption fluctuates greatly at the levels of F2K1 and F2K2, with the maximum peak-valley difference of 400 J/s
2 and 200 J/s
2, and the ratio of F2K3 and F2K4. The maximum peak-valley difference was only 80 J/s
2 and 120 J/s
2. The above changes and laws indicate that the average specific power consumption increases with the increased of the rotating speed of the grinding cutter shaft. The reason may be that the more the blade hit the straw in unit time, the greater the hitting force, and the better the tearing, shearing and crushing effect on the straw. Therefore, when the rotating speed of the grinding cutter shaft increases, the better the tearing, shearing, and crushing effect on the straw.
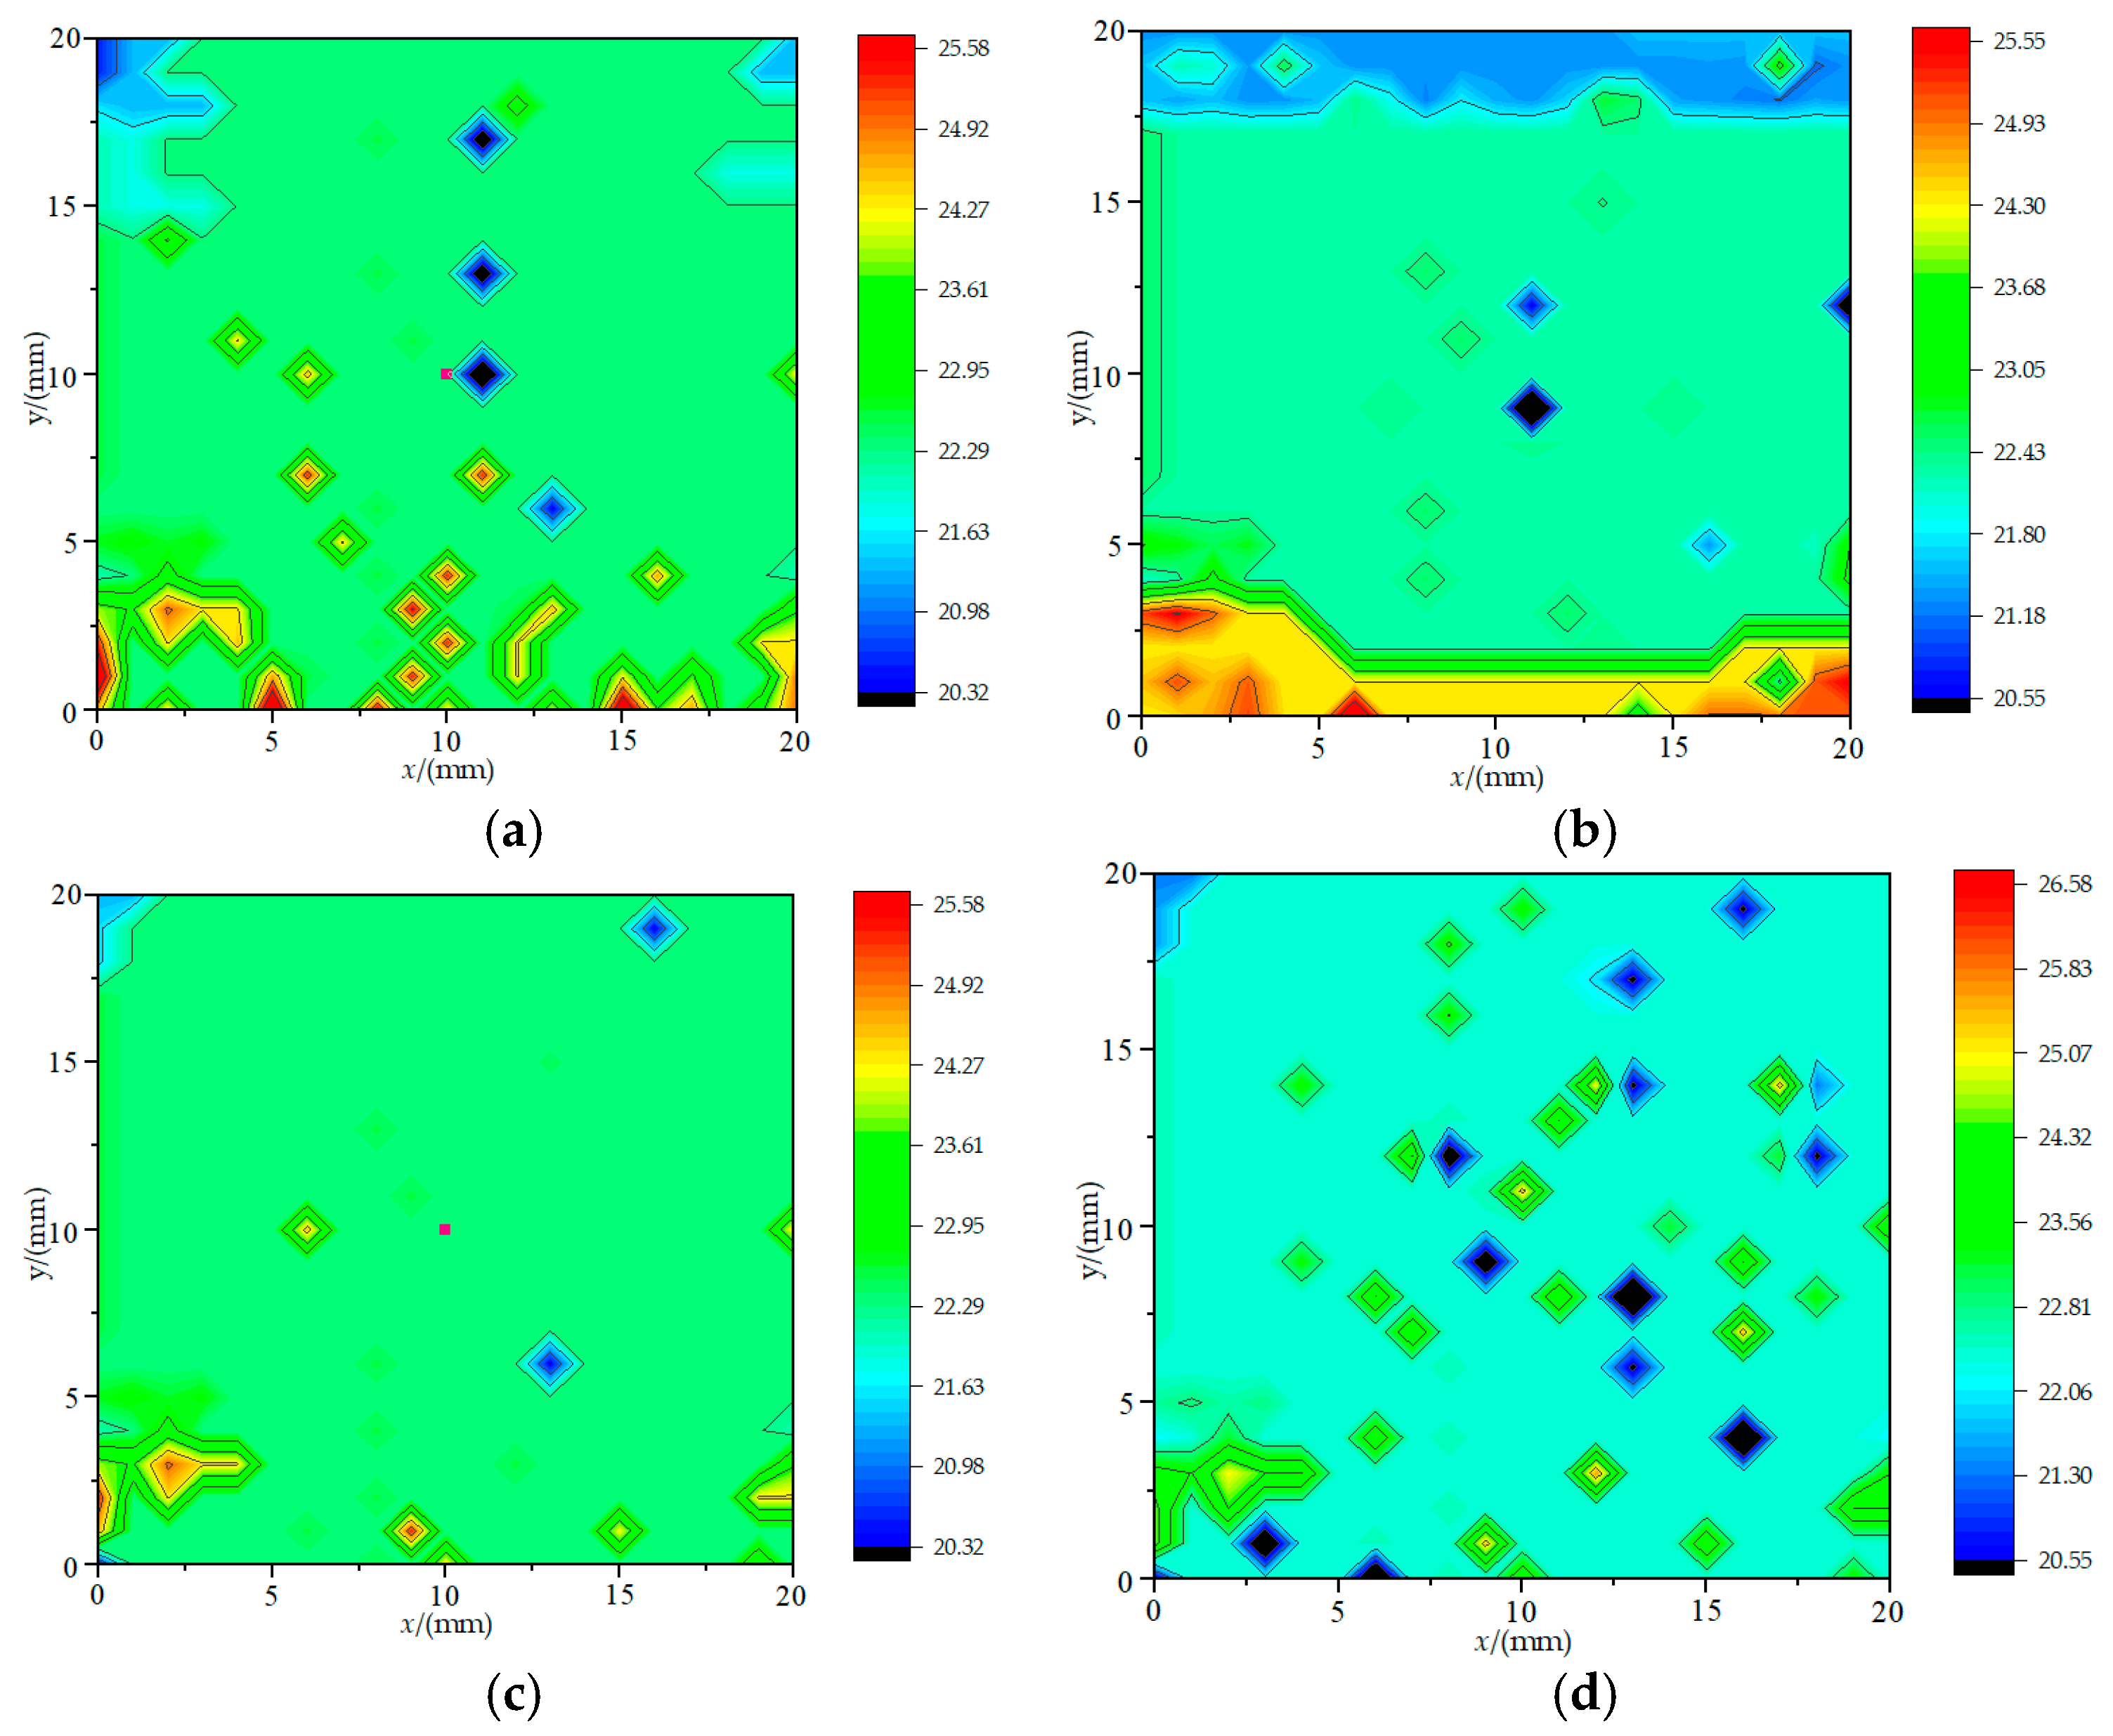
Figure 10 showed the changes of coverage uniformity with time in the test period at four levels, and the corresponding average coverage uniformity was 83.34%, 86.92%, 94.38%, and 95.12%, respectively, which indicated that the coverage uniformity first increased and then tended to be consistent with the increase of cutter shaft rotation speed. The corresponding coverage thickness ranges of the four levels were: 0.1011~0.274 m (F2K1), 0.1527~0.2643 m (F2K2), 0.2034~0.2428 m (F2K3) and 0.2145~0.2415 m (F2K4), respectively. At the same time, there were obvious “thick areas” or “thin areas” in the areas closer to the
x-axis (the test areas closer to the tail of the test bed) at the levels of F2K1 and F2K2. At the same time, this phenomenon was obviously improved at F2K3 and F2K4 levels. The possible reason for this change and regularity was that at 1700 r/min and 1900 r/min, some straws were not crushed, and their lengths were uneven, which led to clumping and falling when they left the channel. With the increase of the rotating speed of the crushing cutter shaft, the more the blade hit the straws in unit time, the greater the hitting force, and the better the tearing, shearing, and crushing effect of the straws. Under the action of the fan and the blade dispersing device, the dispersion effect blown into the air was better, which was more conducive to uniform coverage after landing. Therefore, at 2100 r/min and 2300 r/min, the grinding knife shaft had good adaptability to straw crushing, which led to less fluctuation, more stable crushing, and further improvement of coverage uniformity. However, when the rotating speed of the grinding knife shaft exceeded 2100 r/min, the advantage of blade rotating speed to straw crushing resulted from coverage uniformity.
The importance of coverage uniformity was higher than specific power consumption. From the point of view of giving priority to improving coverage uniformity and then reducing average specific power consumption, it was determined that the rotating speed of the grinding cutter shaft was 1900 r/min~2300 r/min.
3.1.3. Influence of Different Moisture Content of Straw on Indexes
As the moisture content of straw would affect the sliding friction characteristics between the straw and mechanical parts, and also affected the cutting mechanical characteristics of straw, the moisture content of straw had a correlation with the test indexes. Therefore, in this experiment, the conveying and feeding speed was 1.35 m/s, the rotating speed of cutter shaft was 1900 r/min, and nine levels of moisture content of straw were selected for experimental research. During the test, according to the requirements, after the test bench was running stably, materials were fed in for testing. Each test level was measured three times, each time with a fixed feed rate of 80 kg/min, and the arithmetic average of the three test data was taken as the final result.
Figure 11 showed the changes of specific power consumption with time in the test period at four levels, and the corresponding average specific power consumption was 1281.28, 1442.34, 1088.74, and 1103.58 J/s
2, respectively. The corresponding peak–valley differences were 175, 520, 190, and 110 J/s
2, respectively, showing the characteristics that the average specific power consumption and its fluctuation increased first and then decreased with the increase of water content, and the average specific power consumption reached the maximum value at F3M3 level, then decreased.
Figure 12 shows the change of coverage uniformity with time in the test period under four levels; the corresponding average coverage uniformity was 87.62%, 89.14%, 96.75%, and 87.65%, respectively, which indicates that the coverage uniformity first increased and then tended to be consistent with the increase of straw moisture content. The corresponding coverage thickness ranges were: 0.1969~0.2548 m (F3M1), 0.2035~0.2512 m (F3M2), 0.1955~0.2712 m (F3M3), and 0.1862~0.2735 m (F3M4), respectively. There were obvious “uneven areas” in the areas closer to the
x-axis (the test area closer to the end of the test bed) at F3M1 and F3M2 levels, and this phenomenon was different between F3M3 and F3M4.
The above-mentioned changed in specific power consumption and coverage uniformity may be due to the fact that the strength and toughness of straw first increased and then decreased with the increase of water content, and when the water content was around 25%, the strength and toughness of straw reached the maximum value. Under this condition, the crushing effect of the crushing system on straw became weak, resulting in the maximum average specific power consumption, and a large number of long straws were not evenly dispersed in the air, resulting in a large number of long straws falling in the area near the test bed, resulting in obvious “thick areas”. After that, with the increase of water content, the strength and toughness of straw gradually weakened, resulting in a rapid decrease in average specific power consumption. In the range of 30~35%, because the mechanical properties of straw tended to be consistent, the average specific power consumption was similar to its fluctuation, and another reason for the obvious difference in coverage uniformity was that, with the increase of water content, the viscosity between straws increased, and it was not easily scattered and blown away in the air, resulting in poor flying effect and some straws sticking and falling in the air.
3.2. Orthogonal Test and Parameter Optimization
3.2.1. Box–Behnken Experimental Design
On the basis of a single factor experiment, the same rice straw (less than 400 mm in length) as the previous single factor experiment was selected. The conveying and feeding speed
X1, cutter shaft speed
X2, and straw moisture
X3 were selected as experimental factors. The average laying quality of straw was 2.2 kg/m
2. In the experiment, specific power consumption
Y1 and coverage uniformity
Y2 were used as indicators to carry out the orthogonal experiment of three factors and three levels [
25]. See
Table 2 for test factors and codes.
3.2.2. Data Analysis and Results
The experimental data were analyzed by quadratic polynomial regression with Design-Expert12.0 software, and the correlation and interaction effects of various factors were analyzed by response surface analysis. According to the Box–Behnken test principle, a three-factor and three-level analysis test was designed. The test scheme and results were shown in
Table 3.
3.2.3. Subsubsection
The response surface regression model of
Y1 and
Y2 to
X1,
X2 and
X3 was established, as shown in Formulas (1) to (2), and the variance analysis of the regression equation was carried out, as shown in
Table 4.
where,
Y1 is specific power consumption, J/s
2;
Y2 is coverage uniformity, %.
It can be seen from
Table 4 that the
p of specific power consumption
Y1 and coverage uniformity
Y2 are less than 0.05, which indicates that the two models have extremely significant influence. The determination coefficient
R2 values are 0.9606 and 0.9764, respectively, which indicates that more than 96% of the response values can be explained by these two models, and the misfitting
p values are all greater than 0.05, so the misfitting was not significant. Therefore, this model can predict the working parameters of the air separation system. According to the changes of the response maps of the two models, it can be concluded that the primary and secondary order of influence of various factors on power consumption was
X2,
X1, and
X3. The primary and secondary order of influence of various factors on the coverage uniformity was also
X2,
X1, and
X3.
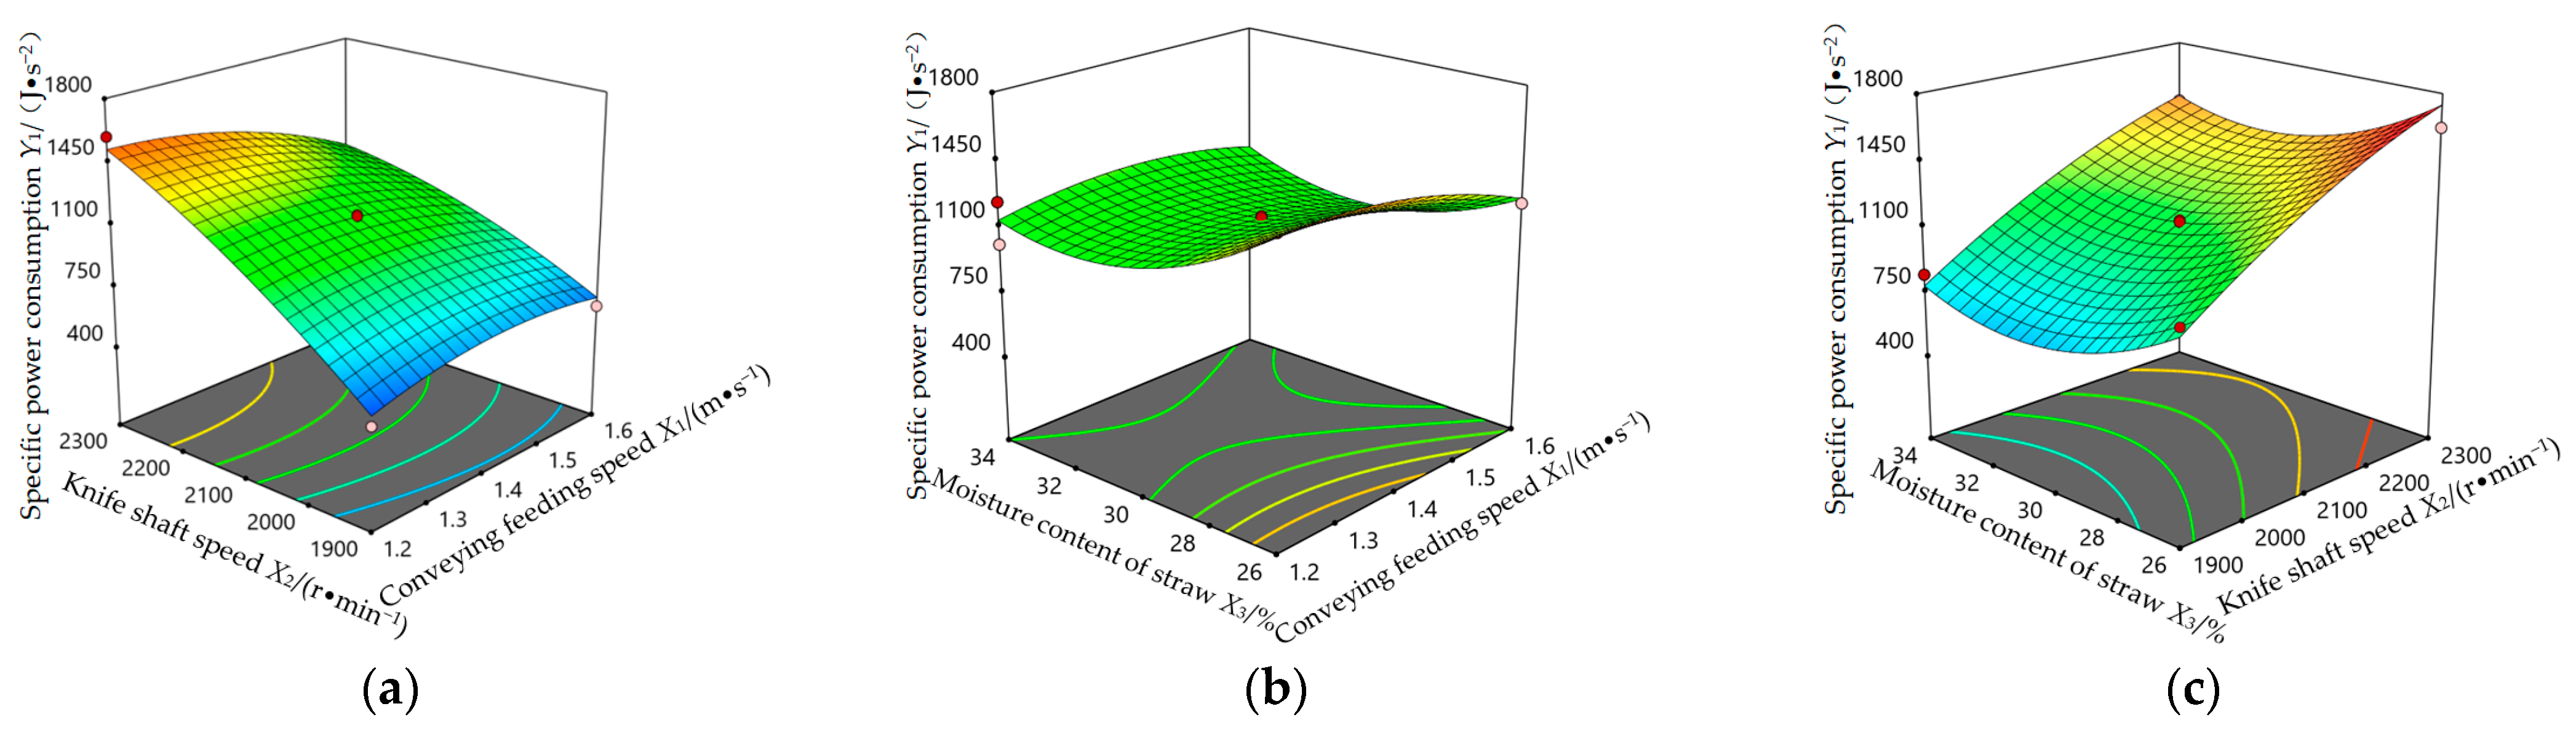
Figure 13a shows that the specific power consumption increases obviously with the increase of conveying and feeding speed
X1, and the specific power consumption increases obviously with the increase of cutter shaft speed
X2, and the influence of cutter shaft speed
X2 on the specific power consumption was greater than that with conveying and feeding speed
X1.
Figure 13b shows that the specific power consumption first decreases and then tends to be flat with the increase of water content
X3;
Figure 13c shows that the specific power consumption obviously increases with the increase of the cutter shaft speed
X2.
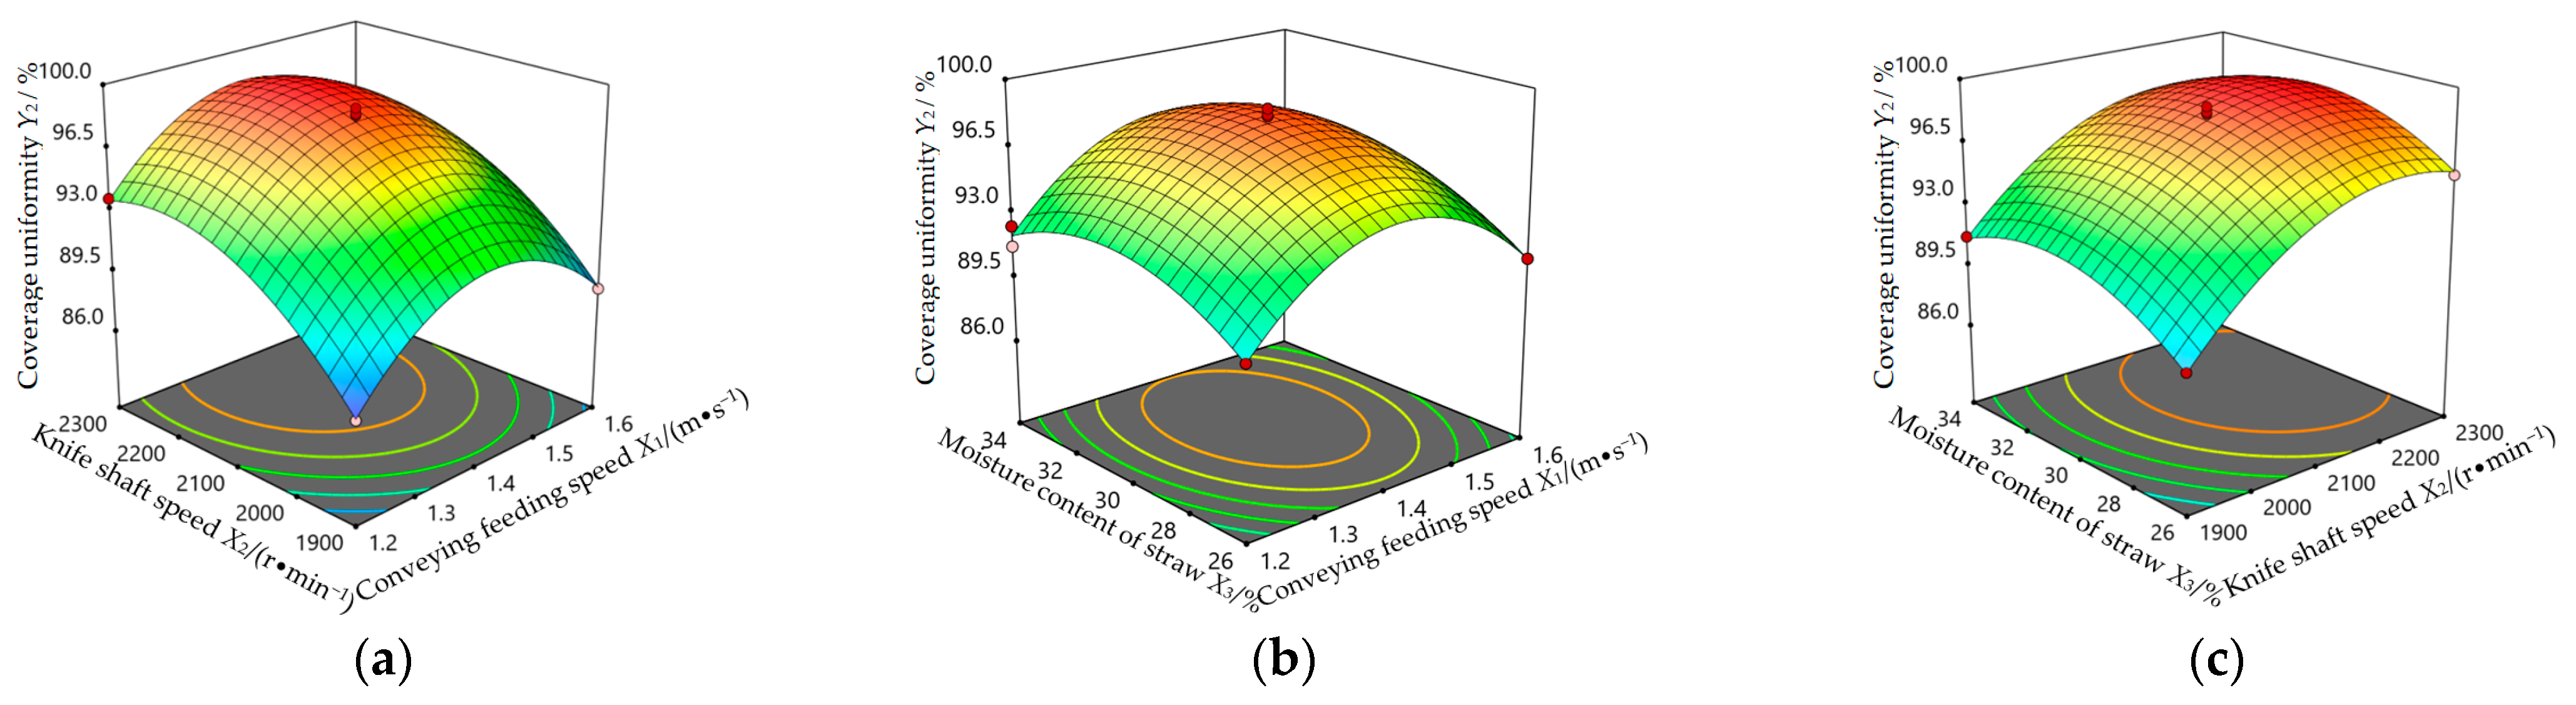
Figure 14a show that the coverage uniformity obviously decreases with the increase of conveying and feeding speed
X1, while the coverage uniformity first increases and then decreases with the increase of cutter shaft rotation speed
X2.
Figure 14b showed that the coverage uniformity obviously decreases with the increase of conveying and feeding speed
X1, and the coverage uniformity first increases and then decreases with the increase of water content
X3.
Figure 14c showed that the coverage uniformity first increases and then decreases with the increase of cutter shaft speed
X2, while the coverage uniformity first increases and then tends to be consistent with the increase of water content X
3.
3.2.4. Parameter Optimization
According to the analysis of the above test results, in order to further improve the operation performance of the air separation system, under the constraints of various test factors, the minimum specific power consumption
Y1 and the maximum coverage evenness
Y2 were taken as the optimization indexes, and the full-factor quadratic regression equation of the performance indexes was established to optimize the target and determine the optimal working parameters.
Using the Design-Expert12.0 self-contained optimization solution module of constraint conditions, the optimal parameter combination of the minimum crushing length pass rate Y1 and the specific power consumption Y2 which meet the constraint conditions can be obtained. The optimal parameter combination was: Conveying and feeding speed of 0.9 m/s, cutter shaft speed of 2059.9 r/min, straw moisture content of 30.7%, corresponding specific power consumption and coverage uniformity of 1163 J/s2 and 99.1%, respectively.
3.3. Field Test Verification
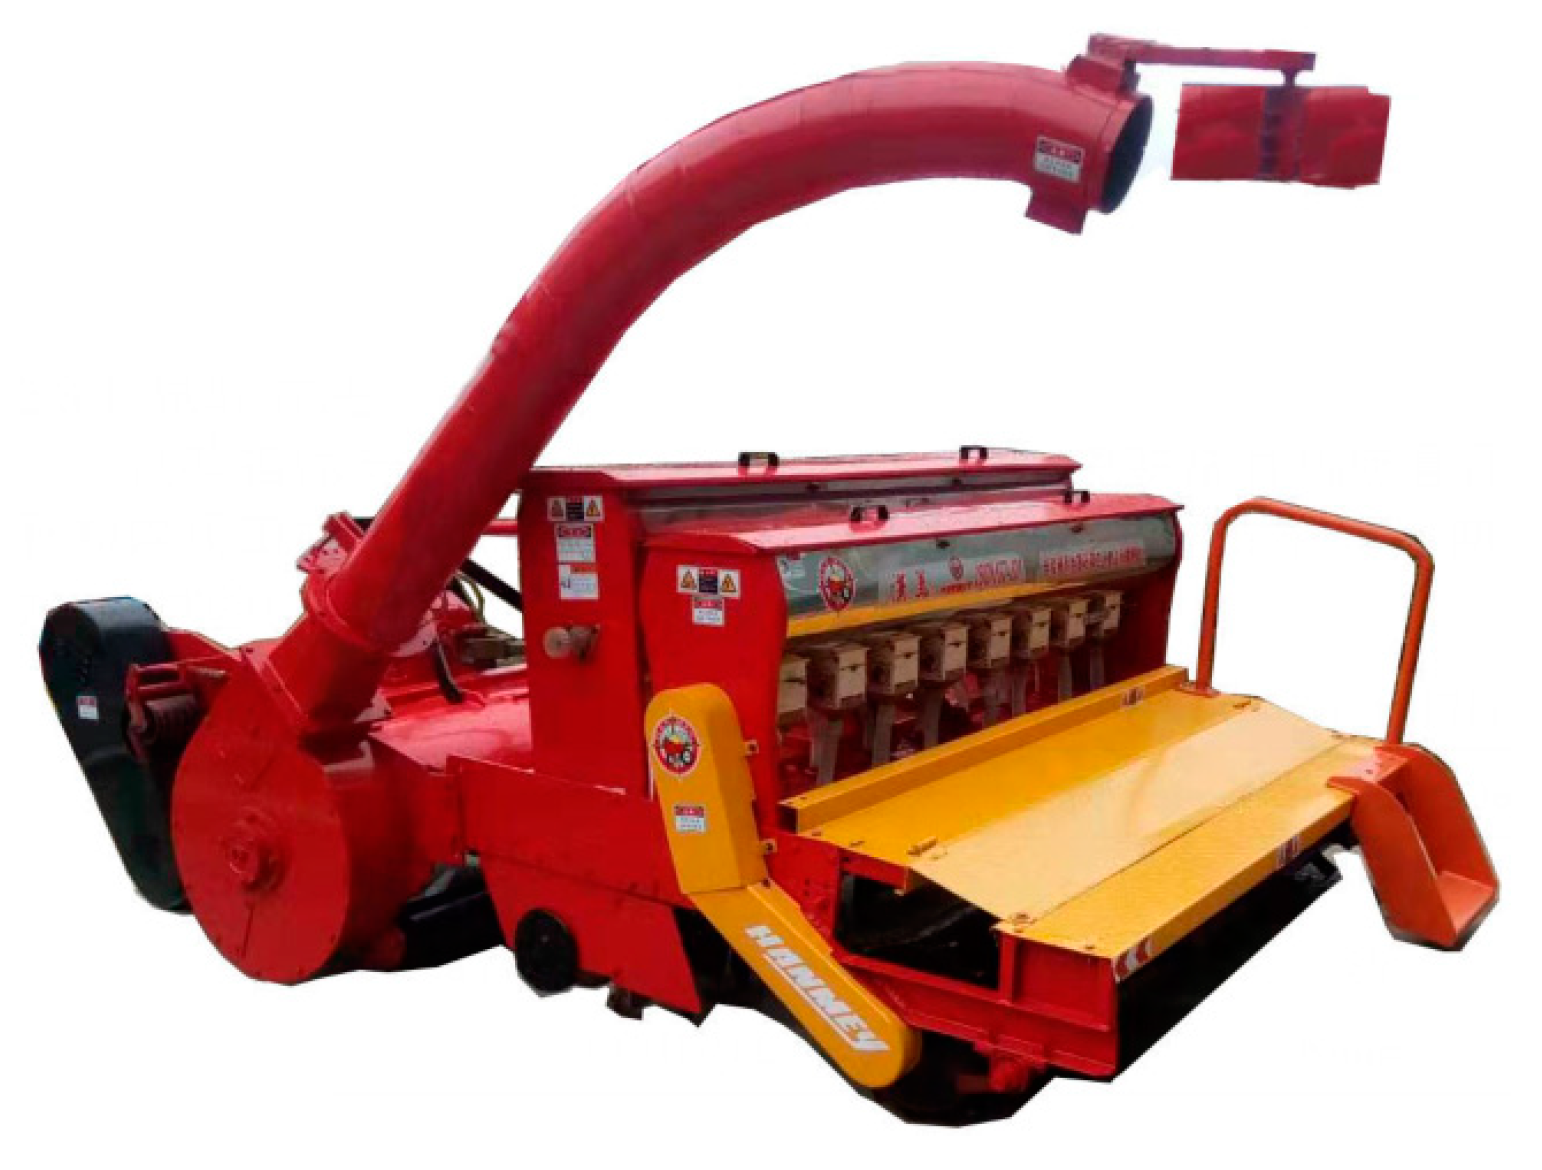
Because the test purpose of the rice straw crushing and scattering system was to apply to no-tillage sowing in the field, the seeding system was installed at the back of the rice straw crushing and scattering system to combine into a no-tillage seeder for the index verification test, which verifies the feasibility of the key parameters of the designed straw crushing and scattering system and the operation quality of the whole machine, focusing on the qualified rate of straw crushing length, uniformity of straw coverage, and specific power consumption. The experiment was carried out in Nanjing Baima Experimental Base in November 2021. The rice varieties in the experimental area were the same as those in the previous experiment. After all-feeding combined harvest, the measured average stubble height was 0.494 m, the average moisture content of straw was 32.1%, and the supporting power of machines and tools was the Dongfanghong LG-1004 wheeled tractor; the model configuration is shown in the
Figure 15.
Test Method
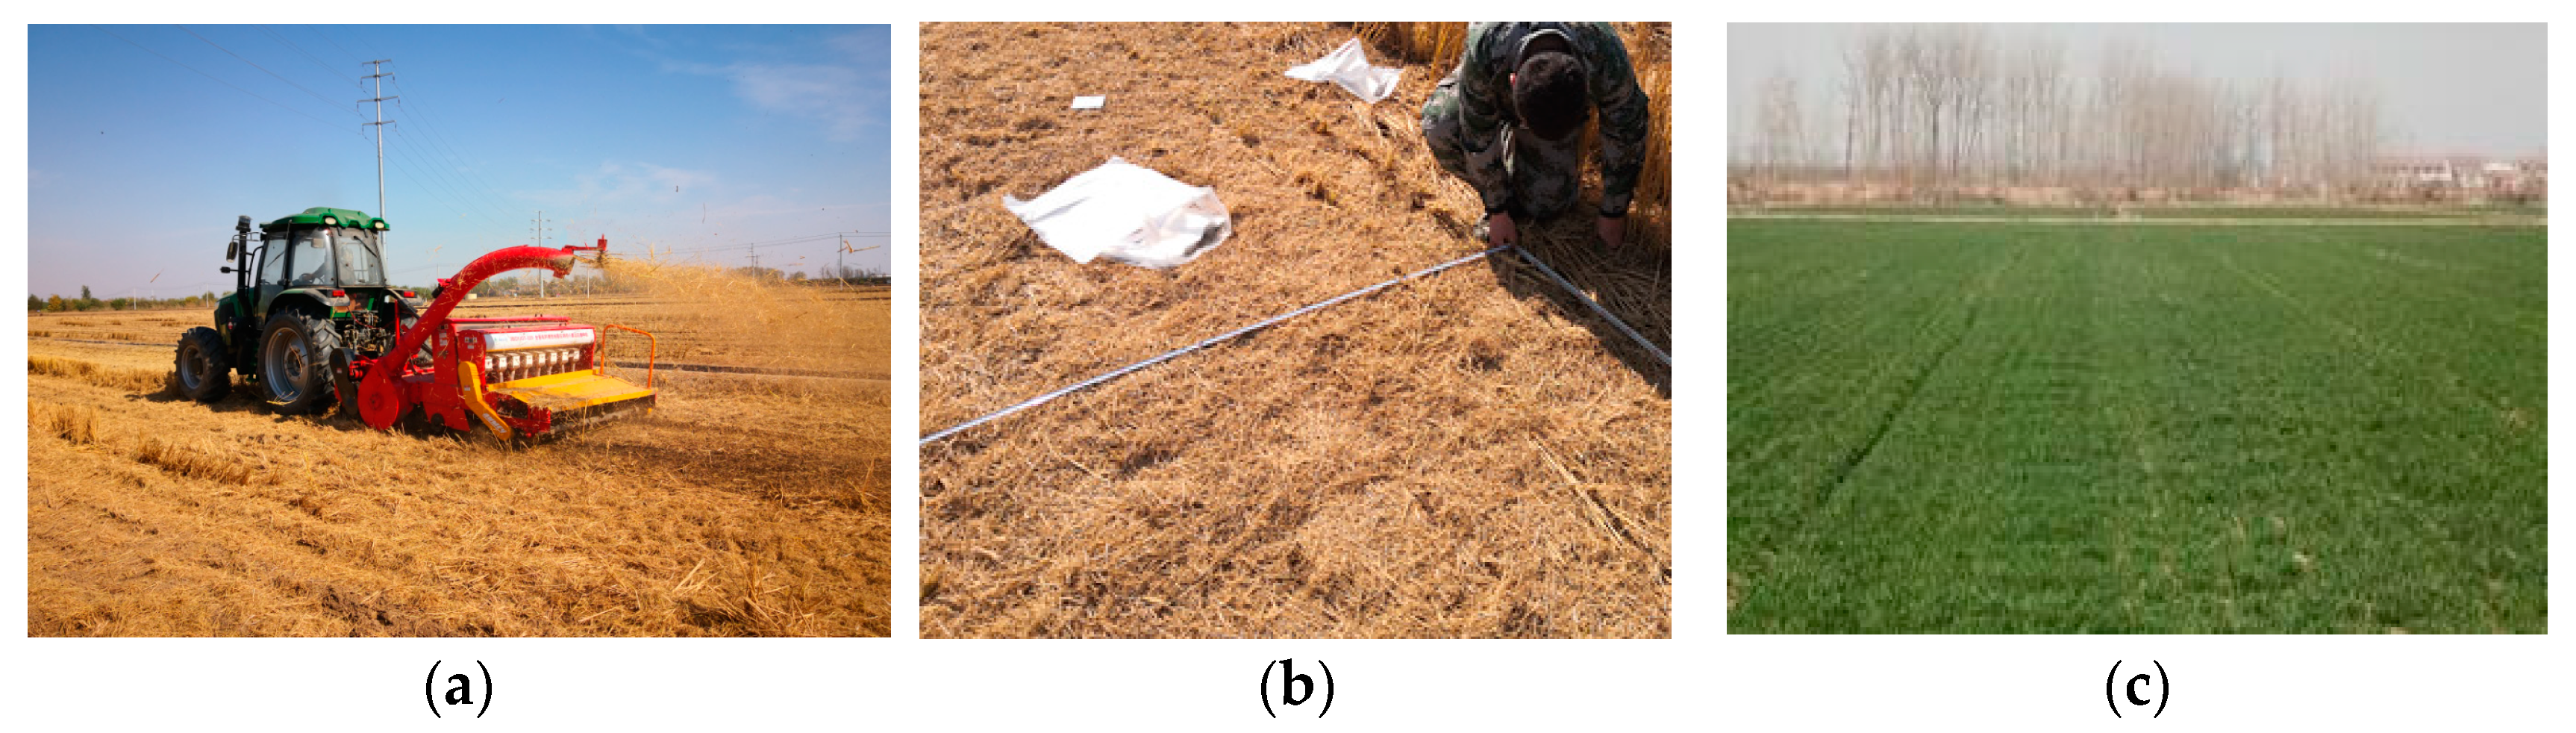
Test indexes and methods were designed and investigated according to NY/T1768-2009 “Technical specification for quality evaluation of no-tillage seeder” and JB/T6678-2001 “Straw crusher-returning machine”, which passed the field test and followed the later growth trend [
26]; the field experiment is shown in
Figure 16.
It can be seen from
Table 5 that this machine can meet the operational quality requirements of crushing and throwing rice straw back to the field and sowing wheat. There was no blockage or shutdown in the whole process of the test, which showed that the structure and key parameters of the crushing and scattering system are designed reasonably, which can ensure that the whole amount of straw was returned to the field while preserving the good passability of machines and tools. The specific power consumption of the test and the uniformity of coverage were 1260 J/s
2 and 94.7%, respectively. The results of the tested indexes are better than the standard requirements, and the relative error with the previous optimal value was less than 5%, which verifies the scientificity, feasibility, and accuracy of the quadratic polynomial regression model of the optimized test.
4. Discussion
In this paper, the straw treatment in the conservation tillage of the whole stubble field was studied. At present, Chinese scholars are focusing on the field test of the prototype of the no-tillage planter. Until now, no one had conducted a complete and scientific test of the straw crushing and scattering system test stand. Therefore, it was innovative and scientific to simulate the mechanized crushing and scattering treatment of harvested rice straw through the crushing and scattering system test stand. At present, no-tillage sowing machines and tools in China are developing rapidly. In recent years, aiming at the problem of poor straw coverage uniformity, Wang et al. [
27] designed a rice straw crushing device that strengthens the cutting effect of straw vibration damage by stirring and sliding the cutting device, and improves the problem that rice straw is difficult to crush. Qin et al. [
28] conducted a numerical analysis and experiment on the crushing and scattering device of the straw returning machine. The experiment in this paper was similar to the two studies in that the structure of the movable knife set and the crushing cavity are similar, but the difference was that the movement track of the crushed straw caused by the different structure of the scattering system was different from the previous two studies, which was embodied in that: Firstly, the straw was sent to the throwing channel by the fan system, and finally, the crushed straw was evenly scattered by the blade scattering device at the end of the throwing channel. Throwing to the target area was a kind of “raindrop” throwing from the ground to the air, and then from the air to the ground. Straw clumps are more easily scattered in the air, and the effect was better. From the test results, the qualified rate of crushed length was 11% higher than that of Wang et al., and 1.7% higher than that of Qin et al. and the coverage uniformity of this test bed was 4.5 higher than that of Qin et al.
Through the analysis of the current research situation of the seeder at home and abroad, there were still some problems in this field in China. Most of the research focused on structural design and performance improvement. By integrating the advantages of different structures, in a specific field environment, through innovative optimization design, better performance has been successfully achieved. In recent years, the field of no-tillage sowing in China mostly relied on numerical analysis, theoretical calculation, and field prototype test. However, this study innovatively put forward a test bed of a rice straw crushing and scattering system, which was equipped with a straw crushing system, a screw conveying system, and a throwing system. The structure of the straw crushing and scattering system was different from that of traditional straw crushing and scattering systems such as pasture and grain. The test system uniformly scattered the device and optimized the structural parameters and motion parameters. The standard crushing, cutting, and even throwing of rice straw on the surface were realized, so that the straw could be evenly covered on the surface after sowing and covering the soil, which not only made good use of fertilizer efficiency, but also achieved the effect of “quasi-plastic film” covering, effectively overcoming the problem of nitrogen consumption when returning the whole amount to the field as stubble. The research on straw movement and no-tillage quality through the test bed had not been found yet, so there was some novelty in the research method.
This research made some experimental innovations, but there were some limitations, as follows:
(1) In the actual field no-tillage operation, the straw was fixed and the machine moved forward, that is, the machine smashed and scattered the straw at the same time, and the non-working area in front of the machine was equal to the working area behind the machine. However, because this experiment was carried out in a fixed test bed, there was a certain difference between the scattering thickness and the field scattering thickness. Therefore, in
Section 2.3, each treatment set in the test method of scattering unevenness was 10 s, which was as close as possible to the actual situation and reduced the overlapping amount of crushed straw.
(2) The uniformity of coverage cannot be well controlled. In the next step, image recognition and intelligent control methods would be used to study the motion law, scattering trajectory, and spatial distribution characteristics of straw under multiple working conditions, so as to further realize the controllability, stability, and accuracy of straw crushing and scattering treatment.
(3) Limited by the research scheme and test conditions, the test object of this paper was only rice straw. In the follow-up experiment, the optimal operation parameters of different crop straws would be studied. The structure would be further optimized, reasonable combination, resistance reduction, and consumption would be reduced, the performance would be improved, the demand of no-tillage sowing wheat, corn, peanut, soybean, and other crops in different dry lands would be met, and the versatility under different crops and different operating conditions would be increased.
5. Conclusions
(1) Through the single factor experiment, the influence rules and causes of various factors on the comparative power consumption and coverage uniformity were analyzed. Combined with the previous experiment and comprehensive judgment, it was determined that the conveying and feeding speed range was 0.9~1.5 m/s, the rotating speed range of grass cutter shaft was 1900~2300 r/min, and the moisture content of straw was 26~34%.
(2) Using the optimization function in the Design-Expert12.0, the optimal parameter combination was determined as follows: Conveying and feeding speed of 1.39 m/s, cutter shaft speed of 2059.9 r/min, straw moisture content of 30.7%, corresponding specific power consumption and coverage uniformity of 1163 J/s2 and 99.1%, respectively. The order of influence of each factor on the available comparative power consumption was cutter shaft speed, conveying and feeding speed, and straw moisture content. The specific power consumption decreased obviously with the increase of conveying and feeding speed, and increased obviously with the increase of cutter shaft speed, and the influence of cutter shaft speed on power consumption was greater than that with conveying and feeding speed. With the increase of water content, the specific power consumption first decreased and then tended to be flat. The primary and secondary order of influence of various factors on the coverage uniformity was conveying feeding speed, cutter shaft rotation speed, and straw moisture content. The coverage uniformity decreased obviously with the increase of conveying feeding speed; it first increased and then decreased with the increase of cutter shaft rotation speed, then decreased obviously with the increase of conveying feeding speed, and then increased first, and then tended to be consistent with the increase of moisture content.
(3) In order to verify the scientificity and feasibility of the crushing and scattering system test bed, after the rice straw crushing and throwing system, the seeding system was installed at the back of the rice straw crushing and throwing system to combine into a straw returning planter for verification test. There was no blockage or shutdown during the whole test process, which showed that the structure and key parameters of the crushing and throwing system were designed reasonably. The uniformity of straw coverage and specific power consumption of the verification test were 94.7% and 1260 J/s2, respectively, which were better than the standard requirements, and the relative error with the previous optimal value was less than 5%, which verified the scientificity and the feasibility of the quadratic polynomial regression model of the optimization test.
Author Contributions
Conceptualization, B.W. and F.G.; methodology, Z.H. and H.Y.; software, B.W. and H.Y.; validation, B.W. and J.M.; formal analysis, F.G.; investigation, F.W.; resources, F.G.; data curation, B.W.; writing—original draft preparation, B.W.; writing—review and editing, B.W.; visualization, F.G. and J.M.; supervision, F.G.; project administration, B.W.; funding acquisition, B.W. All authors have read and agreed to the published version of the manuscript.
Funding
This research was funded by the following fund projects: 1. Jiangsu Agricultural Science And Technology Innovation fund, grant number CX(20)3066; 2. National Natural Science Foundation of China, grant number 31901418; 3. National Peanut Industry Technology System, grant number CARS-13.
Institutional Review Board Statement
Not applicable.
Informed Consent Statement
Not applicable.
Data Availability Statement
The datasets used and/or analyzed during the current study are available from the corresponding author upon reasonable request.
Acknowledgments
The authors would like to thank the teacher and supervisor for their advice and help during the experiments. We also appreciate the editor and anonymous reviewers for their valuable suggestions for improving this paper.
Conflicts of Interest
The authors declare no conflict of interest.
References
- He, J.; Li, H.W.; Chen, H.T.; Lu, C.Y.; Wang, Q.J. Research Progress of Conservation Tillage Technology and Machine. Trans. Chin. Soc. Agric. Mach. 2018, 49, 1–19, (In Chinese with English Abstract). [Google Scholar]
- Xiao, L.G.; Zhao, R.Q.; Kuhn, N.J. Straw mulching is more important than no tillage in yield improvement on the Chinese Loess Plateau. Soil Tillage Res. 2019, 194, 104314. [Google Scholar] [CrossRef]
- Shi, Y.Y.; Sun, X.; Wang, X.C.; Hu, Z.C.; David, N.; Hu, Z.C. Numerical simulation and field tests of minimum-tillage planter with straw smashing and strip laying based on EDEM software. Comput. Electron. Agric. 2019, 166, 105021. [Google Scholar] [CrossRef]
- Khokan, K.S.; Xu, C.L.; Wang, X.Y.; Li, M.J.; Li, L.H.; Lu, G.M. Band tillage with fertilizer application for unpuddled transplanting nice in northeast of China. Int. J. Agric. Biol. Eng. 2016, 9, 73–83. [Google Scholar]
- Zheng, Y.; Han, X.R.; Li, Y.Y.; Yang, J.F.; Li, N.; An, N. Effects of biochar and straw application on the physicochemical and biological properties of paddy soils in northeast China. Sci. Rep. 2019, 9, 16531. [Google Scholar] [CrossRef] [Green Version]
- Gu, F.; Hu, Z.; Chen, Y.; Wu, F. Development and experiment of peanut no-till planter under full wheat straw mulching based on “clean area planting”. Trans. Chin. Soc. Agric. Eng. 2016, 32, 15–23, (In Chinese with English Abstract). [Google Scholar]
- Sun, N.N.; Wang, X.Y.; Li, H.W.; He, J.; Wang, Q.J.; Wang, J.; Liu, Z.D.; Wang, Y.B. Design and experiment of differential sawing rice straw chopper. Trans. Chin. Soc. Agric. Eng. 2019, 35, 267–276, (In Chinese with English Abstract). [Google Scholar]
- Wang, Q.J.; Jiao, F.; Liu, F.; Chang, B.C.; Jiang, H.; Jiang, Y.; Mi, G.; Zhou, X. Effect of straw pulverization and concentrated deep-buried into field on growth and yield of maize. Trans. Chin. Soc. Agric. Eng. 2018, 34, 153–159, (In Chinese with English Abstract). [Google Scholar]
- Ma, J.T.; Wu, F.; Xie, H.X.; Gu, F.W.; Yang, H.C.; Hu, Z.C. Uniformity Detection for Straws Based on Overlapping Region Analysis. Agriculture 2022, 12, 80. [Google Scholar] [CrossRef]
- Zhai, Z.P. Study on Throwing/Blowing Mechanism and Optimizing Parameters of an Impeller Blower. Doctoral Dissertation, Inner Mongolia Agricultural University, Huhhot, China, 2008. [Google Scholar]
- Luo, W.W.; Hu, Z.C.; Wu, F.; Gu, F.; Xu, H.; Chen, Y. Design and optimization for smashed straw guide device of wheat clean area planter under full straw field. Trans. Chin. Soc. Agric. Eng. 2019, 35, 1–10, (In Chinese with English Abstract). [Google Scholar]
- Luo, W.W.; Gu, F.W.; Wu, F.; Xu, H.B.; Chen, Y.Q.; Hu, Z.C. Design and experiment of wheat planter with straw crushing and inter-furrow collecting-mulching under full amount of straw and root stubble cropland. Trans. Chin. Soc. Agric. Mach. 2019, 50, 42–52, (In Chinese with English Abstract). [Google Scholar]
- Yan, W.; Wu, N.; Gu, F.W.; Lin, D.; Zhou, X.; Hu, Z. Parameter optimization and experiment for the power consumption of impeller-blower. J. China Agric. Univ. 2017, 22, 99–106, (In Chinese with English Abstract). [Google Scholar]
- Zhang, Z.Q. Research on Corn Straw Chopping and Spreading Machine Design and Dynamic Characteristic of Straw. Doctoral Dissertation, China Agricultural University, Beijing, China, 2018. [Google Scholar]
- Zhang, Z.Q.; He, J.; Li, H.W.; Wang, Q.J.; Ju, J.W.; Yan, X.L. Design and Experiment on Straw Chopper Cum Spreader with Adjustable Spreading Device. Trans. Chin. Soc. Agric. Mach. 2017, 48, 76–87, (In Chinese with English Abstract). [Google Scholar]
- Zhai, Z.P.; Yang, Z.Y.; Gao, B.; Li, J. Simulation of solid-gas two-phase flow in an impeller blower based on Mixture model. Trans. Chin. Soc. Agric. Eng. 2013, 29, 50–58, (In Chinese with English Abstract). [Google Scholar]
- Wang, Q.J.; Liu, F.; Jiao, F.; Chang, B.C.; Jiang, H.; Gong, X.J. Effects of strip-collected chopping and mechanical deep-buried return of straw on physical properties of soil. Trans. Chin. Soc. Agric. Mach. 2019, 35, 43–49, (In Chinese with English Abstract). [Google Scholar]
- Cao, Y.F.; Zhang, H.; Liu, K.; Lv, J.L. Decomposition characteristics of crop residues among different agricultural treatments. Trans. Chin. Soc. Agric. Eng. 2016, 47, 212–219, (In Chinese with English Abstract). [Google Scholar]
- Wang, W.W.; Zhu, C.X.; Chen, L.Q.; Li, Z.; Huang, X.; Li, J. Design and experiment of active straw-removing anti-blocking device for maize no-tillage planter. Trans. Chin. Soc. Agric. Eng. 2017, 33, 10–17. [Google Scholar]
- Wang, A.C.; Zhang, W.; Wei, X.H. A review on weed detection using ground-based machine vision and image processing techniques. Comput. Electron. Agric. 2019, 158, 226–240. [Google Scholar] [CrossRef]
- Xu, H.B.; Hu, Z.C.; Wu, F.; Gu, F.W.; Chen, Y.Q. Design of straw distributed retention device of wheat planter under full rice straw retention. Trans. Chin. Soc. Agric. Eng. 2019, 35, 19–28, (In Chinese with English Abstract). [Google Scholar]
- Cheng, Y. Driving Torque Control Strategy Design and HIL Test of Pure Electric Vehicle. Master’s Dissertation, Xihua University, Chengdu, China, 2019. [Google Scholar]
- Liang, F. Optimization Design and Experiment Study on Root-Cutter with Fertilization and Reseeding Compound Remediation Machine for Grassland. Doctoral Dissertation, China Agricultural University, Beijing, China, 2015. [Google Scholar]
- He, X.W. Design and Experimental Study of Power Consumption Measurement System for High Stubble Returning and Tillage Machine. Master’s Dissertation, Huazhong Agricultural University, Wuhan, China, 2014. [Google Scholar]
- Standardization Administration of China. Conservation Tillage Equipment-Smashed Straw Machine: GB/T 24675.6-2009; Standards Press of China: Beijing, China, 2009. [Google Scholar]
- Ministry of Agriculture and Rural Affairs of the People’s Republic of China. Technical Specifications of Quality Evaluation for No-Tillage Drilling Machinery: NY/T 1768-2009; Standards Press of China: Beijing, China, 2009.
- Wang, J.; Wang, X.Y.; Li, H.W.; He, J.; Lu, C.Y.; Liu, D. Design and Experiment of Rice Straw Chopping Device for Agitation Sliding Cutting and Tearing. Trans. Chin. Soc. Agric. Mach. 2021, 52, 28–40, (In Chinese with English Abstract). [Google Scholar]
- Qin, K.; Cao, C.M.; Miao, Y.S.; Wang, C.Q.; Fang, L.F.; Ge, J. Design and optimization of crushing and throwing device for straw returning to field and fertilizing hill-seeding machine. Trans. Chin. Soc. Agric. Eng. 2020, 36, 1–10, (In Chinese with English Abstract). [Google Scholar]
Figure 1.
Working process of straw crushing, scattering, and sowing system.
Figure 1.
Working process of straw crushing, scattering, and sowing system.
Figure 2.
Image of poor uniformity of straw mulching.
Figure 2.
Image of poor uniformity of straw mulching.
Figure 3.
Test bed of rice straw crushing and scattering system. 1. Conveyor belt. 2. Frequency conversion motor. 3. Grinding knife shaft. 4. Screw conveyor. 5. Throwing channel. 6. Blade scattering device. 7. Frequency conversion auxiliary motor. 8. Throwing blower.
Figure 3.
Test bed of rice straw crushing and scattering system. 1. Conveyor belt. 2. Frequency conversion motor. 3. Grinding knife shaft. 4. Screw conveyor. 5. Throwing channel. 6. Blade scattering device. 7. Frequency conversion auxiliary motor. 8. Throwing blower.
Figure 4.
Schematic diagram of specific power consumption test system.
Figure 4.
Schematic diagram of specific power consumption test system.
Figure 5.
Test site of rice straw crushing and scattering system.
Figure 5.
Test site of rice straw crushing and scattering system.
Figure 6.
Installation of torque sensor.
Figure 6.
Installation of torque sensor.
Figure 7.
(a) Changes of specific power consumption at F1T1 level; (b) Changes of specific power consumption at F1T2 level; (c) Changes of specific power consumption at F1T3 level; (d) Changes of specific power consumption at F1T4 level.
Figure 7.
(a) Changes of specific power consumption at F1T1 level; (b) Changes of specific power consumption at F1T2 level; (c) Changes of specific power consumption at F1T3 level; (d) Changes of specific power consumption at F1T4 level.
Figure 8.
(a) Uniformity of coverage at F1T1 level; (b) Uniformity of coverage at F1T2 level; (c) Uniformity of coverage at F1T3 level; (d) Uniformity of coverage at F1T4 level.
Figure 8.
(a) Uniformity of coverage at F1T1 level; (b) Uniformity of coverage at F1T2 level; (c) Uniformity of coverage at F1T3 level; (d) Uniformity of coverage at F1T4 level.
Figure 9.
(a) Changes of specific power consumption at F2K1 level; (b) Changes of specific power consumption at F2K2 level; (c) Changes of specific power consumption at F2K3 level; (d) Changes of specific power consumption at F2K4 level.
Figure 9.
(a) Changes of specific power consumption at F2K1 level; (b) Changes of specific power consumption at F2K2 level; (c) Changes of specific power consumption at F2K3 level; (d) Changes of specific power consumption at F2K4 level.
Figure 10.
(a) Uniformity of coverage at F2K1 level; (b) Uniformity of coverage at F2K2 level; (c) Uniformity of coverage at F2K3 level; (d) Uniformity of coverage at F2K4 level.
Figure 10.
(a) Uniformity of coverage at F2K1 level; (b) Uniformity of coverage at F2K2 level; (c) Uniformity of coverage at F2K3 level; (d) Uniformity of coverage at F2K4 level.
Figure 11.
(a) Changes of specific power consumption at F3M1 level; (b) Changes of specific power consumption at F3M2 level; (c) Changes of specific power consumption at F3M3 level; (d) Changes of specific power consumption at F3M4 level.
Figure 11.
(a) Changes of specific power consumption at F3M1 level; (b) Changes of specific power consumption at F3M2 level; (c) Changes of specific power consumption at F3M3 level; (d) Changes of specific power consumption at F3M4 level.
Figure 12.
(a) Uniformity of coverage at F3M1 level; (b) Uniformity of coverage at F3M2 level; (c) Uniformity of coverage at F3M3 level; (d) Uniformity of coverage at F3M4 level.
Figure 12.
(a) Uniformity of coverage at F3M1 level; (b) Uniformity of coverage at F3M2 level; (c) Uniformity of coverage at F3M3 level; (d) Uniformity of coverage at F3M4 level.
Figure 13.
Response surface of interaction factors to specific power consumption. (a) Specific power consumption response surface under factors X1 and X2; (b) Specific power consumption response surface under factors X1 and X3; (c) Specific power consumption response surface under factors X2 and X3.
Figure 14.
Response surface of interactive factors to coverage uniformity. (a) Coverage uniformity response surface under factors X1 and X2; (b) Coverage uniformity response surface under factors X1 and X3; (c) Coverage uniformity response surface under factors X2 and X3.
Figure 14.
Response surface of interactive factors to coverage uniformity. (a) Coverage uniformity response surface under factors X1 and X2; (b) Coverage uniformity response surface under factors X1 and X3; (c) Coverage uniformity response surface under factors X2 and X3.
Figure 15.
Rice straw crushing and scattering sowing system.
Figure 15.
Rice straw crushing and scattering sowing system.
Figure 16.
Field experiment. (a) Field test; (b) Dividing survey area; (c) Crop growth tracking.
Figure 16.
Field experiment. (a) Field test; (b) Dividing survey area; (c) Crop growth tracking.
Table 1.
Different level settings and corresponding environmental conditions.
Table 1.
Different level settings and corresponding environmental conditions.
| Factor | Level | Length of Straw/m | Laying Height/m | Wind Speed/(m/s) | Air Relative Humidity/(%) | Temperature/(°C) |
|---|
| F1 | T1 | 0.401 | 0.206 | 1.91 | 52 | 19.5 |
| T2 | 0.399 | 0.207 | 1.92 | 55 | 20.3 |
| T3 | 0.404 | 0.211 | 1.98 | 54 | 21.2 |
| T4 | 0.398 | 0.209 | 2.01 | 51 | 20.5 |
| F2 | K1 | 0.406 | 0.210 | 1.91 | 50 | 18.3 |
| K2 | 0.392 | 0.201 | 1.92 | 54 | 19.1 |
| K3 | 0.407 | 0.213 | 1.98 | 59 | 18.5 |
| K4 | 0.392 | 0.205 | 2.01 | 53 | 20.5 |
| F3 | M1 | 0.394 | 0.210 | 1.91 | 53 | 21.3 |
| M2 | 0.399 | 0.208 | 1.92 | 58 | 21.4 |
| M3 | 0.406 | 0.206 | 1.98 | 50 | 21.9 |
| M4 | 0.399 | 0.209 | 2.01 | 52 | 21.5 |
Table 2.
Factors and levels of experiment.
Table 2.
Factors and levels of experiment.
| Codes | Factor |
|---|
Conveying Feeding Speed
X1/(m/s) | Knife Shaft Speed
X2/(r/min) | Moisture Content of Straw
X3/% |
|---|
| −1 | 0.9 | 1900 | 26 |
| 0 | 1.3 | 2100 | 30 |
| 1 | 1.5 | 2300 | 34 |
Table 3.
Test design scheme and response value results.
Table 3.
Test design scheme and response value results.
| NO. | Codes | Response Values |
|---|
Conveying Feeding Speed
X1 | Knife Shaft Speed
X2 | Moisture Content of Straw
X3 | Specific Power Consumption Y1/(J·s−2) | Uniformity of Coverage Y2/% |
|---|
| 1 | 1 | −1 | 0 | 585.67 | 88.48 |
| 2 | −1 | 1 | 0 | 1592.37 | 93.68 |
| 3 | 0 | 1 | 1 | 1465.98 | 96.72 |
| 4 | 0 | 0 | 0 | 1139.48 | 96.01 |
| 5 | 0 | 1 | −1 | 1623.87 | 95.23 |
| 6 | 0 | −1 | −1 | 1024.56 | 88.93 |
| 7 | −1 | −1 | 0 | 503.92 | 87.12 |
| 8 | 1 | 0 | −1 | 1183.60 | 91.17 |
| 9 | 0 | 0 | 0 | 1137.88 | 98.33 |
| 10 | −1 | 0 | 1 | 1234.94 | 91.18 |
| 11 | 1 | 1 | −1 | 1480.67 | 91.62 |
| 12 | 0 | 0 | 0 | 1130.54 | 98.72 |
| 13 | 0 | 0 | 0 | 1134.78 | 98.34 |
| 14 | −1 | 0 | −1 | 1501.68 | 90.28 |
| 15 | 1 | 0 | 1 | 1010.34 | 92.27 |
| 16 | 0 | 0 | 0 | 1128.61 | 98.42 |
| 17 | 0 | −1 | 1 | 845.59 | 91.16 |
Table 4.
Variance analysis of regression equation.
Table 4.
Variance analysis of regression equation.
Variance
Source | Specific Power Consumption Y1 | Coverage Uniformity Y2 |
|---|
| Sum of Squares | Freedom | F | p | Sum of Squares | Freedom | F | p |
|---|
| model | 1.561 × 10⁶ | 9 | 18.97 | 0.0004 | 230.63 | 9 | 32.25 | <0.0001 |
| X1 | 21,853.56 | 1 | 2.39 | 0.1660 | 1.30 | 1 | 1.64 | 0.2411 |
| X2 | 9.290 × 10⁵ | 1 | 101.63 | <0.0001 | 64.25 | 1 | 80.86 | <0.0001 |
| X3 | 58,800.12 | 1 | 6.43 | 0.0389 | 3.78 | 1 | 4.75 | 0.0657 |
| X1X2 | 37,943.91 | 1 | 4.15 | 0.0810 | 0.0427 | 1 | 0.0537 | 0.8234 |
| X1X3 | 7455.48 | 1 | 0.8156 | 0.3965 | 0.0299 | 1 | 0.0376 | 0.8518 |
| X2X3 | 798.39 | 1 | 0.0873 | 0.7762 | 0.1849 | 1 | 0.2327 | 0.6443 |
| X12 | 18,965.62 | 1 | 2.07 | 0.1929 | 45.02 | 1 | 56.66 | 0.0001 |
| X22 | 19,265.56 | 1 | 2.11 | 0.1899 | 27.98 | 1 | 35.21 | 0.0006 |
| X32 | 1.269 × 10⁵ | 1 | 13.88 | 0.0074 | 15.24 | 1 | 19.18 | 0.0032 |
| residual | 63,987.54 | 7 | | 0.0984 | 5.56 | 7 | | 0.9567 |
| Lack of fit | 38,678.57 | 2 | 3.82 | 0.0956 | 2 | 0.0437 |
| Pure error | 25,308.96 | 5 | | 5.47 | 5 | |
| Cor total | 1.625 × 10⁶ | 16 | | 236.2 | 16 | |
Table 5.
Influence of conveying and feeding speed on evaluation index.
Table 5.
Influence of conveying and feeding speed on evaluation index.
| Indexes | Standard Requirement | Experimental Results |
|---|
| Acceptability of straw crushing | ≥92 | 98.3 |
| Uneven rate of straw scattering/% | >80 | 94.7 |
| Specific power consumption/(J/s2) | None | 1260 |
| Publisher’s Note: MDPI stays neutral with regard to jurisdictional claims in published maps and institutional affiliations. |
© 2022 by the authors. Licensee MDPI, Basel, Switzerland. This article is an open access article distributed under the terms and conditions of the Creative Commons Attribution (CC BY) license (https://creativecommons.org/licenses/by/4.0/).


