Generating a Cylindrical Panorama from a Forward-Looking Borehole Video for Borehole Condition Analysis


Abstract
:1. Introduction
2. Related Work
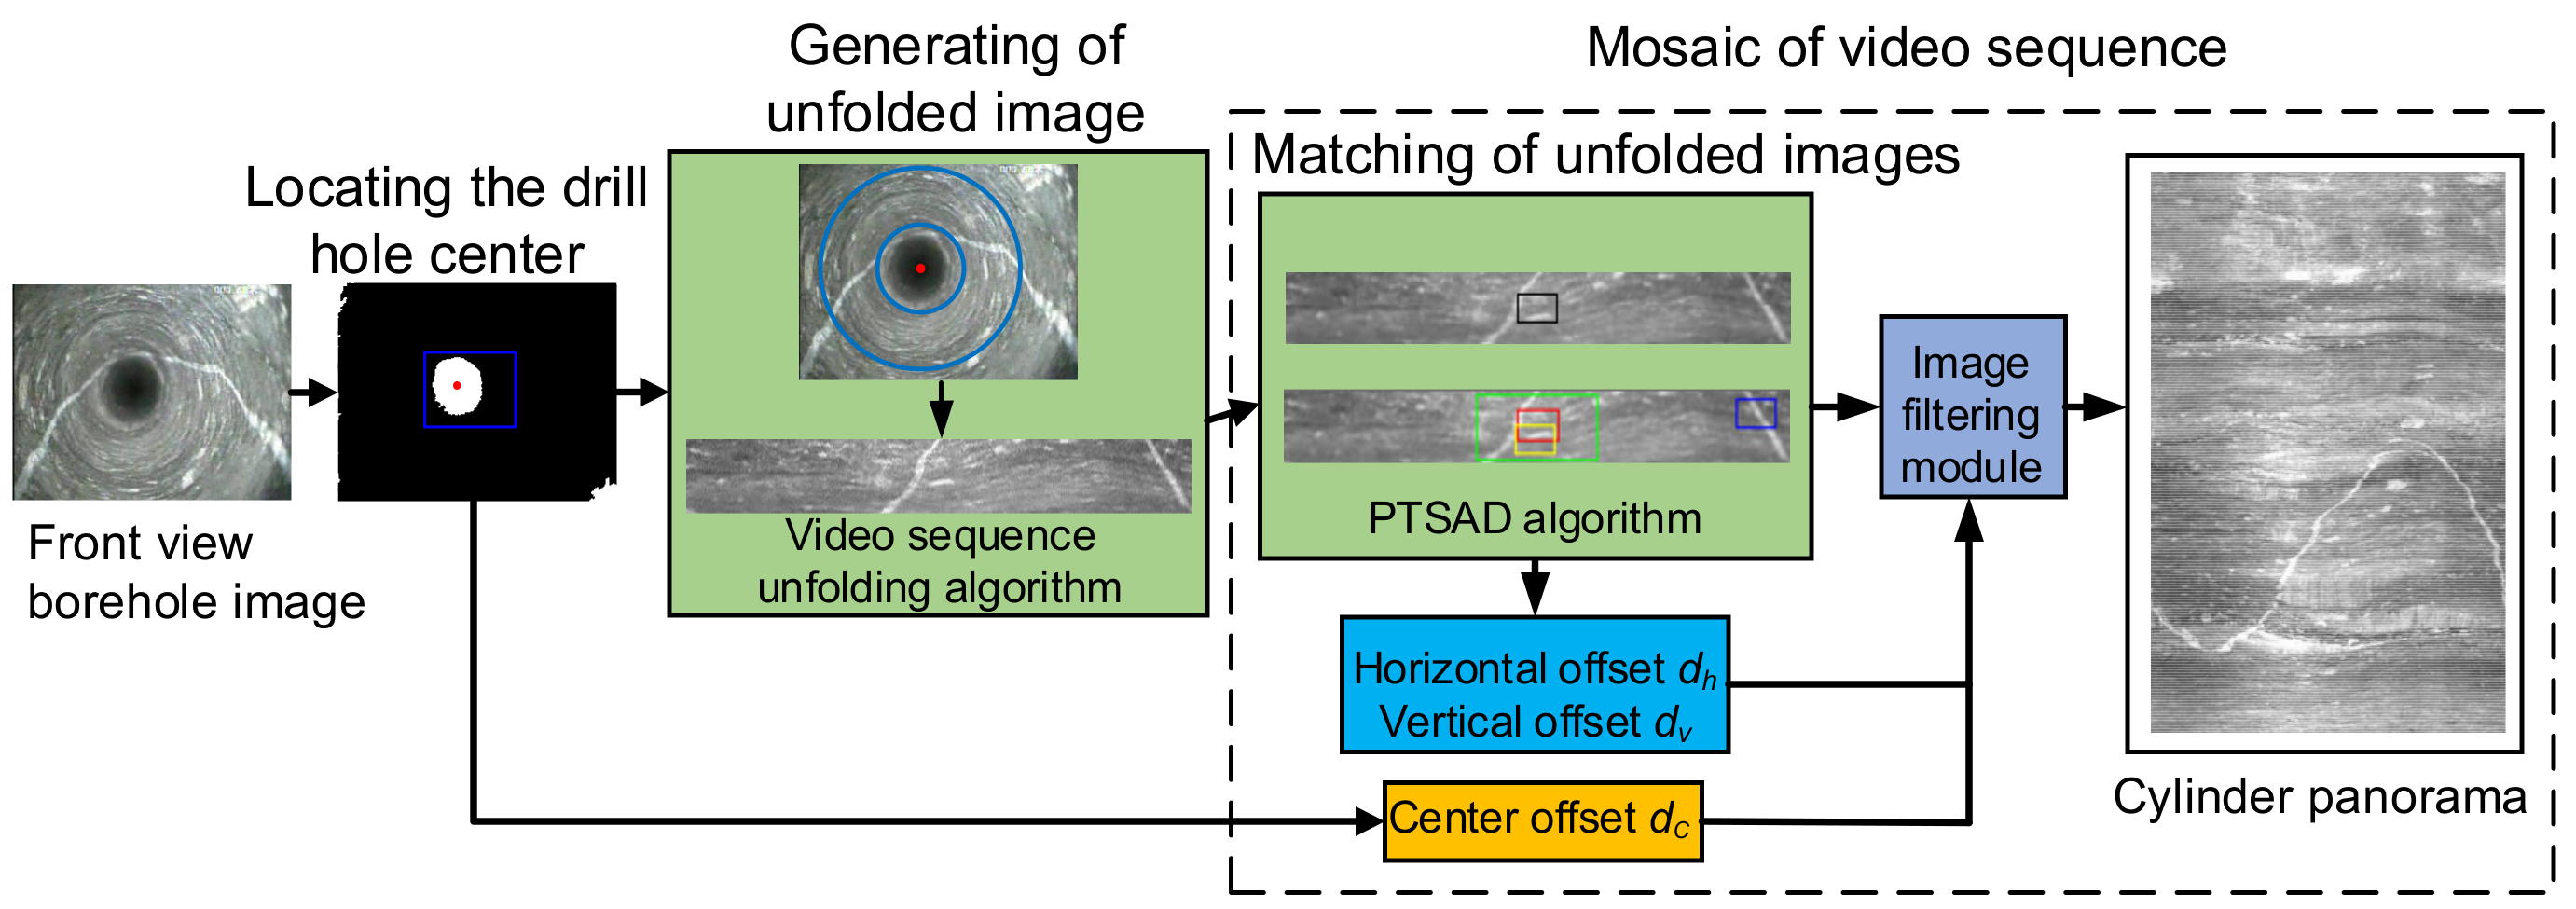
3. Overview of the System
4. Methods
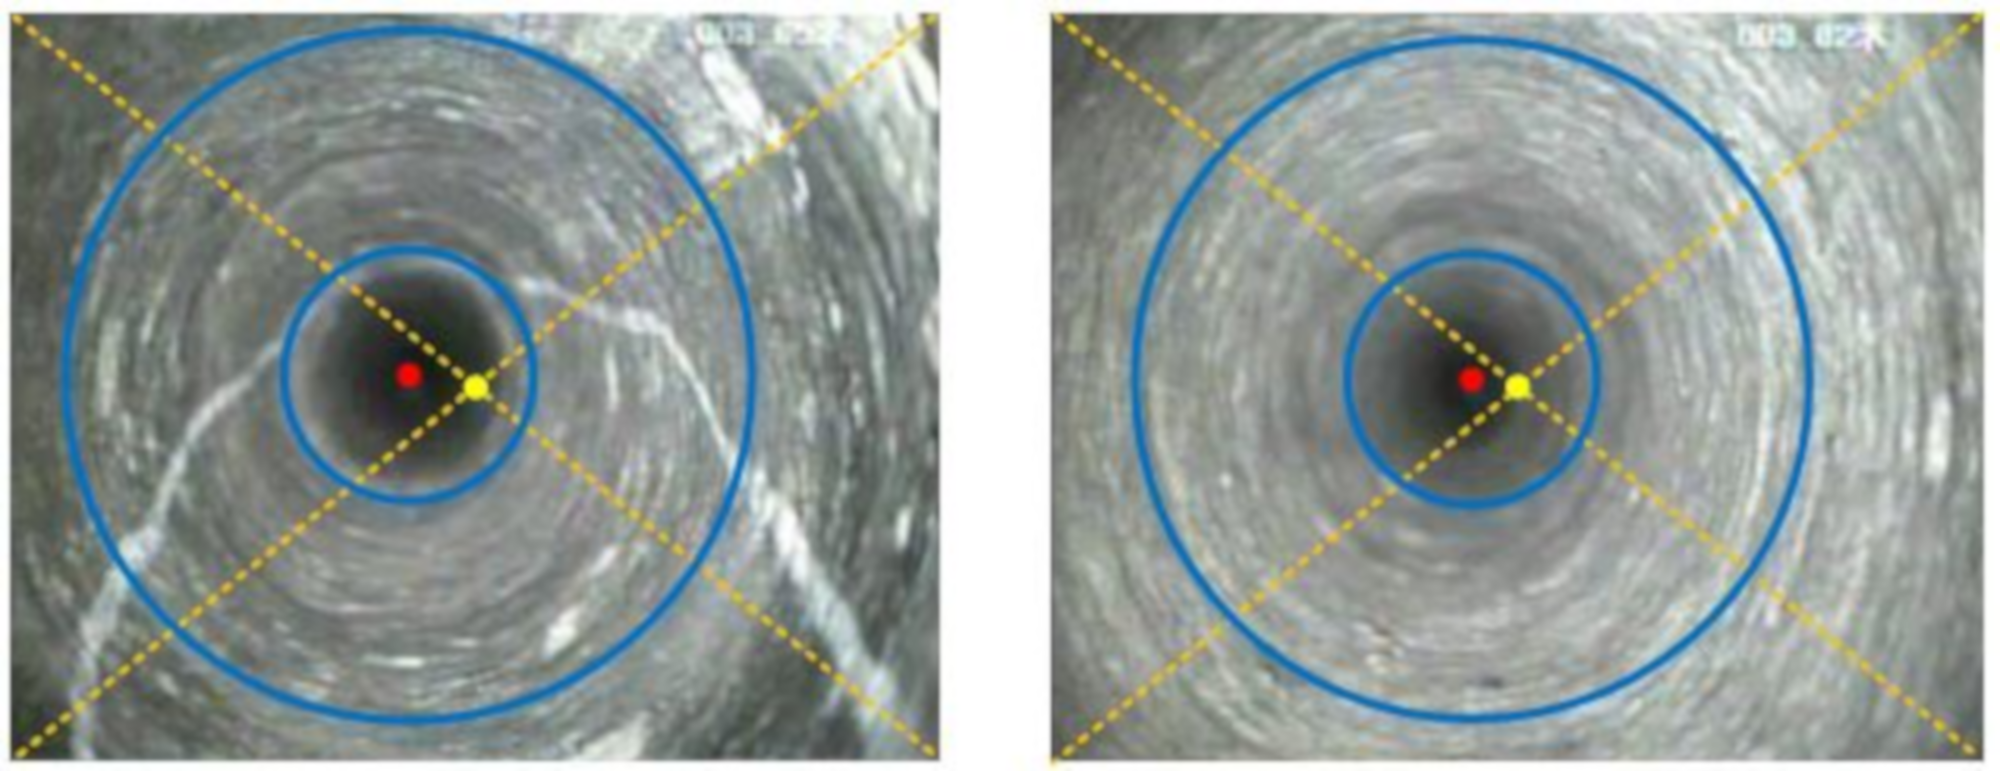
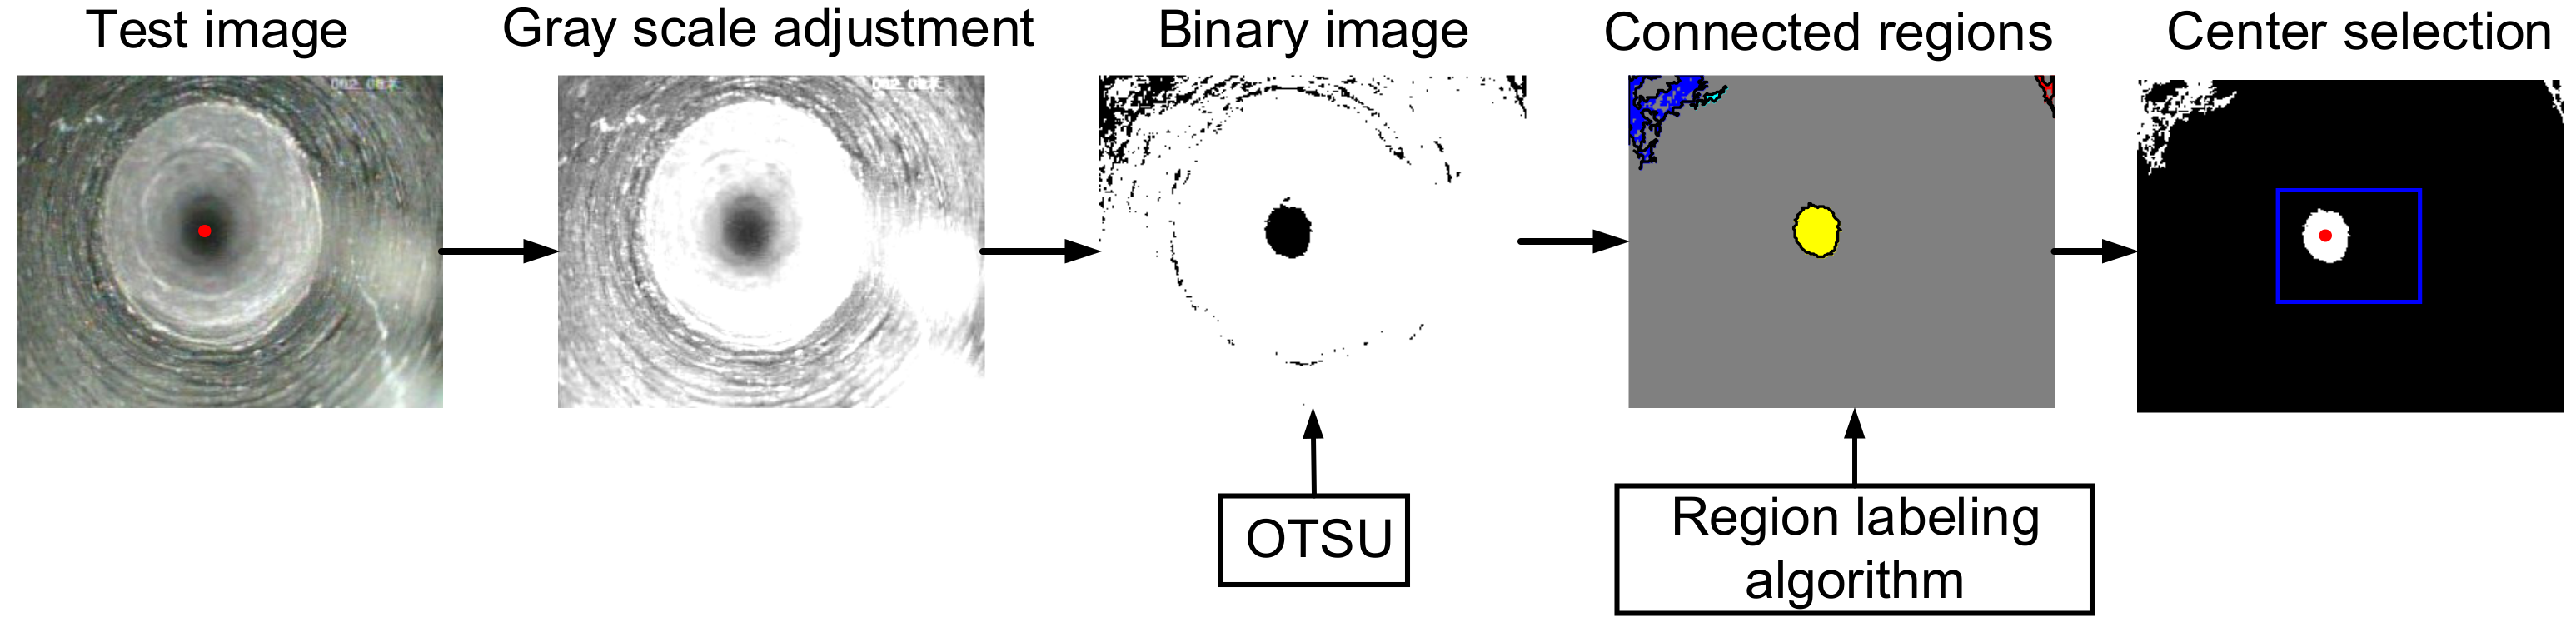
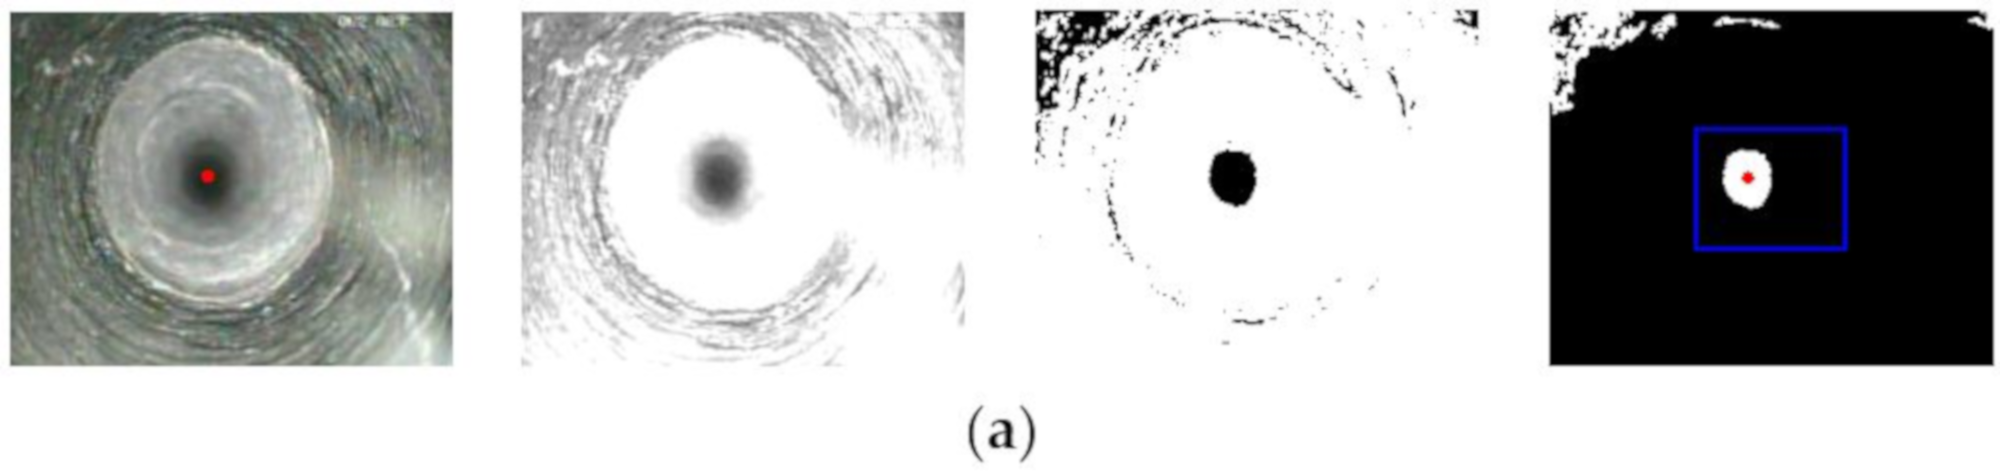
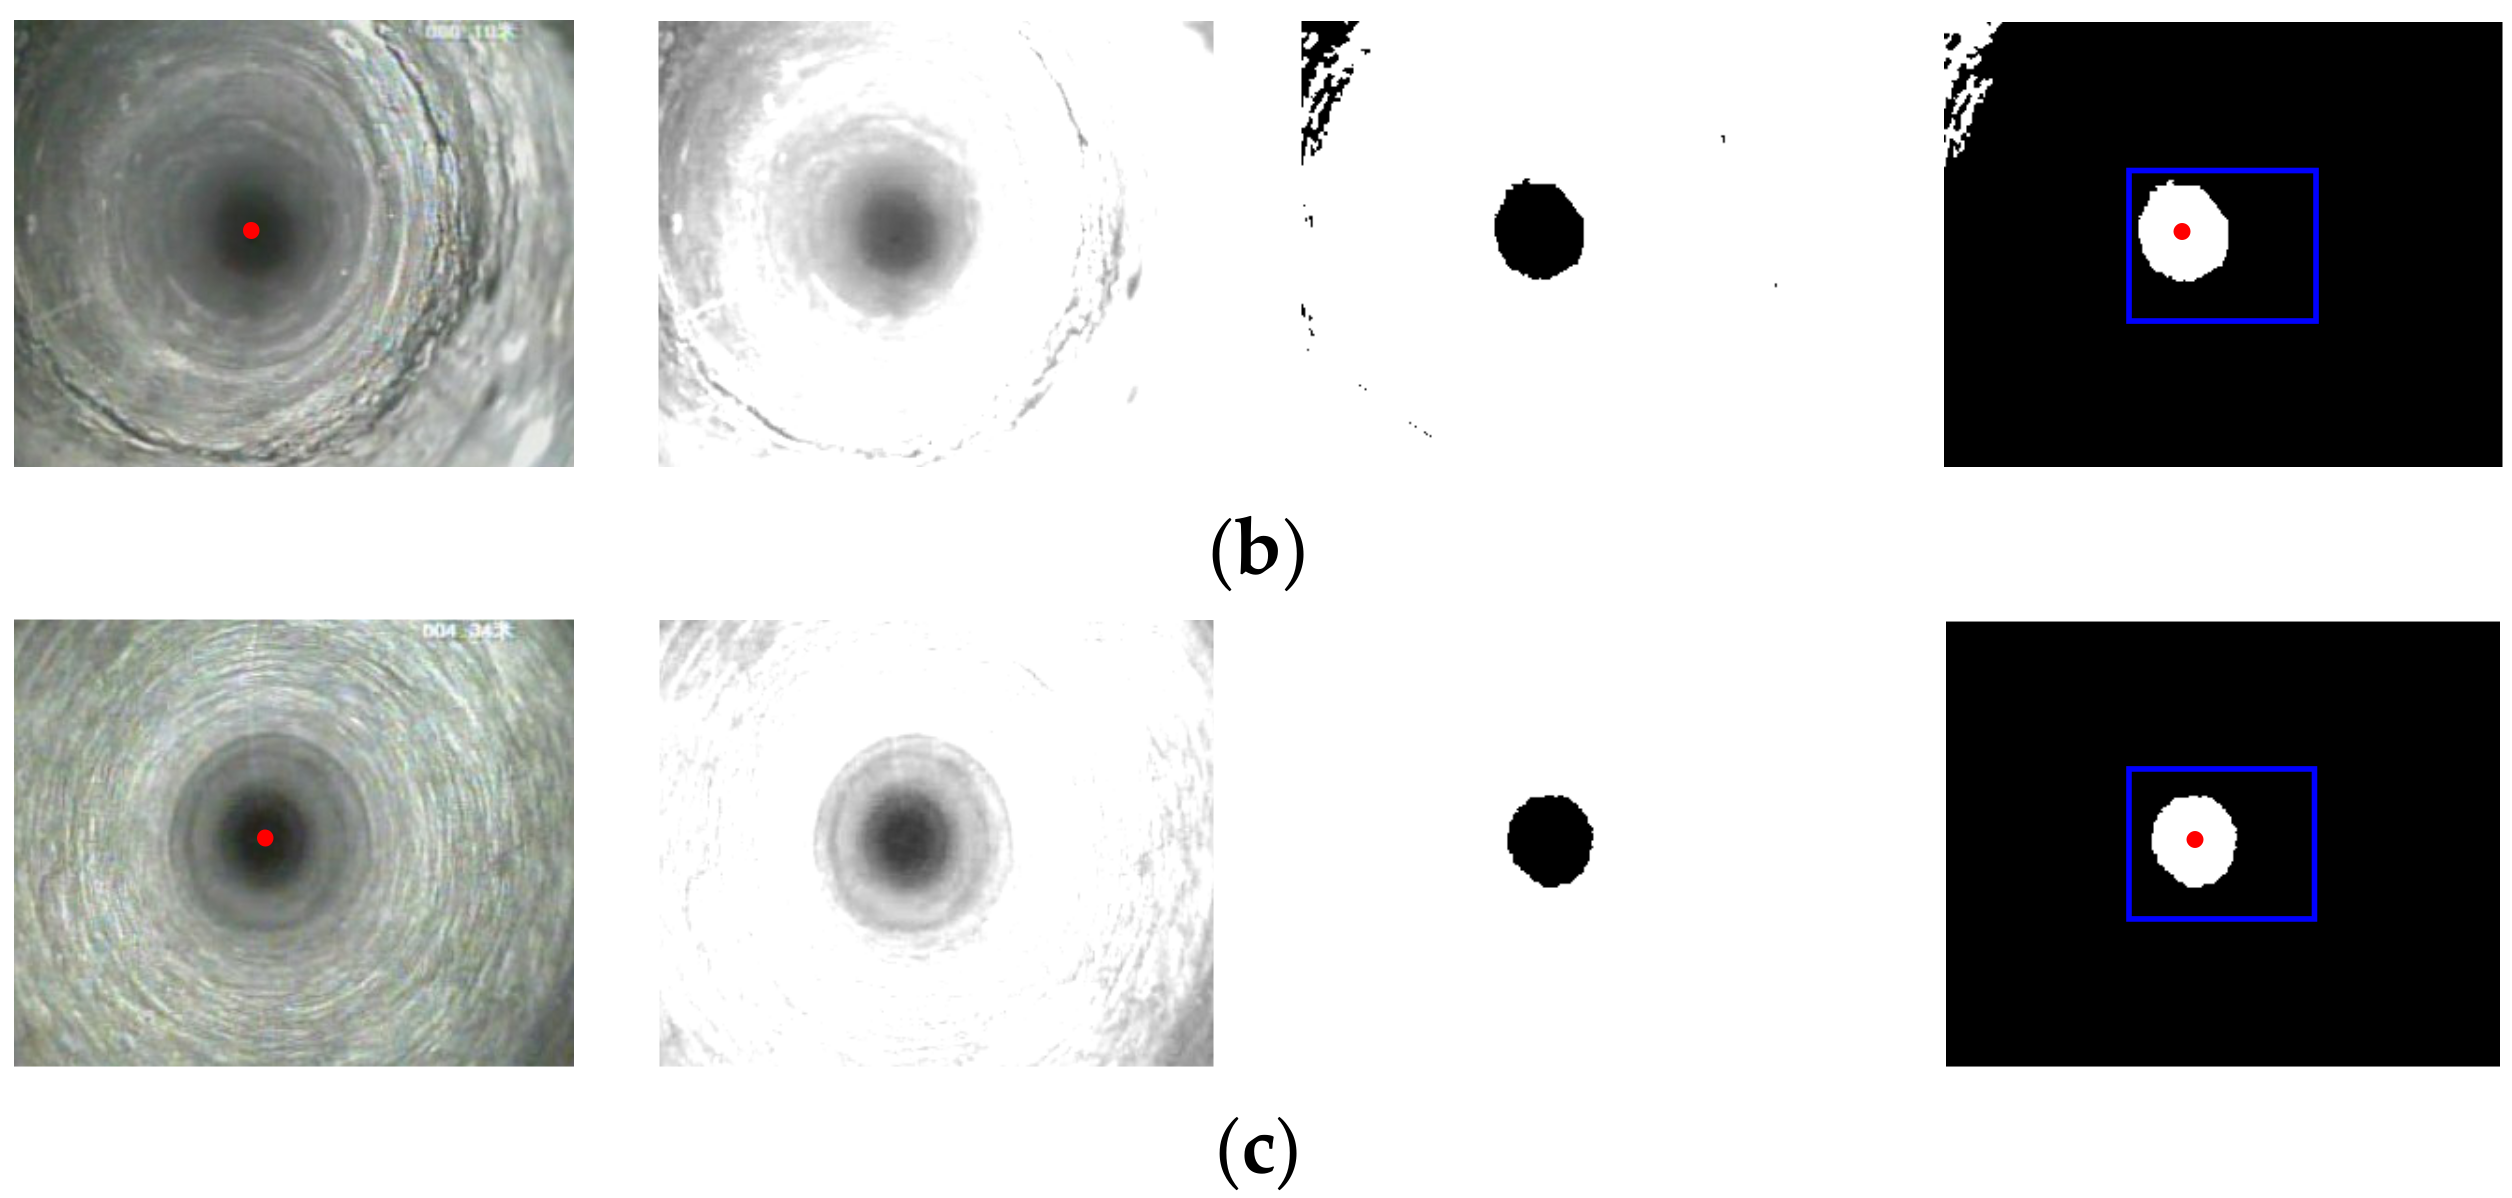
4.1. Locating Drilled Hole Center
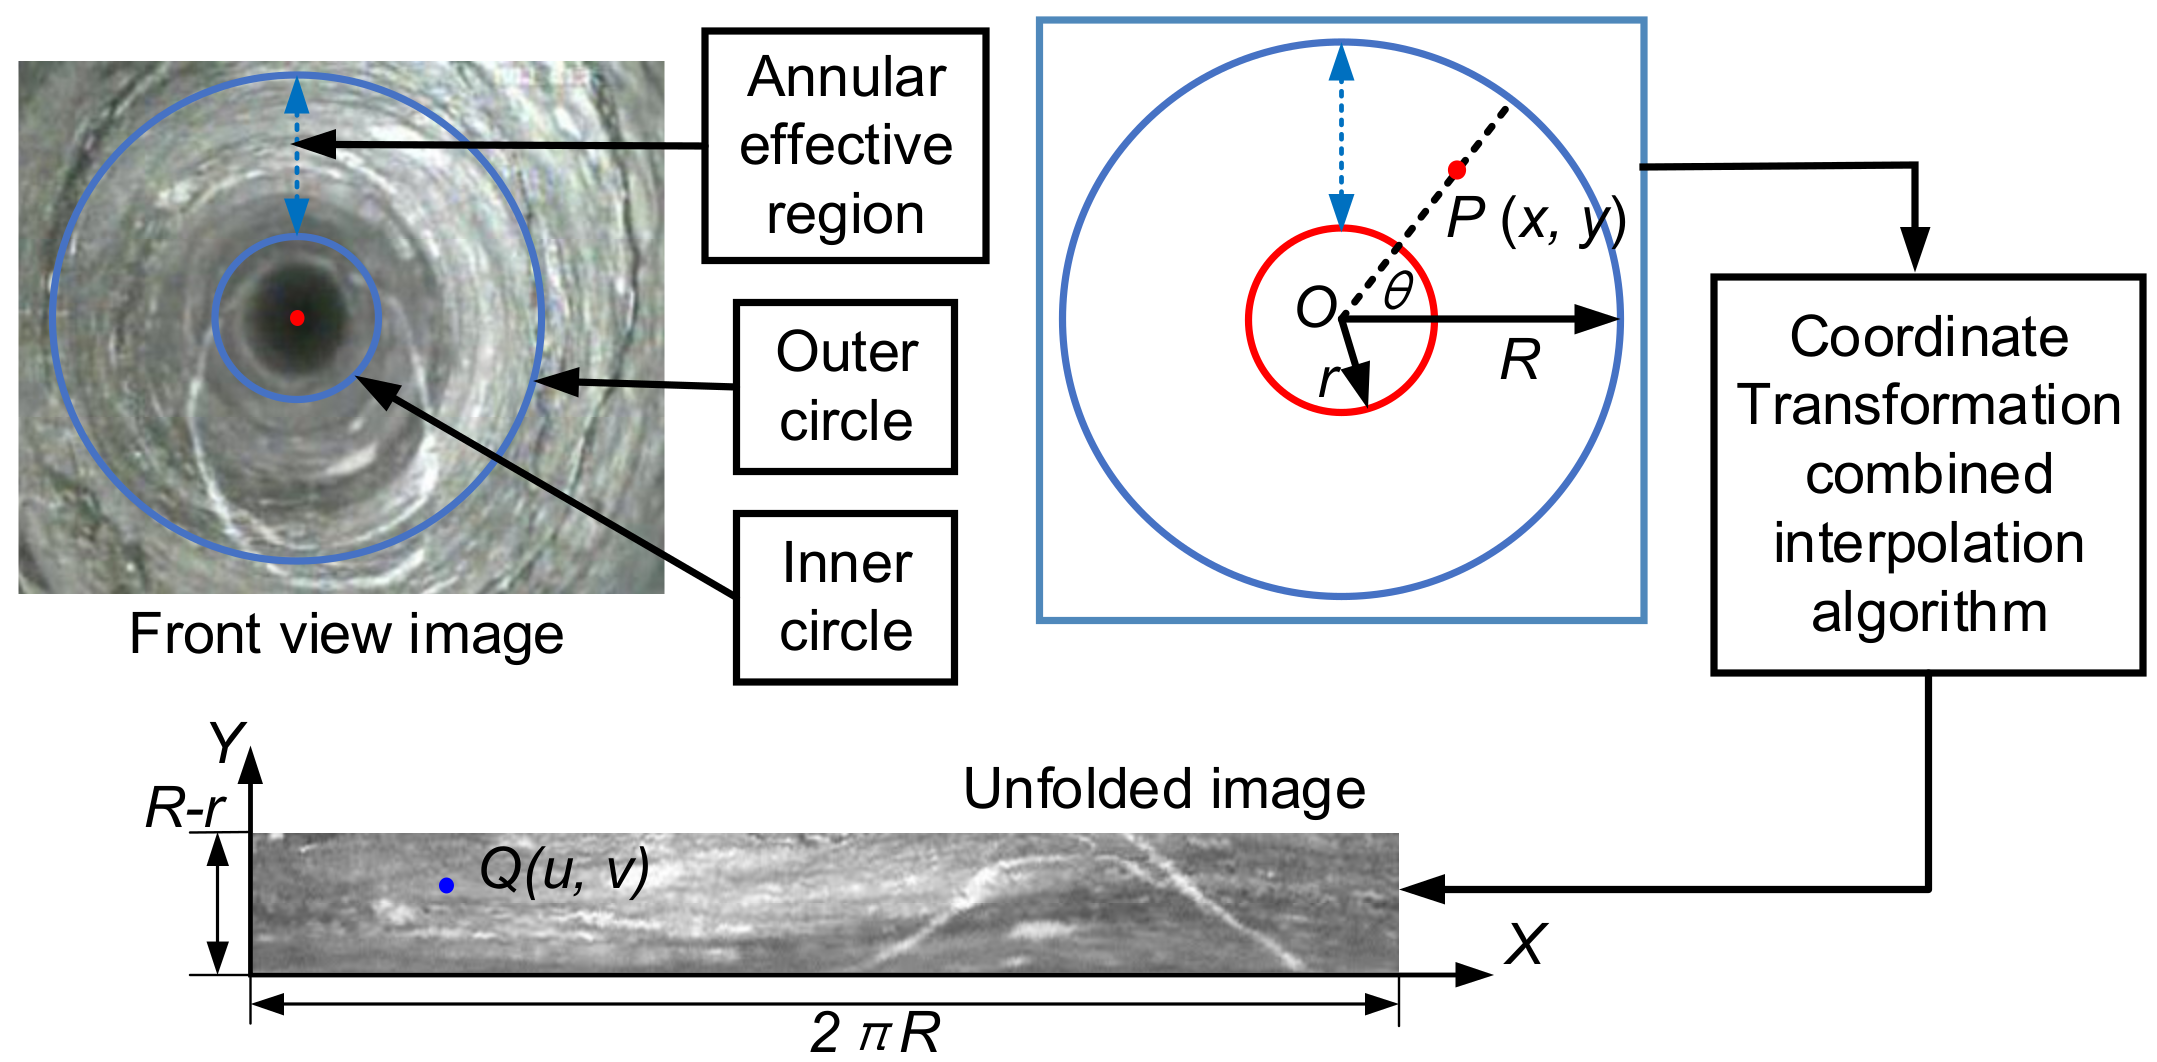
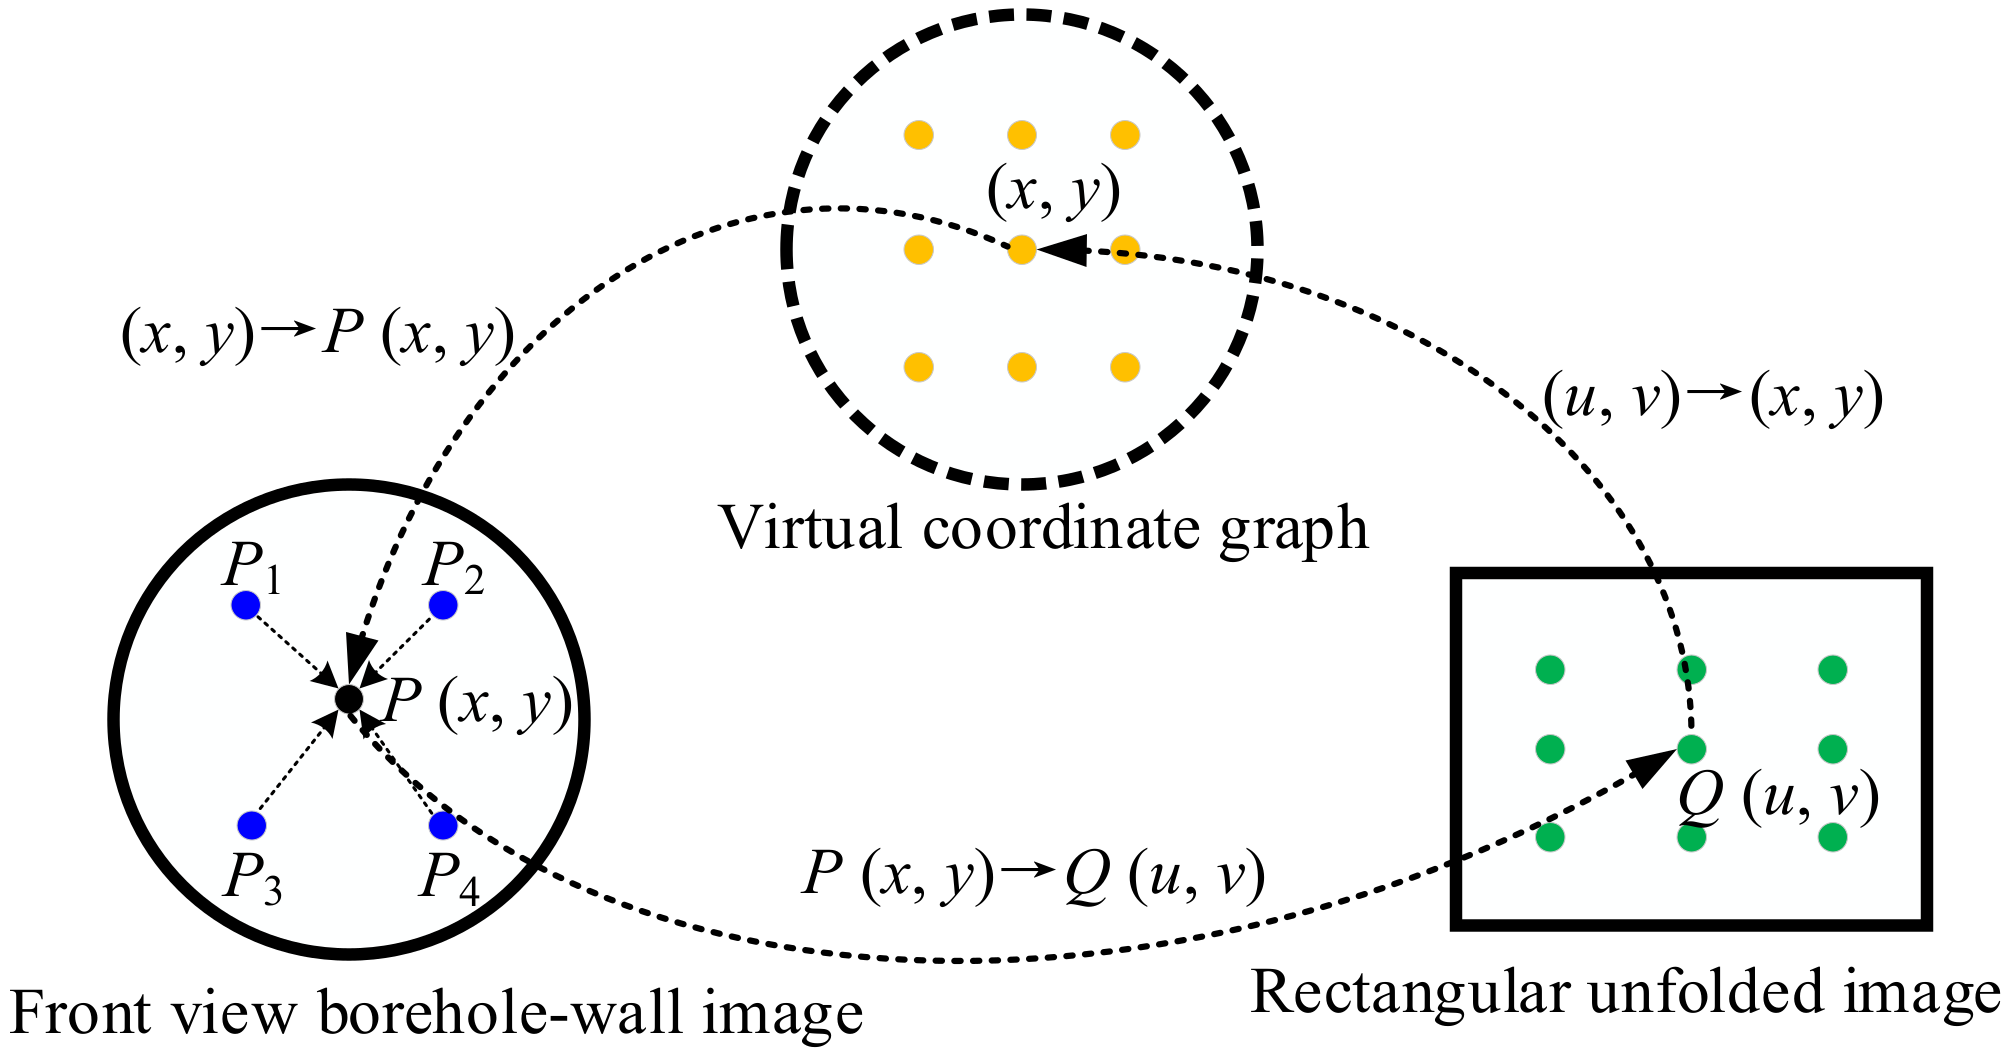
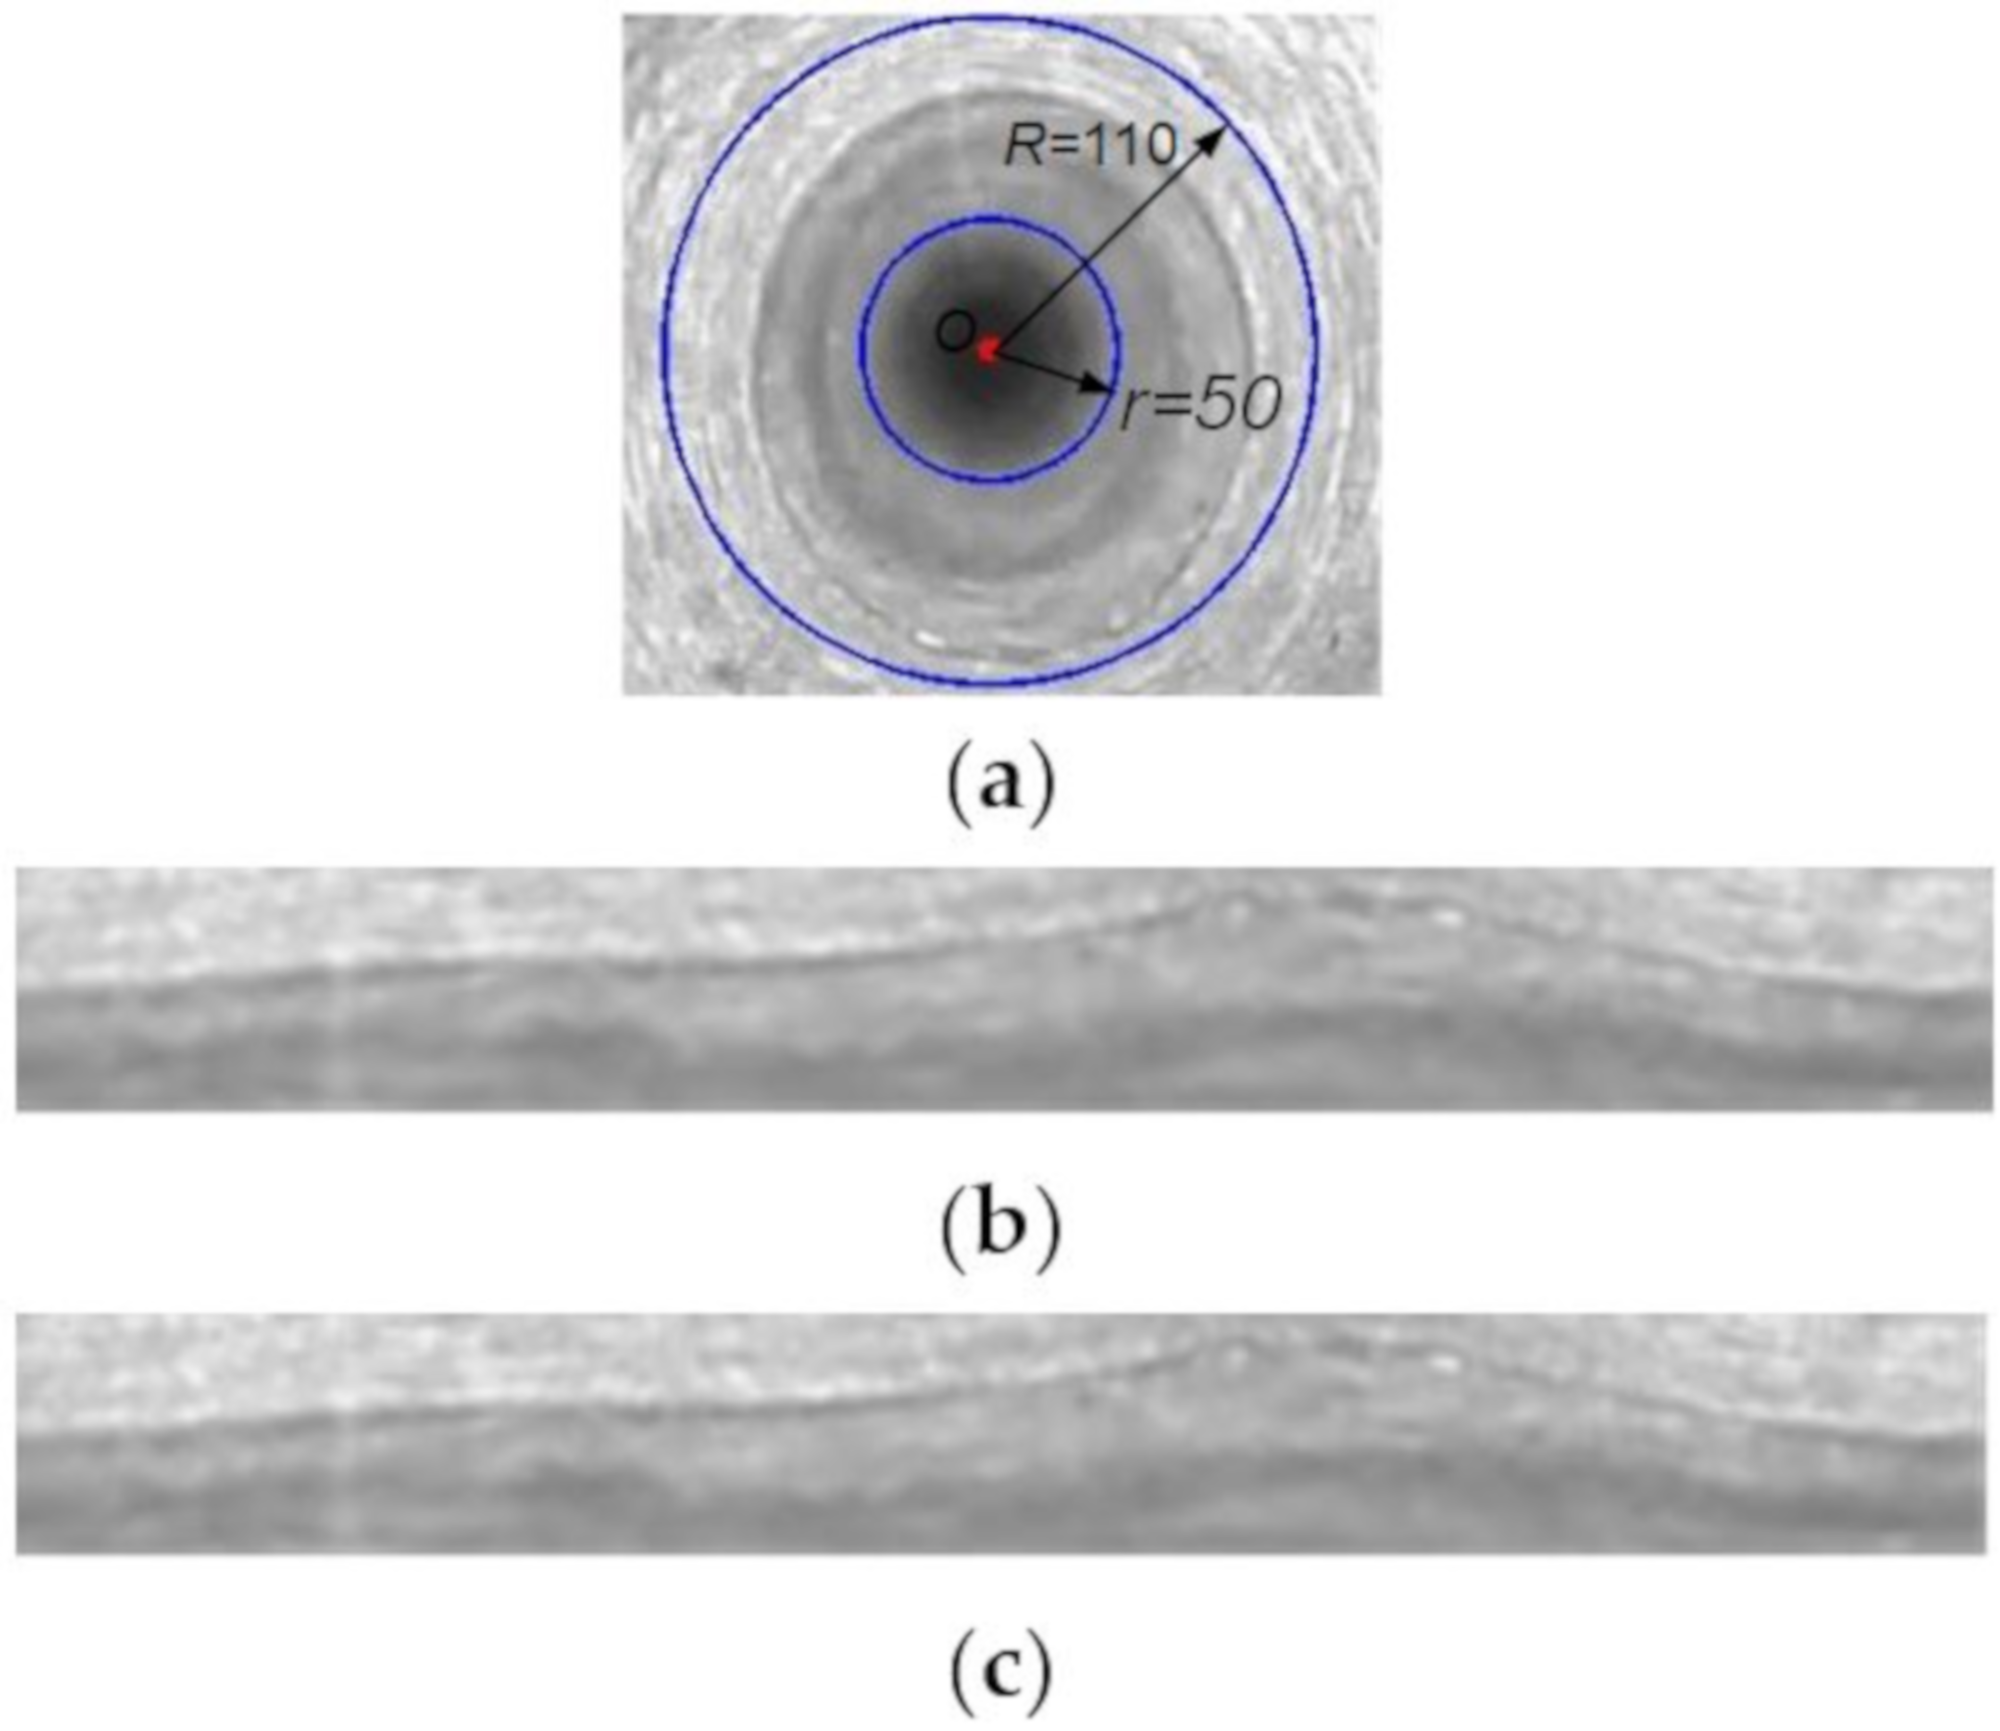
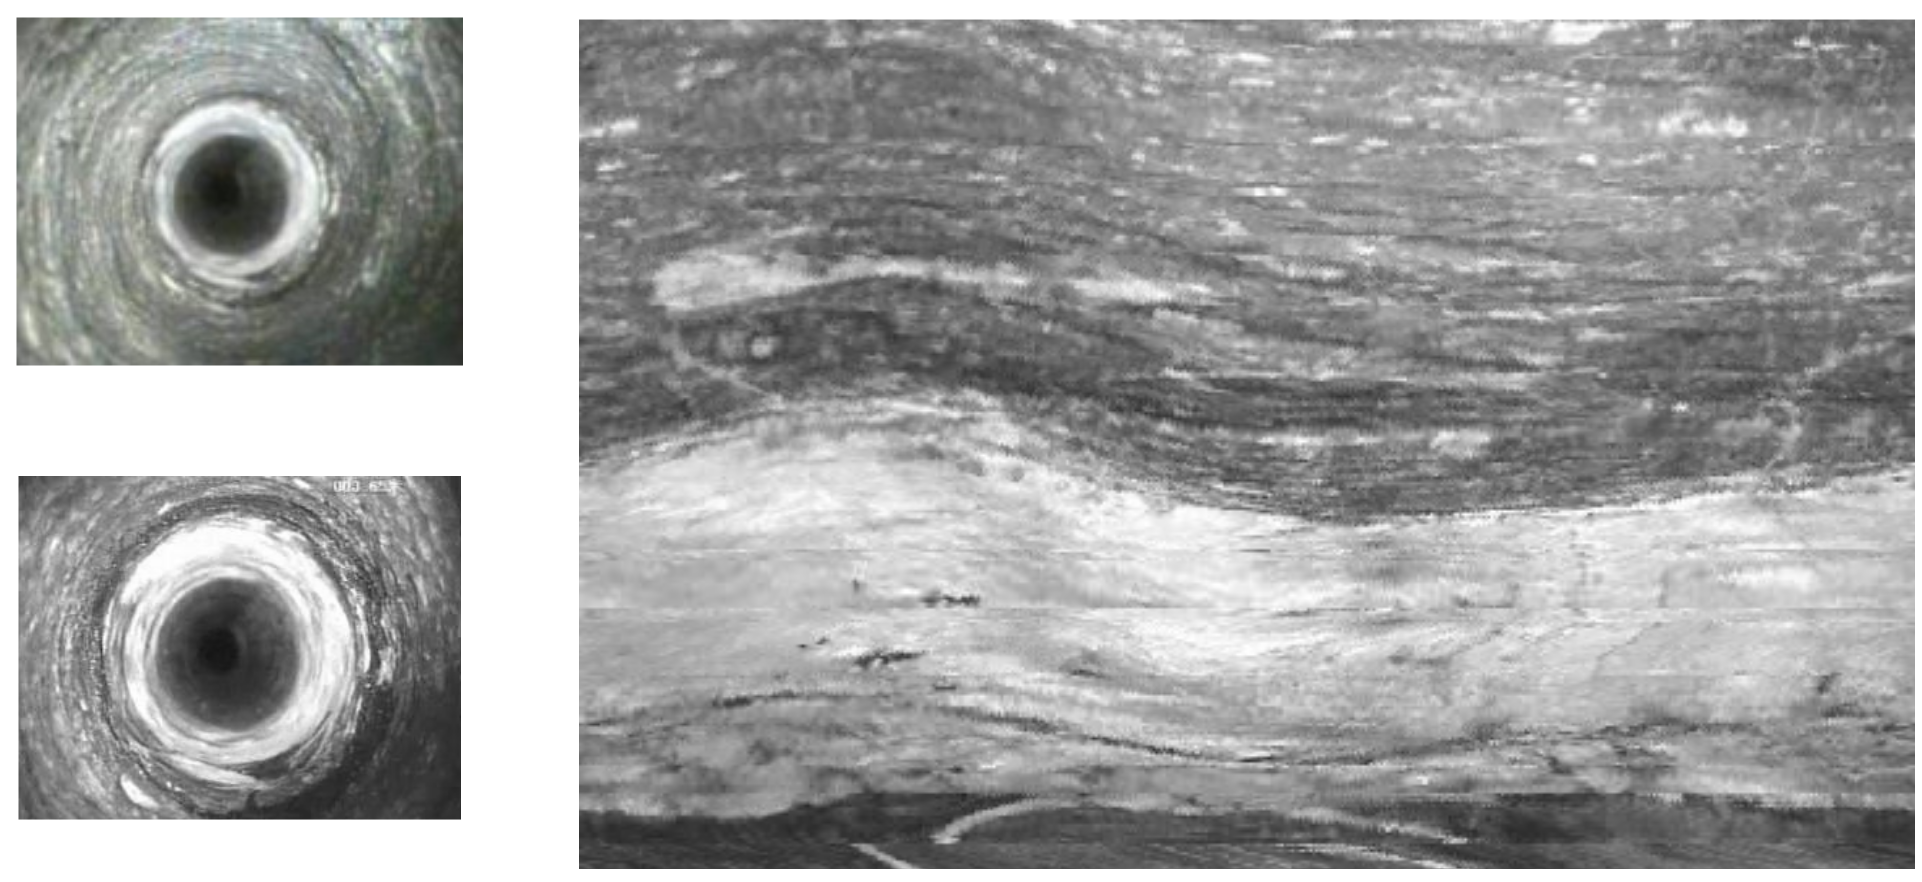
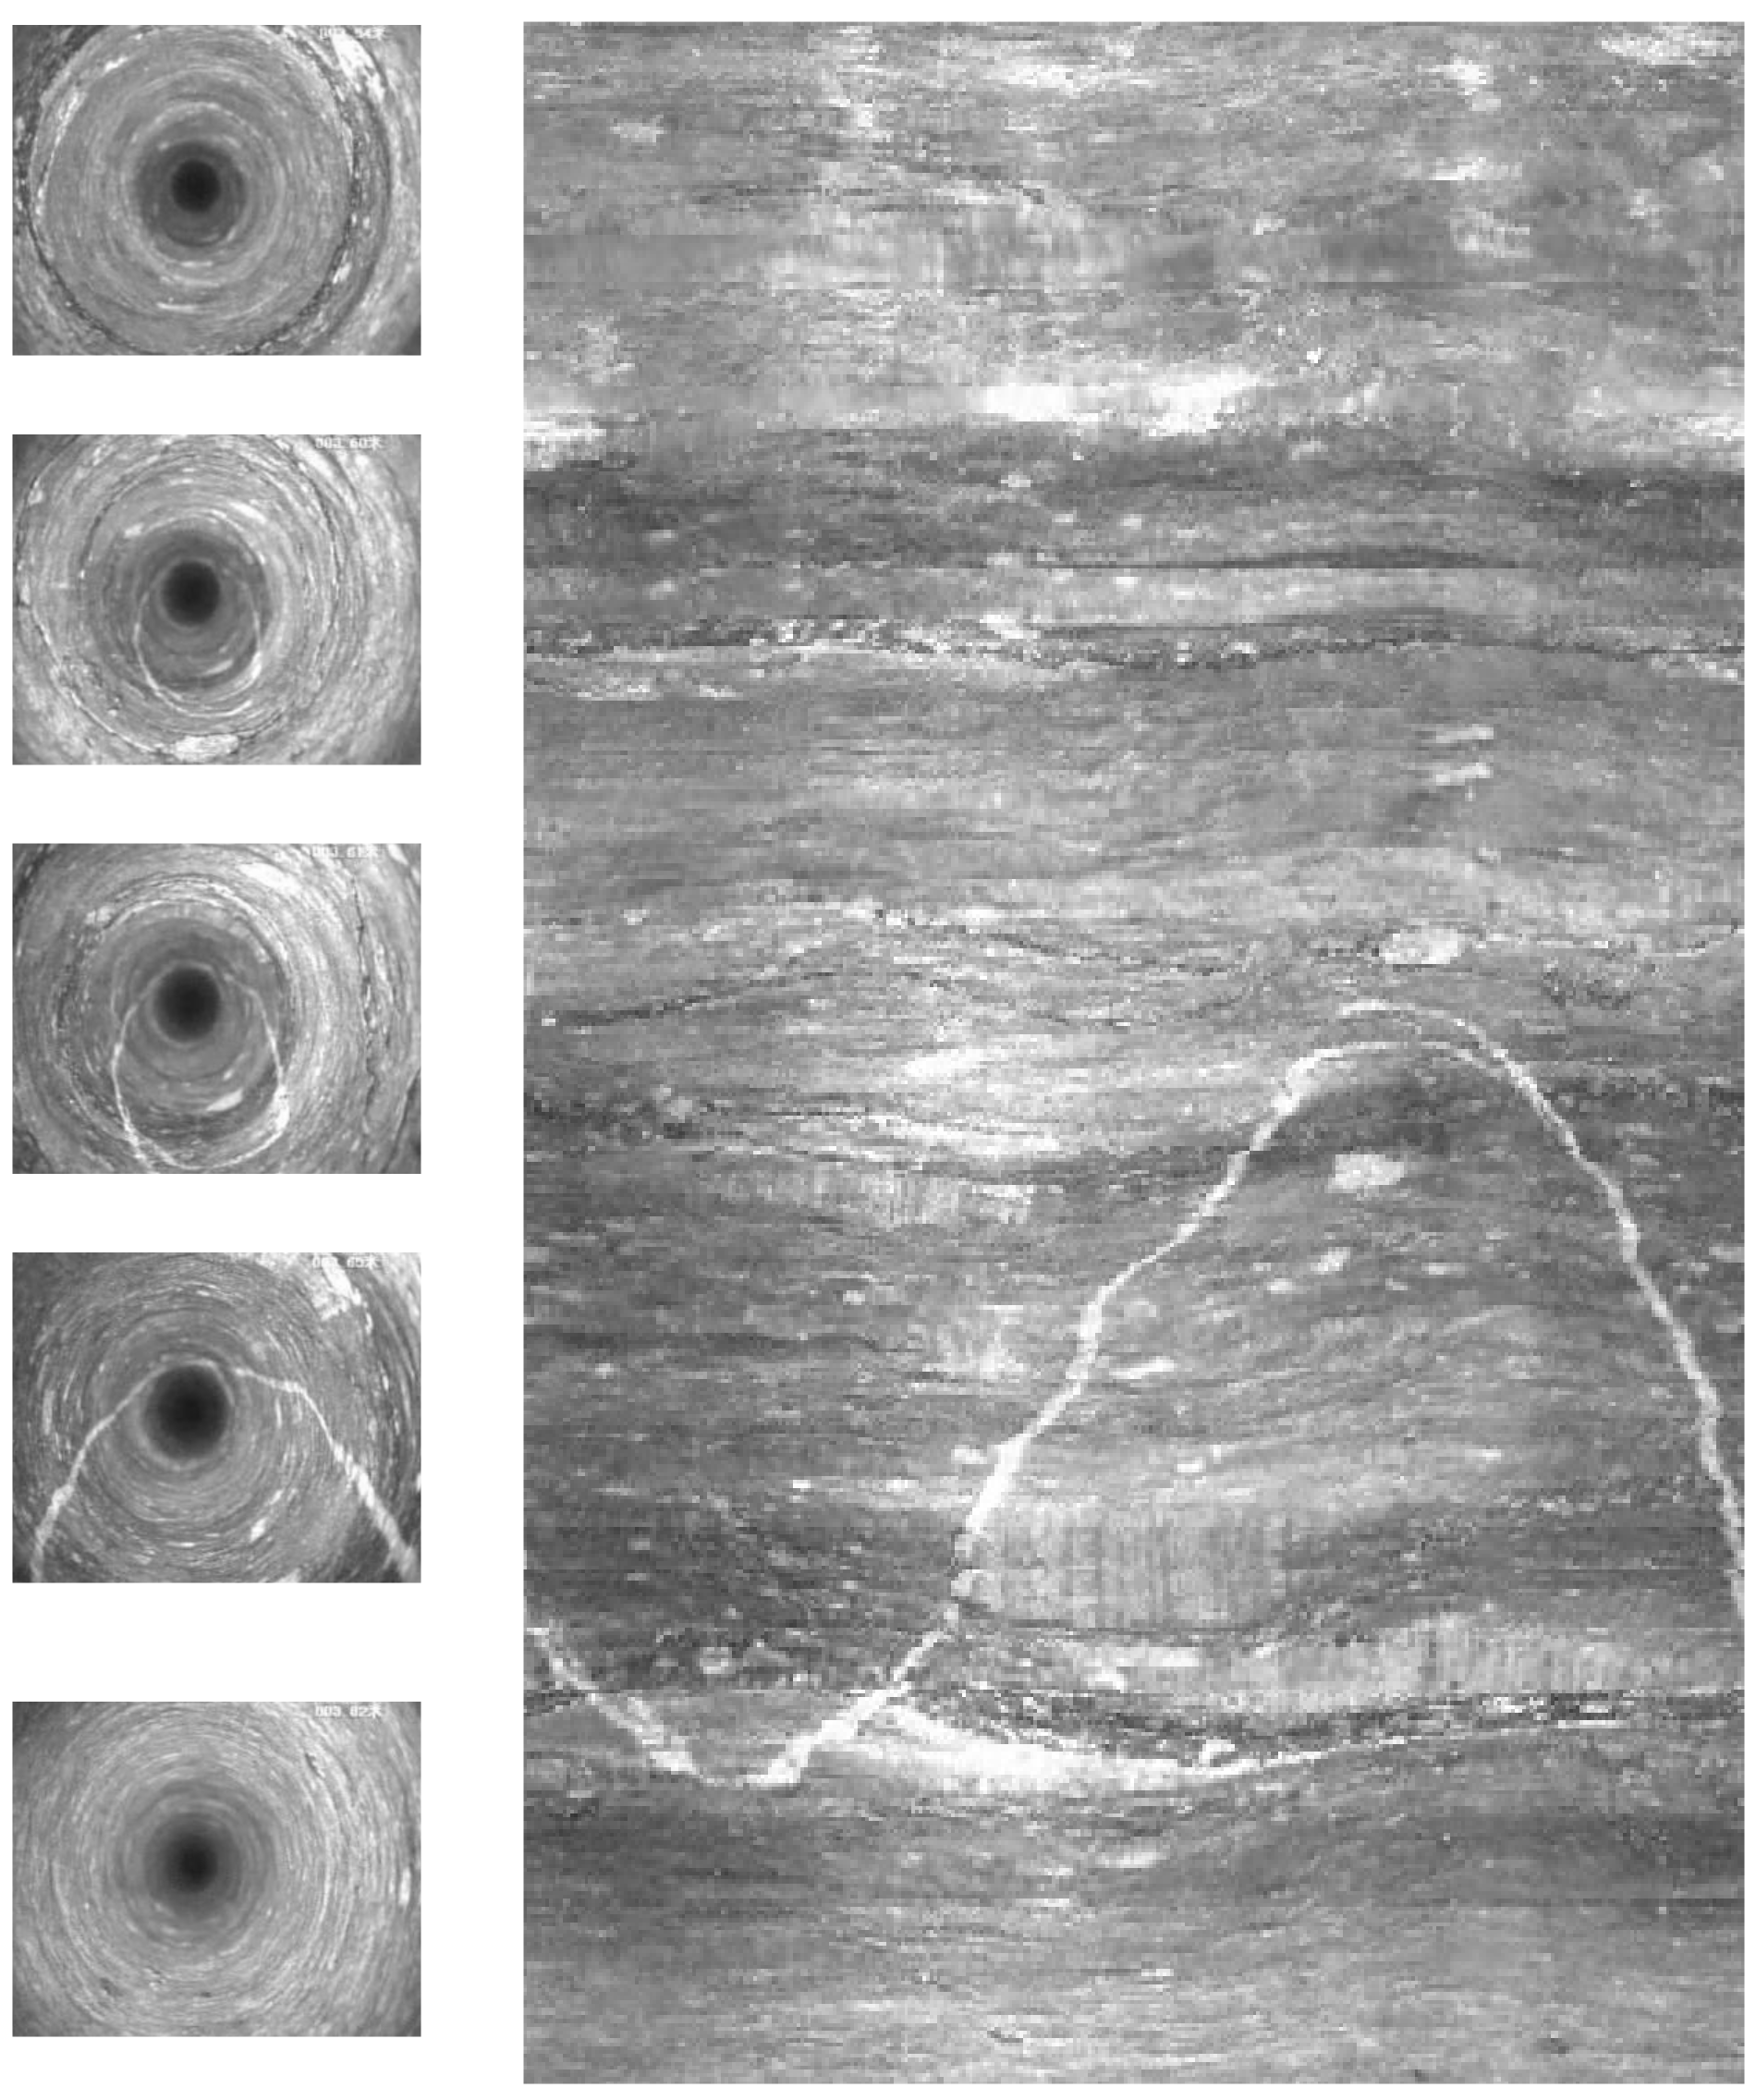
4.2. Generating of Unfolded Image Sequence
4.3. Mosaic of Borehole Video
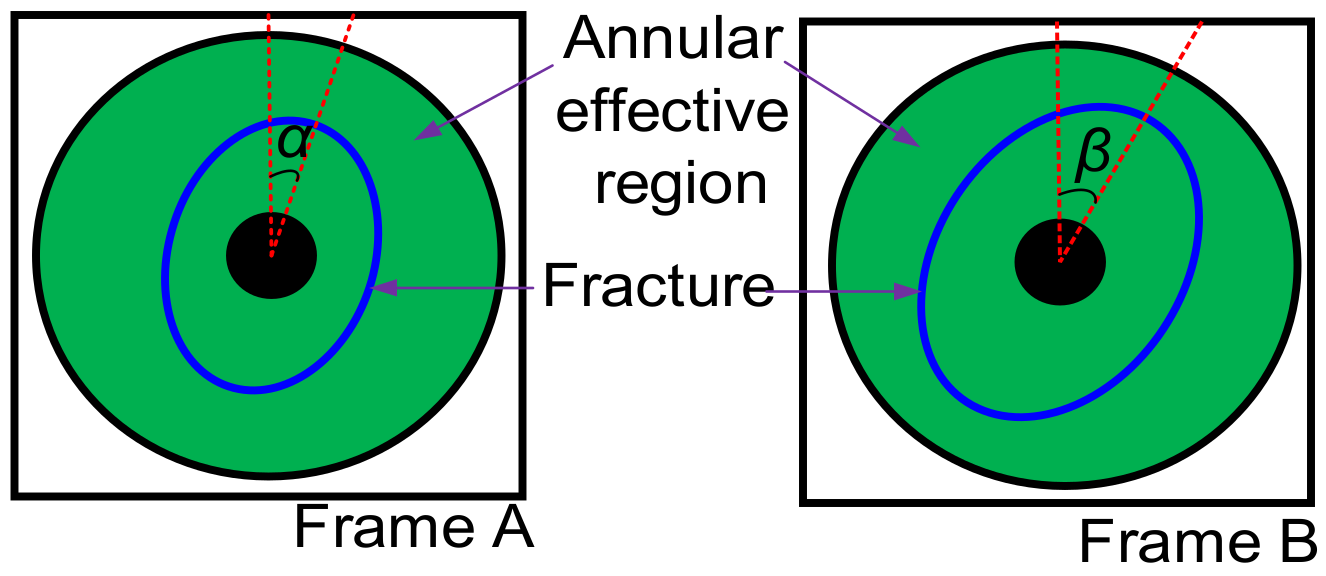
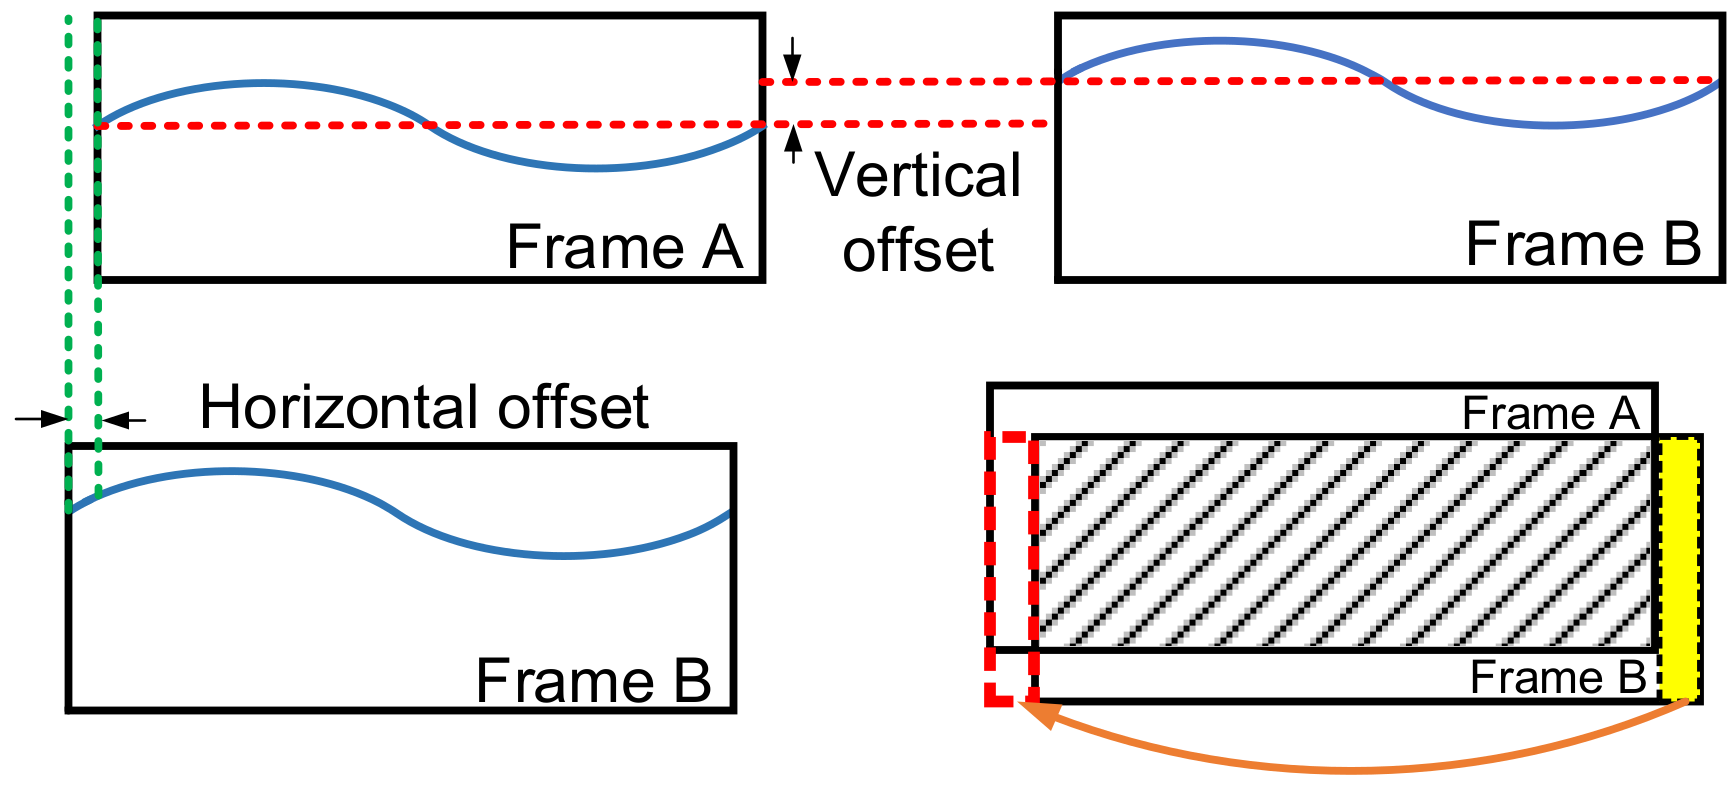
4.3.1. Mosaic Principle of the Borehole Wall Image
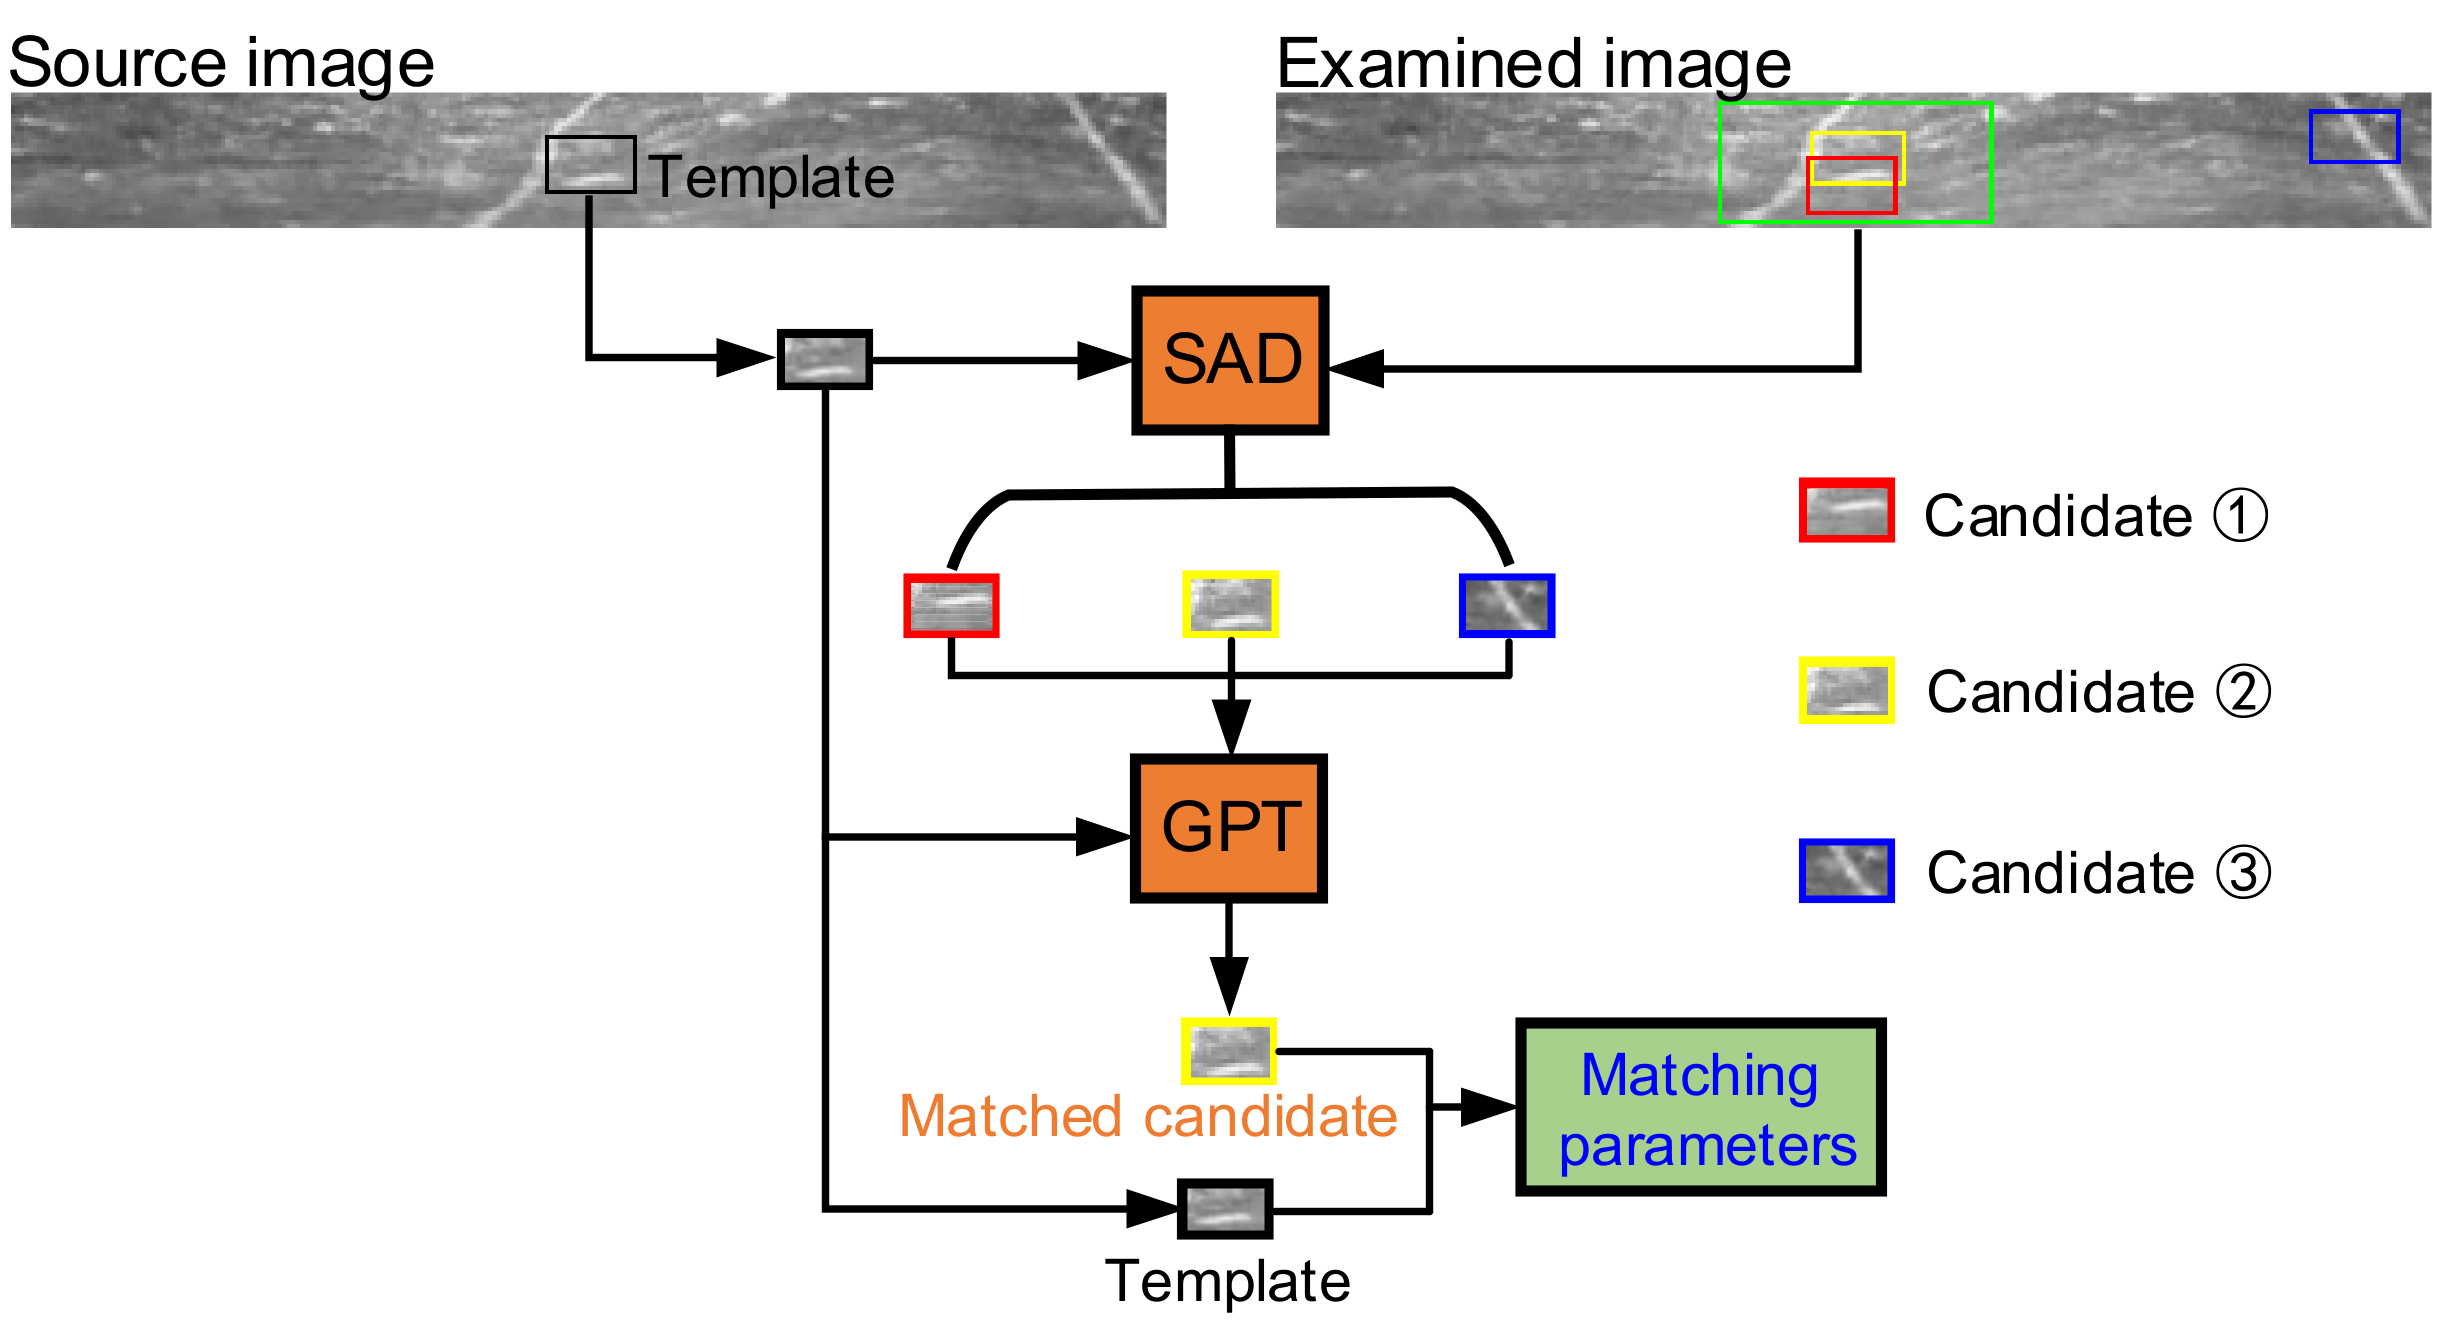
4.3.2. Proposed PTSAD Algorithm
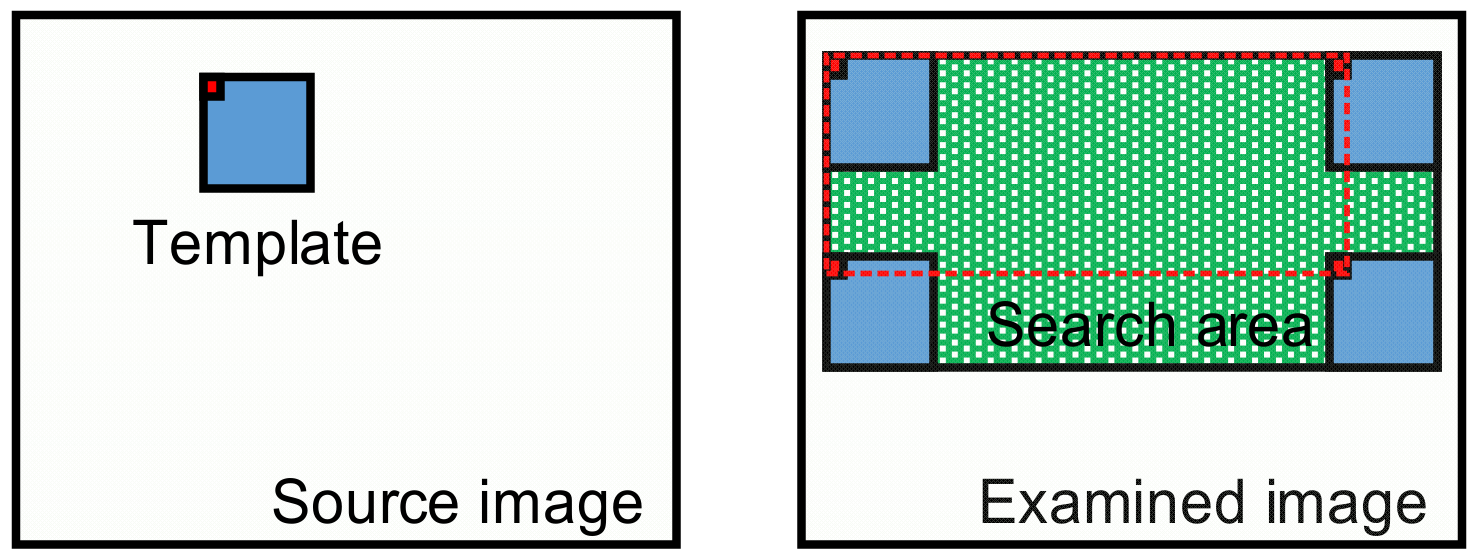
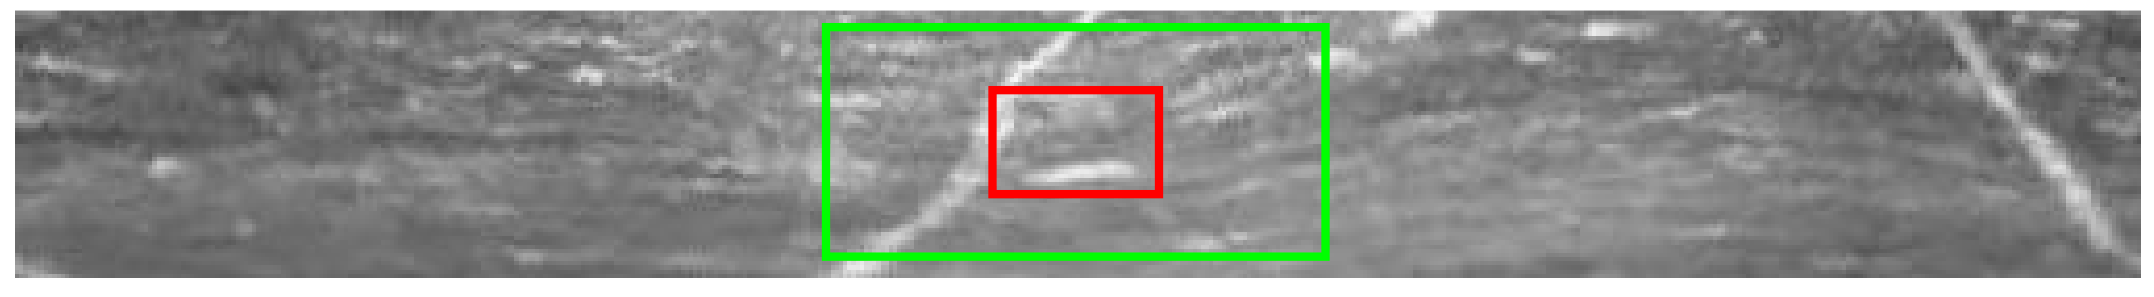
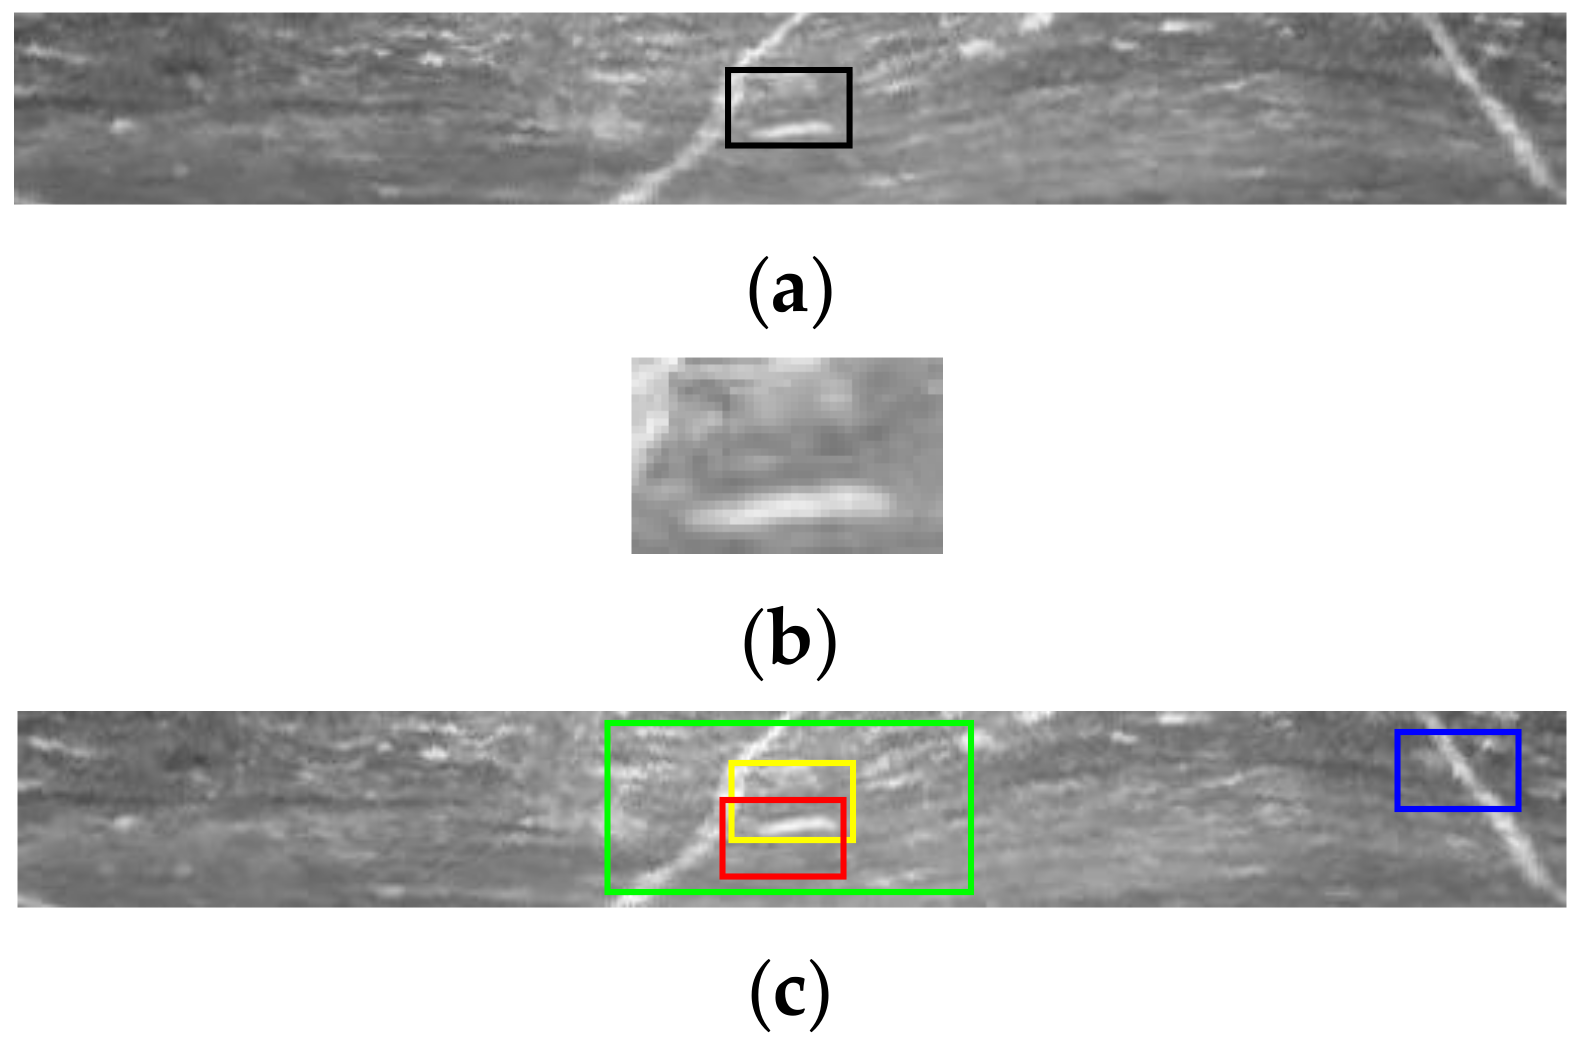
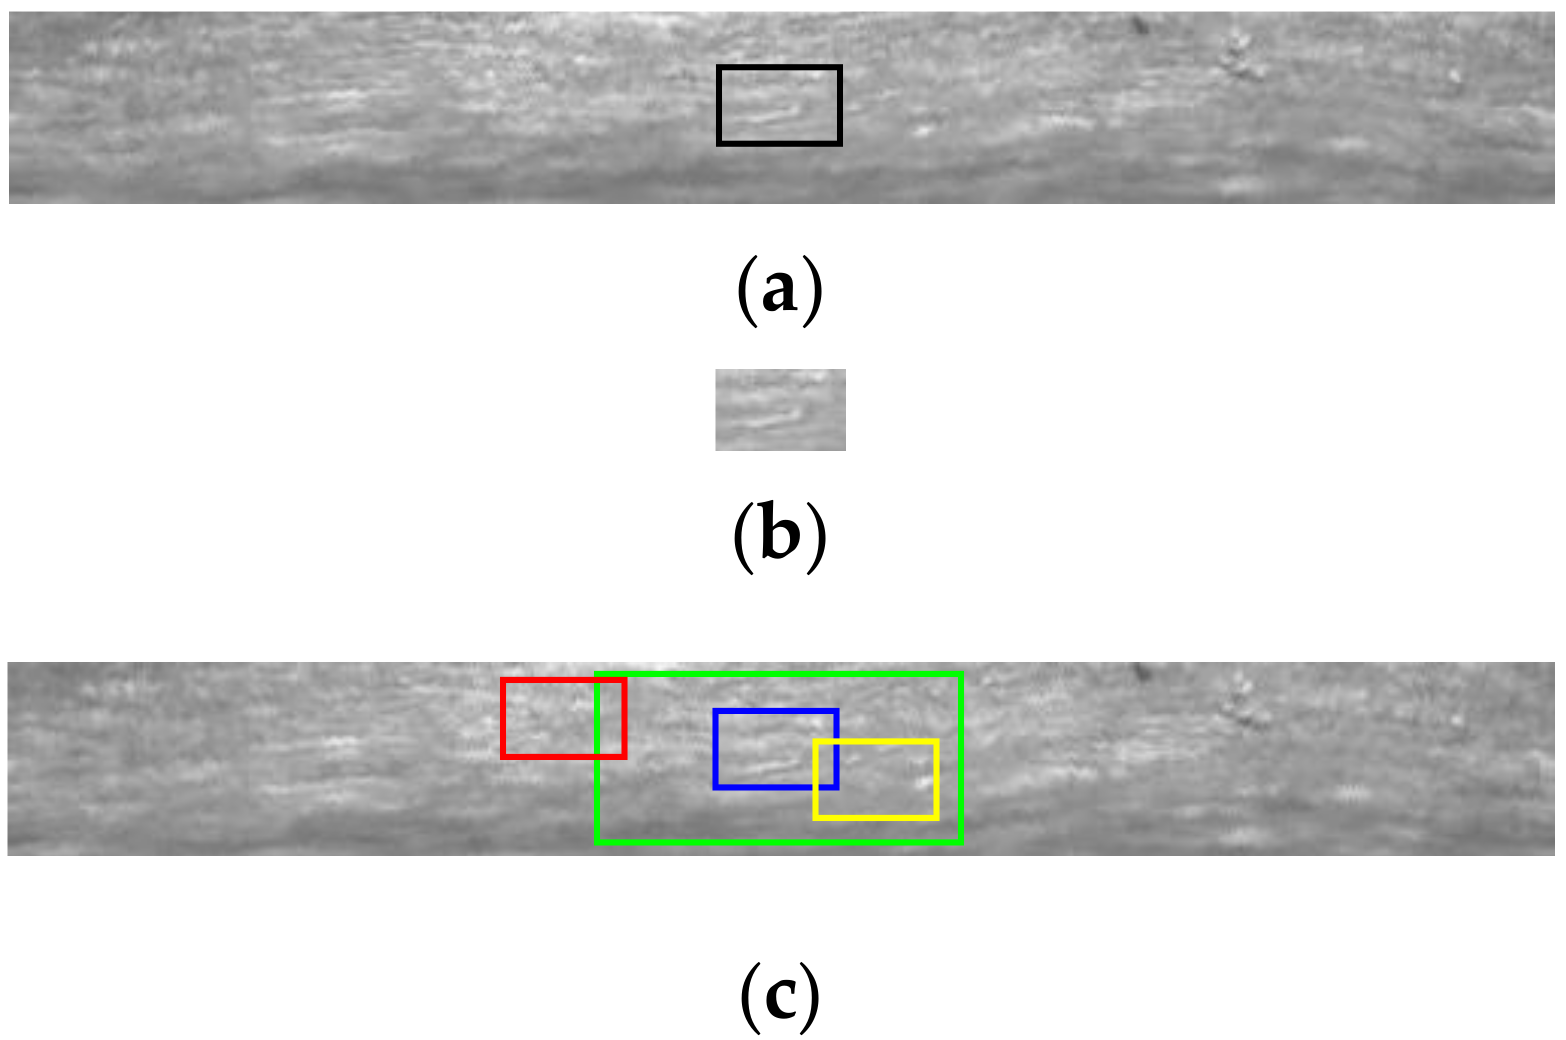
- Template selection
- Search area selection
- Similarity measure method of PTSAD
| Algorithm 1 Pseudo-code: Projection Transformation SAD (PTSAD) |
| Input: Source image Pm×n, examined image Qm×n, where m × n is the size of image. |
| Output: Horizontal offset dh, vertical offset dv. |
| 1. Set Tu×v (x, y) = Pu×v (x, y), Pu×v ∈ Pm×n, where u × v is the size of image, Search area Sa ∈ Rm×n |
| 2. Obtain: Candidate images set {C (1), C (2), …, C (k)}, with step size 1 pixel |
| 3. Compute: SAD value of Tu×v (x, y) and {C (1), C (2), …, C (k)} |
| 4. for s = 1, 2, …, k |
| 5. |
| 6. end for |
| 7. Obtain: SAD value of candidate images {CSAD (1), CSAD (2), …, CSAD (k)} |
| 8. Candidate images of three minimum SAD value: C (R), C (G), C (B), where C (R) < C (G) < C (B) |
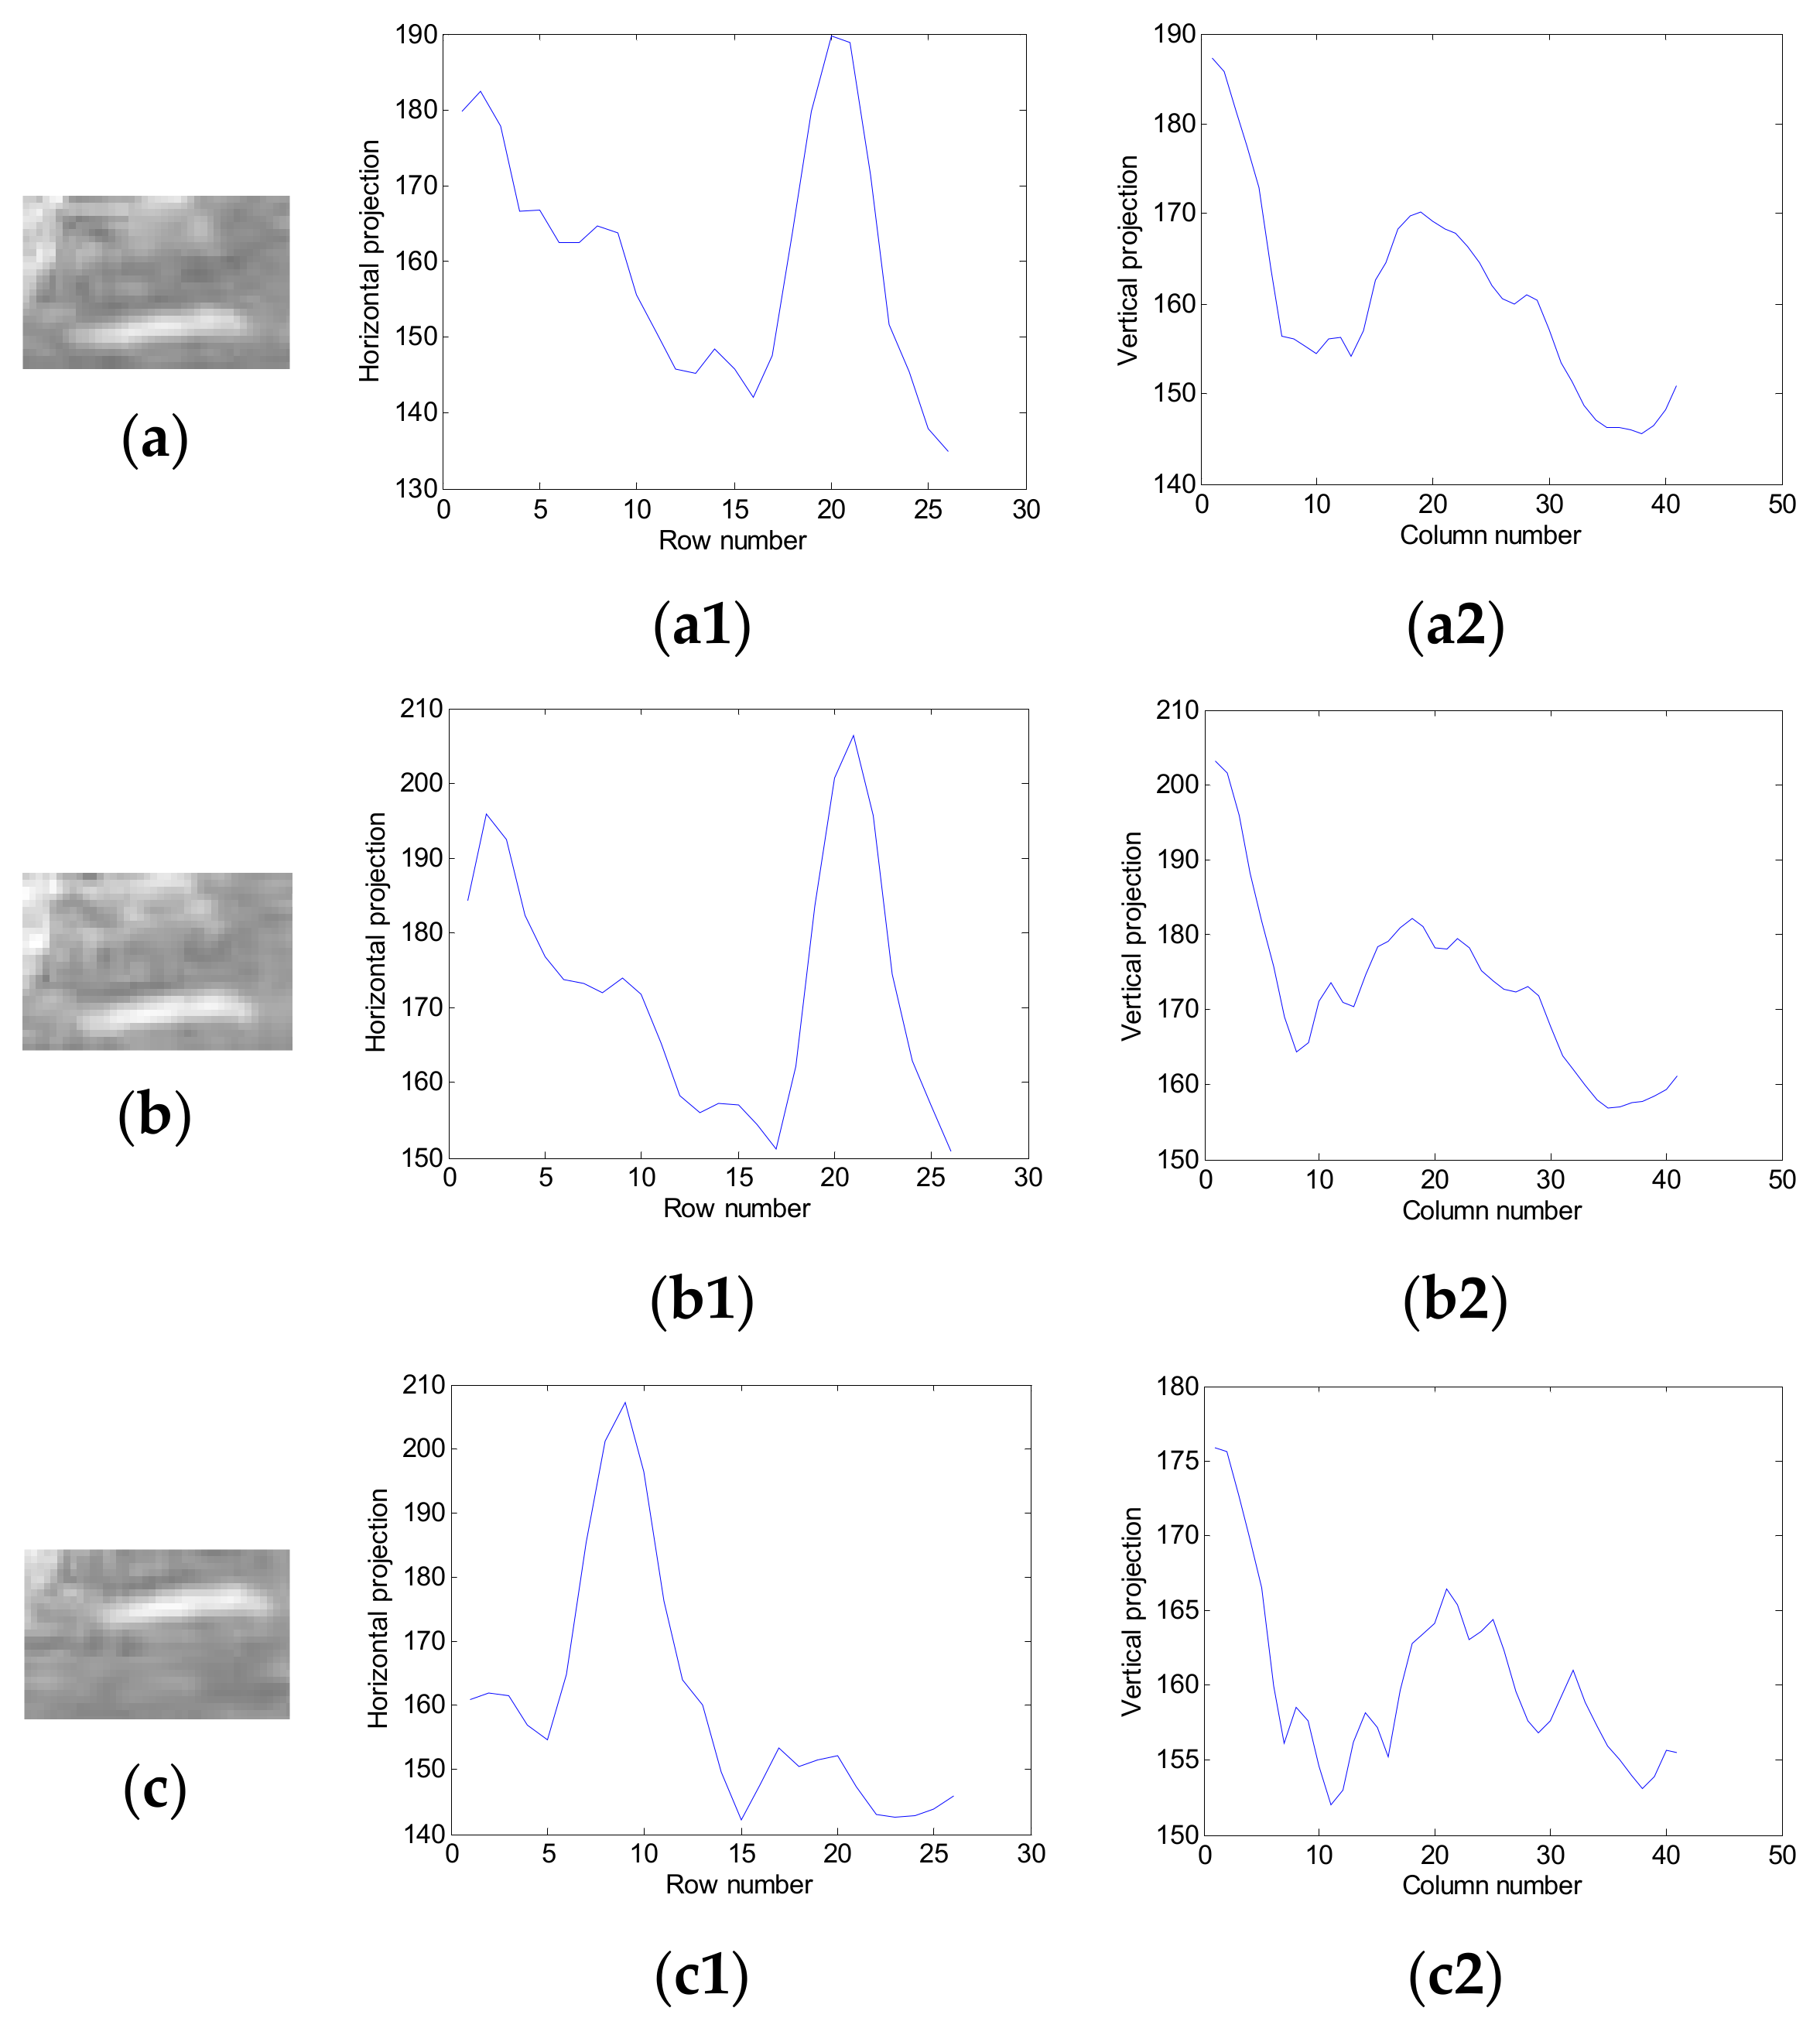
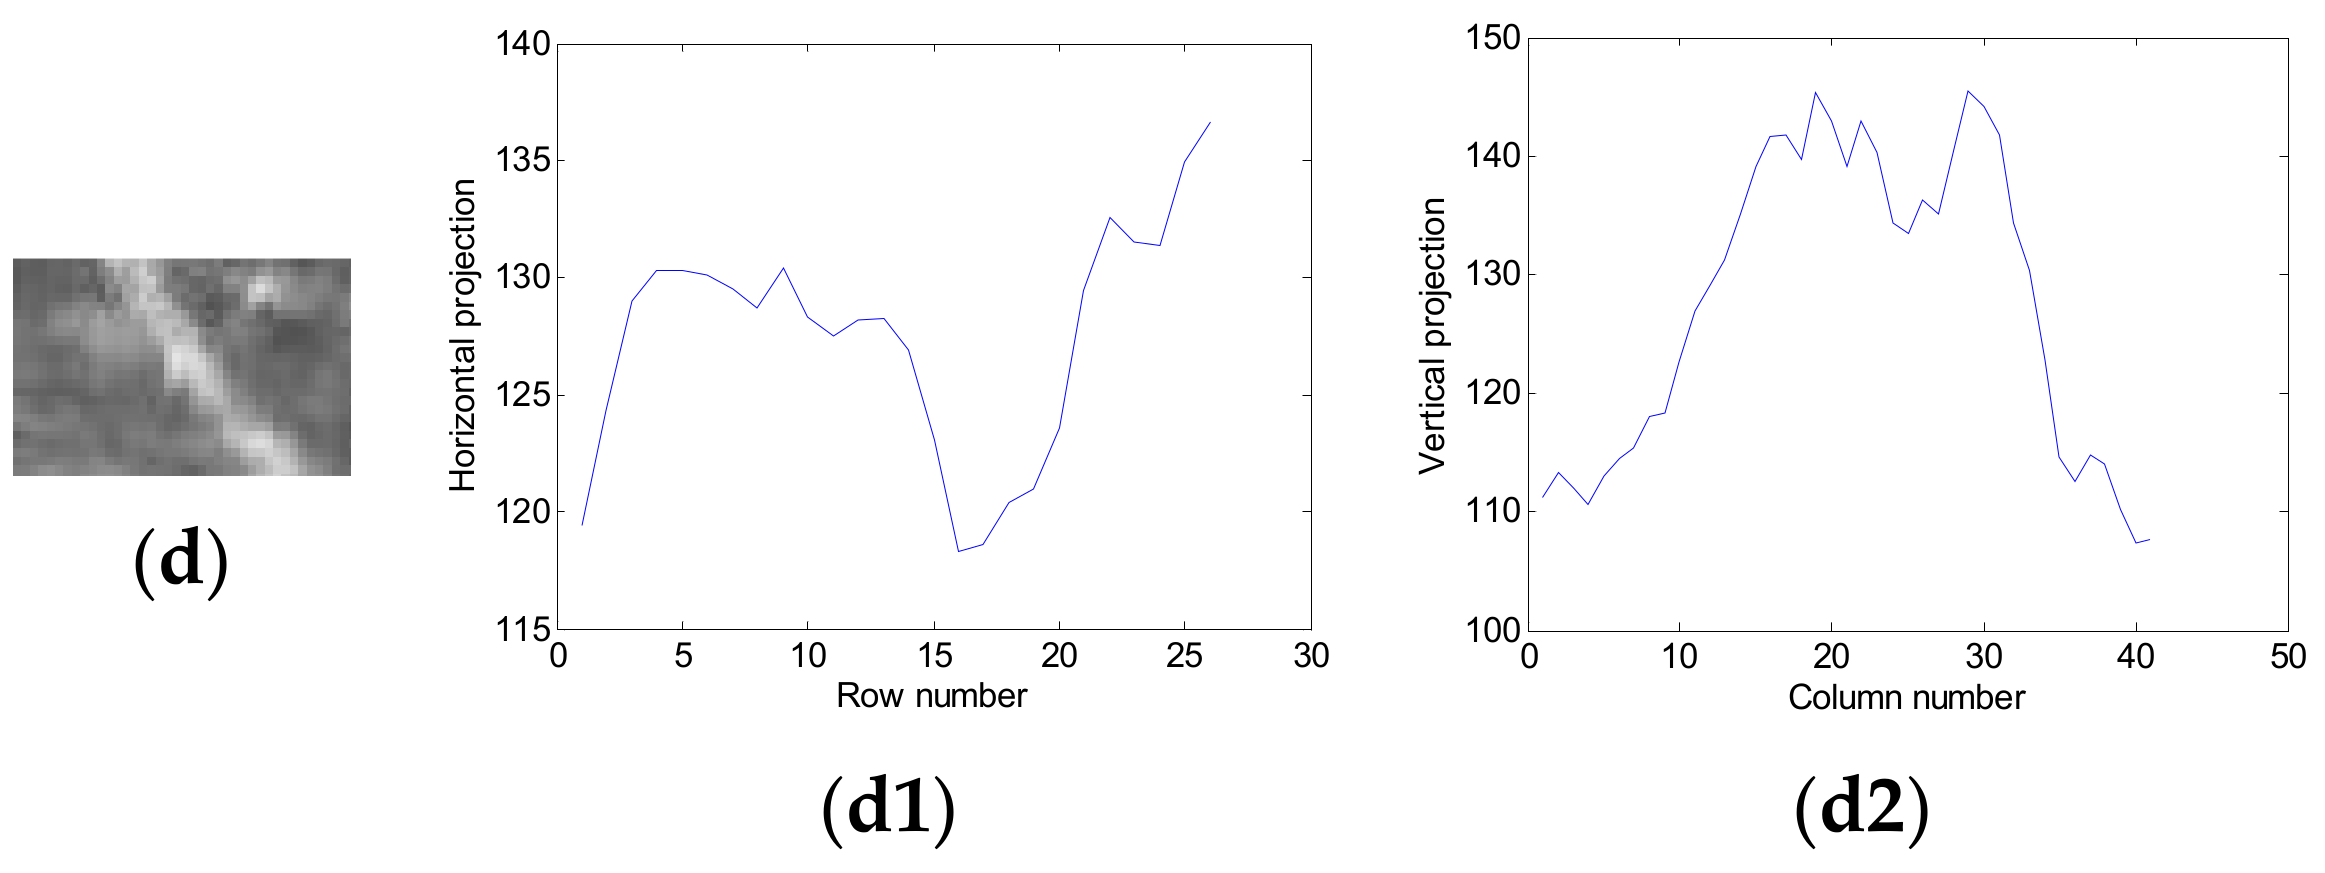
| 9. Compute: Projection vectors in X-axis of T (x, y), C (R), C (G) and C (B) |
| 10. for i = 1, 2, …, u do |
| 11. for j = 1, 2, …, v |
| 12. ; |
| 13. end for |
| 14. end for |
| 15. Obtain: Th, Ch (R), Ch (G) and Ch (B) |
| 16. Compute: Correlation coefficient |
| 17. |
| 18. Obtain: In X-axis: Rh (R), Rh (G), Rh (B), and In Y-axis: Rv (R), Rv (G), Rv (B) |
| 19. Compute: Linear constant Z |
| 20. |
| 21. Obtain: Z (R), Z (G), Z (B), where Z (B) > Z (R) > Z (G) |
| 22. Compute: Horizontal offset dh, vertical offset dv dh = |x − u|, dv = |y − v|, where (x, y) and (u, v) are the center coordinates of T (x, y) and C (B) |
4.4. Image Filtering Module
5. Experimental Results and Analysis
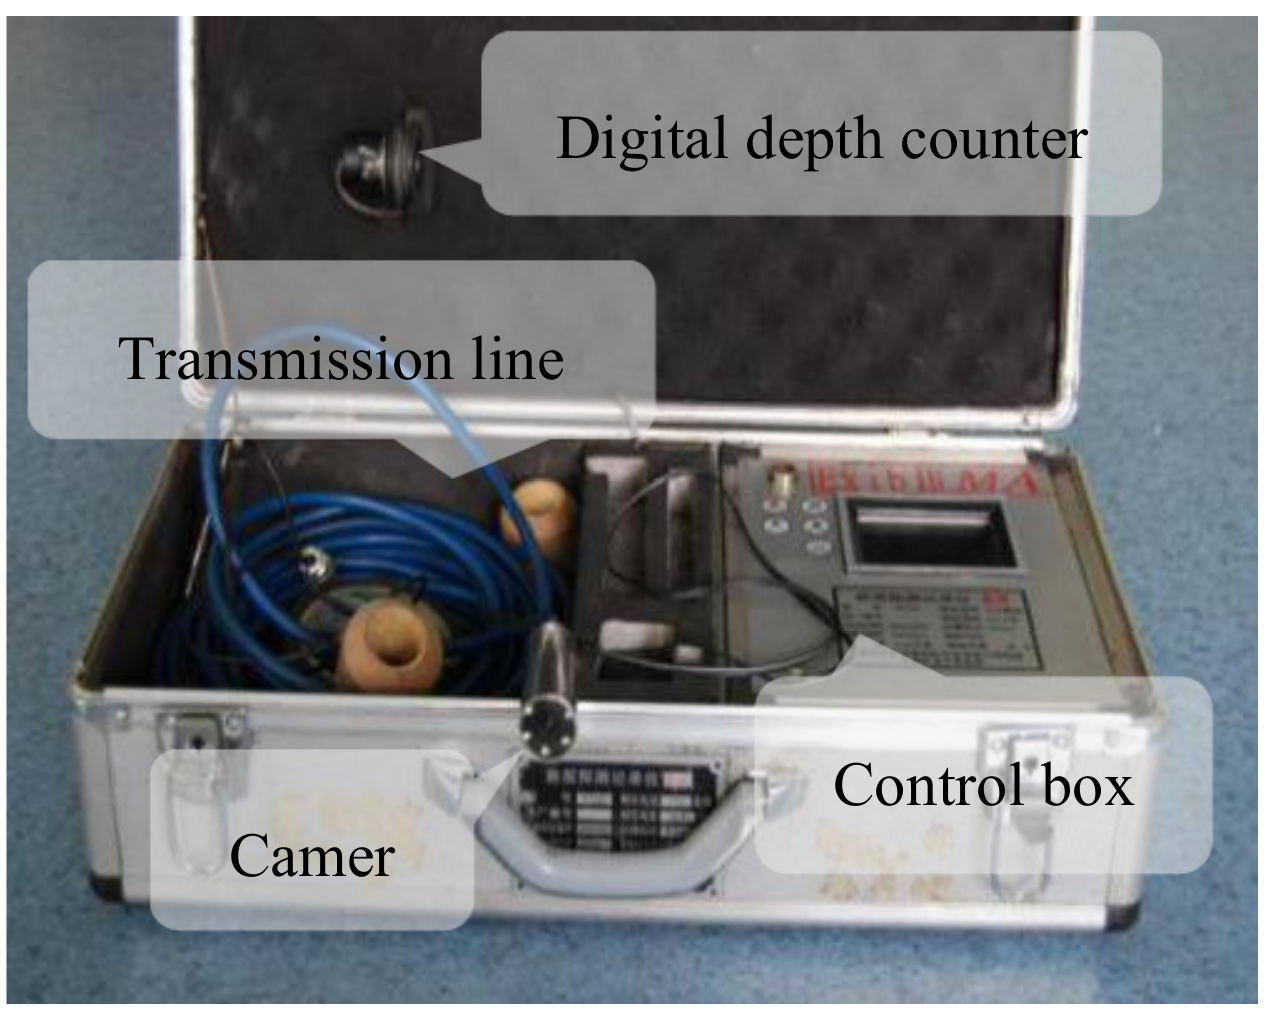
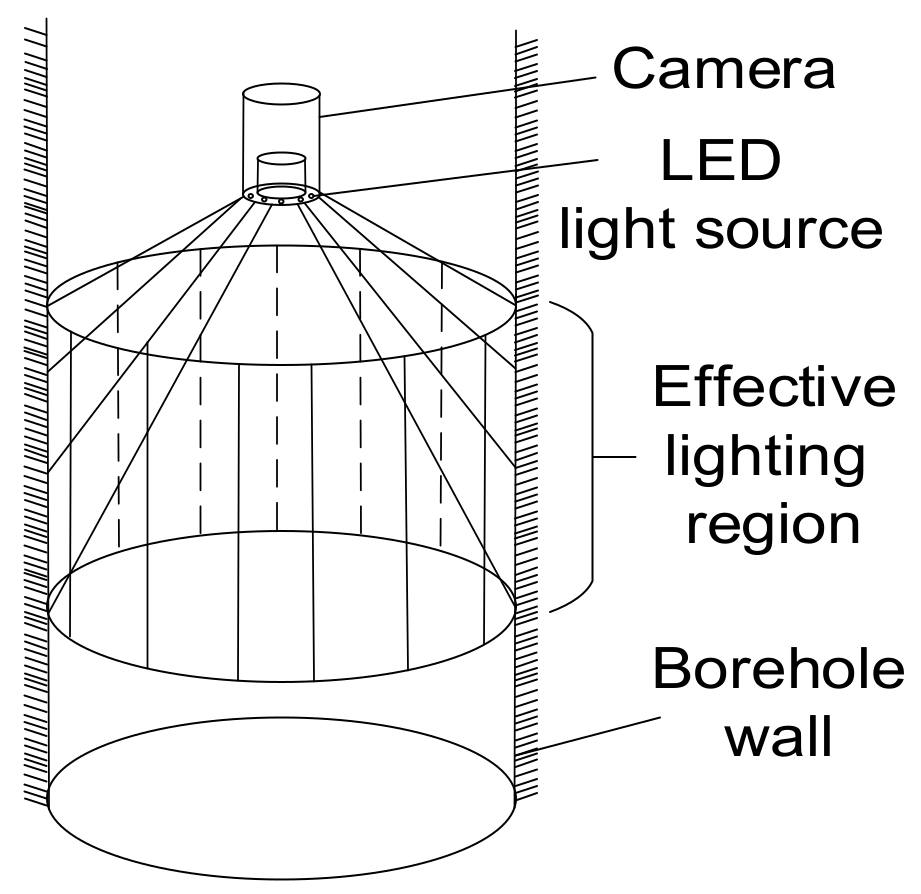
5.1. Image Acquisition System
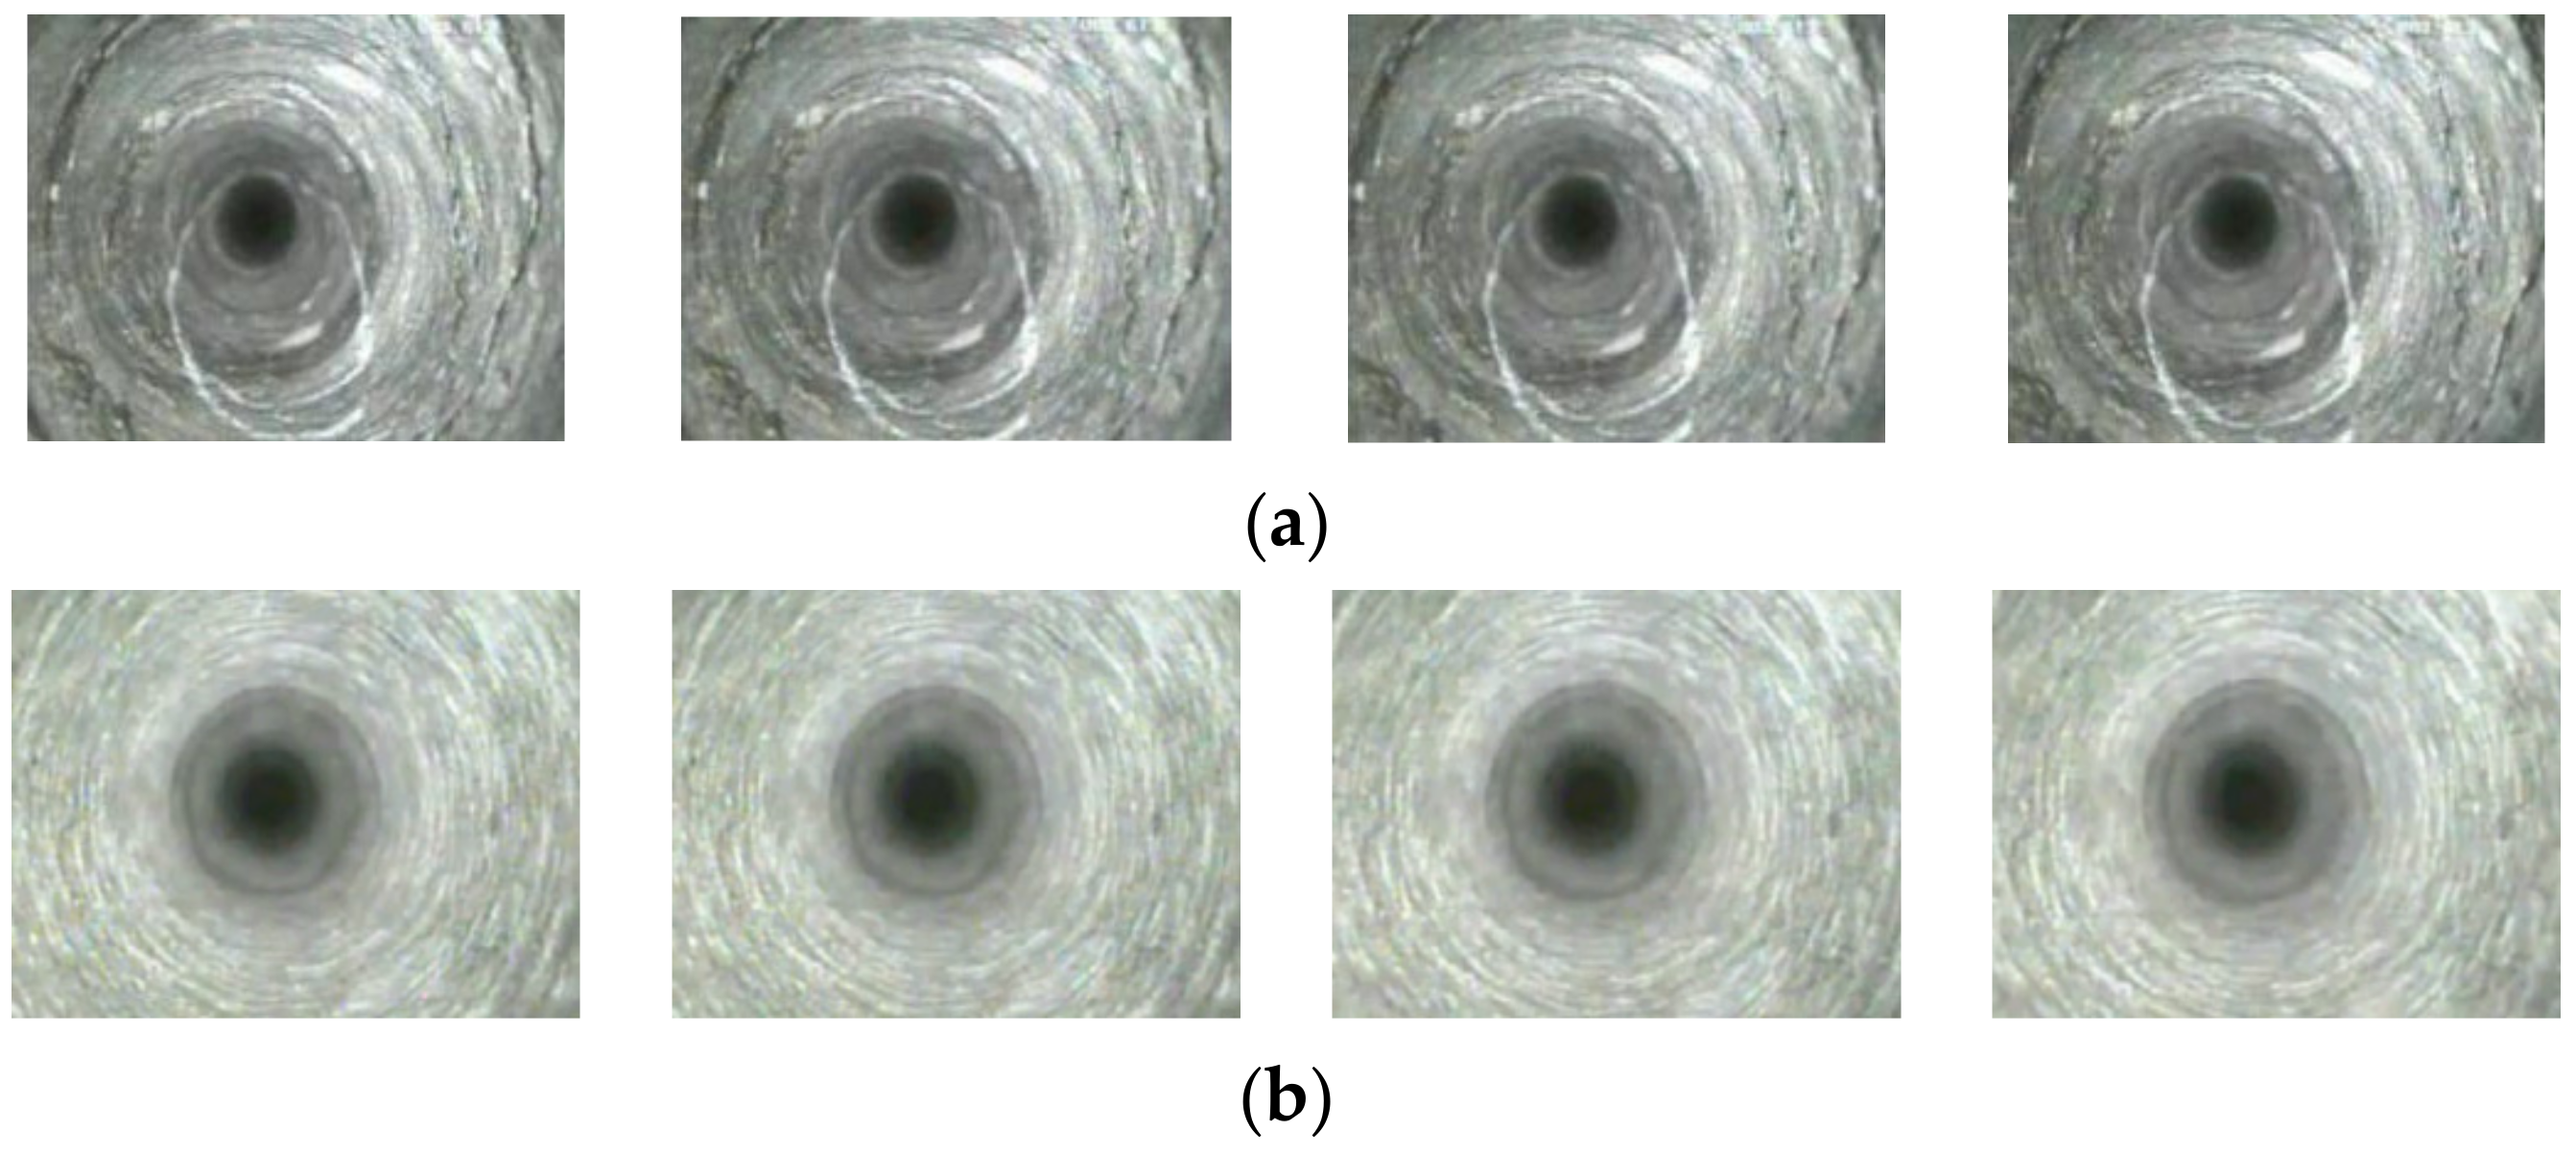
5.2. Center Positioning and Image Unwrapping Experiments
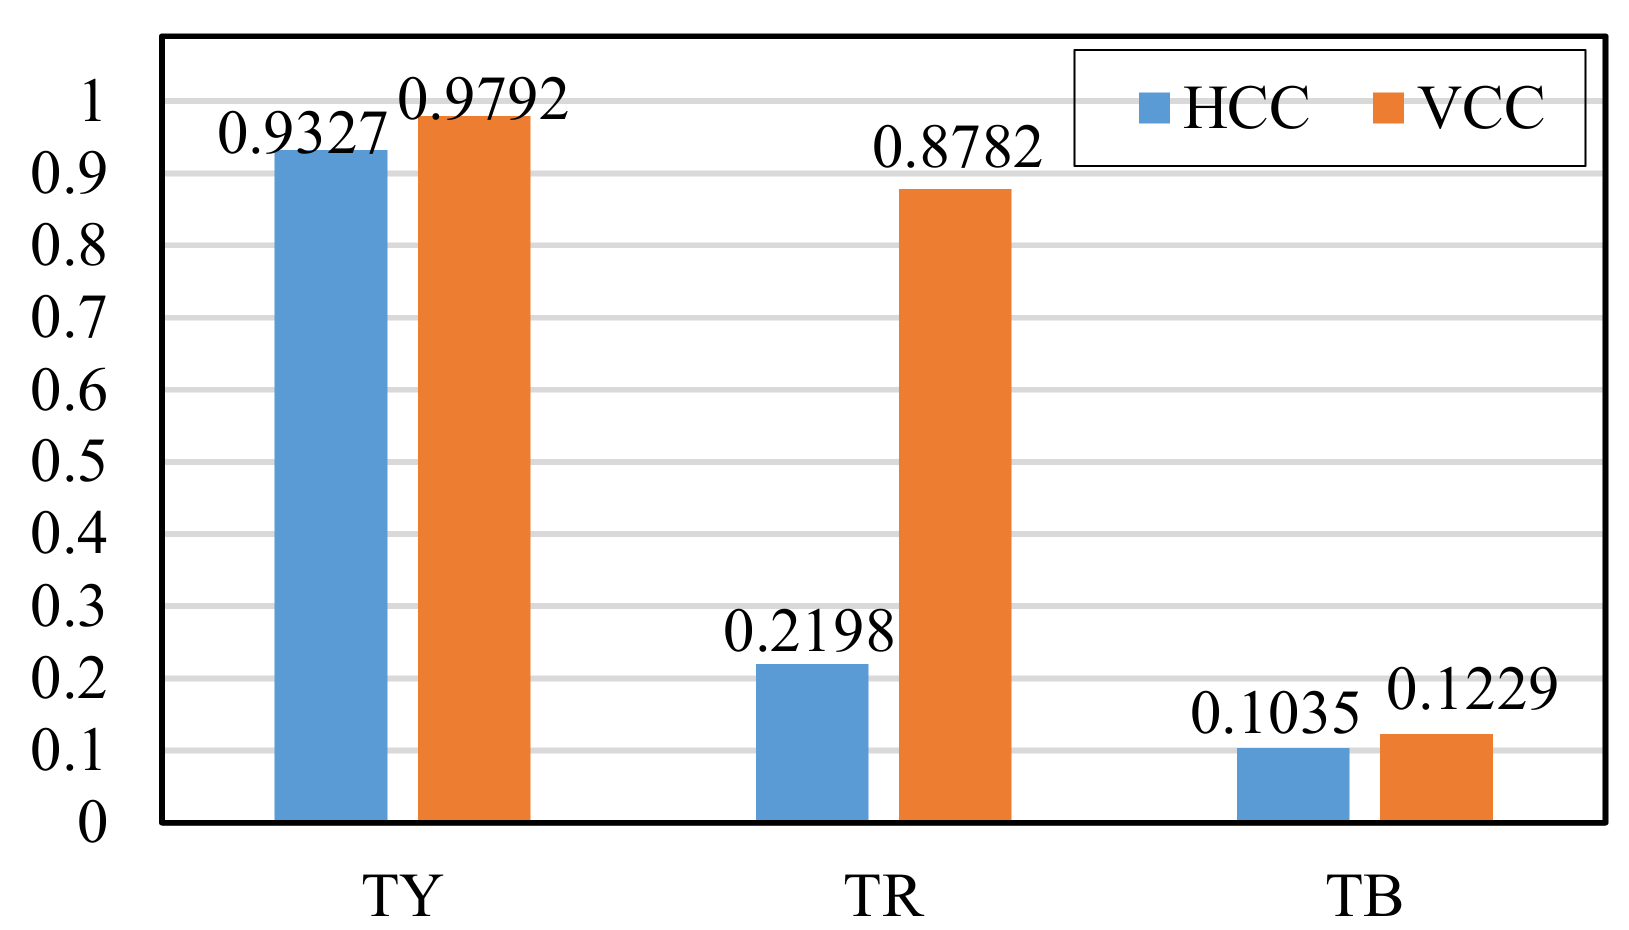
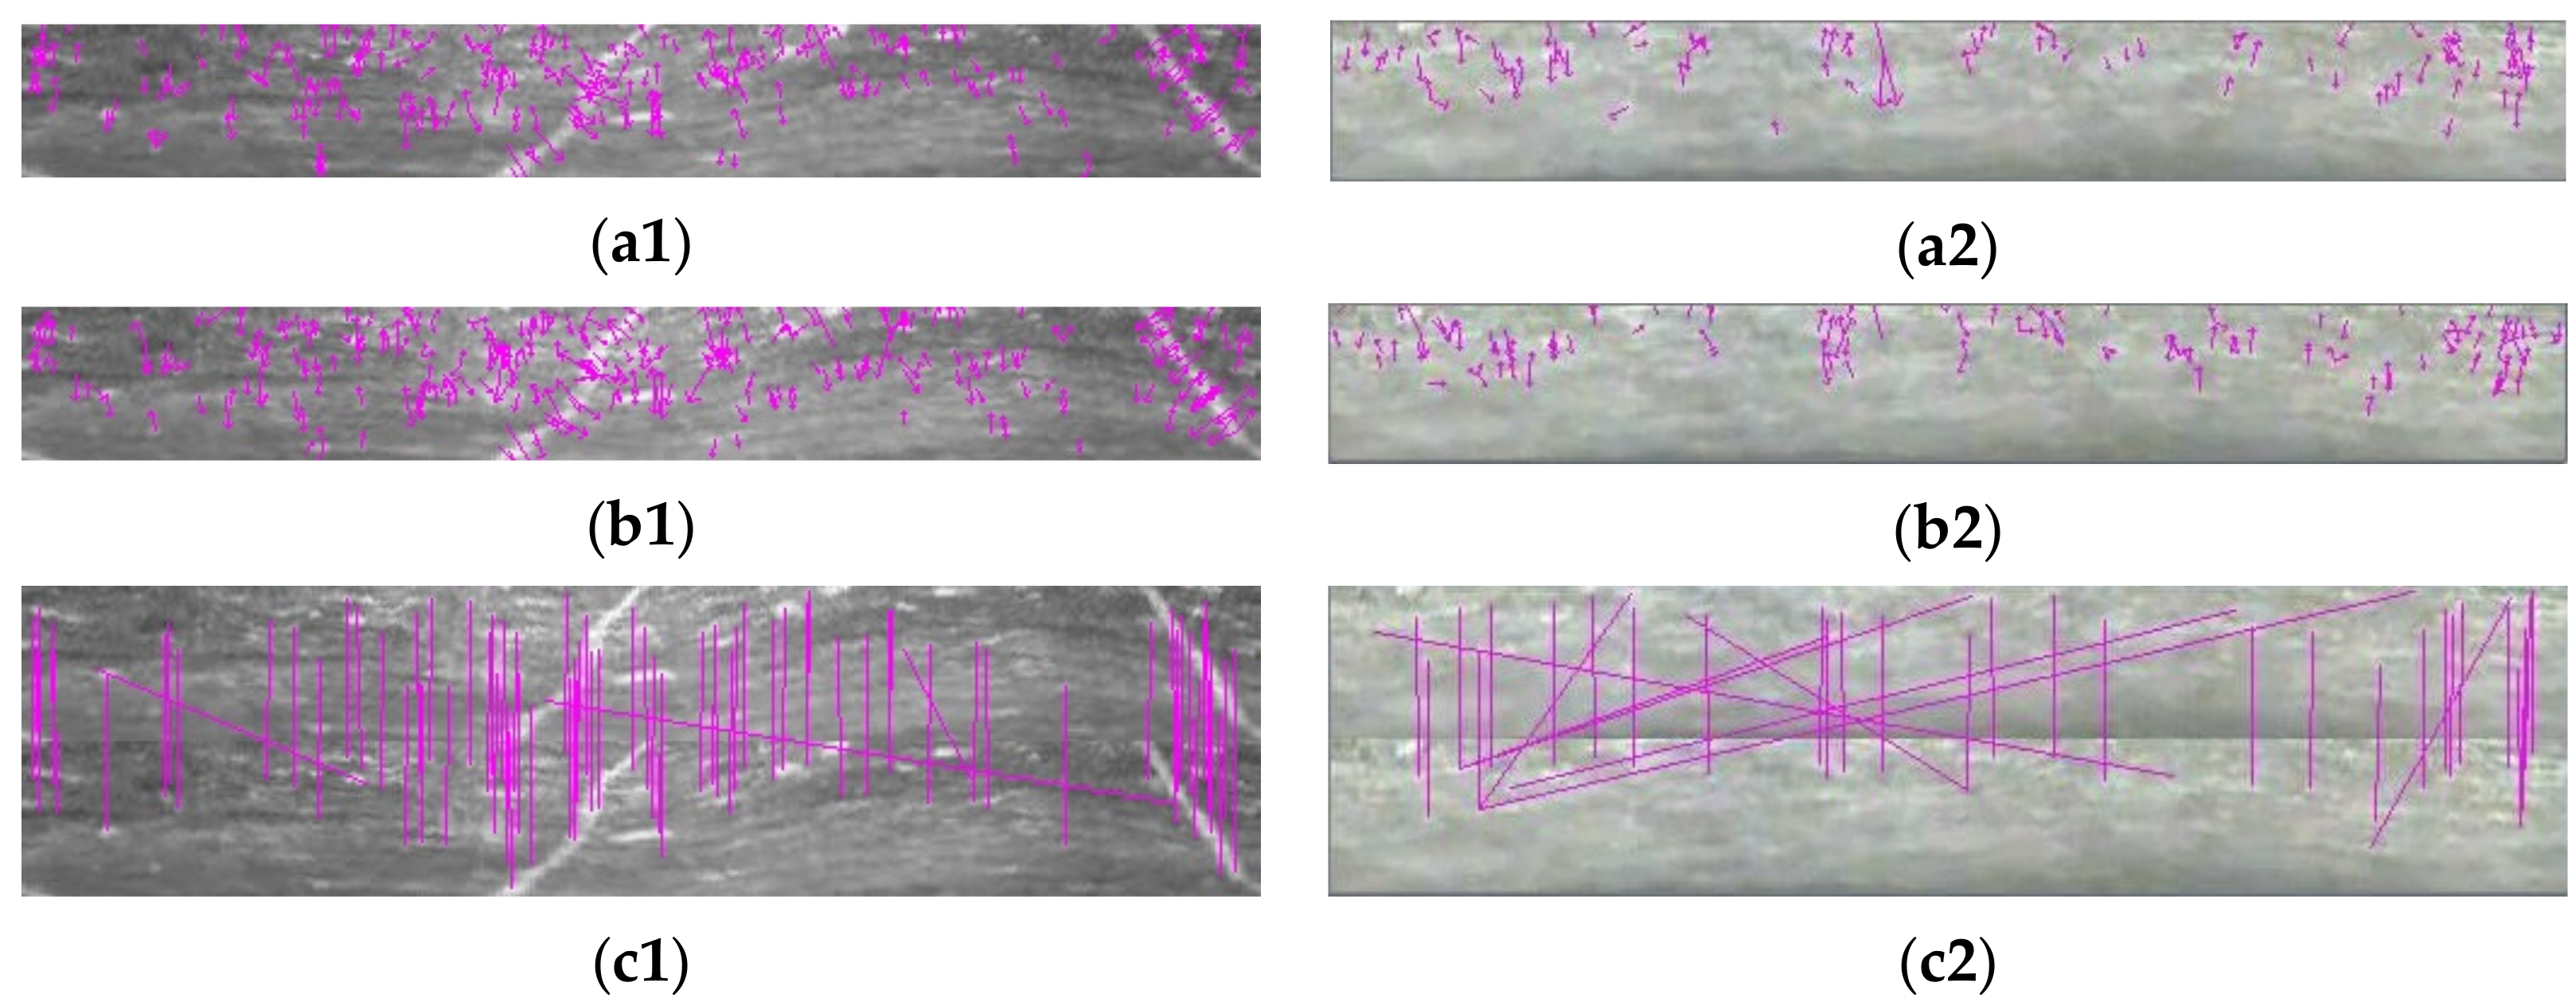
5.3. Borehole Wall Unfolded Images Matching Experiment
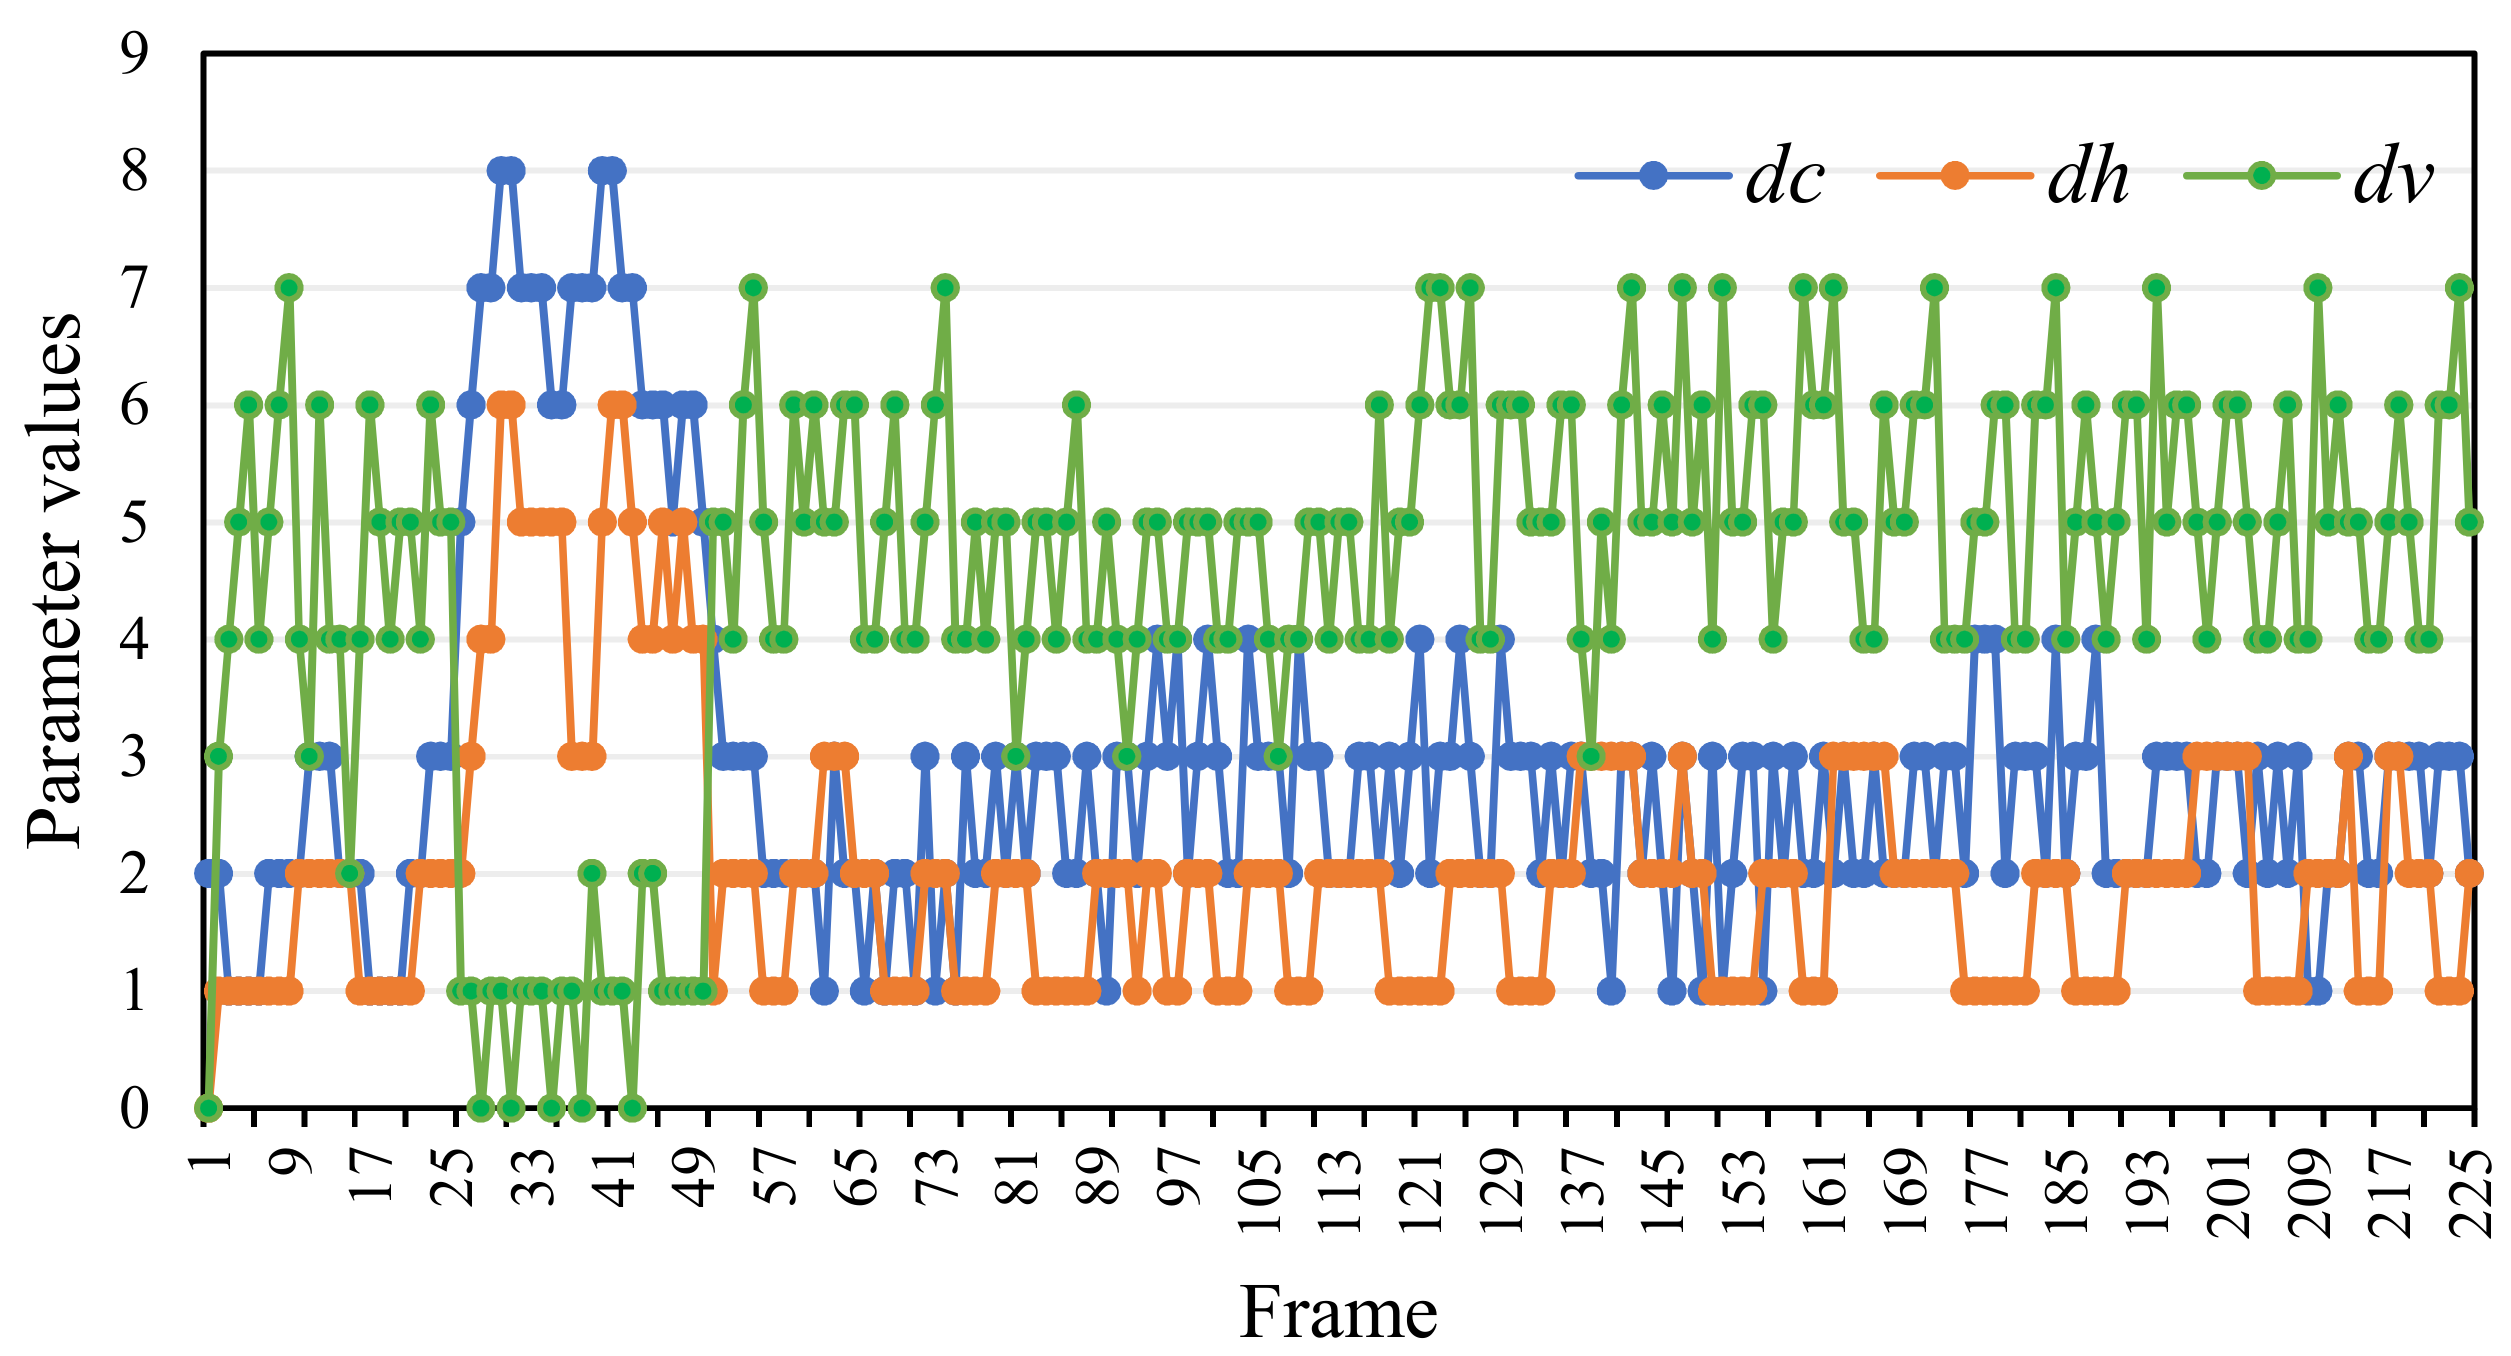
5.4. Mosaic Results of Cylindrical Panorama
- On the matching performance, considering the characteristics of the borehole-wall image sequences, the PTSAD algorithm ensures the accuracy and reliability of image matching by introducing the GPT process to the SAD. It has solved the problem of the change between the template and examined image.
- On the computing time, the PTSAD algorithm takes the optimal search area and selects the simpler SAD algorithm. Thus, its computational speed is much faster than the SIFT and full-search NCC and SAD algorithms.
6. Conclusions
Author Contributions
Funding
Conflicts of Interest
References
- Xiao, Y.; Feng, X.; Hudson, J.; Chen, B.; Feng, G.; Liu, J. ISRM suggested method for in situ microseismic monitoring of the fracturing process in rock masses. Rock Mech. Rock Eng. 2016, 49, 343–369. [Google Scholar] [CrossRef]
- Roberson, S.; Hubbard, B. Application of borehole optical televiewing to investigating the 3-D structure of glaciers: Implications for the formation of longitudinal debris ridges, midre Lovénbreen, Svalbard. J. Glaciol. 2010, 56, 143–156. [Google Scholar] [CrossRef]
- Copland, L.; Harbor, J.; Gordon, S.; Sharp, M. The use of borehole video in investigating the hydrology of a temperate glacier. Hydrol Process. 2015, 11, 211–224. [Google Scholar] [CrossRef]
- Li, S.; Feng, X.; Wang, C.; Hudson, J. ISRM Suggested Method for Rock Fractures Observations Using a Borehole Digital Optical Televiewer. Rock Mech. Rock Eng. 2013, 46, 635–644. [Google Scholar] [CrossRef]
- Kang, H.; Si, L.; Su, B. Borehole observation methods in coal and rock mass and their applications. J. China Coal Soc. 2010, 35, 1949–1956. [Google Scholar]
- Skoczylas, N.; Godyń, K. Evaluating selected lithological features using photographs taken with an introscopic camera in boreholes. Int. J. Rock Mech. Min. Sci. 2014, 72, 319–324. [Google Scholar] [CrossRef]
- Zhang, X.; Yang, Y.; Yang, T.; Yang, Y. Synthetic aperture photography using a moving camera-IMU system. Pattern Recognit. 2017, 62, 175–188. [Google Scholar] [CrossRef]
- Wu, D.; Chatzigeorgiou, D.; Youcef-Toumi, K.; Ben-Mansour, R. Node localization in robotic sensor networks for pipeline inspection. IEEE Trans. Ind. Inf. 2016, 12, 809–819. [Google Scholar] [CrossRef]
- Tezerjani, A.; Mehrandezh, M.; Paranjape, R. Optimal Spatial Resolution of Omnidirectional Imaging Systems for Pipe Inspection Applications. Int. J. Optomechatron. 2015, 9, 261–294. [Google Scholar] [CrossRef] [Green Version]
- Rousso, B.; Peleg, S.; Finci, I. Mosaicing with Generalized Strips. In Proceedings of the Darpa Image Understanding Workshop, New Orleans, LA, USA, 11–14 May 1997. [Google Scholar]
- Niu, C.; Zhong, F.; Xu, S.; Yang, C.; Qin, X. Cylindrical panoramic mosaicing from a pipeline video through MRF based optimization. Vis. Comput. 2013, 29, 253–263. [Google Scholar] [CrossRef]
- Zhou, W.; Lu, J.; Zhou, O.; Chen, Y. Ray-tracing-based reconstruction algorithms for digital breast tomosynthesis. J. Electron. Imaging 2015, 24, 023028. [Google Scholar] [CrossRef]
- Chong, N.; Kho, Y.; Mou, L. A closed form unwrapping method for a spherical omnidirectional view sensor. Eurasip J. Image Video Process. 2013, 5, 279–342. [Google Scholar] [CrossRef]
- Chen, L.; Zhang, M.; Xiong, Z. Series-parallel pipeline architecture for high-resolution catadioptric panoramic unwrapping. IET Image Process. 2010, 4, 403–412. [Google Scholar] [CrossRef]
- Dwivedi, R.; Dey, S.; Singh, R.; Prasad, A. A privacy-preserving cancelable iris template generation scheme using decimal encoding and look-up table mapping. Comput. Secur. 2016, 65, 373–386. [Google Scholar] [CrossRef]
- Zhang, Z.; Li, K.; Hu, B.; Pu, B.; Li, J.; Jiang, Z. Research on high resolution & high sensitivity panoramic surveillance system. In Proceedings of the IEEE International Conference on Advanced Video and Signal Based Surveillance, Seoul, Korea, 26–29 August 2014; pp. 154–158. [Google Scholar]
- Zaid, A.; Hai, J.; Ayad, I. SEPIM: Secure and Efficient Private Image Matching. Appl. Sci. 2016, 6, 213. [Google Scholar]
- Yang, D.; Zhang, M.; Chang, X. A method to detect landmark pairs accurately between intra-patient volumetric medical images. Med. Phys. 2017, 44, 5859–5872. [Google Scholar] [CrossRef] [PubMed] [Green Version]
- Shang, X.D.; Zhao, J.H.; Zhang, H.M. Obtaining High-Resolution Seabed Topography and Surface Details by Co-Registration of Side-Scan Sonar and Multibeam Echo Sounder Images. Remote Sens. 2019, 11, 1496. [Google Scholar] [CrossRef]
- González, A.; Cuevas, E.; Fausto, F.; Valdivia, A.; Rojas, R. A template matching approach based on the behavior of swarms of locust. Appl. Intell. 2017, 47, 1087–1098. [Google Scholar] [CrossRef]
- Chantara, W.; Mun, J.; Shin, D.; Ho, Y. Object tracking using adaptive template matching. IEIE Trans. Smart Process. Comput. 2015, 4, 1–9. [Google Scholar] [CrossRef]
- Wang, B.; Peng, J.; Wu, X. Automatic Matching of Multi-Source Satellite Images: A Case Study on ZY-1-02C and ETM+. Appl. Sci. 2017, 7, 1066. [Google Scholar] [CrossRef]
- Jia, D.; Cao, J.; Song, W.; Tang, X. Colour fast (CAST) match: Fast affine template matching for colour images. Electron. Lett. 2016, 52, 1220–1221. [Google Scholar] [CrossRef]
- Chung, K.; Chiu, C.; Yu, T.; Huang, P. Temporal and spatial correlation-based reversible data hiding for RGB CFA videos. Inf. Sci. 2017, 420, 386–402. [Google Scholar] [CrossRef]
- Zhang, Q.; Gao, H.; Kang, Z. Fast template matching with partial skipping using sub-template. In Proceedings of the International Conference on Audio, Language and Image Processing IEEE, Shanghai, China, 16–18 July 2012; pp. 889–892. [Google Scholar]
- Zhang, X.; Zhao, H.; Li, X.; Feng, Y.; Li, H. A multi-scale 3D Otsu thresholding algorithm for medical image segmentation. Digit. Signal Process. 2016, 60, 186–199. [Google Scholar]
- Ahn, I.; Kim, C. Face and Hair Region Labeling Using Semi-Supervised Spectral Clustering-Based Multiple Segmentations. IEEE Trans. Multimed. 2016, 18, 1414–1421. [Google Scholar] [CrossRef]
- Santosh, K.; Wendling, L.; Antani, S.; Thoma, G. Overlaid arrow detection for labeling regions of interest in biomedical images. IEEE Intell. Syst. 2016, 31, 66–75. [Google Scholar] [CrossRef]
- Araki, S.; Maeda, K.; Shibata, K.; Horita, Y. High quality panoramic image generation using multiple panoramic annular lens images. In Proceedings of the IEEE International Conference on Image Processing, Hong Kong, China, 26–29 September 2010; pp. 1213–1216. [Google Scholar]
- Zhou, R.; Hu, W.; Ping, F.; Hou, I. Quantum realization of the bilinear interpolation method for NEQR. Sci. Rep. 2017, 7, 2511–2528. [Google Scholar] [CrossRef] [PubMed]
- Chae, J.; Lee, J.; Lee, M.; Han, J.; Nguyen, T.; Yeo, W. Cubic convolution scaler optimized for local property of image data. IEEE Trans. Image Process. A Publ. IEEE Signal Process. Soc. 2015, 24, 4796–4809. [Google Scholar] [CrossRef] [PubMed]
- Penate-Sanchez, A.; Porzi, L.; Moreno-Noguer, F. Matchability Prediction for Full-Search Template Matching Algorithms. In Proceedings of the International Conference on 3d Vision IEEE Computer Society, Lyon, France, 19–22 October 2015; pp. 353–361. [Google Scholar]
- Korman, S.; Reichman, D.; Tsur, G. Fast-Match: Fast Affine Template Matching. Int. J. Comput. Vis. 2017, 121, 111–125. [Google Scholar] [CrossRef]
- Putra, A.; Mochammad, F.; Herdian, H. FPGA implementation of template matching using binary sum of absolute difference. In Proceedings of the International Conference on System Engineering and Technology IEEE, Bandung, Indonesia, 3–4 October 2017; pp. 13–17. [Google Scholar]
- Li, S.; Qi, J. Image stabilization by combining gray-scale projection and representative point matching algorithms. In Proceedings of the International Conference on Awareness Science and Technology IEEE, Dalian, China, 27–30 September 2011; pp. 128–132. [Google Scholar]
- Zhang, G.; Zeng, Z.; Zhang, S.; Zhang, Y.; Wu, W. Sift matching with CNN evidences for particular object retrieval. Neurocomputing 2017, 238, 399–409. [Google Scholar] [CrossRef]
- Jia, L.; Tsui, C.Y.; Au, O.C. A Low-Power Motion Estimation Architecture for HEVC Based on a New Sum of Absolute Difference Computation. IEEE Trans. Circuits Syst. Video Technol. 2018, 99. [Google Scholar] [CrossRef]
- Hongzhi, W.; Dongsheng, Z.; Xufeng, W. Visual Exploration of the Spatiotemporal Evolution Law of Overburden Failure and Mining-Induced Fractures: A Case Study of the Wangjialing Coal, Mine in China. Minerals 2017, 7, 35. [Google Scholar]
- Młynarczuk, M.; Habrat, M.; Skoczylas, N. The application of the automatic search for visually similar geological layers in a borehole in introscopic camera recordings. Measurement 2016, 85, 142–151. [Google Scholar] [CrossRef]
- Qingsheng, B.; Shihao, T. A General Review on Longwall Mining-Induced Fractures in Near-Face Regions. Geofluids 2019, 3089292. [Google Scholar] [CrossRef]
- Palchik, V. In situ study of intensity of weathering-induced fractures and methane emission to the atmosphere through these fractures. Eng. Geol. 2012, 125, 56–65. [Google Scholar] [CrossRef]


| Device | Probe Diameter (mm) | CCD Pixels | Color (Bits) | Borehole Diameter (mm) | Test Velocity (m/min) |
|---|---|---|---|---|---|
| DPBCS [4] | 45 | 795 × 596 | 16/24 | 48–180 | 1.5 |
| AVBCS [5] | 25 | 320 × 240 | 16/24 | 28–250 | 0.8 |
| Introscopic camera [6] | 50 | 1280 × 720 | 16/24 | >60 | \ |
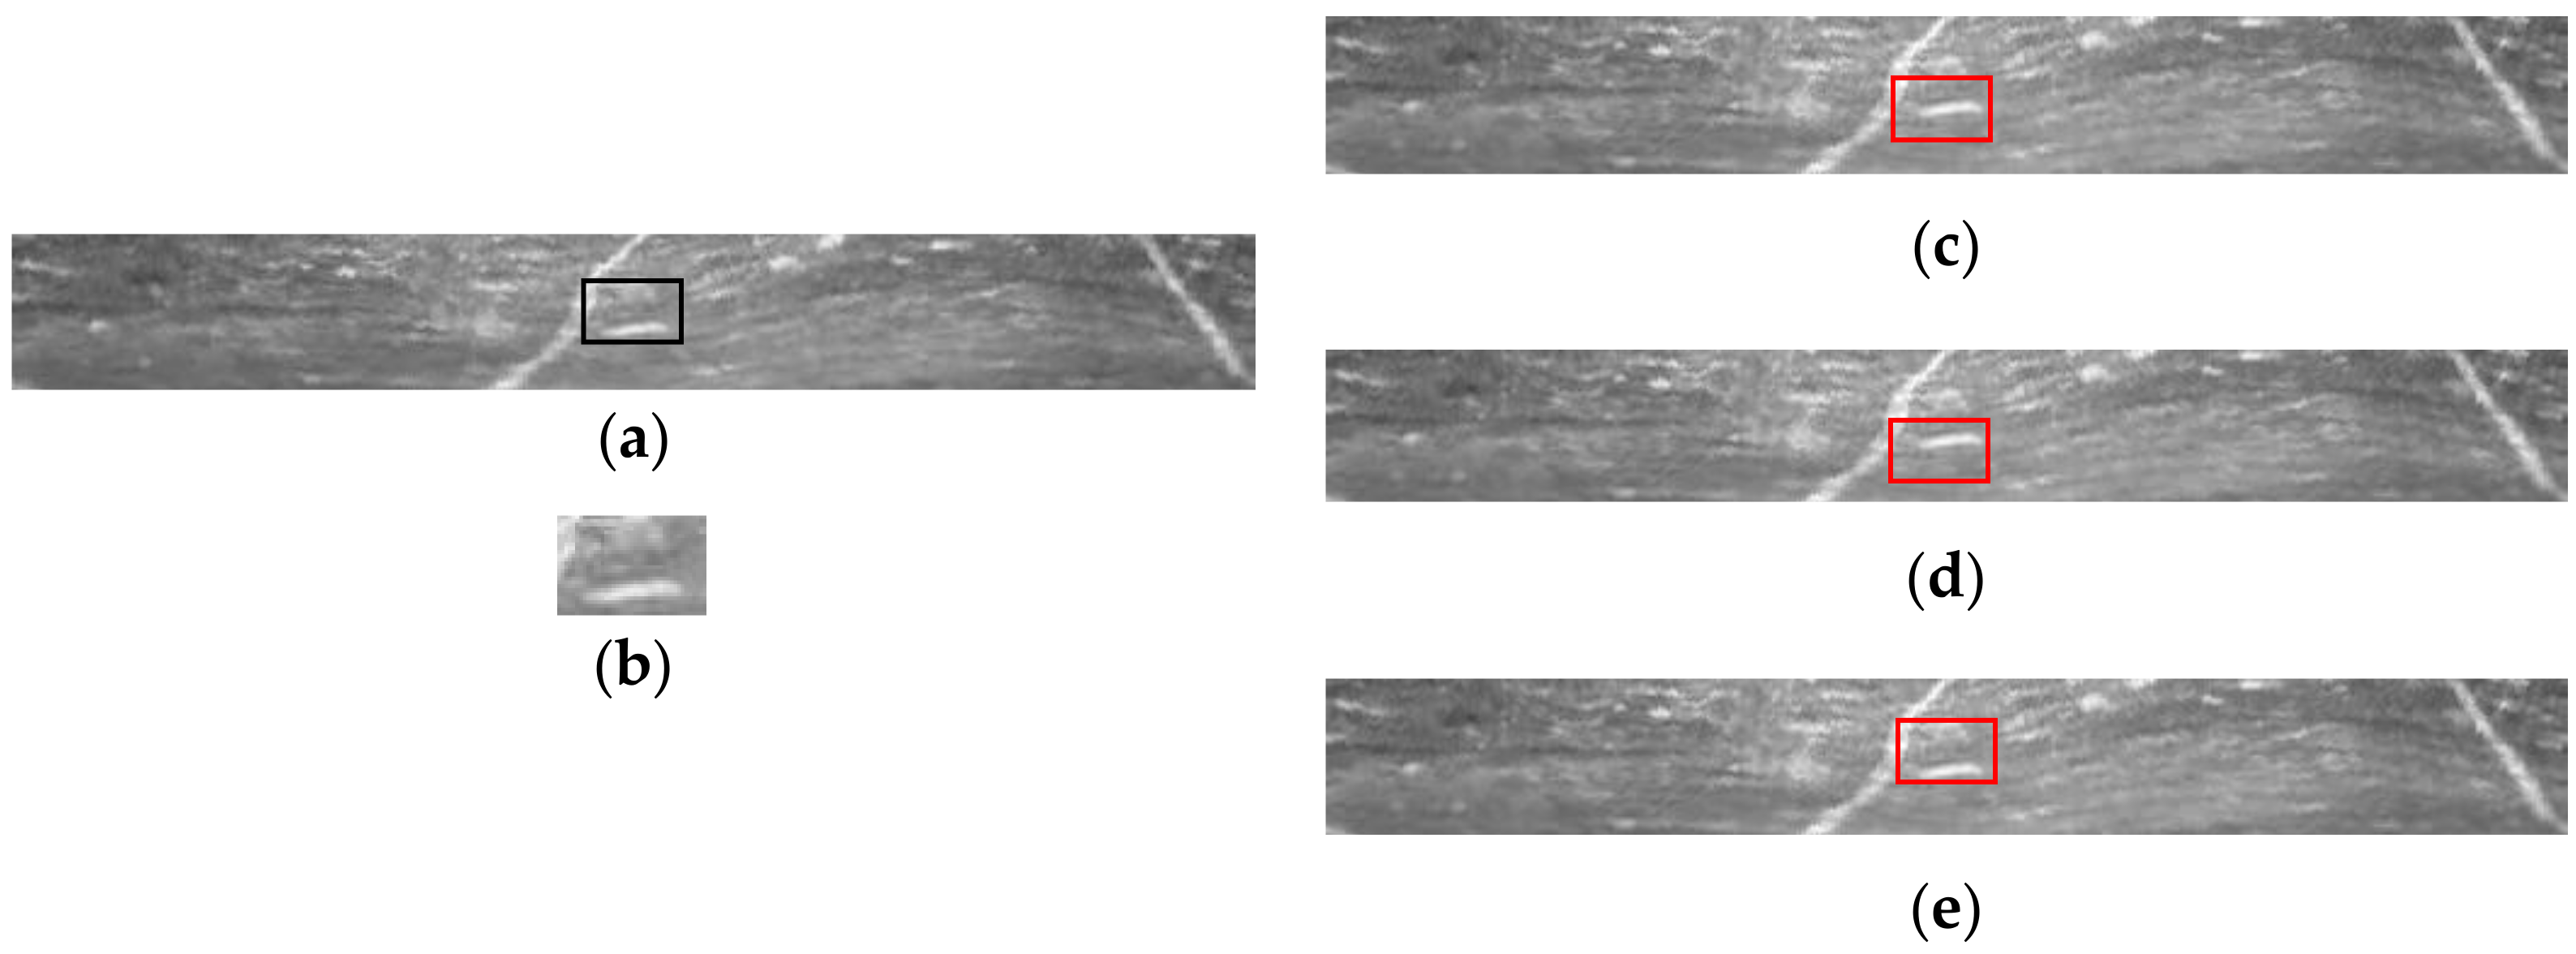
| Image | X-Coordinate | Y-Coordinate | dc |
|---|---|---|---|
| Figure 14a | 142 | 111 | 3 |
| Figure 14b | 143 | 109 | 3 |
| Figure 14c | 148 | 109 | 3 |
| Method | Exec. Time (s) | False Matching Rate (%) |
|---|---|---|
| SIFT | 303 | 19 |
| Full-search NCC | 267 | 45 |
| Full-search SAD | 154 | 59 |
| Proposed PTSAD | 53 | 0 |
| Method | Exec. Time (s) | False Matching Rate (%) |
|---|---|---|
| SIFT | 802 | 23 |
| Full-search NCC | 698 | 39 |
| Full-search SAD | 413 | 46 |
| Proposed PTSAD | 134 | 0 |
© 2019 by the authors. Licensee MDPI, Basel, Switzerland. This article is an open access article distributed under the terms and conditions of the Creative Commons Attribution (CC BY) license (http://creativecommons.org/licenses/by/4.0/).
Share and Cite
Deng, Z.; Cao, M.; Geng, Y.; Rai, L. Generating a Cylindrical Panorama from a Forward-Looking Borehole Video for Borehole Condition Analysis. Appl. Sci. 2019, 9, 3437. https://doi.org/10.3390/app9163437
Deng Z, Cao M, Geng Y, Rai L. Generating a Cylindrical Panorama from a Forward-Looking Borehole Video for Borehole Condition Analysis. Applied Sciences. 2019; 9(16):3437. https://doi.org/10.3390/app9163437
Chicago/Turabian StyleDeng, Zhaopeng, Maoyong Cao, Yushui Geng, and Laxmisha Rai. 2019. "Generating a Cylindrical Panorama from a Forward-Looking Borehole Video for Borehole Condition Analysis" Applied Sciences 9, no. 16: 3437. https://doi.org/10.3390/app9163437