Article

Moisture Buffering of Multilayer Internal Wall Assemblies at the Micro Scale: Experimental Study and Numerical Modelling

by
Dobrosława Kaczorek
Building Research Institute, Department of Thermal Physics, Acoustics and Environment, ul. Filtrowa 1, 00-611 Warszawa, Poland
Appl. Sci. 2019, 9(16), 3438; https://doi.org/10.3390/app9163438
Submission received: 24 July 2019 / Revised: 14 August 2019 / Accepted: 17 August 2019 / Published: 20 August 2019

Abstract

:
In this paper, a series of experiments assessing the moisture buffer value (MBV) of four internal wall assembly samples made from hygroscopic materials was performed. A modified Nordtest protocol was used. Moisture buffer values of all the investigated wall assemblies, with varying moisture loads in the range of 50% to 80%, showed a moderate moisture buffer value (MBV: 0.5–1.0 (g·m−2·%RH−1)). The results showed that in a wall assembly where the MBV of the whole assembly is lower than the MBV of the outer layers, the moisture-buffering capacity of the inner layer is untapped. Outer layers affect inner layers by changing their moisture-buffering capacity, which in turn changes the overall performance of the whole assembly. In addition, it was observed that if the penetration depth value of the outer layer is greater than its thickness, vapour reaches into the deeper layer and wall assemblies made of layers with materials characterized by a lower value of penetration depth reach steady state more slowly. The WUFI Pro tool was used to compare the simulated and experimental results. Despite the discrepancies between these results, it offers a simplified method, helping designers make decisions about which materials to choose to improve the moisture-buffering effect.

1. Introduction

The new Energy Performance of Buildings Directive (EPBD) [1] promotes sustainable, economical and comfortable buildings for their residents. There are requirements for lower energy consumption, and more attention is being given to the use of hygroscopic materials from renewable sources [2,3], which are characterized by a lower negative impact on the environment. User comfort and indoor air quality have become important parameters to take into account when choosing building materials [4]. This approach is also promoted by green building rating tools as the Building Research Establishment Environmental Assessment System (BREEAM), Leadership in Energy and Environmental Design (LEED) or voluntary standards such as Passive House. Therefore, research on renewable, hygroscopic materials has acquired much more importance than in the past.
In recent years, numerous studies of hygric materials have been conducted, showing that these materials can contribute to improvements in indoor air quality by passively controlling the indoor humidity level [5,6,7] and reducing energy consumption [8,9]. These materials usually have very good moisture-buffering capacities; they can effectively take up and release moisture from the air when they are exposed to different moisture loads [10].
The literature reports several studies, conducted at the materials scale, where the moisture buffering was quantified using the moisture buffer value (MBV). At the Technical University of Denmark, Padfield [11] compared the MBVs of different materials using an experimental flux chamber. A theoretical MBV, determined by measuring the water vapour permeability and sorption isotherm, was calculated for clay masonry by McGregor at al. [12], Dubois et al. [13] and Laborel-Preneron et al. [14]. Palumbo et al. [15] reported the MBV results for six different bio-based materials: hemp lime, hemp fibre, wood wool, wood fibre, barley-straw starch and corn pith‒alginate. Novel bio-insulating particleboards made from bamboo powders and various bio-adhesives were investigated by Nguyen [16], and Limam et al. [3] studied bio-based insulating materials based on various hemp and shive‒fibre ratios.
The moisture-buffering phenomenon is not limited to the materials scale. The definition of the moisture buffer value is also applicable to the wall scale [10]. Evrard and Herde [17] determined the MBVs of lime‒hemp composite wall assemblies, using WUFI simulations and adopting the Nordtest protocol [10]. A series of experiments in a full-scale test facility, aimed at determining the moisture buffer effect of interior walls of cellular concrete and plasterboard construction, was carried out by Mortensen et al. [18]. Colinart et al. [19] investigated the hygrothermal behaviour of a hemp-coated concrete wall using cyclical absorption/desorption tests and compared their simulation results with the experimental data. The MBVs of vapour open wall assemblies containing hemp‒lime with inner linings and surface treatments were compared with that of the exposed hemp‒lime by Latif et al. [20]. The experimental method, based on diurnal cycles with two relative humidity levels (upper and lower) corresponding to occupied and unoccupied periods, was studied by Ojanen and Salonvaara to determine the moisture-buffering effect of structures and building components [21].
At the same time, numerical studies on the hygrothermal behaviour of hygroscopic materials and walls have increasingly been undertaken by researchers and designers, as this is a cheaper and more easily available method. However, to have confidence in the model used, it is necessary to validate the prediction of the numerical model using the measurement data. The latest studies comparing measurement and simulation results on the hygrothermal behaviour of building materials and investigating potentially emerging trends for all building materials, thus validating the simulation tools, are reported in [22].
To summarize, the aim of the current study was to assess the hygric behaviour of internal wall assemblies via the MBVs. The modified Nordtest [10] protocol was used to determine the MBVs. The tested assembly samples corresponded to timber-frame lightweight panels with mineral wool or bio-based flexible wood fibreboard at the core. As numerical simulations are becoming a necessary tool for predicting the performance of walls containing highly hygroscopic materials, the measured data are compared with the simulation results. The task of this validation process was to confirm that this type of tool can be used, especially by designers, to choose the optimal wall system in terms of indoor air quality and energy consumption, as an alternative to using MBV tests.

2. Methodology

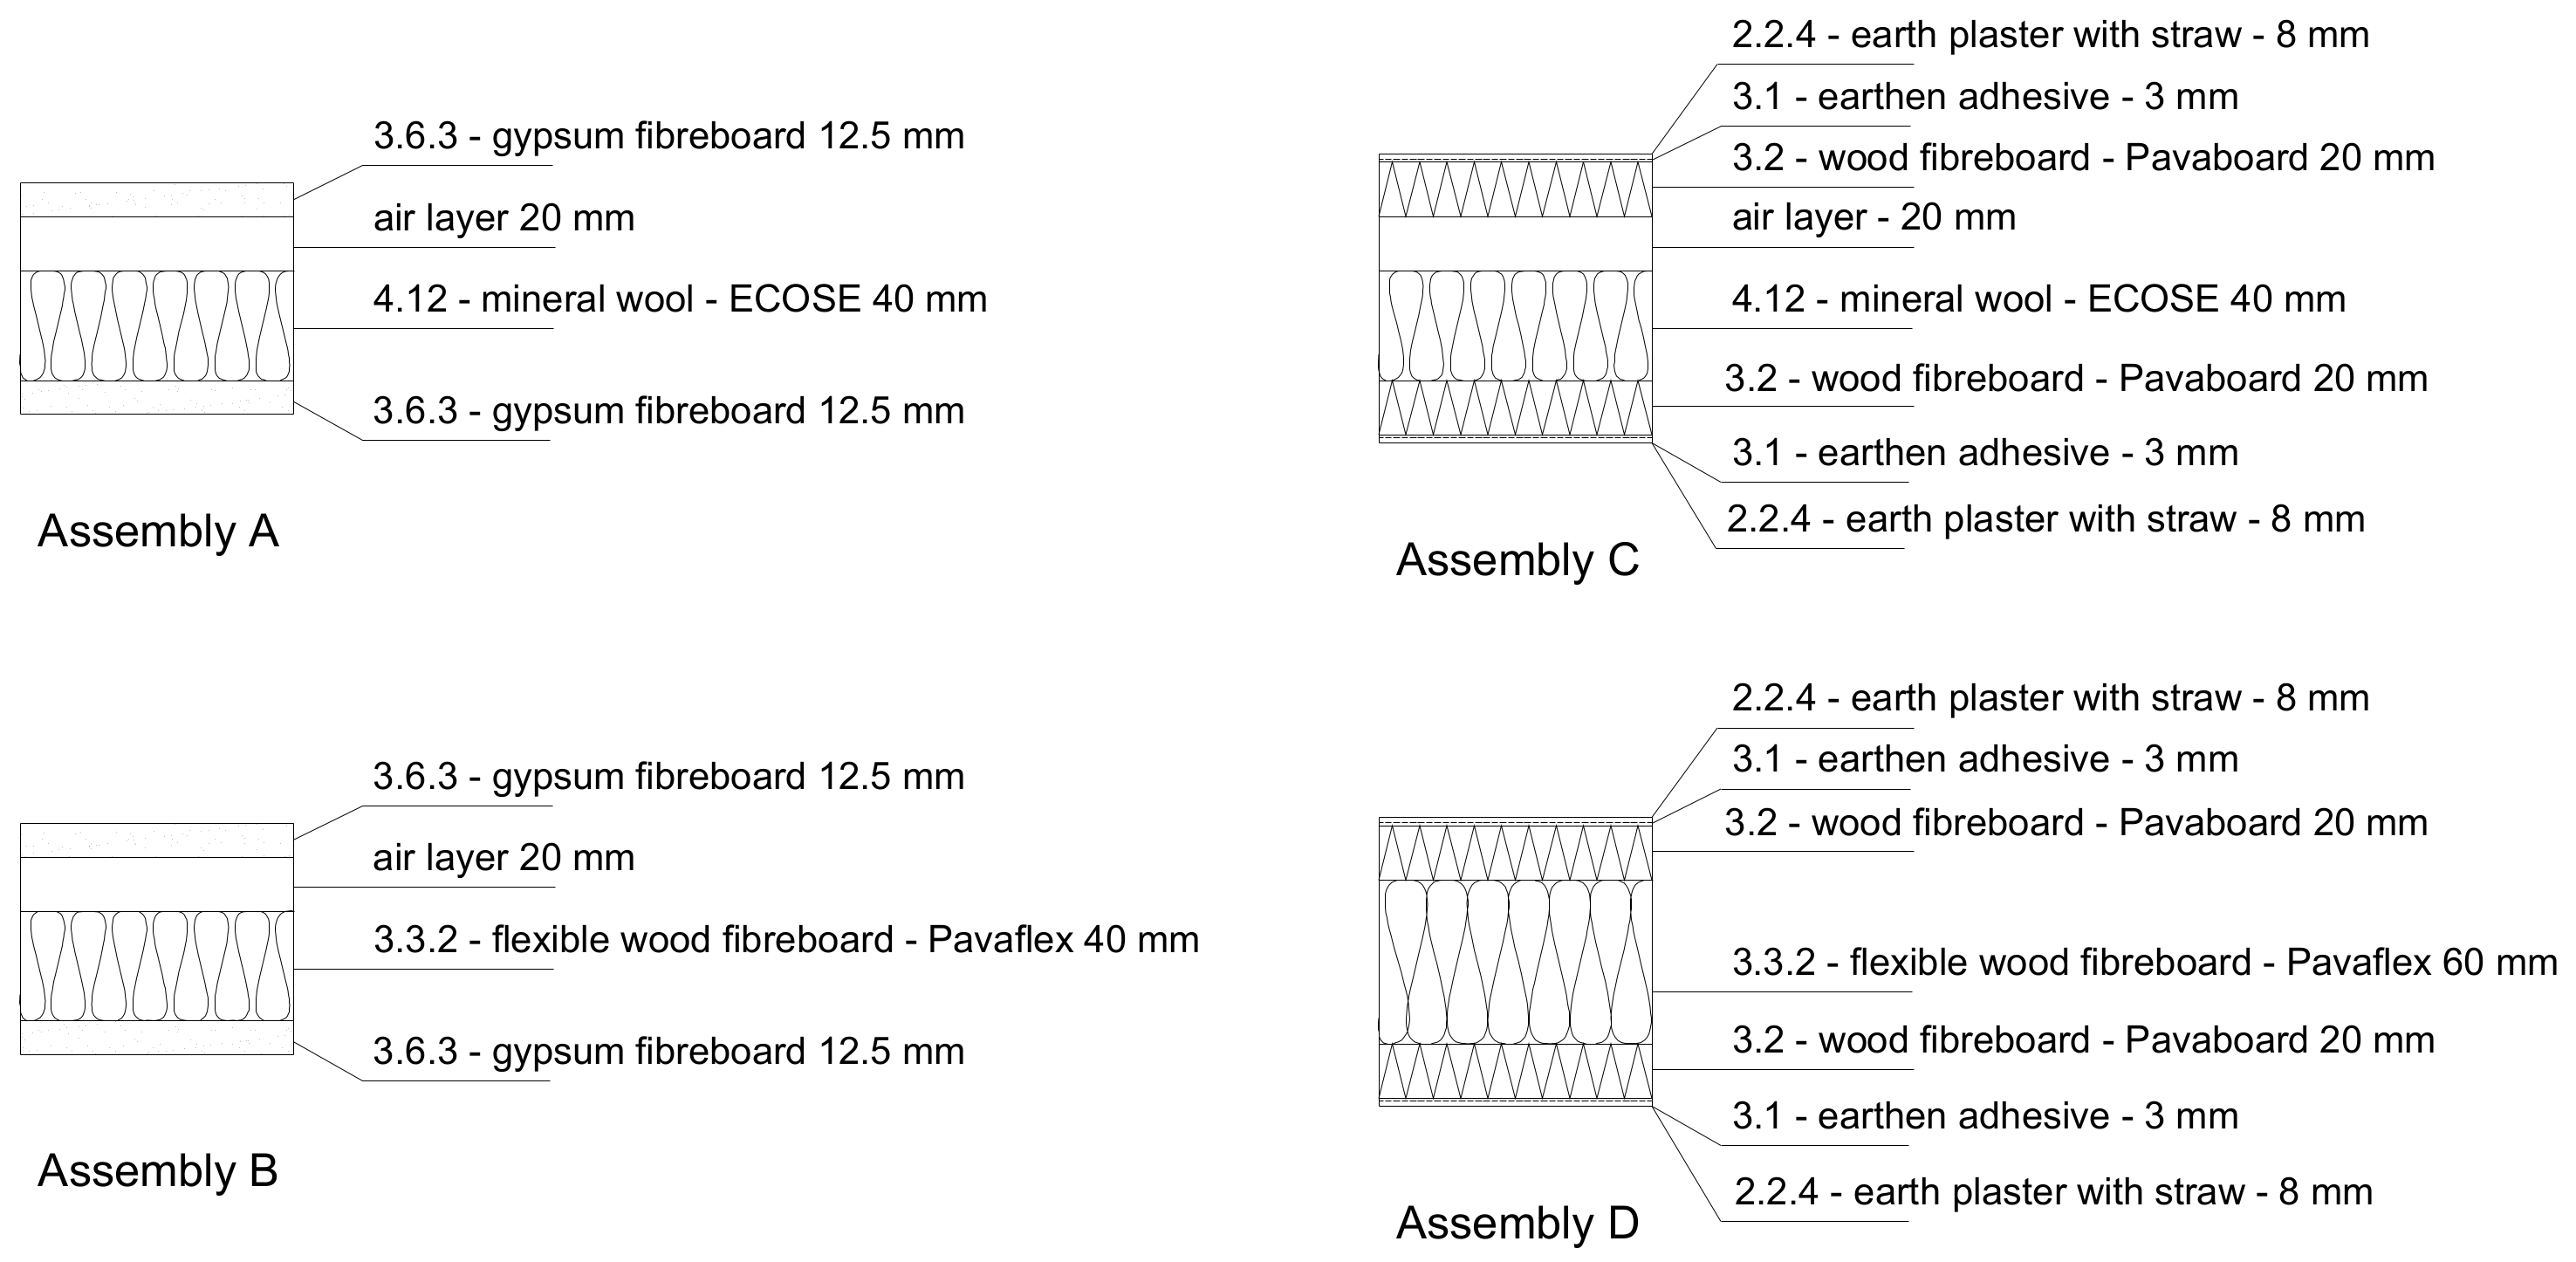
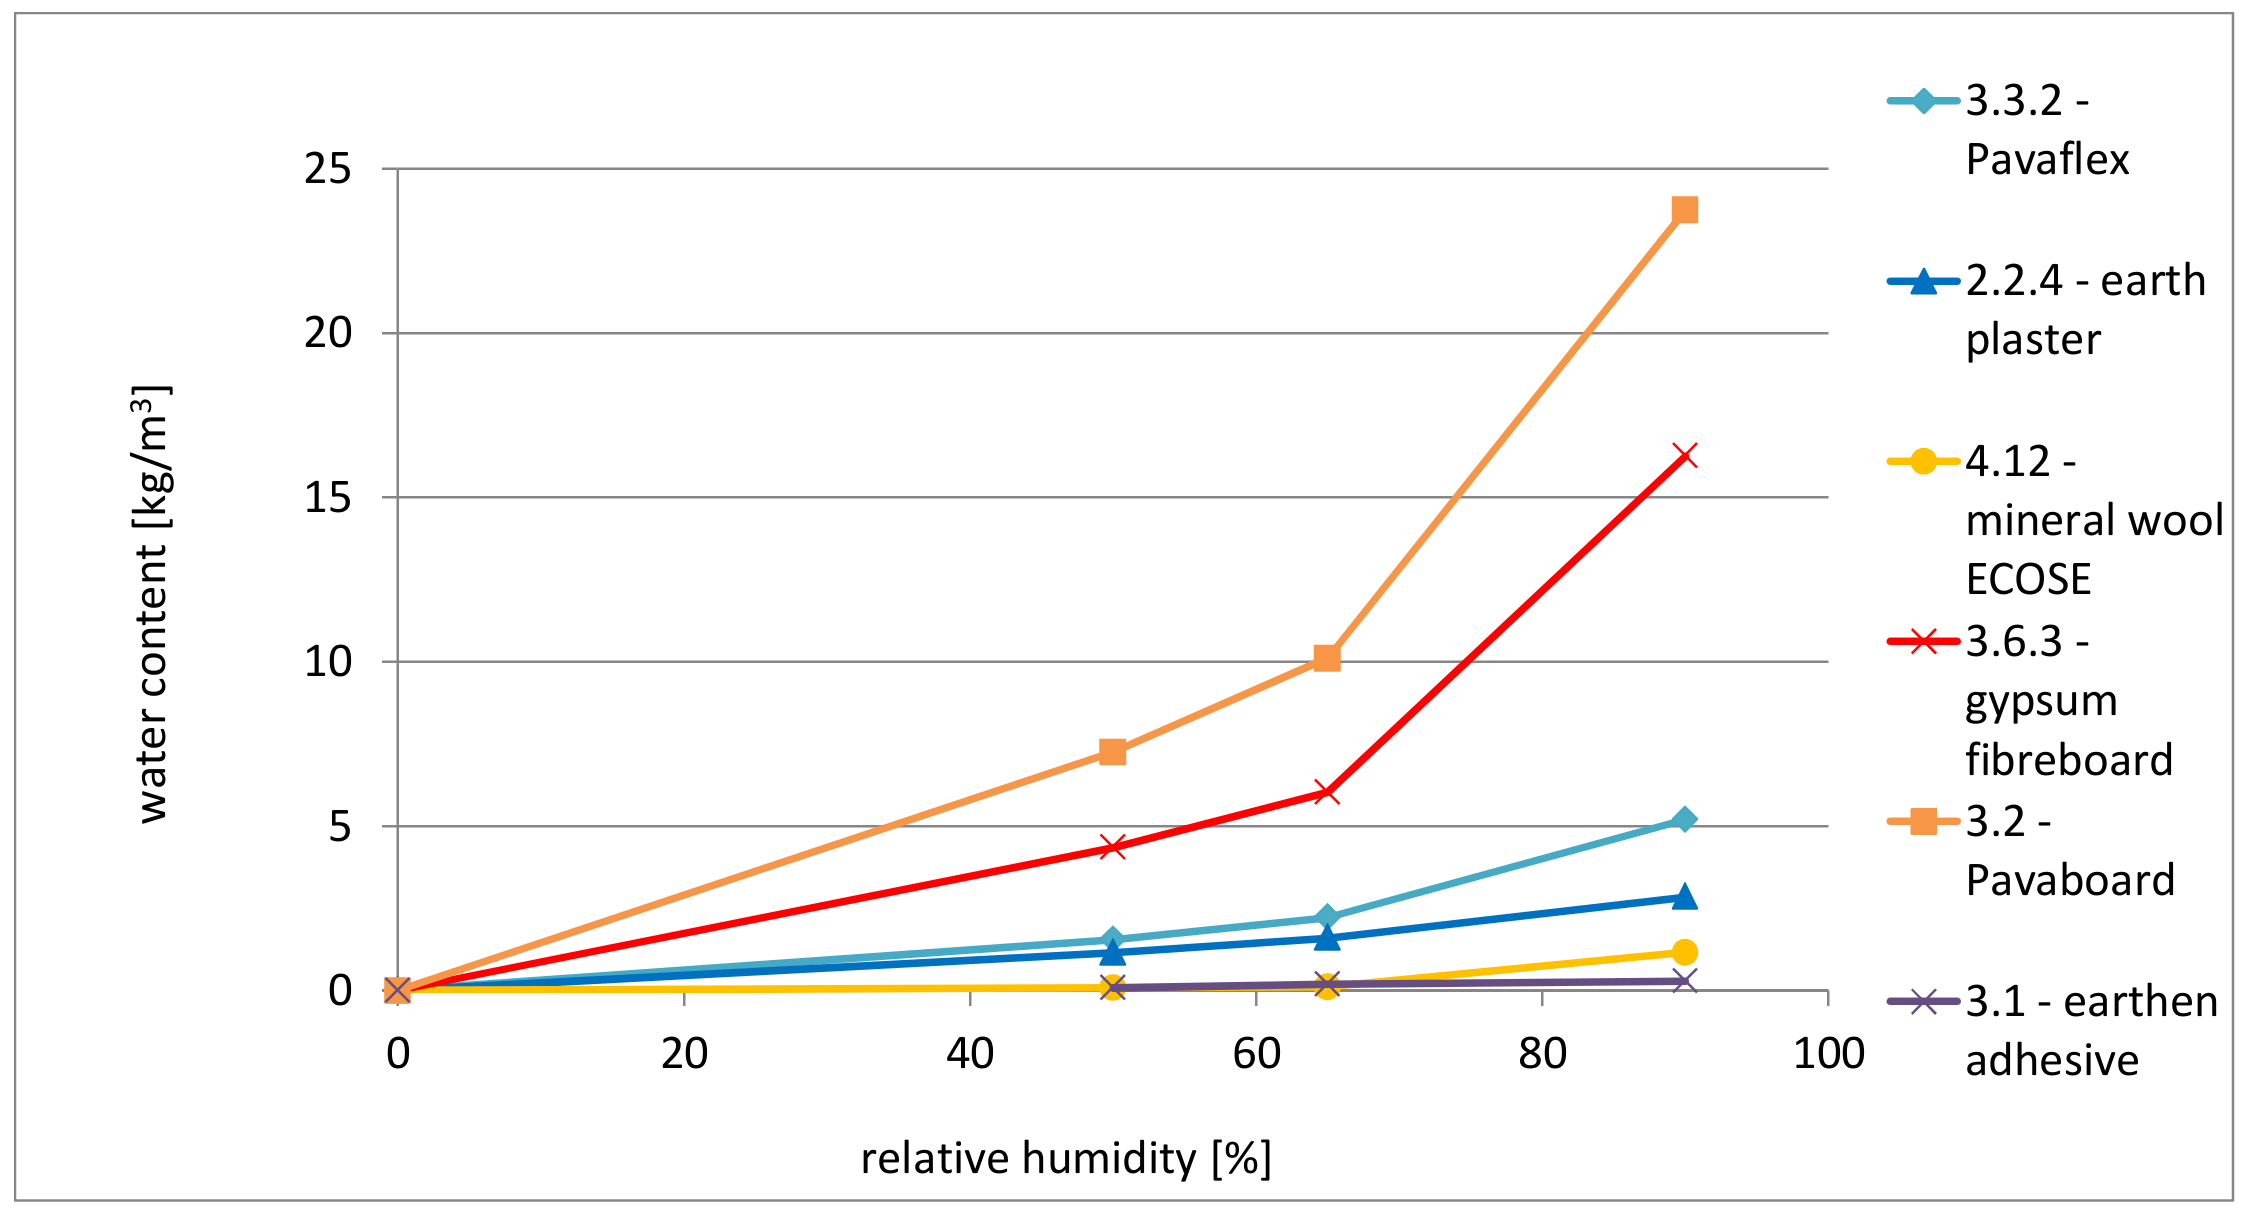
2.1. Sample Compositions and Material Properties

Four different small-scale wall assembly samples with 200 × 500-mm surface areas (Figure 1) were used for the tests. These samples corresponded to the timber-frame lightweight panels used as internal walls in buildings. Assembly A and Assembly B represent 8.5-cm thick walls with an inner air gap of 20 mm. Assembly A differed from Assembly B only in the type of internal insulation used. In the case of Assembly A, this was mineral wool (4.12), while in the case of Assembly B the insulation was made of wood board (3.3.2). Assemblies C and D represent 12.2-cm thick walls, differing in the composition of the inner layers. In Assembly C, the internal insulation was mineral wool (4.12) with a 20-mm air gap, while in Assembly D, the inner layer was wood fibreboard (3.3.2) with a thickness of approximately 60 mm, with no air gap. The coating used in Assemblies C and D, designated as material 3.1, was an earthen adhesive layer, whose purpose was to strengthen the top layers of the wall assemblies, made of earth plaster with straw (2.2.4).
All the materials used to prepare the samples are commercially available, and the thicknesses are representative of the products (Table 1). However, the basic hygrothermal properties necessary for the simulations, such as density, sorption isotherm (water content as a function of RH), thermal conductivity and water-vapour permeability, were measured in the laboratory using steady-state methods. Some physical (porosity) and thermal (heat capacity) properties were taken from the WUFI software database [23]. The material properties of the assemblies are shown in Table 1.
Thermal conductivity values λ (W·m−1·K−1) were measured according to the EN 12664 standard [24]. Samples of area 300 mm × 300 mm and thickness, according to the thickness of each type of material used in the wall assemblies, were prepared. They were conditioned at various relative humidity values (20%, 50% and 80%), at 23 °C. Their thermal conductivities were then determined using a Fox 314 HFM apparatus (TA instruments, Hüllhorst, Germany) which measures the steady-state heat transfer through flat materials. The samples were placed between two flat plates controlled to a specified constant temperature. Thermocouples fixed in the plates measured the temperature drop across the specimen and wireless thermal flux meters (HFMs) embedded in each plate measured the heat flow through the specimen. The thermal flux meters were located in the centre of the plates. The thermal conductivity of the specimen λ (W·m−1·K−1) was then calculated by measuring the heat flux q (W/m2), the temperature difference across the specimen ΔT (K) and the thickness of the specimen s (m) in steady state.
λ = s · q Δ T ,
The adsorption isotherm was tested in accordance with the ISO 12571 [25] standard. The samples of dimensions 100 mm × 100 mm, with a thickness of 40 to 80 mm, were placed in environments with a gradually increasing relative humidity (50%, 65% and 90%), at a constant temperature of 23 °C. The moisture content in particular samples was not determined for humidity values higher than 90%, due to the fact that the MBV tests were carried out at a maximum moisture load of 80%. To measure the water content corresponding to the relative humidity, samples were first exposed to constant temperature and relative humidity conditions in a climate chamber with an accuracy of ±0.5 °C and 3% RH. The eight samples were measured over a 24-h period until the change rate of the sample was smaller than the initial change rate at least three times in succession. Figure 2 shows the adsorption isotherms for all tested materials.
The vapour diffusion resistance factors of the samples were determined according to the ISO 12572 standard [26]. The tests were carried out for each type of material on three samples with diameters 127–128 mm and thicknesses in the range of 40–80 mm. The samples were initially conditioned at 23 °C and 50% relative humidity, until they reached a constant mass. Then, the samples were placed in special metal dishes containing a desiccant (CaCl2). The sides of the insulation samples were sealed with wax. The prepared samples were exposed to a temperature of 20 °C with a relative humidity of 50%. Dishes were then weighed every 24 h until steady state was reached, when the difference between two consecutive weigh-ins became constant. The water-vapour resistance factor µ was calculated according to Equation (2):
μ = δ a δ ,
where µ is the water-vapour resistance factor, δ is the water-vapour permeability (kg·m−1 s−1·Pa−1) and δa is the water-vapour permeability of air with respect to the partial vapour pressure. The water-vapour permeability δ is calculated using Equation (3):
δ = G · d A · Δ p ,
where G is the water-vapour flow rate (kg/s), d is the test specimen thickness (m), A is the exposed surface area (m2) and Δp is the pressure difference (Pa).
The density was determined according to the EN 1602 standard [27]. The specimens were cut and preconditioned at 50% RH and 20 °C before being tested. The test consisted of weighing the samples, determining their volume and calculating the density as the quotient of mass and volume using Equation (4):
ρ = W a · b · c ,
where a, b, c (m) and W (kg) are the length, width, thickness and weight of the specimen, respectively.

2.2. Hygrothermal Tests

Two experiments were performed on the coated wall assembly samples, using a CTS climatic test chamber, where it is possible to control the internal parameters in the temperature range from +10 °C to +95 °C and in the humidity range from 10% to 98%. The lateral surfaces of the tested samples were tightly sealed with aluminium foil on four sides, thus creating a barrier against the penetration of water vapour. Other surfaces (upper and lower) were left uncovered to expose them to moisture absorption and desorption, representing an internal wall between two environments.
The first test, known as the sorption/desorption kinetics test, was performed using the following protocol. Firstly, the samples were preconditioned at 23 °C and 50% RH, and then the relative humidity was increased to 80% and the samples were kept in this environment for 324 h. After this time, the relative humidity was decreased to 50%. During the test, the temperature was kept constant at 23 °C and the samples were weighed. The sorption kinetics values were calculated as a function of mass gain/loss over time. The moisture content variation (ΔMC) was calculated using Equation (5):
Δ M C = W 80 % / 50 % W 50 % W 50 % × 100 % ,
where W80%/50% is the weight at 80% or 50% RH during the mass change and W50% is the constant weight of the preconditioned sample at 50% RH.
Because several samples were weighed at the same time, the measurements were carried out outside the chamber, in less than 2 min. The short exposure time of the samples to different humidity conditions does not significantly interfere with the results. This was confirmed by McGregor [12], who compared the results obtained from mass measurements of samples carried out outside the chamber with those from continuous measurements taking place directly in the chamber.
The second test, i.e., the MBV test, determined the MBV in terms of water-vapour adsorption and desorption in response to cyclic humidity variation. A number of methods are available to determine the moisture buffer value of building materials, such as the Nordtest method [10], the Japanese standards [28], the ISO standard [29], the method proposed by Padfield [30] and the ultimate moisture buffer value concept [31]. Each of the methods vary in terms of the procedure of the test, the time steps used, the humidity level and the sample sizes, but all use the same principle of exposing samples to different RH variations and recording the mass changes within the samples. The methodology used in this study differs from the Nordtest method in the range of measurements recorded, the cycling of RH levels and the time steps. According to the Nordtest method, the materials are exposed to cyclic step-changes that alternate levels of relative humidity from 75% for 8 h to 33% for 16 h. The duration of the entire cycle is 24 h. During the test the temperature is held constant at 23 °C. In this research different levels of humidity and time steps was chosen: 50% for 12 h and 80% for 12 h, according with German industry standard [32]. When assessing the behaviour of assemblies in rooms with high occupation, or bathrooms where there are many moisture sources and the ventilation level is often inadequate, especially in the summer, the proposed approach responds better to these conditions. Firstly, the samples were conditioned at 23 °C and 50% humidity, until the mass change of the specimen between two consecutive measurement was below 1% of the total mass. This state was considered to represent equilibrium with the environment. Then, the samples were exposed to a series of step changes in relative humidity between two levels, in cycles of 24 h (12 h at 80% RH and 12 h at 50% RH), at 23 °C. Five cycles were carried out with a total test time of 120 h. Switching between the humidity values was performed manually, according to the adopted load diagram (12/12 h). The change in moisture mass Δm was determined as the average of the weight gain during the moisture uptake phase of the cycle. The MBV was calculated using Equation (6):
M B V = Δ m A · Δ R H ,
where Δm is the average between the absorbed and desorbed mass (kg), A is the exposed surface (m2) and ΔRH is the difference in relative humidity (%).
In the Nordtest project [10], it was assumed that a dynamic equilibrium was reached, and the final results were read when the Δm variation was below 5% between the last three cycles. However, in this study the test was continued for five days, and the moisture buffer value was estimated after each day. Based on the Nordtest project, the MBVs of samples were then classified into five categories: negligible (MBV: 0.0–0.2), limited (MBV: 0.2–0.5), moderate (MBV: 0.5–1.0), good (MBV: 1.0–2.0) and excellent (MBV: 2.0 or more).

3. Results and Discussion

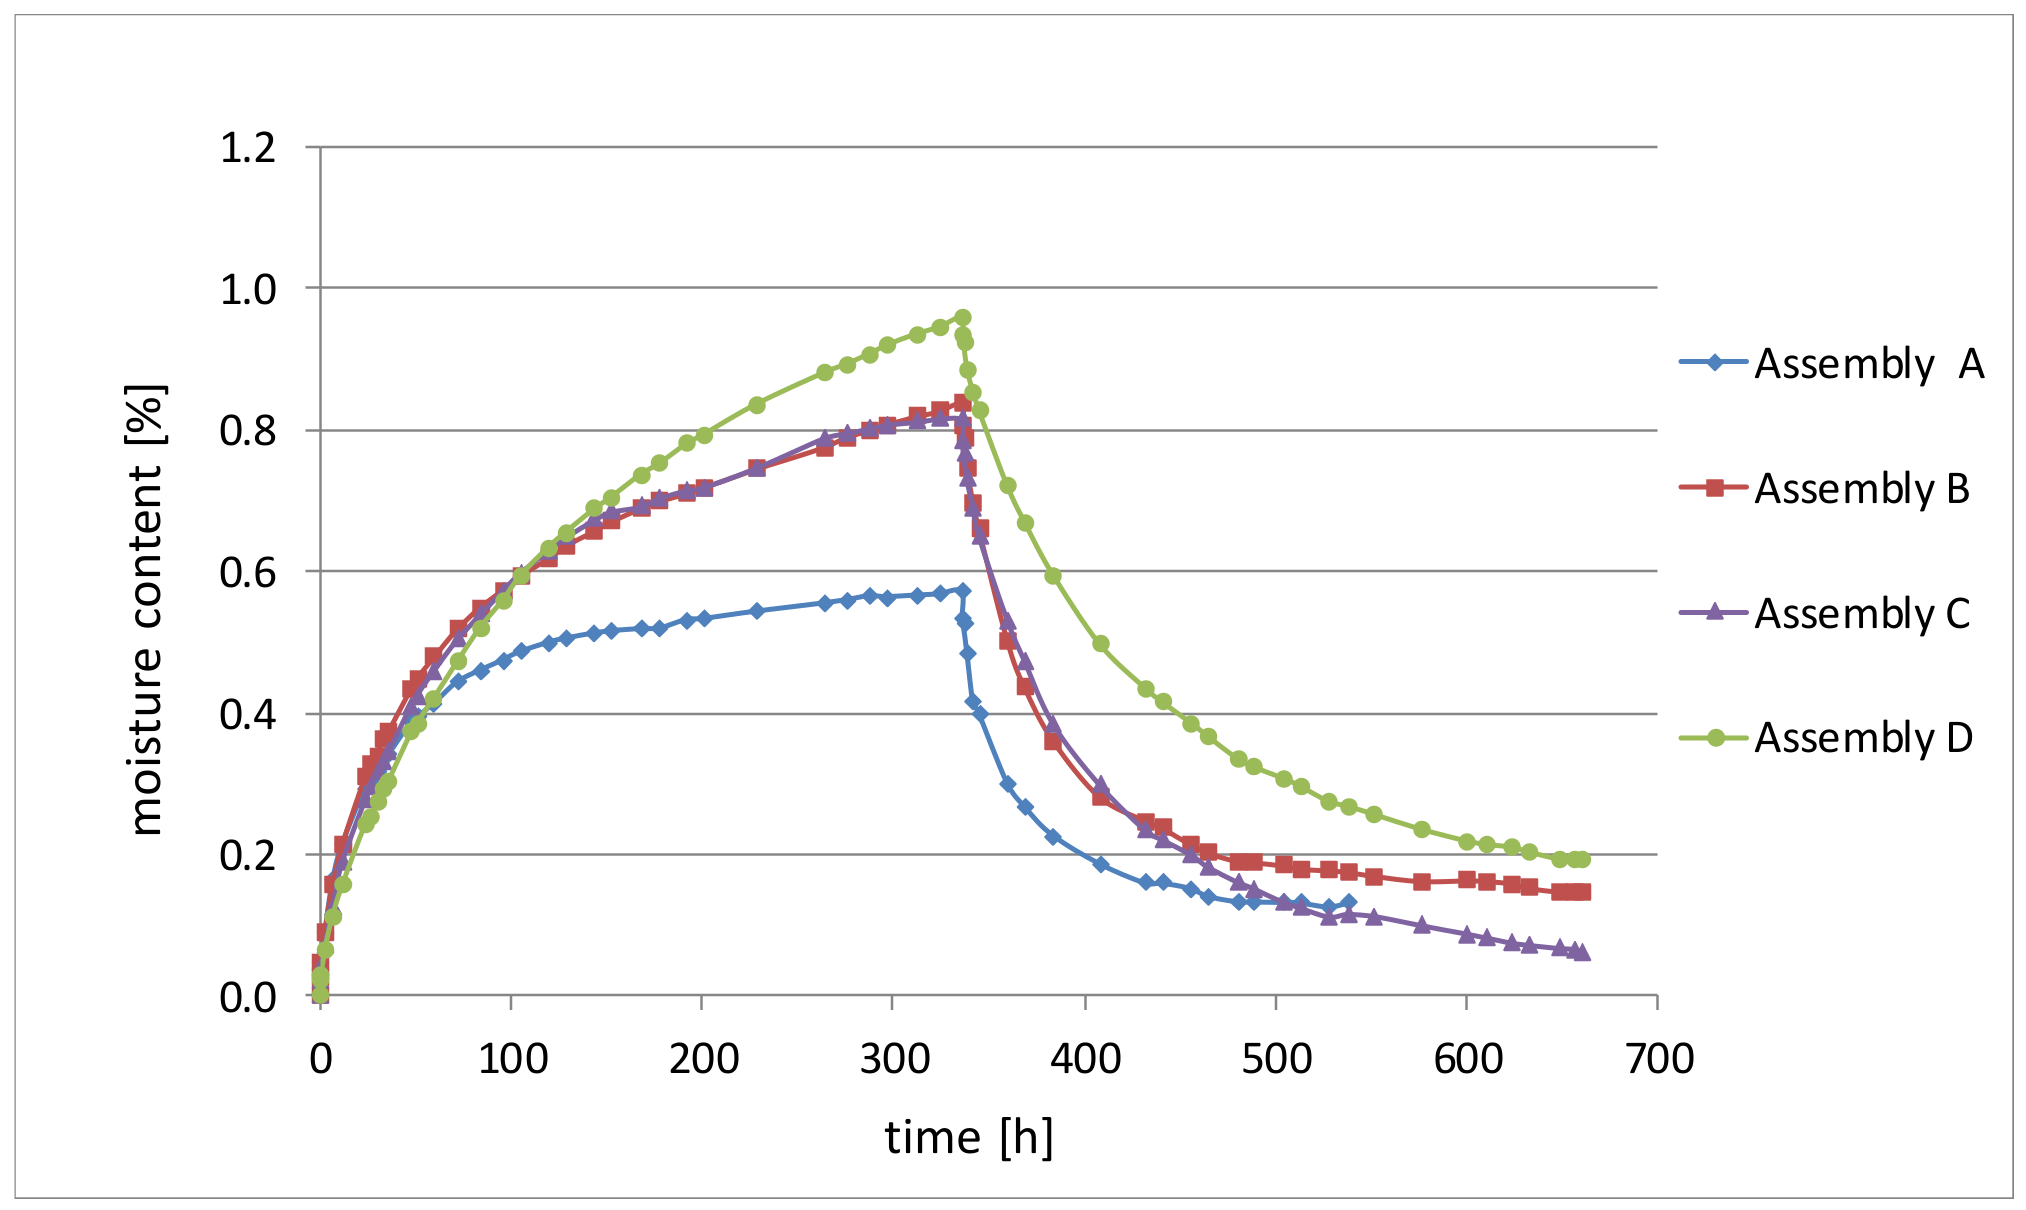
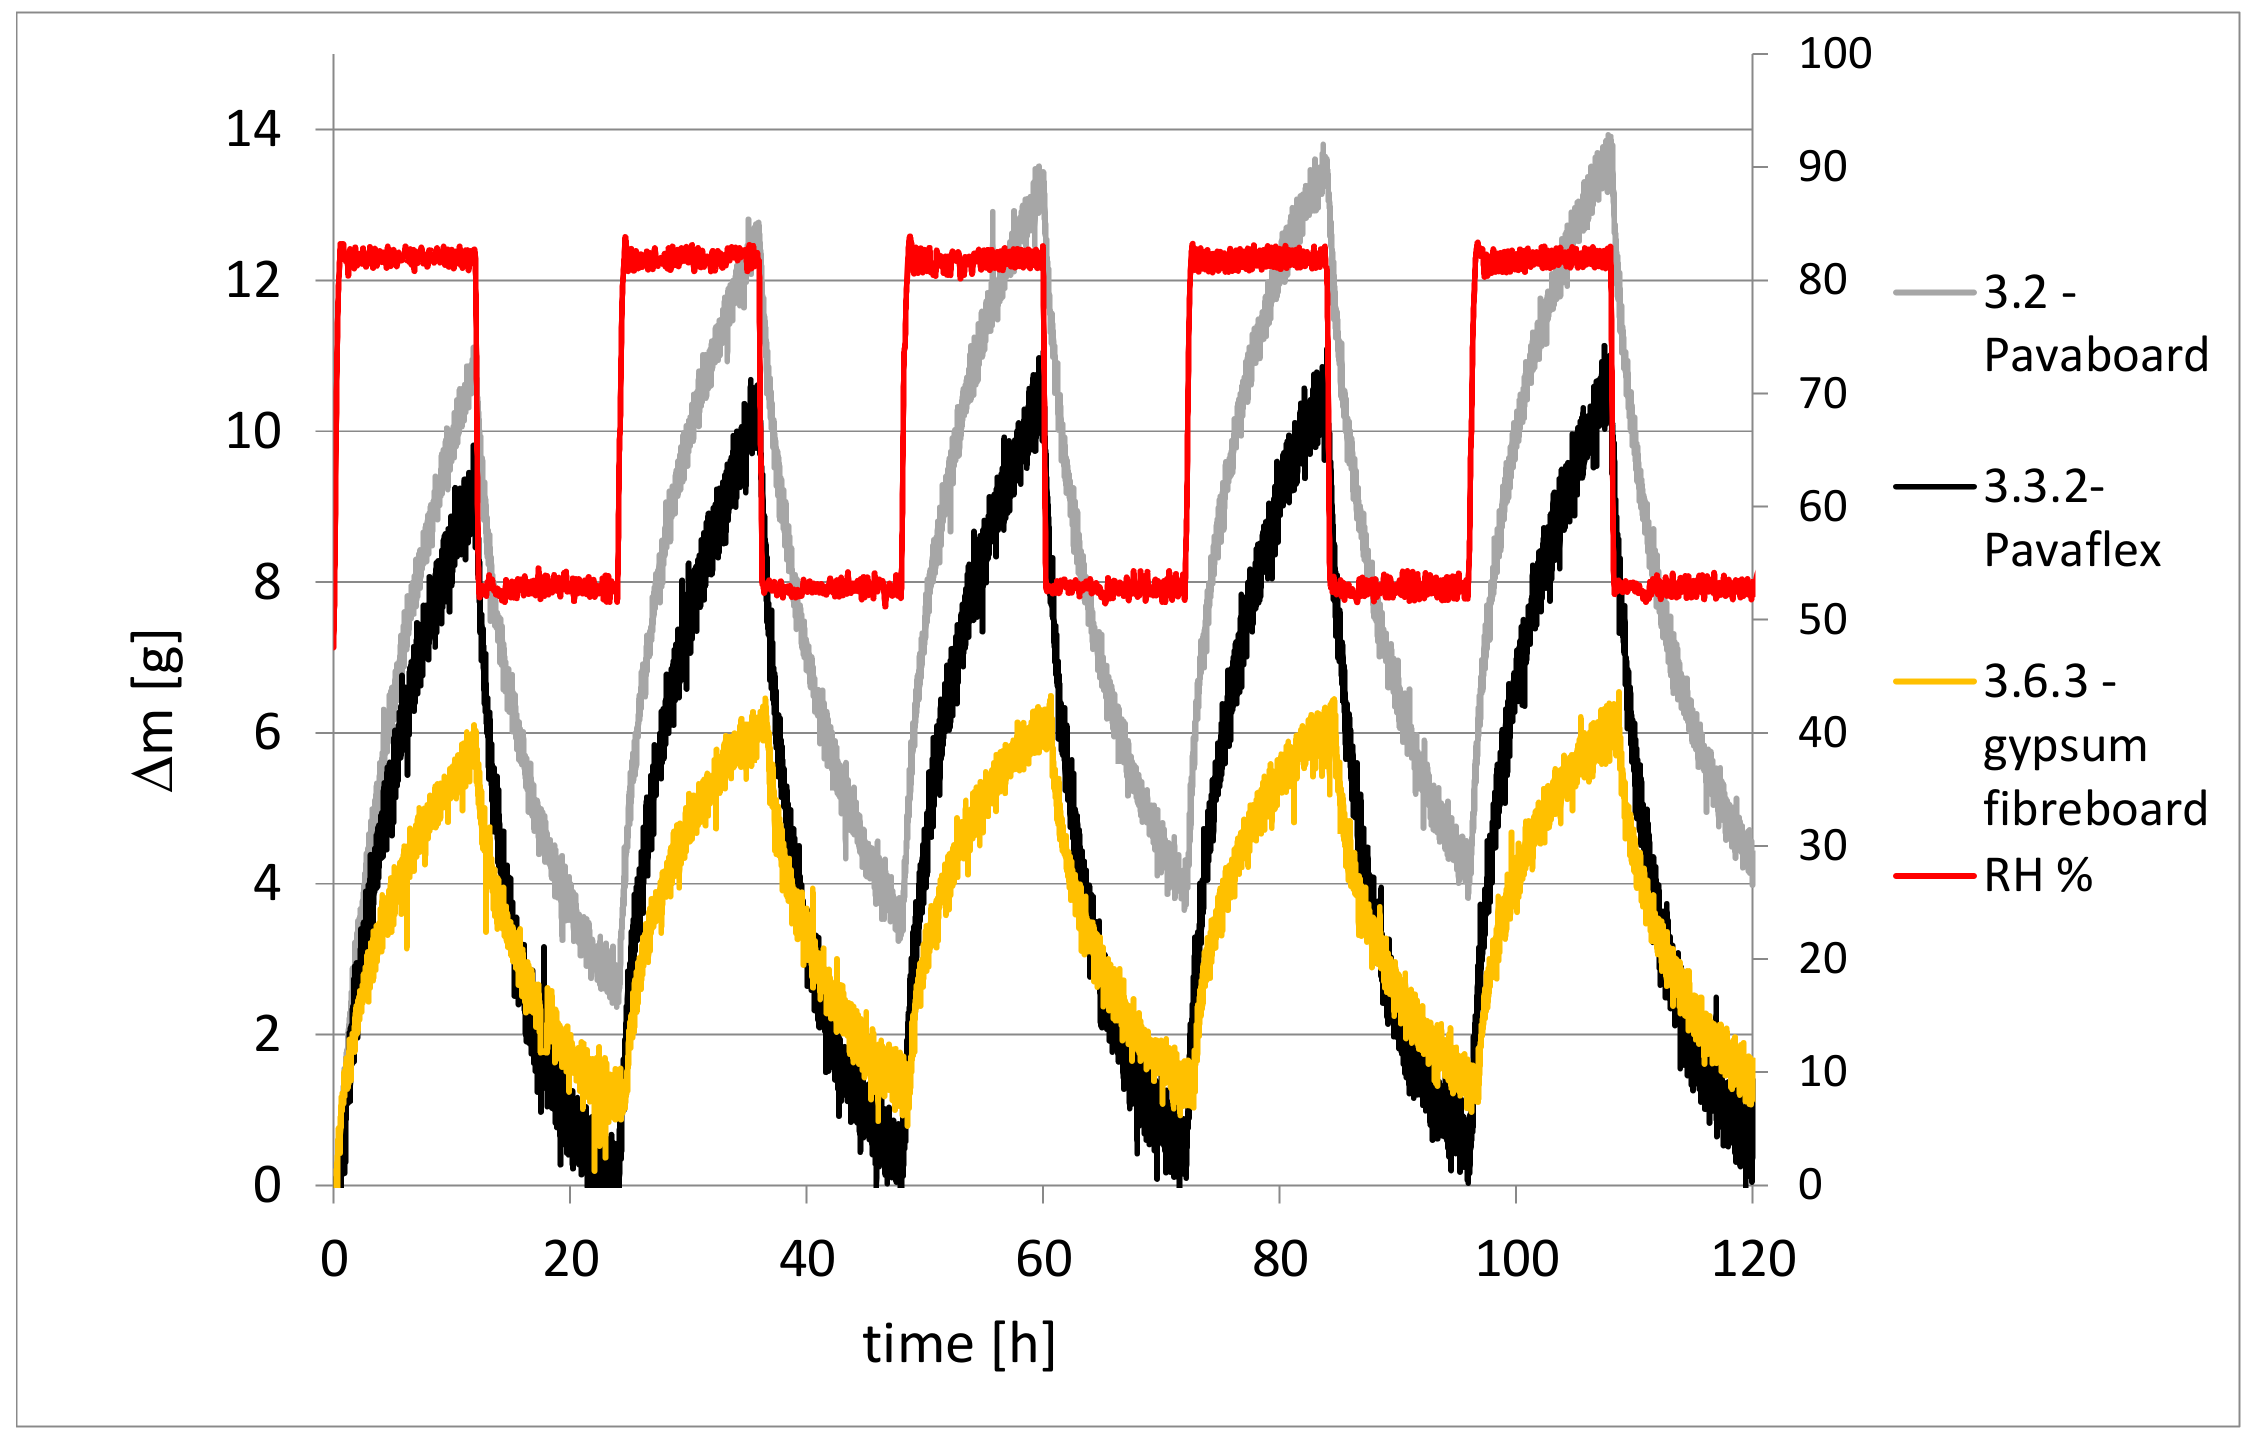
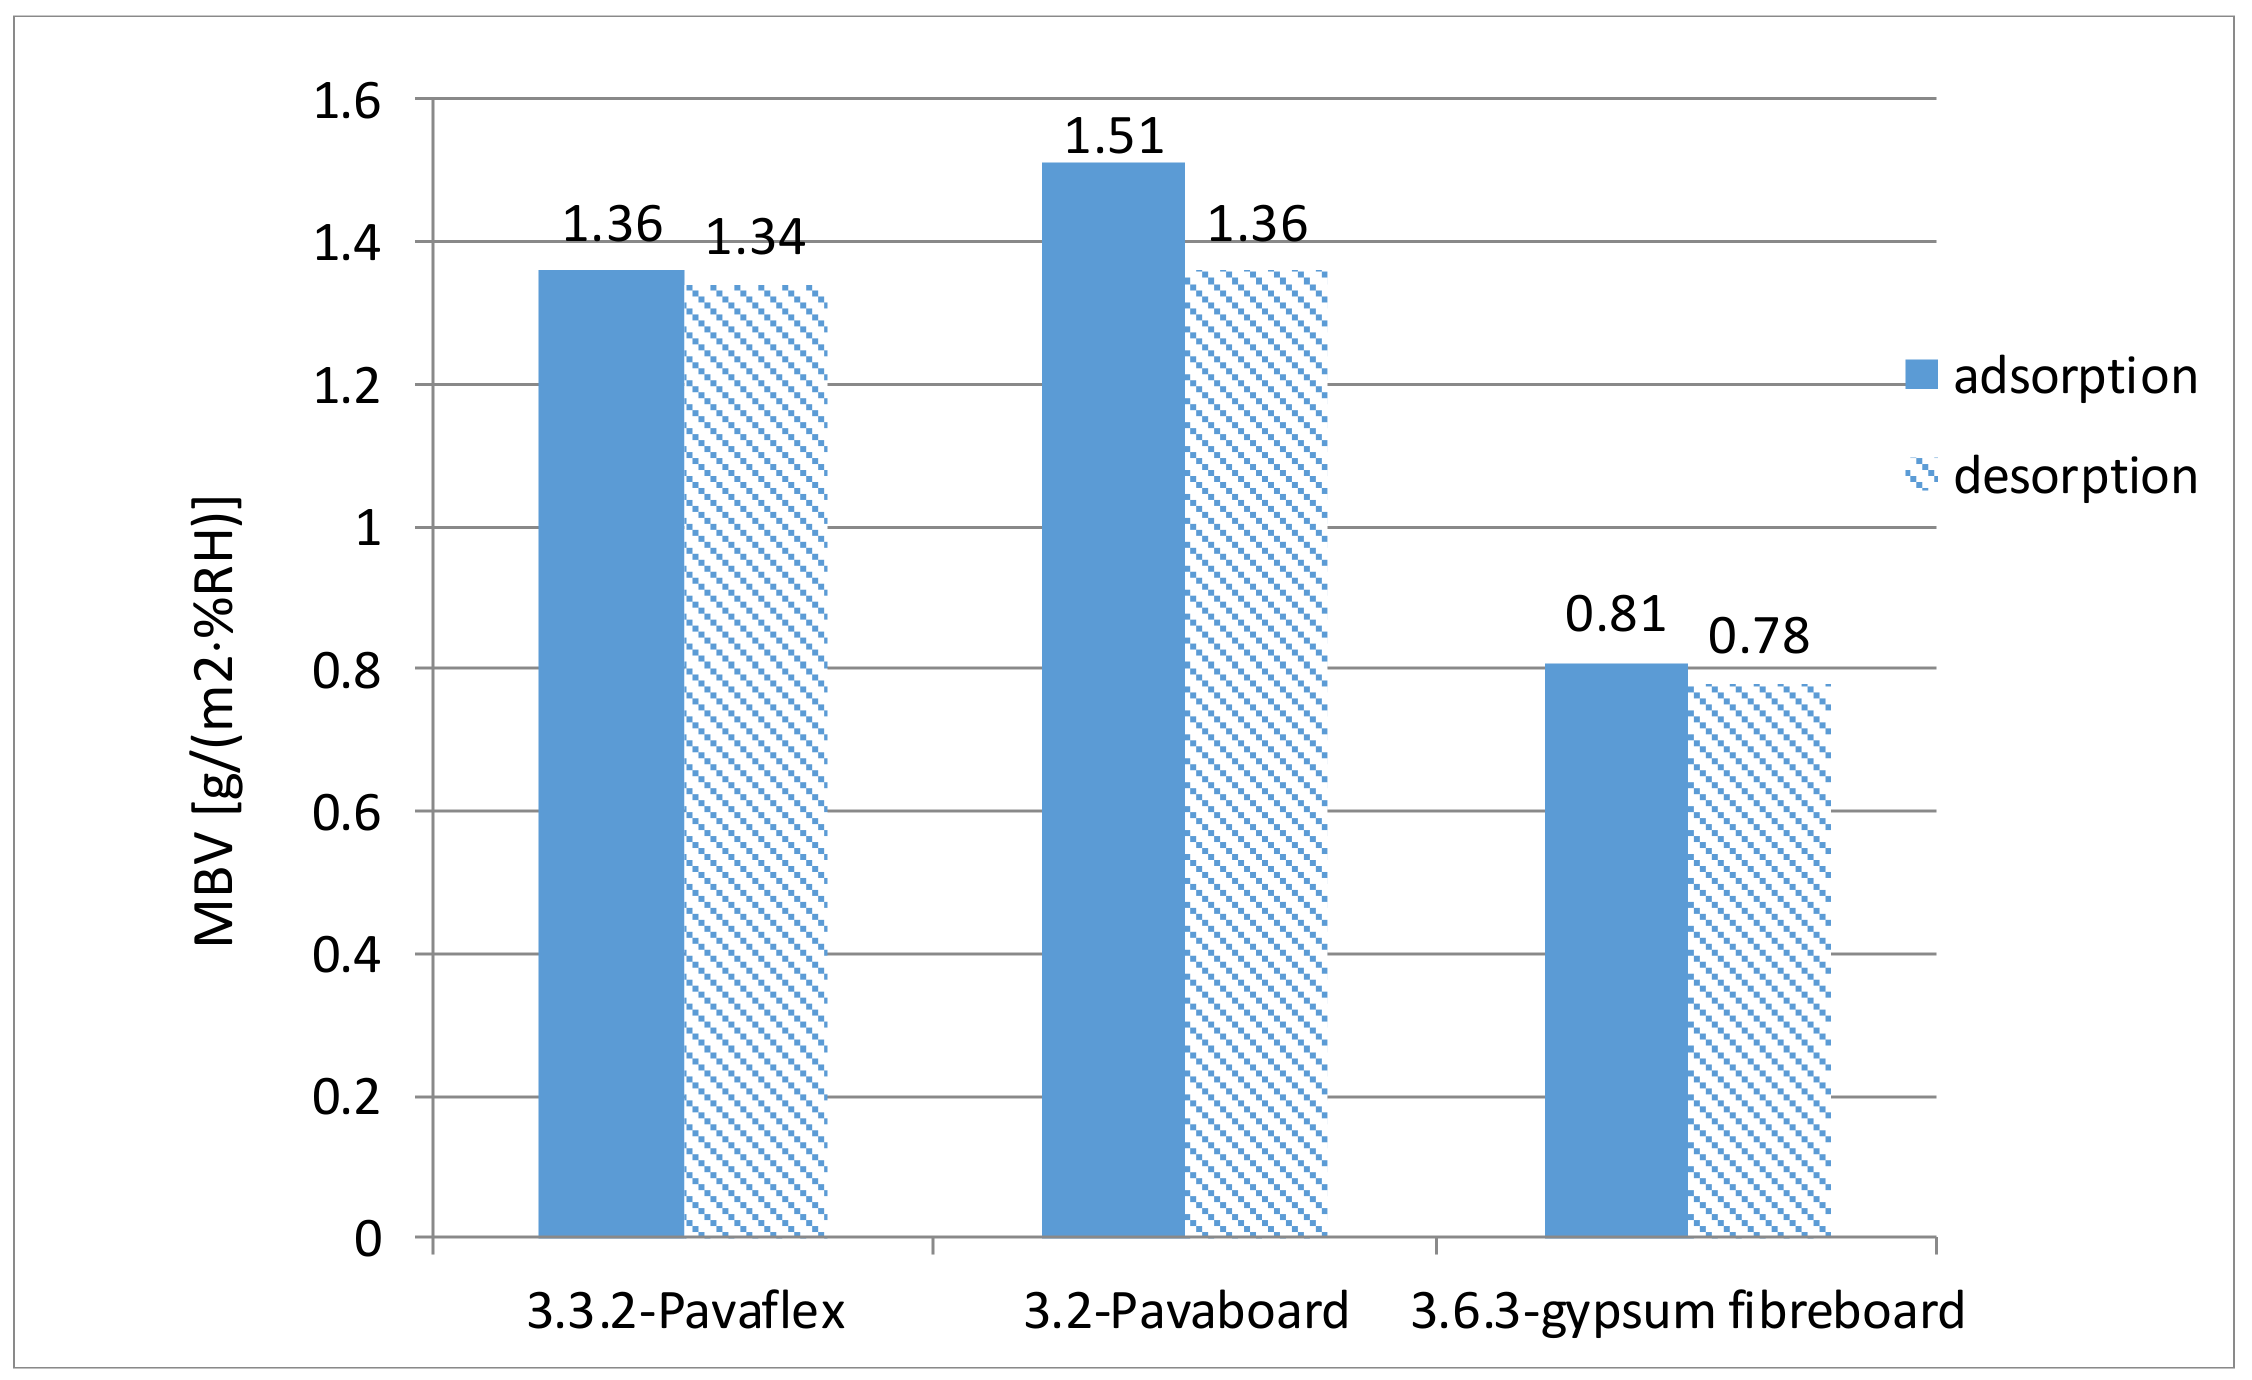
3.1. Sorption/Desorption Kinetic

The moisture uptake and release variations over time between 50% and 80% RH are shown in Figure 3. All the tested assemblies showed a similar trend for moisture sorption. The samples absorbed moisture when the relative humidity increased and desorbed moisture when the relative humidity decreased. The increase in weight was due to the absorbed liquid water in the pores of the materials. Water vapour cannot cause such an increase as its density is too low, and therefore the water vapour in the air must be stored by the material in the form of liquid water [33]. Steady state was not reached for the mass after 324 h. During absorption, the mass increase was higher than the decrease during desorption. The uptake and release masses for individual wall assembly samples are shown in Table 2. At the beginning of the exposure to lower relative humidity, the desorption was faster than the adsorption during the exposure to higher relative humidity. The water vapour was released quickly, and after a period of rapid release, the process slowed down. The results show that desorption occurs faster than adsorption, and this phenomenon is also a clear illustration of hysteresis within the hygroscopic samples.
Comparing the results for moisture transfer, it is observed that the rate of moisture uptake in Assembly D was higher than in Assembly C, at 0.96% and 0.84%, respectively. Assembly D and Assembly C differed only in the inner layer. In Assembly D this was flexible wood fibreboard (Pavaflex) (3.2.2); in Assembly D it was mineral wool (ECOSE) (4.12) and an air layer. The situation was similar for Assemblies A and B, which also differed only in the interior composition. The moisture uptake in Assembly B was 0.82% and that in Assembly A was 0.57%.
Analysing the properties of individual material layers (Table 1), it is seen that the inner layers (wood fibreboard (Pavaflex) (3.2.2) and mineral wool (ECOSE) (4.12)) had a similar vapour diffusion resistance factor µ of 3–5, so, in this case, this was not a factor influencing the obtained differences in results. However, mineral wool showed negligible moisture sorption (Figure 2) compared with wood fibreboard, and this is certainly associated with the fact that Assembly B absorbed more moisture than Assembly A and Assembly D absorbed more than Assembly C.
An analysis of the tested cases allows us to conclude that materials with a higher density absorb a greater amount of water. Comparing further the sorption kinetics shown in Figure 4, it can be seen that Assembly B and Assembly C had almost the same moisture uptake: Assembly B had 0.82% and Assembly C had 0.84%. These results indicate than the outer finishing layers of the material had an effect on the inner layers and may reduce their capacity for moisture buffering.

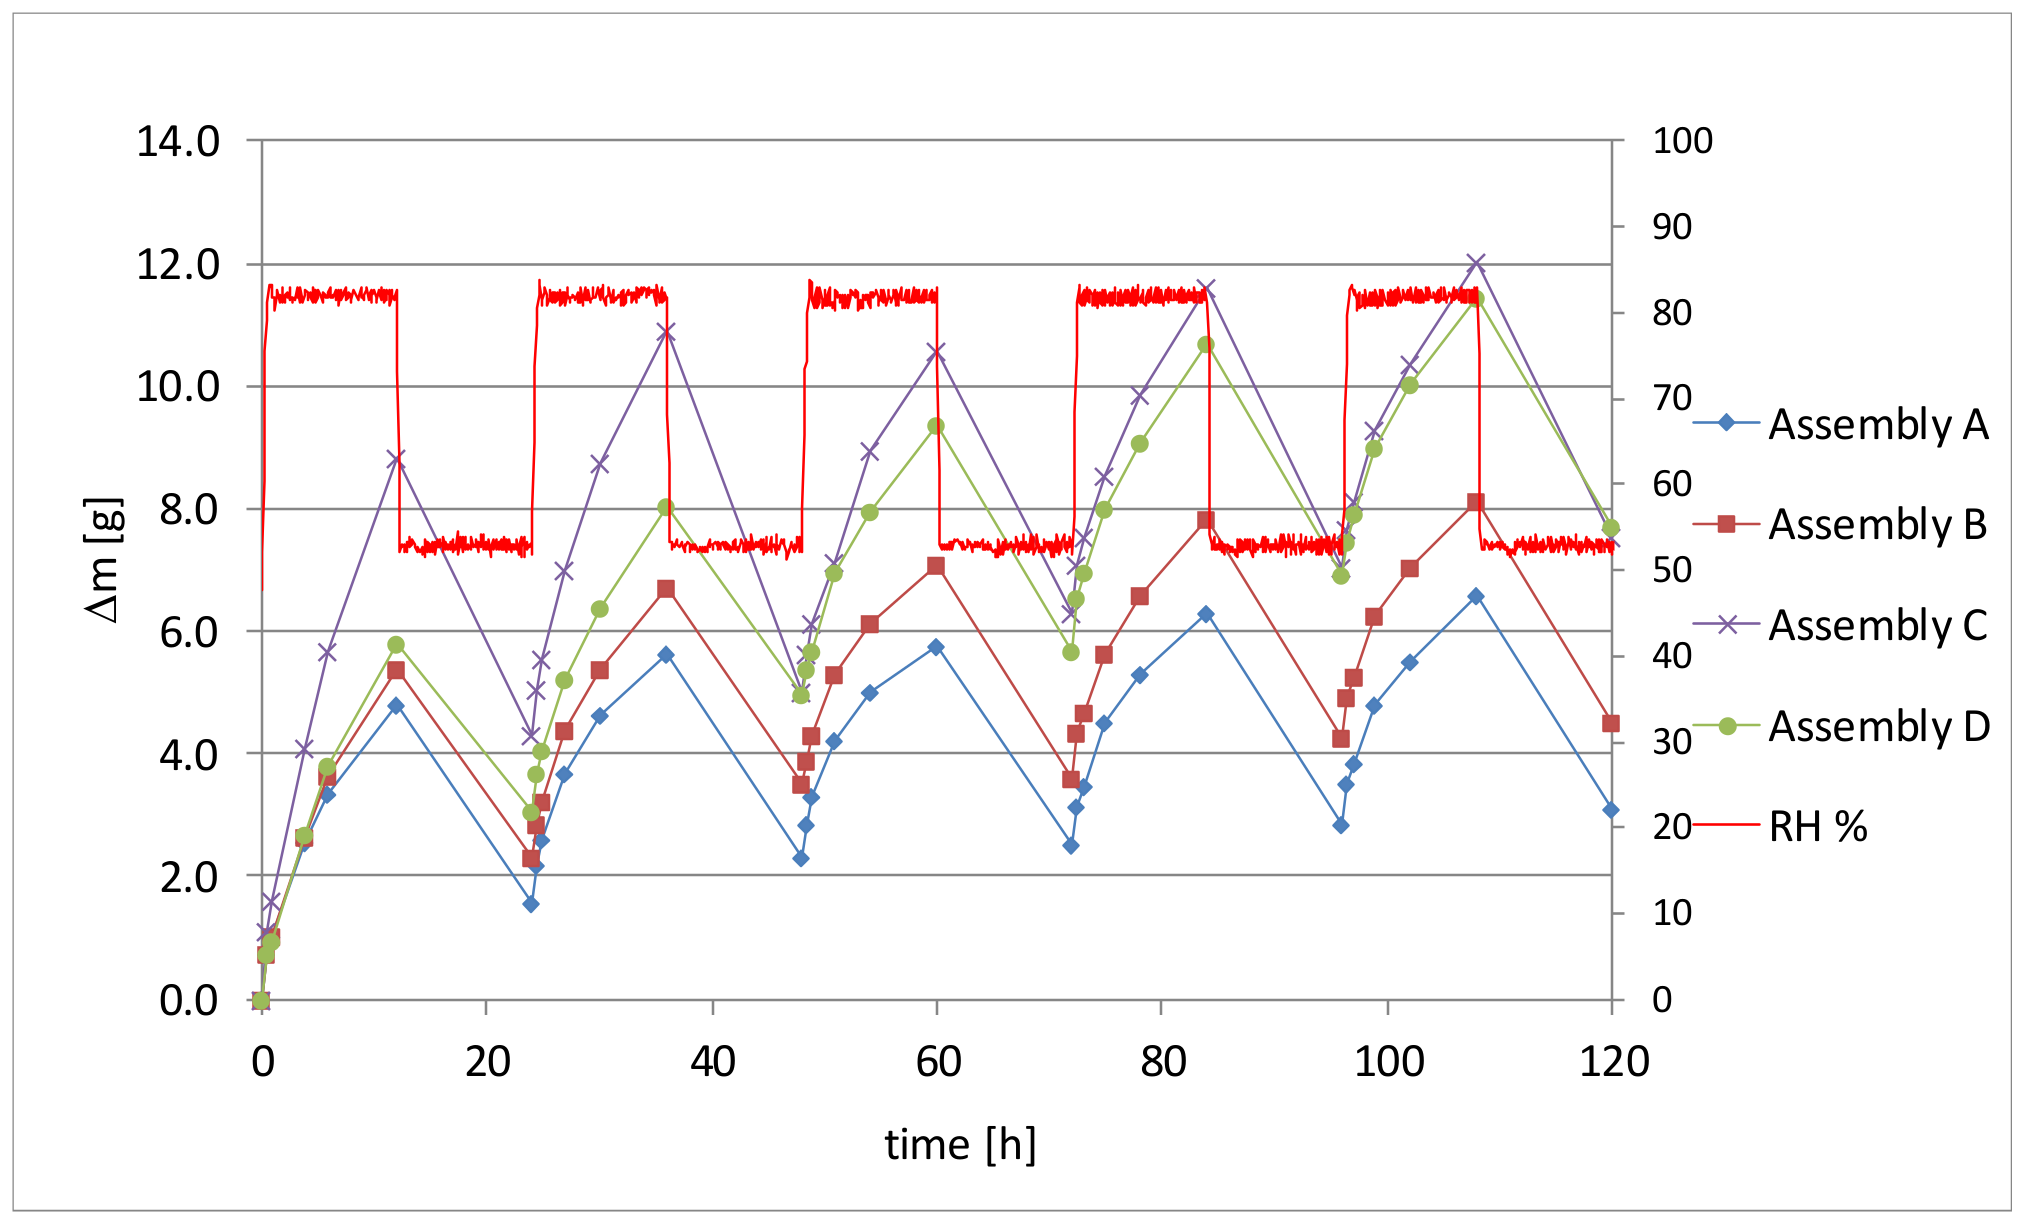
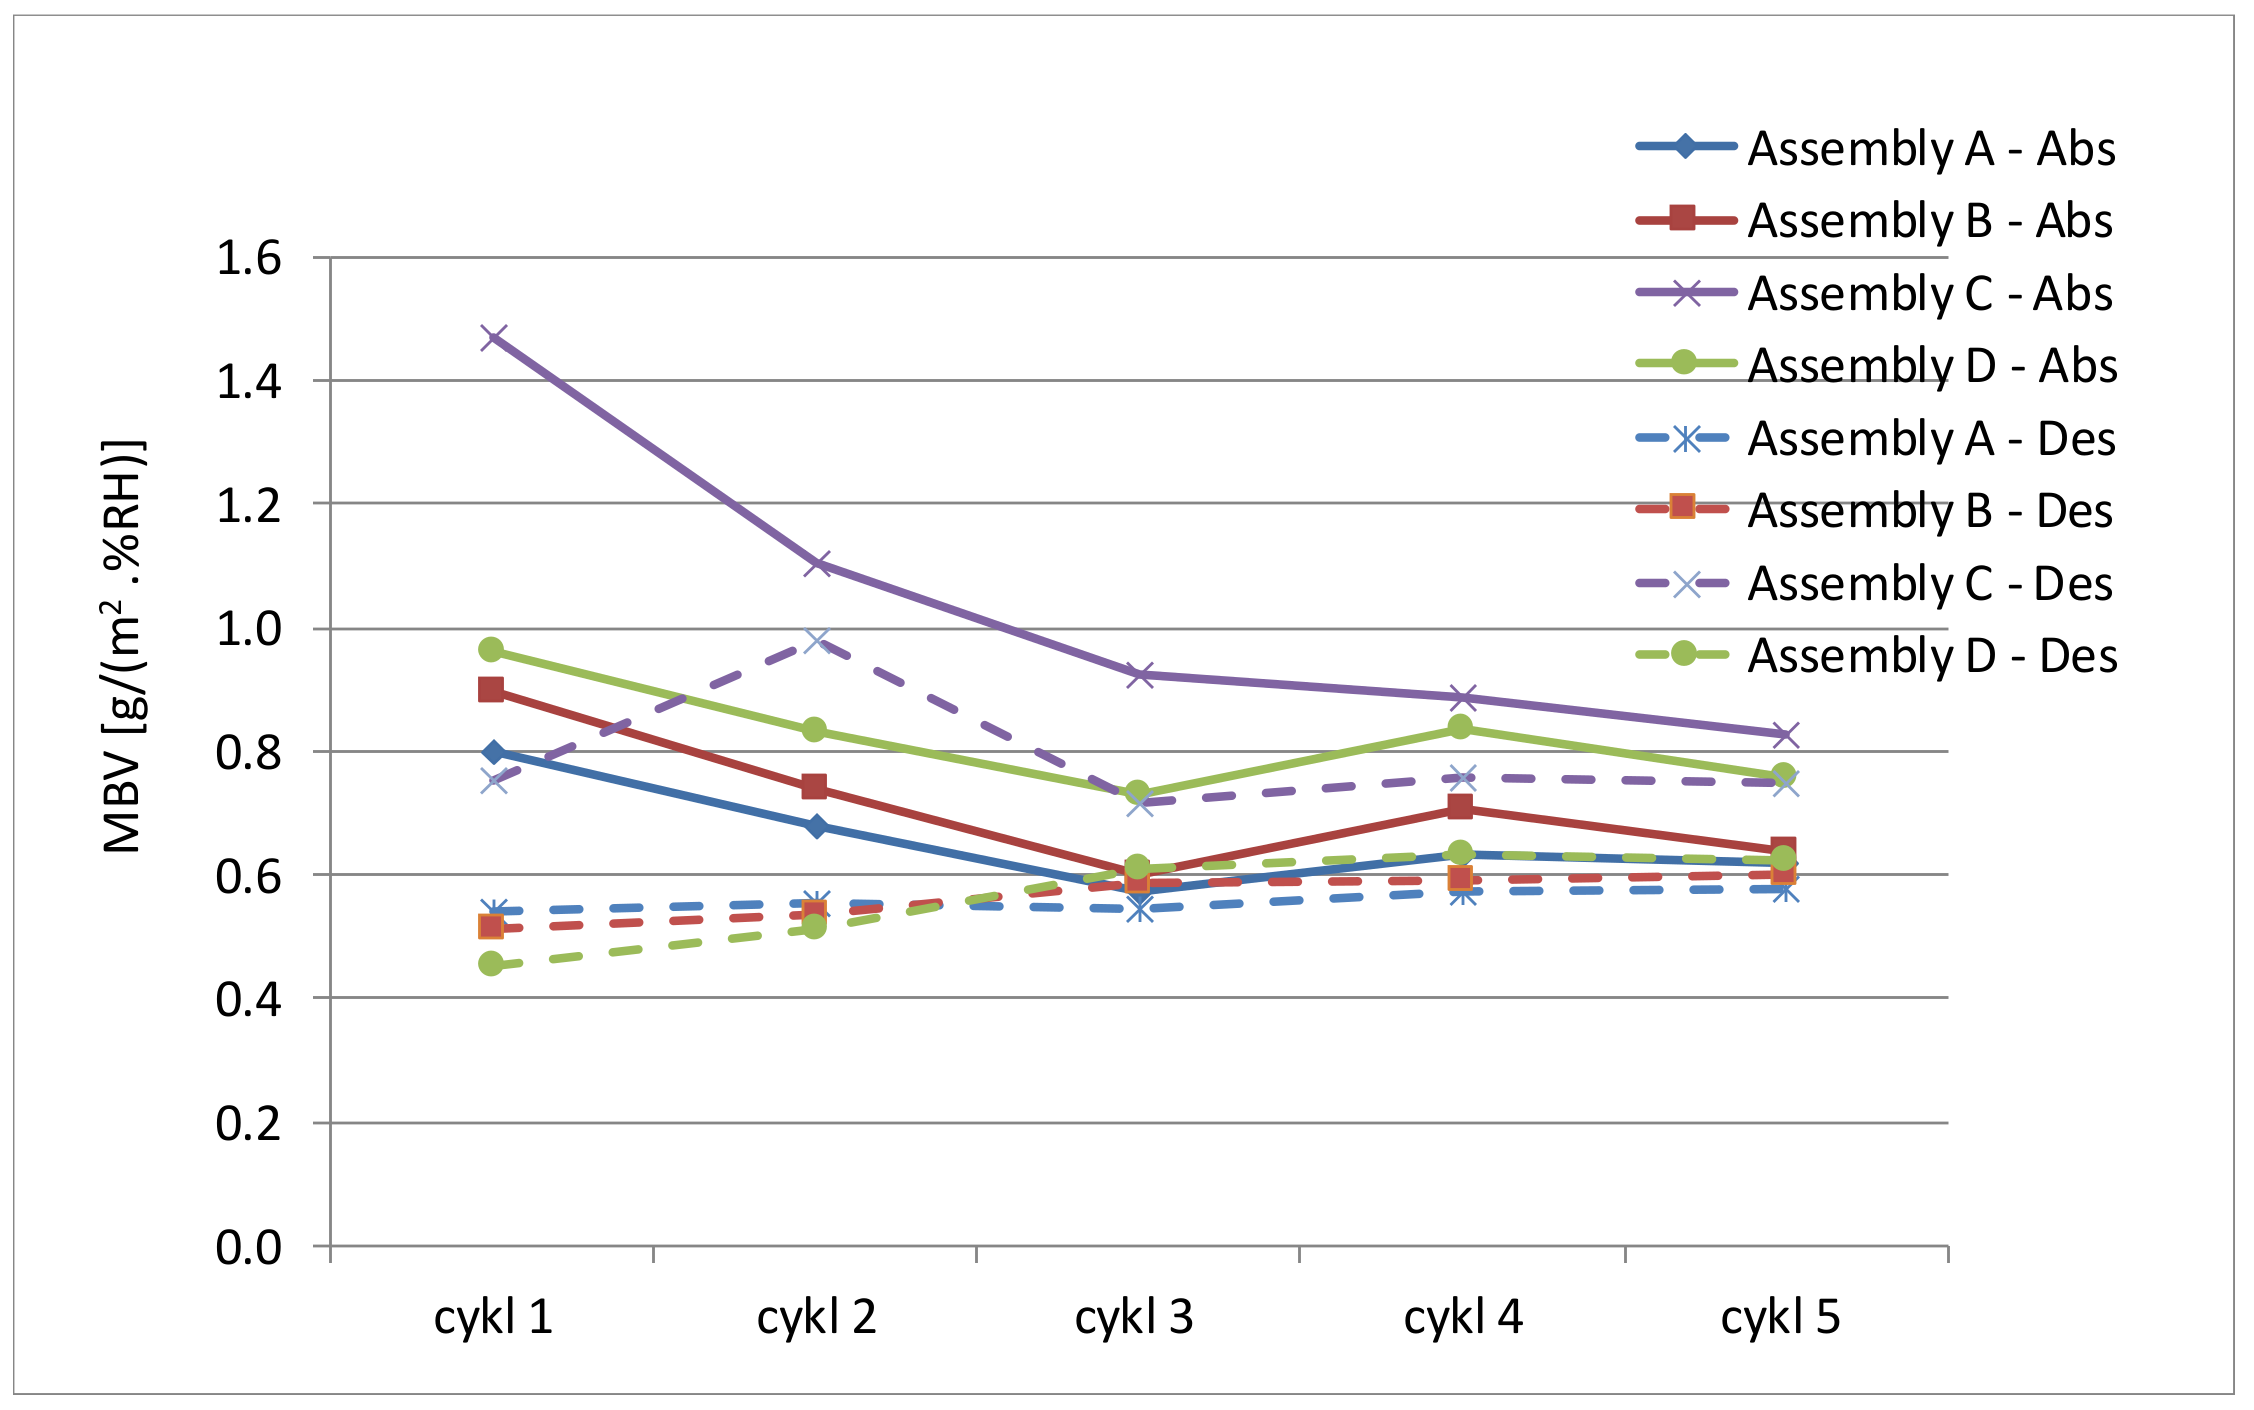
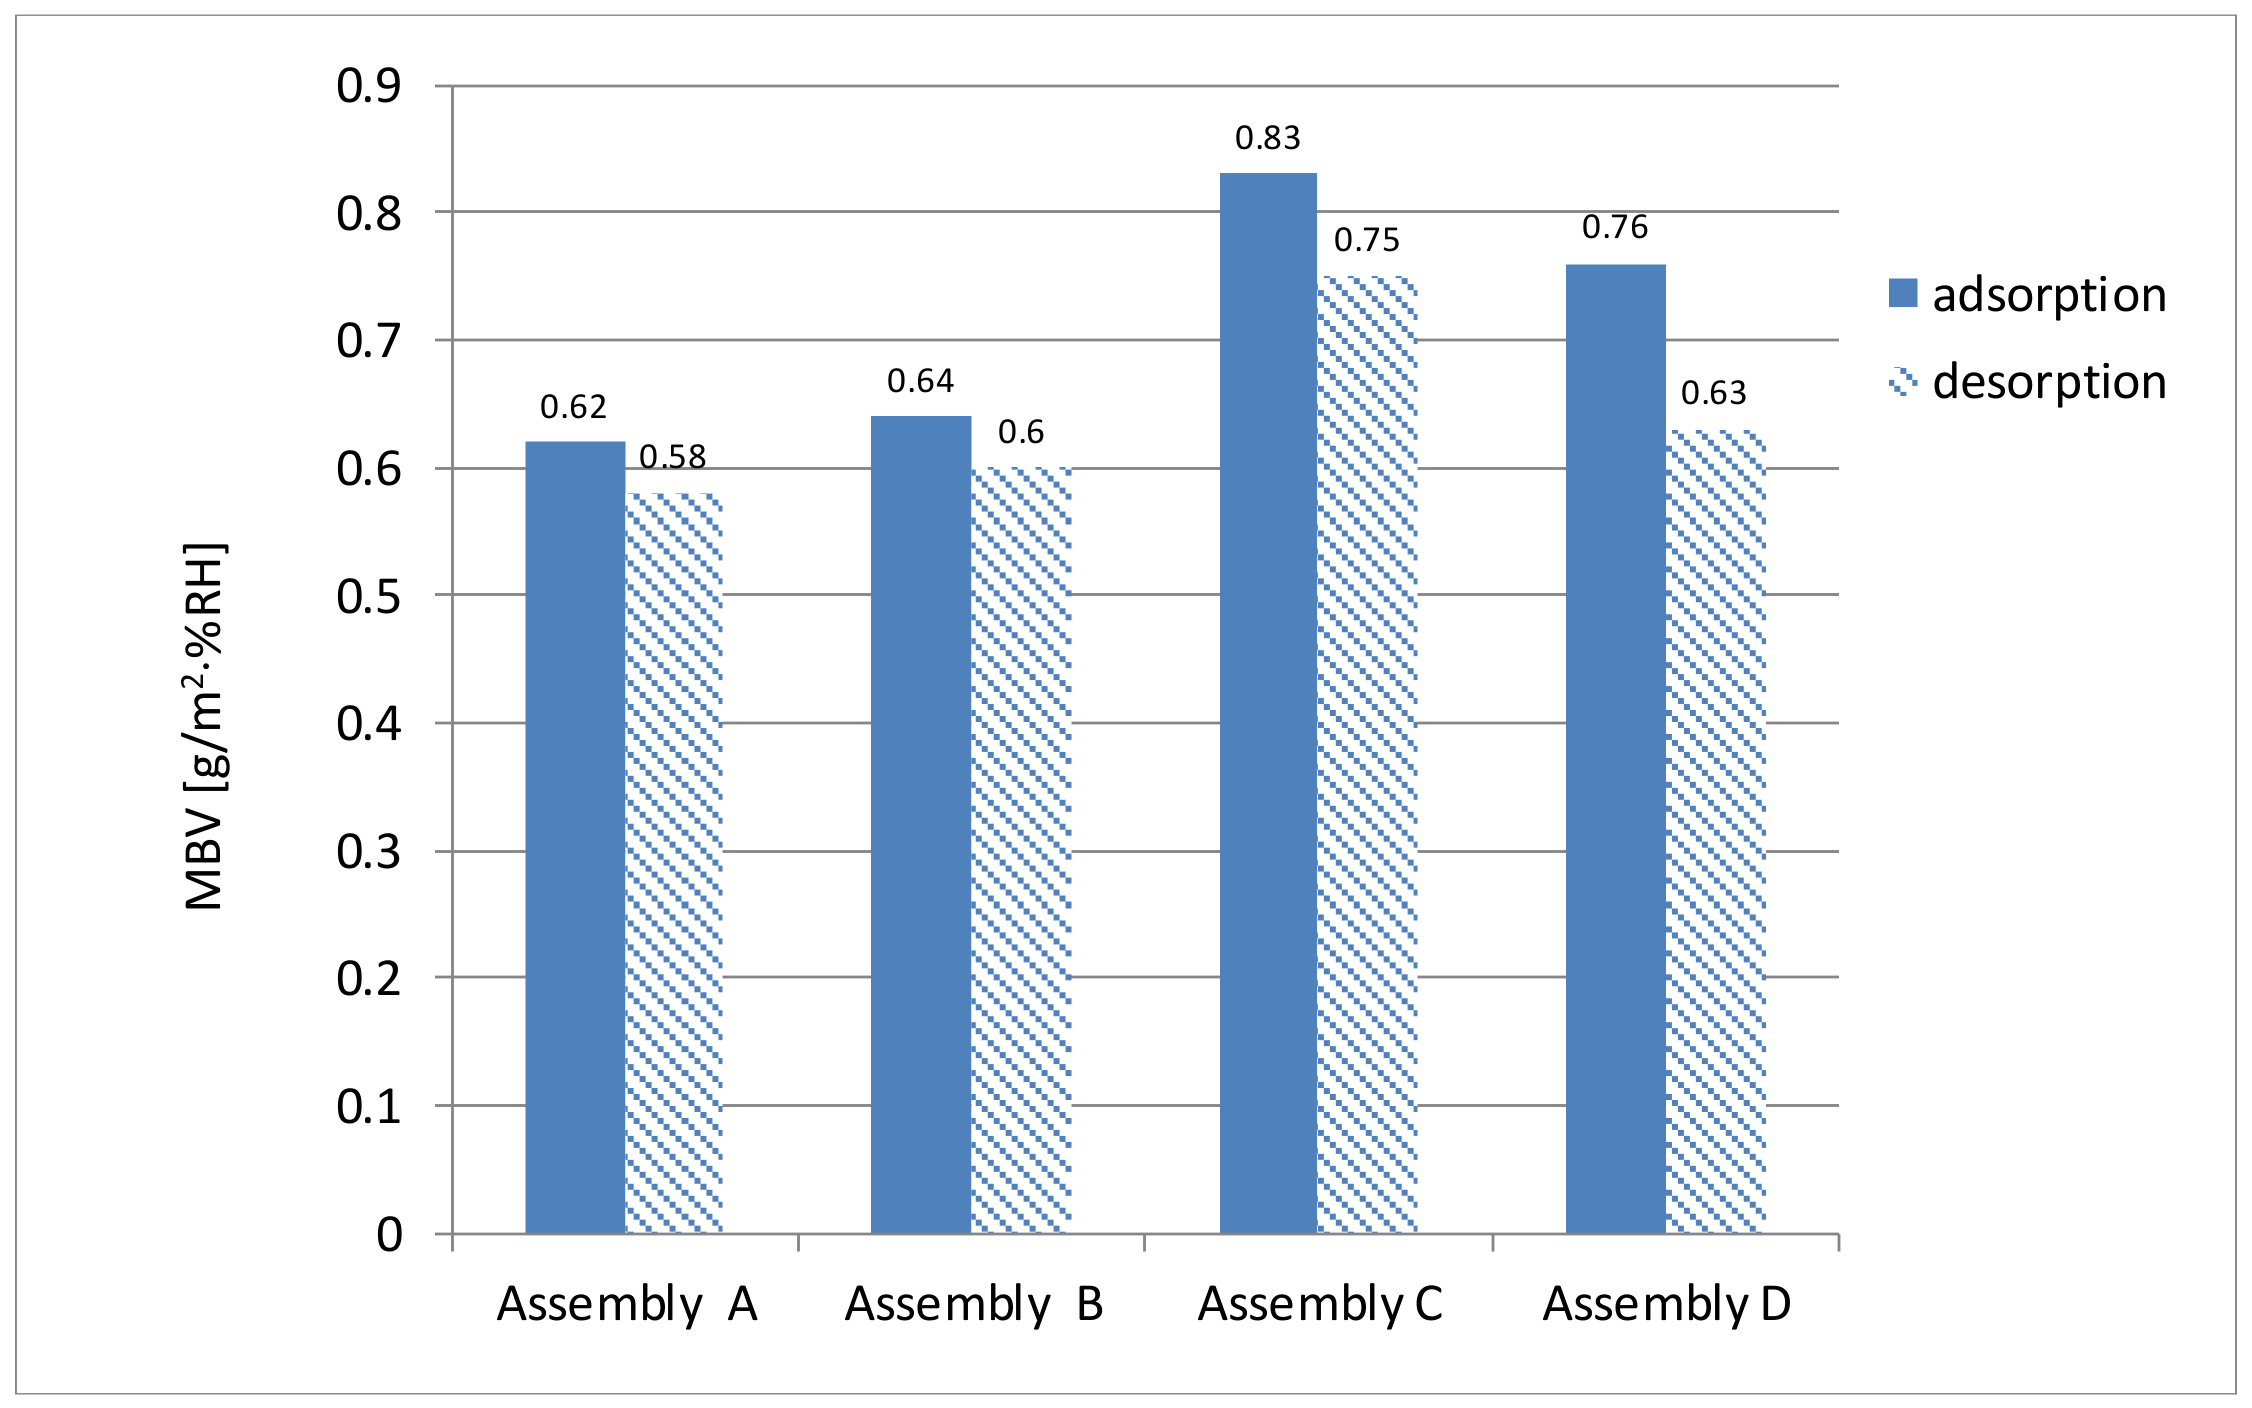
3.2. Moisture Buffering Test

Figure 4 shows the increases and decreases in the masses of individual samples in the absorption and desorption process and Figure 5 shows the MBVs calculated on the basis of these changes in relation to a given cycle. Considering the values shown in the graphs, it can be seen that only cycle 5 of Assembly A can be considered stable. In this case only, the change in the MBV between two consecutive cycles was 2.10%, which is less than 5%, indicating a state of equilibrium. In [34], it was shown that materials with small penetration depths require much longer times to achieve stable moisture-buffering cycles.
The penetration depth dp is defined as the distance between the material surface and the depth where the amplitude of the vapour pressure variation is 1% of that on the surface [20,35]. It is given by Equation (7):
d p , 1 % = 4.61 D w · t p π ,
where Dw is the moisture diffusivity of the material (m2/s), calculated as:
D w = δ a · P s a t ξ · μ ,
where δa is the vapour permeability of air (kg/(m·s·Pa)), Psat is the saturation vapour pressure (Pa), ξ is the moisture capacity (kg·m−3·%RH−1), µ is the vapour resistance factor of the material and tp = 24 h is the load cycling period.
Comparing the tested assemblies based on the moisture penetration depth values (Table 3) for individual layers, it can be seen that Assembly A (except for the exterior layers of the gypsum fibreboard (3.6.3) with dp,1% = 10.2 mm) was composed of mineral wool (4.12) with dp,1% = 610.8 mm, and reached steady state fastest. Assembly B, with an internal layer of flexible wood fibre insulation (3.3.2) with a much lower moisture penetration depth of dp,1% = 109.4 mm, did not reach steady state. Assemblies C and D, covered with several finishing layers with different values of moisture penetration depth, also did not achieve a stable moisture-buffering cycle. Therefore, we can expect Assembly D to be the last assembly to reach equilibrium, as it had the lowest penetration depth values for the individual layers.
Figure 6 shows the MBVs for each sample, determined on the basis of the values recorded for the last (fifth) test cycle. The MBVs for absorption in all assembly samples were in the range 0.83–0.62 g·m−2·%RH−1, while the MBVs for desorption were in the range 0.75–0.58 g·m−2·%RH−1. Referring these results to the MBV classes shown in Figure 3, we can see that all the tested assemblies were characterized by a moderate predisposition to moisture buffering.
Comparing walls of similar construction, we see that Assembly B showed a slightly higher MBV than Assembly A, by 3.2% in the case of adsorption and by 3.4% in the case of desorption. As already mentioned, these two wall assemblies differed only in the type of internal insulation used. In the case of Assembly A, this was ECOSE mineral wool (4.12) with a density of 15 kg/m3, while in the case of Assembly B, it was flexible Pavaflex fibreboard (3.2.2) with a density of 70 kg/m3. Furthermore, both mineral wool (4.12) and fibreboard (3.2.2) were characterized by low and comparable vapour diffusion resistance factors μ (Table 2), but differed in the slope of the sorption isotherm (Figure 2). The curve for Pavaflex fibreboards (3.2.2) was at a higher level than the curve for ECOSE mineral wool (4.12). The slopes of the adsorption curves determine the moisture capacity ξ, and a higher moisture capacity seems to correlate with a higher dynamic adsorption [36]. Therefore, the MBV of Assembly B could be slightly higher than that of Assembly A.
In turn, comparison of the 12.2-cm thick walls indicates a 9.21% increase in MBV for absorption and a 19.04% increase for desorption (for Assembly C compared to Assembly D). Here also, the difference in wall construction was limited to the composition of the internal layers. In the case of Assembly C, there was a 40-mm layer of ECOSE mineral wool (4.12) and a 20-mm air gap, while in the case of Assembly D, the inner layer was a layer of Pavaflex with a thickness of approximately 60 mm (3.3.2). A higher MBV for Assembly C indicates that, in the case of Assembly D, the internal layer of Pavaflex board was not fully active in the process of moisture buffering. The additional external layers significantly reduced the MBV capacity of the internal layer and changed the overall performance of the whole wall assembly.
From the results, it can be observed that the wall assemblies finished with earth plaster with straw showed higher MBVs. Despite the higher sorption isotherm of the finishing layer in Assembly A (gypsum board with a thickness of 12.5 mm (3.6.3)) in comparison with Assembly C (8-mm thick clay plaster (2.2.4)) and a comparable value of the vapour diffusion resistance factor (Table 2), Assembly C was characterized by a 33% higher MBV than Assembly A. Furthermore, the thickness of the finishing layer in Assembly C was lower than the calculated penetration depth (dp,1% = 18.9 mm), and therefore it may be that the water vapour penetrated through this layer and reached into the next, deeper layer. However, due to the very high affinity of the clay for water molecules, some of the moisture may also have been drawn in and held by ionic bonding with the clay particles themselves. This indicates that the actual penetration depth washigher than the calculated depth. The same results have been observed by Rahim et al. [37].
In a multilayer wall, the MBV of each layer may contribute to the MBV of the assembly, and therefore the behaviour of the whole assembly cannot be assessed in a simple way. To look more closely at how the individual layers can affect the MBV of the assembly, the MBVs of the following materials were also tested: Pavaboard (3.2), Pavaflex (3.3.2) and gypsum fibreboard (3.6.3).
A moisture buffering test was performed using DVS (dynamic vapour sorption) equipment with the same time period and RH level as for the climatic chamber tests. Measurements using the DVS technique were made on small samples of less than 1 g, with all surfaces exposed.
The kinetics of sorption of the selected materials are presented in Figure 7 and the MBV results are in Figure 8.
Comparing the MBVs of selected materials with the MBVs of the assemblies, we observe that the MBVs of individual materials are higher. The MBV of gypsum fibreboard (3.6.3) is 30% higher than that of Assembly A and 28% higher than that of Assembly B, and the MBV of Pavaboard (3.2) is 81% higher than that of Assembly C and 98% higher than that of Assembly D. This implies that the internal layer did not fully participate in the moisture buffering of the assembly, and the coating layers were more active. This can be partially attributed to the vapour diffusion resistance factor of the individual materials, which, combined with the effect of thickness, could decrease the moisture-buffering capacity of the internal layer, especially the flexible wood fibreboard (Pavaflex) (3.3.2) in Assembly D.
Looking further at the obtained results, we see that with such a small sample (on the order of 1 g) and considering the specificity of the DVS test, the MBVs for wood fibreboards did not differ significantly. The MBV of Pavaboard (3.2) is 9% higher than that of Pavaflex (3.3.2). However, in many studies carried out in climatic chambers, it has been proven that the internal structure, and especially the particle size distribution, has a greater effect on moisture uptake than the density [16,36,38].

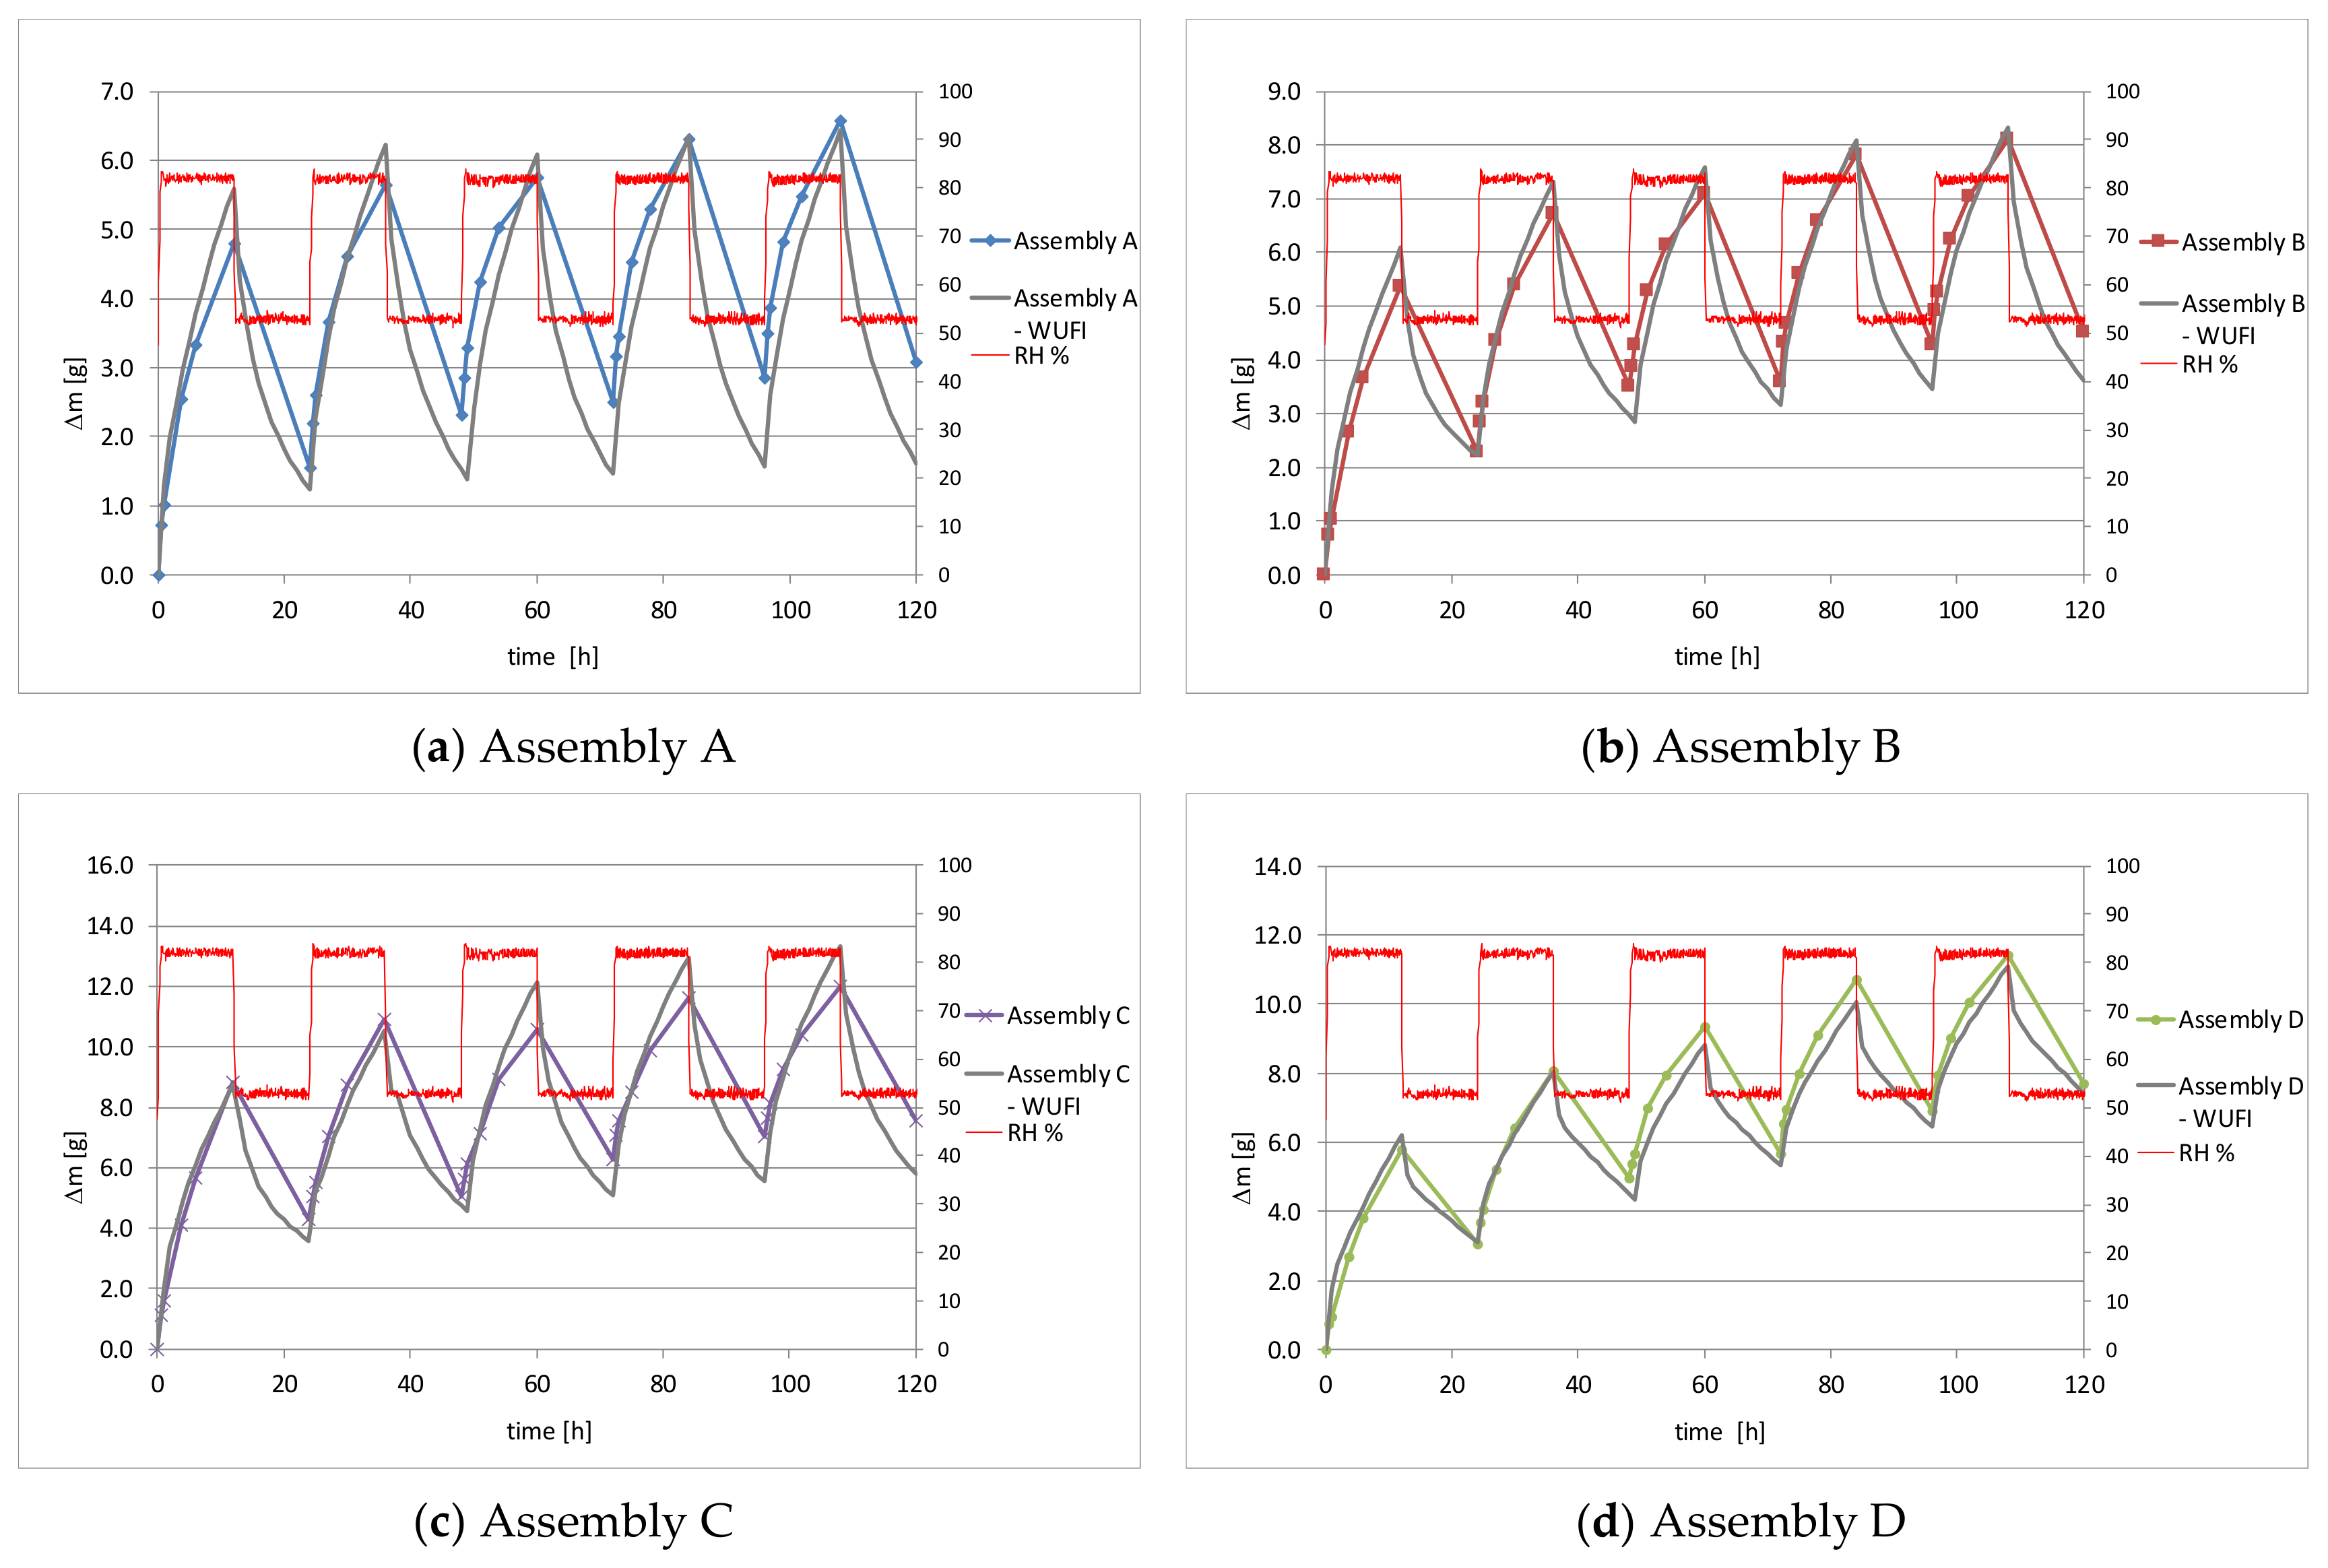
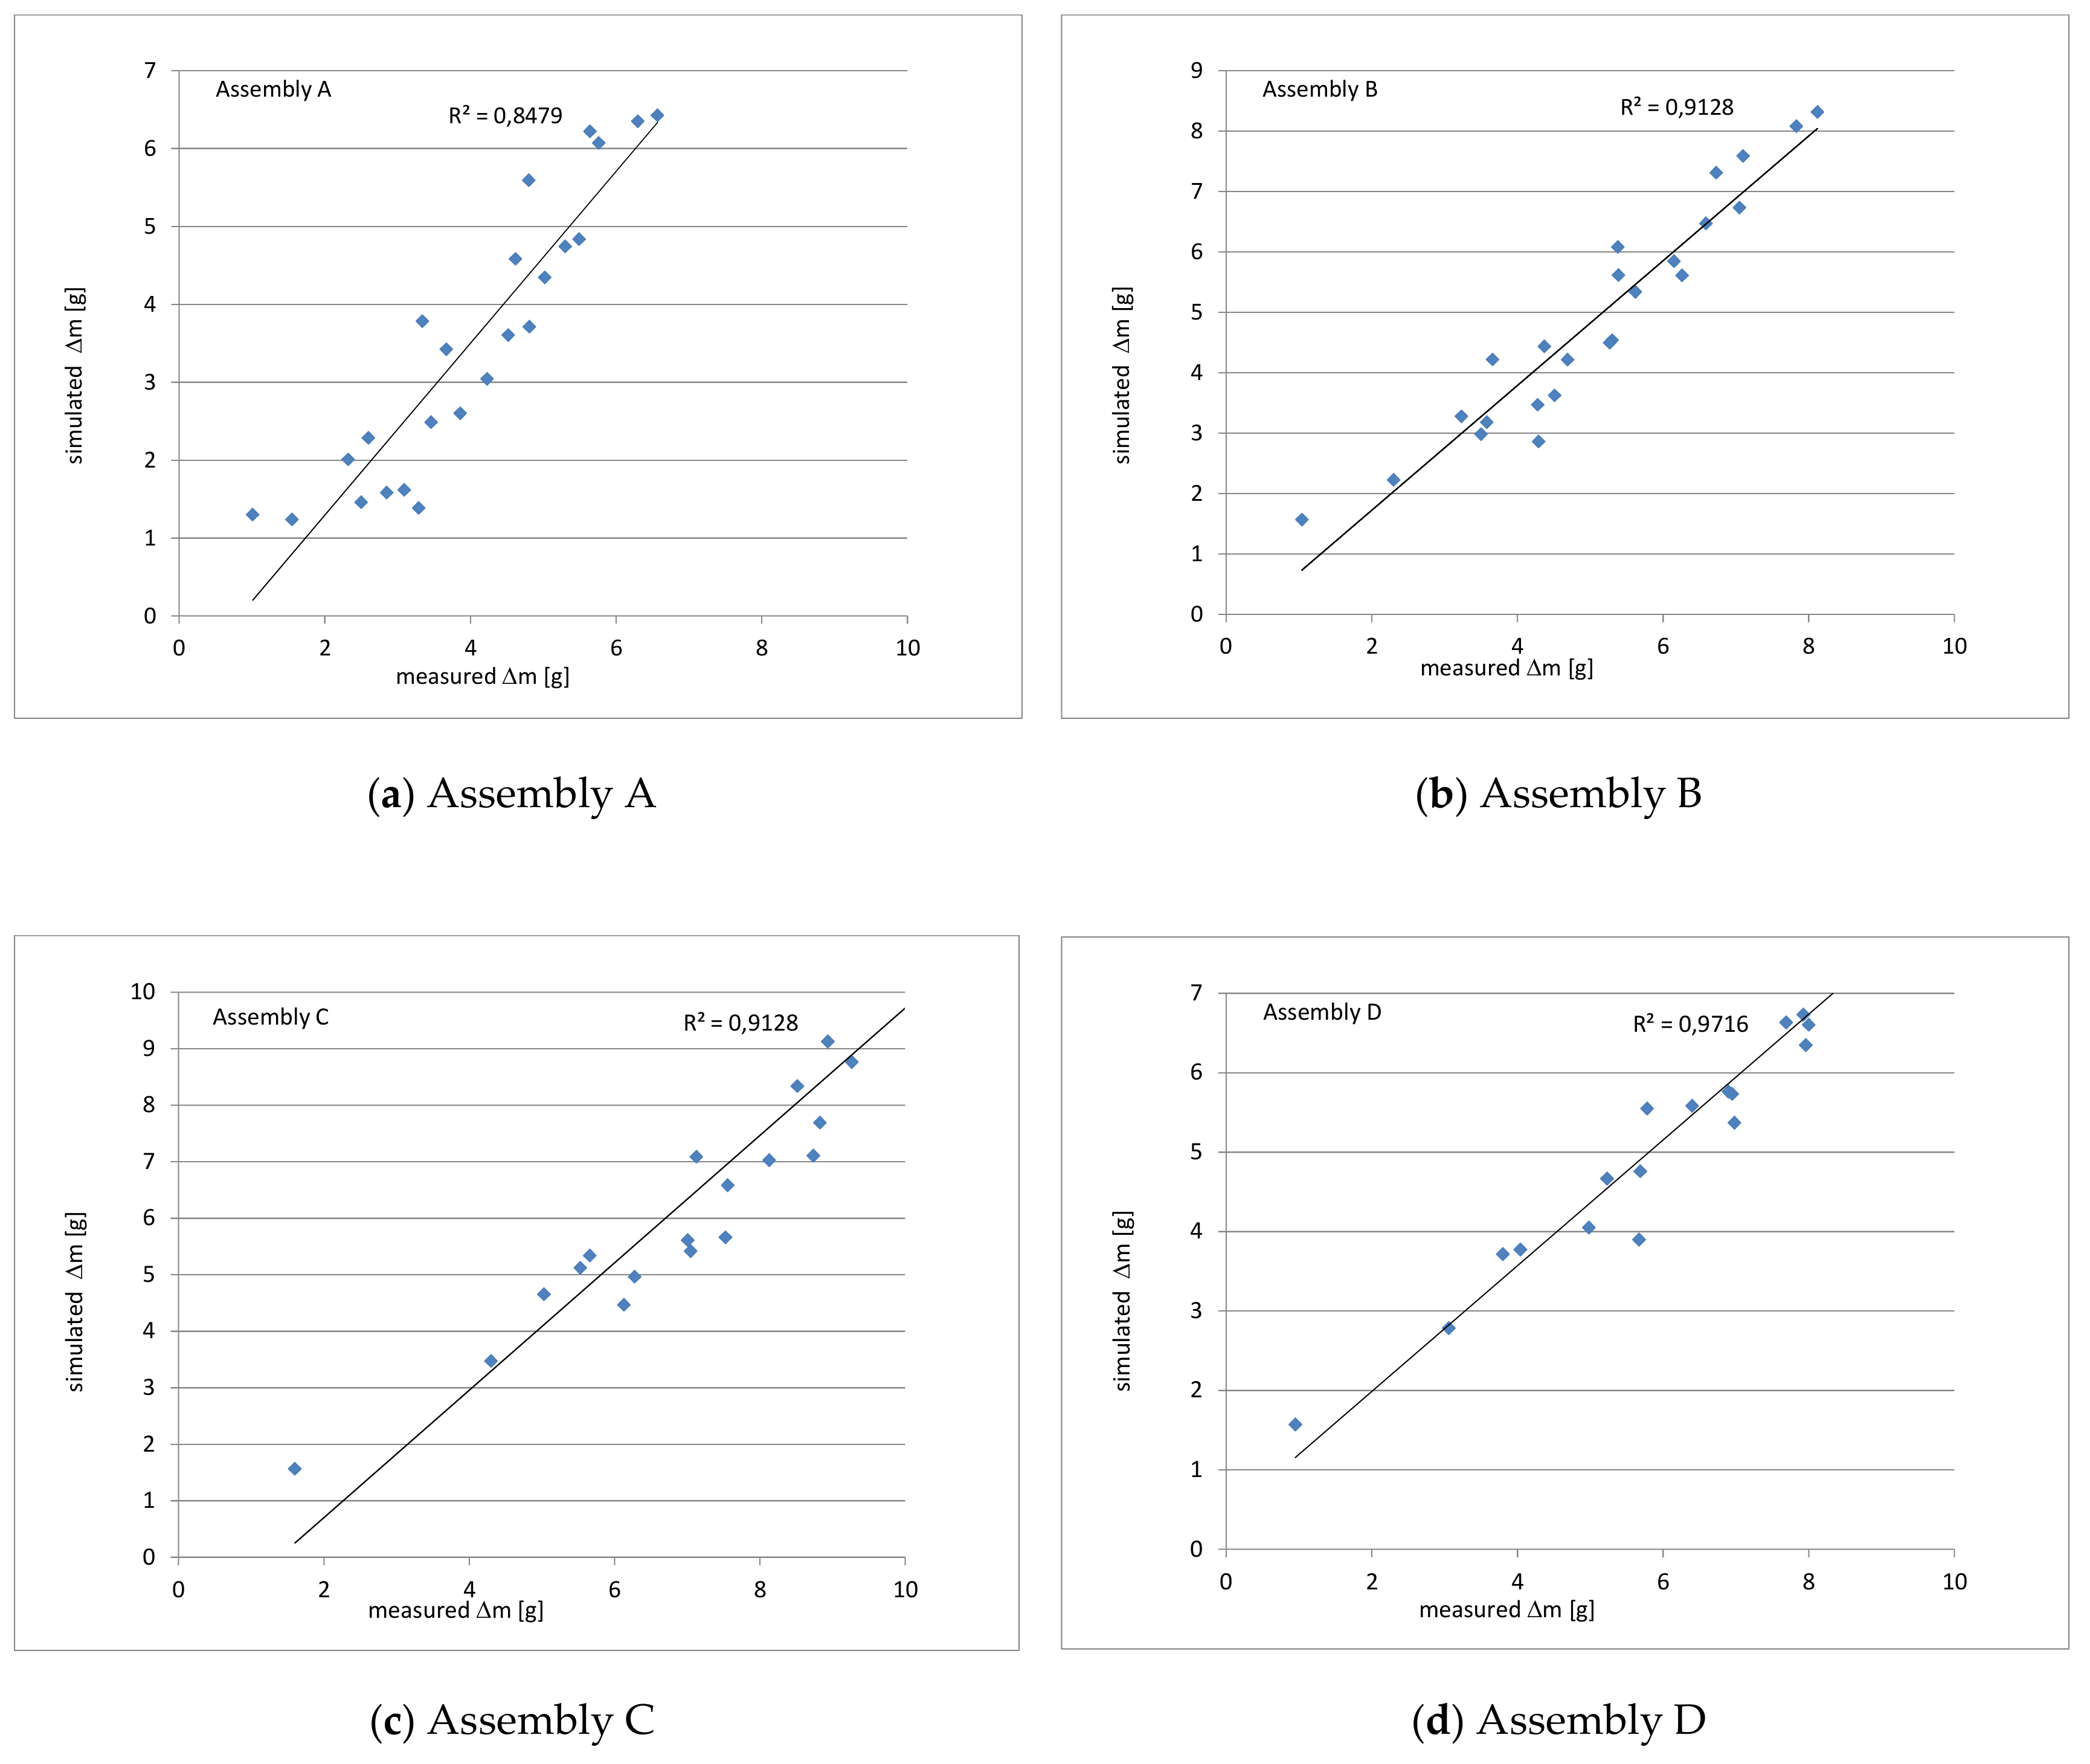
4. Comparison between Simulation and Experiments

The hygrothermal simulation was compared with the experimental results. The well-known and widely validated computer simulation program WUFI Pro 5.3 (Fraunhofer Institute for Building Physics, Holzkirchen, Germany) [23,39] was used to evaluate the hygrothermal behaviour of walls. WUFI Pro considers coupled heat and moisture transfer through the assembly and complies with the EN 15026 standard [40]. To reproduce the experimental protocol described in Section 3.1, the partition walls were set to a temperature of 23 °C and a relative humidity of 50%, and the simulation was performed until a steady state was reached. Then, external and internal temperatures were fixed at 20 °C and the final moisture content profile was adopted as the initial boundary conditions for further simulation, where the humidity was changed cyclically between 50% and 80% every 12 h for five days. No sun, rain or wind were introduced into the artificial climate file. Comparisons between simulation and experimental results for each assembly are shown in Figure 9.
We note that there are discrepancies between the results. In the initial cycles, the simulation results underestimate the adsorption process, but subsequently the situation is reversed. The simulation results underestimate the adsorption process and overestimate the desorption process, but the data from the simulations follow the same trend as the experimental data.
Numerous studies report similar observations [19,41,42,43]. These differences are usually assigned to uncertainties in input material data and boundary conditions, especially in the case of highly hygroscopic bio-based or wood-based materials made of natural products, whose properties may vary slightly from one sample to another. In the literature, we find several studies reporting that deviations appear when the samples are subjected to a rapidly changing dynamic load [22,43]. The key role is assigned to the sorption isotherm and the vapour permeability, which should be estimated via a dynamic method instead of the standard steady-state method.
Additionally, in order to quantitatively compare the discrepancy between the model and the measurements, a root mean-square error (RMSE) correlation coefficient was calculated, using the following equation:
R M S E = i = 1 N x m e a s x m o d e l 2 / N ,
where Xmeas are the measured data, Xmodel are the modelled data and N is the number of data points.
The value of RMSE is 0.86 for Assembly A, 0.64 for Assembly B, 1.09 for Assembly C and 0.81 for Assembly D; this shows that there is a small discrepancy between the modelled and measured results. Moreover, a linear regression was used to calculate a correlation factor between the measured and simulated values, as shown in Figure 10. The correlation factors were 0.85 for Assembly A, 0.91 for Assembly B, 0.91 for Assembly C and 0.97 for Assembly D. The correlation is very good; the factors indicate that the simulated results calculated by the software are consistent with the measured data. The accuracy of the simulated results is sufficient to enable use of the simulation method to study the moisture-buffering effect in practical applications.

5. Conclusions

This paper assesses various internal wall assemblies by comparing their moisture buffer values (MBVs). Because there is no single globally agreed method for determining MBVs, a modified Nordtest protocol was used in this study. This step response method is not representative of real indoor RH variation, but is a simplified way to present the effect of different internal and external layers on the MBV of the wall assembly. From a hygric point of view, all wall assemblies had a moisture-buffering capacity corresponding to the Nordtest ‘moderate’ category.
From the results, the MBV of Assembly A was slightly higher than that of Assembly B. Assembly A and Assembly B differed only in the type of internal insulation used. Both insulation materials had low and comparable vapour diffusion resistance factors μ, but the slope of the sorption isotherm was higher for the Pavaflex fibreboards used in Assembly B than for the mineral wool ECOSE used in Assembly A. Thus, the higher the adsorption curve and moisture capacity ξ, the higher the moisture accumulation in the material.
In turn, the higher MBV of Assembly C than of Assembly D indicates that, in the case of Assembly D, the internal layer of Pavaflex board, despite the higher sorption isotherm, was not fully active in the process of moisture buffering. The additional external layers significantly reduced the MBV capacity of the internal layer and changed the overall performance of the whole wall assembly.
The comparison of the MBVs between selected materials (wood fibreboard—Pavaflex, Pavaboard and gypsum fibreboard) and the MBVs of the assemblies showed that the MBVs of individual materials are higher. This can partially be attributed to the vapour diffusion resistance factor of the individual materials, which, combined with the effect of thickness, could decrease the moisture-buffering capacity of the internal layer, especially the flexible wood fibreboard (Pavaflex) in Assembly D. This implies that the internal layers were not fully participating in the moisture buffering of assemblies.
In addition, the comparison of the moisture penetration depth values for individual layers of the tested assemblies confirmed that wall assemblies made of layers with materials characterized by a lower value of penetration depth reach steady state more slowly. Wall assemblies finished with earthen plaster with straw showed a higher MBV than assemblies covered with gypsum board, despite the higher sorption isotherm of gypsum board compared to clay plaster and the comparable vapour diffusion coefficient of resistance. The thickness of the plaster with straw was smaller than the penetration depth calculated for it. It can therefore be concluded that if the penetration depth value dp of the outer layer is greater than its thickness, vapour penetrates through this layer and reaches into the deeper layer.
The present research confirmed the results of previous studies that suggested that one layer can have a significant effect on the response of another layer, and therefore the hygric behaviour of whole assemblies cannot be assessed in a simple way.
Since the hygric performance of multilayer structures with different types of coating and hygroscopic layers is difficult to predict, simulation seems to be a good tool for studying hygrothermal behaviour. The WUFI Pro tool, as a widely available and easy-to-use computer tool, was chosen to perform the simulations. Despite the discrepancies between the measured and simulated values, it can be used as a simplified method for helping designers make decisions about which materials to choose to improve the moisture-buffering effect.

Funding

This research received no external funding.

Acknowledgments

The author would like to thank all other members of the research team for their help in testing the hygrothermal properties of materials.

Conflicts of Interest

The author declares no conflict of interest.

References

  1. Directive (EU) 2018/844 of the European Parliament and of the Council of 30 May 2018 Amending Directive 2010/31/EU on the Energy Performance of Buildings and Directive 2012/27/EU on Energy Efficiency. Available online: https://eur-lex.europa.eu/legal-content/EN/TXT/?uri=uriserv%3AOJ.L_.2018.156.01.0075.01.ENG (accessed on 12 April 2018).
  2. Korjenic, A.; Zach, J.; Hroudová, J. The use of insulating materials based on natural fibers in combination with plant facades in building constructions. Energy Build. 2016, 116, 45–58. [Google Scholar] [CrossRef]
  3. Limam, A.; Zerizer, A.; Quenard, D.; Sallee, H.; Chenak, A. Experimental thermal characterization of bio-based materials (Aleppo Pine wood, cork and their composites) for building insulation. Energy Build. 2016, 116, 89–95. [Google Scholar] [CrossRef]
  4. Madhumathi, A.; Sundarraja, M.C.; Shanthipriya, R. A comparative study of the thermal comfort of different building materials in Madurai. Int. J. Earth Sci. Eng. 2014, 7, 1004–1018. [Google Scholar]
  5. Salonvaara, M.; Ojanen, T.; Holm, A.; Künzel, H.M.; Karagiozis, A.N. Moisture Buffering Effects on Indoor Air Quality-experimental and Simulation Results. In Proceedings of the Performance of Exterior Envelopes of Whole Buildings IX International Conference, Clearwater Beach, FL, USA, 5 December 2004. [Google Scholar]
  6. Simonson, C. Energy consumption and ventilation performance of a naturally ventilated ecological house in a cold climate. Energy Build. 2005, 37, 23–35. [Google Scholar] [CrossRef]
  7. Woloszyn, M.; Kalamees, T.; Abadie, M.O.; Steeman, M.; Kalagasidis, A.S. The effect of combining a relative-humidity-sensitive ventilation system with the moisture-buffering capacity of materials on indoor climate and energy efficiency of buildings. Build. Environ. 2009, 44, 515–524. [Google Scholar] [CrossRef]
  8. Osanyintola, O.F.; Simonson, C.J. Moisture buffering capacity of hygroscopic building materials: Experimental facilities and energy impact. Energy Build. 2006, 38, 1270–1282. [Google Scholar] [CrossRef]
  9. Zhang, M.; Qin, M.; Rode, C.; Chen, Z. Moisture buffering phenomenon and its impact on building energy consumption. Appl. Therm. Eng. 2017, 124, 337–345. [Google Scholar] [CrossRef]
  10. Rode, C.; Peuhkuri, R.H.; Mortensen, L.H.; Hansen, K.K. Moisture Buffering of Building Materials. 2005 Final Report. Technical University of Denmark. Available online: https://core.ac.uk/download/pdf/60659981.pdf (accessed on 5 January 2019).
  11. Padfied, T. The Role of Absorbent Building Materials. In Moderating Changes of Relative Humidity in Department of Structural Engineering and Materials. Ph. D. Thesis, The Technical University of Denmark, Lyngby, Denmark, 1998. [Google Scholar]
  12. McGregor, F.; Heath, A.; Fodde, E.; Shea, A. Conditions affecting the moisture buffering measurement performed on compressed earth blocks. Build. Environ. 2014, 75, 11–18. [Google Scholar] [CrossRef] [Green Version]
  13. Dubois, S.; McGregor, F.; Evrard, A.; Heath, A.; Lebeau, F. An inverse modelling approach to estimate the hygric parameters of clay-based masonry during a Moisture Buffer Value test. Build. Environ. 2014, 81, 192–203. [Google Scholar] [CrossRef] [Green Version]
  14. Laborel-Préneron, A.; Magniont, C.; Aubert, J.E. Hygrothermal properties of unfired earth bricks: Effect of barley straw, hemp shiv and corn cob addition. Energy Build. 2018, 178, 265–278. [Google Scholar] [CrossRef]
  15. Palumbo, M.; Lacasta, A.M.; Holcroft, N.; Shea, A.; Walker, P. Determination of hygrothermal parameters of experimental and commercial bio-based insulation materials. Constr. Build. Mater. 2016, 124, 269–275. [Google Scholar] [CrossRef] [Green Version]
  16. Nguyen, D.M.; Grillet, A.-C.; Diep, T.M.H.; Thuc, C.N.H.; Woloszyn, M. Hygrothermal properties of bio-insulation building materials based on bamboo fibers and bio-glues. Constr. Build. Mater. 2017, 155, 852–866. [Google Scholar] [CrossRef]
  17. Evrard, A.; Herde, D. Hygrothermal performance of lime hemp wall assemblies. J. Build. Phys. 2010, 34, 15–25. [Google Scholar] [CrossRef]
  18. Mortensen, L.H.; Rode, C.; Peuhkuri, R.H. Full Scale Tests of Moisture Buffer Capacity of Wall Materials. In Proceedings of the 7th Symposium on Building Physics in the Nordic Countries, Reykjavik, Iceland, 13–15 June 2005; The Icelandic Building Research Institute, IBRI, 2005. Available online: https://orbit.dtu.dk/files/122242065/Paper_NBPS2005_passys_ver.1.1_w_header.pdf (accessed on 25 January 2019).
  19. Colinart, T.; Lelievre, D.; Glouannec, P. Experimental and numerical analysis of the transient hygrothermal behavior of multilayered hemp concrete wall. Energy Build. 2016, 112, 1–11. [Google Scholar] [CrossRef]
  20. Latif, E.; Lawrence, M.; Shea, A.; Walker, P.; Walker, P. Moisture buffer potential of experimental wall assemblies incorporating formulated hemp-lime. Build. Environ. 2015, 93, 199–209. [Google Scholar] [CrossRef] [Green Version]
  21. Ojanen, T.; Salonvaara, M. A Method to Determine the Moisture Buffering Effect of Structures During Diurnal Cycles of Indoor Air Moisture Loads. In Proceeding of the 2nd International Building Physics Conference, Leuven, Belgium, 14–18 September 2003. [Google Scholar]
  22. Busser, T.; Berger, J.; Piot, A.; Pailha, M.; Woloszyn, M. Experimental Validation of Hygrothermal Models for Building Materials and Walls: An Analysis of Recent Trends. 2018. Available online: https://hal.archives-ouvertes.fr/hal-01678857/document (accessed on 15 April 2019).
  23. IBP. WUFI® Pro Version 5.3; Fraunhofer Institute for Building Physics: Holzkirchen, Germany, 2015. [Google Scholar]
  24. EN 12664. Thermal Performance of Building Materials and Products. Determination of Thermal Resistance by Means of Guarded Hot Plate and Heat Flow Meter Methods. Dry and Moist Products of Medium and Low Thermal Resistance; CEN: Brussels, Belgium, 2002. [Google Scholar]
  25. ISO 12571. Hygrothermal Performance of Building Materials and Products. Determination of Hydroscopic Sorption Properties; International Organization for Standardization: Geneva, Switzerland, 2013. [Google Scholar]
  26. ISO 12572. Hygrothermal Performance of Building Materials and Products. Determination of Water Vapour Transmission Properties-Cup Method; International Organization for Standardization: Geneva, Switzerland, 2016. [Google Scholar]
  27. EN 1602. Thermal Insulating Products for Building Applications. Determination of the Apparent Density; CEN: Brussels, Belgium, 2013. [Google Scholar]
  28. JISA 1470-1. Test Method of Adsorption/desorption Efficiency for Building Materials to Regulate an Indoor Humidity–Part 1: Response method of Humidity Japan; Japanese Standards Association: Tokyo, Japan, 2002. [Google Scholar]
  29. ISO 24353. Hygrothermal Performance of Building Materials and Products. Determination of Moisture Adsorption/Desorption Properties in Response to Humidity Variation; International Organization for Standardization: Geneva, Switzerland, 2008. [Google Scholar]
  30. Padfied, T.; Jeansen, L. Humidity Buffering by Absorbent Materials. 2010. Available online: https://www.conservationphysics.org/ppubs/humidity_buffering_building_interiors_nsb2011.pdf (accessed on 22 November 2018).
  31. Wu, Y.; Gong, G.; Yu, C.W.; Huang, Z. Proposing ultimate moisture buffering value (UMBV) for characterization of composite porous mortars. Constr. Build. Mater. 2015, 82, 81–88. [Google Scholar] [CrossRef]
  32. DIN 18947. Earth Plasters–Terms and Definitions, Requirements, Test Methods; NABau: Berlin, Germany, 2013. (In German) [Google Scholar]
  33. Busser, T.; Piot, A.; Pailha, M.; Bejat, T.; Woloszyn, M. From Materials Properties to Modelling Hygrothermal Transfers of Highly Hygroscopic Walls; CESBP: Dresden, Germany, 2016; Available online: https://www.researchgate.net/publication/308266233_from_materials_properties_to_modelling_hygrothermal_transfers_of_highly_hygroscopic_walls (accessed on 15 March 2019).
  34. Ge, H.; Yang, X.; Fazio, P.; Rao, J. Influence of moisture load profiles on moisture buffering potential and moisture residuals of three groups of hygroscopic materials. Build. Environ. 2014, 81, 162–171. [Google Scholar] [CrossRef]
  35. Abadie, M.O.; Mendonça, K.C. Moisture performance of building materials: From material characterization to building simulation using the Moisture Buffer Value concept. Build. Environ. 2009, 44, 388–401. [Google Scholar] [CrossRef]
  36. McGregor, F.; Heath, A.; Shea, A.; Lawrence, M. The moisture buffering capacity of unfired clay masonry. Build. Environ. 2014, 82, 599–607. [Google Scholar] [CrossRef] [Green Version]
  37. Rahim, M.; Douzane, O.; Le, A.T.; Promis, G.; Laidoudi, B.; Crigny, A.; Dupre, B.; Langlet, T. Characterization of flax lime and hemp lime concretes: Hygric properties and moisture buffer capacity. Energy Build. 2015, 88, 91–99. [Google Scholar] [CrossRef]
  38. Belakroum, R.; Gherfi, A.; Kadja, M.; Maalouf, C.; Lachi, M.; El Wakil, N.; Mai, T. Design and properties of a new sustainable construction material based on date palm fibers and lime. Constr. Build. Mater. 2018, 184, 330–343. [Google Scholar] [CrossRef]
  39. Kalamees, T.; Vinha, J. Hygrothermal calculations and laboratory tests on timber-framed wall structures. Build. Environ. 2003, 38, 689–697. [Google Scholar] [CrossRef]
  40. EN 15026. Hygrothermal Performance of Building Components and Building Elements—Assessment of Moisture Transfer by Numerical Simulation; CEN: Brussels, Belgium, 2007. [Google Scholar]
  41. James, C.; Simonson, C.J.; Talukdar, P.; Roels, S. Numerical and experimental data set for benchmarking hygroscopic buffering models. Int. J. Heat Mass Transf. 2010, 53, 3638–3654. [Google Scholar] [CrossRef]
  42. Talukdar, P.; Osanyintola, O.F.; Olutimayin, S.O.; Simonson, C.J. An experimental data set for benchmarking 1-D, transient heat and moisture transfer models of hygroscopic building materials. Part II: Experimental, numerical and analytical data. Int. J. Heat Mass Transf. 2007, 50, 4915–4926. [Google Scholar] [CrossRef]
  43. Busser, T.; Berger, J.; Piot, A.; Pailha, M.; Woloszyn, M. Dynamic experimental method for identification of hygric parameters of a hygroscopic material. Build. Environ. 2018, 131, 197–209. [Google Scholar] [CrossRef]
Figure 1. Investigated wall assembly samples.
Applsci 09 03438 g001
Figure 2. Water content according to relative humidity at 50%, 65% and 90%.
Applsci 09 03438 g002
Figure 3. Sorption/desorption kinetics at 80% and 50% RH.
Applsci 09 03438 g003
Figure 4. Measured changes in mass of individual assemblies during the adsorption and desorption phases.
Applsci 09 03438 g004
Figure 5. Moisture buffer values of the assemblies versus cycle number.
Applsci 09 03438 g005
Figure 6. Moisture buffer values for individual assemblies.
Applsci 09 03438 g006
Figure 7. Measured changes in mass of individual materials during the adsorption and desorption phases over five 24-h cycles.
Applsci 09 03438 g007
Figure 8. Moisture buffer values for individual materials.
Applsci 09 03438 g008
Figure 9. Comparisons of the numerical and experimental data, showing the change in mass of individual assemblies over five 24-h cycles: (a) Assembly A; (b) Assembly B; (c) Assembly C; (d) Assembly D.
Applsci 09 03438 g009
Figure 10. The correlations between measured and simulated results: (a) Assembly A; (b) Assembly B; (c) Assembly C; (d) Assembly D.
Applsci 09 03438 g010
Table 1. Material properties.
MaterialsThicknessDensity Water-Vapour Resistance FactorConductivity 1Specific HeatPorosity
(mm)(kg/m3)(-)(W·m−1·K−1)(J·kg−1·K−1)(m3/m3)
20%50%80%
2.2.4 earth plaster with straw0.0081456180.710.750.948800.85
3.1 earthen adhesive0.00345670.340.3440.4048800.9
3.2 wood fibreboard Pavaboard0.02023260.0470.0480.05112000.91
3.3.2 flexible wood fibreboard Pavaflex0.0407050.0370.0380.05221000.96
3.6.3 gypsum fibreboard0.1251200150.220.230.248000.53
4.12 mineral wool ECOSE0.401530.0370.0380.0418500.9
1 Corresponding to three values of relative humidity: 20%, 50%, 80%.
Table 2. Variation in moisture uptake and release.
Sample ΔMC Uptake at 80% RH (%)ΔMC Release at 50% RH (%)
Assembly D0.960.77
Assembly C0.840.69
Assembly B0.820.75
Assembly A0.570.42
Table 3. Theoretical moisture penetration depth values.
Material ξδa (1011)dp,1%
(kg·m−1·s−1·Pa−1)(mm)
2.2.4 earth plaster with straw0.0351.1118.9
3.1 earthen adhesive0.0030.28174.3
3.2 wood fibreboard—Pavaboard0.4173.3323.8
3.3.2 flexible wood fibreboard—Pavaflex0.0824.17109.4
3.6.3 gypsum fibreboard0.4173.3310.2
4.12 mineral wool—ECOSE0.0227.5610.8

