Article

Estimation of Parameters of Parathyroid Glands Using Particle Swarm Optimization and Multivariate Generalized Gaussian Function Mixture

by
Maria H. Listewnik
1,
Hanna Piwowarska-Bilska
1,
Krzysztof Safranow
2,
Jacek Iwanowski
1,
Maria Laszczyńska
3,
Maria Chosia
4,
Marek Ostrowski
5,
Bożena Birkenfeld
1,
Dorota Oszutowska-Mazurek
6 and
Przemyslaw Mazurek
7,*
1
Department of Nuclear Medicine, Pomeranian Medical University, Unii Lubelskiej 1 St., 71252 Szczecin, Poland
2
Department of Biochemistry and Medical Chemistry, Pomeranian Medical University, Powstancow Wielkopolskich 72 Ave., 70111 Szczecin, Poland
3
Department of Histology and Developmental Biology, Pomeranian Medical University, Zolnierska 48 St., 71210 Szczecin, Poland
4
Department of Pathology, Pomeranian Medical University, Unii Lubelskiej 1 St., 71252 Szczecin, Poland
5
Department of General Surgery and Transplantology, Pomeranian Medical University, Powstancow Wielkopolskich 72 Ave., 70111 Szczecin, Poland
6
Department of Histology and Embryology, Pomeranian Medical University, Powstancow Wielkopolskich 72 Ave., 70111 Szczecin, Poland
7
Department of Signal Processing and Multimedia Engineering, West Pomeranian University of Technology Szczecin, 26. Kwietnia 10 St., 71126 Szczecin, Poland
*
Author to whom correspondence should be addressed.
Appl. Sci. 2019, 9(21), 4511; https://doi.org/10.3390/app9214511
Submission received: 1 September 2019 / Revised: 15 October 2019 / Accepted: 21 October 2019 / Published: 24 October 2019
(This article belongs to the Special Issue Advanced Intelligent Imaging Technology)

Abstract

:

Featured Application

The analyzed technique allows the estimation of parameters of small objects from SPECT volumes. Data analysis was based on Particle Swarm Optimization that reduces error between assumed model and measurements. Analysis by Synthesis was used for the estimation of parameters.

Abstract

The paper introduces a fitting method for Single-Photon Emission Computed Tomography (SPECT) images of parathyroid glands using generalized Gaussian function for quantitative assessment of preoperative parathyroid SPECT/CT scintigraphy results in a large patient cohort. Parathyroid glands are very small for SPECT acquisition and the overlapping of 3D distributions was observed. The application of multivariate generalized Gaussian function mixture allows modeling, but results depend on the optimization algorithm. Particle Swarm Optimization (PSO) with global best, ring, and random neighborhood topologies were compared. The obtained results show benefits of random neighborhood topology that gives a smaller error for 3D position and the position estimation was improved by about 3 % voxel size, but the most important is the reduction of processing time to a few minutes, compared to a few hours in relation to the random walk algorithm. Moreover, the frequency of obtaining low MSE values was more than two times higher for this topology. The presented method based on random neighborhood topology allows quantifying activity in a specific voxel in a short time and could be applied it in clinical practice.

1. Introduction

Parathyroid glands are located on the posterior surface of both thyroid lobes. They are represented by two pairs of structures: upper and lower parathyroid glands with oval shape on 2D images or ellipsoid shape in 3D volume. The size of parathyroid gland varies between 2 and 8 mm in length. There are four typically located glands in the majority (80–97%) of healthy humans, but there are various exceptions in number and location [1]. In the literature cases of up to 12 glands per patient were reported [2].
The main function of parathyroid gland is the maintenance of body’s calcium and phosphate levels and it is achieved by the production of parathyroid hormones (PTH) [3]. In parathyroid disorders, depending on etiology, uncontrolled growth of parathyroid gland or hyperplasia of all parathyroid glands with transition into adenomas is observed [4,5,6].
Surgery remains the main treatment option, and it is a relatively simple procedure if the location of parathyroid pathology is previously known. The main challenge is the preoperative localization of parathyroid pathology. Ultrasonography [7,8], magnetic resonance imaging (MRI) [9], computed tomography (CT), and scintigraphy [10] are used as preoperative imaging techniques. Modern imaging approaches use Single-Photon Emission Computed Tomography (SPECT) or Single-Photon Emission Computed Tomography combined with Computed Tomography (SPECT/CT) [11,12] for improved localization.
Ultrasonography remains the first-line parathyroid imaging technique due to low cost, good availability, lack of radiation, quickness of the procedure, and high anatomical detail. However, the method is operator-dependent. 99 m Tc-MIBI Planar and SPECT/CT with low dose protocol is usually the second-line technique. The method is not widely available, more expensive, time-consuming, and involves radiation exposure. It provides data about the metabolic activity of the hyperactive parathyroid gland [12]. Combination of SPECT and low dose CT enables the anatomical localization and good surgery results. According to the literature, sensitivity of 100% was achieved in patient-based analysis. However, in the analyzed group of patients, the lesions volume was considerably large with mean 3D volume 1.2 ± 0.1 cm 3 [13]. As a next step to reduce radiation exposure for patients and staff during SPECT/CT study, there was an attempt of 80% reduction of the administered activity. In the opinion of authors of the presented paper, phantoms test should be performed to prove the applicability of the approach [14].
Traditional contrast-assisted CT is rarely used as a single modality. It is very helpful for surgeons as it provides an excellent anatomical map, yet there are disadvantages such as high radiation exposure. The data regarding sensitivity are shown in Table 1 [15].
Specifity and sensitivity of the SPECT imaging of parathyroid gland depends on scintigraphy protocol [16,17,18].
F18–Choline PET/CT is a novel method which might be an alternative for 99 m Tc-MIBI in view of better spatial resolution, allowing detection of smaller lesions. To date, the method has not been widely used because of its cost [19].
SPECT allows metabolic analysis of lesions and CT helps with anatomic localization [20,21,22]. The tracer used for localization of hyperfunctioning parathyroid gland/glands before the first surgery is lipophilic cation complex (MIBI: methoxy–isobutyl–isonitrile) labeled with pertechnetate— 99 m Tc (gamma emitter with a half-life of 6 h, decays by isomeric transition to technetium-99). The factor determining tumor cell uptake of 99 m Tc-MIBI is a strong electrostatic attraction between the (+) charged MIBI molecule and negatively (−) charged mitochondria [23]. The tracer is actively taken up and stored in the mitochondria. The accumulation of the tracer is more pronounced and lasts longer in hyperactive parathyroid tissue than in the surrounding thyroid tissue [10,24]. SPECT enables analysis of changes in parathyroid gland activity over time (early and delayed phases) [25].
The acquisition parameters of SPECT with gamma camera are INFINIA Hawkeye 4 (GE Healthcare), collimator: Low Energy High Resolution, number of projections: 60, static scan, matrix: 128 × 128 , zoom: 2, time per projection: 20 s, pixel sizes: 2.1 mm, 1.6 mm; the low dose CT was used to create attenuation maps. The image reconstruction parameters of SPECT with usage of the Xeleris, version 2.17, reconstruction method: OSEM, reconstruction ramp filter: Qurecon Quant, prefilter Hann (0.9), 3D postfilter Hann (0.9; 10.0), number of iterations: 2, subsets: 10. Patients were examined with planar and SPECT/CT parathyroid scintigraphy following intravenous administration of 99 m Tc-MIBI 762 ± 60.7 (range: 600–850) MBq with “wash-out” technique (dual-phase, single-tracer). The early phase (EP) started no later than 10 min after administration of the tracer, and the delayed phase (DP) was performed 127 ± 28 min later. Exported SPECT volumes used 2.209030 mm pixel spacing for all 3D directions.
Automatic analysis of achieved volumes after the manual preselection of Volume of Interest (VOI) is possible using numerous computational approaches, but the quality of parameter estimation is the most important factor. Different criteria could be used for quality analysis. The difference between real and estimated volume could be analyzed using global parameters such as mean squared error (MSE), but positions and amplitudes of components after the separation are much more interesting from a medical analysis point of view. They are related to activities of small scale regions. Our database has two: EP and DP measurements. The achieved parameters are important for the research purposes of the project, because the results of mathematical quantification are tailored to the specific medical context of 332 patients examined with preoperative parathyroid SPECT/CT (“wash-out” technique) scintigraphy. Apart from SPECT/CT scintigraphy, the collected data set encompasses biochemical blood results (plasma PTH concentration, ionized calcium and inorganic phosphate concentrations), blood genotyping results (genotyping the cohort of patients for MDR1 (ABCB1) and MRP1 (ABCC1) genes, probably responsible for different radiotracer kinetics in two phases of SPECT/CT scintigraphy in different individuals), results of additional planar parathyroid scintigraphy and ultrasonography of the neck. The main problem to solve for our project is the influence of genetic factors which may be the reason for different behavior of 99 m Tc-MIBI in preoperative scanning [26]. In addition, a quantitative approach to SPECT uptake was taken into consideration. Finally, 70 patients underwent surgery and histopathological examination was performed. The exact information about the number of counts in particular VOIs are used to find the relation between pathology of proven tissue samples and clinical background.

1.1. Contribution and Content of the Paper

The distribution of parathyroid glands in SPECT volume varies in patients. There are numerous problems for manual or automatic determination of spatial properties of parathyroid glands:
  • SPECT images are very noisy and low-pass filtering leads to blurred images with loss of some details.
  • Planar images are straightforward for analysis, but few details are lost due to single view projection as detail overlapping occurs.
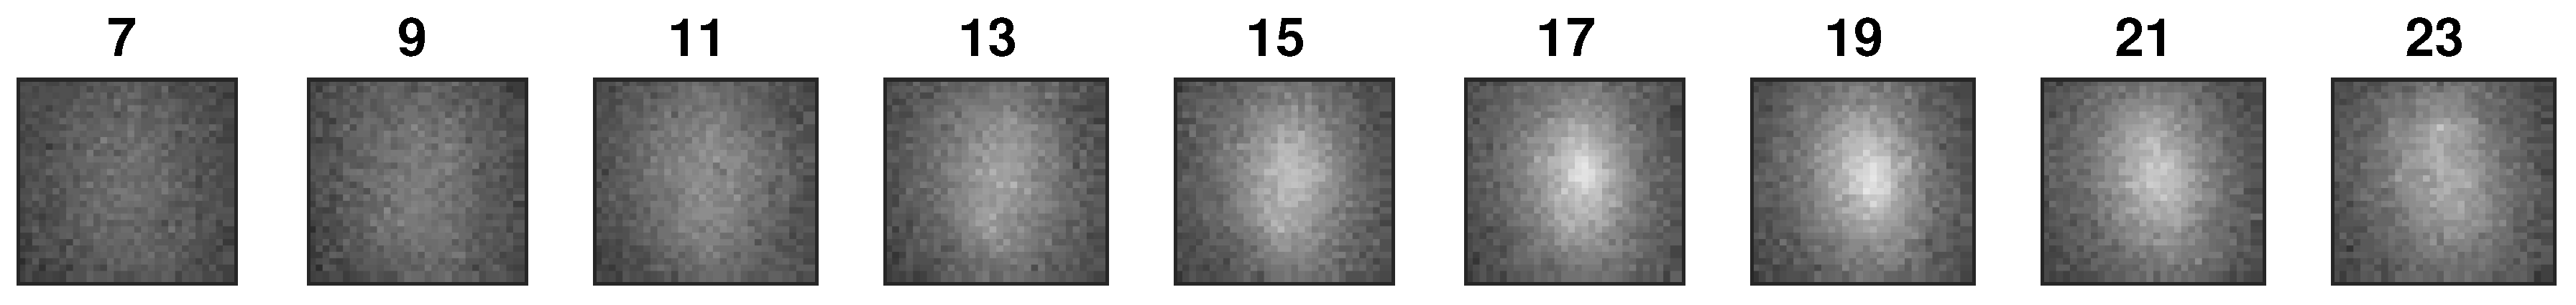
  • Volumetric images are difficult to analyze for a human operator due to small and low contrast objects.
  • Numerous details are recognized after careful examination of SPECT volume, but the automatic estimation of parameters is necessary.
Available techniques for the improvement of visual inspection of parathyroid glands include: dedicated extended color palette, small VOI selection using sphere, and background threshold-based rejection [27]. The most crucial problem is the analysis of cases where parathyroid glands with small distances between them are observed. Observed local maxima in the SPECT volume are dispersed as 3D distributions, therefore overlapping occurs. Automated estimation of parameters for distributions could be valuable for research purposes and further design of a Computer-Assisted Diagnosis system (CADx). This paper assumes the Analysis by Synthesis approach with the use of a complex model and determination of unknown parameters by the application of particle swarm optimization (PSO) [28,29,30].
Real SPECT measurements were used for the determination of model type and approximate value ranges. In this paper, SPECT patient data was deliberately not used, because the quality of estimation cannot be calculated this way. An alternative approach that was proposed in [31], which is based on a comparison of synthetic volume, and achieved from an estimation algorithm (synthesized) is the only possible method for the proper evaluation of the optimization algorithm. Such an approach with the use of Monte Carlo sampling allows the determination of estimation quality parameters. This is a very challenging task since small volumes with significant overlapping are difficult to analyze due to nonlinearity and large number of local minima. The considered approach allows parallel processing to achieve a reasonable processing time.
Synthetic data sets used in this work are described in Section 2. The method for the estimation of parameters is described in Section 3. Comparative results, based on Monte Carlo tests for proposed PSO are presented in Section 4. The discussion is provided in Section 5. Final conclusions and further work are presented in Section 6.

1.2. Related Works

The idea of estimation of parameters using a model is a well-known approach used for speech perception by machines (Analysis by Synthesis, A-by-S) [32] that was proposed in the late 1950s. The availability of sufficient processing power allows the application of this technique for complex images [33], like human faces [34].
The approach, proposed in [31], assumes modeling of parathyroid glands using multivariate generalized Gaussian function mixture. Standard Gaussian function is not feasible for the modeling because shape control is not available. Generalized Gaussian function (GGD—Generalized Gaussian Distribution with sharpness control parameter, known also as a version 1 [35]—there is also version 2 with skew control parameter) and an optimization process using random walk were tested [31].
Gaussian mixtures are well known and have numerous applications [36,37,38,39]. One of the most important factors when applying PSO is the selection of topology responsible for sharing information among neighbors during the optimization [40,41]. Three topologies were tested: global best (gbest) [42], ring [43], and random [44]. The selection of topology results in convergence and achieved final error value (quality of estimation).

2. Data

Two types of data were considered: real volume and synthetic volume used in Monte Carlo test. Exemplary real volume was tested in this paper for illustrative purposes (Figure 1).
Proper 3D view with enhanced contrast and color allows visual inspection of parathyroid glands and some details of the structures are visible, including local maxima [27]. Maximal Intensity Projection (MIP) is used for the visualization of SPECT [45,46,47]. This solution indicates details such as local maxima of SPECT that are not visible for Average or Composite Intensity Projections [47] and removes artifacts from distant regions not related to parathyroid glands by the application of spherical region of interest [27]. Additional threshold for removal voxels with values below specified value improves visibility of region with parathyroid glands (Figure 1 right) [27]. This volume has complex structure and shows the importance of multiparameter mixtures for analysis.
Automated analysis is required for the estimation of parameters because the selection of 3D view parameter is not sufficient and is a time-consuming task. It could lead to human operator induced error, therefore automated volume analysis is very important for achieving reliability.
Synthetic volumes that are generated from the model are used in this work for the evaluation of the estimation algorithm and allow testing and validation of estimated properties for different algorithms [31]. The assumed volume is 32 × 32 × 32 voxels (cells) in size and was selected based on observation of real SPECT volumes. Such size (power of two) is also important for code and memory accesses optimization. The estimation of parameters for three additive distributions (components) was tested and it was assumed that number of distributions was known. The Monte Carlo approach was used for the testing of performance using random number generators. There were 15,000 test cases for global best, ring, and random neighborhood topologies each. There were 32 particles and 500 iterations steps of PSO that were selected arbitrarily after pretests.
Synthetic volumes allow testing of the estimation algorithm quality. Noiseless volume is smooth and depends on filtering algorithms and parameters during volume reconstruction. Adding noise to synthetic volume allows testing the algorithm with higher independence on the selection of filtering algorithms and filtering parameters used in volume reconstruction (acquisition) process. Low-pass filtering smooths volume, reduces contrast, and blurs edges. Adding noise to synthetic volume allows extending testing boundaries of the tested algorithm. It improves the testing reliability, because it reduces dependence on the filter settings.
Separation of left and right parathyroid glands is usually straightforward. The problem is the overlapping of multiple structures in SPECT images for left or right side. The model-based approach allows algorithm testing using smooth (ideal, without noise) volumes as well as noised volumes, such as in the examples shown in Figure 2. Noised volumes are achieved using additive Gaussian noise with mean zero and unit standard deviation. Testing separation algorithms with noises even higher then observed typically allows determination of properties and comparison of further selections in CADx applications.

3. Method

3.1. Model for Analysis by Synthesis Using Gaussian Mixture Model

This method was chosen because of previous experiments related to true volumes of parathyroid glands [31]. It was found that the estimation of 3D position, amplitude, orientation, and scale is not sufficient. The problem is related to slight deviation of shape so Multivariate Generalized Gaussian Function Mixture was proposed [31]. Generalized Gaussian Distribution (GGD) supports additional parameters for the control of shape, and GGD version 1 function was selected with single parameter. It is possible to use three values of shape control, individual for each direction, but a simpler case was selected. A single function has 11 parameters: 3D position (3 parameters of position vector), 3D orientation (3 parameters of orientation vector), amplitude (1 parameter), 3D directional scale (3 parameters of covariance vector), and GGD shape (1 parameter). The parameter estimation of this search process was performed using real values, not integers, particularly for the position vector. Volumetric data of parathyroid gland are not a single maximum function, therefore 11 parameters are insufficient. The mixture approach extends the number of parameters and is efficient if particular components of a mixture describe data in different volume areas.
The single generalized Gaussian function is
f ( . ) = A exp 1 2 v Σ 1 v β .
Amplitude value A consists of amplitude and scaling factor with gamma function. The shape control is possible by the β parameter. The value is β = 2 for the normal Gaussian function and β = 1 for Laplace function (distribution).
The position is defined as a vector v:
v = x m x y m y z m z ,
where m x , m y , and m z are parameters of the center of this function.
Orientation and scale for 3D function requires a covariance matrix Σ that is 3 × 3 in size. The most convenient solution is the calculation of this matrix using the following formula,
Σ = R S S R 1 ,
because orientation and scale parameters are available directly in the following matrices,
S = s x 0 0 0 s y 0 0 0 s z ,
R x = 1 0 0 0 cos ( θ x ) sin ( θ x ) 0 sin ( θ x ) cos ( θ x ) ,
R y = cos ( θ y ) 0 sin ( θ y ) 0 1 0 sin ( θ y ) 0 cos ( θ y ) ,
R z = cos ( θ z ) sin ( θ z ) 0 sin ( θ z ) cos ( θ z ) 0 0 0 1 ,
R = R z R y R x ,
that are essential for the estimation of parameters for orientation θ x , θ y , θ z and scale s x , s y , s z . Single function f ( x , y , z , p i ) allows the synthesis of single 3D function by regular sampling, using x , y , z sampling position for particular vector of parameters p i :
p i = ( m x , m y , m z , θ x , θ y , θ z , s x , s y , s z , A , β ) .

3.2. Dimensionality of Model

Multiple Generalized Gaussian Functions are additive, so the final distribution used during the synthesis is
f ( x , y , z ) = i = 1 N f i ( x , y , z , p i ) ,
where N is the number of functions. This parameter is unknown, and could be obtained using observation of volume by human operator of CADx system or automatically using additional high-level optimization algorithm. In this work we assumed N = 3 for the evaluation of optimization algorithm.

3.3. Optimization Algorithm and Implementation

The task of optimization is described by the following formula,
P = arg min x , y , z M X x , y , z i = 1 N f i ( x , y , z , p i ) 2 ,
where P is the matrix of parameters, p i is the vector of parameters, and f i a set of Multivariate Generalized Gaussian Function Mixture functions and X is measured volume. MSE (Mean Squared Error) is reduced using this formula. There are 11 of parameters for single i. There are 33 unknown parameters for this model ( 11 · N ). A previous work [31] was based on mean absolute error (MAE).
Different optimization algorithms are available and for this project PSO was selected [48], as it is a derivative-free optimization algorithm. The main task of optimization algorithm is the separation of maxima.
Random walk based algorithm, proposed in [31], allows the estimation of parameters, but convergence is slow. Random walk algorithm could be considered as a single particle algorithm. The application of multiple particles in PSO provides the possibility of testing a volumetric region at one iteration step with the interactions between particles (swarm behavior), which is promising for global minimum search.
The optimization process uses a single CPU (Central Processing Unit) core. The matrix algebra applied for the synthesis of the volume uses Armadillo library [49]. PSO code [50] was modified for the application of constrained optimization and there are two types of constraints that should be applied for particular parameters:
  • selected by range and
  • folded with range.
The considered model requires both approaches, and there are 8 regular range constraints and 3 folded range constraints.
Folded range constraints are related to angles only. The application of regular range constraints for angles leads to a few times slower convergence due to the problem of orientation switching near 0 (360) region. Folding allows the smooth transition in 0 (360) degree value region. All ranges are presented in Table 2.
Where B is the side of volume ( B = 32 ). Centers of functions are not placed near volume boundaries, because such cases are related to wrong selection of VOIs. Angles folding could be further reduced to the 0 to 180 range due to rotational symmetry of ellipsoid. The value range for β prefers Laplace function and it was intentionally selected, because peak is observed in real measurement.
Random selection of parameters could lead to degenerate cases with two overlapped functions with i and j indexes, if their position is too close: ( m x i m x j ) ( m y i m y j ) ( m z i m z j ) . So as to prevent generation of such cases, as they are are impossible to solve, testing of minimal positional distance for each pair of functions was performed. The minimal Euclidean distance 3 was obtained by checking of numerous real SPECT volumes.
Original PSO code uses normalized range values (0–1) and the denormalization of values of p vector is required according to Table 2 during the volume synthesis.
Three types of topology are supported in PSO implementation: global best, ring, and random neighborhood [50]. Additional parameters specific to topologies are also available in source code [50].

4. Results

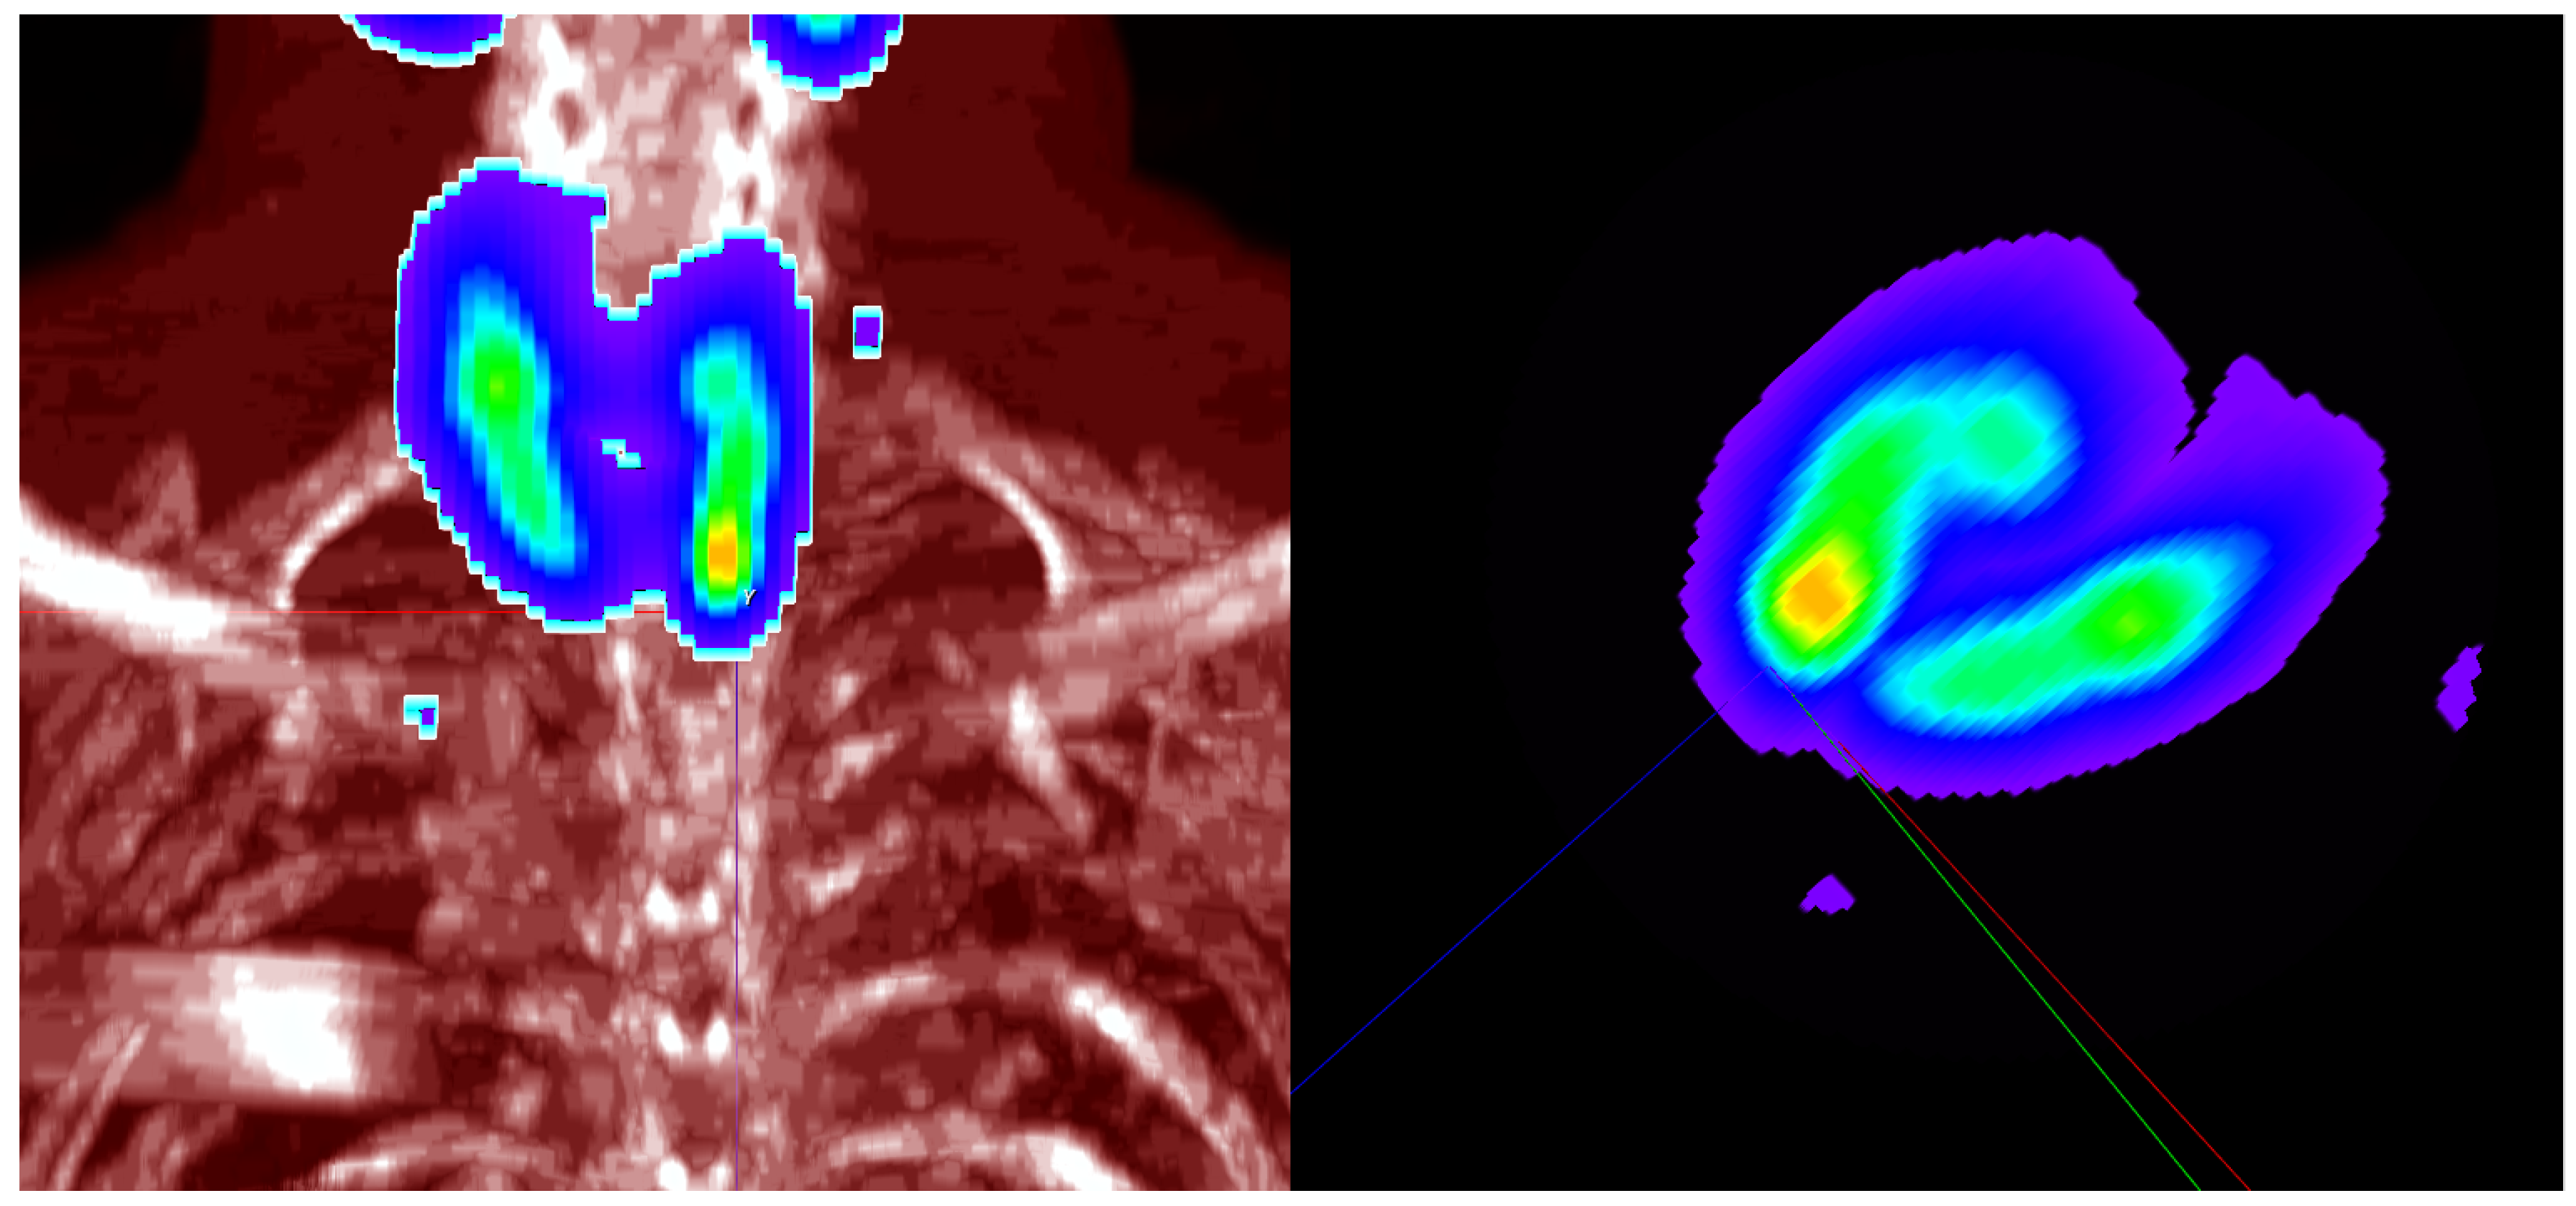
4.1. Exemplary Result for Real Parathyroid Glands

Real parathyroid glands are processed using the proposed approach as an illustrative example and selected slices are shown (Figure 3). The achieved results are shown for global best ring topology. The computation time was ~4 min for single test using the AMD Ryzen 7 2700 processor 3.2 GHz (8-cores), 2133 MHz DDR4 16 GB RAM, Samsung SSD 960 Evo, and Debian 9 Linux distribution.
The proposed approach uses optimization techniques, therefore the question of convergence arises. Global minimum is not achieved in all cases, which is typical for complex optimization problems [51,52]. The analysis of convergence is possible with the use of the Monte Carlo test. This test assumes multiple repetition of optimization for random starting parameters. A histogram of MSE is shown in Figure 4. The number of iterations is limited, because infinite iterations correspond to testing all possible cases. Single value of MSE should be achieved if the global minimum is found and that is indicator of the optimality. Different values that could be depicted in the compact form using histogram means that there are local minima, so parameter values are not equal. This test allows the testing of coupling between parameters. Independent parameters lead to simple optimization problem for random starting point of optimization. Such independence gives quick convergence to identical final results that is global minimum, because independent parameters are optimized independently. Histogram for such a case is the single value of error. Dependent parameters introduce complex relation between them so error space is very complicated with a lot of local minima. Histogram of optimization after finite number of iterations is multivalued.

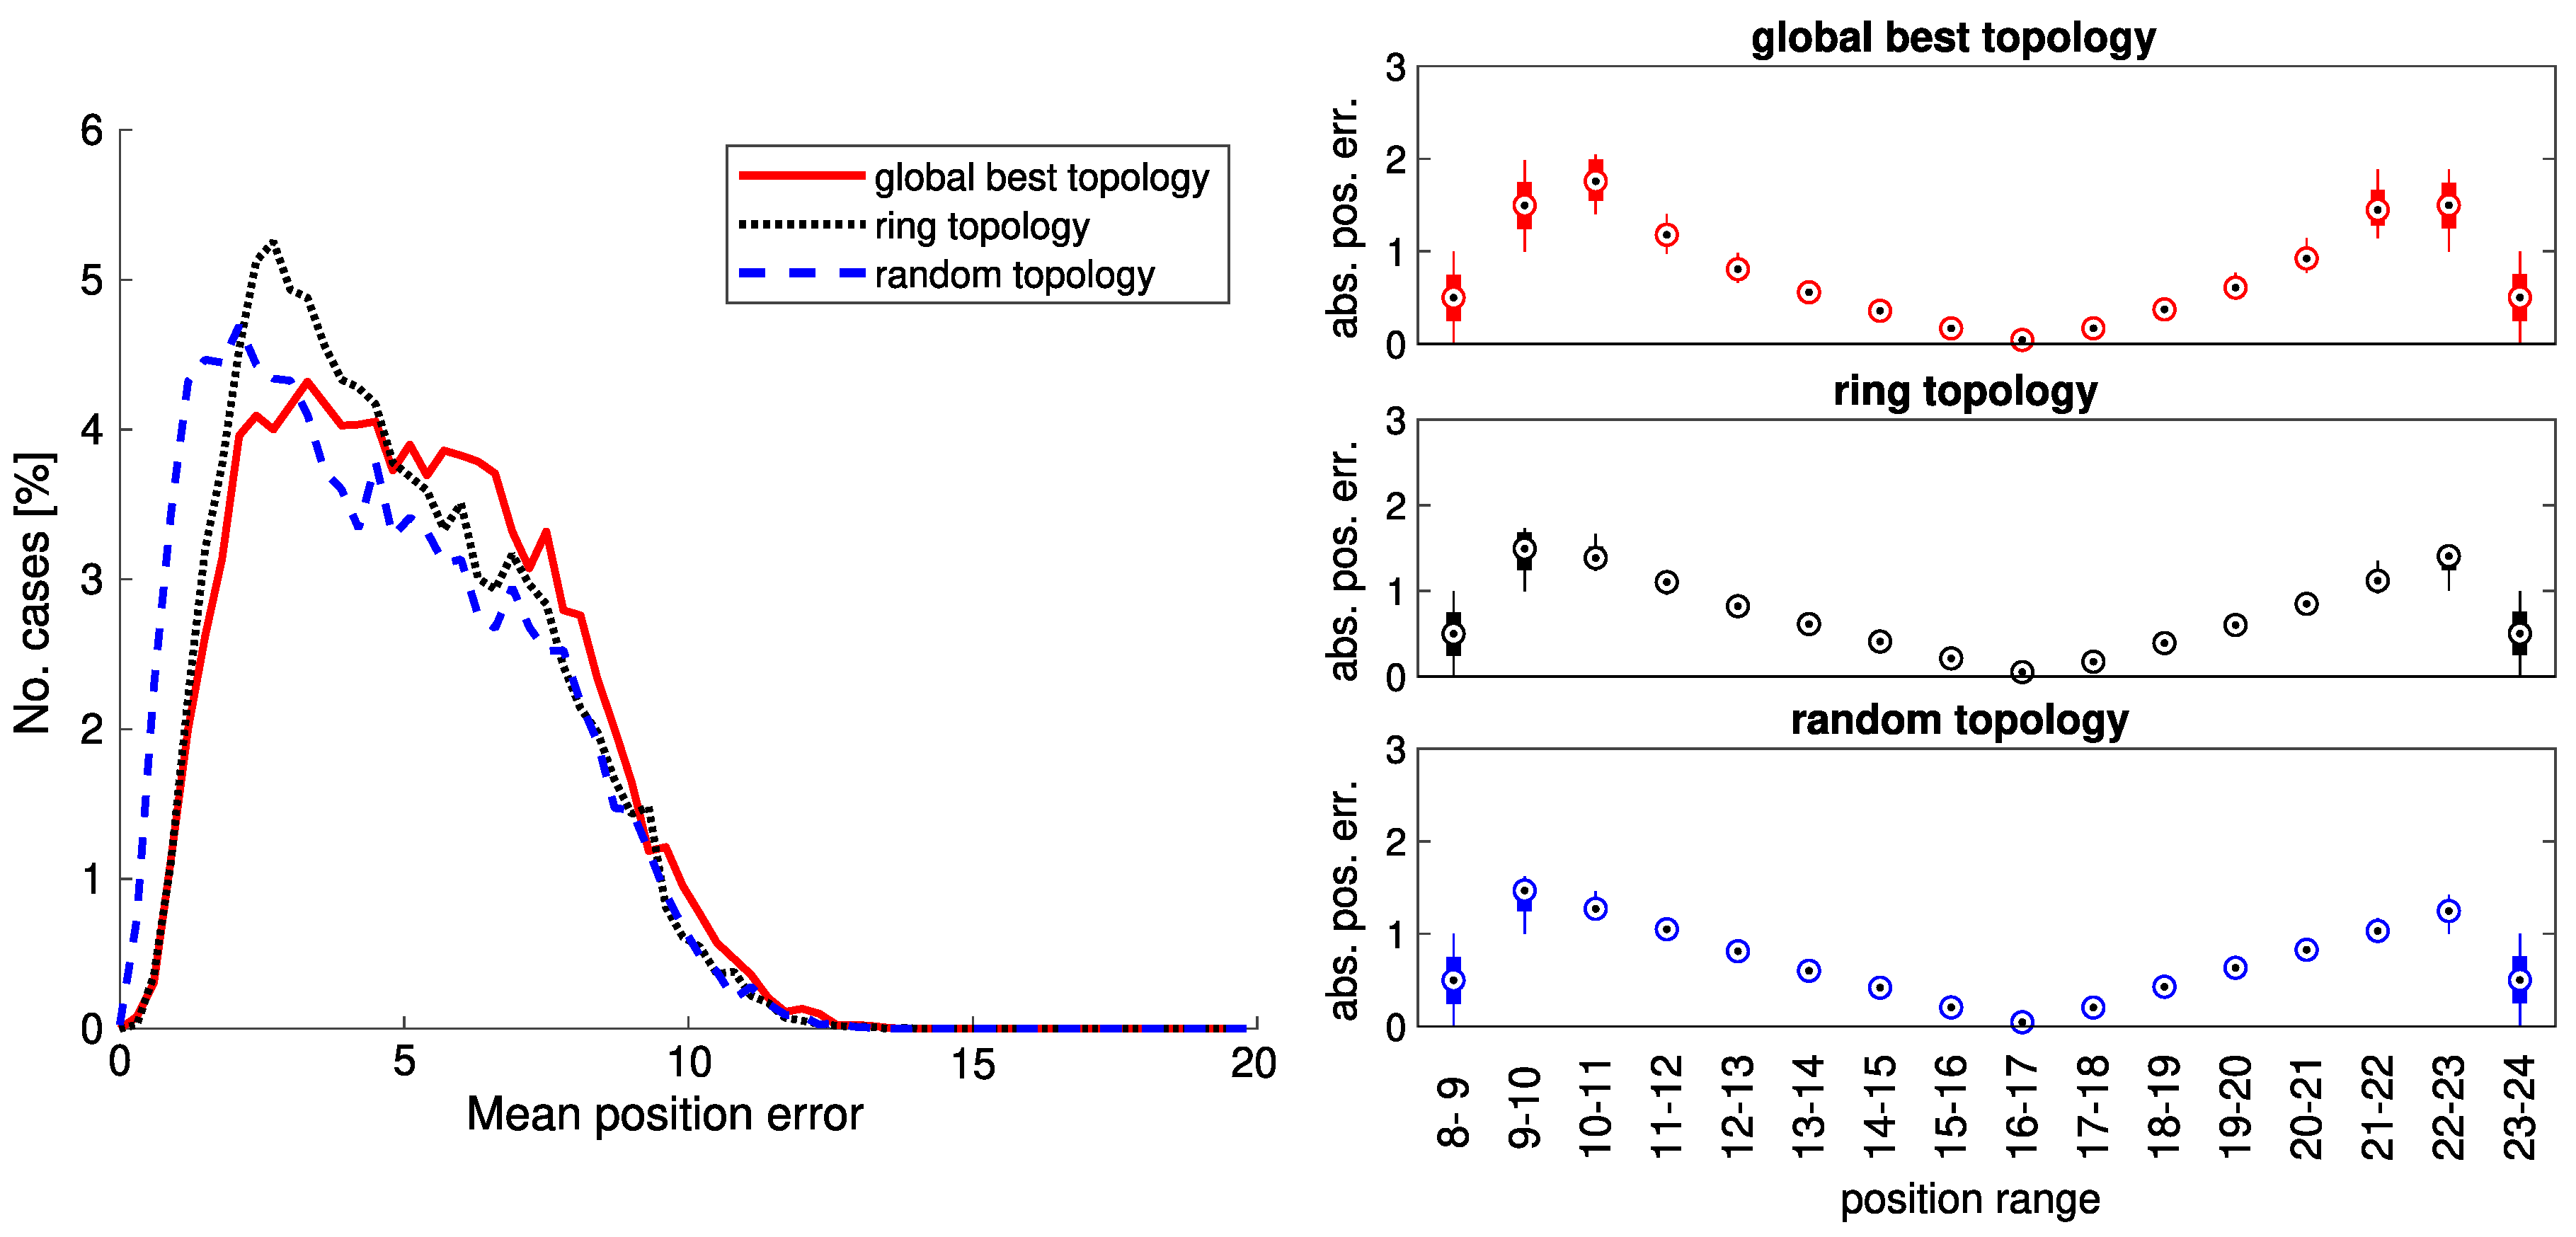
4.2. Results of Monte Carlo Test

The achieved result for a particular case is a set of parameters: 3 × 11 and MSE value. The comparison of known and estimated functions requires proper pair assignment. Wrong assignment leads to the comparison of different functions located in different parts of volume and increased error. Global optimization with the use of exhaustive search is used as an assignment algorithm and all variants are tested. There are six possible variants for assignment that are shown in Table 3. The selection of best assignment is the MSE optimization task related to 3D positions of functions.
Mean errors (mean Euclidean error between known and estimated value of 3D distributions) allow comparative analysis of results of different topologies. Error values are related to Table 2 parameters. Box-and-whiskers plots for different ranges of parameters enable the analysis of stability of achieved results and help to examine biases introduced by particular topology. Mean value is the indicator of typical error value (depicted as circle with point inside), and standard deviation shows information about distribution of error (depicted as bold vertical line). Outliers are also important in this analysis, and they are depicted using a thin vertical line, so minimum and maximum values are shown. Particular values are tested for the arbitrary selected ranges. Such approach allows the analysis of possible biases that are mean shifts and the reference level is zero error value.
The relation of absolute errors, amplitude, and a few selected parameters (position, scale, and β ) are shown in Figure 5, Figure 6 and Figure 7, respectively.

4.3. Analysis of Distributions Related to Errors

A two-sample Kolmogorov–Smirnov test was applied for the analysis of error distributions. There are three pairs related to the combinations of topologies: (global best and random), (random and ring), and (global best and ring). For all considered distributions of errors the test rejected the null hypothesis at the 5 % significance level that the data in vector pairs are from the same continuous distribution.
The test was applied for comparison of errors obtained in cases with noise and without noise. The results are shown in Table 4.
The obtained distribution could also be compared using the above mentioned test (Table 5).

5. Discussion

The analysis of the example with real parathyroid glands shows rather good convergence of the PSO algorithm (Figure 4). It is not possible to achieve a zero value of MSE because of noise and because there are differences between the model and measurements of the real biological object. The minimal value is about 0.4 and 57 % cases achieved ≤0.55 MSE values. Sometimes high values such as >2 are achieved and the solution for the improvement of results is the repetition of the estimation a few times for random starting parameters and the selection of the best result using minimal MSE value criterion. Multivalue histogram is an indicator of dependence between parameters and limits possibilities of reliable visualization of results for particular parameter, due to dependence between them. This is the reason why MSE values are presented in this paper.
Slices (Figure 3) show the achieved separation of components. Maxima are located in different positions. The last component is spherical and two components are volumetric ellipsoids.
The Monte Carlo test showed the most important result: the random topology was better in this application, because the particular distribution was shifted to the left (Figure 8, Figure 9, Figure 10 and Figure 11 left) and a higher peak was observed for lower error values (Figure 8 left). The MSE histogram (Figure 12) demonstrated the advantages of random topology because lower MSE values were achieved more frequently (approximately two times more often).
The mean shift was ~1 (voxel size) (Figure 8 left), so relative improvement was ~ 3 % for the assumed size of volume. Global best and ring topologies gave similar results. This result shows the importance of the selection of proper topology for further processing of real data. All analyzed methods introduced some bias for boundary ranges of particular parameters: position, amplitude, and β (Figure 8, Figure 9, and Figure 11, right). Higher standard deviation was also observed. The exception was scale (Figure 10) with bias value in the middle of tested ranges. These results show importance of the assumed analysis of parameters for selected ranges. Without such analysis errors are merged to single distribution with high standard deviation. Particular distributions of error are with biases but small standard deviation. Further analysis of biases is important for the analysis of optimization algorithm, because desired value is zero, even if bias value is relatively very small. Analysis of distribution of biases is the possible starting point for further improvement of algorithm, because known global minimum is not achieved. Low values of standard deviation is the indicator of good convergence and achieving a local minimum near a global minimum.
Achieved distributions are quite smooth for the selected resolution of error value (Figure 8, Figure 9, Figure 10 and Figure 11 left), so the number of iterations assumed in Monte Carlo test is correct.
The comparisons of absolute errors between amplitude and position, scale, and β are shown in Figure 5, Figure 6 and Figure 7. There are significant differences between different topologies in such relations. Absolute mean amplitude error and scale were not correlated (Figure 6). Small positive correlation (but nonlinear) was found for absolute mean amplitude error and absolute mean position error (Figure 5).
The analysis of particular parameters due to estimation errors was also important. The selection of random topology based on MSE was correct, but when it comes to estimation of particular parameters, quality needs to be checked as well. The hypotheses about similarity of distributions for all topology pairs were rejected (Table 5). The hypothesis about similarity of distributions cannot be rejected for most results (Table 4).
The obtained means of position error values (3–6 voxels distance) are satisfactory results (Figure 8), but the reduction of this error is still an interesting avenue of research. Mean amplitude errors and mean scale errors are quite similar visually, but the Kolmogorov–Smirnov test rejects such hypothesis.
Processing time is acceptable, further improvements are desired. Monte Carlo test is possible using parallel computations, so each core is assigned its own optimization test. OpenMP will be used for parallel computations in further work for the reduction of computation time for the analysis of a single case. Parallel processing is possible using all cores as well as using multiple computers and MPI (Message Passing Interface) [53]. OpenMP processing is another possibility for a single computer [54]. CUDA (Compute Unified Device Architecture) [55] or OpenCL [56] implementations could also be used.
One of the open questions is the quality of estimation for real data. Initial research [31] showed the possibility of applying this model to real data, but very long processing time was the most important drawback of the previous approach (a few hours, even with CUDA code). Now the processing time was reduced to a few minutes, opening real possibilities of applying such a model and evaluating its modified version. The processing time was reduced in this work by the application of PSO, but the selection of the proper topology is important.

6. Final Conclusions and Further Work

The number of distributions in volume could be unknown in a real case and the determination of this number is possible by the application of two strategies. The first strategy assumes exhaustive search with independent processing of one, two, and three expected components of mixture. The results are based on the achieved error, and the minimal value selects the set of parameters as well as the number of components. The second strategy assumes single optimization process with dimensionality switching so that the number of components (dimensions) is variable—components are added or removed dynamically.
The improvement of computation time is still important, e.g., with the use graphics processing unit (GPU) or multiple computers, but the achieved results offer the possibility of investigating real parathyroid glands, a matter that could be investigated in further works.
The described method allows calculating a tracer activity in small lesions. It applies, mainly, to secondary hyperparathyroidism because the volume of lesions is lower compared to primary hyperthyroidism. Parathyroid adenomas or hyperplasias, especially in secondary hyperparathyroidism [8] could be assessed more precisely. There are examples of using the same approach but on different organs in the literature [57,58,59]. There have also been first attempts at quantitative calculation of parathyroid adenoma in SPECT/CT [60]. An alternate method (NM Quantification Q.Metrix for SPECT/CT Package [61]) has been shown to validate the quantitative assessment of preoperative parathyroid SPECT/CT scintigraphy results in a new approach with standard uptake value (SUV). The technique is described as a promising tool to improve diagnostic accuracy of 99 m Tc-Sestamibi in localizing/lateralizing the parathyroid adenoma. Incidentally, it can be quite interesting to compare both methods in future.
The concept of precise or personalized medicine (PM) is currently a subject of considerable debate. As it is stated in the editorial commentary of the European Journal of Nuclear Medicine and Molecular Imaging, “the concept of PM, prevention and treatment strategies taking into account individual variability, might be strictly related to molecular imaging and nuclear medicine, through understanding the molecular basis of disease and defining molecular changes or markers associated with disease progression, response to treatment, and relapse” [62]. This statement, though limited to the diagnostic approach, closely corresponds with the approach presented here. Development of PM would be hindered without SPECT quantification as is it is a routine approach for PET/CT [63]. We hope that this paper adequately addresses the challenges of PM.

Author Contributions

M.H.L. (study conception and design, principal investigator and project manager, and drafting of the manuscript); H.P.-B. (acquisition of data from SPECT/CT gamma cameras, quality control, and study protocols); K.S. (database design and statistical analysis); J.I. (acquisition and processing of planar and SPECT/CT parathyroid scintigraphy data); M.L. (pathological examination of removed specimens); M.C. (pathological examination of removed specimens); M.O. (performed surgical removal of parathyroid pathology); B.B. (final approval of the paper); D.O.-M. (study conception and design, drafting of the manuscript, testing software, and statistical analysis); P.M. (development of the mathematical model, writing software, and final approval of the paper); All authors read and approved the final manuscript.

Funding

This study was supported by grant from budget resources for science from 2010 to 2015 as a research project No. N N402 463339 (Poland).

Conflicts of Interest

The authors declare no conflicts of interest.

References

  1. Nguyen, B.D. Parathyroid Imaging with Tc-99m Sestamibi Planar and SPECT Scintigraphy. RadioGraphics 1999, 19, 601–614. [Google Scholar] [CrossRef] [PubMed] [Green Version]
  2. Taterra, D.; Wong, L.M.; Vikse, J.; Sanna, B.; Pękala, P.; Walocha, J.; Cirocchi, R.; Tomaszewski, K.; Henry, B.M. The prevalence and anatomy of parathyroid glands: A meta-analysis with implications for parathyroid surgery. Langenbeck’s Arch. Surg. 2019, 404, 63–70. [Google Scholar] [CrossRef] [PubMed]
  3. Hindié, E.; Ugur, Ö.; Fuster, D.; ODoherty, M.; Grassetto, G.; Ureña, P.; Kettle, A.; Gulec, S.A.; Pons, F.; Rubello, D. 2009 EANM parathyroid guidelines. Eur. J. Nucl. Med. Mol. Imaging 2009, 36, 1201–1216. [Google Scholar] [CrossRef] [PubMed]
  4. Tominaga, Y.; Tanaka, Y.; Sato, K.; Nagasaka, T.; Takagi, H. Histopathology, pathophysiology, and indications for surgical treatment of renal hyperparathyroidism. Semin. Surg. Oncol. 1997, 13, 78–86. [Google Scholar] [CrossRef]
  5. DeLellis, R.A. Parathyroid tumors and related disorders. Mod. Pathol. 2011, 24, S78–S93. [Google Scholar] [CrossRef] [Green Version]
  6. Zitt, E.; Lhotta, K. Therapie des sekundären renalen Hyperparathyreoidismus—Aktueller Stellenwert der Parathyreoidektomie. Wien. Med. Wochenschr. 2016, 166, 254–258. [Google Scholar] [CrossRef]
  7. Sung, J.Y. Parathyroid ultrasonography: The evolving role of the radiologist. Ultrasonography 2015, 34, 268–274. [Google Scholar] [CrossRef]
  8. Barraclough, B.M.; Barraclough, B.H. Ultrasound of the Thyroid and Parathyroid Glands. World J. Surg. 2000, 24, 158–165. [Google Scholar] [CrossRef]
  9. Hänninen, E.; Vogl, T.; Steinmüller, T.; Ricke, J.; Neuhaus, P.; Felix, R. Preoperative Contrast-Enhanced MRI of the Parathyroid Glands in Hyperparathyroidism. Investig. Radiol. 2000, 35, 426–430. [Google Scholar] [CrossRef]
  10. Alenezi, S.; Asa’ad, S.; Elgazzar, A. Scintigraphic parathyroid imaging: Concepts and new developments. Res. Rep. Nucl. Med. 2015, 5, 9–18. [Google Scholar]
  11. Seeram, E.; Sil, J. Computed Tomography: Physical Principles, Instrumentation, and Quality Control. In Practical SPECT/CT in Nuclear Medicine; Springer: London, UK, 2013; pp. 77–107. [Google Scholar]
  12. Lawson, R.S. Gamma Camera SPECT. In Practical SPECT/CT in Nuclear Medicine; Springer: London, UK, 2013; pp. 47–75. [Google Scholar]
  13. Kim, Y.I.; Jung, Y.H.; Hwang, K.T.; Lee, H.Y. Efficacy of 99mTc-sestamibi SPECT/CT for minimally invasive parathyroidectomy: Comparative study with 99mTc-sestamibi scintigraphy, SPECT, US and CT. Ann. Nucl. Med. 2012, 26, 804–810. [Google Scholar] [CrossRef] [PubMed]
  14. Vaiman, M.; Cohenpur, M.; Halevy, A.; Volkov, O.; Gold, R.; Peer, M.; Golan, H.; Gavriel, H. Low-radiation of technetium-99m-sestamibi and single-photon emission computed tomography/computed tomography to diagnose parathyroid lesions. World J. Nucl. Med. 2019, 18, 52–57. [Google Scholar] [CrossRef] [PubMed]
  15. Redmann, A.J.; Steward, D.L. Essentials of parathyroid imaging. Oper. Tech. Otolaryngol. Head Neck Surg. 2016, 27, 122–128. [Google Scholar] [CrossRef]
  16. Taubman, M.L.; Goldfarb, M.; Lew, J.I. Role of SPECT and SPECT/CT in the Surgical Treatment of Primary Hyperparathyroidism. Int. J. Mol. Imaging 2011, 2011, 141593. [Google Scholar] [CrossRef]
  17. Raruenrom, Y.; Theerakulpisut, D.; Wongsurawat, N.; Somboonporn, C. Diagnostic accuracy of planar, SPECT, and SPECT/CT parathyroid scintigraphy protocols in patients with hyperparathyroidism. Nucl. Med. Rev. 2018, 21, 20–25. [Google Scholar] [CrossRef] [Green Version]
  18. Assante, R.; Zampella, E.; Nicolai, E.; Acampa, W.; Vergara, E.; Nappi, C.; Gaudieri, V.; Fiumara, G.; Klain, M.; Petretta, M.; et al. Incremental Value of Sestamibi SPECT/CT Over Dual-Phase Planar Scintigraphy in Patients with Primary Hyperparathyroidism and Inconclusive Ultrasound. Front. Med. 2019, 6, 164. [Google Scholar] [CrossRef]
  19. Quak, E.; Lheureux, S.; Reznik, Y.; Bardet, S.; Aide, N. F18-Choline, a Novel PET Tracer for Parathyroid Adenoma? J. Clin. Endocrinol. Metab. 2013, 98, 3111–3112. [Google Scholar] [CrossRef]
  20. Wernick, W.; Asrsvold, J. (Eds.) Emission Tomography. The Fundamentals of PET and SPECT; Elsevier: Amsterdam, The Netherlands, 2004. [Google Scholar]
  21. Fanti, S.; Farsad, M.; Mansi, L. Atlas of SPECT-CT; Springer: Berlin/Heidelberg, Germany, 2011. [Google Scholar]
  22. Yuan, L.; Kan, Y.; Ma, D.; Yang, J. Combined application of ultrasound and SPECT/CT has incremental value in detecting parathyroid tissue in SHPT patients. Diagn. Interv. Imaging 2016, 97, 219–225. [Google Scholar] [CrossRef] [Green Version]
  23. Planche, K.; Vinnicombe, S. Breast imaging in the new era. Cancer Imaging Off. Publ. Int. Cancer Imaging Soc. 2004, 4, 39–50. [Google Scholar] [CrossRef]
  24. Minisola, S.; Cipriani, C.; Diacinti, D.; Tartaglia, F.; Scillitani, A.; Pepe, J.; Scott-Coombes, D. Imaging of the parathyroid glands in primary hyperparathyroidism. Eur. J. Endocrinol. 2016, 174, D1–D8. [Google Scholar] [CrossRef] [Green Version]
  25. Shevtsova, O.N.; Shevtsova, V.K. Mathematical Simulation of Transport Kinetics of Tumor-Imaging Radiopharmaceutical 99mTc-MIBI. Comput. Math. Methods Med. 2017, 2017, 2414878. [Google Scholar] [CrossRef] [PubMed]
  26. Listewnik, M.; Piwowarska-Bilska, H.; Kurzawski, M.; Safranow, K.; Ostrowski, M.; Borowiecki, A.; Laszczynska, M.; Chosia, M.; Jasiakiewicz, K.; Iwanowski, J.; et al. The relationship of mRNA ABCC1 expression and uptake of MIBI-Tc99m in patients with hyperparathyroidism. Eur. J. Nucl. Med. Mol. Imaging 2016, 43, S70. [Google Scholar]
  27. Listewnik, M.H.; Piwowarska-Bilska, H.; Safranow, K.; Iwanowski, J.; Laszczyńska, M.; Chosia, M.; Ostrowski, M.; Birkenfeld, B.; Mazurek, P. CT–SPECT Analyzer—A Tool for CT and SPECT Data Fusion and Volumetric Visualization. In Image Processing and Communications Challenges 9; Choraś, M., Choraś, R.S., Eds.; Springer International Publishing: Cham, Switzerland, 2018; pp. 11–18. [Google Scholar]
  28. Bonabeau, E.; Dorigo, M.; Theraulaz, G. Swarm Intelligence: From Natural to Artificial Systems; Oxford University Press, Inc.: New York, NY, USA, 1999. [Google Scholar]
  29. Panigrahi, B.K.; Shi, Y.; Lim, M.H. Handbook of Swarm Intelligence: Concepts, Principles and Applications, 1st ed.; Springer Publishing Company, Incorporated: Berlin/Heidelberg, Germany, 2011. [Google Scholar]
  30. Pallero, J.L.G.; Fernández-Muñiz, M.Z.; Cernea, A.; Álvarez-Machancoses, O.; Pedruelo-González, L.M.; Bonvalot, S.; Fernández-Martínez, J.L. Particle Swarm Optimization and Uncertainty Assessment in Inverse Problems. Entropy 2018, 20, 96. [Google Scholar] [CrossRef]
  31. Listewnik, M.H.; Piwowarska-Bilska, H.; Safranow, K.; Iwanowski, J.; Laszczyńska, M.; Chosia, M.; Ostrowski, M.; Birkenfeld, B.; Mazurek, P. Multivariate generalized Gaussian function mixture for volume modeling of parathyroid glands. In Proceedings of the 2017 22nd International Conference on Methods and Models in Automation and Robotics (MMAR), Miedzyzdroje, Poland, 28–31 August 2017; pp. 1045–1050. [Google Scholar]
  32. Idsardi, W. Analysis by synthesis techniques. J. Acoust. Soc. Am. 2015, 137, 2328. [Google Scholar] [CrossRef]
  33. Li, S.Z.; Jain, A. (Eds.) Analysis-by-Synthesis. In Encyclopedia of Biometrics; Springer: Boston, MA, USA, 2009; pp. 35–36. [Google Scholar]
  34. Zivanov, S.R.J. Face Sample Synthesis. In Encyclopedia of Biometrics; Springer: Boston, MA, USA, 2009; pp. 376–383. [Google Scholar]
  35. Generalized Normal Distribution—Wikipedia. Available online: https://en.wikipedia.org/wiki/Generalized_normal_distribution (accessed on 1 September 2019).
  36. Aristophanous, M.; Penney, B.C.; Martel, M.K.; Pelizzari, C.A. A Gaussian mixture model for definition of lung tumor volumes in positron emission tomography. Med. Phys. 2007, 34, 4223–4235. [Google Scholar] [CrossRef]
  37. Layer, T.; Blaickner, M.; Knäusl, B.; Georg, D.; Neuwirth, J.; Baum, R.P.; Schuchardt, C.; Wiessalla, S.; Matz, G. PET image segmentation using a Gaussian mixture model and Markov random fields. EJNMMI Phys. 2015, 2, 9. [Google Scholar] [CrossRef] [Green Version]
  38. Pham, V.; Vo, P.; Hung, V.T.; Bac, L.H. GPU Implementation of Extended Gaussian Mixture Model for Background Subtraction. In Proceedings of the 2010 IEEE RIVF International Conference on Computing Communication Technologies, Research, Innovation, and Vision for the Future (RIVF), Hanoi, Vietnam, 1–4 November 2010; pp. 1–4. [Google Scholar]
  39. Wang, Y.; Chen, W.; Zhang, J.; Dong, T.; Shan, G.; Chi, X. Efficient Volume Exploration Using the Gaussian Mixture Model. IEEE Trans. Vis. Comput. Graph. 2011, 17, 1560–1573. [Google Scholar] [CrossRef]
  40. Liu, Q.; Wei, W.; Yuan, H.; Zhan, Z.H.; Li, Y. Topology selection for particle swarm optimization. Inf. Sci. 2016, 363, 154–173. [Google Scholar] [CrossRef]
  41. Li, F.; Guo, J. Topology Optimization of Particle Swarm Optimization. In Advances in Swarm Intelligence; Tan, Y., Shi, Y., Coello, C.A.C., Eds.; Springer International Publishing: Cham, Switzerland, 2014; pp. 142–149. [Google Scholar]
  42. Dallaki, H.; Lari, K.; Hamzeh, A.; Hashemi, S.; Sami, A. Scaling up the hybrid Particle Swarm Optimization algorithm for nominal data-sets. Intell. Data Anal. 2015, 19, 825–844. [Google Scholar] [CrossRef] [Green Version]
  43. Li, X. Niching Without Niching Parameters: Particle Swarm Optimization Using a Ring Topology. IEEE Trans. Evol. Comput. 2010, 14, 150–169. [Google Scholar] [CrossRef]
  44. Clerc, M. Back to Random Topology. 2007. Available online: http://clerc.maurice.free.fr/pso/random_topology.pdf (accessed on 1 September 2019).
  45. Mroz, L.; Hauser, H.; Gröller, E. Interactive High-Quality Maximum Intensity Projection. Comput. Graph. Forum 2000, 19, 341–350. [Google Scholar] [CrossRef]
  46. Bruckner, S. Performing Maximum Intensity Projection with the Visualization Toolkit; Seminar Paper; Vienna University of Technology: Vienna, Austria, 2002. [Google Scholar]
  47. Schroeder, W.; Martin, K.; Lorensen, B.; Kitware, I. The Visualization Toolkit: An Object-Oriented Approach to 3D Graphics, 4th ed.; Kitware: Clifton Park, NY, USA, 2006. [Google Scholar]
  48. Kennedy, J.; Eberhart, R. Particle swarm optimization. In Proceedings of the ICNN’95—International Conference on Neural Networks, Perth, Australia, 27 November–1 December 1995; Volume 4, pp. 1942–1948. [Google Scholar]
  49. Conrad Sanderson, R.C. Armadillo: A template-based C++ library for linear algebra. J. Open Source Softw. 2016, 1, 26. [Google Scholar] [CrossRef]
  50. Kentzoglanakis, K. Particle Swarm Optimization (PSO) in C. 2017. Available online: https://github.com/kkentzo/pso (accessed on 1 September 2019).
  51. Jin, C.; Zhang, Y.; Balakrishnan, S.; Wainwright, M.; Jordan, M. Local Maxima in the Likelihood of Gaussian Mixture Models: Structural Results and Algorithmic Consequences. In Proceedings of the 30th International Conference on Neural Information Processing Systems NIPS’16, Barcelona, Spain, 5–10 December 2016; pp. 4123–4131. [Google Scholar]
  52. Deledalle, C.; Parameswaran, S.; Nguyen, T. Image Denoising with Generalized Gaussian Mixture Model Patch Priors. SIAM J. Imaging Sci. 2018, 11, 2568–2609. [Google Scholar] [CrossRef] [Green Version]
  53. Pacheco, P.S. Parallel Programming with MPI; Morgan Kaufmann Publishers Inc.: San Francisco, CA, USA, 1996. [Google Scholar]
  54. Chapman, B.; Jost, G.; Pas, R.V.D. Using OpenMP: Portable Shared Memory Parallel Programming (Scientific and Engineering Computation); The MIT Press: Cambridge, MA, USA, 2007. [Google Scholar]
  55. Cook, S. CUDA Programming: A Developer’s Guide to Parallel Computing with GPUs, 1st ed.; Morgan Kaufmann Publishers Inc.: San Francisco, CA, USA, 2013. [Google Scholar]
  56. Khrono OpenCL Working Group. The OpenCL Specification, version 2.0.11; Khronos: Beaverton, OR, USA, 2013. [Google Scholar]
  57. He, B.; Du, Y.; Song, X.; Segars, W.P.; Frey, E.C. A Monte Carlo and physical phantom evaluation of quantitative In-111 SPECT. Phys. Med. Biol. 2005, 50, 4169–4185. [Google Scholar] [CrossRef]
  58. Du, Y.; Tsui, B.M.W.; Frey, E.C. Model-based compensation for quantitative123I brain SPECT imaging. Phys. Med. Biol. 2006, 51, 1269–1282. [Google Scholar] [CrossRef]
  59. El Khouli, R.; Turkbey, E.; Lodge, M.; Vranesic, M.; Ziessman, H.; Spence, D.; Ding, X.; Vija, A.; Szabo, Z. Standardized Uptake Value based assessment of dual phase parathyroid SPECT CT: Promising role in equivocal cases. J. Nucl. Med. 2017, 58, 101. [Google Scholar]
  60. Matsunaga, K.; Kamiya, T.; Fujino, K.; Watabe, T.; Isohashi, K.; Tatsumi, M.; Shimosegawa, E.; Hatazawa, J. Quantitative 99mTc-Sestamibi SPECT/CT in patients with hyperparathyroidism. J. Nucl. Med. 2017, 58, 984. [Google Scholar]
  61. GE-Healthcare. NM Quantification Q.Metrix for SPECT/CT Package; Technical Report; GE Healthcare: Chicago, IL, USA, 2017. [Google Scholar]
  62. Schillaci, O.; Urbano, N. Personalized medicine: A new option for nuclear medicine and molecular imaging in the third millennium. Eur. J. Nucl. Med. Mol. Imaging 2017, 44, 563–566. [Google Scholar] [CrossRef]
  63. Aboagye, E.O.; Kraeber-Bodéré, F. Highlights lecture EANM 2016: “Embracing molecular imaging and multi-modal imaging: A smart move for nuclear medicine towards personalized medicine”. Eur. J. Nucl. Med. Mol. Imaging 2017, 44, 1559–1574. [Google Scholar] [CrossRef]
Figure 1. Fusion coronal image of Single-Photon Emission Computed Tomography combined with Computed Tomography (SPECT/CT)—a lesion with slightly increased uptake in a lower left pole of thyroid gland corresponds with abnormal parathyroid gland (left). 3D view of parathyroid glands (right, SPECT only).
Applsci 09 04511 g001
Figure 2. Exemplary slices from synthetic volume (there are three overlapping additive components).
Applsci 09 04511 g002
Figure 3. Exemplary slices for a real SPECT measurement with parathyroid glands (top) and estimated volume for the proposed method (three bottom rows show components of estimated volume).
Applsci 09 04511 g003
Figure 4. Mean square error (MSE) histogram of Monte Carlo test for real parathyroid glands.
Applsci 09 04511 g004
Figure 5. The relation of absolute mean amplitude error and absolute mean position error.
Applsci 09 04511 g005
Figure 6. The relation of absolute mean amplitude error and absolute mean scale error.
Applsci 09 04511 g006
Figure 7. The relation of absolute mean amplitude error and absolute mean β error.
Applsci 09 04511 g007
Figure 8. Distributions of mean position errors (left) and box-and-whiskers plot of absolute position errors dependent on true position ranges (right).
Applsci 09 04511 g008
Figure 9. Distributions of mean amplitude errors (left) and box-and-whiskers plot of absolute amplitude errors dependent on true amplitude ranges (right).
Applsci 09 04511 g009
Figure 10. Distributions of mean scale errors (left) and box-and-whiskers plot of absolute scale errors dependent on true scale ranges (right).
Applsci 09 04511 g010
Figure 11. Distributions of mean β errors (left) and box-and-whiskers plot of absolute β errors dependent on true β ranges (right).
Applsci 09 04511 g011
Figure 12. Histogram of MSE.
Applsci 09 04511 g012
Table 1. Sensitivities of preoperative imaging.
Preoperative ImagingUltrasonographyPlanar ScintigraphySPECT/CT4D-CTMRI
Sensitivity80–90%44–88%93%88–92%NA *
* Usefulness of MRI is controversial as motion artifacts may occur from swallowing and respiration as a resut of long scan times.
Table 2. Ranges used for parameters.
ParametersMinimal ValueMaximal ValueType
m x , m y , m z 1 4 B 3 4 B selected by range
θ x , θ y , θ z 0360folded by range
s x , s y , s z 510selected by range
A520selected by range
β 0.51.5selected by range
Table 3. Possible assignments (p denotes known parameters of function f; p ^ denotes estimated parameters of function f ^ ).
No.1’st Pair2’nd Pair3’th Pair
1 ( p 1 , p 1 ^ ) ( p 2 , p 2 ^ ) ( p 3 , p 3 ^ )
2 ( p 1 , p 1 ^ ) ( p 2 , p 3 ^ ) ( p 3 , p 2 ^ )
3 ( p 1 , p 2 ^ ) ( p 2 , p 1 ^ ) ( p 3 , p 3 ^ )
4 ( p 1 , p 2 ^ ) ( p 2 , p 3 ^ ) ( p 3 , p 1 ^ )
5 ( p 1 , p 3 ^ ) ( p 2 , p 1 ^ ) ( p 3 , p 2 ^ )
6 ( p 1 , p 3 ^ ) ( p 2 , p 2 ^ ) ( p 3 , p 1 ^ )
Table 4. Two-sample Kolmogorov–Smirnov tests: ideal and noised volumes (0—rejection of the null hypothesis).
Error TypeTopologyKolmogorov–Smirnov Test Result
Mean positionglobal best0
Mean positionring0
Mean positionrandom1
Mean amplitudeglobal best0
Mean amplitudering0
Mean amplituderandom1
Mean angleglobal best0
Mean anglering0
Mean anglerandom0
Mean scaleglobal best0
Mean scalering0
Mean scalerandom0
Mean β global best0
Mean β ring0
Mean β random0
Table 5. Two-sample Kolmogorov–Smirnov test for comparison distributions (0—rejection of the null hypothesis).
Error TypeWithout NoiseWith Noise
Mean position: global best—ring11
Mean position: global best—random11
Mean position: ring—random11
Mean amplitude: global best—ring11
Mean amplitude: global best—random11
Mean amplitude: ring—random11
Mean angle: global best—ring11
Mean angle: global best—random11
Mean angle: ring—random11
Mean scale: global best—ring11
Mean scale: global best—random11
Mean scale: ring—random11
Mean β : global best—ring11
Mean β : global best—random11
Mean β : ring—random11

