
Research on a Super-Sub-Arc Bivariate Relative Angle Thermal Deformation Testing Method without Pitch Angle Limitation
Abstract
:1. Introduction
2. Testing Methods
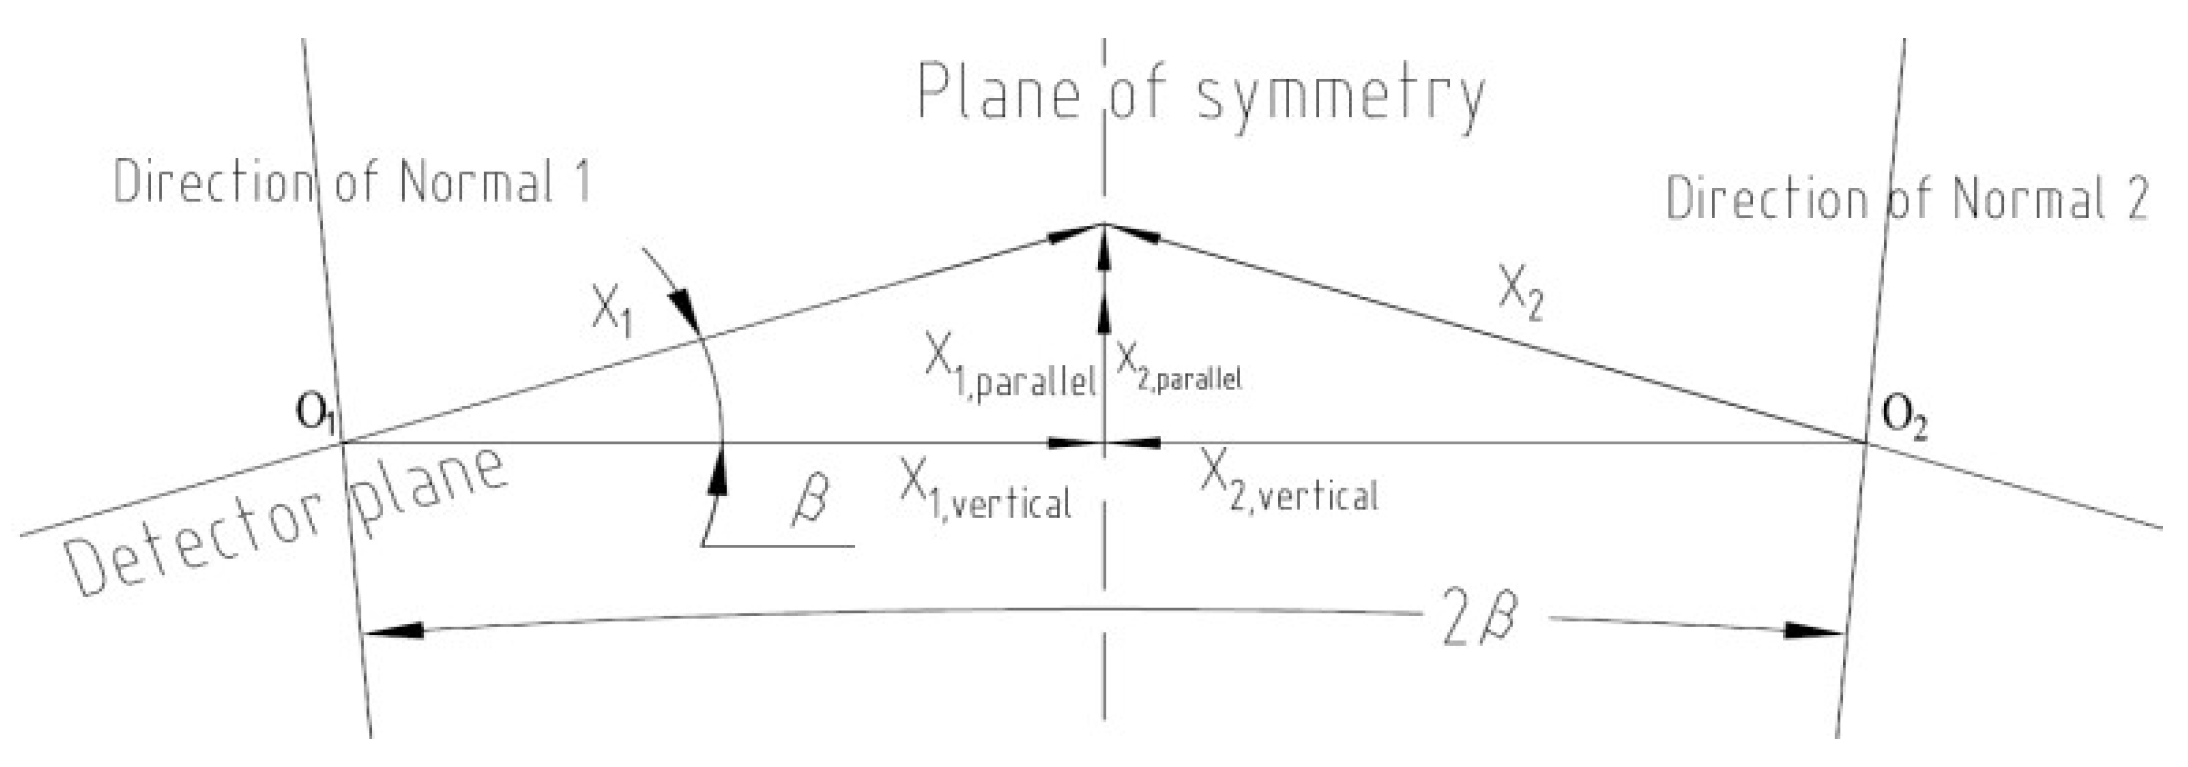
2.1. Theoretical Basis of Ultra-Sub-Arc-Level Angle Measurement
2.2. Dual-Variable Angle Variation Test
2.3. Conversion Algorithm for Thermal Conditions
3. Test and Verification
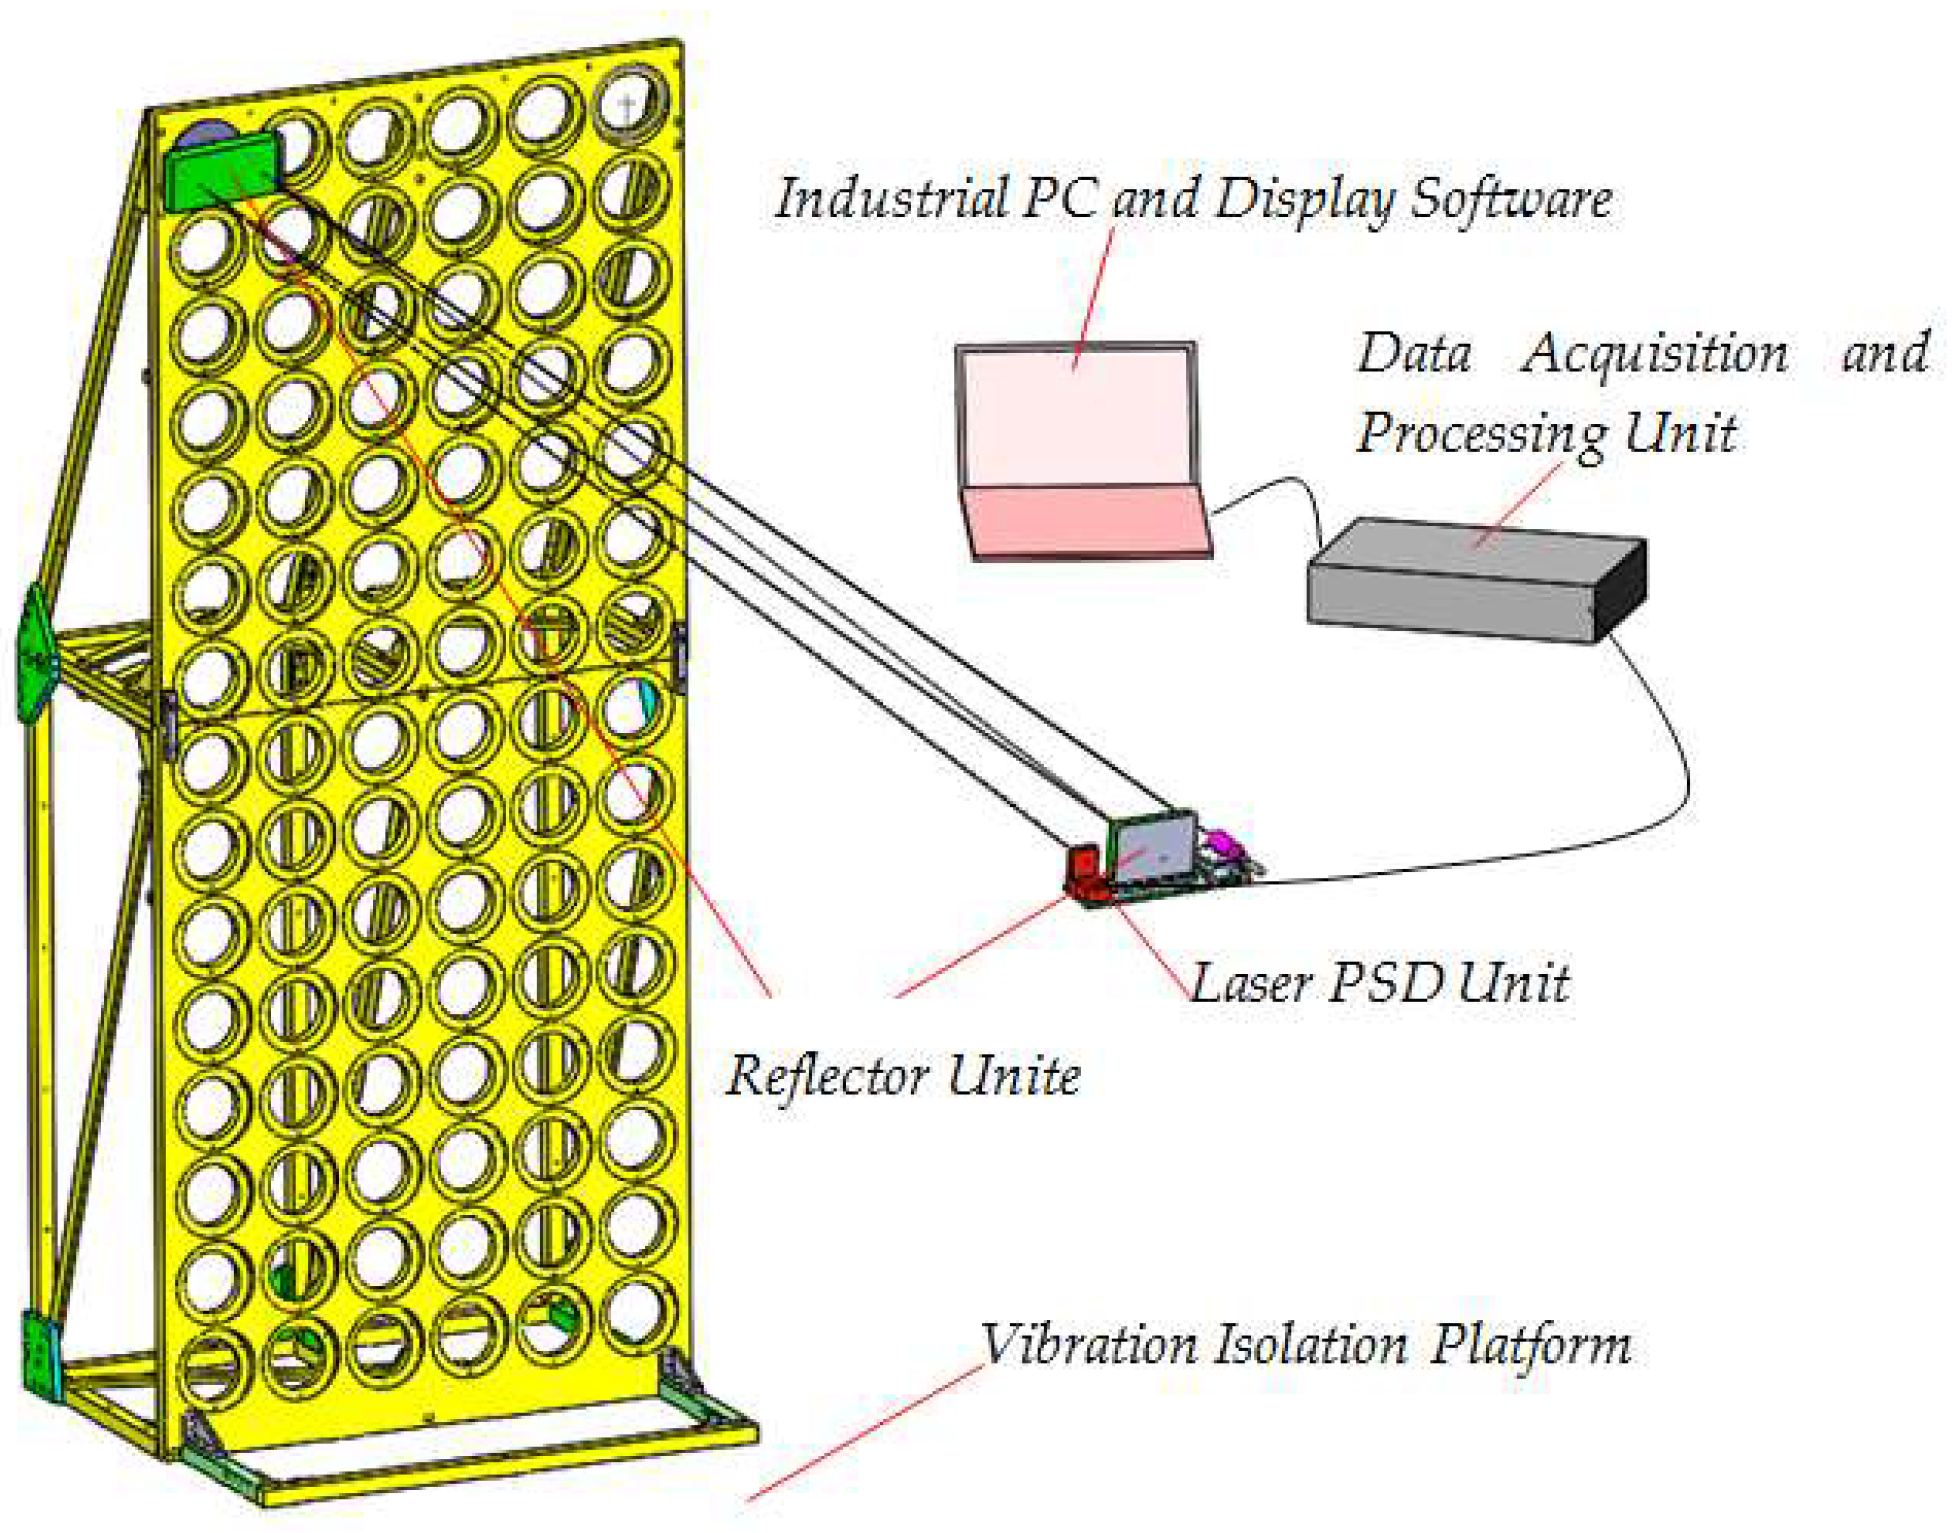
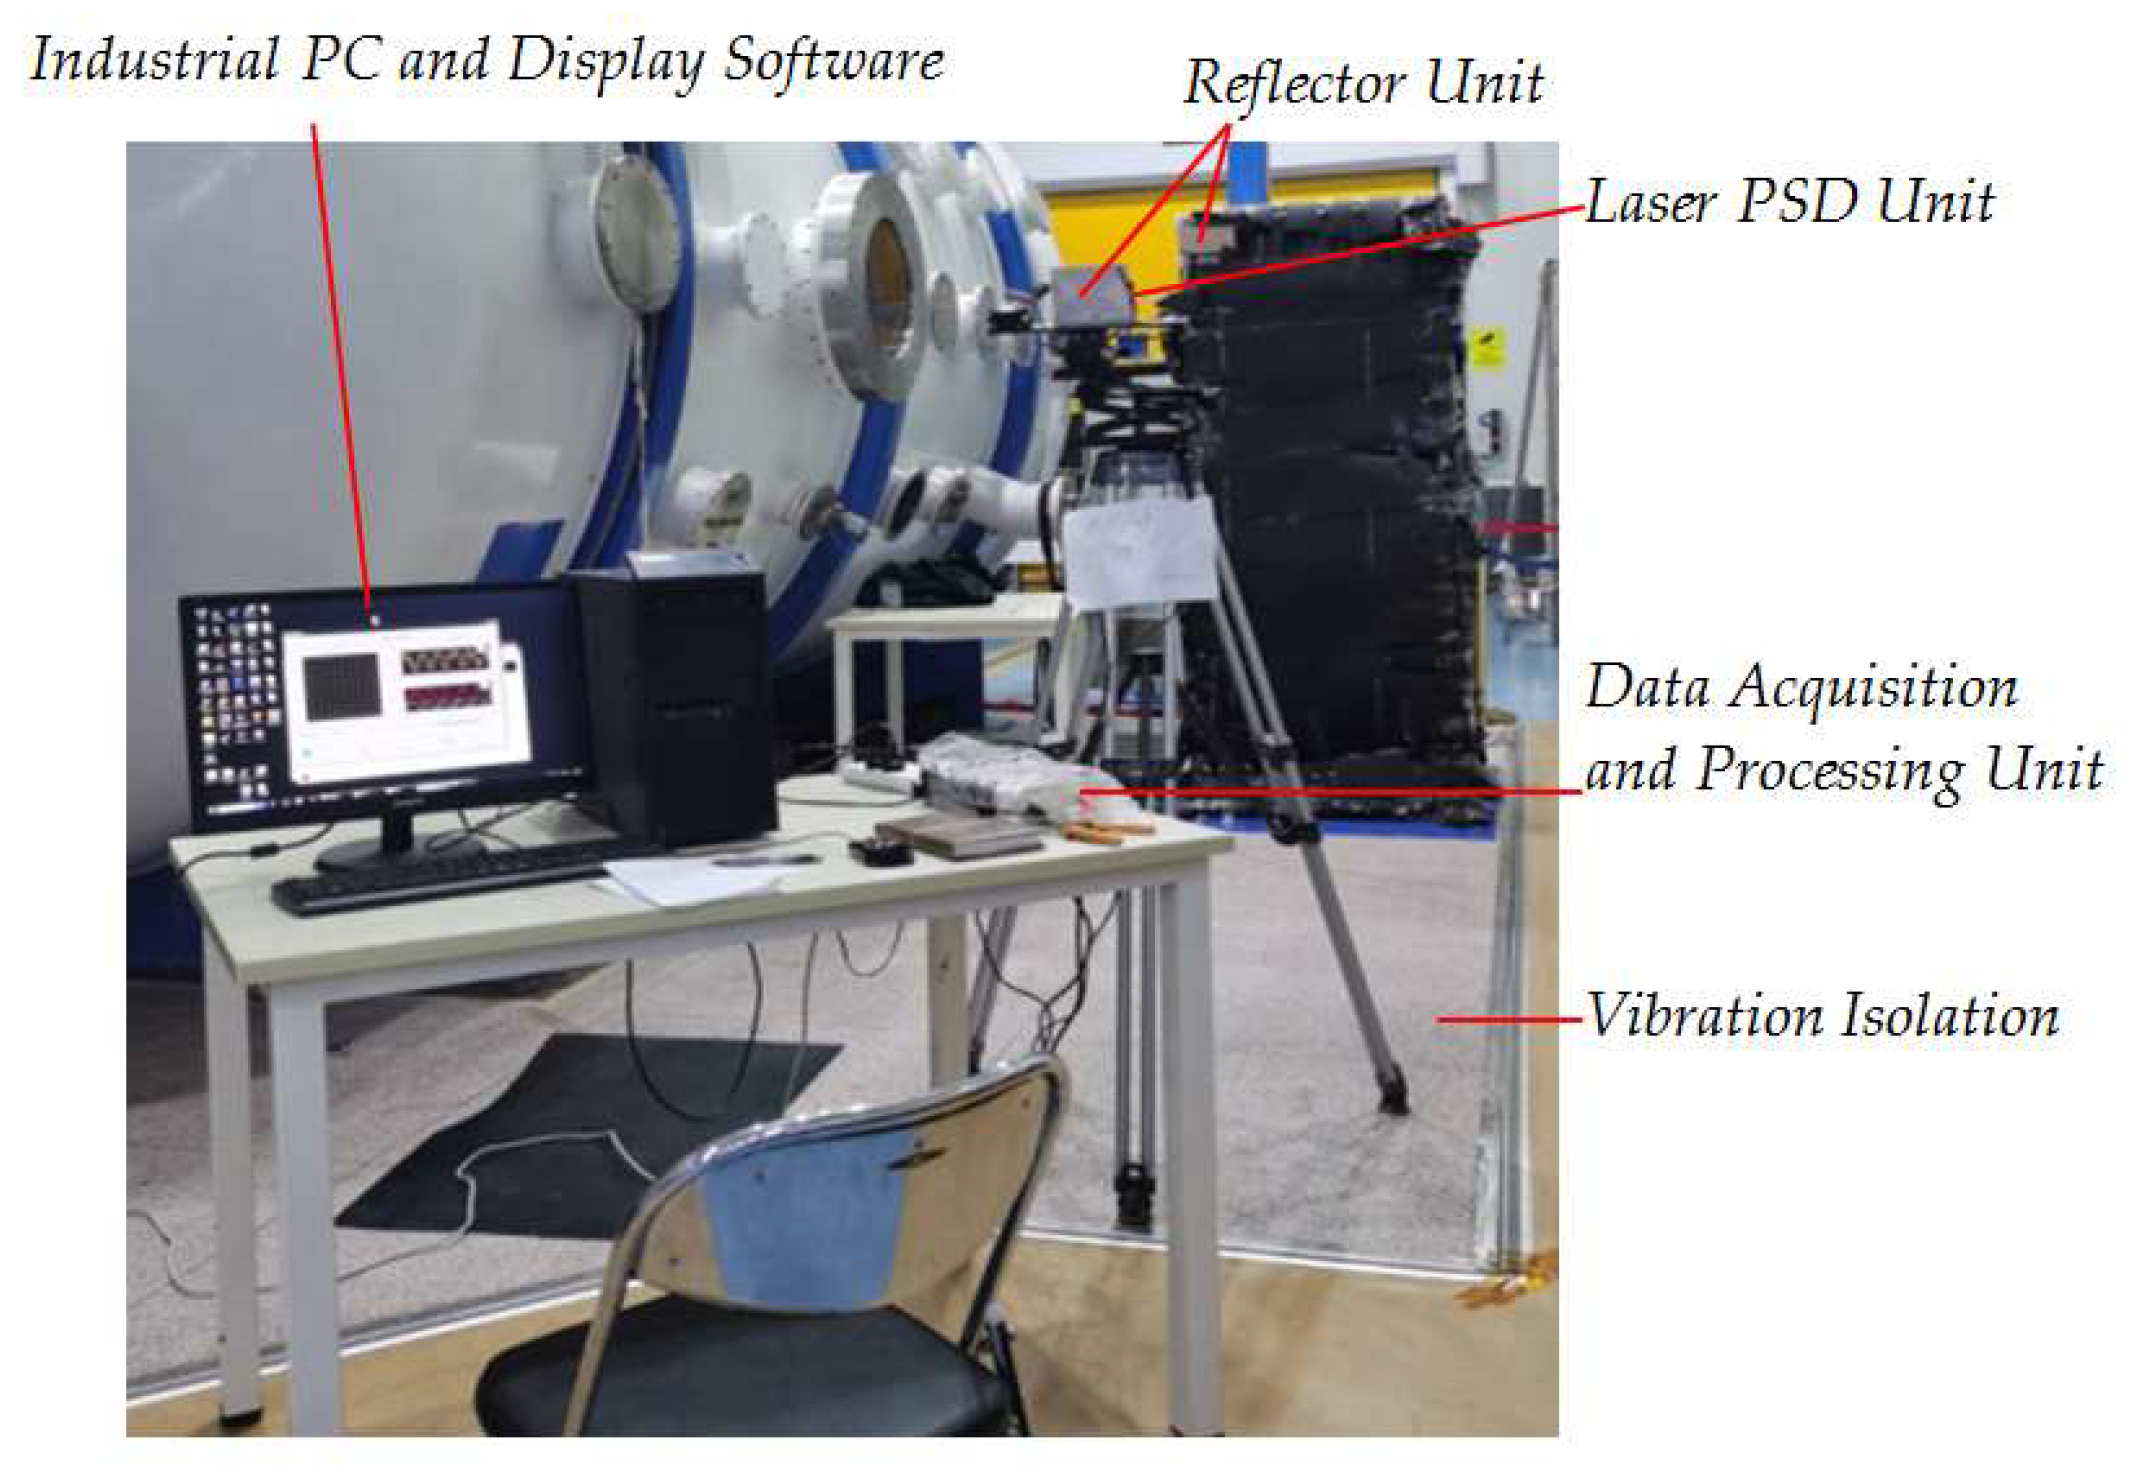
3.1. Test System Parameter Design
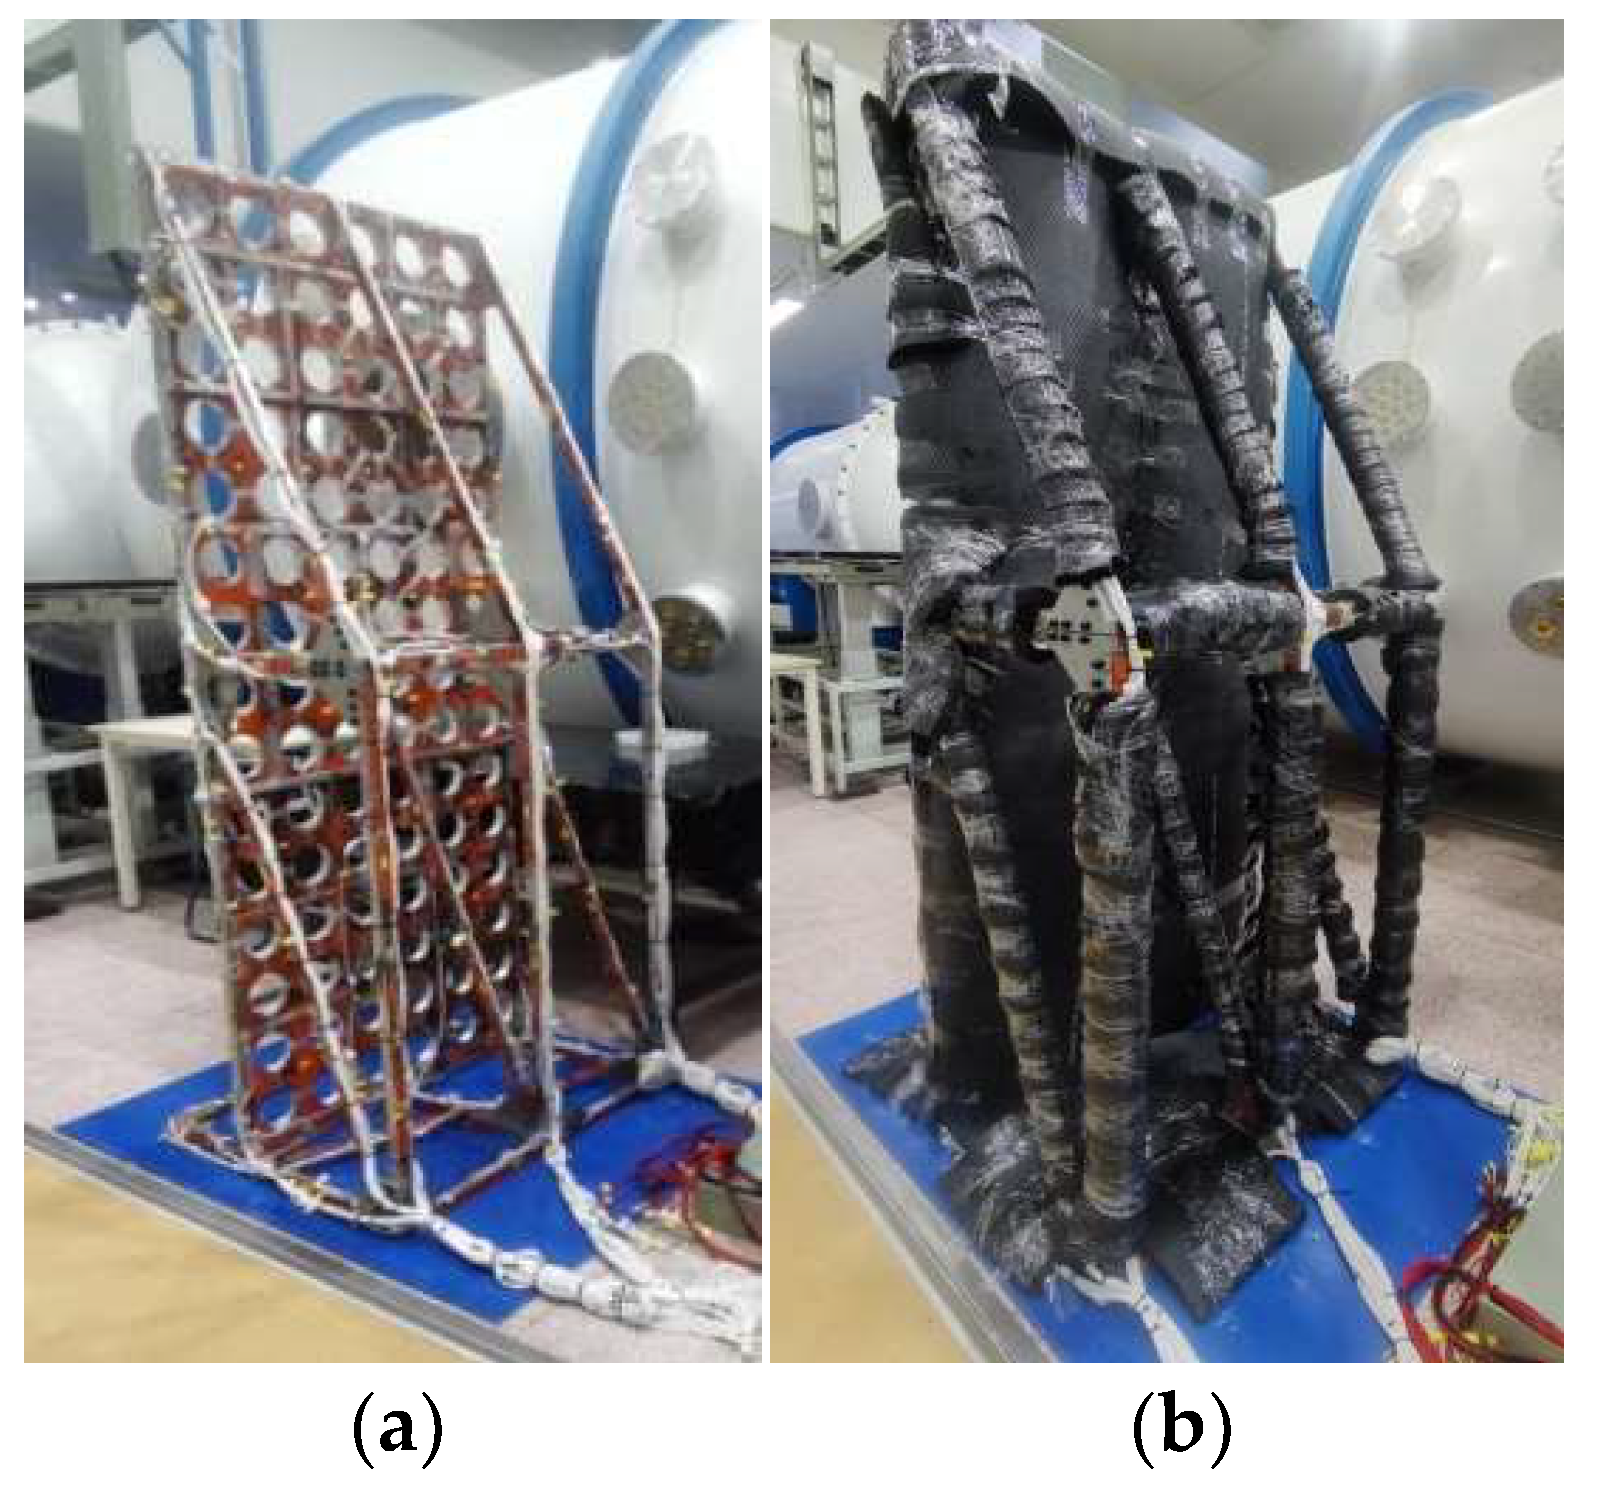
3.1.1. Introduction to Test Objectives
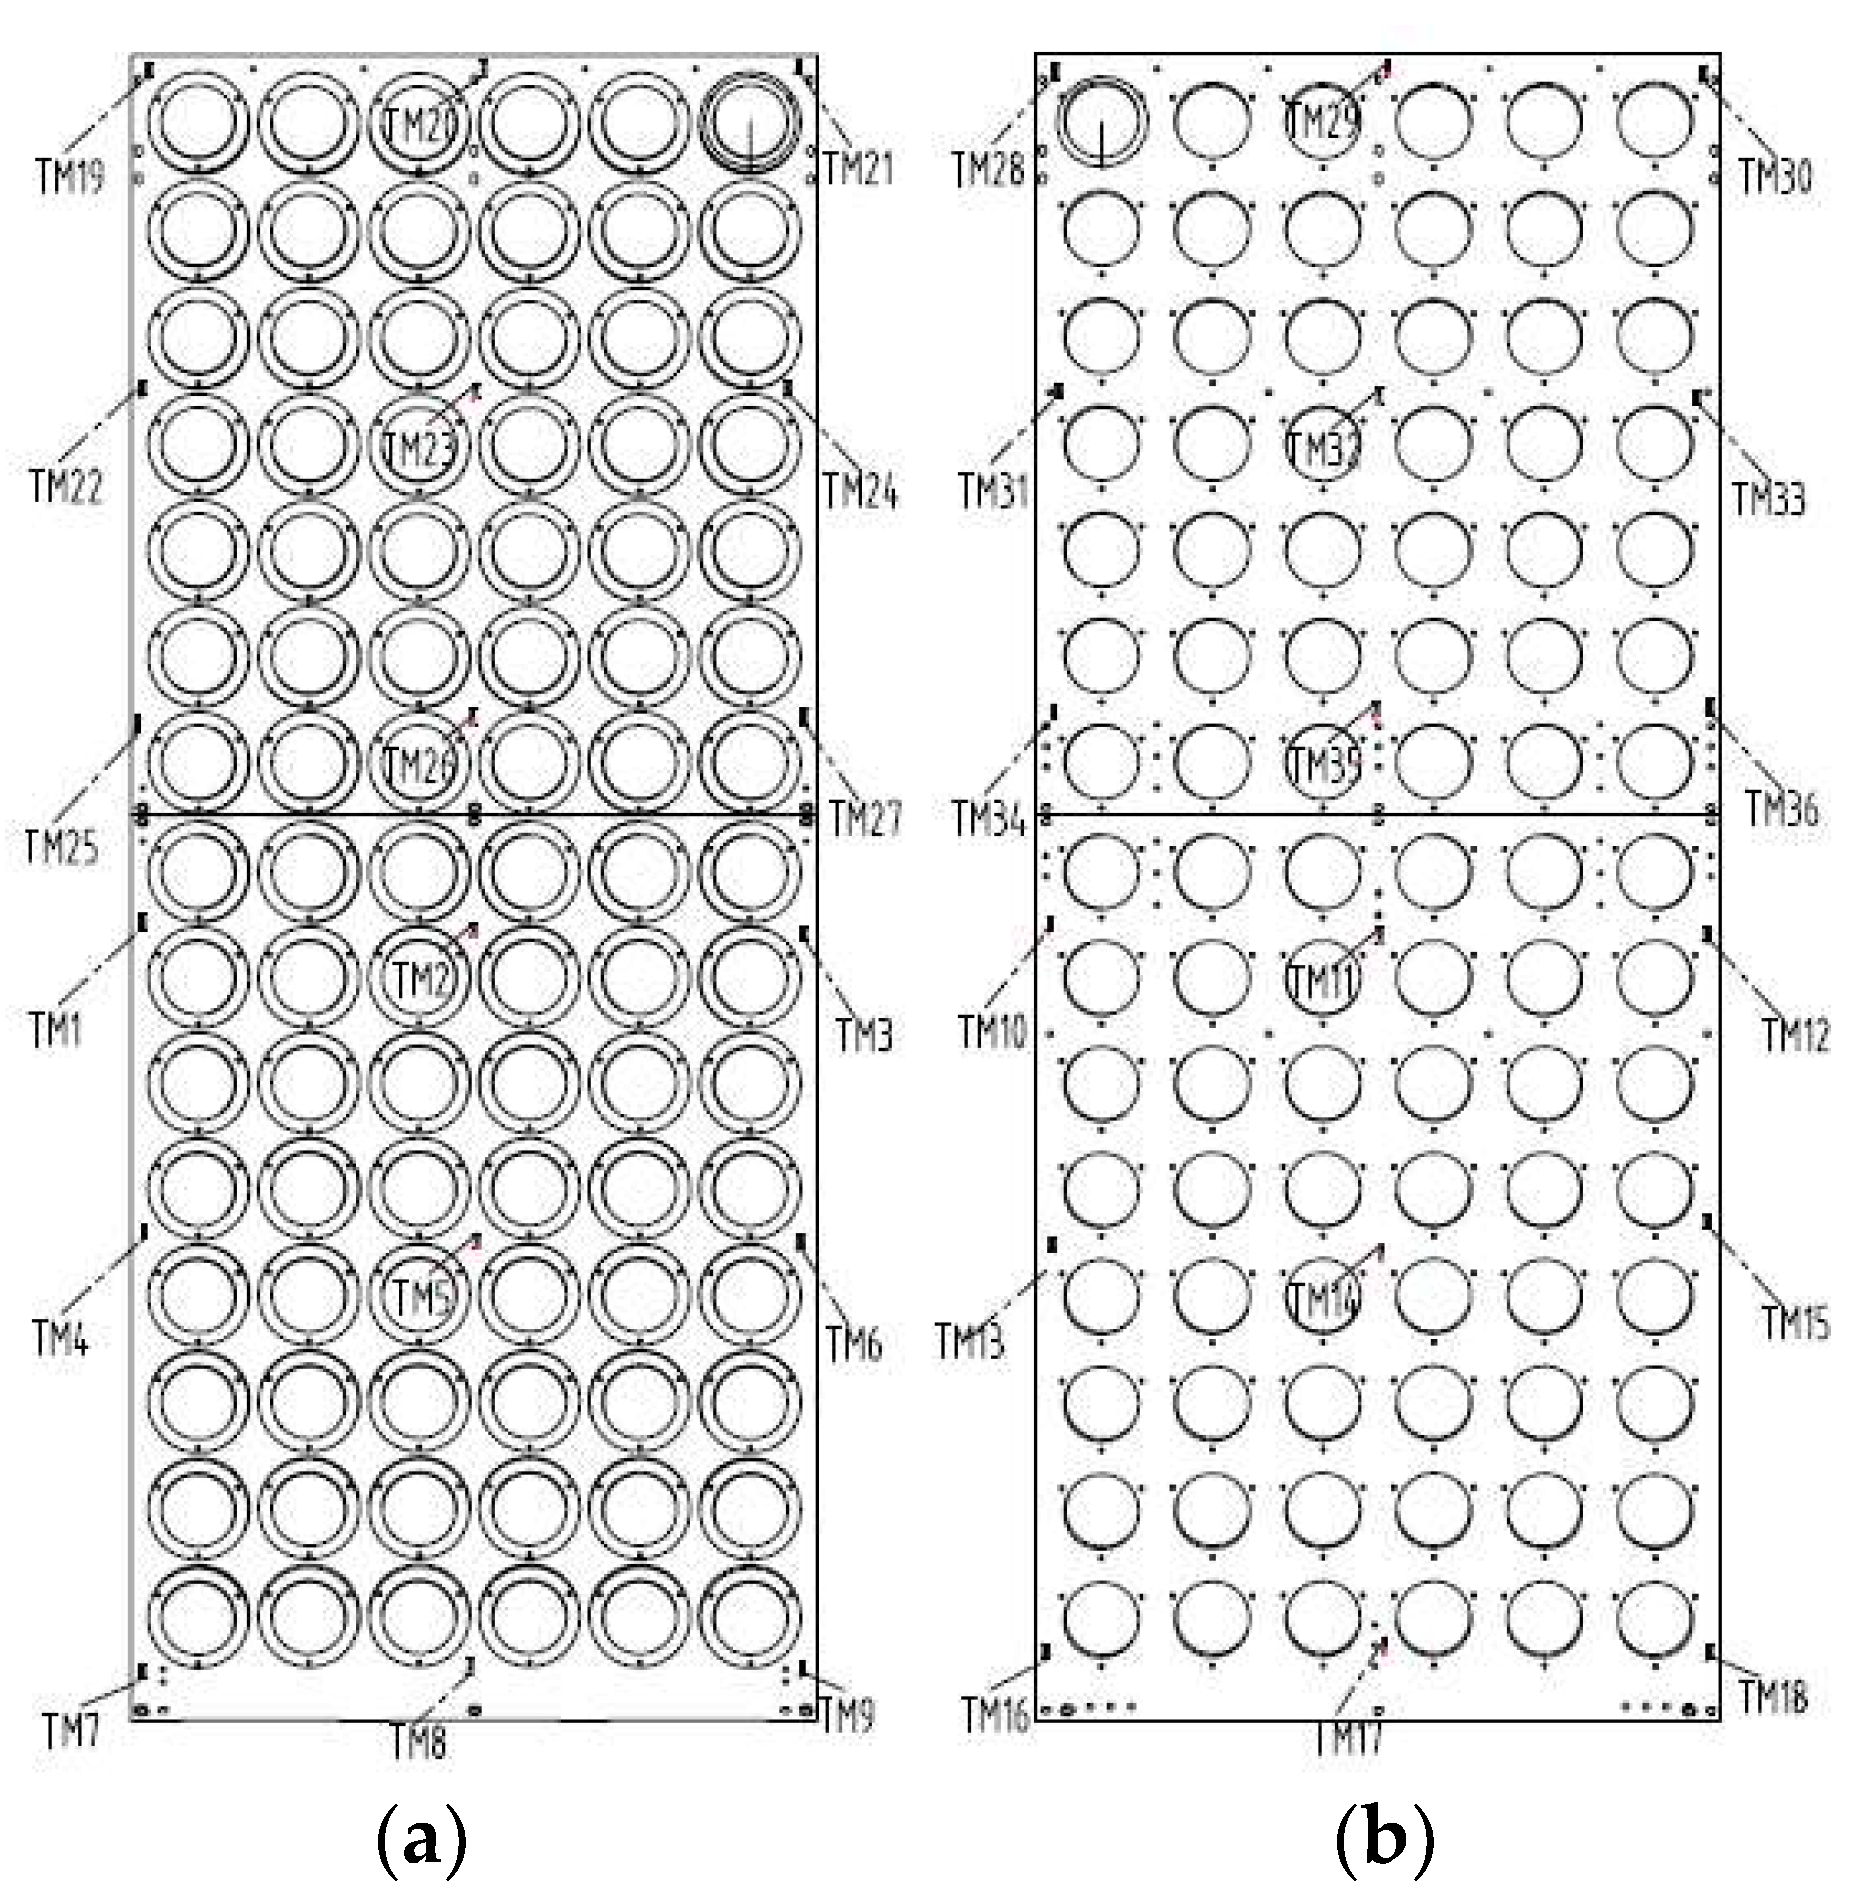
3.1.2. Test System Parameter Design
3.1.3. Test Implementation
3.2. Calculation of Test Results
3.2.1. Calculation of Angle Test Results
3.2.2. Calculation of Thermal Condition Magnification
3.2.3. Calculation of Test Results for Indicators
3.3. Test Error Analysis
4. Conclusions
Author Contributions
Funding
Institutional Review Board Statement
Informed Consent Statement
Data Availability Statement
Acknowledgments
Conflicts of Interest
References
- Li, J.-Y.; Wu, J.-T.; Han, H.-Q. Small angle measurement with optical methods and its application. Appl. Sci. Technol. 2006, 33, 15–16. [Google Scholar]
- Hou, Y.-L.; Yang, F.; Wang, F.-G. Overview of key technologies for segmented mirrors of large-aperture optical telescopes. Chin. Opt. 2022, 15, 973–982. [Google Scholar]
- Sahai, R. Observing Planetary and Pre-Planetary Nebulae with the James Webb Space Telescope. Galaxies 2020, 8, 61. [Google Scholar] [CrossRef]
- Guo, P.; Zhang, J.; Yang, F.; Hu, H.; Jiang, H. Geometric layout optimization of a large aperture thin elliptical mirror’s axial and lateral support. Appl. Opt. 2021, 60, 2861–2869. [Google Scholar] [CrossRef]
- Shen, S.-D.; Cui, X.-Q.; Zhang, Y. Simulation and analysis of co-phasing errors of the segmented primary mirror tiled by hexagonal segments in LOT. Res. Astron. Astrophys. 2021, 21, 245. [Google Scholar] [CrossRef]
- Hu, J.-N.; Dong, J.-H.; Zhou, P.-W. Review on active support system of large ground-based telescope primary mirror. Laser Infrared 2017, 47, 5–12. [Google Scholar]
- Xu, H.; Yang, L.-W.; Yang, H.-S. Recent progress of active support system for large optical telescope primary mirror. Laser Optoelectron. Prog. 2018, 55, 11–23. [Google Scholar]
- Li, X.P.; Shi, J.F.; Wang, W.; Wang, Y.J.; Fan, X.W. Review on splicing structure technology of large aperture space primary mirror. Laser Optoelectron. Prog. 2018, 55, 22–34. [Google Scholar]
- Liu, M.; Wang, H.; Yi, H.; Xue, Y.; Wen, D.; Wang, F.; Shen, Y.; Pan, Y. Space Debris Detection and Positioning Technology Based on Multiple Star Trackers. Appl. Sci. 2022, 12, 3593. [Google Scholar] [CrossRef]
- Liu, M.; Wei, X.; Wen, D.; Wang, H. Star Identification Based on Multilayer Voting Algorithm for Star Sensors. Sensors 2021, 21, 3084. [Google Scholar] [CrossRef]
- Xu, H.-G.; Han, B.; Li, M.L.; Ma, H.T.; Zhang, P.Y.; Ju, D.H. Design and verification of high-precision multi-star simulator with a wide field of view. Chin. Opt. 2020, 13, 1343–1351. [Google Scholar]
- Li, M.L.; Han, B.; Liu, H.; Yuan, L.; Huang , D.F. Study on Calibration Technology of Large Field of View Multi-star Simulator. J. Changchun Univ. Sci. Technol. (Nat. Sci. Ed.) 2020, 43, 17–22. [Google Scholar]
- Huang, Y.-G. Study on Micro-Angle Measuring Basic Technique of Laser Autocollimation. Ph.D. Thesis, Tianjin University, Tianjin, China, 2009. [Google Scholar]
- ELCOMAT HR Operation Manual. MÖLLER-WEDEL OPTICAL: Wedel, Germany. Available online: https://www.haag-streit.com/moeller-wedel-optical/products/electronic-autocollimators/elcomat-product-line/elcomat-hr/ (accessed on 24 August 2023).
- Konyakhin, I.A.; Timofeev, A.N.; Konyakhin, A. Three-axis optic-electronic autocollimation system for the inspection of large-scale objects. In Proceedings of the SPIE Optical Metrology 2013, Munich, Germany, 13–16 May 2013; Volume 8788, p. 87882C-1-8. [Google Scholar]
- Konyakhin, I.A.; Kopylova, T.V.; Konyakhin, A.I. Optic-electronic autocollimation sensor for measurement of the three-axis angular deformation of industry objects. In Proceedings of the SPIE Photonics Europe, Brussels, Belgium, 16–19 April 2012; Volume 8439, p. 84391N-1-7. [Google Scholar]
- Di, C.; Yan, W.; Hu, S.; Yin, D.; Ma, C. Moire-Based absolute interferometry with large measurement range in Wafer-Mask alignment. IEEE Photonics Technol. Lett. 2015, 27, 435–438. [Google Scholar] [CrossRef]
- Wang, Q.-H.; Ri, S.; Tsuda, H. Digital sampling Moireas asubstitute for microscope scanning Moire for high-sensitivity and full-field deformation measurement at micron/nano scales. Appl. Opt. 2016, 55, 6858–6885. [Google Scholar] [CrossRef] [PubMed]
- Zhang, A.-Y.; Huang, P.-S. Total internal reflection for precision small-angle measurement. Appl. Opt. 2001, 40, 167–1622. [Google Scholar] [CrossRef] [PubMed]
- Chui, M.-H.; Wang, S.-F.; Chang, R.-S. Instrument for measuring small angles by use of multiple total internal reflection in heterodyne interferometry. Appl. Opt. 2004, 43, 5438–5442. [Google Scholar] [CrossRef]
- Lin, J.-Y.; Liao, Y.-C. Small-angle measurement with highly sensitive total internal-reflection heterodyne interferometer. Appl. Opt. 2014, 53, 1903–1908. [Google Scholar] [CrossRef]
- Ma, T.; Wang, W.-H. Sub-Arc Accuracy Small Angle Measurement Based on Dual Mirrors Reflections. Flight Control Detect. 2019, 2, 84–89. [Google Scholar]
- Mao, S.; Wang, Z.; Pan, J. Microscope 3D Point Spread Function Evaluation Method on a Confirmed Object Plane Perpendicular to the Optical Axis. Appl. Sci. 2020, 10, 2430. [Google Scholar] [CrossRef]
- Zhou, S.; Zhang, Z.-W.; Cai, R.-B. High Precision Micro Displacement Measurement System Based on PSD. Flight Control Detect. 2020, 18, 22–27. [Google Scholar]
- Yang, Y.-P. Development and application of position sensitive detector. Sci-Tech Inf. Dev. Econ. 2006, 24, 183–185. [Google Scholar]
- Foisal, A.R.M.; Nguyen, T.; Dinh, T.; Nguyen, T.K.; Tanner, P.; Streed, E.W.; Dao, D.V. 3C-SiC/Si hetero structure: An excellent platform for position-sensitive detectors based on photovoltaic effect. ACS Appl. Mater. Interfaces 2019, 11, 55–58. [Google Scholar] [CrossRef] [PubMed]
- He, Y.; Mi, F.; Jin, W.; Liu, M.; Hu, L. Design of an autocllimator swing micro-mirror angle measurement system based on PSD. Opt. Tech. 2017, 43, 561–565. [Google Scholar]


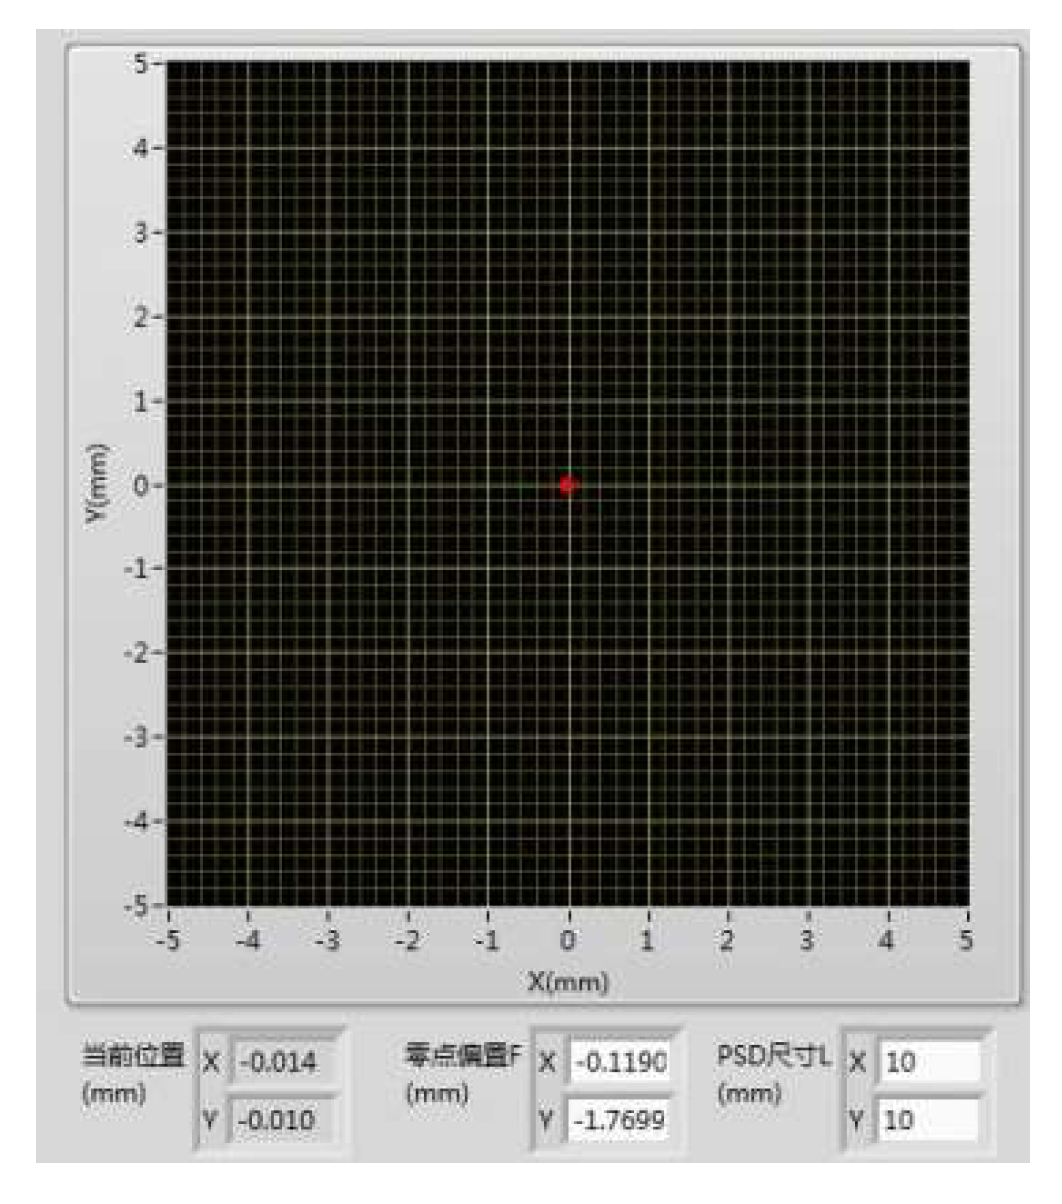
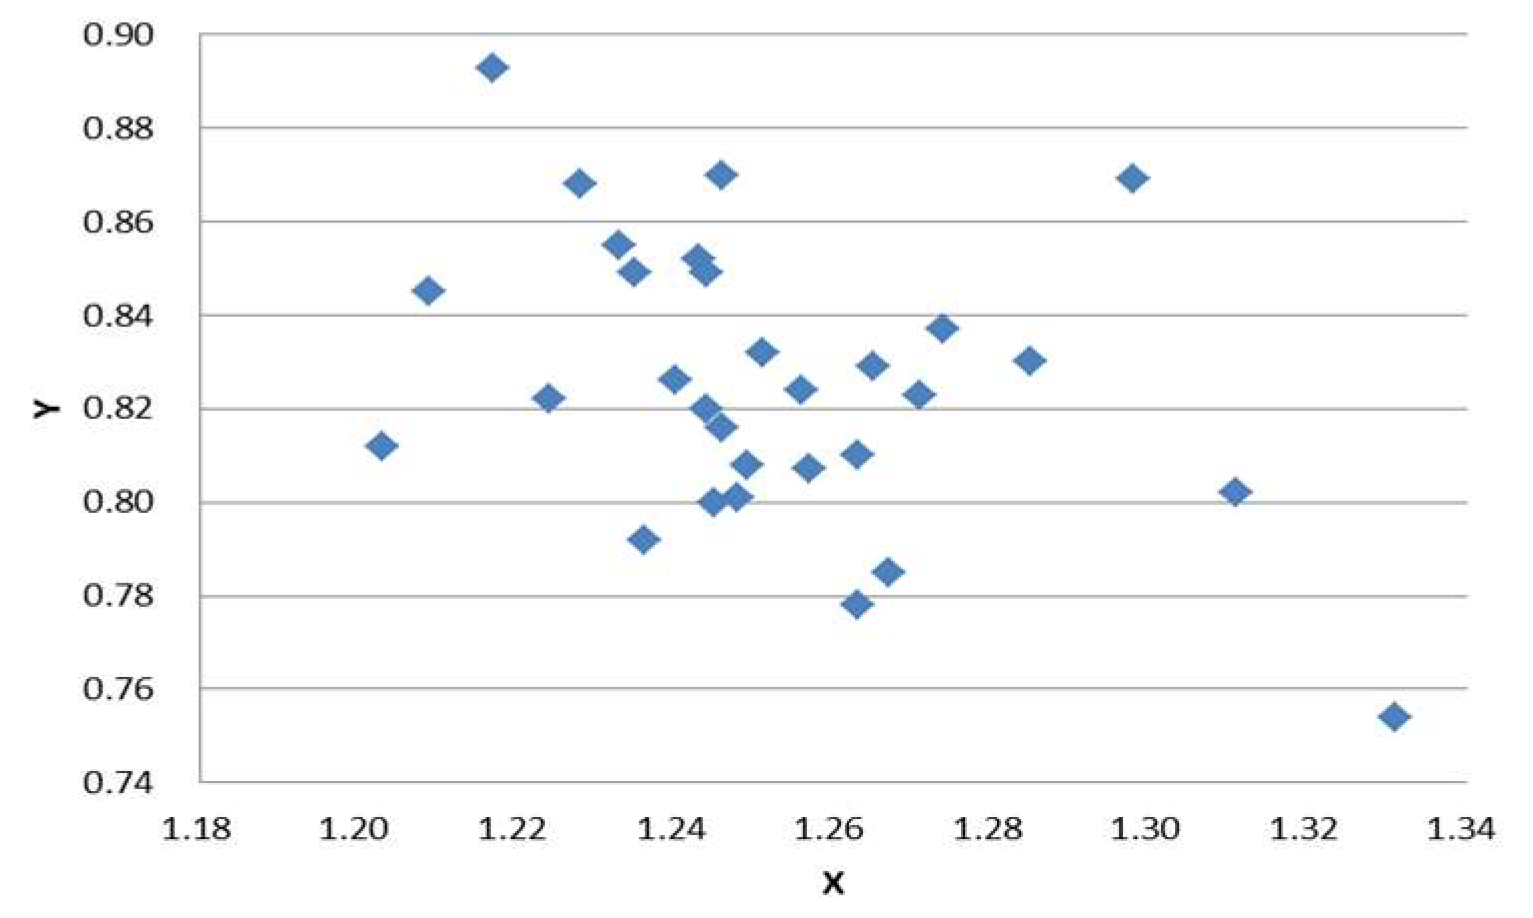
| Sampling | X | Y |
|---|---|---|
| 1 | −0.014 | −0.01 |
| 2 | 0 | −0.004 |
| 3 | −0.003 | −0.019 |
| 4 | 0.017 | 0.024 |
| 5 | −0.003 | −0.004 |
| 6 | 0.012 | −0.047 |
| 7 | 0.005 | −0.04 |
| 8 | 0.008 | −0.007 |
| 9 | 0.012 | 0.014 |
| Average drift error | 0.003778 | −0.01033 |
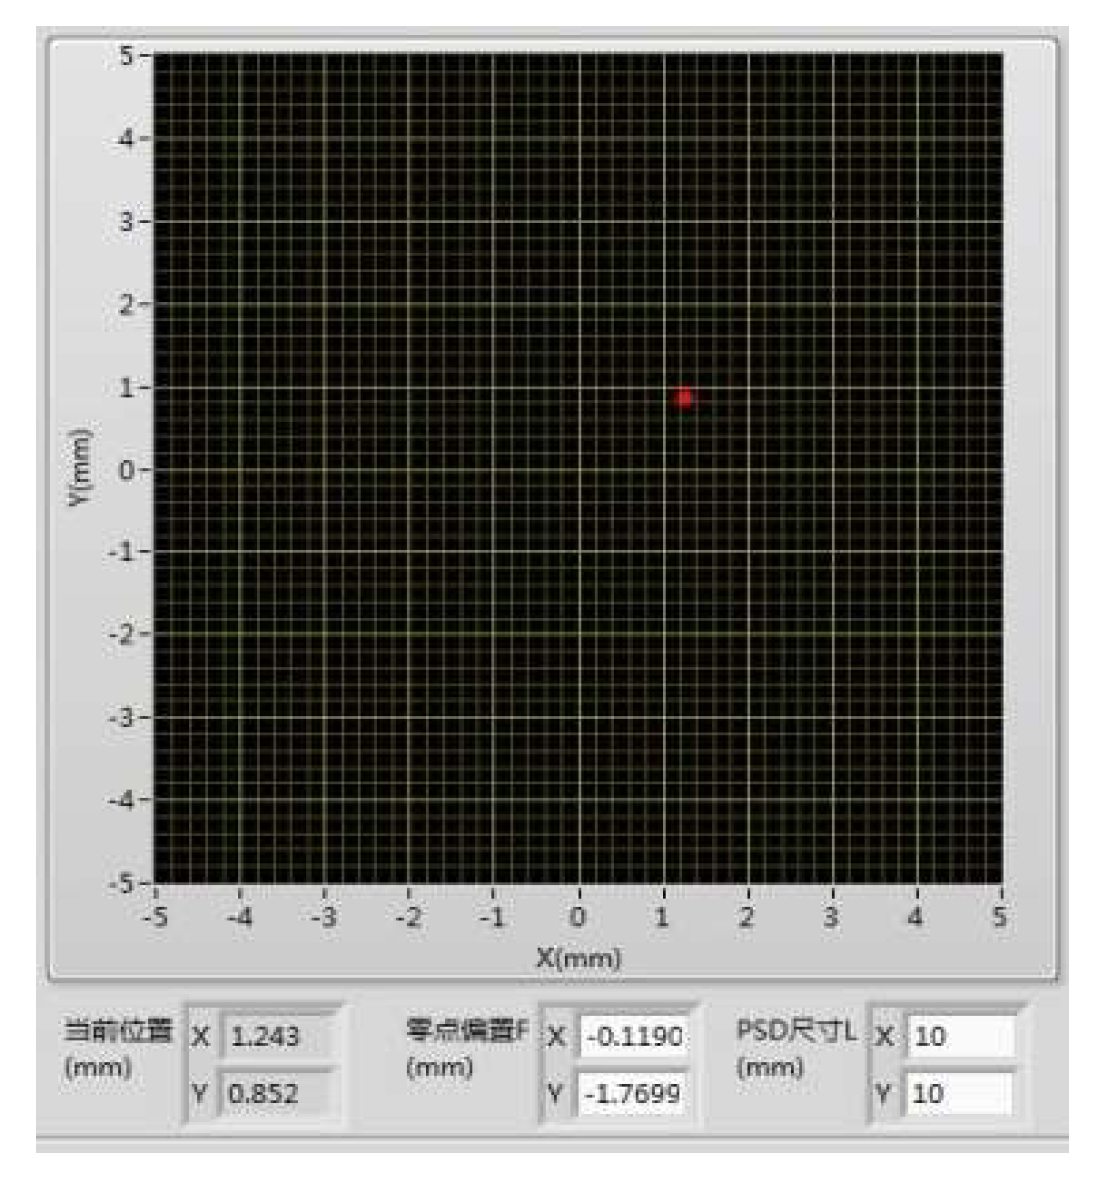
| Displacement Direction | X1 | Y1 |
|---|---|---|
| Average displacement value (mm) | 1.25 | 0.83 |
| Average drift error (mm) | 0.003778 | −0.01033 |
| Absolute displacement value (mm) | 1.24622 | 0.8403 |
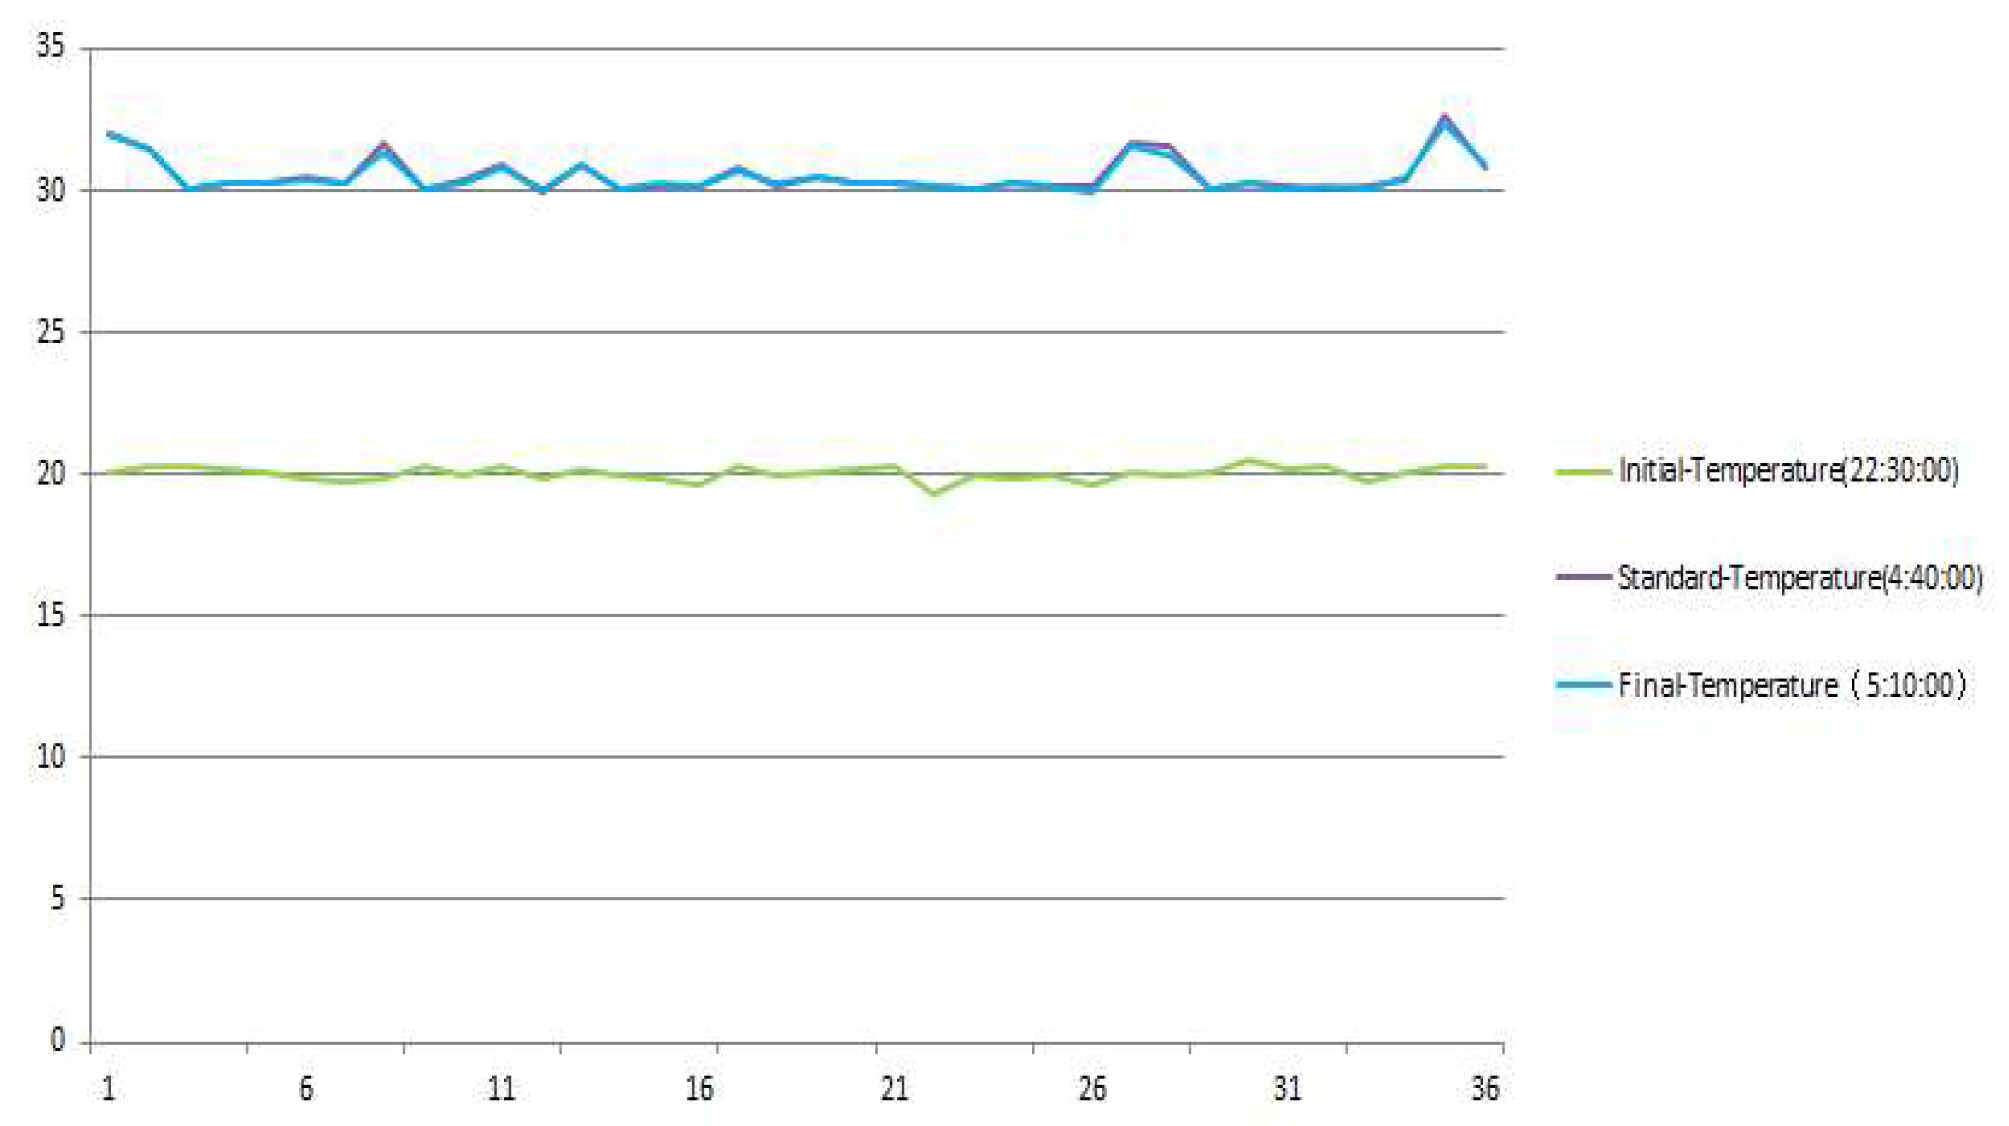
| Average temperature change value (°C) | 10.4633 | |
Disclaimer/Publisher’s Note: The statements, opinions and data contained in all publications are solely those of the individual author(s) and contributor(s) and not of MDPI and/or the editor(s). MDPI and/or the editor(s) disclaim responsibility for any injury to people or property resulting from any ideas, methods, instructions or products referred to in the content. |
© 2023 by the authors. Licensee MDPI, Basel, Switzerland. This article is an open access article distributed under the terms and conditions of the Creative Commons Attribution (CC BY) license (https://creativecommons.org/licenses/by/4.0/).
Share and Cite
Liu, Y.; Xue, Y.; Wang, H.; Pan, Y.; Lin, S.; Ye, S.; Liu, J. Research on a Super-Sub-Arc Bivariate Relative Angle Thermal Deformation Testing Method without Pitch Angle Limitation. Appl. Sci. 2023, 13, 9725. https://doi.org/10.3390/app13179725
Liu Y, Xue Y, Wang H, Pan Y, Lin S, Ye S, Liu J. Research on a Super-Sub-Arc Bivariate Relative Angle Thermal Deformation Testing Method without Pitch Angle Limitation. Applied Sciences. 2023; 13(17):9725. https://doi.org/10.3390/app13179725
Chicago/Turabian StyleLiu, Yang, Yaoke Xue, Hu Wang, Yue Pan, Shangmin Lin, Shuifu Ye, and Jie Liu. 2023. "Research on a Super-Sub-Arc Bivariate Relative Angle Thermal Deformation Testing Method without Pitch Angle Limitation" Applied Sciences 13, no. 17: 9725. https://doi.org/10.3390/app13179725