1. Introduction
The concept of the assembly style of bridge structures has not been widely considered until recently, although the prefabricated composite bridge has a long and successful history. The use of prefabricated systems in bridge construction has recently been the subject of much attention and interest among bridge jurisdictions as a way of improving bridge construction [
1]. In particular, prefabrication offers several benefits, such as reduced waste generation, improved site safety, enhanced quality under factory production, promotion of recycling construction waste, greater environmental protection, process standardization, shorter lead time, and sustainability, as studied by Tam [
2] and Robert Hällmark [
3]. The Federal Highways Administration (FHWA) publication titled “Connection Details for Prefabricated Bridge Elements and Systems” outlines the state of practice in the United States for accelerated bridge construction (ABC) [
4]. However, there are still various engineering problems that have not been solved yet, especially for the design and construction of shear connectors in prefabricated composite beams.
The connection of precast concrete bridge decks and steel beams is a very important part of the construction [
5], in which shear studs are used. There are several methods for the shear studs to connect the existing decks. Some reserve shear stud holes in the steel flange plates and precast concrete decks, thus achieving composite action through post-installed shear studs to connect the existing deck to the steel beams. The methods of installing the shear studs and the behavior of the post-installed shear connectors were studied in recent years by Gordon [
6], Kwon [
7], and A. Peiris [
8].
This method slightly weakens the concrete decks but the hole requires high construction accuracy.
Composite action between the steel beams and deck elements can also be achieved by using headed studs cast into the beam. Precast decks are always made with full thickness pockets or with blind pockets with grouting ports, which were reported in the research of Robert Hällmark [
3] and Giang Bergerova [
9]. This method cannot avoid weakening the concrete and causing creep and shrinkage in the cast concrete.
Another method is shown in
Figure 1, the shear studs are precast in the concrete deck, then, the precast decks are welded to the steel beam to achieve composite action. This approach has been applied to the assembly of a simple supported beam bridge across the Fuling River, which is upstream of the Yangtze River tributaries. The studs of this kind are called “prefabricated shear studs” in this paper, according to the studs’ arrangement.
The shear studs being arranged horizontal to the steel upper flange is the unique characteristic of prefabricated shear studs, which may affect the shear behavior of the structure. The constraint conditions of the concrete are changed because of the stud arrangement, which can improve the shear behavior of the shear studs during the longitudinal loading stage, and some design notes were proposed in the efforts of many researchers such as Kuhlmann U [
10], Silvana [
11], and Y.-T. Chen [
12].
In terms of construction, the horizontal arrangement of the shear studs is to facilitate the prefabrication and assembly of concrete decks. In terms of mechanics, the horizontal arrangement of shear studs mainly plays a role in resisting shear and uplift in the composite bridge deck. Unfortunately, the current research results are not enough to guide the design of prefabricated shear studs, because of the limited results and the different design concept. Recently, the push-out test and finite element simulation are the most popular research methods of shear connectors, as well as other new composite structures, including steel-UHPC composite structures, etc. [
13,
14]. Many researchers have made remarkable achievements on conventional shear studs, such as Daniel [
15] and Chen Xu [
16].
The push-out test study is the base of the finite element simulation, which can verify whether the finite element simulation is correct, and the FEM is more convenient for parameter analysis, which can supplement the shortcomings of experimental parameters. Therefore, FEM has become one of the important means to study the mechanical properties of bolted shear studs and steel concrete composite components.
D. Kruszewski [
17] focused on finite element simulations of push-out tests with headed shear studs embedded in UHPC, with the goal of investigating the engineering parameters concerned with a novel bridge repair method. Hadee Mohammed Najm [
18] developed a three-dimensional finite element model to represent the real physical behavior of complex shear wall structures. The analysis escalates with parametric variation in the reinforcement ratio, compressive strength of the concrete wall, layout of the shear stud, and yield stress of the infill steel plate. In a study of headed studs by Wenxu Hu [
19], a finite element model was validated by a series of push-out tests to study the shear behaviors of headed studs in steel-UHPC composite slabs. A three-dimensional numerical model was validated using previously conducted experimental tests and was used as a reference for a parametric study by Seyedeh [
20]. The height to diameter ratio, friction coefficient of the steel–concrete interface, and concrete strength were selected as the main variables for the parametric study, along with the effects of the bolt-hole clearance.
According to the existing finite element research results involving multi-parameter analysis, researchers usually use a single-factor rotation method, and the parameters are not always preferably set. This situation directly leads to a huge number of calculated quantities, and the results are not easy to sort and analyze, which greatly wastes computing resources and exacerbates time consumption.
The goals of the present work are to explore a more efficient, fast, and economic research method, and at the same time obtain meaningful results. Then, the shear performance of precast shear studs is researched, based on the combination of push-out tests and finite element simulation, and the orthogonal design method by Japanese statistics expert Taguchi Gen’ichi [
21] is brought into the multi-parameter finite element simulation program.
2. Push-Out Test for Shear Performance Analysis
2.1. Test Specimens
Two groups of specimens are designed according to the current codes in China (GB50917-2013 [
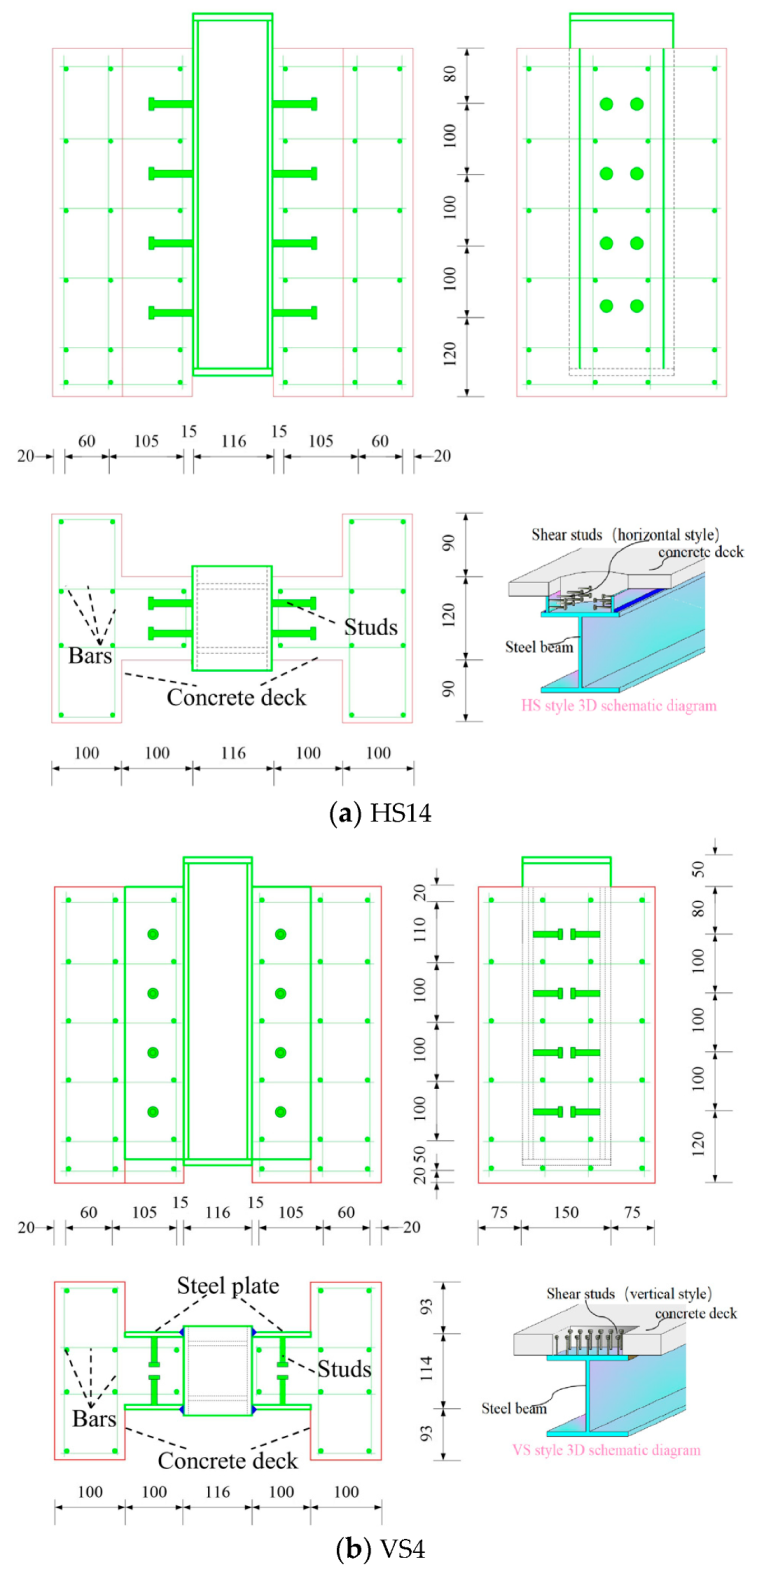
22]). One is VS style another is HS style; each style has 3 layout forms and 3 specimens of each form were repeated. The longitudinal length is 500 mm. The major difference between them is the layout of the shearing studs, as shown in
Figure 2. There are 3 specimens in each group and 4 rows of shearing studs in each specimen, as shown in
Table 1. In the notation of the specimens, VS indicates the conventional specimen with vertical studs, and HS14 indicates the prefabricated specimen with horizontal studs.
2.2. Material Properties
Table 2 shows the steel’s material properties. For the studs of all the test specimens, the diameter is 10 mm, the modulus of elasticity is 205 GPa, the yielding strength is 340 MPa, and the ultimate tensile strength is 400 MPa. For the concrete slab, the designed concrete compressive strength is 60 MPa (named C60-grade concrete), the measured cubic concrete compressive strength is 62.1 MPa, and the modulus of elasticity is 3.46 × 10
4 MPa. For the steel plates (Q345D), the measured modulus of elasticity is 210 GPa, the yielding strength is 412 MPa. For the rebar, the measured modulus of elasticity is 209 GPa, and the yielding strength is 458 MPa.
2.3. Loading Boundary Conditions and Testing
In order to calculate the nominal bearing force
F, a preload with 0.1
F was applied 3 times, then 3 cycles of loading with 0.3
F were applied. In the last failure cycle, the load was applied with steps of 100 kN, 200 kN, …, and every step was sustained for 3 min to observe the test phenomenon. The loading was performed by an electric hydronic testing machine, YAW10000F. The actuator was placed on an extraordinarily thick end plate on the top of a steel box, in order to distribute the applied load. Meanwhile, the bottom end of the concrete deck was placed on the supporting base without any extra constraints. Especially, the fine-grained sand was placed between the concrete and the supporting base, to relax the lateral constraint on the concrete. Subsequent load increments were imposed such that failure did not occur in less than 15 min, according to Eurocode-4. The longitudinal slips between each concrete slab and the steel section were measured continuously during loading using a 1/1000 mm dial gage. The relative slip between the steel plate and the concrete was recorded automatically and obtained by computer. There were 4 displacement gages on each side of every specimen, as shown in
Figure 3.
2.4. Shear Capacity and Slip Characteristics
The test results of the HS14 specimens and VS4 specimens were analyzed after all the specimens had failed. In order to facilitate the comparison of the two types of specimens, the test results are listed in
Table 3, including the maximum bearing capacity value
Pu, the value of the slip under the load of
Pu, the ductility test value, and the failure mode.
The test results show that the failure modes of the two types of specimens were all shear stud shank failure. The maximum shear capacity of the prefabricated shear studs is higher than that of the conventional shear studs, according to the comparison analysis.
The shear capacity value of the smallest (HS14-2; 43 kN) of the prefabricated shear studs is 15% larger than the maximum shear capacity value (VS4-1; 37.38 kN) of the conventional shear studs.
On the contrary, the slip value,
SPu, of the VS4 specimens under the load of
Pu is a little larger than that of the HS14 specimens, as shown in
Table 3. The ductility of the two specimens was also tested, the ductility value,
Sd, is selected when the load value is decreased by 10%, which is also the test termination condition of this test.
The test ductility value shows that the ductility ratios of the prefabricated shear studs are better than those of the conventional shear studs. In addition, the minimum ductility value of the HS14 specimens (2.75 mm) is 36.8% larger than the maximum ductility of the VS4 specimens (2.01 mm).
Finally, the HS style studs’ ultimate load capacity is at least 1.19 times greater than the VS style studs, and their ductility is at least 1.36 times greater than the VS style studs.
Figure 4 shows that the load–slip behavior of the two types of specimens generally follow three stages. Stage I: the amount of slip is tiny increased. Stage II: the slip increases in a nonlinear positive fashion before the curve’s peak with load growth, while the load growth rate exceeds the slip increase rate. Stage III: the slip grows rapidly while the load decreases gradually after the curve’s peak, and the rate of slip growth is far greater than the reduction rate of the load.
The two types of specimen follow the same slip law, and the slope of the curve can reflect the specimen’s stiffness and ductility. The stiffness is almost the same during stage I, where the curve’s positive rate of the two types of specimens is only slightly different. However, the specimen stiffness of the HS14 samples is larger than for the VS4 samples so the curve’s positive rate of the HS14 samples is larger than for the VS4 samples during stage II. The ductility of the HS14 specimens is larger than for the VS4 specimens, so the curve’s negative rate is small during stage III.
In addition, during stage III the HS14 specimens’ load–slip curves are discrete smaller, while the VS4 specimens’ slip curves are discrete larger, generally the less discrete the component the better performance it has.
2.5. Failure Characteristics
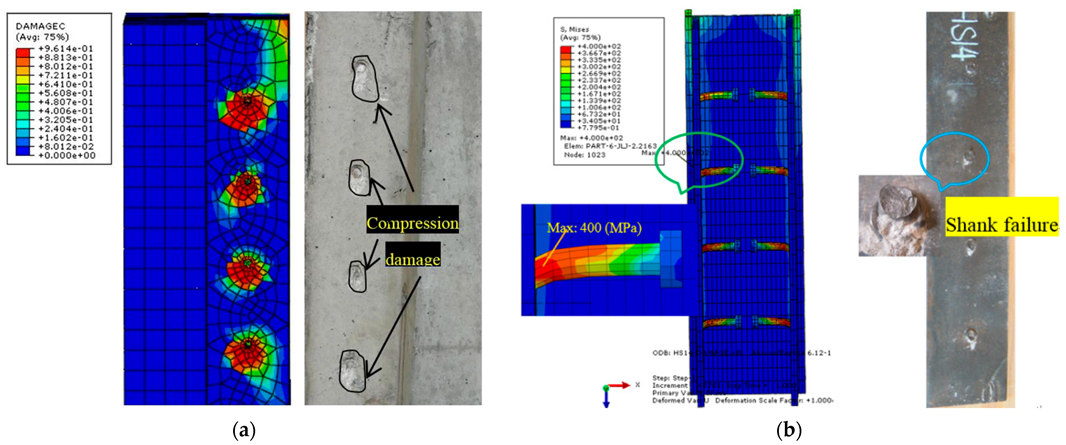
The failure characteristics of the two specimens are observed after the test and the components are separated, as shown in
Figure 5.
The inner damage of HS14 is shown in
Figure 5a. It is obvious that the local crushing zone appears below the roots of the studs, but the concrete crack is not obvious. All the studs display shank failure, there are concrete scratches around the studs on the steel plate.
Figure 5b shows the inner damage of VS4. The local crushing zone appears below the roots of the studs, which is more obvious than for HS14, the concrete cracks are serious and the crack widths are large, even extending into each other. There are also concrete scratches around the studs on the steel plate.
There are several reasons that lead to the different damage situations of the two types of test specimens. Firstly, compared with the VS4, the shear studs of HS14 are arranged in both sides of the concrete, which reduces the stress interaction zone of the concrete. Secondly, the studs are weakly constrained from the edge of the concrete in VS4. Furthermore, the main reason is that the vertical steel plate in HS14 constrains the core concrete from outside, improving the concrete compression performance, so the concrete cracks cannot extend.
It is found that the ductility and bearing capacity of shear studs will improve when the concrete around the studs has existing lateral pressure [
23]. The concrete in HS14 is enclosed by the steel plates, so the passive lateral pressure is produced under the longitudinal shear force, which is a similar principle. The test results of HS14 and VS4 are the best proof.
The above test results show that the shear performance of prefabricated shear studs is better than conventional shear studs when the design geometry size and the number of studs are the same.
Usually, the factors that influence the shear performance of conventional shear studs are stud diameter, concrete strength, stirrup diameter, etc., but for prefabricated shear studs, the factors are still unknown.
The economic cost and time cost of continuing to research the shear performance effects of prefabricated shear studs by push-out testing are significant. Therefore, using the FEA software ABAQUS to continue the research is the best choice.
Therefore, three design parameters are considered for the prefabricated shear studs finite element simulation study, including concrete strength fc, stud diameter D, and lateral spacing of the vertical steel plates L. The research results are expected to guide the design optimization of prefabricated shear studs.
3. FEA Based on Concrete Damage
3.1. Element Type
Based on testing research, the ABAQUS finite element software was adopted to analyze the influencing factors of the prefabricated shearing studs. Therefore, by finding the major factors which influence the bearing capacity of prefabricated shearing studs, we might provide more data support for future design. Firstly, according to the geometrical dimensions of the testing specimens, the fundamental FEM HS-MS was established, as shown in
Figure 6. The 3D solid element C3D8R [
24] was employed with adaptive meshing, to balance accuracy and efficiency. The element size was defined as 2 mm in the 50 × 50 mm region around the studs and then gradually increased to 10 mm outside the region.
Then, based on the fundamental model, three parameters, including the concrete strength, the stud diameter, and the arrangement distance, were modified, and numerical analysis was performed. Considering the obvious slip and material nonlinearity in the push-out tests, eight-node hexahedron-reduced integral elements were applied for the studs, steel plates, and concrete. In this type of element, each node has eight degrees of freedom, which is suitable for modeling specimens with complex nonlinearity.
3.2. Mesh Division and Boundary Conditions
As the element shape might significantly influence the result of the nonlinear analysis, we should make sure that the element shape is regular when dividing the mesh. For elements with contact surface, the dimension should be refined.
For corresponding elements with contact matches, the dimension should be identical, to ensure the accuracy of modeling and reduce the time of convergence. The meshes with a contact surface between the steel and concrete are all matched and corresponding to each other, and the element division is shown in
Figure 6.
The boundary conditions of the model should be identical with the test. The three dimensions of the bottom surface of the concrete specimen were all restrained, and vertical loads were imposed on the top surface of the steel specimen to simulate the push-out force.
In addition, at the contact surface between the steel plate and the concrete, as well as the contact surface between the stud and the concrete, hard contact was applied, as shown in
Figure 6. The interlayer friction coefficient was assumed to be 0.3. Moreover, the contact surfaces of the steel flange and stud shaft were initially selected as master surfaces, while the concrete contact surfaces were the slave surfaces. In the model, the rebar in the concrete were embedded by the command of “embedded region”.
3.3. Loading and Algorithm
As there are studs in the model, the contact issue becomes complicated. If ABAQUS/Standard is applied for static analysis, it may lead to inefficient calculation and poor convergence. By comparison of a tentative calculation, ABAQUS/Explicit is selected for explicit quasi-static analysis, and the result is accurate and convergent, with fast calculation.
Displacement loading is applied in the FEM [
25], the same as the loading method in the push-out test, i.e., downward displacement is imposed on the top surface of the specimen, and the concrete on the ground restrains the other degree of freedom for displacement. Specimen HS-MS is taken as a standard specimen, and the simulated testing result of HS-MS is compared with the actual measured results of HS14 in the push-out test, to verify the validity of the simulation method and the accuracy of the testing results.
3.4. Parameter Design
Applying ABAQUS/Standard can save the results at each convergent incremental step. So, for the same geometric configuration, the output data from nonlinear simulation calculations is many times larger than the data from linear analysis. When planning computer resources, it is necessary to consider these factors and the type of nonlinear simulation calculation a researcher wants to perform, otherwise the efficiency of the calculation will be greatly reduced. Thus, this article uses an orthogonal method to save computational resources in the design of the finite element models.
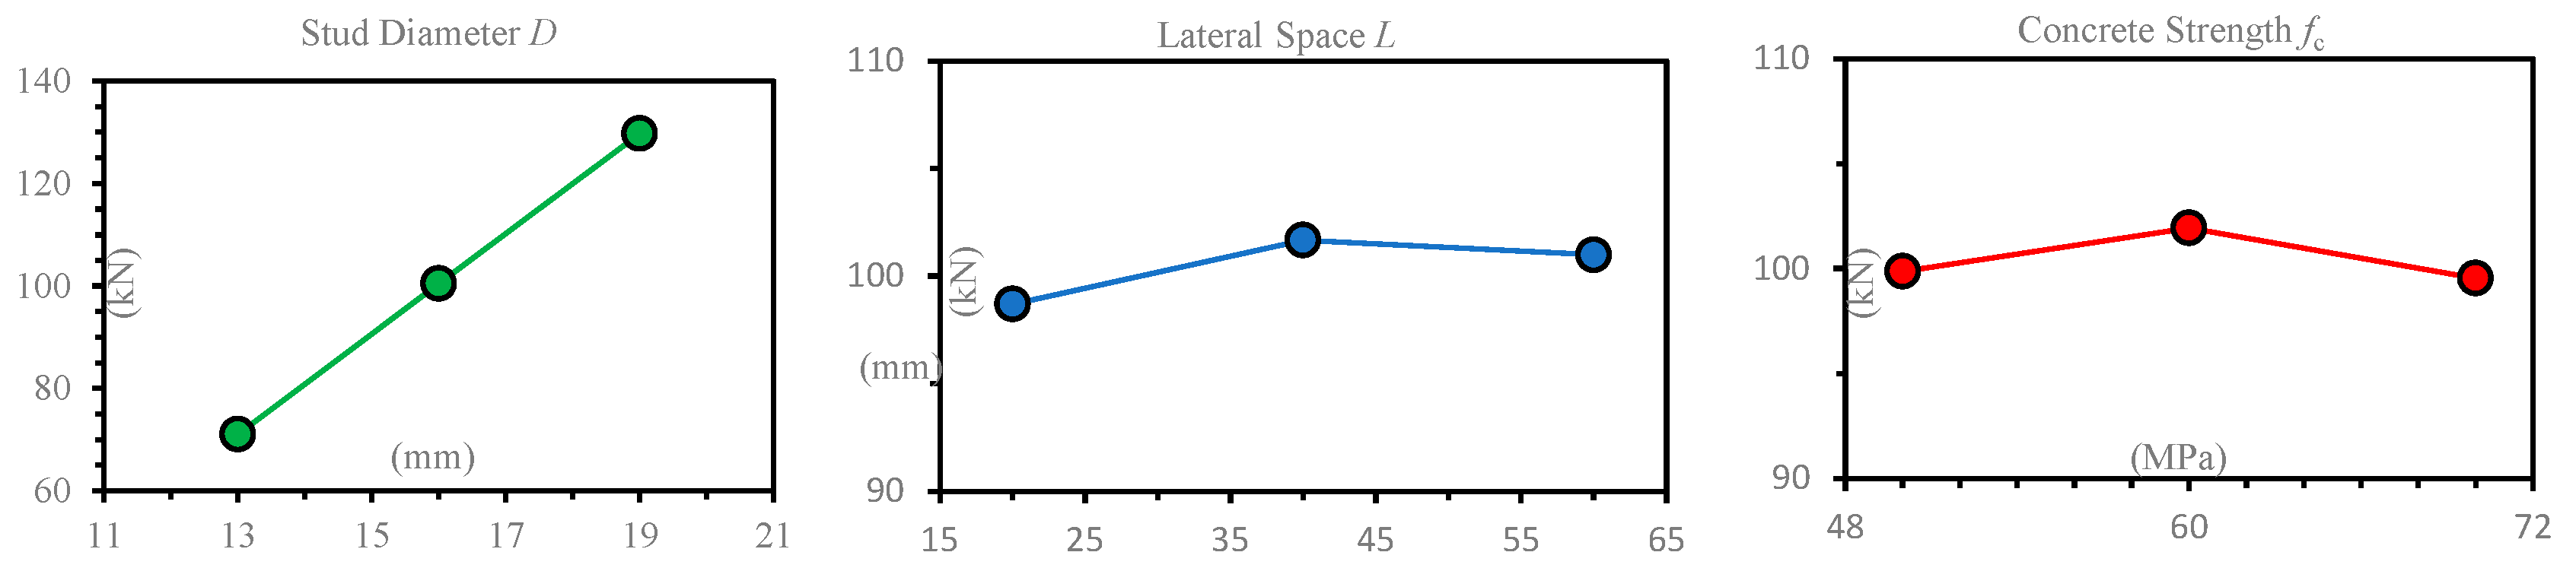
Except for the model HS-MS, with the same parameters as specimen HS14 in the push-over test, models with different designed parameters were established including the following parameters: three different compressive strength concretes (C50, C60, C70); three different stud diameters (
D = 13 mm, 16 mm, 19 mm); and three different lateral spacings of the vertical steel plate (
L = 20 mm, 40 mm, 60 mm) (
Figure 7). According to the traditional single-factor rotating method, it is too difficult to establish 3
3 = 27 models to investigate all of the listed 9 parameters.
However, considering the characteristics of the parameters, this problem could be solved by the orthogonal list proposed by a Japanese famous statistician named Taguchi Gen’ichi [
20]. Therefore, only nine models are needed for parameter analysis. In total, 10 models were created, using ABAQUS to perform the finite element method (FEM) analysis, as shown in
Table 4. Test numbers 1–9 refer to the FEMs according to the orthogonal list, and test number 10 refers to a standard model which is the same as the push-out test to verify the accuracy of the modeling method. It is obvious that the orthogonal experimental method greatly reduces the sample size of the experiment, saves computational resources, and is more conducive to discovering and summarizing rules.
Based on the orthogonal list, three design parameters are divided into groups; the opportunity and frequency of each parameter in the nine models are the same, which significantly reduced the work due to repeated emergence of the parameters. Moreover, in the results analysis, with the calculation method of the orthogonal list, the shearing resistance with different parameters is obtained, and the influence of the three parameters on the loading capacity is also obtained.
3.5. Material Constitutions of Concrete Damage
In the FEM, the materials contain concrete and steel.
Table 2 lists the material properties of the steel plate, rebar, and studs. An elastic-strengthen model is applied for the stress–strain curve of the studs, and an ideal elastic-plastic model for the steel plate and rebar. By comparison, the material constitution of the concrete seems more complicated.
Considering the obvious nonlinear displacement of concrete under load, a special concrete damage model in ABAQUS is adopted. In this damage model, a damage factor,
d, is introduced to reflect the degeneration law of the elastic modulus in the plastic damage process of concrete. The relationship between the elastic modulus and the damage factor is in terms of Equation (1)
where
E0 refers to the initial elastic modulus, and
E refers to the damaged elastic modus. The damage factor,
d, is defined in Equation (2).
where
dt refers to uniaxial tensile damage,
dc refers to uniaxial compressive damage, and
st and
sc refer to recovered stiffness in the opposite direction of stress.
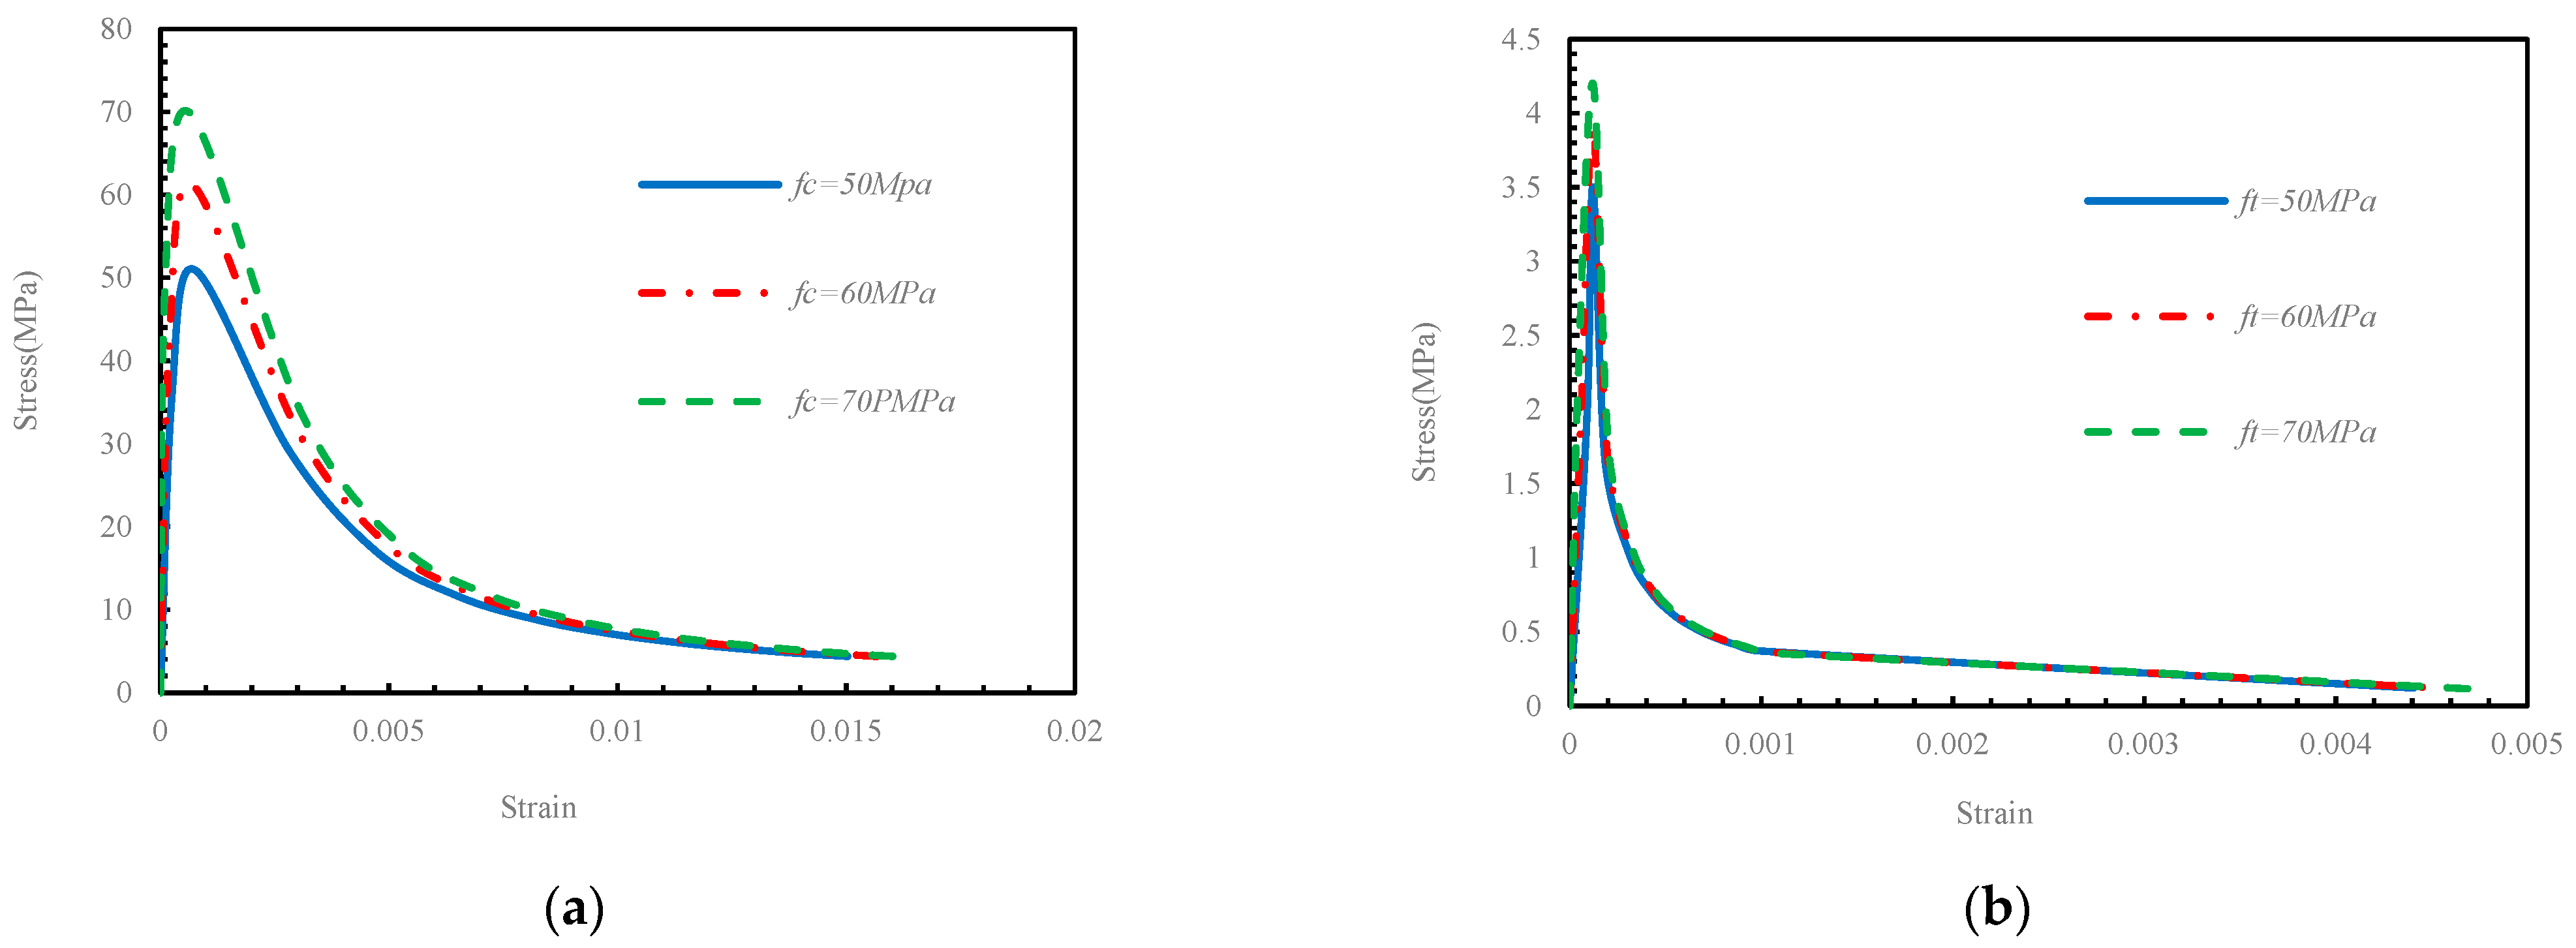
The calculation of concrete damage includes two parts. One is the condition to reach the damage state. The other is the evolution of the damage process. Once the concrete reaches the peak stress of tension or compression, the damage is considered in the calculation. The stress–strain curve of modeling concrete is shown in
Figure 8.
After the concrete reaches the state of damage, the failure of concrete can be calculated by the damage faction curve, as shown in
Figure 9. In addition, when calculating concrete damage in the model, we need to input other parameters, i.e., the dilation angle of concrete is 53°, the biaxial–uniaxial ratio is 1.16, and the eccentricity is 0.15.


