Article

Pavement Strategy Optimization of Cable-Stayed Bridges against the Negative Reaction Risks of Auxiliary Piers

1
School of Highway, Chang’an University, Xi’an 710018, China
2
School of Civil Engineering, Southeast University, Nanjing 211189, China
3
Sichuan Highway Planning, Survey, Design and Research Institute Ltd., Chengdu 610041, China
4
Central & Southern China Municipal Engineering Design and Research Institute Co., Ltd., Xi’an 430010, China
*
Author to whom correspondence should be addressed.
Appl. Sci. 2023, 13(8), 4877; https://doi.org/10.3390/app13084877
Submission received: 18 March 2023 / Revised: 10 April 2023 / Accepted: 11 April 2023 / Published: 13 April 2023
(This article belongs to the Special Issue Bridge Structural Analysis)

Abstract

:
Because the adjustment of the stay cable tension and girder counterweight is limited at the operation stage it is a difficult problem to control the negative reaction risk of the auxiliary pier (NRRAP) caused by multisource construction uncertainties and traffic growth. This paper proposes a pavement strategy optimization to control the NRRAP by adjusting the pavement thickness. The pavement strategy optimization is formulated as a reliability-constrained, multiobjective optimization problem, which is resolved by the nondominated sorting genetic algorithm (NSGA-II). A sensitivity analysis and a reliability analysis based on the generalized regression neural network (GRNN) surrogate model were performed to illustrate the significance of the uncertainty level in auxiliary pier negative reactions. The Pareto front examines the balance of construction cost, driving comfort and specified reliability threshold. The efficiency and accuracy of the proposed method are validated in a real cable-stayed bridge, and the results exhibit its advantages in controlling the NRRAP.

1. Introduction

An auxiliary pier is an important measure to enhance the overall stiffness of cable-stayed bridges [1]. The auxiliary pier can not only restrain the displacement and the bending moment of the side-span girder and reduce the stress amplitude of the stay cable [2] but can also significantly reduce the horizontal displacement of the pylon and the vertical displacement of the mid-span girder under the live load by enhancing the anchoring effect of the anchor cable [3]. Therefore, auxiliary piers are widely used in long-span cable-stayed bridges [4,5,6]. To give full play to the auxiliary pier, the positive (upward) reaction on the auxiliary pier needs to preserve a reliable magnitude to prevent the upward deflection of the girder during both the construction and operation stages [7]. The auxiliary pier bearing separation will change the structure’s stress system and cause boundary nonlinearity, which has an adverse impact on the structure’s stress state [1]. Therefore, not only the traditional criteria of “the tower being vertical, the girder being horizontal and a uniform distribution of cable forces” (C1~C3) but also the criterion of “no negative reaction under the live load” (C4) should be satisfied during the design state of a completed bridge [1]. The criterion requires that the bearing reactions of the transition piers and auxiliary piers should have a sufficient positive reaction under the dead load without a negative reaction under the live load.
However, it is difficult to totally achieve the objective service stage (OSS) considering the unpredictable multisource construction uncertainties [8,9], and the NRRAP will be further increased when considering traffic growth at the operation stage [10,11]. Therefore, it is crucial to decide an economic and practical strategy against the NRRAP at the operation stage on the basis of ensuring “the tower being vertical, the girder being horizontal and a uniform distribution of cable tensions”.
For long-span asymmetric cable-stayed bridges, the NRRAP can be reduced by girder counterweight or cable tension optimization in the construction stage [12,13]. However, the parallel strand cable can hardly be adjusted at the operation stage [14]. Because the strands are stretched one-by-one and anchored with wedge-type anchors, the strands at the tensioning end have to be cut according to the required tensioning length after cable tension adjustment. After the cable tension adjustment, the protective cover should be installed and filled with oil to protect the anchor head, which will further increase the difficulty of cable tension adjustment at the operation stage [15]. In addition, it is extremely difficult to construct a girder counterweight inside the main girder at the operation stage because of the restricted construction space, which is accompanied by cable tension optimization [16]. Due to the high cost of tensioning operations, bridges should be designed so that the stay cables are prestressed the minimum number of times and no final tuning retensioning operation is sought after construction, especially for cable-stayed bridges with parallel strand cables [17]. In summary, it is infeasible to construct the girder counterweight or optimize the cable tension at the operation stage. Furthermore, an optimal coping strategy that can successfully control the NRRAP at the operation stage has not been reported in the literature thus far.
In addition to multiple control criteria, it is also necessary to quantify the various uncertainties by a probabilistic analysis at the construction and operation stages. Therefore, reliability-based design optimization (RBDO) is essential to decide an optimal coping strategy [7]. Massive simulations and analyses are required when coupling the RBDO and the multiple control criteria. However, finite element model (FEM) analysis is very time-consuming due to the strong nonlinearity of a cable-stayed bridge. Nested RBDO based on an FEM analysis would make it computationally expensive and even intractable. To improve the optimization efficiency, various surrogate models are employed to replace the FEM analysis to approximate the implicit performance functions and the corresponding limit states in the reliability analysis and RBDO. The commonly used surrogate models include the response surface method (RSM) [18], support vector regression (SVR) [19], artificial neural networks (ANNs) [20,21], kriging models [22,23], and radial basis functions (RBFs) [24]. This paper applies the GRNN, a deformation form of the RBF, in RBDO because the GRNN has excellent performance in nonlinear approximation, quick learning, fault tolerance, and robustness, even in the case of inadequate samples [25].
In addition, the RBDO aims to obtain a reliable optimum to ensure that the failure probability does not exceed a target level. Therefore, various corresponding approaches have been proposed. Wang et al. [7] presented a BPNN-assisted reliability-based design optimization method for the two-phase tensioning system transformation process (STP) of a cable-stayed bridge erected by the incremental launching method. Xiang et al. [26] used the RSM and NSGA-II algorithms to execute the multiobjective optimization of a composite orthotropic bridge to improve the fatigue performance to achieve an infinite fatigue life under a relatively low structural weight. Wang et al. [27] proposed a fault-tolerant interval inversion (F-TII) framework to mine the fault-tolerant capacity from the geometric nonlinear redundancy of a cable system, in which the inversion is solved as a reliability-constrained, multiobjective interval optimization problem with the aid of a GRNN-based surrogate model. These studies indicate that multiobjective optimization methods combined with the surrogate model are feasible in structure optimization. However, there are no related reports on the multiobjective optimization of controlling the NRRAP of cable-stayed bridges in the literature thus far.
This paper presents a three-step pavement optimization strategy (TPOS) against the NRRAP. First, the assessment of the NRRAP under the live load was carried out based on the updated parameters. Second, the design variables were determined according to sensitivity analysis. The pavement optimization problem was formulated with the objectives of driving comfort and minimum construction cost. In addition, the reliability constraint for the bearing reaction of the auxiliary pier was adopted in the optimization model. The NSGA-II was used to solve the multiobjective optimization problem and obtain the optimal Pareto set. Third, we randomly selected an optimization scheme from the optimal Pareto set and evaluated it with C1~C3 [28]. The TPOS was applied to an asymmetric cable-stayed bridge. The results demonstrate that the TPOS can efficiently achieve the optimal pavement strategy of the cable-stayed bridge under multisource construction uncertainties and traffic growth.

2. Assessment Model for Negative Reaction Risks under Uncertainties

2.1. Reliability Assessment Model for the Reactions of an Auxiliary Pier

The reaction force of the auxiliary pier is critical to prevent the permanent bearing from separating from the girder during the construction and operation stages. The limit state function of the minimum reaction of the auxiliary pier (RAP) at the operation stage is as follows:
G x = R m = min K T T + K P P + R G + R Q
where G(x) < 0 means the separation between the permanent bearing and the girder [1]. Rm is the minimum RAP at the operation stage; KT is the influence matrix of the cable tension on the RAP, where T is the cable tension vector; KP is the influence matrix of the pavement load on the RAP, where P is the pavement load vector; RG is the influence vector of the permanent load other than the cable force and pavement load on the RAP; and RQ is the influence of the live load on the RAP.
The sensitivity index and reliability index of the parameters relating to the limit state function in Formula (1) were calculated by the method shown in Section 3. The related surrogate models were built using the GRNN method shown in Section 4.2. The optimization model was solved by the NSGA-II method shown in Section 4.3.

2.2. Increased Negative Reaction Risks under Uncertainties

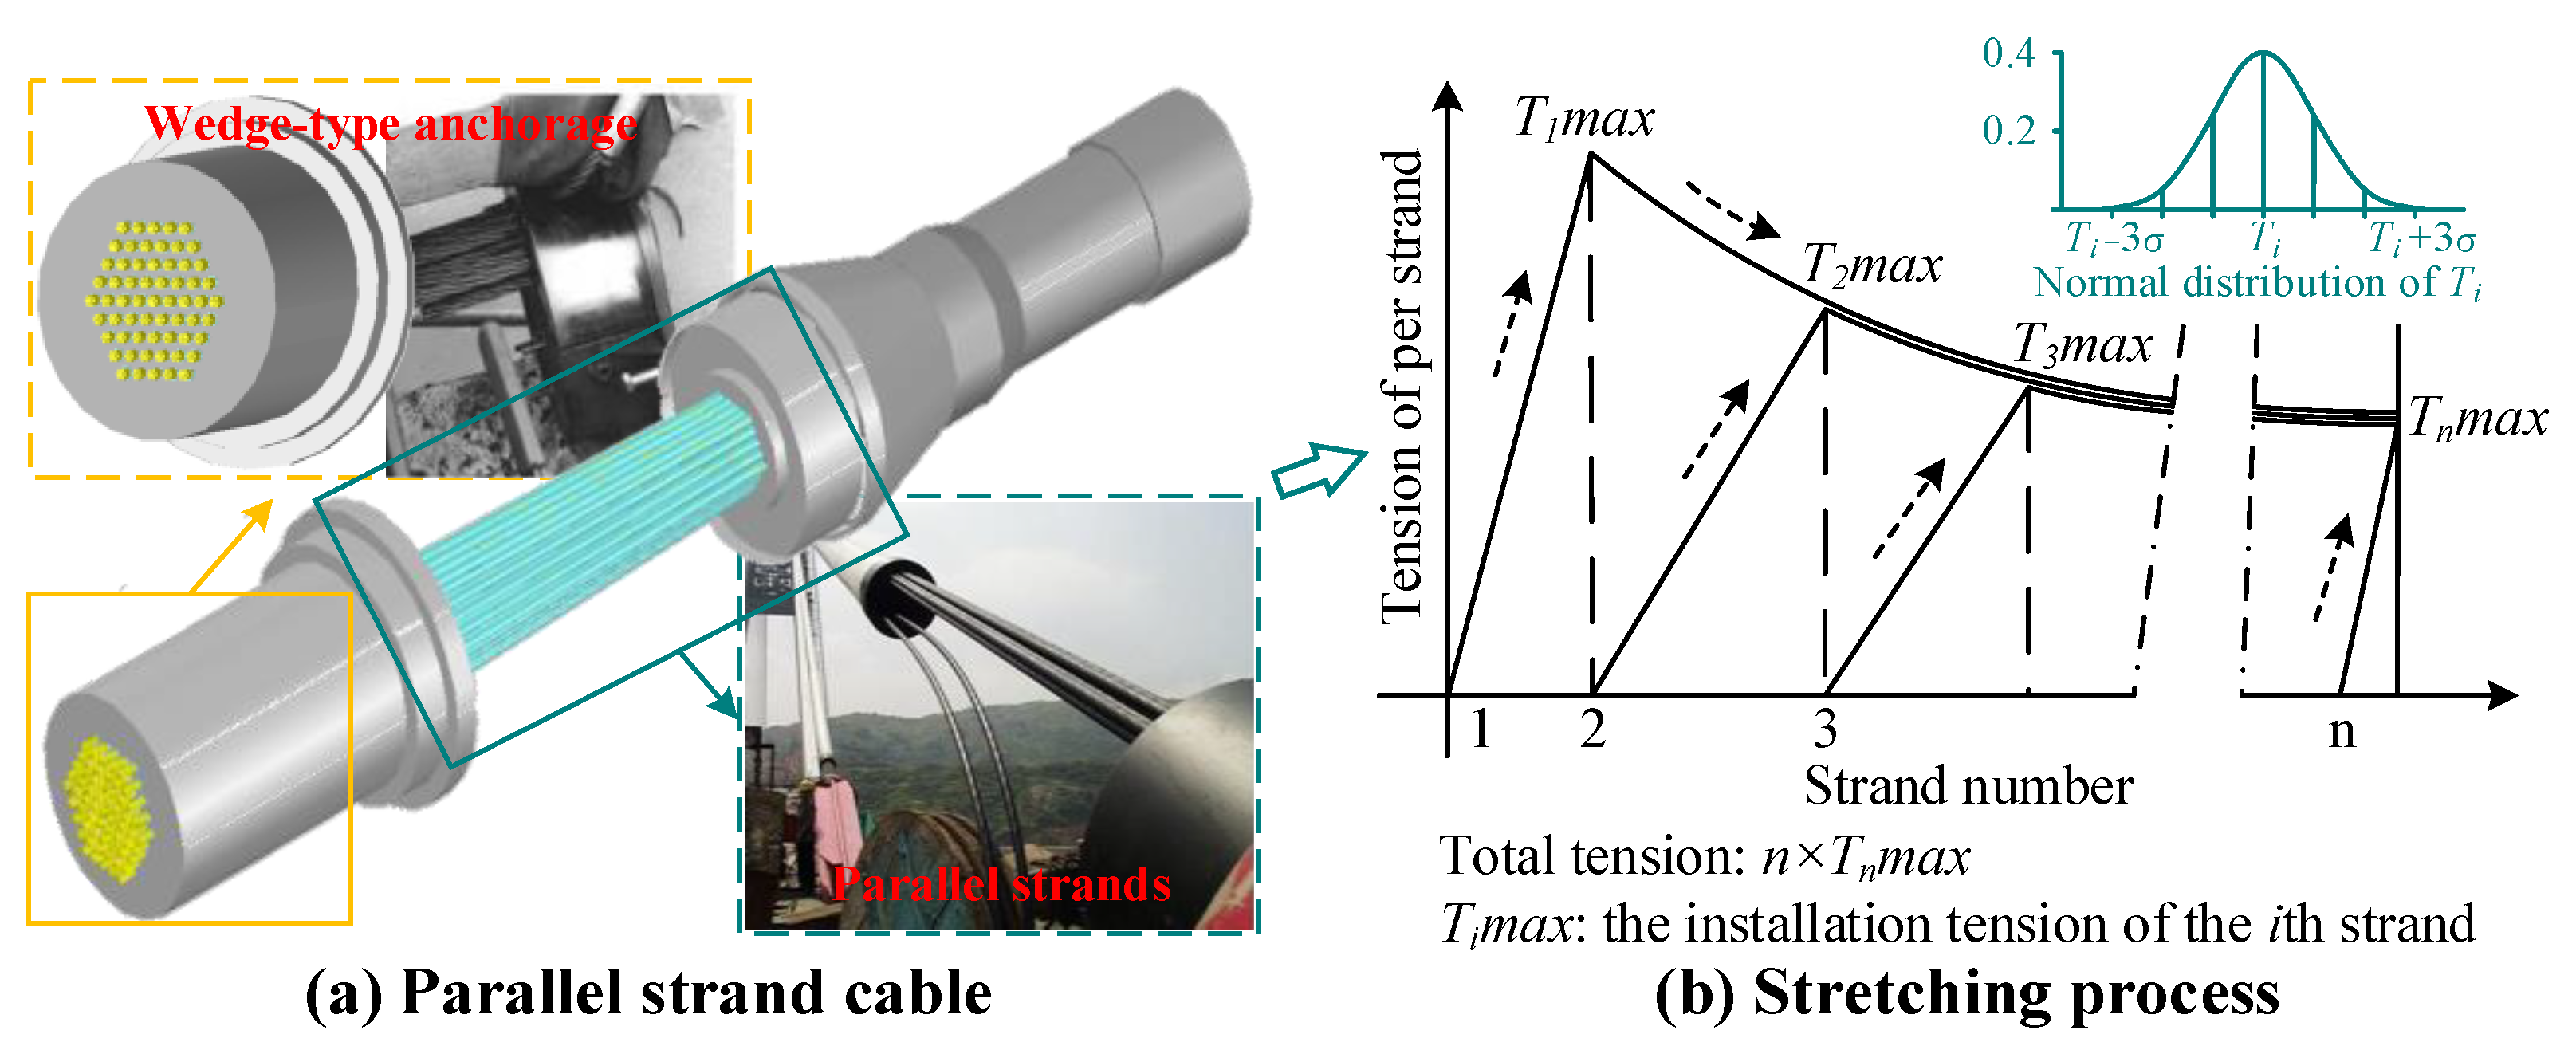
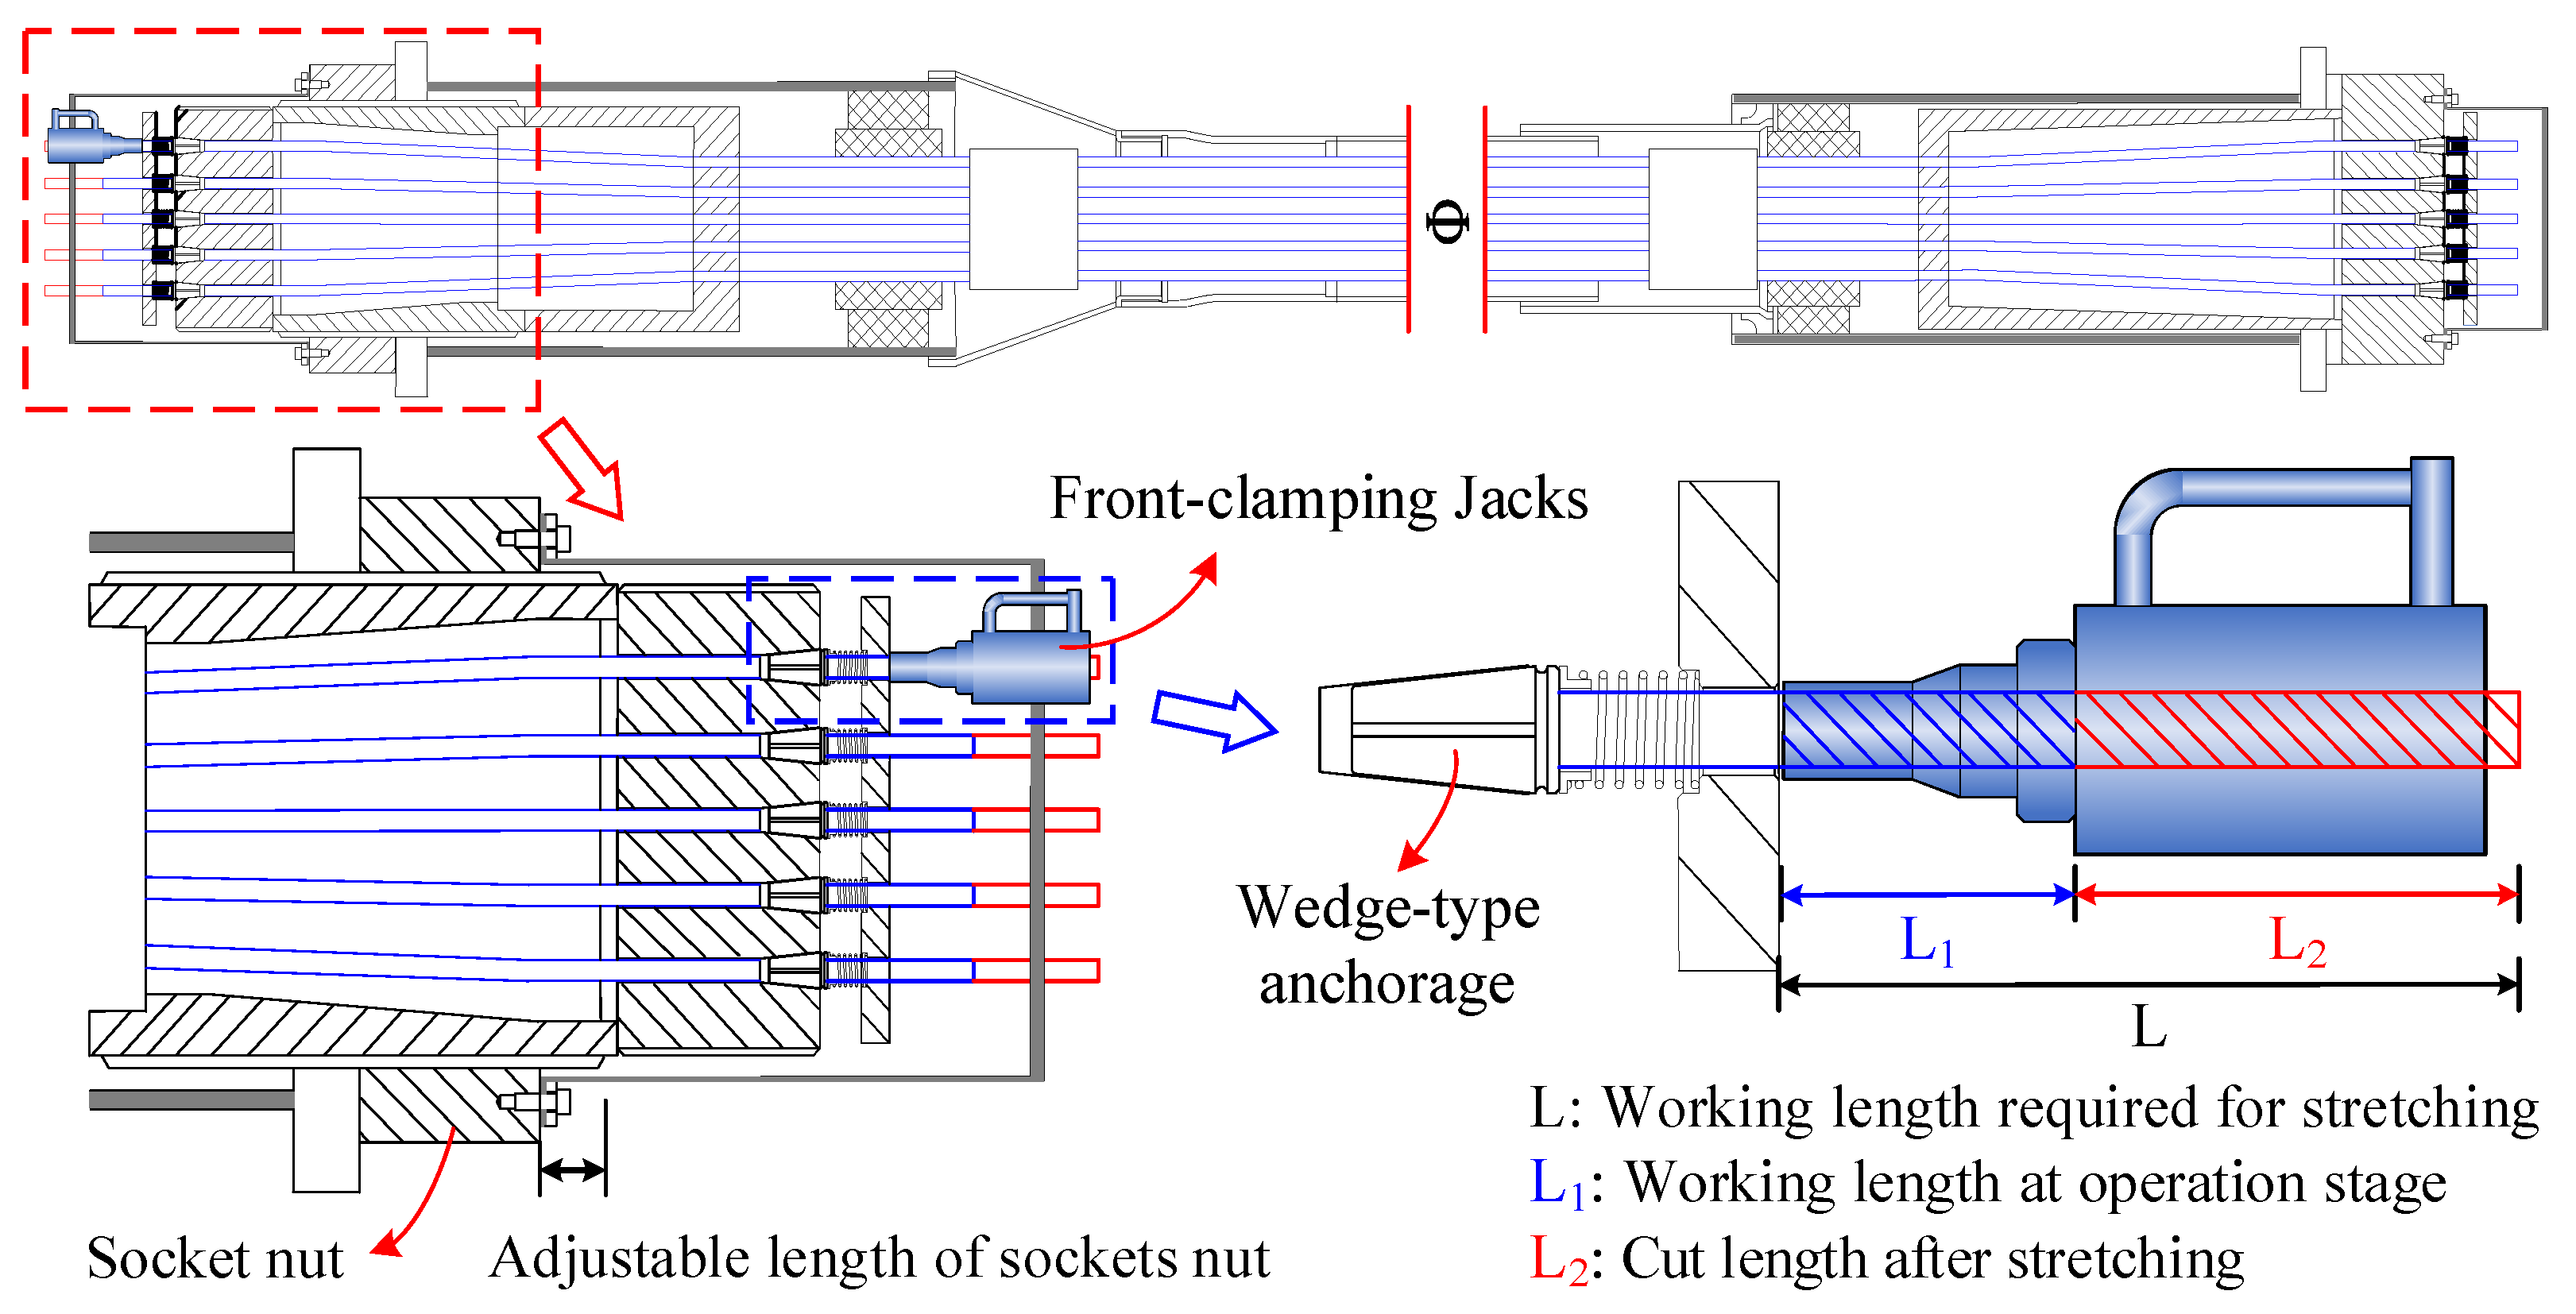
2.2.1. Stretching Process and Adjustable Length of the Parallel Strand Cable

In cable-stayed bridges, stay cables are essential, and parallel strand cables are one of the principal stay cables utilized in all different forms of cable-stayed bridges. Parallel strand cables are made up of bundles of strands shielded by galvanization and a semibonded individual sheath, as shown in Figure 1a. Parallel strand cables are fabricated and transported separately from parallel wire stay cables, and the strands are stretched and anchored one by one. This allows for all stretch-draw work to be performed with lighter and smaller equipment [15]. However, as shown in Figure 1b, the tensioning of the parallel strand Ti will reduce the original parallel strand tension T1~Ti−1. The strong interference between parallel strand tensions and the tension uncertainty of each strand will make it extremely difficult to ensure a uniform cable tension and achieve the theoretical optimal cable tension. During the actual construction stage, the cable tension error of parallel strand cables often reaches 8% or even 10%, which will greatly increase the NRRAP [1].
In addition, as shown in Figure 2, the parallel strand cable with a wedge-type anchor will be cut after tensioning, and the length of the cut parallel strand is very short, so it is difficult to adjust the cable tension by tensioning a single parallel strand at the operation stage. It is difficult to ensure the uniformity of the cable tension among the parallel strands when adjusting the parallel strands. Furthermore, the very modest adjustable cable tension at the operation stage is caused by the very short adjustable length of the socket nut.
The control difficulty of parallel strand cable tension will greatly increase the deformation control difficulty of the cantilever construction of a cable-stayed bridge. The stretching limitation of the parallel strand cable will make it almost infeasible to adjust the cable tension at the operation stage.

2.2.2. NRRAP Caused by Forced Closure

According to the Specifications for Design of Highway Cable-stayed Bridge (JTG/T 3365-01-2020) [1], the unbalanced load of a cable-stayed bridge in the construction stage should be considered as follows: ① unbalanced load generated by the asymmetric design of the girder; ② unbalanced load due to the construction process; ③ unbalanced load caused by construction errors; and ④ unbalanced wind load at both ends of the cantilever during cantilever construction. The coupling of the above unbalanced loads will bring great challenges to the cantilever construction control of asymmetric cable-stayed bridges.
Material nonlinearity and geometric nonlinearity will cause a secondary internal force and reduce the structural stiffness with increasing cantilever length, which will significantly increase the structural deformation and internal force under unbalanced loads and even cause a large closure deviation [29]. As shown in Figure 3, when a large closure deviation appears, the forced closure construction will lead to the tendency of upward deflection of the side span, which will lead to the reduction in the RAP or even the negative reaction of the auxiliary pier.

2.2.3. Time-Varying Live Load

According to the Unified Standard for Reliability Design of Highway Engineering Structures (JTG 2120-2020) [30], the live load on the bridge is time-varying, so its statistical analysis is described as a probability model of a random process. As shown in Figure 4, road traffic has experienced substantial growth with the rapid development of the transportation industry over the past decades. The continued increase in the live load poses a serious threat to the operational safety of existing bridges, and the growth in traffic could become a risk factor for them [31]. Therefore, it is crucial to assess how increasing traffic affects the security of transportation infrastructures, especially in light of the fact that current load models and safety factors neglect the impact of the traffic increase [10].
In this paper, a dynamic generalized extreme value (GEV) distribution was used to establish the live load model instead of the traditional single extreme value distribution [32]. The GEV distribution is a bottom function composed of three extreme value distributions, including extreme value type Ⅰ (Gumbel), extreme value type II (Fréchet), and extreme value type Ⅲ (Weibull) distributions. Compared with a single extreme value distribution, using the GEV distribution as the bottom function can adapt to varied section distributions and has better robustness.
Z τ ~ G E V ( μ , σ , ω ) = G ( x g e v , θ ) = exp 1 ω ( x g e v μ σ ) 1 ω
where xgev is a random variable obeying the GEV distribution. μ, σ, and ω are the location parameter, size parameter, and shape parameter of the GEV distribution, respectively. θ is the parameter vector. The value of ω will directly determine the distribution type of the GEV distribution: an extreme value type I distribution occurs when ω is close to 0; an extreme value type II distribution occurs when ω is much larger than 0, and an extreme value type III distribution occurs when ω is much smaller than 0.
By introducing the time parameter t, the dynamic GEV distribution model of the nonstationary vehicle load process can be further expressed as follows:
Z τ ~ G E V μ ( t ) , σ ( t ) , ω ( t ) = G x g e v , θ ( t ) = exp 1 ω ( t ) ( x g e v μ ( t ) σ ( t ) ) 1 ω ( t ) ω ( t ) 0 exp exp x g e v μ ( t ) σ ( t ) ω ( t ) 0

2.3. Risk Control Strategy

This paper presents a three-step pavement optimization strategy (TPOS) against NRRAP. This strategy includes the assessment of the NRRAP under the live load and the formulation and solution of the pavement optimization problem. As shown in Figure 5, the key steps of the TPOS are summarized as follows:
(1)
The assessment of the NRRAP under the live load is carried out based on the updated parameters. If the assessment result meets the requirements of the specification, the construction can be carried out directly; otherwise, the pavement needs to be optimized for C4;
(2)
The design variables are determined according to the sensitivity analysis results and construction status;
(3)
The pavement optimization problem is formulated as a multiobjective optimization problem under reliability constraints. The GRNN-based surrogate model is created for the reliability constraint function. The Pareto optimal solution set is obtained by utilizing NSGA-II to solve the RBDO problem mentioned above;
(4)
The optimization scheme from the Pareto optimal solution set is selected and evaluated with C1~C3. The optimization scheme is selected according to the decision-maker’s emphasis on different objectives. If it does not satisfy C1~C3, the optimization process in step 4 is repeated until the optimization scheme satisfies C1~C4 at the same time.

3. Identification of the Key Parameters Affecting the Negative Reactions

The first-order second-moment (FOSM) method was used in this section to conduct a reliability sensitivity analysis for each variable on the static reliability to quantify the impact of each fundamental random variable on the failure probability Pf of the auxiliary pier [33]. The FOSM technique extends the limit state function G(X) at the most troublesome failure point, X*, and then calculates the first-order Taylor expansion of G(X) in Formula (4). Calculating the mean and standard deviation of the G(X) expansion will yield the reliability index, as indicated in Formula (5):
G X = G X + i = 1 n G X i X X i x i
β = μ G σ G = G X + i = 1 n G X i X μ i x i i = 1 n G X i X σ i 2
where xi* denotes the ith component of X*, and μi and σi denote the mean and standard deviation of the ith random variable after equivalent normalization.
The sensitivity index can be derived using the traditional FOSM method, which solves the limit state equation by equivalently normalizing random variables, as illustrated in Formula (6). The following Formula (7) suggested by Jie et al. [34] was utilized in this work to account for the influence of the mean and standard deviation and make up for the shortcomings of the conventional FOSM technique in determining sensitivity:
S i = G X i X σ i k = 1 n G X k X σ k 2
S i = P f σ i X σ i 2 k = 1 n P f σ k X σ k
P f σ i X = P f β β μ i μ i σ i = ϕ β G x i X σ i G x k X σ k x i μ i σ i 2
S i = G x i X x i μ i 2 k = 1 n G x k X x k μ k
where Pf is the failure probability. The sensitivity calculation formula can be obtained by combining Formulas (7) and (8), as shown in Formula (9). The calculation formula was used to identify the key parameters affecting the negative reactions of the auxiliary pier.

4. Surrogate-Assisted Uncertain Optimization for Pavement Strategy

4.1. Surrogate-Assisted RBDO

RBDO is the synthesis of reliability analysis and optimization design [35]. In contrast to standard deterministic optimization, RBDO considers the uncertainties as a kind of random variable that makes up probabilistic constraints, which are assessed in the reliability routine. Therefore, compared to deterministic optimization, RBDO can offer a more accurate and competitive solution to an optimization problem [36]. The RBDO problem is as follows:
f i n d D = d 1 , d 2 , , d k T obj . min   f o b j D , U   s . t . β G i D , U β i T i = 1 , 2 , , m d k L d k d k U k = 1 , 2 , , n
where D is the vector of design variables, U is the vector of random variables, dL and dU are the lower limit and upper limit of the design vector, respectively, and βT is the required target reliability index. The limit state function G(X) is defined in Formula (1).
The traditional solution process of RBDO usually focuses on the optimization iteration of the outer layer on the design variables. When the reliability index is required by the objective functions or constraint functions, the outer layer optimization is suspended, and the reliability analysis module is called to calculate the corresponding reliability index. After the reliability analysis, the outer layer iterative optimization is continued. The process is repeated until convergence. The disadvantages of this method are low computational efficiency and poor convergence. Therefore, the key problem restricting the calculation efficiency of RBDO is how to obtain the structural reliability index quickly and accurately.
Therefore, as shown in Figure 6, this paper proposes a surrogate-assisted RBDO, which used a GRNN-based surrogate model to replace the complex nonlinear calculation of traditional finite element analysis and reliability analysis. On this basis, NSGA-II [37] was adopted to further improve the optimization speed and obtain the Pareto optimal sets. The detailed steps are as follows:
Step 1: The objective functions, constraint functions, and design variables are determined according to the construction status and sensitivity analysis results;
Step 2: The optimization interval of design variables [X0 − λ|X0|, X0 + λ|X0|] (0 ≤ λ ≤ 0.5) is initialized based on considering the updated structural parameters, and the design values X0 are chosen as the center;
Step 3: The optimization interval of the design variables is sampled uniformly using the Latin hypercube sampling technique (LHST) [38], and the corresponding sample data for the objective functions and constraint functions are produced using the FEM and reliability analysis.
Step 4: The explicit functional relation between input side samples and output side samples is generated by the GRNN. The reliability optimization model is established when the GRNN models meet the accuracy requirements.
Step 5: The multiobjective optimization problem is solved by NSGA-II with respect to the design variables defined in step (2).
Step 6: The optimization results are output when they fall into the optimization interval and satisfy the discrimination condition; otherwise, steps (2–6) are iterated using the results as a new optimization interval center.

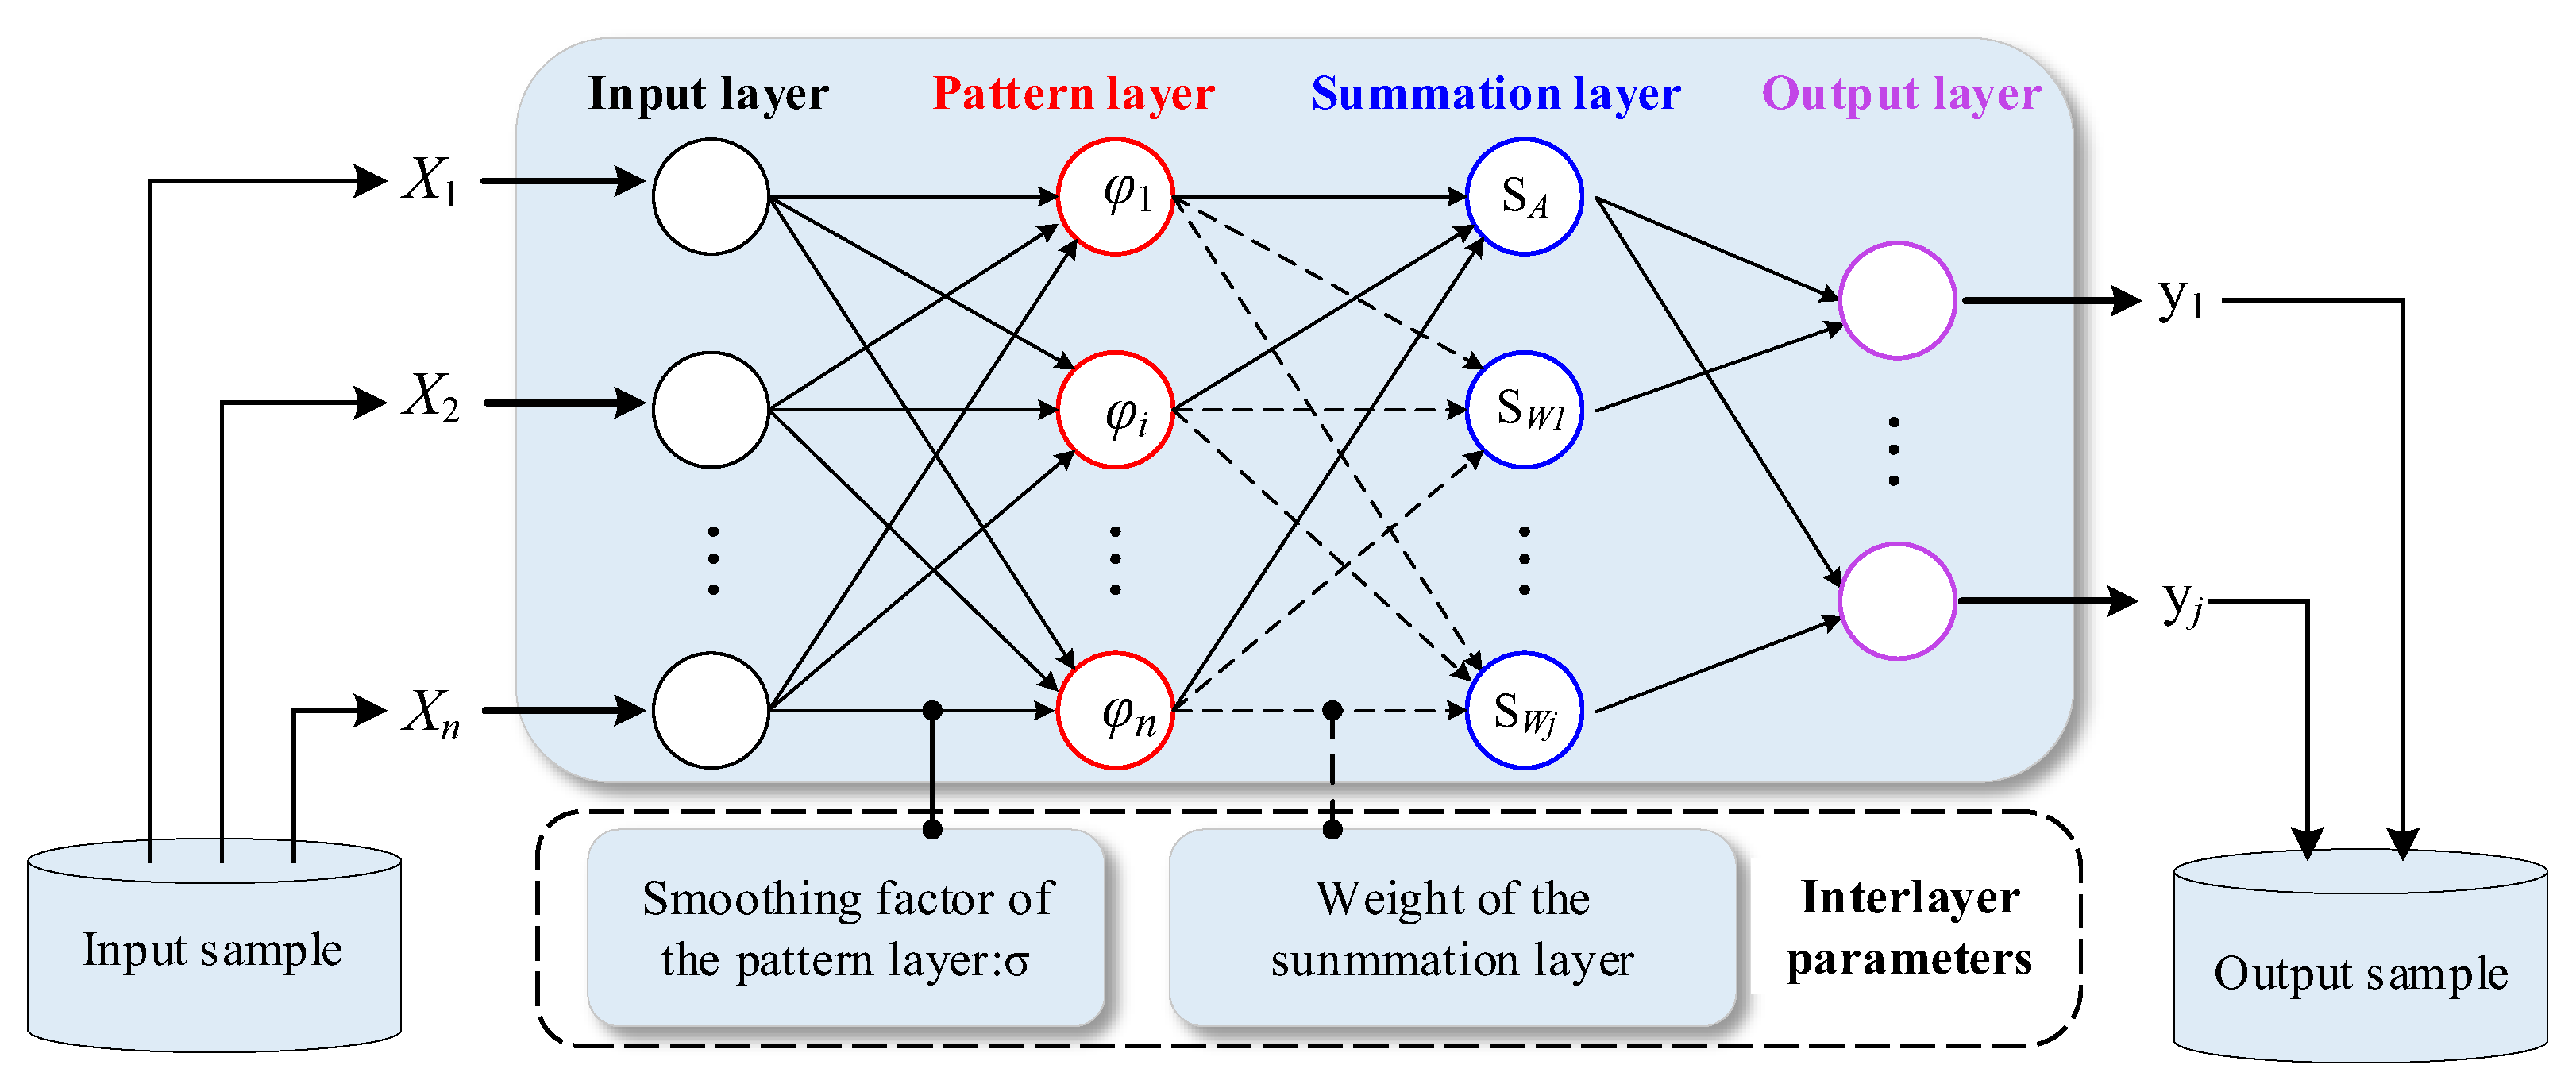
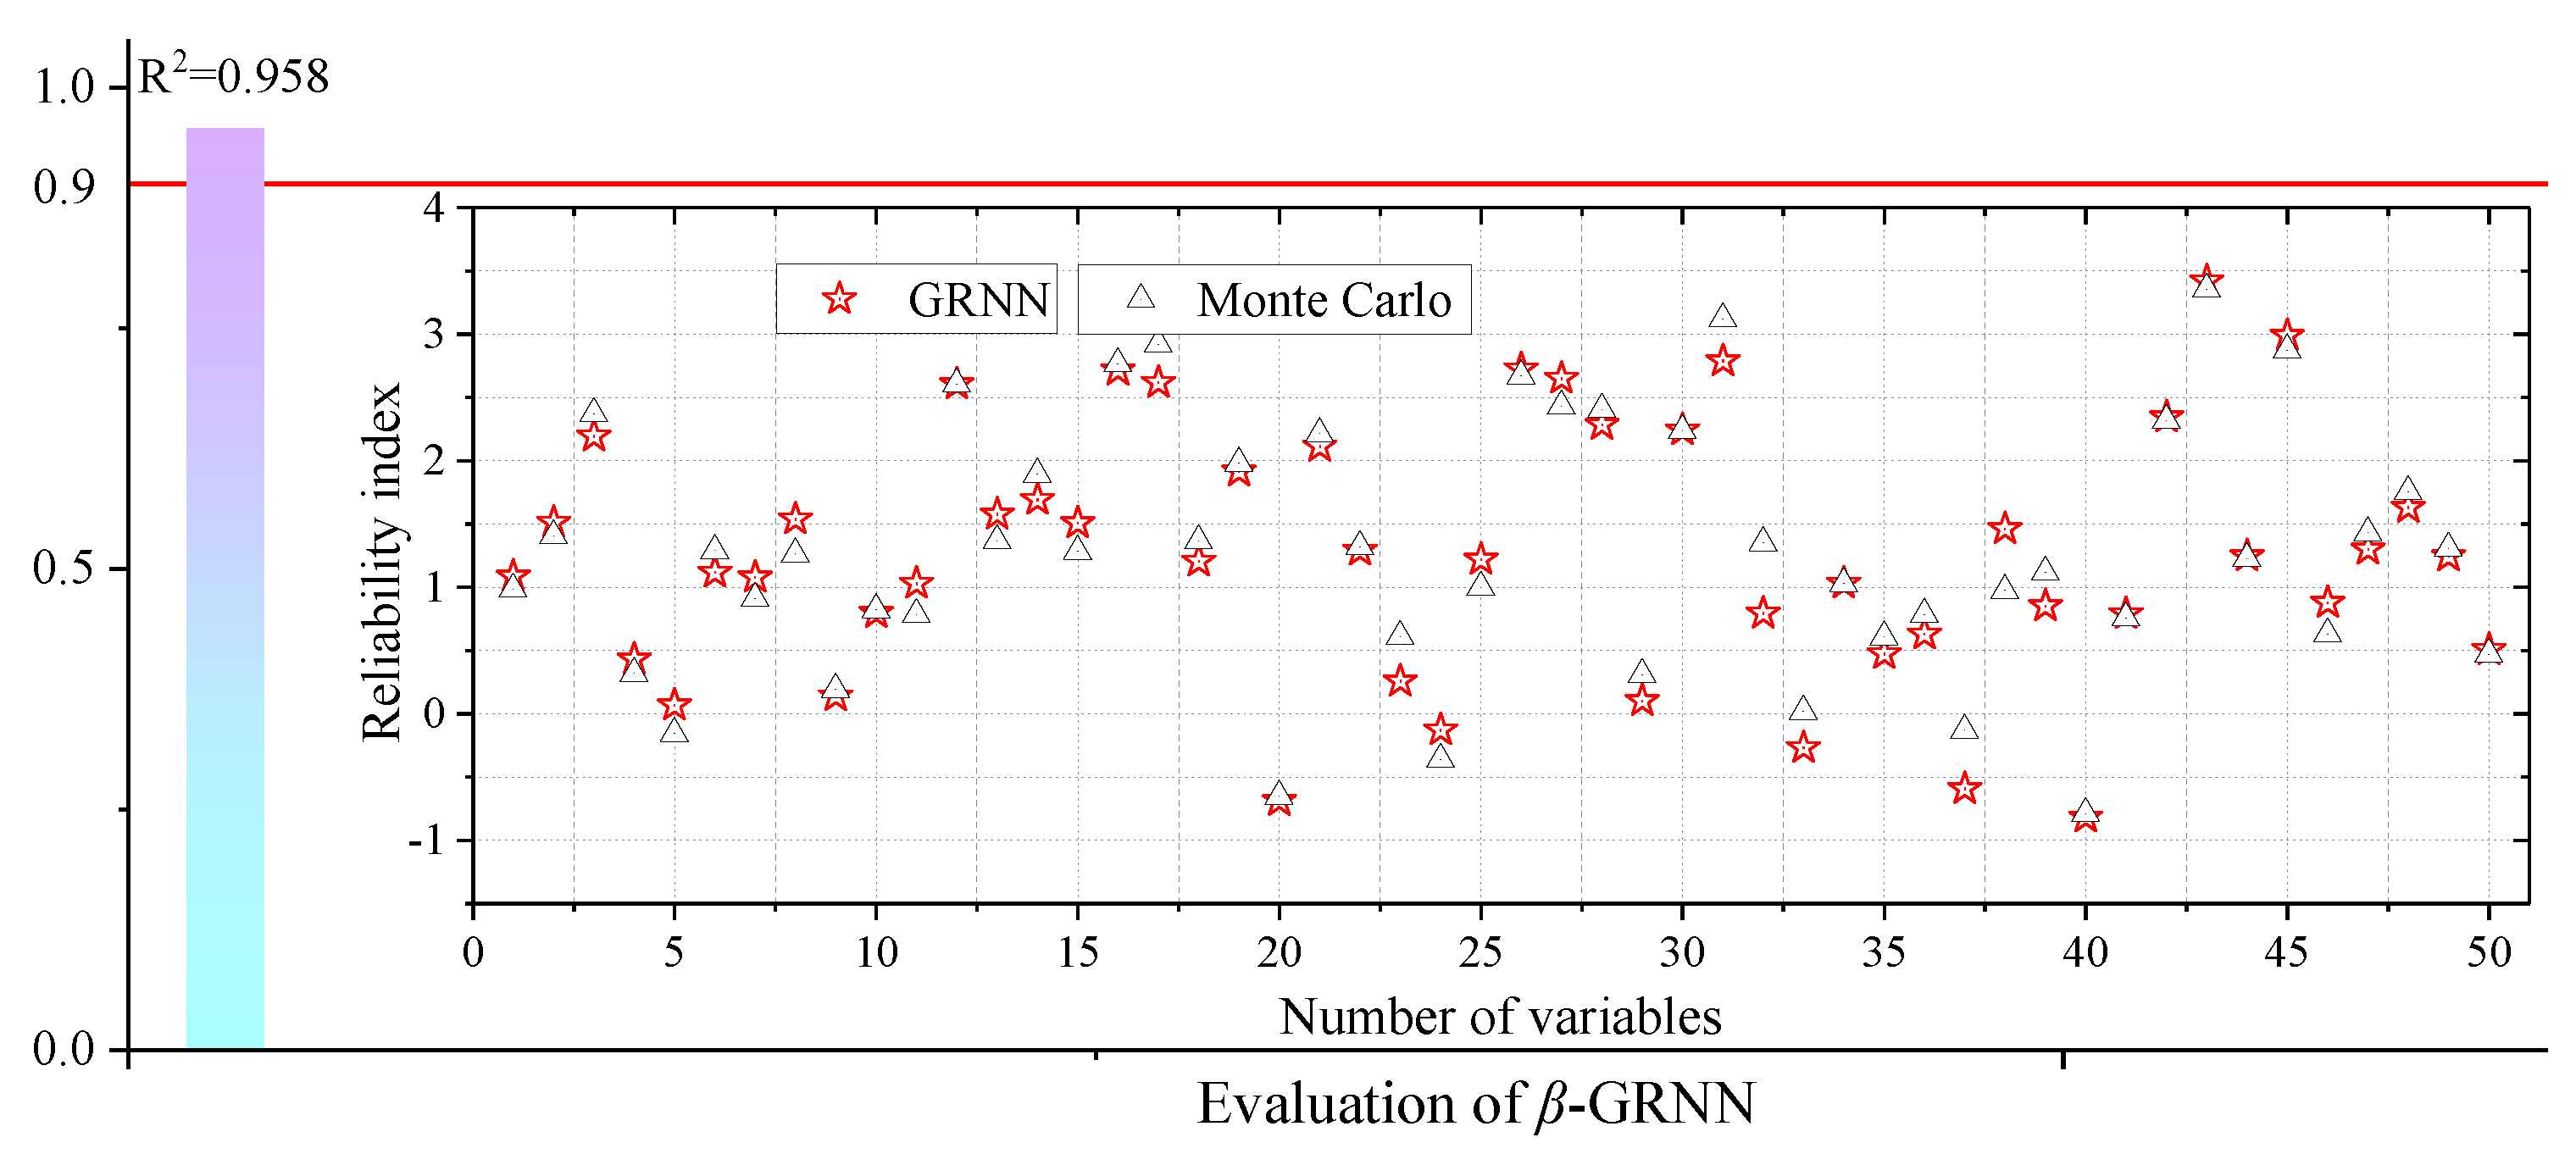
4.2. GRNN-Based Surrogate Model Generation

GRNN is a deformation form of the radial basis function (RBF) neural network designed for regression and function approximation [39]. GRNN takes the sample data as the posterior probability to perform Parzen nonparametric estimation and computes the network output according to the maximum probability. It approximates any mapping function between input and output vectors, extracting the function estimate directly from the training samples. In contrast to the RBF neural network, the GRNN performs better in terms of nonlinear approximation, quick learning, fault tolerance, and robustness, even in the case of insufficient samples [40]. Additionally, the GRNN does not require an initial artificial assignment of the network parameters, which minimizes the impact of human subjective assumptions on the prediction results. Similar to the RBF neural network, the GRNN has four layers: an input layer, a pattern layer, a summation layer, and an output layer. The specific process of building the GRNN model is shown in Figure 7, which is described in detail as follows:
(1) In the input layer, the training input and output samples are obtained through the finite element model in Section 5.1. The input layer receives information and stores an input vector Xi, and the number of input units equals the dimension of the input vector in the training samples. Then, the neurons of the input layer directly transfer the input data to the pattern layer.
(2) In the pattern layer, the number of neurons consists of an exactly equal number of input training datasets. The pattern Gaussian function of ϕ i is expressed in Formula (11).
ϕ i = exp D i 2 2 σ 2 ( i = 1 ,   2 , ,   n ) D i 2 = ( X X i ) T ( X X i )
where the output of neuron i is the exponential square of Di, Di is the Euclidean distance between X and Xi, X is the input variable of the network, Xi is the specific training sample of neuron i in the pattern layer, and σ is the smoothing parameter.
(3) The neurons in the summation layer consist of arithmetic summation (SA) neurons and weighted summation (SW) neurons. SA is one of the neurons in the summation layer, which makes an arithmetic summation of the output of all the pattern layer neurons. SWj is the other k neuron in the summation layer, which makes a weighted summation of the output of all the pattern layer neurons. The output vector can be calculated by Formula (12), where yij is the connection weight between the ith neuron in the pattern layer and the jth neuron in the summation layer.
S A = i = 1 n ϕ i S W j = i = 1 n y i j ϕ i ( j = 1 ,   2 , ,   k )
(4) After the summations of the summation layer neurons are transferred into the output layer, the output results yj of the output neuron can be calculated by Formula (13).
y j = S W j S A ( j = 1 ,   2 , ,   k )
Particularly, the value of the smoothing factor σ has a great influence on the prediction accuracy and the generalization ability of the GRNN model. In this paper, the optimal smoothing factor with a minimum cross-validation error was determined using a one-dimensional optimization method.

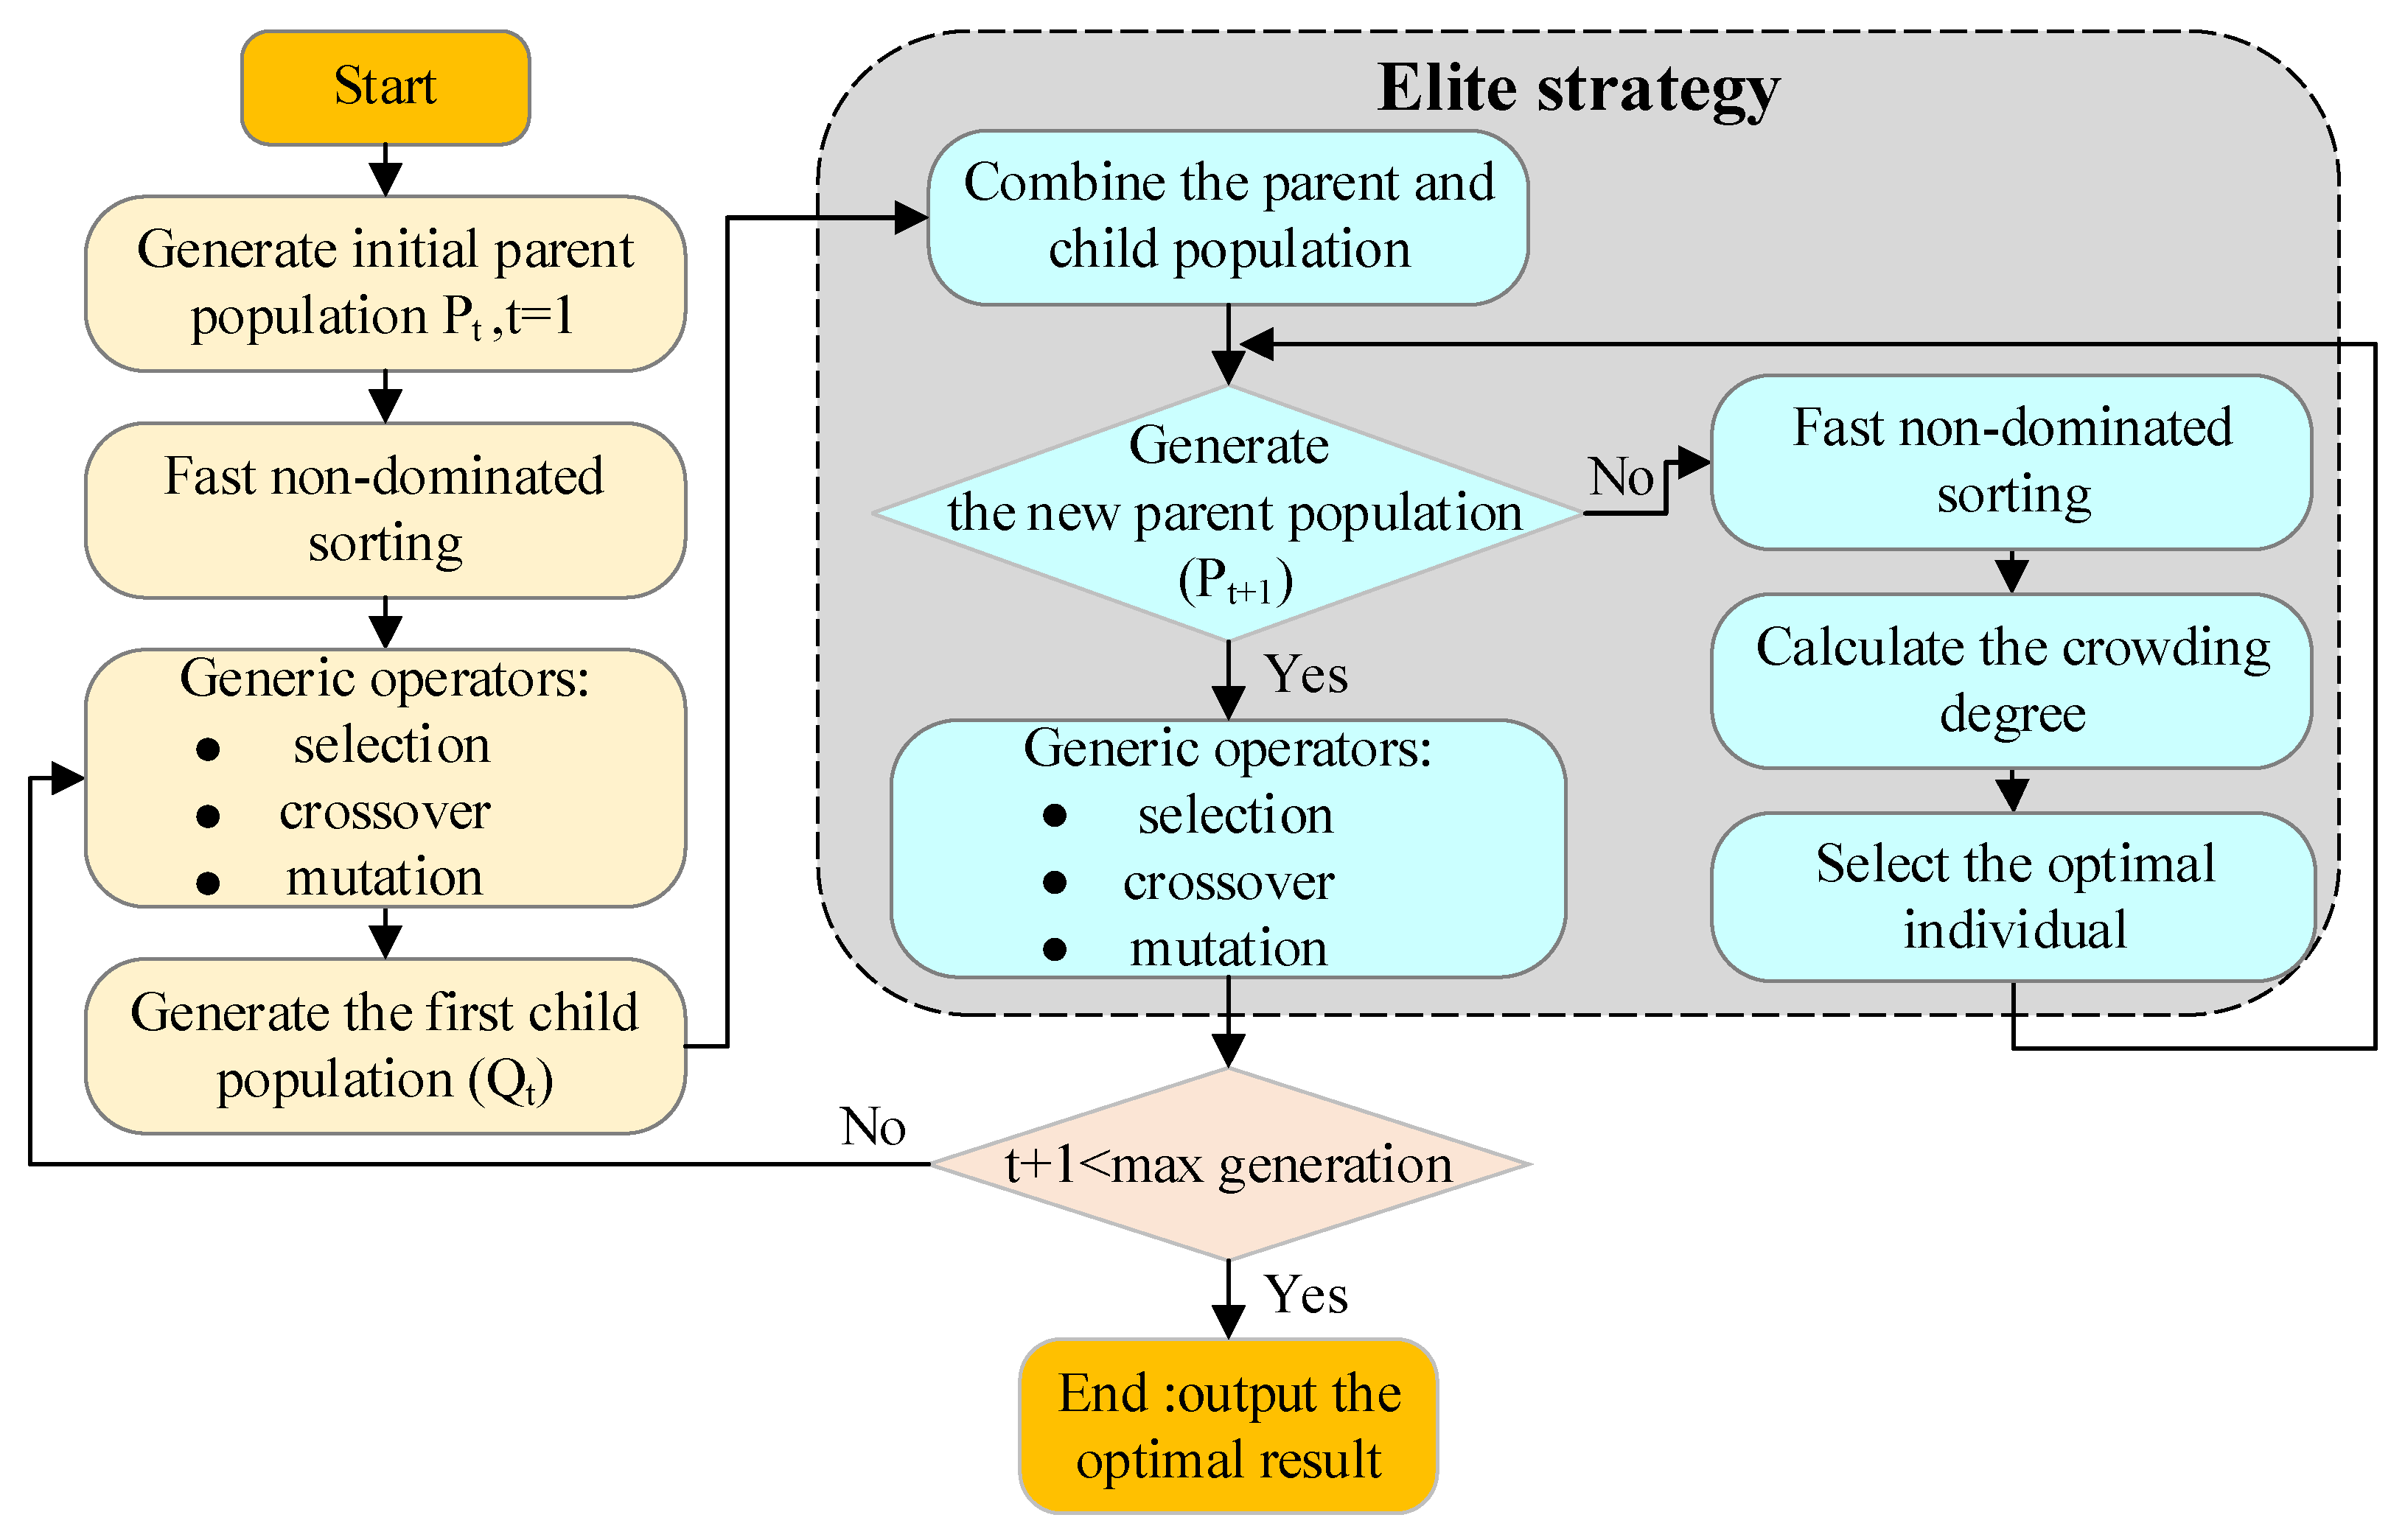
4.3. NSGA-II-Based Optimization

NSGA-II is one of the most effective multiobjective optimization methods [37]. Compared with NSGA, NSGA-II has three advantages: ① a new fast nondominated sorting algorithm is proposed based on classification, which reduces the computational complexity from O(mN3) to O(mN2); ② the concept of crowding degree is proposed, which replaces the fitness sharing strategy that needs to specify the sharing radius by the crowding distance comparison operator; and ③ features of the elitist strategy are also incorporated to effectively prevent the loss of the best individual. In summary, the Pareto front obtained by NSGA-II is uniformly distributed in the target space, which further improves the arithmetic speed and robustness. As shown in Figure 8, the NSGA-II procedure is as follows:
Step 1: Generate an initial population Pt of size N randomly.
Step 2: Rank the initial population Pt by nondominated sorting and generate the first child population Qt by the generic operators (selection, crossover, and mutation).
Step 3: Combine the parent and child populations to create a population Rt of size 2N after the first generation.
Step 4: Rank Rt by nondominated sorting and layer the sorted Rt. At the same time, calculate the crowding distance of individuals in each critical layer.
Step 5: Select the suitable individuals from the critical layer by nondominated relations and crowding distance until the number of individuals in the new generation Pt+1 population is N.
Step 6: Generate the new child population Qt+1 by the generic operators (selection, crossover, and mutation).
Step 7: Repeat steps 3 to 6 until the conditions are satisfied.

5. Engineering Application

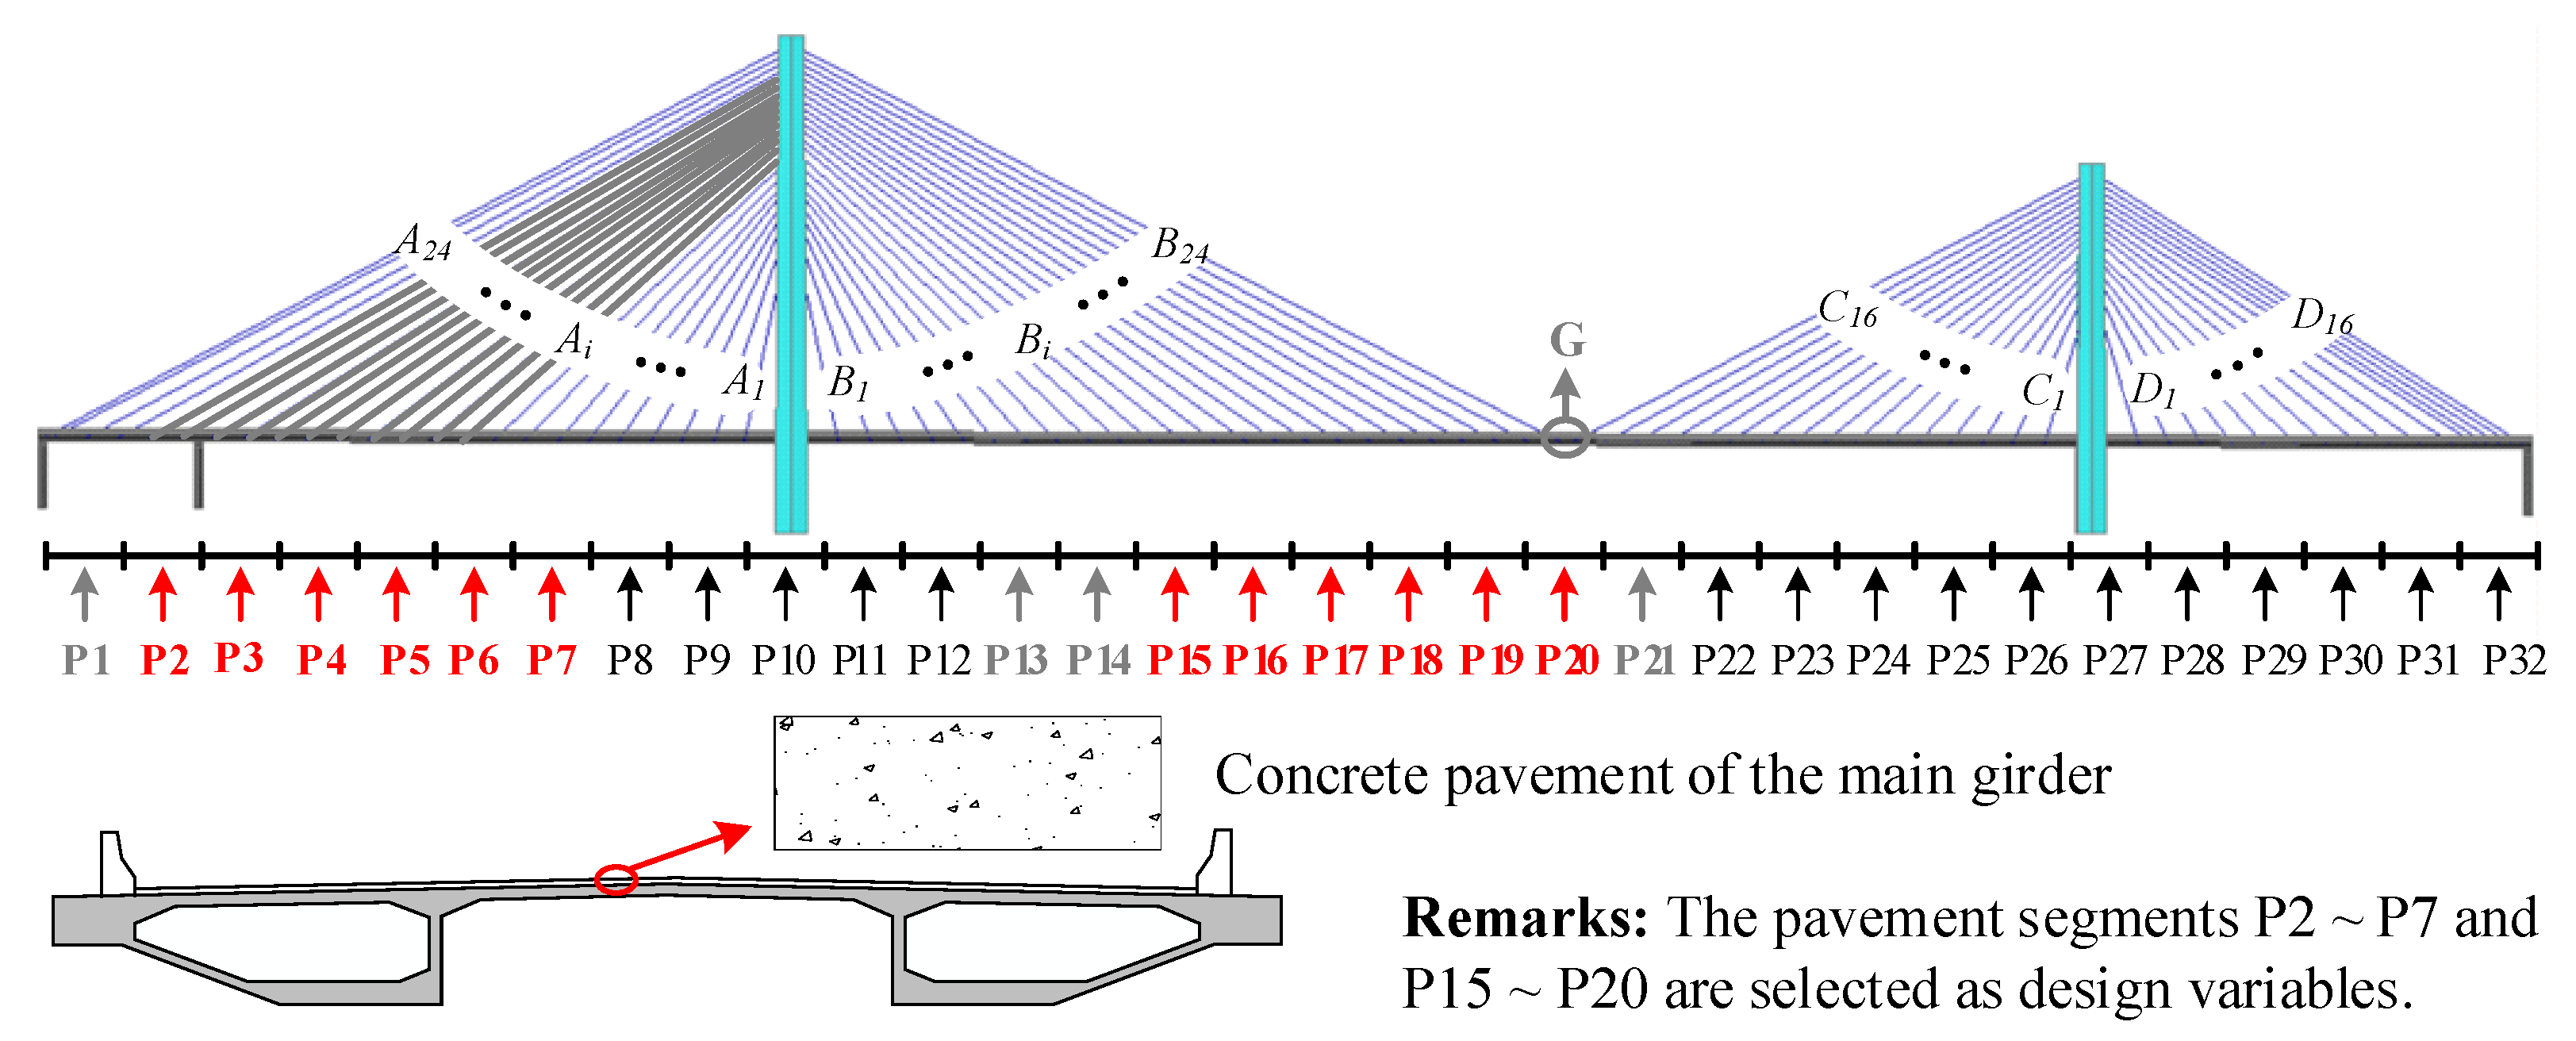
5.1. Engineering Description

The Yongjiang Bridge (as shown in Figure 9a) is a three-span concrete cable-stayed bridge with pylons of unequal height. The span layout is 193 m + 332 m + 113 m, and the deck width is 31 m. The structural characteristics are as follows: ① the concrete girder is constructed by the cantilever casting method; ② the bridge has 80 pairs of stay cables with a longitudinal standard spacing of 8 m; and ③ the H-shaped frame structure is adopted for the pylons. The refined finite element model was established by ANSYS, in which nonlinear effects, such as the large displacement and sag effect of the structure, were considered. Among them, 1032 spatial beam elements were used to simulate the pylon-girder system, and 160 spatial elastic catenary cable elements were used to simulate the stay cable system. The main modeling information is depicted in Figure 9b, and the origin of the coordinate system is arranged on the road centerline.

5.2. Negative Reaction Risk Assessment under the Live Load
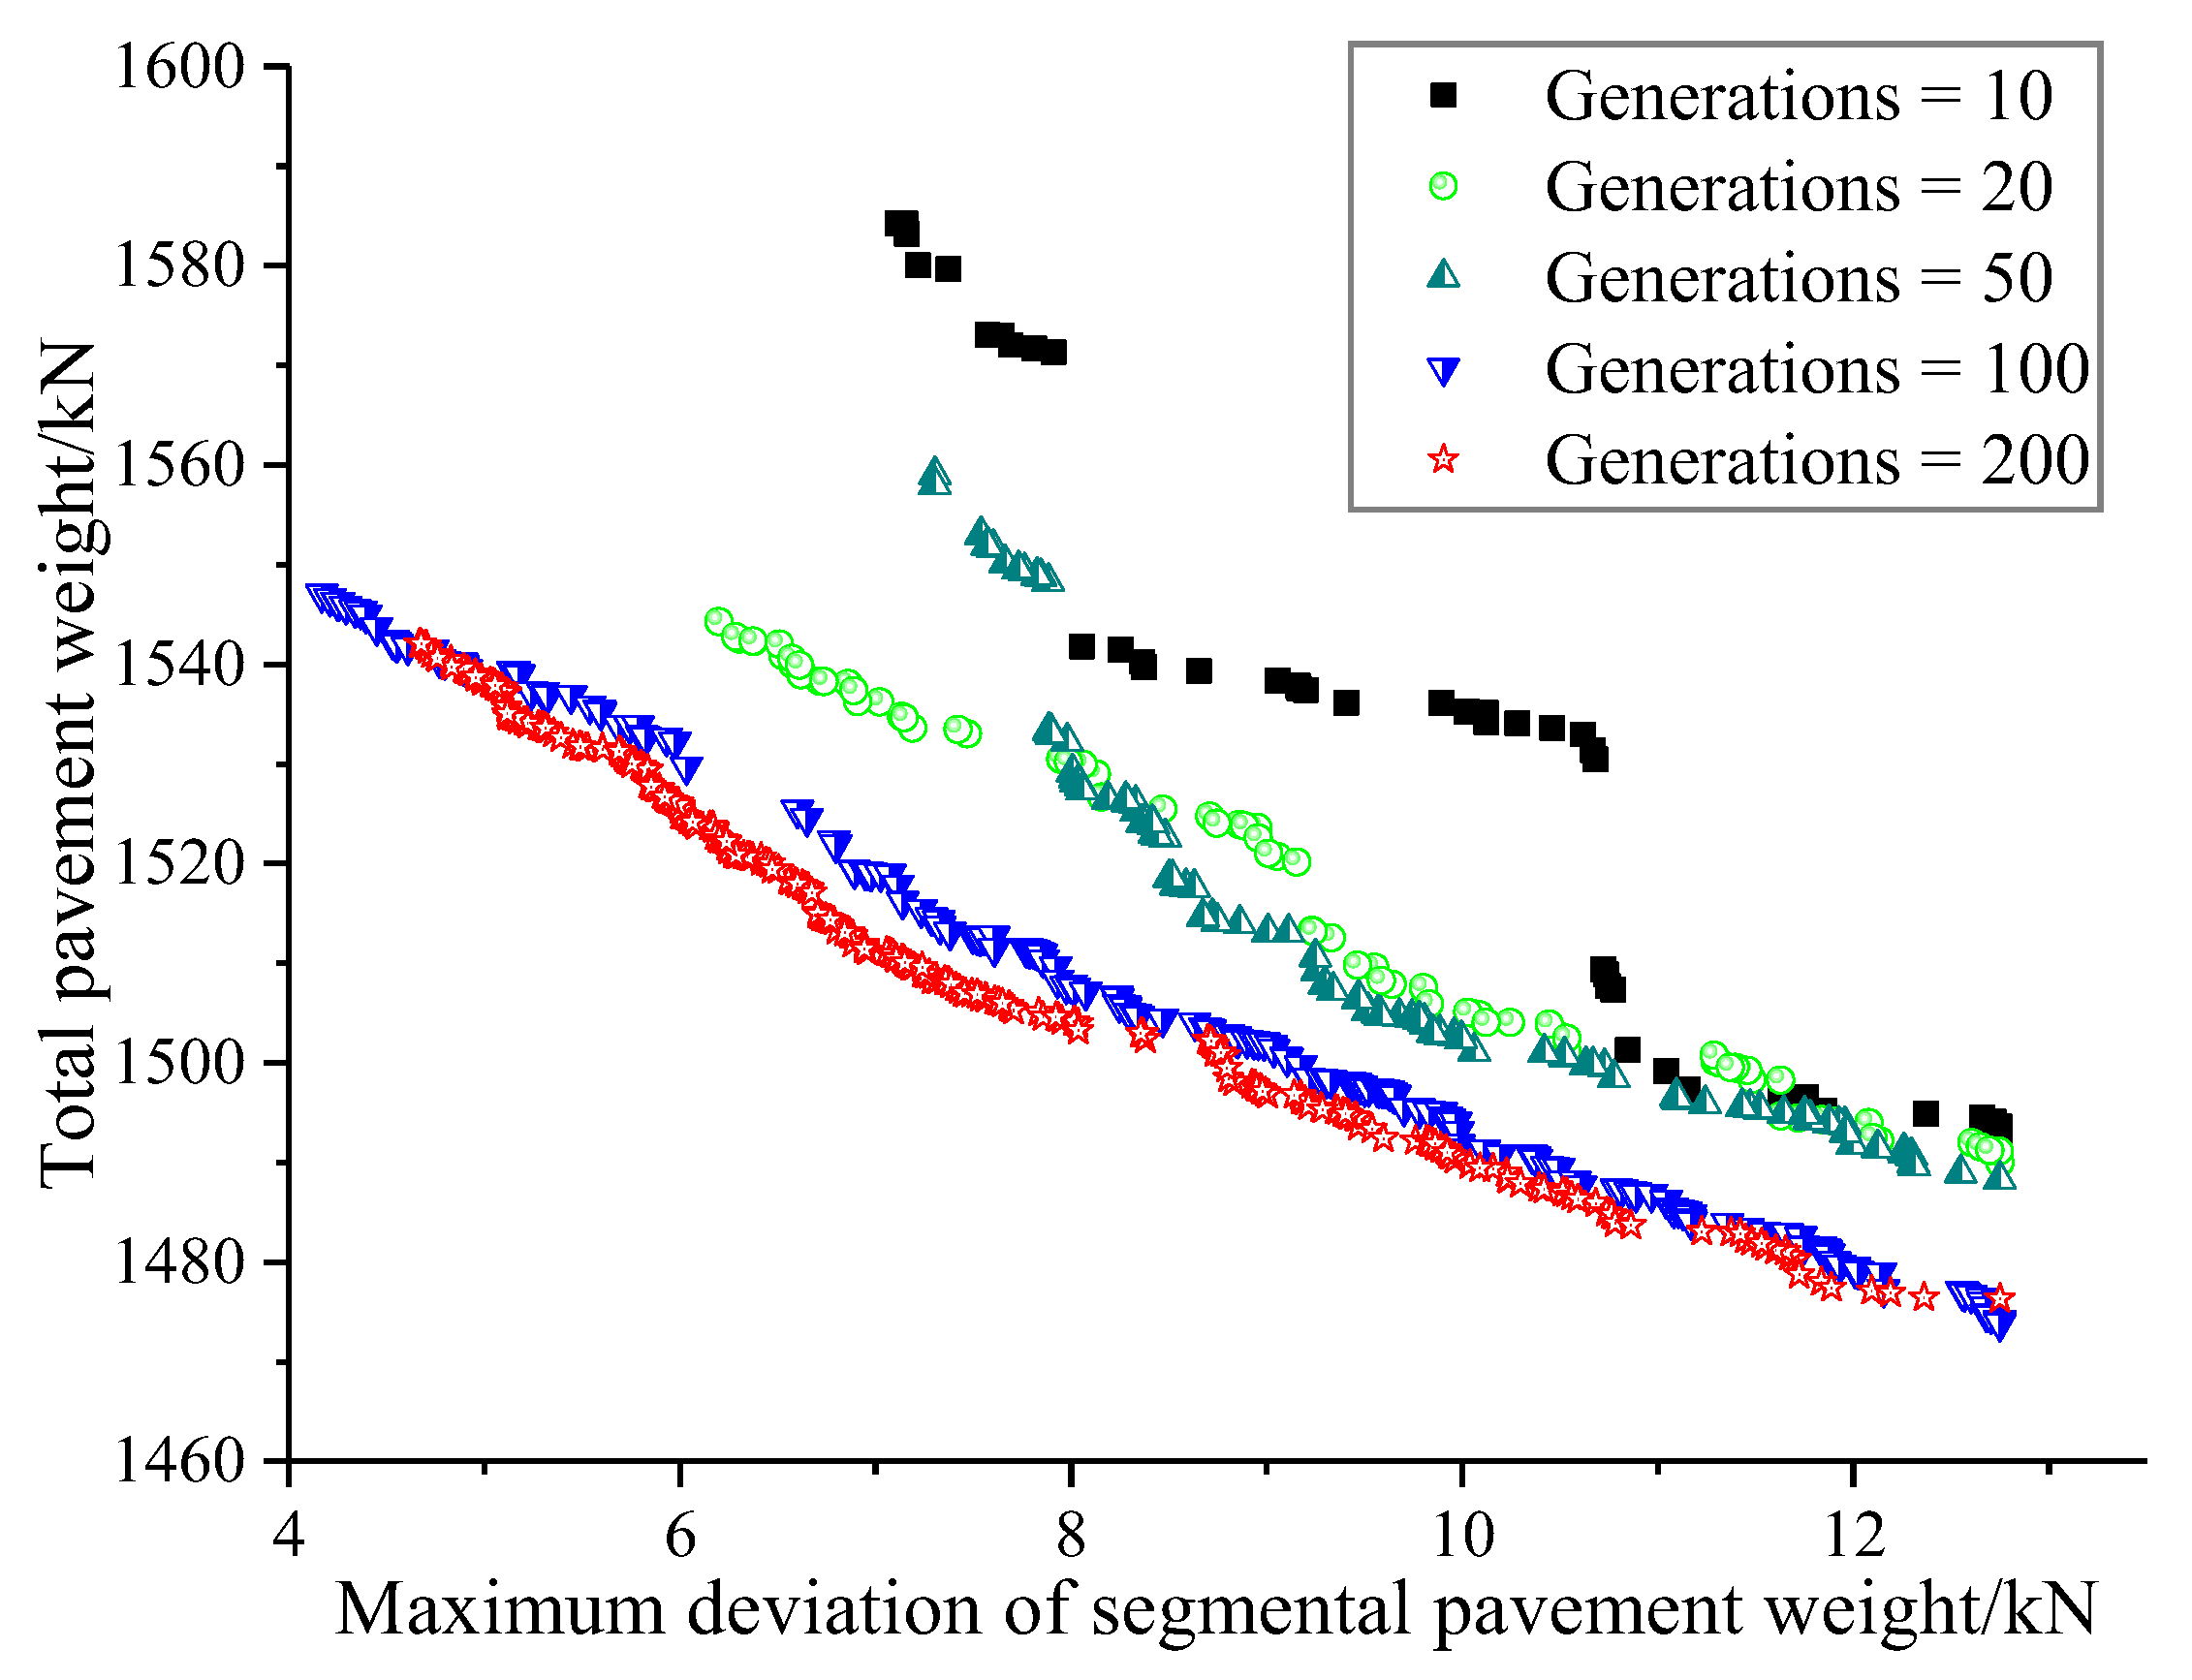
Due to errors in the manufacturing and construction processes, the material properties, tension properties, and structural geometric parameters may be affected by uncertainties. Hence, these parameters are supposed to be treated as random variables rather than deterministic variables. The random variables for the Yongjiang Bridge are listed in Table A1, including the tension errors of stay cables A1~A24, B1~B24, C1~C16, and D1~D16 and the weight errors of pavements P1~P32 and concrete girder G. In this study, all the random variables were assumed to be independent of each other to simplify the reliability and sensitivity analyses. The sensitivity analysis results are presented in Figure 10.
As shown in Figure 10, the weight error of concrete girder G is the most significant factor affecting the RAP. Among the weight errors of the pavements, those of P2~P7 and P15~P20 have the greatest impact on the RAP, followed by those of P1, P13, P14, and P21, and the others have little impact on the RAP. Stay cables A10~A20 have significant impacts on the RAP, and the other stay cables have minimal influence on the RAP. Therefore, the weight error of the concrete girder G, the tension errors of stay cables A10~A20, and the weight errors of pavements P1~P7 and P13~P21 were treated as random variables to assess the NRRAP under the live load.
According to the procedure proposed in Figure 6, 500 groups of input side samples were obtained by LHST [41], and the corresponding output side samples were obtained through finite element analysis and reliability analysis. The input and output side samples were trained by the GRNN to obtain the objective function and reliability constraint function. The goodness-of-fit R2 was used to evaluate the prediction accuracy of the GRNN surrogate model (R2 approaching 1.0 indicates a higher fitting accuracy). The GRNN surrogate model of RAP R0 was validated by FEM. As shown in Figure 11, the R2 value of R0 is 0.9897. The Monte Carlo method based on FEM was employed to validate the GRNN surrogate model of the reliability index β, with a sample size of 5000. As shown in Figure 12, the R2 value of β is 0.958. The above results show that the prediction accuracy of the GRNN model is sufficient for engineering applications.
It is necessary to assess the NRRAP under the live load because of the increased negative reaction risk described in Section 2.2. The assessment results are shown in Figure 13. The RAP under the dead load at the design stage is 1059 kN. Considering the live load and parameter uncertainty, the reliability of the auxiliary pier is 2.605, and the failure probability is 0.67%. At the operation stage, the RAP under the dead load is 256 kN. Considering the live load and parameter uncertainty, the reliability of the auxiliary pier is 0.785, and the failure probability is 18.33%.
The above results show that: ① the auxiliary pier bearing has a large reserve of reaction force and a low probability of failure at the design stage. ② However, due to the increased negative reaction risk, the auxiliary pier bearing has a higher failure probability under the live load at the operation stage, although the RAP under the dead load is still positive.

5.3. RBDO for C4

As shown in Figure 10, the NRRAP can be effectively reduced by adjusting the cable tension and the dead weight of the concrete girder and pavement. However, the NRRAP is caused by the forced closure of the concrete girder in actual engineering, and the concrete girder is closed while the pavement has not been constructed. As described in Section 2.2, it is infeasible to adjust the self-weight of the concrete girder, construct the girder counterweight, or optimize the cable tension in this case. Therefore, as shown in Figure 14, pavement segments P2~P7 and P15~P20 were selected as design variables Xopt, while the others were treated as random variables U.
The pavement optimization problem was formulated with the objectives of driving comfort and minimum construction cost. In addition, the reliability constraint for the RAP was implemented in the optimization model. The optimization model was established as follows:
f i n d X o p t = P 2 , P 3 P 7 , P 15 , P 16 P 20 T obj . f 1 o b j X o p t = min max P i P 0 f 2 o b j X o p t = min P i i = 2 , 3 7 , 15 , 16 20   s . t . f c o n X o p t ,   U = β G X opt ,   U 2.5 P i = 510 p i + 76.5 ; 0.075 m < p i < 0.125 m
where Xopt refers to the design variables, and U refers to the random variables. P0 and Pi refer to the pavement load before and after optimization, respectively. pi refers to the thickness of the concrete pavement of each section after optimization, and the specification requires that the maximum deviation between pi and the design value should not exceed 0.025 m [42,43]. β is the reliability index of the RAP under the live load. NSGA-II was used to solve the multiobjective optimization problem, and the Pareto-optimal sets are as follows:
During the evolution of NSGA-II, the Pareto front will continue to approach the optimal Pareto front. As shown in Figure 15, the Pareto frontier trend of the 10th, 20th, 50th, and 100th generations of adjacent algebraic populations fluctuates greatly but has a close trend. The trend of the Pareto front of the 100th generation is completely consistent with that of the 200th generation, and the difference is small. Therefore, it can be approximately considered that the Pareto front of the 200th generation is the optimal Pareto front.

5.4. Feasibility Verification for the Optimization Scheme

As shown in Figure 16a, the optimal Pareto set clearly describes the negative correlation between the total weight of the bridge deck pavement and driving comfort. A randomly selected optimization scheme A was evaluated using C1~C3 to verify its feasibility.
As shown in Figure 16b, the total weight of the pavement load in scheme A is 1.48307 × 10³ kN, and the maximum difference between the optimized design variables is 11.225 kN. According to Formula (14), the maximum difference of the deck pavement thickness is 0.022 m, which meets the maximum limit (0.025 m) of the specification. The smoothing treatment of the pavement is completed within 4 m to improve the driving comfort.
The mechanical performance of the concrete girder is shown in Figure 17. As shown in Figure 17a, the maximum vertical deviations of the midspan before and after optimization are 12.30 cm and 9.81 cm, respectively. As shown in Figure 17b, the maximum positive bending moments of the concrete girder before and after optimization are 2.183 × 10⁴ kN·m and 1.702 × 10⁴ kN·m, respectively. The maximum negative bending moments of the concrete girder before and after optimization are −4.375 × 10⁴ kN·m and −4.251 × 10⁴ kN·m, respectively. Hence, scheme A can slightly improve the mechanical performance of the concrete girder.
As shown in Figure 18, the bending moment and longitudinal displacement of the pylon are almost unchanged after optimization, which means that scheme A hardly changes the mechanical performance of the pylon. As shown in Figure 19, the maximum deviation of the cable tension before and after optimization does not exceed 1%, which further indicates that the mechanical performance of the structure is not changed. Hence, scheme A is feasible to control the NRRAP under the live load.

6. Conclusions

This paper presents a three-step pavement optimization strategy (TPOS) to control the NRRAP of cable-stayed bridges by adjusting the pavement thickness. In addition, the pavement optimization strategy is formulated as a reliability-constrained, multiobjective optimization problem.
To address the computing challenges of the multiobjective optimization problem with reliability constraints, the TPOS utilizes the GRNN as a surrogate solution and the NSGA-II as an optimized engine. The integration of GRNN-assisted sensitivity and reliability analysis can considerably shorten the calculation times without compromising accuracy. In addition, the optimal Pareto set obtained from the NSGA-II can provide multiple solutions for decision-makers based on their focus. The case study of the Yongjiang Bridge demonstrates that the TPOS can effectively control the NRRAP under the increased negative reaction risk and multiple control criteria.

Author Contributions

Conceptualization, Y.B., X.W. (Xiaoming Wang) and W.W.; Methodology, Y.B. and H.W.; Software, Y.B. and H.W.; Validation, Y.B., X.W. (Xudong Wang), H.W. and N.F.C.T.; Formal analysis, Y.B. and X.W. (Xudong Wang); Investigation, Y.B., X.W. (Xudong Wang) and W.W.; Resources, X.W. (Xiaoming Wang); Data curation, Y.B.; Writing—original draft, Y.B.; Writing—review & editing, Y.B., X.W. (Xiaoming Wang), X.W. (Xudong Wang) and N.F.C.T.; Visualization, Y.B.; Supervision, X.W. (Xiaoming Wang); Project administration, X.W. (Xiaoming Wang); Funding acquisition, X.W. (Xiaoming Wang). All authors have read and agreed to the published version of the manuscript.

Funding

This work is supported by the National Natural Science Foundation of China [Grant No. 52178104] and the Fundamental Research Funds for the Central Universities, CHD [Grant No. 300102212905].

Institutional Review Board Statement

Not applicable.

Informed Consent Statement

Not applicable.

Data Availability Statement

Not applicable.

Conflicts of Interest

The authors declare no conflict of interest.

Nomenclature

RBDOreliability-based design optimization
FORMfirst-order reliability method
GRNNgeneralized regression neural network
NSGA-IInondominated sorting genetic algorithm
LHSTLatin hypercube sampling technique
TPOSthree-step pavement optimization strategy
FEMfinite element model
OSSobjective service stage
NRRAPnegative reaction risk of the auxiliary pier
RAPreaction of auxiliary pier

Appendix A. Characteristics of the Random Variables

Table A1. Characters of the random variables of Yongjiang Bridge.
VariableDesign StageConstruction StageDB
MeanSDMeanSD
A24/kN5926.70098.7785926.160197.539N
A23/kN5939.70098.9955956.560198.552N
A22/kN5928.90098.8155959.500198.650N
A21/kN5866.00097.7675905.560196.852N
A20/kN5681.90094.6985729.040190.968N
A19/kN5500.80091.6805549.580184.986N
A18/kN5334.10088.9025375.020179.167N
A17/kN4863.90081.0654893.520163.117N
A16/kN4817.70080.2954810.160160.339N
A15/kN4810.80080.1804783.680159.456N
A14/kN4795.80079.9304749.360158.312N
A13/kN4741.30079.0224677.770155.926N
A12/kN4692.10078.2024615.010153.834N
A11/kN4602.70076.7124513.020150.434N
A10/kN4527.60075.4604431.630147.721N
A9/kN4336.60072.2774242.360141.412N
A8/kN4194.60069.9104105.060136.835N
A7/kN4003.20066.7203918.740130.625N
A6/kN3776.90062.9483703.970123.466N
A5/kN3508.30058.4723457.820115.261N
A4/kN3122.30052.0383098.900103.297N
A3/kN2775.10046.2522797.84093.261N
A2/kN2415.90040.2652501.68083.389N
A1/kN2893.80048.2303037.120101.237N
B1/kN2953.90049.2323045.950101.532N
B2/kN2450.60040.8432490.89083.030N
B3/kN2777.30046.2882766.46092.215N
B4/kN3094.30051.5723050.850101.695N
B5/kN3445.70057.4283384.270112.809N
B6/kN3705.10061.7523631.400121.047N
B7/kN3943.40065.7233861.860128.729N
B8/kN4251.00070.8504159.000138.633N
B9/kN4442.20074.0374346.310144.877N
B10/kN4629.30077.1554525.770150.859N
B11/kN4811.70080.1954697.390156.580N
B12/kN5207.20086.7875066.120168.871N
B13/kN5361.70089.3625205.370173.512N
B14/kN5513.10091.8855348.550178.285N
B15/kN5598.40093.3075433.860181.129N
B16/kN5647.10094.1185492.700183.090N
B17/kN5688.70094.8125550.560185.019N
B18/kN5678.60094.6435567.240185.575N
B19/kN5618.20093.6375542.720184.757N
B20/kN5564.10092.7355532.910184.430N
B21/kN5463.80091.0635484.860182.829N
B22/kN5341.40089.0235424.060180.802N
B23/kN5206.30086.7725355.410178.514N
B24/kN5085.10084.7525301.470176.716N
C16/kN5447.60090.7935351.490178.383N
C15/kN5565.60092.7605433.860181.129N
C14/kN5629.00093.8175471.130182.371N
C13/kN5633.30093.8885461.320182.044N
C12/kN5638.90093.9825459.360181.979N
C11/kN5575.90092.9325394.640179.821N
C10/kN5531.40092.1905353.450178.448N
C9/kN5397.50089.9585225.960174.199N
C8/kN5001.70083.3624855.270161.842N
C7/kN4780.00079.6674649.330154.978N
C6/kN4528.10075.4684413.970147.132N
C5/kN4078.50067.9753995.230133.174N
C4/kN3743.90062.3983685.340122.845N
C3/kN3169.80052.8303144.990104.833N
C2/kN2723.70045.3952747.82091.594N
C1/kN3109.70051.8283183.240106.108N
D1/kN3088.20051.4703190.100106.337N
D2/kN2705.60045.0932745.86091.529N
D3/kN3136.90052.2823118.510103.950N
D4/kN3653.90060.8983601.000120.033N
D5/kN3919.00065.3173841.260128.042N
D6/kN4157.70069.2954077.610135.920N
D7/kN4290.40071.5074212.940140.431N
D8/kN4485.50074.7584419.860147.329N
D9/kN4592.00076.5334538.520151.284N
D10/kN4711.90078.5324663.060155.435N
D11/kN4777.60079.6274725.820157.527N
D12/kN5968.20099.4705926.160197.539N
D13/kN6076.500101.2755956.560198.552N
D14/kN6109.500101.8255959.500198.650N
D15/kN6104.000101.7335905.560196.852N
D16/kN6096.200101.6035729.040190.968N
P1~P32/kN/m127.5004.25127.5004.25N
G1.0000.0171.0000.017N
Note. DB = distribution type; N = normal; SD = standard deviation. The stay cable tension error is 2–8% according to the Specifications for Design of Highway Cable-stayed Bridge (JTG/T 3365-01-2020) [1], which is taken as 5% in the design stage. According to the updated parameters in the construction stage, the stay cable tension error is taken as 10%, and the weight error of the concrete girder and the unbalanced load error is taken as 5%.

References

  1. JTG/T 3365-01-2020; Specifications for Design of Highway Cable-Stayed Bridge. China Communications Press: Beijing, China, 2020.
  2. Liang, F.; Jia, Y.; Sun, L.; Xie, W.; Chen, H. Seismic response of pile groups supporting long-span cable-stayed bridge subjected to multi-support excitations. Soil Dyn. Earthq. Eng. 2017, 101, 182–203. [Google Scholar] [CrossRef]
  3. Guo, S.; Cui, D.; Ma, S. Auxiliary Piers on Long-Span Specially Shaped Mixed Steel Structure Main Tower Cable-Stayed Bridge: Research on the Impact on the Dynamic Performance. Adv. Mater. Sci. Eng. 2021, 2021, 1980387. [Google Scholar] [CrossRef]
  4. Zhang, J.; Zhang, M.; Jiang, X.; Yuan, R.; Yu, J.; Zhou, Y.; Qin, S. Causes and control to lateral displacement of the main girder in the super-long-span cable-stayed bridge with transverse asymmetry dead load. Structures 2022, 37, 168–184. [Google Scholar] [CrossRef]
  5. Lin, K.; Xu, Y.-L.; Lu, X.; Guan, Z.; Li, J. Digital twin-based collapse fragility assessment of a long-span cable-stayed bridge under strong earthquakes. Autom. Constr. 2021, 123, 103547. [Google Scholar] [CrossRef]
  6. Fabbrocino, F.; Modano, M.; Farina, I.; Carpentieri, G.; Fraternali, F. Optimal prestress design of composite cable-stayed bridges. Compos. Struct. 2017, 169, 167–172. [Google Scholar] [CrossRef]
  7. Wang, X.; Wu, W.; Liu, Y.; Ran, Z. Surrogate-assisted two-phase tensioning strategy optimization for the system transformation process of a cable-stayed bridge. Eng. Optim. 2019, 52, 603–619. [Google Scholar] [CrossRef]
  8. Wang, X.; Miao, C.; Wang, X. Prediction analysis of deflection in the construction of composite box-girder bridge with corrugated steel webs based on MEC-BP neural networks. Structures 2021, 32, 691–700. [Google Scholar] [CrossRef]
  9. Chen, T.-Y. An Interval-Valued Pythagorean Fuzzy Compromise Approach with Correlation-Based Closeness Indices for Multiple-Criteria Decision Analysis of Bridge Construction Methods. Complexity 2018, 2018, 6463039. [Google Scholar] [CrossRef]
  10. Yu, Y.; Cai, C.; He, W.; Peng, H. Prediction of bridge maximum load effects under growing traffic using non-stationary bayesian method. Eng. Struct. 2019, 185, 171–183. [Google Scholar] [CrossRef]
  11. Cao, H.; Chen, Y.; Yang, L.; Feng, L. Hanger pre-tensioning force optimization of steel tied-arch bridges considering operational loads. Struct. Multidiscip. Optim. 2020, 63, 867–880. [Google Scholar] [CrossRef]
  12. Martins, A.M.; Simões, L.M.; Negrão, J.H. Optimization of cable-stayed bridges: A literature survey. Adv. Eng. Softw. 2020, 149, 102829. [Google Scholar] [CrossRef]
  13. Wang, Z.; Zhang, N.; Cheng, Q. Multi-objective optimization-based reasonable finished state in long-span cable-stayed bridge considering counterweights. Structures 2023, 51, 1497–1506. [Google Scholar] [CrossRef]
  14. Zhang, Y.T.; Li, X.; You, X.P. Construction Technology of Jiu-Jiang Yangtze River Highway Bridge. Appl. Mech. Mater. 2014, 501–504, 1274–1278. [Google Scholar] [CrossRef]
  15. Wang, R.; Zhang, Z.; Dong, C.; Huang, Y. Fast Algorithm and Its Application in Construction Monitoring of Parallel Strand Cables. J. Bridg. Eng. 2015, 20, 04014100. [Google Scholar] [CrossRef]
  16. Song, C.; Xiao, R.; Sun, B. Optimization of cable pre-tension forces in long-span cable-stayed bridges considering the counterweight. Eng. Struct. 2018, 172, 919–928. [Google Scholar] [CrossRef]
  17. Farré-Checa, J.; Komarizadehasl, S.; Ma, H.; Lozano-Galant, J.; Turmo, J. Direct simulation of the tensioning process of cable-stayed bridge cantilever construction. Autom. Constr. 2022, 137, 104197. [Google Scholar] [CrossRef]
  18. Li, Z.; Lu, D.; Gao, X. Optimization of mixture proportions by statistical experimental design using response surface method—A review. J. Build. Eng. 2020, 36, 102101. [Google Scholar] [CrossRef]
  19. Yu, H.; Zhou, X.; Zhang, X.; Mooney, M. Enhancing earth pressure balance tunnel boring machine performance with support vector regression and particle swarm optimization. Autom. Constr. 2022, 142, 104457. [Google Scholar] [CrossRef]
  20. Falcone, R.; Ciaramella, A.; Carrabs, F.; Strisciuglio, N.; Martinelli, E. Artificial neural network for technical feasibility prediction of seismic retrofitting in existing RC structures. Structures 2022, 41, 1220–1234. [Google Scholar] [CrossRef]
  21. Maschio, C.; Schiozer, D.J. A new optimization framework using genetic algorithm and artificial neural network to reduce uncertainties in petroleum reservoir models. Eng. Optim. 2014, 47, 72–86. [Google Scholar] [CrossRef]
  22. Li, X.; Zhu, H.; Chen, Z.; Ming, W.; Cao, Y.; He, W.; Ma, J. Limit state Kriging modeling for reliability-based design optimization through classification uncertainty quantification. Reliab. Eng. Syst. Saf. 2022, 224, 108539. [Google Scholar] [CrossRef]
  23. Keshtegar, B.; Mert, C.; Kisi, O. Comparison of four heuristic regression techniques in solar radiation modeling: Kriging method vs RSM, MARS and M5 model tree. Renew. Sustain. Energy Rev. 2018, 81, 330–341. [Google Scholar] [CrossRef]
  24. Chiang, Y.-C.; Borgart, A. A form-finding method for membrane shells with radial basis functions. Eng. Struct. 2021, 251, 113514. [Google Scholar] [CrossRef]
  25. Eghtedaei, R.; Abdi-Khanghah, M.; Najar, B.S.; Baghban, A. Viscosity estimation of mixed oil using RBF-ANN approach. Pet. Sci. Technol. 2017, 35, 1731–1736. [Google Scholar] [CrossRef]
  26. Xiang, Z.; Zhu, Z. Multi-objective optimization of a composite orthotropic bridge with RSM and NSGA-II algorithm. J. Constr. Steel Res. 2021, 188, 106938. [Google Scholar] [CrossRef]
  27. Wang, X.; Wang, H.; Sun, Y.; Liu, Y.; Liu, Y.; Liang, P.; Bai, Y. Fault-tolerant interval inversion for accelerated bridge construction based on geometric nonlinear redundancy of cable system. Autom. Constr. 2022, 134, 104093. [Google Scholar] [CrossRef]
  28. Bakhshinezhad, S.; Mohebbi, M. Multi-objective optimal design of semi-active fluid viscous dampers for nonlinear structures using NSGA-II. Structures 2020, 24, 678–689. [Google Scholar] [CrossRef]
  29. Deng, X.; Liu, M. Nonlinear Stability Analysis of a Composite Girder Cable-Stayed Bridge with Three Pylons during Construction. Math. Probl. Eng. 2015, 2015, 978514. [Google Scholar] [CrossRef] [Green Version]
  30. JTG 2120-2020; Unified Standard for Reliability Design of Highway Engineering Structures. China Communications Press: Beijing, China, 2020.
  31. Lu, N.; Ma, Y.; Liu, Y. Evaluating Probabilistic Traffic Load Effects on Large Bridges Using Long-Term Traffic Monitoring Data. Sensors 2019, 19, 5056. [Google Scholar] [CrossRef] [PubMed] [Green Version]
  32. Yuan, Y.; Han, W.; Xie, Q.; Li, G.; Xu, X. Time-dependent Reliability Assessment of Concrete Bridges Considering Non-stationary Vehicle Load and Resistance Deterioration Process. China J. Highw. Transp. 2020, 33, 85–96. [Google Scholar]
  33. Kriegesmann, B.; Lüdeker, J.K. Robust compliance topology optimization using the first-order second-moment method. Struct. Multidiscip. Optim. 2019, 60, 269–286. [Google Scholar] [CrossRef]
  34. Yang, J.; Zhang, Q.; Huang, Y. A new sensitivity factor for structural reliability. Eng. Mech. 2015, 30, 16–21. [Google Scholar]
  35. Ni, P.; Li, J.; Hao, H.; Zhou, H. Reliability based design optimization of bridges considering bridge-vehicle interaction by Kriging surrogate model. Eng. Struct. 2021, 246, 112989. [Google Scholar] [CrossRef]
  36. Kusano, I.; Baldomir, A.; Jurado, J.A.; Hernández, S. Reliability based design optimization of long-span bridges considering flutter. J. Wind. Eng. Ind. Aerodyn. 2014, 135, 149–162. [Google Scholar] [CrossRef]
  37. Verma, S.; Pant, M.; Snasel, V. A Comprehensive Review on NSGA-II for Multi-Objective Combinatorial Optimization Problems. IEEE Access 2021, 9, 57757–57791. [Google Scholar] [CrossRef]
  38. Shields, M.D.; Zhang, J. The generalization of Latin hypercube sampling. Reliab. Eng. Syst. Saf. 2016, 148, 96–108. [Google Scholar] [CrossRef] [Green Version]
  39. Sadeghi, F.; Yu, Y.; Zhu, X.; Li, J. Damage identification of steel-concrete composite beams based on modal strain energy changes through general regression neural network. Eng. Struct. 2021, 244, 112824. [Google Scholar] [CrossRef]
  40. Bendu, H.; Deepak, B.; Murugan, S. Multi-objective optimization of ethanol fuelled HCCI engine performance using hybrid GRNN–PSO. Appl. Energy 2017, 187, 601–611. [Google Scholar] [CrossRef]
  41. Masoomzadeh, M.; Basim, M.C.; Chenaghlou, M.R.; Khajehsaeid, H. Probabilistic performance assessment of eccentric braced frames using artificial neural networks combined with correlation latin hypercube sampling. Structures 2023, 48, 226–240. [Google Scholar] [CrossRef]
  42. JTG/T F30-2014; Technical Guidelines for Construction of Highway Cement Concrete Pavements. China Communications Press: Beijing, China, 2014.
  43. Yang, Y.; Liu, Z.; Tang, H.; Peng, J. Deflection-based failure probability analysis of low shrinkage-creep concrete structures in presence of non-stationary evolution of shrinkage and creep uncertainties. Constr. Build. Mater. 2023, 376, 131077. [Google Scholar] [CrossRef]
Figure 1. Stretching process of the parallel strand cable.
Applsci 13 04877 g001
Figure 2. Adjustable length of the parallel strand cable.
Applsci 13 04877 g002
Figure 3. NRRAP caused by forced closure.
Applsci 13 04877 g003
Figure 4. Traffic growth process based on AATGR.
Applsci 13 04877 g004
Figure 5. Framework of the TPOS.
Applsci 13 04877 g005
Figure 6. Flowchart of the surrogate-assisted RBDO.
Applsci 13 04877 g006
Figure 7. GRNN model building process.
Applsci 13 04877 g007
Figure 8. Diagram of NSGA-II.
Applsci 13 04877 g008
Figure 9. Description of the Yongjiang Bridge. (a) Yongjiang Bridge and (b) spatial FEM.
Applsci 13 04877 g009
Figure 10. Sensitivity analysis results of the negative reactions.
Applsci 13 04877 g010
Figure 11. Structural response values from FEM and GRNN.
Applsci 13 04877 g011
Figure 12. Reliability index from Monte Carlo and GRNN.
Applsci 13 04877 g012
Figure 13. Negative reaction risk assessment under the live load.
Applsci 13 04877 g013
Figure 14. Design variables and random variables.
Applsci 13 04877 g014
Figure 15. Pareto solutions in objective space.
Applsci 13 04877 g015
Figure 16. The optimal Pareto set and the optimization scheme.
Applsci 13 04877 g016
Figure 17. Mechanical performance of the concrete girder. (a) Vertical deviation. (b) Bending moment.
Applsci 13 04877 g017
Figure 18. Mechanical performance of the high pylon. (a) Bending moment. (b) Longitudinal displacement.
Applsci 13 04877 g018
Figure 19. Cable tension of the stay cables.
Applsci 13 04877 g019
Disclaimer/Publisher’s Note: The statements, opinions and data contained in all publications are solely those of the individual author(s) and contributor(s) and not of MDPI and/or the editor(s). MDPI and/or the editor(s) disclaim responsibility for any injury to people or property resulting from any ideas, methods, instructions or products referred to in the content.

