Article

Design of an Adaptive Algorithm for Feeding Volume–Traveling Speed Coupling Systems of Rice Harvesters in Southern China

College of Mechanical and Electrical Engineering, Hunan Agricultural University, Changsha 410128, China
*
Author to whom correspondence should be addressed.
Appl. Sci. 2023, 13(8), 4876; https://doi.org/10.3390/app13084876
Submission received: 1 March 2023 / Revised: 30 March 2023 / Accepted: 11 April 2023 / Published: 13 April 2023
(This article belongs to the Special Issue Engineering of Smart Agriculture)

Abstract

:
We developed an adaptive algorithm to reduce rice loss in harvesting, promote threshing and improve the quality and efficiency of small- and medium-sized rice harvesters operating in southern China’s hilly and mountainous areas. Using a fuzzy PID control algorithm, the harvester adapts to the rice harvesting conditions in southern China, and monitors rice feed volume changes and instantly adjust the traveling speed to optimize feed volume levels and threshing quality. We compared and analyzed the algorithm and the traditional PID control regulation effect in the simulation experiment. The algorithm had a quicker response speed and stable accuracy. In the field trial, the average error rate was 3.4%, and the maximum error rate was 5.1%, with most data points centered around the ideal feeding rate of 3.2 kg/s. Our results showed that the algorithm’s stability, accuracy, and real-time performance met the threshing loss reduction requirements of southern China’s rice harvesting operations.

1. Introduction

As an important grain cash crop in southern China, research on threshing loss reduction, referring to effectively reducing grain loss and improving agricultural production efficiency by adopting appropriate harvesting equipment and control methods, is of great significance to improving farmers’ profitability and guaranteeing national food security [1,2].
Threshing losses are usually analyzed from two aspects. On the one hand, during the operation of the harvester, a considerable portion of the rice grain will fall into the field or be discharged with the stem, resulting in direct losses; on the other hand, the harvested rice can be partially broken, leading to losses such as mold and spoilage during storage and transportation. The proper feeding volume is the key to improving the threshing quality, reducing losses and achieving the optimal performance of the harvester. Under current traveling speed adaptive system regulations, the traveling speed of the harvester and its feeding volume should have a good coupling relationship [3]. When the traveling speed changes, the feeding volume changes accordingly. This direct positive correlation reflects the close coupling between the traveling speed and the feeding volume. Therefore, the feed amount can be controlled by adjusting the traveling speed.
Many developed countries have researched smart traveling speed controls based on traditional manual operations, making extensive use of various types of electronic instruments and monitoring, alarms and other devices [4,5]. Sood et al. investigated a machine vision system for automatic plant division adapted to different light conditions, which can be used to monitor crop density in real time during harvester operations [6]. Federico et al. presented a control system for the modeling, control design and experimental automatic calibration of a combine harvester leveling system [7]. Nevavuori et al. used deep convolutional neural network techniques to predict crop yields and thus guide harvesting [8]. Contemporary research results are more reliable and widely referenced, and mainstream products are suitable for large-scale farming operations. However, the corresponding purchase cost is relatively high and does not align with China’s agricultural situation of diversified farming types and family farming [9]. Therefore, it is difficult to implement in China.
Numerous Chinese scholars have researched combine harvester traveling speed controls. Li et al. established an online monitoring system for combine harvesters’ hydraulic actuators using the AMESim simulation platform, and experimentally verified its high accuracy, providing harvester drivers with a reference for controlling traveling speed [10]. Yang et al. electrically modified a harvester and tested functions such as sequential start/stop, reel speed tracking and blockage detection, with good results [11]. Wang et al. designed a new adaptive control system for combine harvesters that considered cutting and tool advancement speeds [12]. Their experiments showed that the system controlled the tool’s cutting and advancement speeds more effectively. Chen et al. proposed a method for the real-time monitoring of grain breakage rates of rice combine harvesters based on machine vision, which can be used for the optimization and adjustment of traveling speeds of an intelligent harvester [13]. Some deep-learning related algorithms have inspired the development of intelligent agricultural machinery [14,15,16,17].
However, the current research results have certain limitations: (1) most of the studies are based on ideal conditions; that is, the field operation terrain is flat, or the undulating degree is minor, the operation area is large enough that the harvester does not need to change direction frequently, or the harvesting needs of scattered rice fields in the southern area’s hilly, mountainous terrain are not being met [18,19]; (2) the design does not consider the impact caused to the system’s detection accuracy and control effects by the high moisture characteristics of rice harvesting materials from southern China; (3) in addition to the high cost of promoted automatic control technology, some complex integrated control systems struggle to meet the current market demand for affordable, stable, or modifiable small- and medium-sized harvester-traveling speed control systems [20].
To solve the above limitations, we designed an adaptive algorithm for the feeding volume–traveling speed coupling system for a rice harvester in southern China. We calculated the feeding volume by detecting the torque and speed of the power shaft of the harvester’s tilting conveyor. We also developed a traveling speed optimization strategy to calculate the optimal traveling speed, which was used as an input quantity to automatically adjust the stepper electric actuator action online based on fuzzy PID. We discussed and optimized the signal analysis method and controller algorithm design for rice harvesting conditions in southern China. The stability, accuracy, and real-time performance of the algorithm were verified through simulation experiments and field trials. Our results showed that this can provide a reference for rice harvesters’ feeding volume–traveling speed coupling systems in southern China.
In summary, the main contributions of this paper are as follows: (1) We proposed an optimal speed optimization strategy based on torque and detection of the tilting conveyor power shaft to improve the stability and accuracy of the harvester’s traveling speed control; (2) We developed an adaptive algorithm for feeding volume–traveling speed coupling systems that adapts to rice harvesting conditions in southern China; (3) A control system with low hardware requirements was designed. The system has a high practical value. It can be used to develop new small- and medium-sized rice harvesters in hilly and mountainous areas. It can also be used for the modification of traditional harvesters. We propose that the variation of traveling speed during harvesting causes threshing loss. Our experimental results can provide rice harvesters with a reference for designing threshing and loss reduction systems in southern China.
The rest of the paper is organized as follows: Section 2 discusses and determines the feed rate detection scheme. Section 3 outlines the overall framework of the control system. Section 4 presents the design of the algorithm. Section 5 presents experiment-related content and discusses the simulation and field trial results. Section 6 summarizes our proposed approach and the direction of future work.

2. Methods

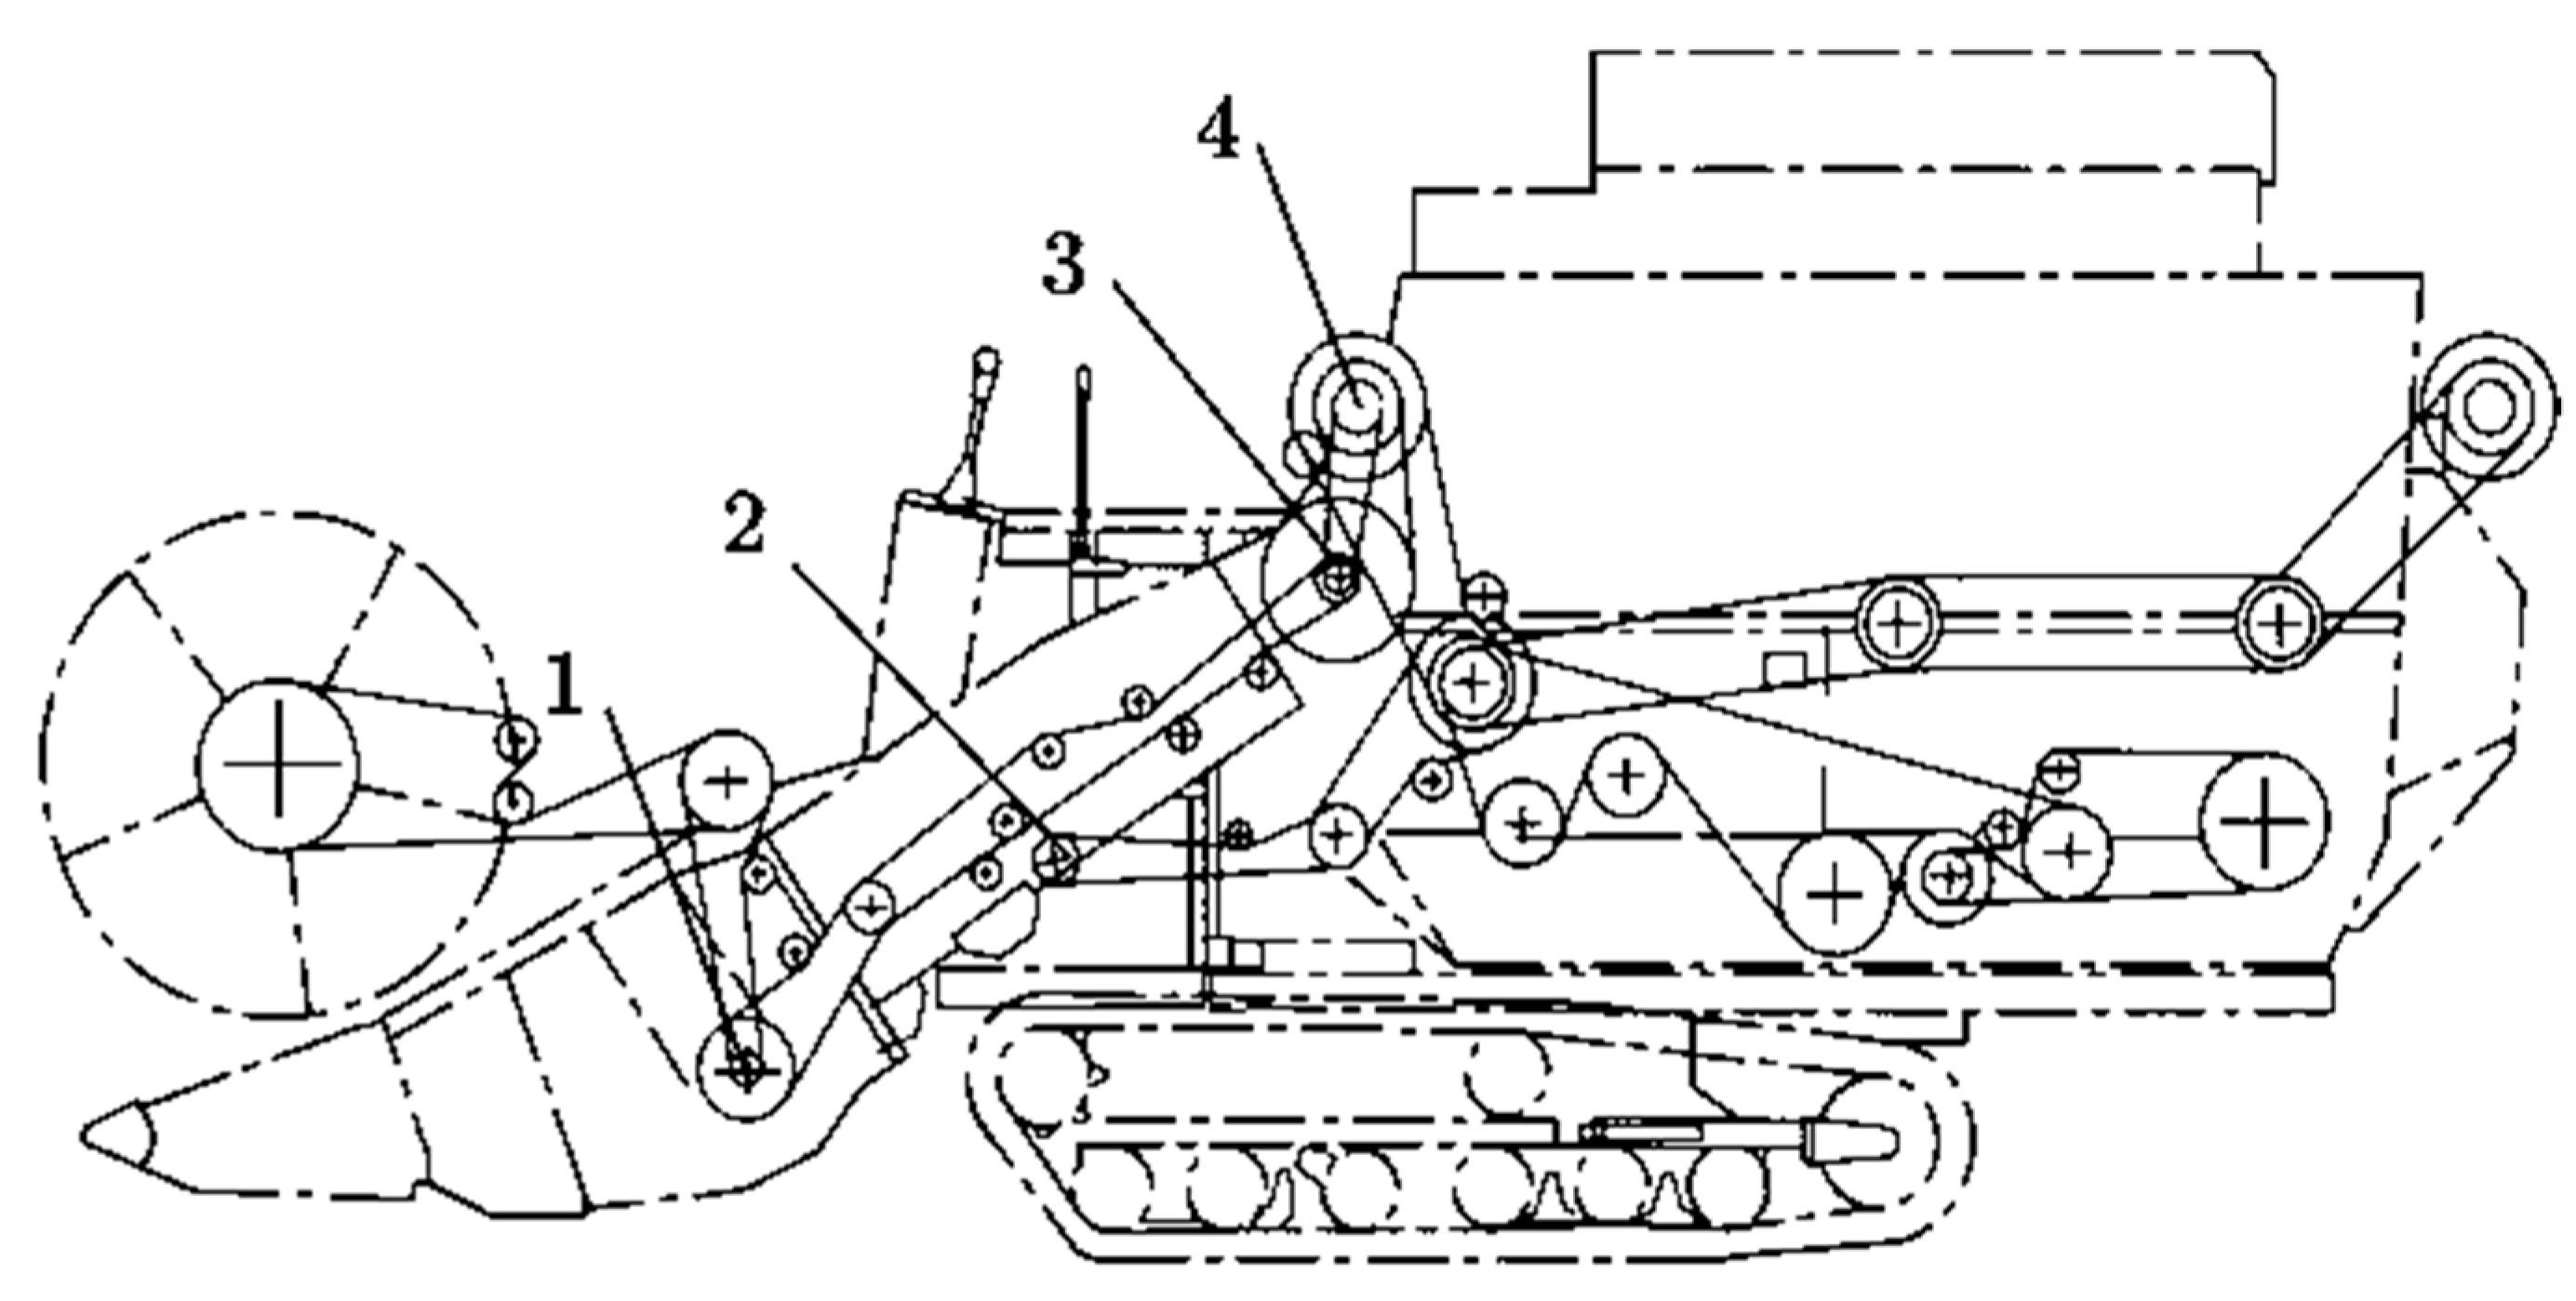
2.1. Detection Scheme Selection

Currently, considering the detection location, sensors are mainly placed in four parts of the tilt conveyor, screw conveyor, threshing drum, and active shaft of the cutting platform [21,22,23]. Figure 1 shows the installation position of the sensor test. In terms of detection stability under the harsh harvesting conditions in southern China, which are mountainous with high temperatures and humidity, it is difficult to maintain the working stability of the cutting platform’s active shaft sensor. Regarding real-time detection, the threshing drum is used after the threshing process, and the detection results of the sensor at this location lag significantly. Regarding detection practicality, there is less space for the screw conveyors of small- and medium-sized harvesters, which is not conducive to sensor installation. Installing sensors at the inclined conveyor position ensures operational stability and better real-time performance, and it is simple and easy to retrofit.
There are two main categories of feeding detection parameters: torque detection and power detection. Although the torque can theoretically reflect the feed variation more effectively, measurement accuracy and stability are greatly influenced by the angle of the tilted conveyor, the width of the cutting platform, etc. The actual detection accuracy is not ideal when applied to small- and medium-sized harvesters [24]. As a linear quantity, shaft power has fewer variables affecting detection accuracy and better stability, making it more suitable for feeding volume detection in southern China.
In summary, we selected a feeding volume detection scheme based on the power consumed by the tilting conveyor’s power shaft. When the harvester was in operation, the feed crop was transported by the tilting conveyor to the threshing drum for threshing. The shaft power consumption of the tilting conveyor was then measured. A mathematical model of the feeding volume and total power consumption detected the feeding volume in real time.

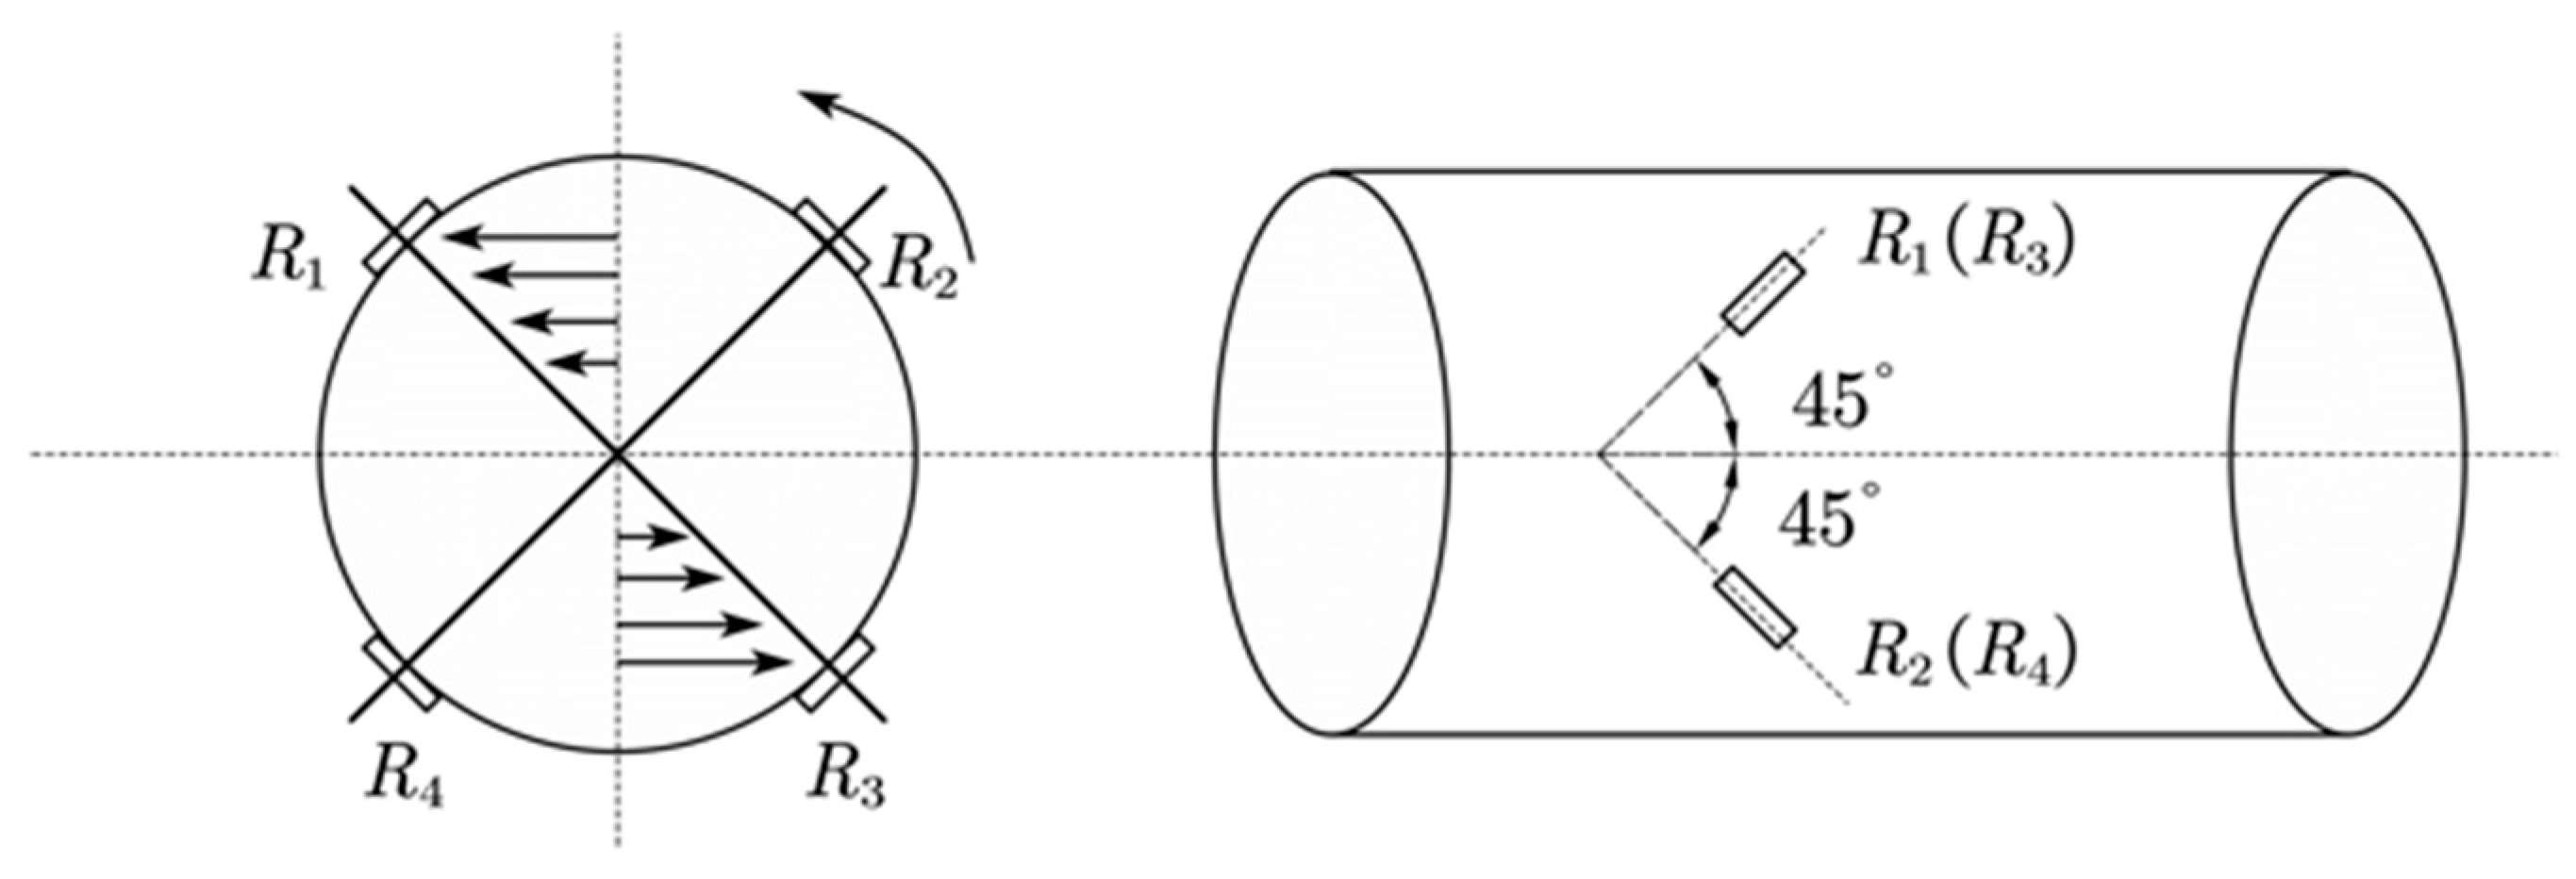
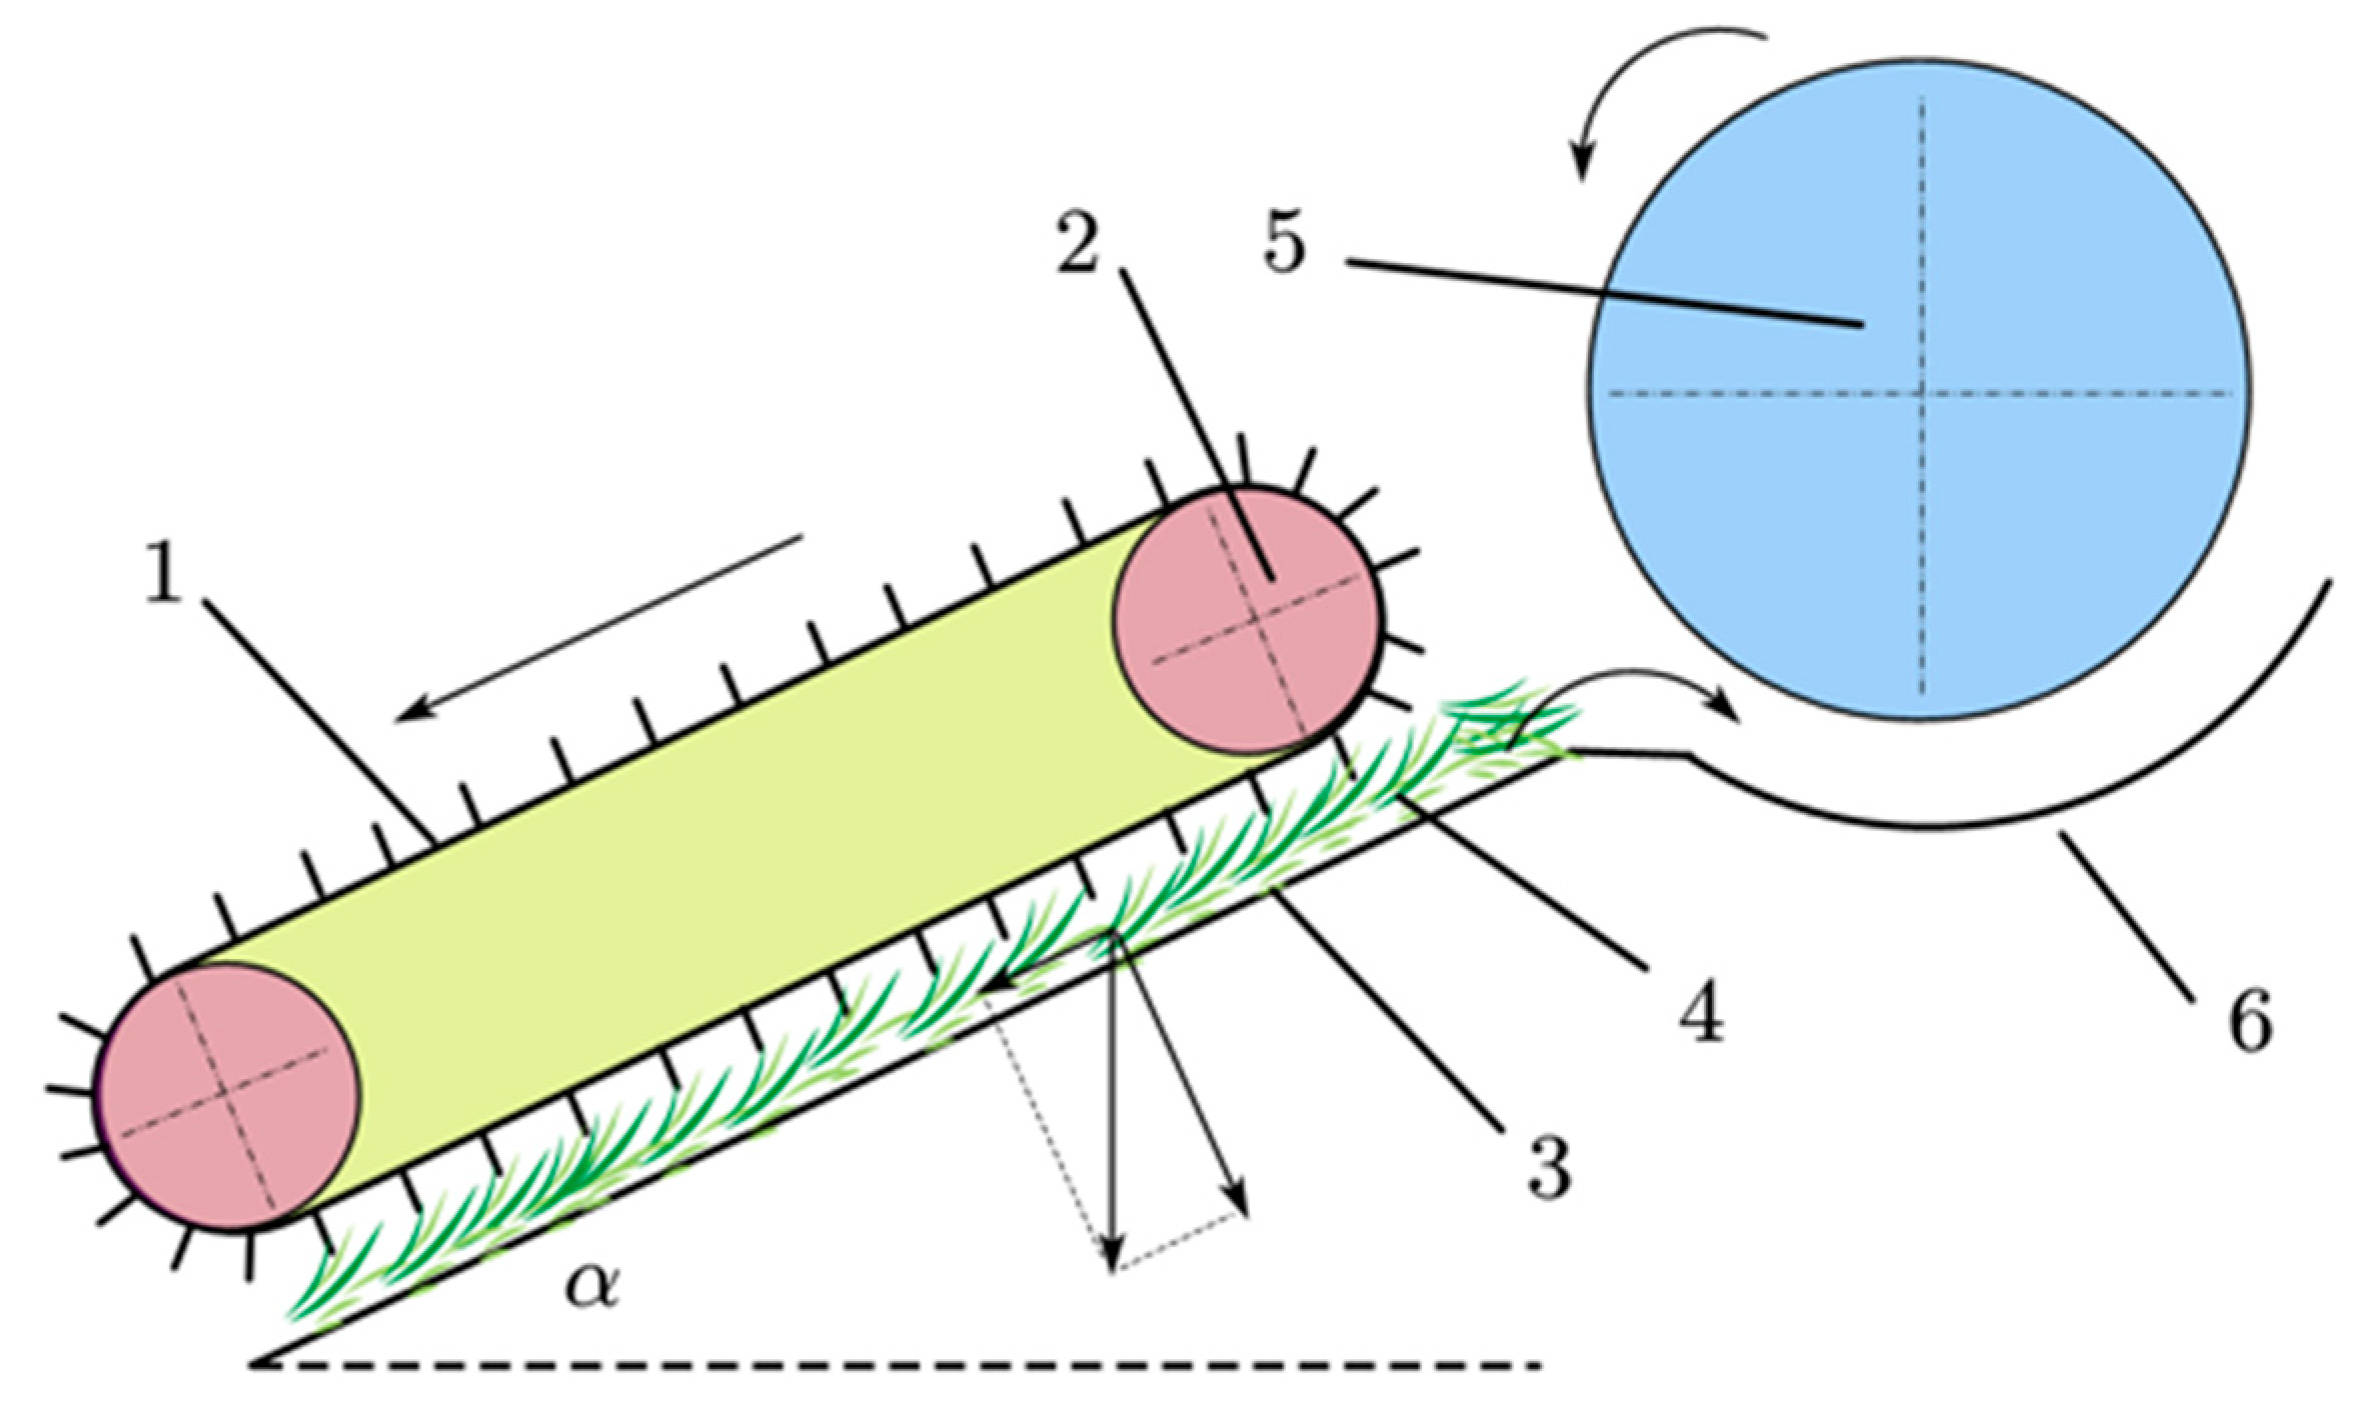
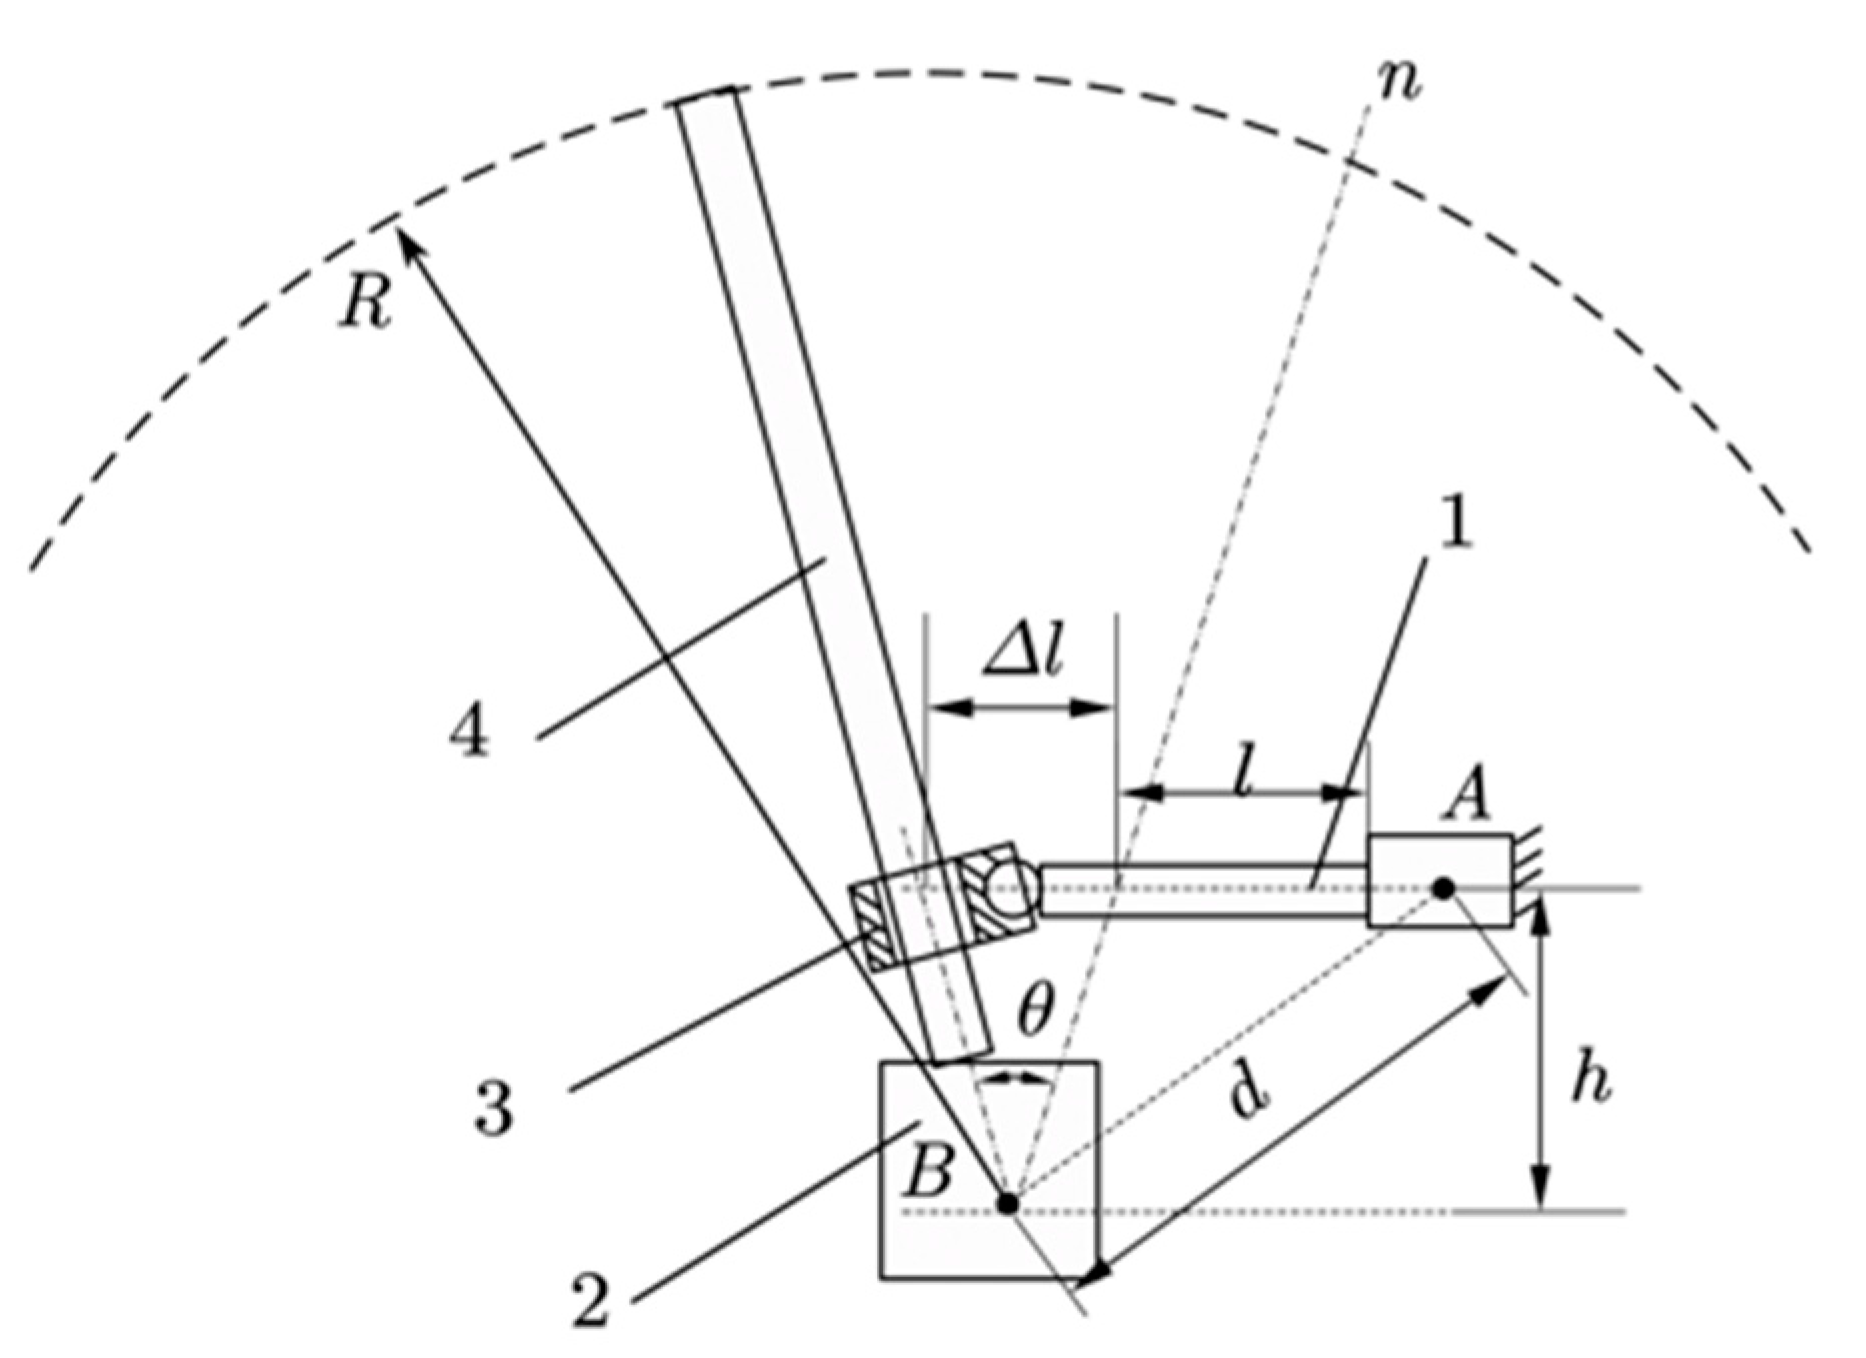
2.2. Detection Principle and Calculation Method

The two main feed detection devices were torque sensors and Hall-type speed sensors. The former was used to measure the power shaft torque of the tilting conveyor, T s . The latter was used to measure the speed of the main shaft of the cutting platform at n 1 .
Torque strain gauges were pasted in the 45 and −45° directions along the tilted conveyor’s power axis. Adjacent strain gauges were arranged at 90° equal intervals. Figure 2 shows the principle of torque sensor detection. When the harvester is in operation, the power shaft of the tilting conveyor will deform to different degrees with the change in feeding volume. The resistance of the strain gauge will then change, causing the output voltage to change. The output voltage signal of the bridge will convert to digital signals through the signal amplification and acquisition circuit, and will then be output to the industrial control machine. The power shaft torque is obtained by measuring the voltage signal.
Several magnets were attached to the side of the main shaft of the cutting platform. When the main shaft rotated, the Hall effect occurred when the magnets alternately passed through the Hall element, forming a pulse signal. The number of pulses generated per unit of time and the number of magnets on the surface of the main shaft can be used to calculate the corresponding speed of the main shaft of the cutting platform n 1 . The calculation formula for the speed of the power shaft of the tilting conveyor n s is as follows:
n s = k n 1
where n s is the speed of the harvester tilting conveyor power shaft, r/min; k is the transmission ratio between the tilt conveyor power shaft and the main shaft of the cutting platform; and n 1 is the speed of the cutting platform active shaft.
The formula for calculating the power shaft of a harvester tilt conveyor is as follows:
P s = T s n s 9550
where P s is the power of the power shaft of the harvester tilt conveyor, kW; T s is the torque of the harvester tilting conveyor power shaft, N-m.
Figure 3 shows a schematic diagram of the operation of the combine harvester tilt conveyor.
Assume that the tilt conveyor feeding volume at the moment t is q (kg/s). Through the chain rake, the active shaft of the inclined conveyor exerts a traction force on the grain that is F (N). The pressure on the grain is M (N). For the analysis of the tilting conveyor in the grain force, it can be seen that, in order to make the grain along the conveyor bottom plate display an upward movement, the following conditions must be met:
F m g s i n α + μ M + m g c o s α
where α is the inclination angle of the inclined conveyor, rad; μ is the friction factor between the grain and the bottom plate of the conveyor; and m is the mass of the grain conveyed by the conveyor, kg.
m is calculated as follows:
m = a p l h p γ  
where a p is the width of the conveyor, m; l is the length of the conveyor, m; h p is the average thickness of the material in the down-strike chain rake conveyor, m; and γ is the density of the transported grain layer, kg/ m 3 .
h p = q v a p γ ϵ
where v is the speed of the conveyor chain, m/s; ϵ is the filling factor of the material in the space formed between the lower working part of the conveyor and the inclined surface ( ϵ = 0.6 to 0.8).
Substituting Equation (3) into Equation (2), we can obtain:
m = γ a p l q v a p γ ϵ = q l v ϵ
The pressure M of the chain harrow on the grain is approximately proportional to the diameter h p , so the following relationship exists:
M = k h p = k q v a p γ ϵ  
where k is the proportionality constant.
Substituting Equations (6) and (7) into Equation (3), we can obtain the following equation when the inclined conveyor is moving at a constant speed:
F = q l v ϵ g s i n α + μ k v a p γ ϵ + l v ϵ g c o s α  
When feeding uniformly and at a constant speed, neglecting the influence of certain secondary factors, the power balance equation of the inclined conveyor according to the principle of transmission dynamics is as follows:
P s P c = F v
where P c is the unwanted power when the inclined conveyor is operating.
Substituting Equation (8) into Equation (9), we can finally obtain the calculation formula for the inclined conveyor:
q = a p γ ϵ a p γ lg s i n α + μ c o s α + μ k c o s α ( P s P c )

3. System Design

We selected the original 4LZ-3.2Z full-feed grain combine harvester from Nongyou Agricultural Equipment Co., Ltd. in Hunan Province, China, as the test prototype for this paper. The shape of the harvester is shown in Figure 4. The harvester has a rated feeding capacity of 3.2 kg/s, a theoretical operating speed of 2.2 m/s, a working width of 1700 mm on the cutting platform, and a rated engine power of 55.2 kW. The driving method is fully hydraulic, with highly integrated electronic controls. The traveling speed is regulated by an electronic control handle, which is conducive to the design and modification of the hardware system. Therefore, we based the design of the adaptive coupling system on this harvester. We also based the relevant parameters of the adaptive coupling system on this harvesting platform’s performance index.

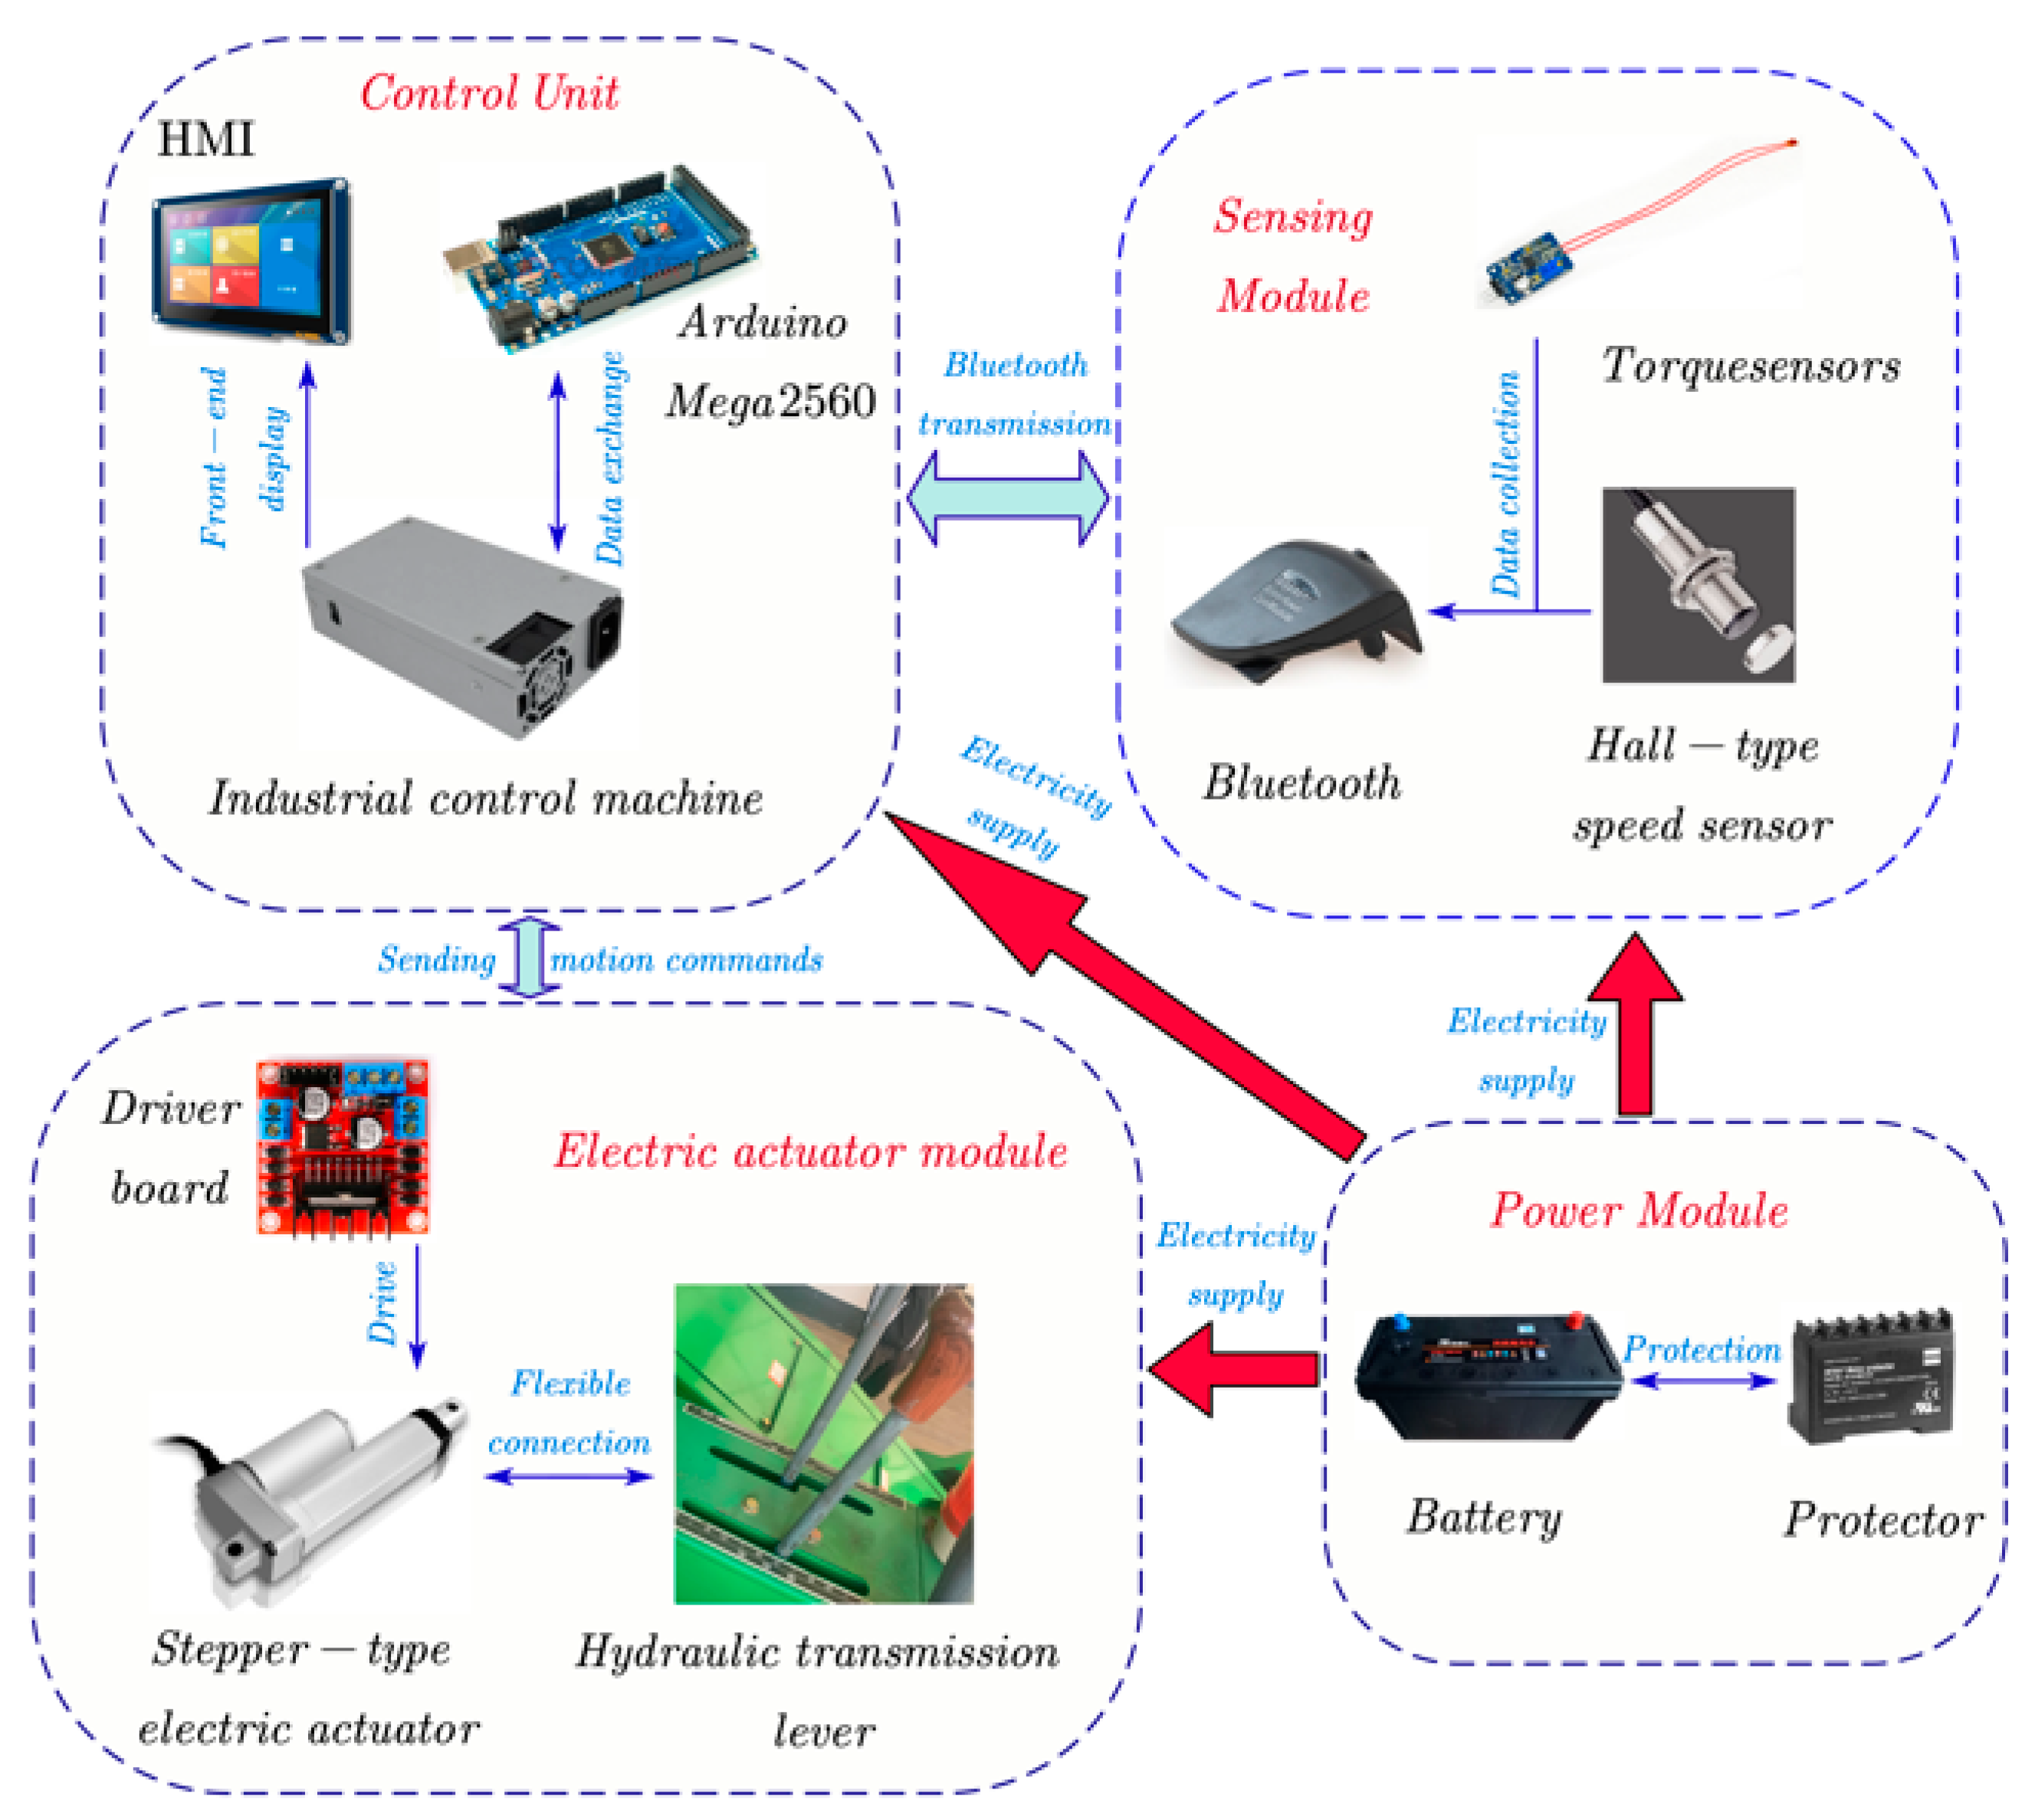
3.1. Control System Hardware Framework

The harvester’s feeding volume–traveling speed coupling system consists of a sensing module, a control unit, an electric actuation module, and a power supply module. The control principle is that the sensor module detects the torque and speed of the tilting conveyor’s power shaft to calculate the real-time feeding volume. It obtains the deviation value e t by comparing the calculated value c t to the ideal feeding volume r t provided by the system. The fuzzy PID controller receives and processes the error signal, and the corresponding control signal is output. The signal is multi-stage amplified by the drive module to control the stepping electric actuator action, adjusting the harvester’s stopper position, i.e., controlling the traveling speed toward deviation elimination until the deviation tends to zero, thus realizing the feeding volume–traveling speed self-adaptation. The hardware framework of the control system was designed as shown in Figure 5.
The control unit is responsible for communication management, analyzing all information and implementing logical operations. The sensing module detects parameters such as the torque and rotation speed of the tilt conveyor’s power shaft during harvesting operations. The power supply module provides power to all modules.

3.2. Electric Actuator Module

The stepper electric actuator was mounted on the self-propelled chassis frame, and the output shaft was flexibly connected to the hydraulic transmission joystick. The actuator was lightweight, small in size, simple in principle, and met the modification requirements of small- and medium-sized harvesters. Figure 6 shows a schematic diagram of the electric actuator module.
Under the control of the control system, the size of the stepping electric actuator extension or contraction Δ l (mm) will drive the angle of the joystick swing θ (rad). The speed of the harvester is controlled by adjusting the hydraulic transmission to realize the control of the traveling speed of the harvester. Assuming that the illustrated mechanism occurs while operating the actuator, if the dotted line n indicates the starting position of the joystick, the formula for calculating the angle of the joystick position would be:
θ = arcsin h Δ l Δ l + l d 2 h 2 ) 2 + h 2 h 2 + d 2 h 2 l ) 2
where d and h are the linear and vertical distances between the center of the stepper motor actuator base and the stopper pivot point, respectively ( d > h ); l is the original length of the electric actuator.

4. Algorithm Design

4.1. Optimal Traveling Speed Calculation Strategy

When the feeding volume q exceeds the rated feeding volume Q of the harvester, the traveling speed should be reduced appropriately. The traveling speed should be increased when the feeding volume q is too low. The ideal target speed can be calculated from real-time feed rates while ensuring rice harvester efficiency and quality and reducing equipment failure.
v n = v 0 + Q q 3 σ
where v n and v 0 are the ideal target velocity and real-time velocity (in m/s), respectively.
Considering the many contingent factors when rice harvesters operate in southern China’s complex field environments, the target speed calculated from the input quantity alone was not well adapted to the system. Therefore, we propose the traveling speed optimization formula, as shown in Equation (13). In the following exposition, the traveling speed of the harvester is optimized based on the tilt conveyor’s power shaft torque T s and rotational speed n s .
  • When T s and n s are both in a reasonable state, the absolute value of the relative error between its value and the rated value belongs to [0, 0.1]; then, the traveling speed at this time is v n ;
  • When there is an abnormality between T s and n s , i.e., the absolute value of the relative error between at least one set of values and the rated value belonging to [0.1, 0.2], adjust the speed to 0.8 v n and observe the subsequent values. If all values return to a reasonable state within 3 s, adjust the speed to v n ; otherwise, decelerate to 0.4 v n ;
  • When the harvester fails, i.e., the absolute value of the relative error between any value and the rated value is constantly >20%, the speed is immediately reduced to 0 m/s and the machine is stopped for inspection.
    V = v n , 0 n i 0.1 N i 0.8 v n , 0.1 N i < n i 0.2 N i ; T 5 0.4 v n , 0.1 N i n i 0.2 N i ; T 5 0 , n i > 0.2 N i
    where V is the optimal traveling speed of the harvester, m/s; i = 1,2, n i are the error values of T s and n s , respectively; N i are the rated values of T s and n s , respectively; and T is the data update time, s.

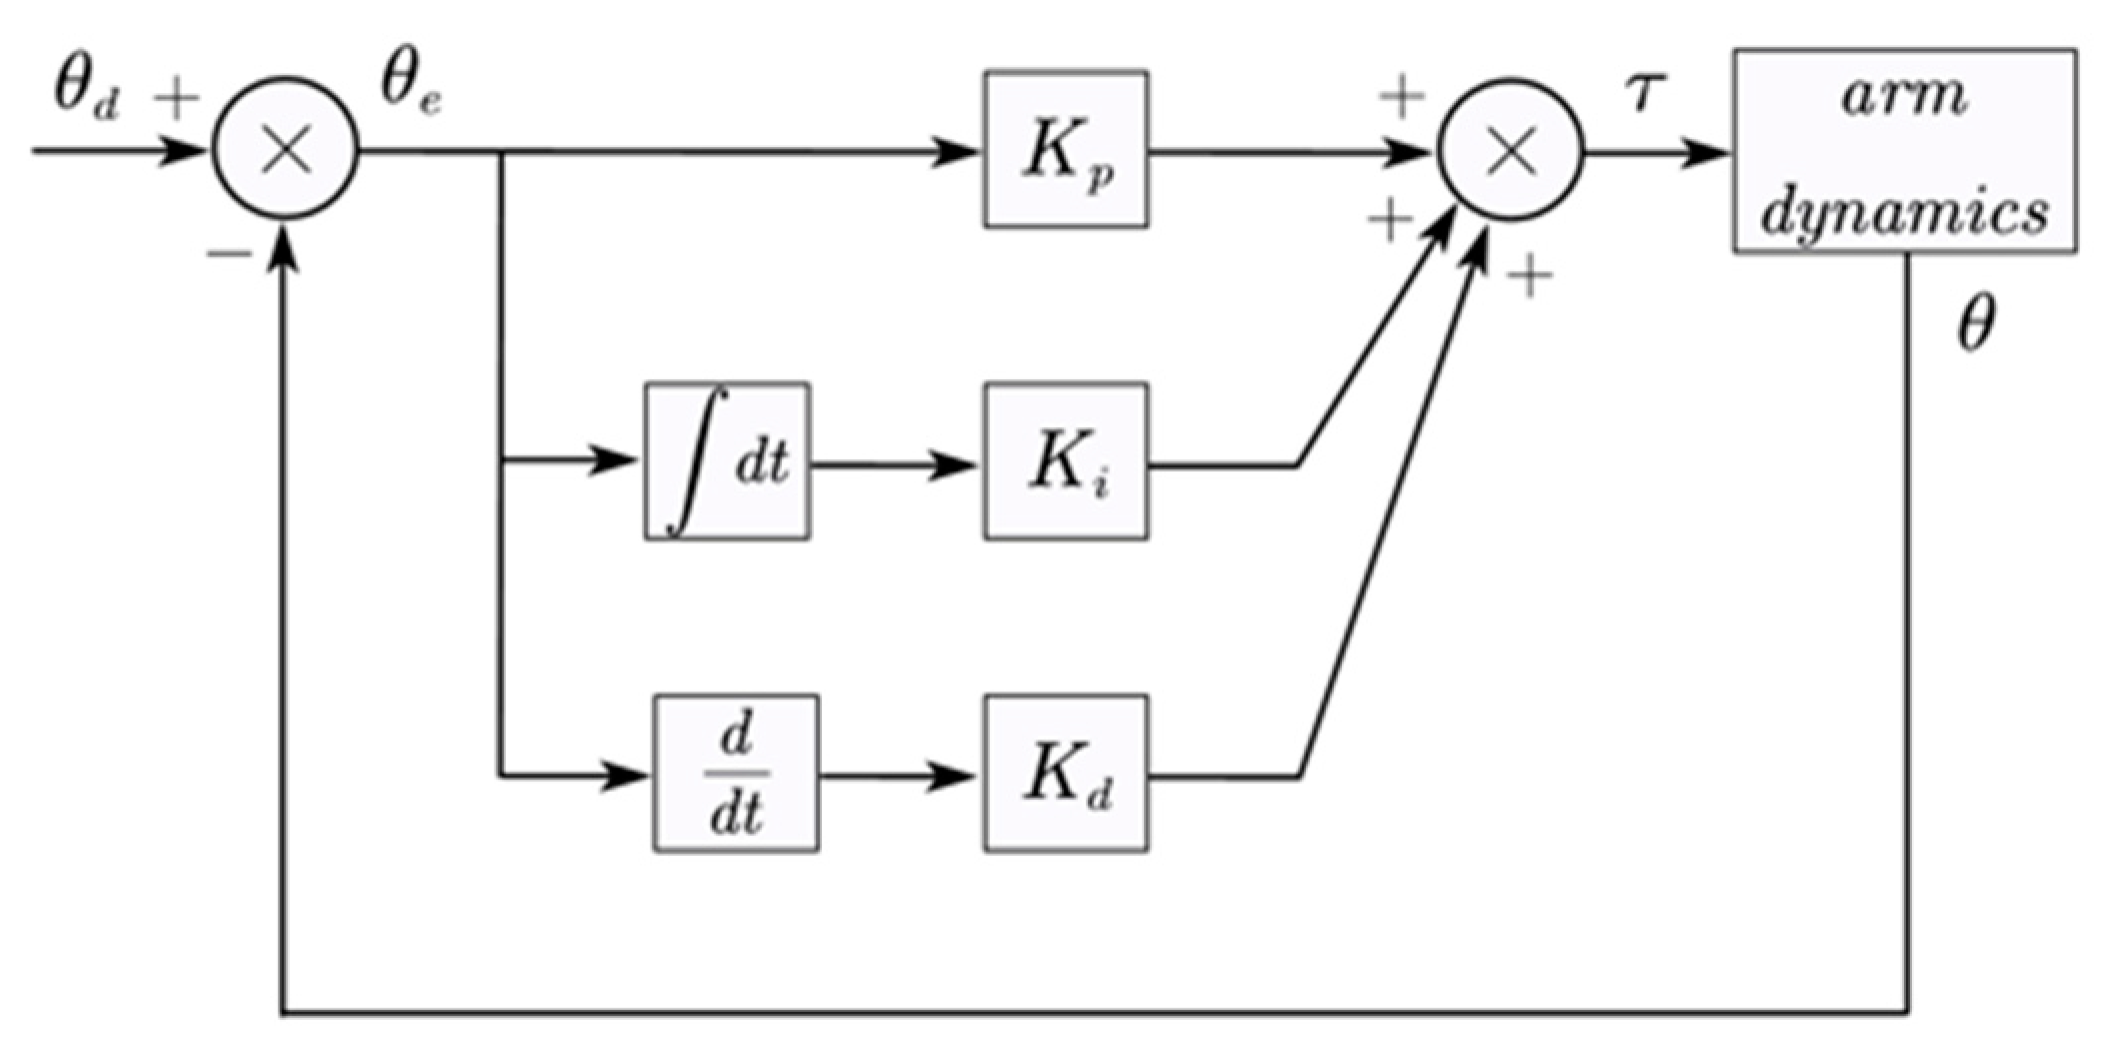
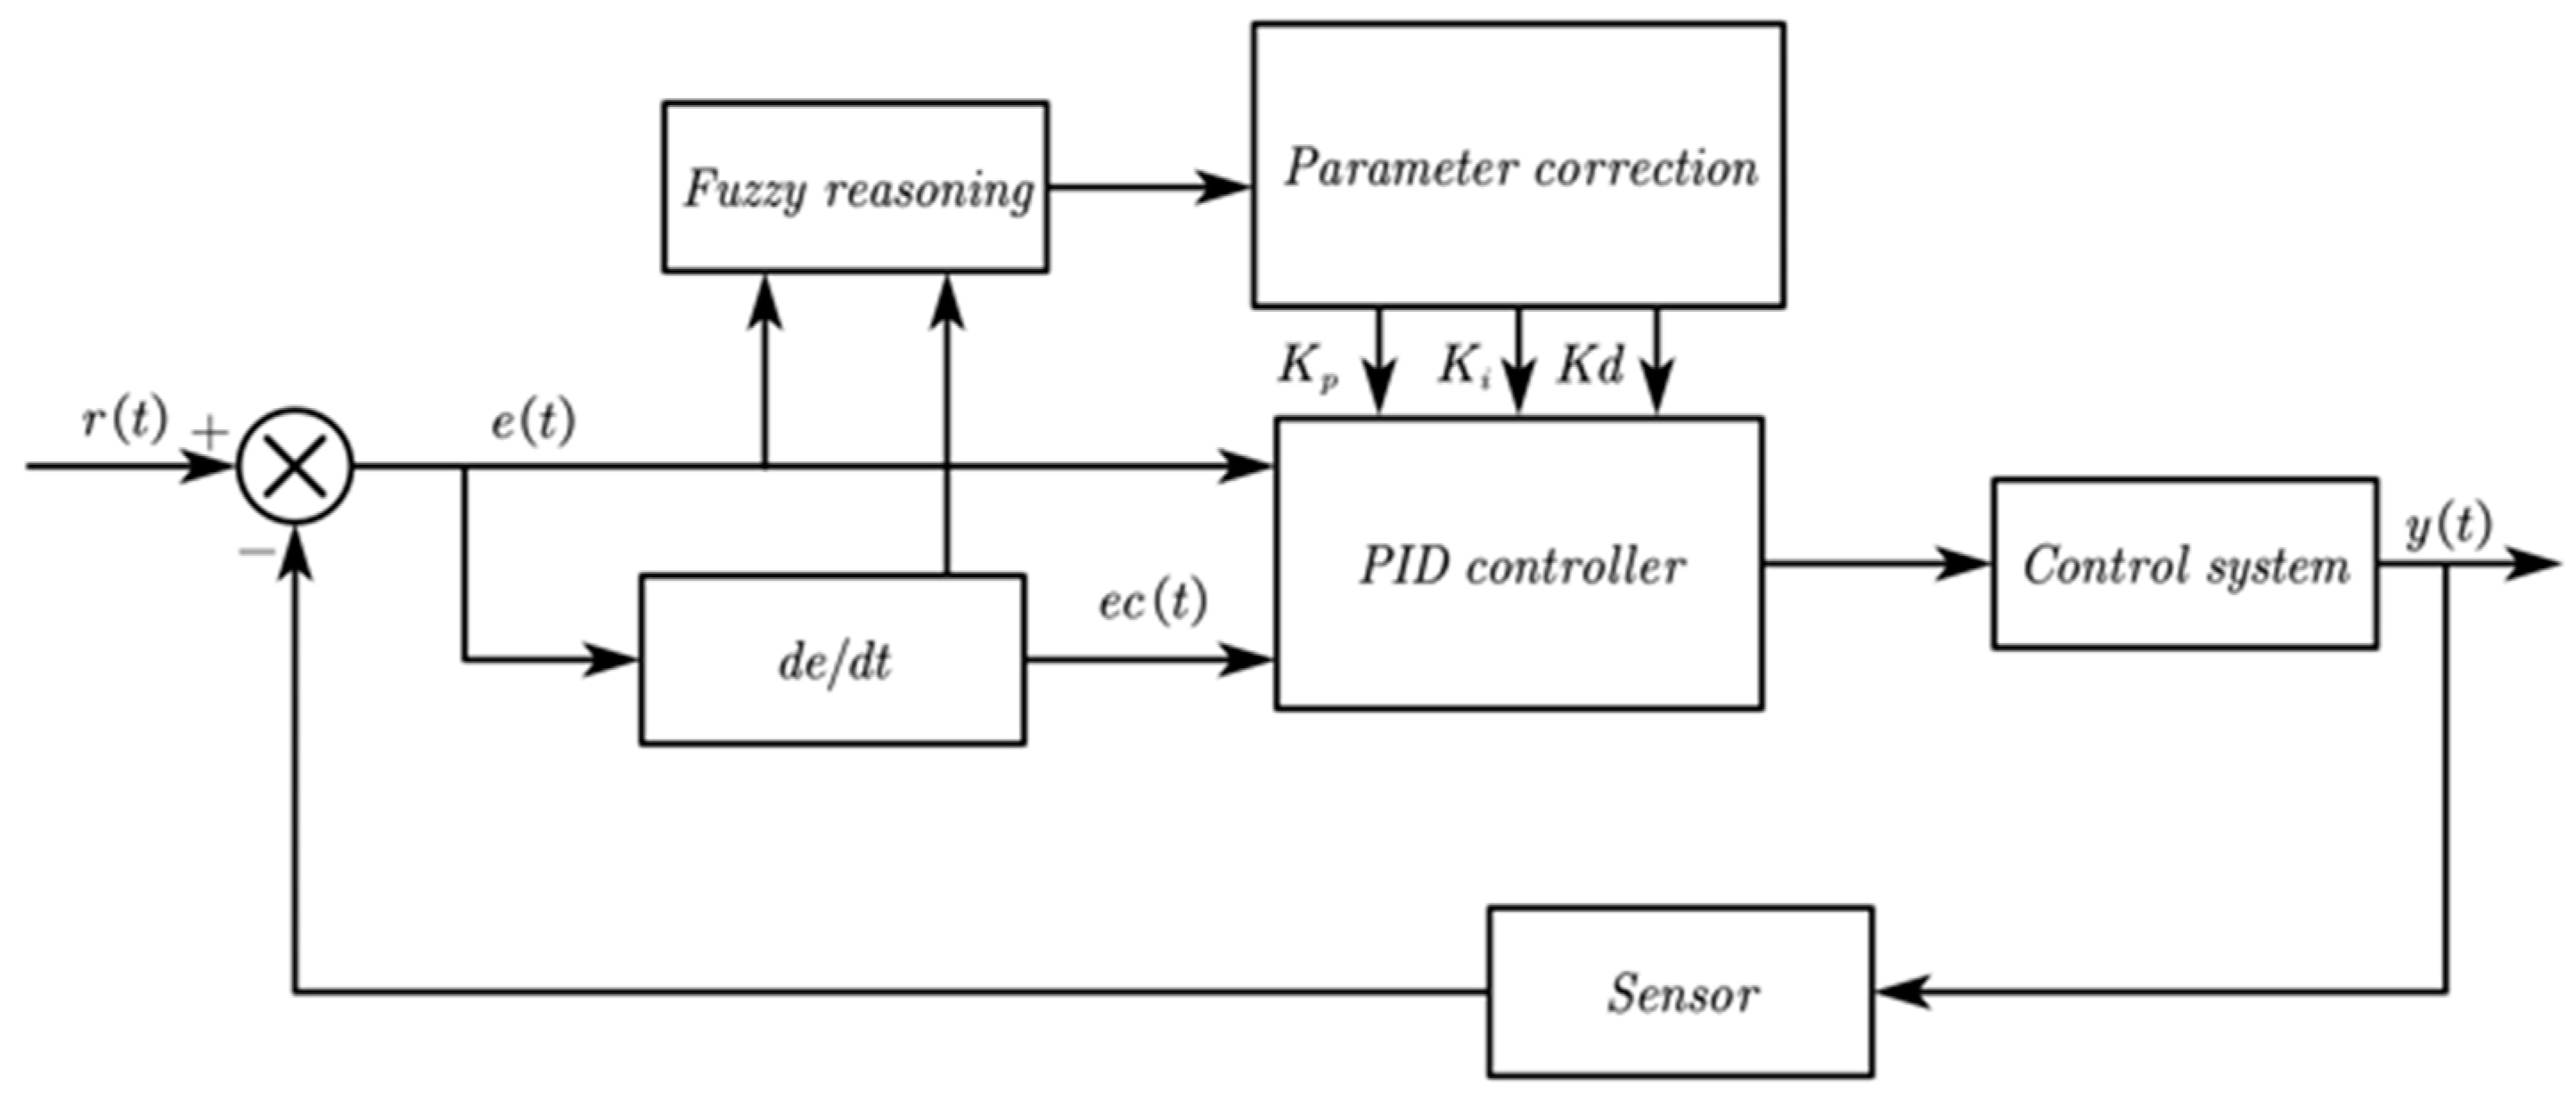
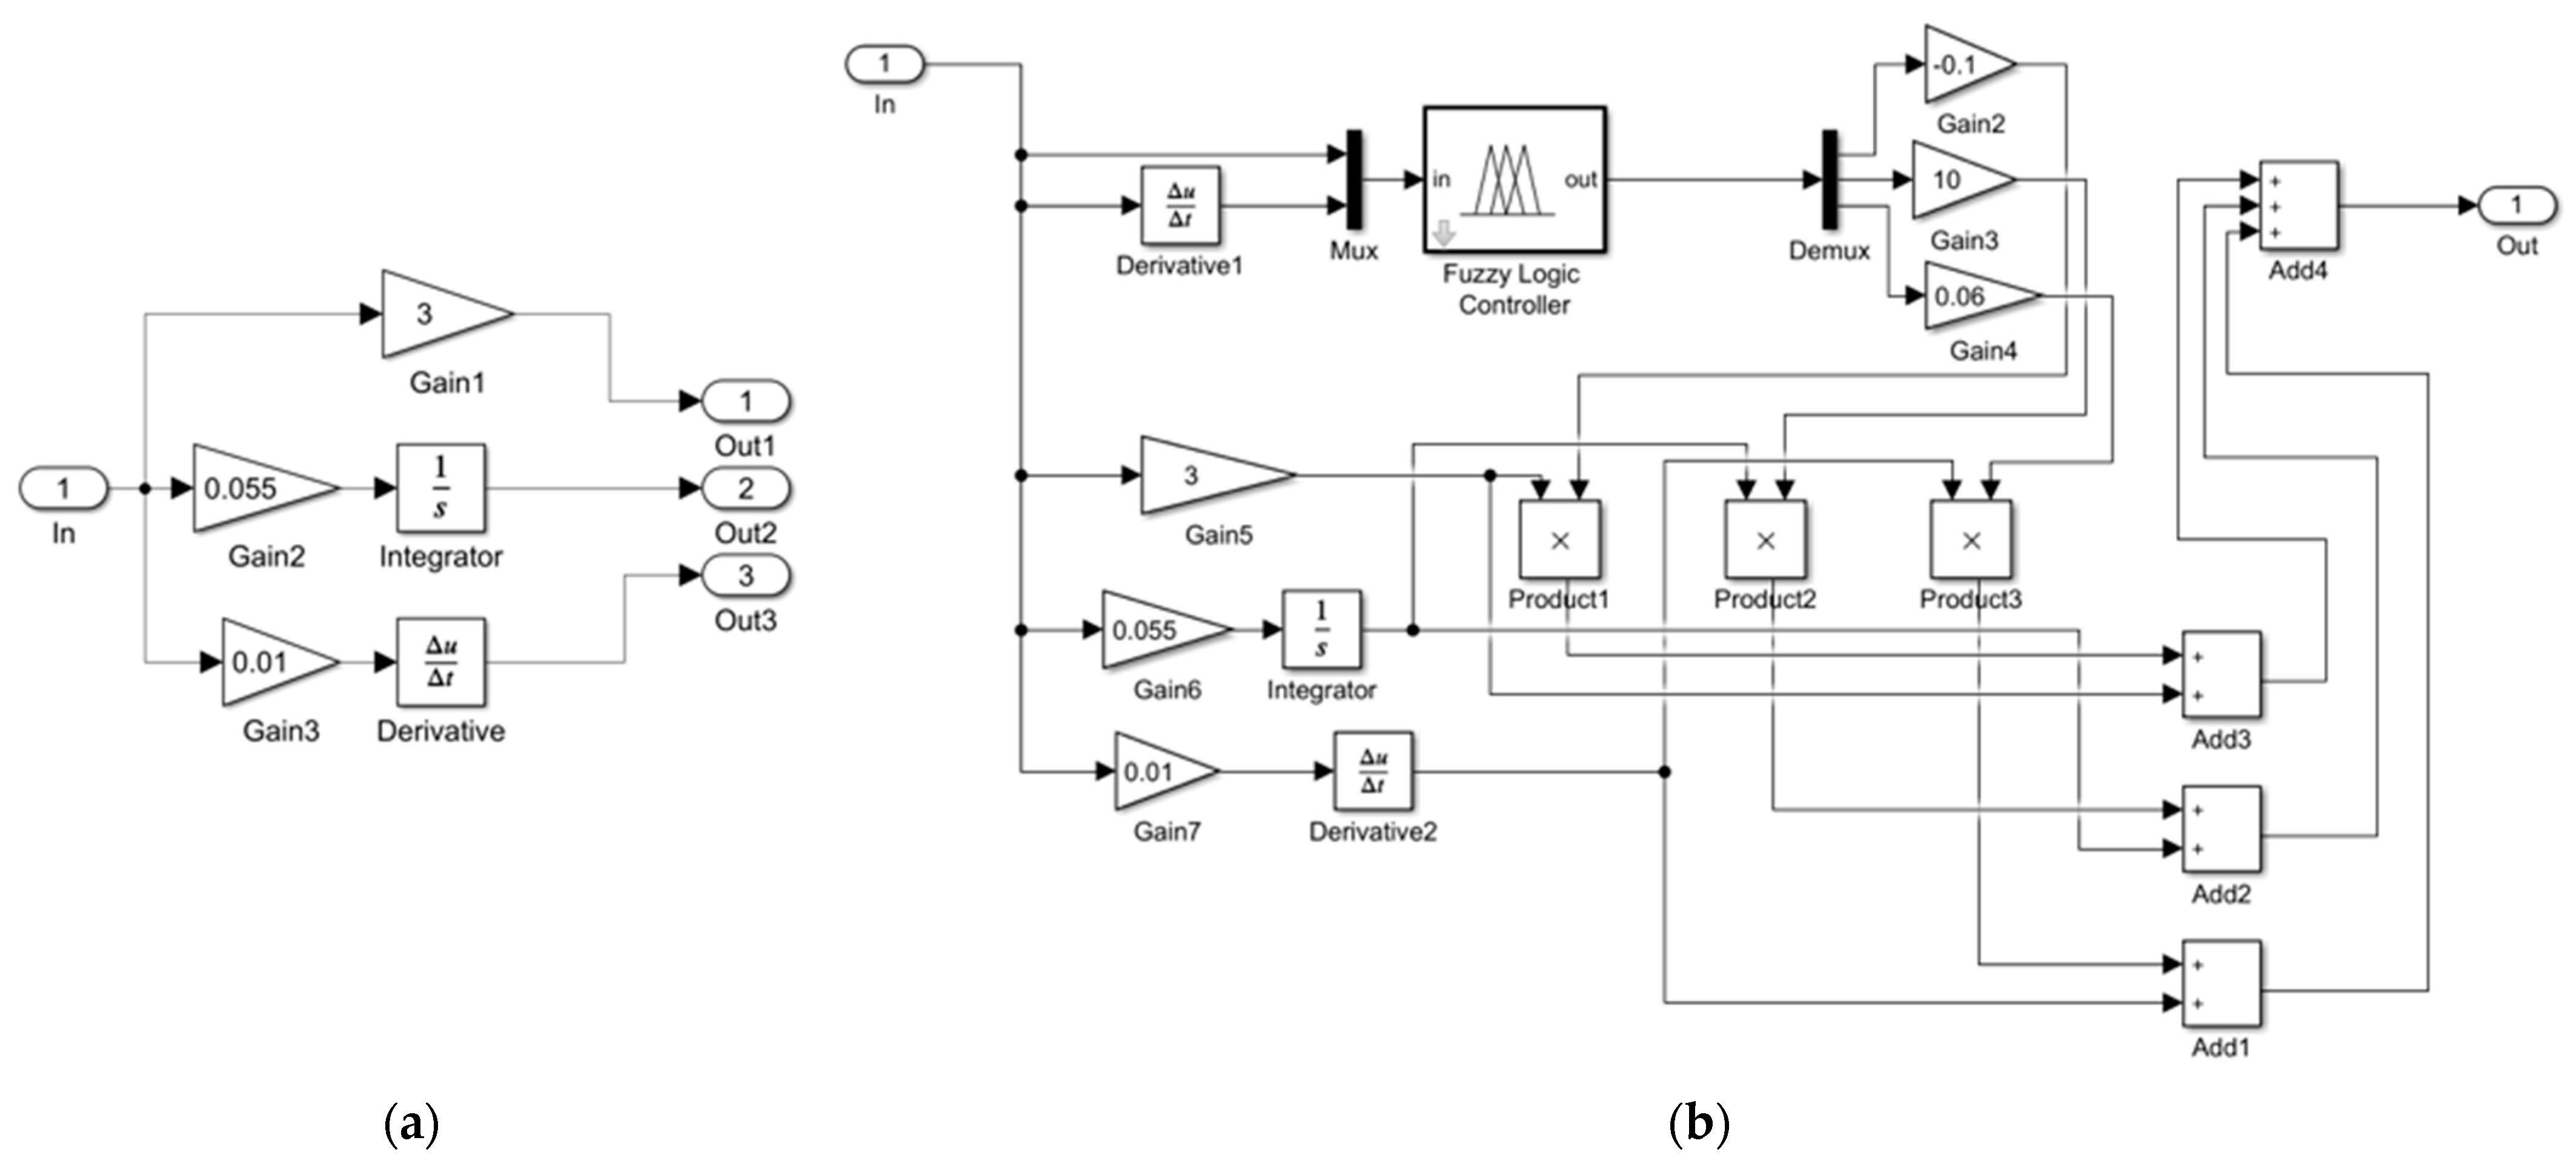
4.2. Adaptive Fuzzy PID for Coupling System

In this paper, we used a fuzzy PID control strategy combining fuzzy control and classical PID to achieve an adaptive coupling system. It uses the PID algorithm with fuzzy inference based on fuzzy rules to adjust PID parameters and achieve optimal control [25]. It has the advantages of simplicity and high accuracy in traditional PID regulation while avoiding the disadvantages, such as poor adaptability and flexibility. This paper uses a PID type controller, and Figure 7 shows the schematic. Figure 8 shows the schematic block diagram of the fuzzy PID controller.

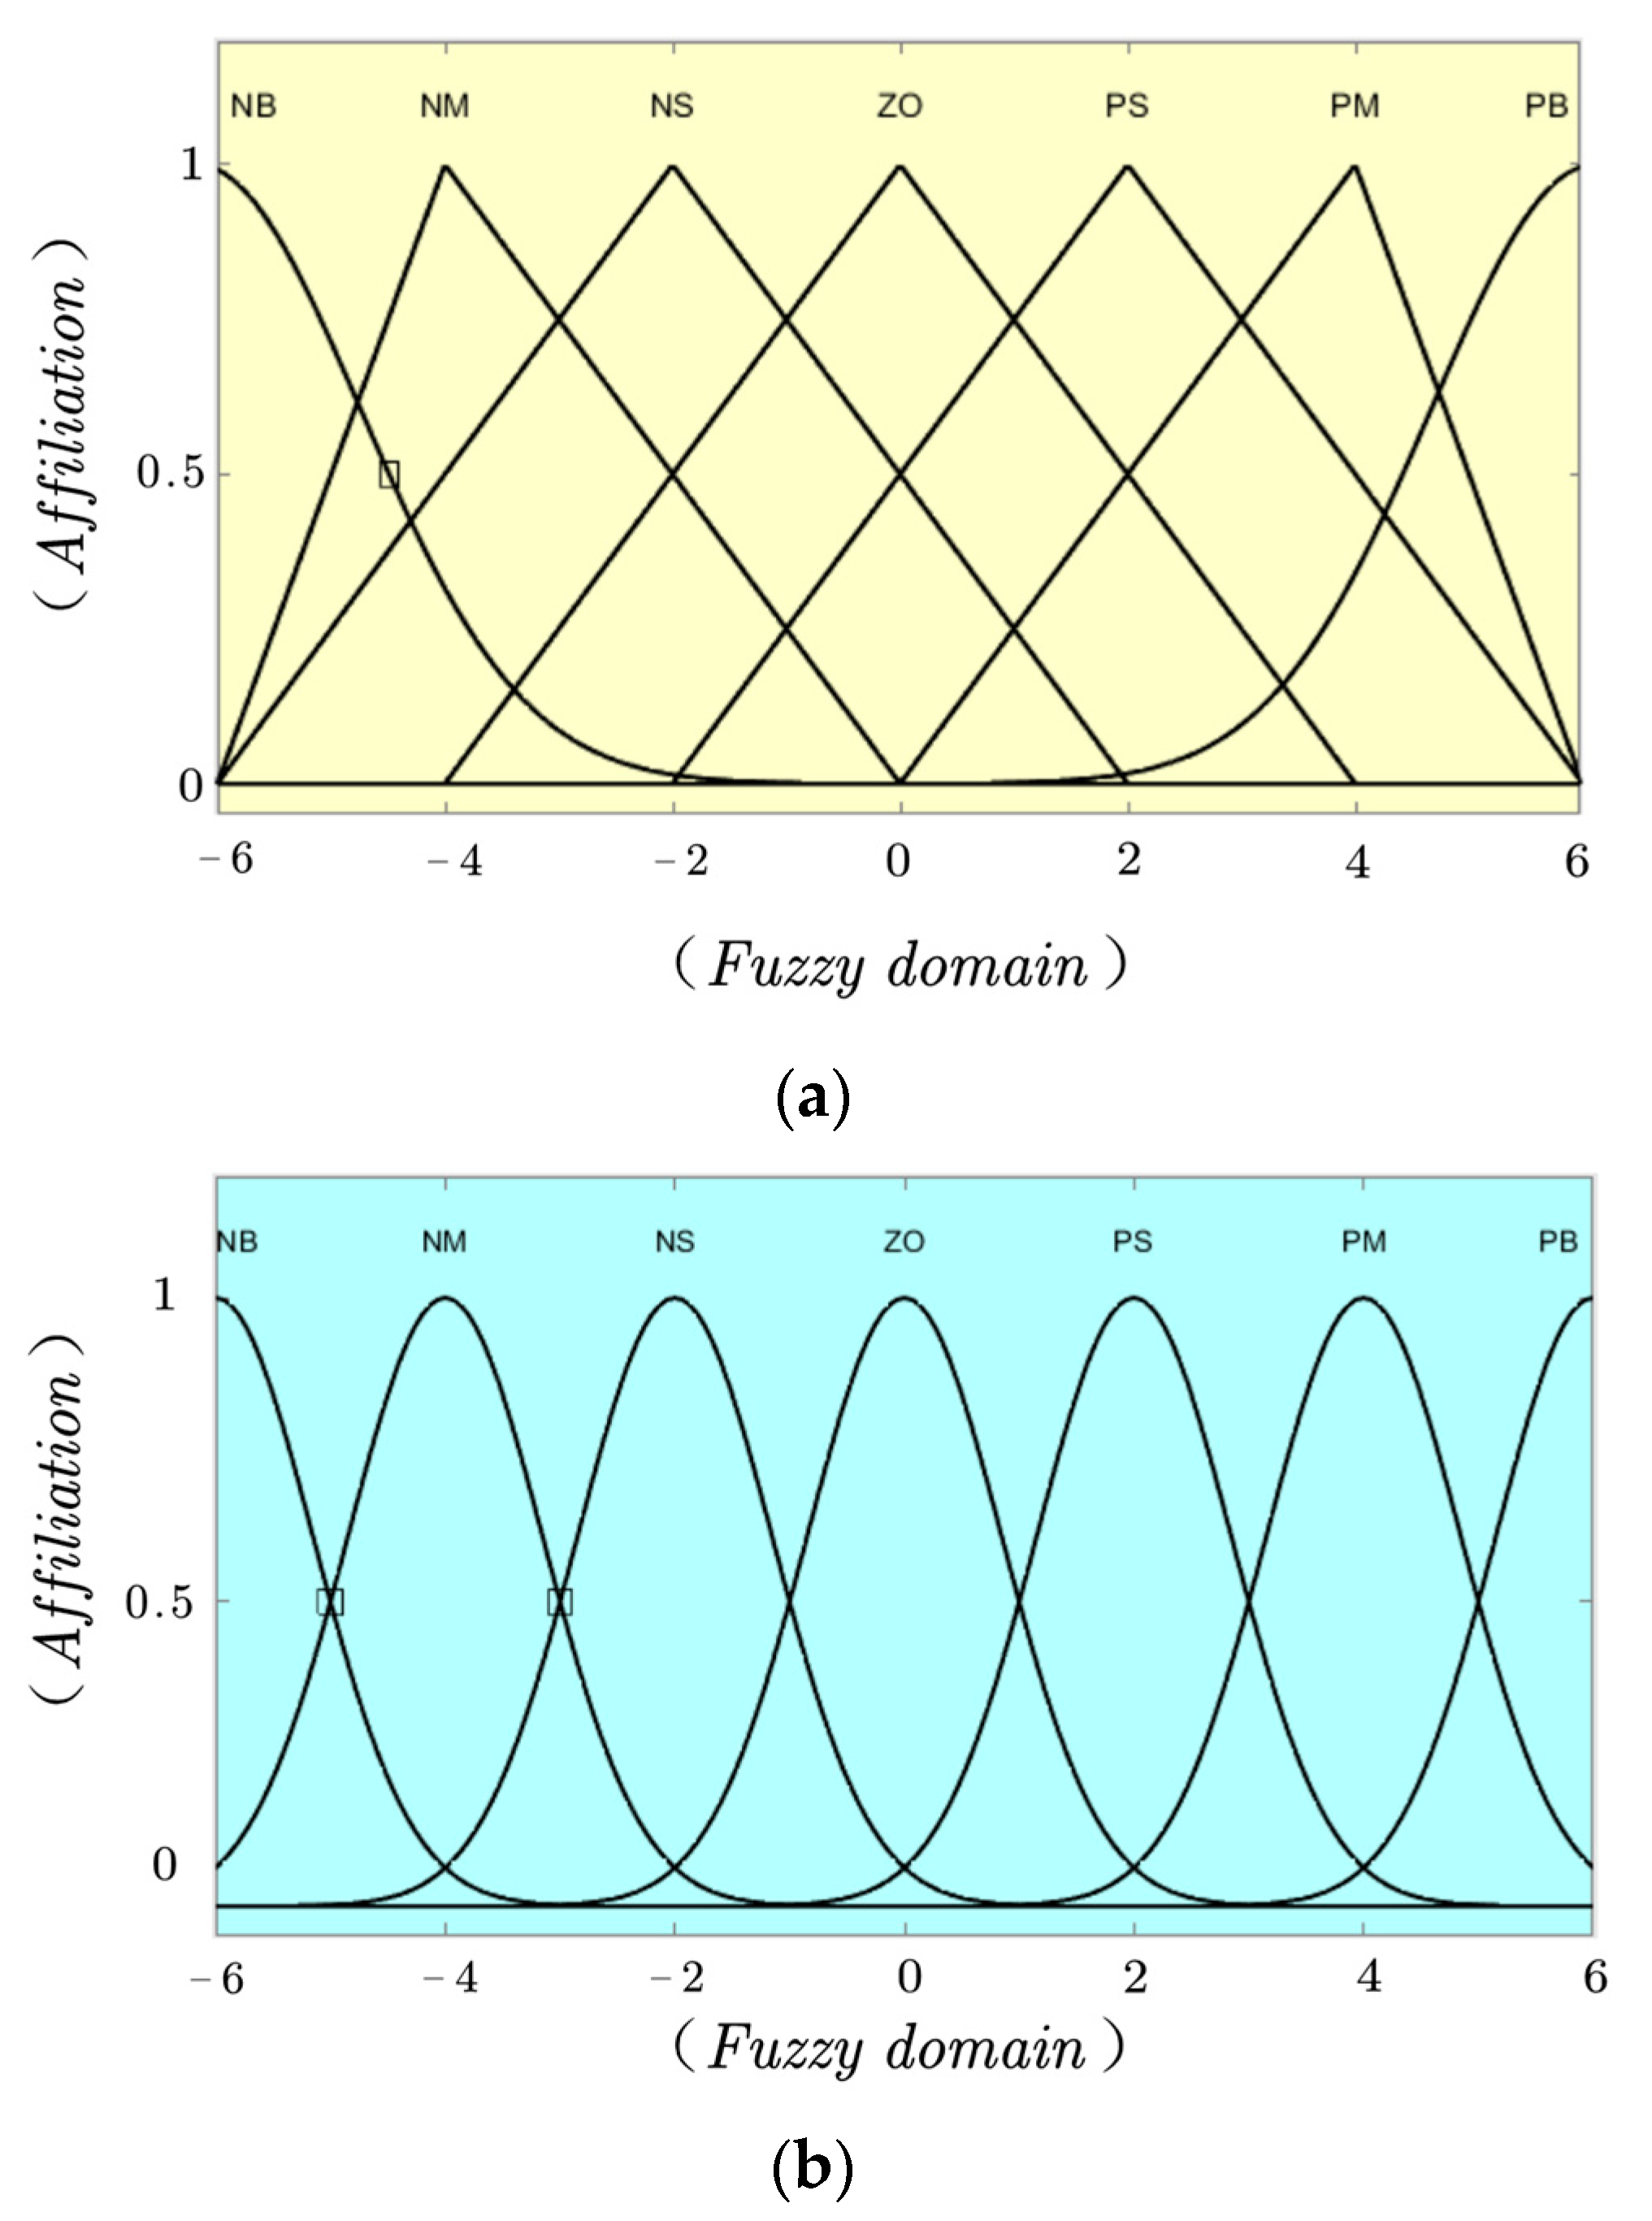
4.2.1. Domain of Discourse and Fuzzy Subset Determination

In this paper, we defined the traveling speed deviation e and the rate of change in deviation e c as the input variables. We also defined the corrections of the three PID control parameters Δ K p ,   Δ K i and Δ K d as the output variables. The constant parameters of the conventional PID controller were as follows: K p = 3, K i = 0.055 and K d = 0.01. This was designed according to the transfer function and dynamic characteristics of the system. Additionally, MATLAB was used for trial control and optimization.
We modified the experimental vehicle with a feed detection function. Simulation tests were performed with the manual feeding of rice. At the same time, we performed a conventional PID simulation of the feeding volume–traveling speed coupling system. By referring to the variation characteristics of the input variables in the simulation tests, the basic domain of each variable was finally determined (Table 1).
After determining the fuzzy domain, the variables were divided into several fuzzy sets using fuzzy linguistic values. Each variable value corresponded to a set of fuzzy language values, and the number of fuzzy sets was selected according to the control accuracy. The more accurate the number, the more complex the corresponding control rules. In this paper, we selected seven levels of fuzzy language values {NB, NM, NS, ZO, PS, PM, and PB} based on the actual harvesting conditions.

4.2.2. Affiliation Function Selection

The continuous domain fuzzy sets were expressed in the functional form [26]. To filter the random perturbations that often exist in the input variables e and e c , we selected the isosceles triangular shape as its affiliation function, which we set to a Gaussian affiliation curve to improve the response sensitivity, considering that the basic domain edges of the input variables belonged to the large deviation category. To enhance the smoothness of the controller output, the output variables Δ K p , Δ K i , and Δ K d were chosen to be of Gaussian type as the affiliation function. The affiliation function and distribution of each variable are shown in Figure 9, where the horizontal coordinate is the fuzzy domain and the vertical coordinate is the affiliation degree.

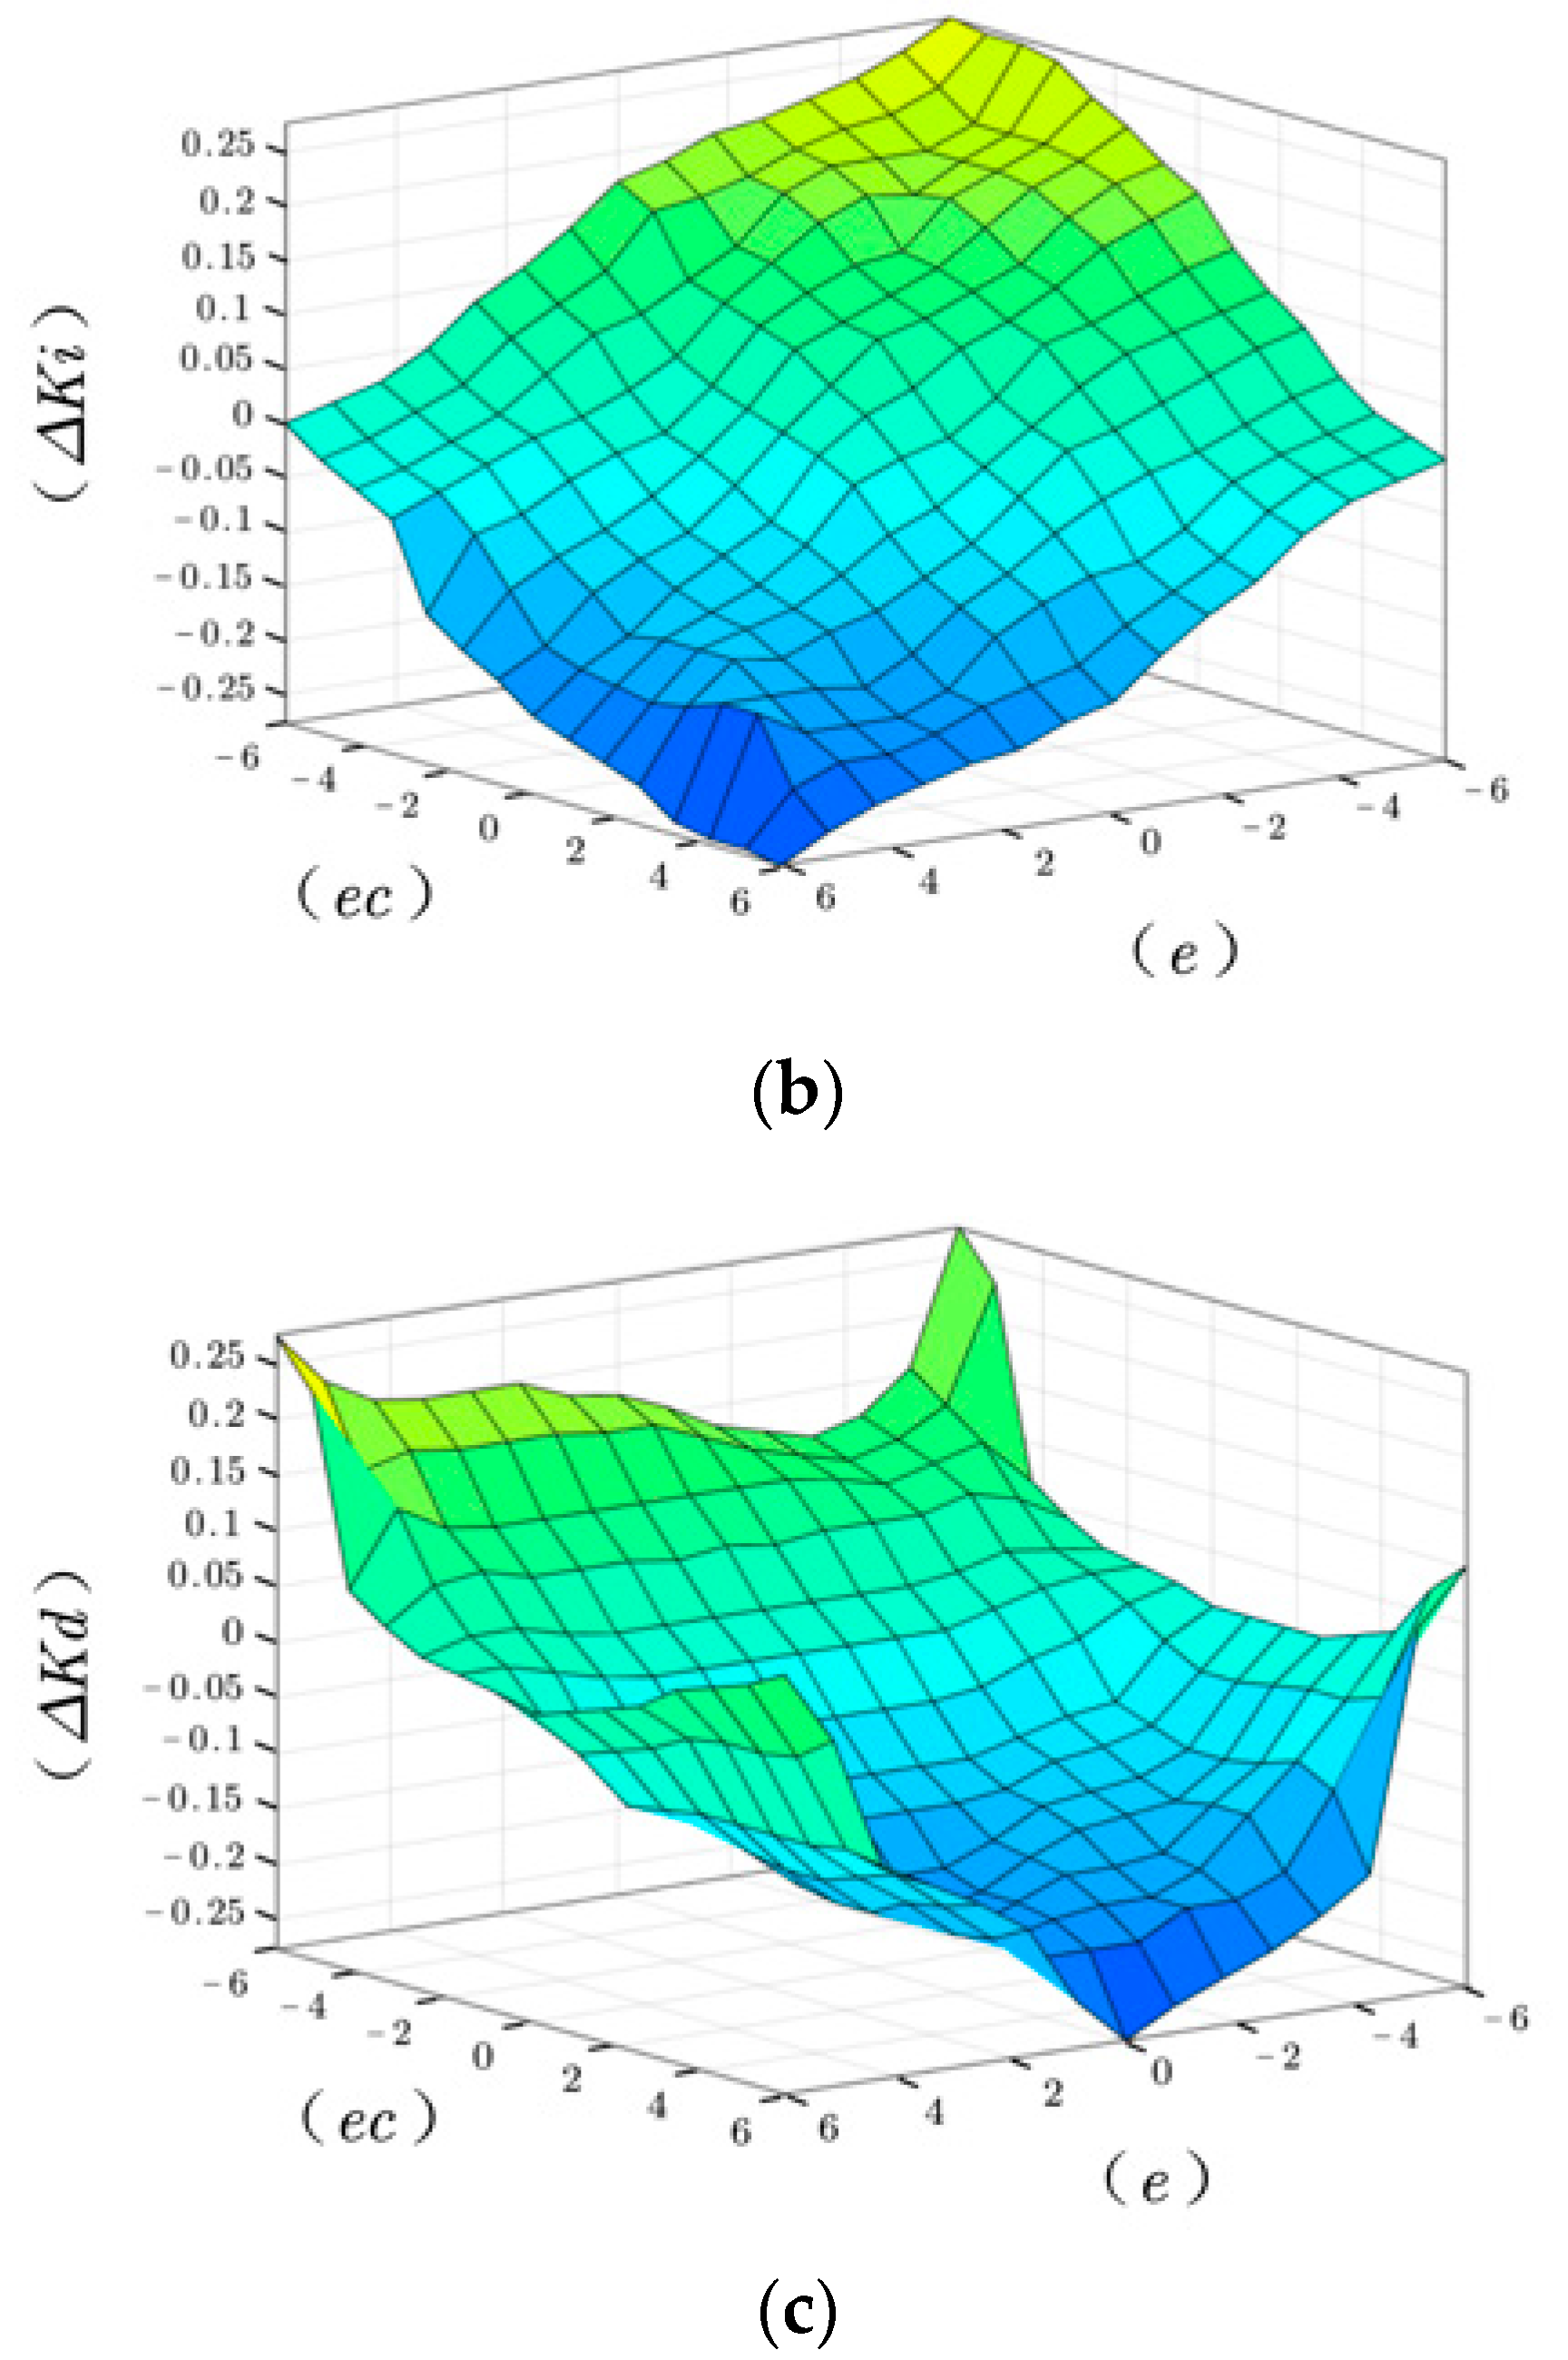
4.2.3. Fuzzy Rules Design

The fuzzy rules for the design output quantities Δ K p , Δ K i and Δ K d are summarized based on expert experience [27,28], as shown in Table 2.
The fuzzy inference surface of each output quantity is shown in Figure 10. It can be concluded that, when |e| is large, Δ K p should be considered larger, Δ K d as smaller, and Δ K i needs no adjustment. When |e| is medium, Δ K p should be considered smaller, and Δ K i , and Δ K d should be considered medium. When |e| is small, Δ K p and Δ K i should be increased appropriately and Δ K d should be kept as a medium.
According to the affiliation function of each fuzzy variable and fuzzy rule table, we designed the PID parameter adjustment algorithm using the fuzzy inference theory to obtain more accurate control parameters and improve the performance of the fuzzy control system. If Δ K p , Δ K i and Δ K d are the pre-tuned values of the PID controller’s three parameters, then the formulae for calculating the three are:
K p = K p ' + Δ K p
K i = K i ' + Δ K i
K d = K d ' + Δ K d

4.2.4. Inference and Defuzzification

We used the Zadeh approximation inference method based on fuzzy rules to complete the inference and obtain the fuzzy control quantity [29]. Due to its aggregate form, the system must be defuzzified to receive a clear control signal that drives the actuator. For a smooth control effect and convenient operation, we adopted the weighted average method and the calculation formula is as follows:
Z 0 = i = 1 n μ C Z i Z i i = 1 n μ C Z i
where Z 0 is the exact output value; Z i is the value corresponding to the fuzzy control quantity in the theoretical domain; and μ C Z i is the value of the affiliation degree corresponding to Z i .

5. Experiment and Analysis

5.1. Simulation Experiments

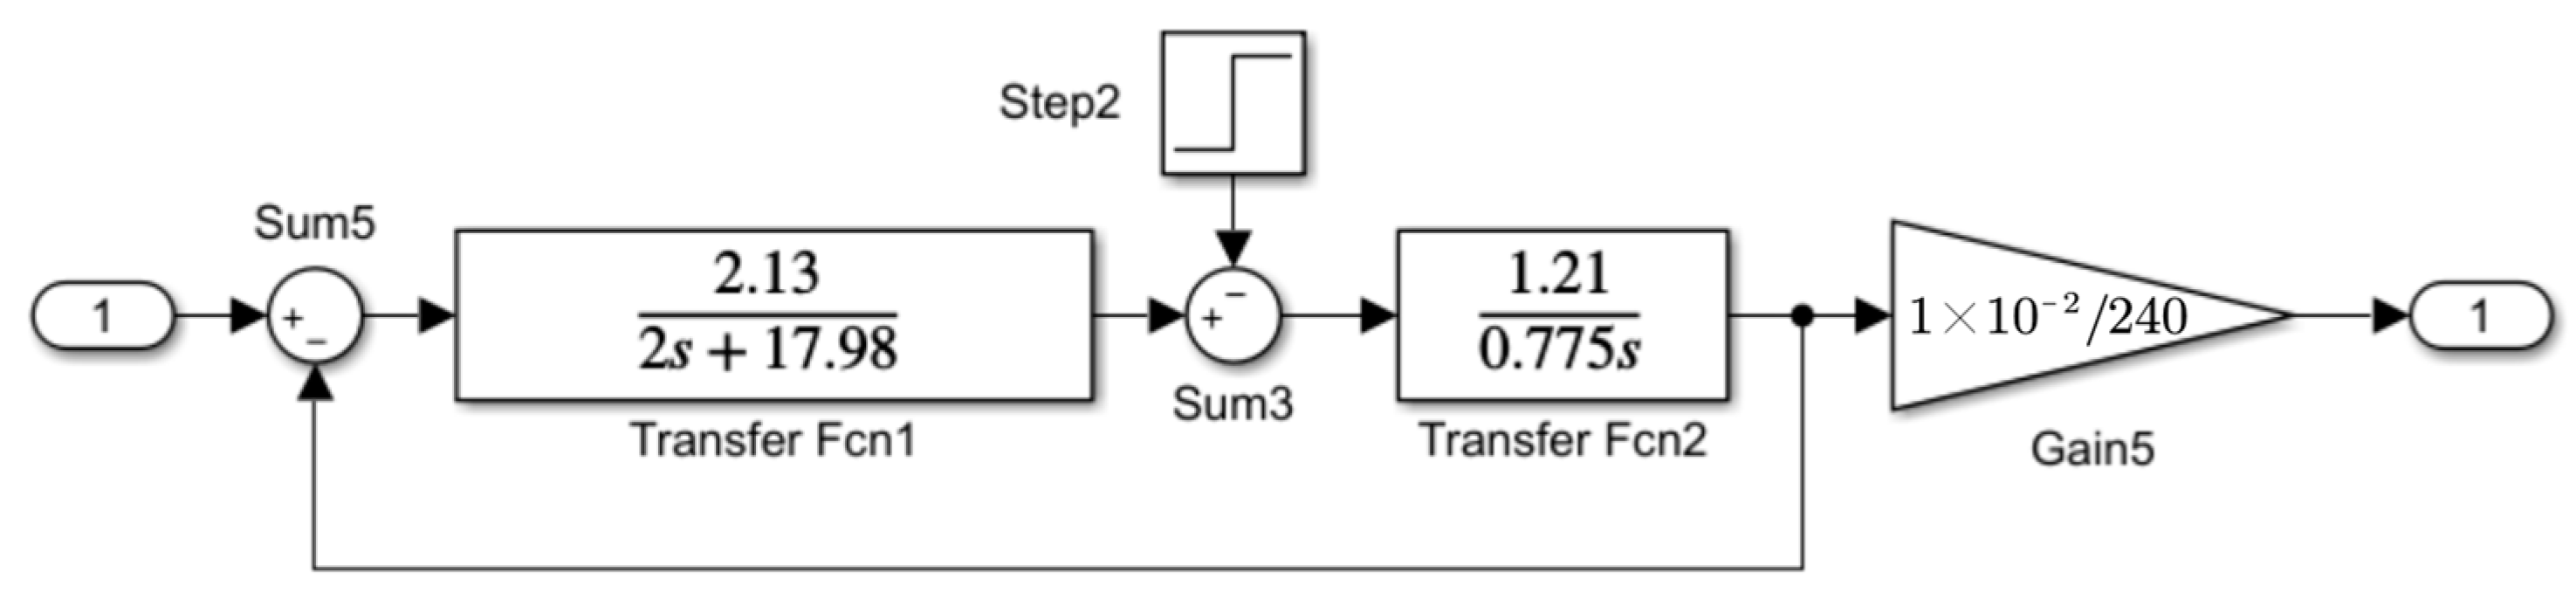
5.1.1. Pusher Voltage–Motor Speed Coupling Model

Electric actuators are a class of devices that convert the rotational motion of a motor into linear motion and comprise a motor, gear structure, screw, and other components. Hu et al. studied electric actuators’ synchronous control systems and derived the electric actuator simulation structure that forms the basis for the coupled actuator voltage–motor speed model in this paper (Figure 11) [30].
After the system outputs the motor speed, it converts it into the push rod retraction, joystick tilt angle and, finally, the harvester traveling speed. A second-order system to describe the controlled object can be approximated by neglecting secondary factors under certain accuracy conditions [31]. After data processing, the system transfer function is expressed as follows:
G s = 4531 s 2 + 0.335 s + 0.0108
The Bode plot in Figure 12 was plotted using MATLAB according to the transfer function. The ideal suppression of harmonics was in the high-frequency region, and resonant spikes were successfully suppressed at resonant frequencies. The gain margin of the system was approximately infinite and the phase margin was close to satisfying m π β π / 2 , β was the system damping ratio, and the above transfer function corresponds to a damping ratio of 1.675. Therefore, we could conclude that this closed-loop system’s accuracy and stability are high.

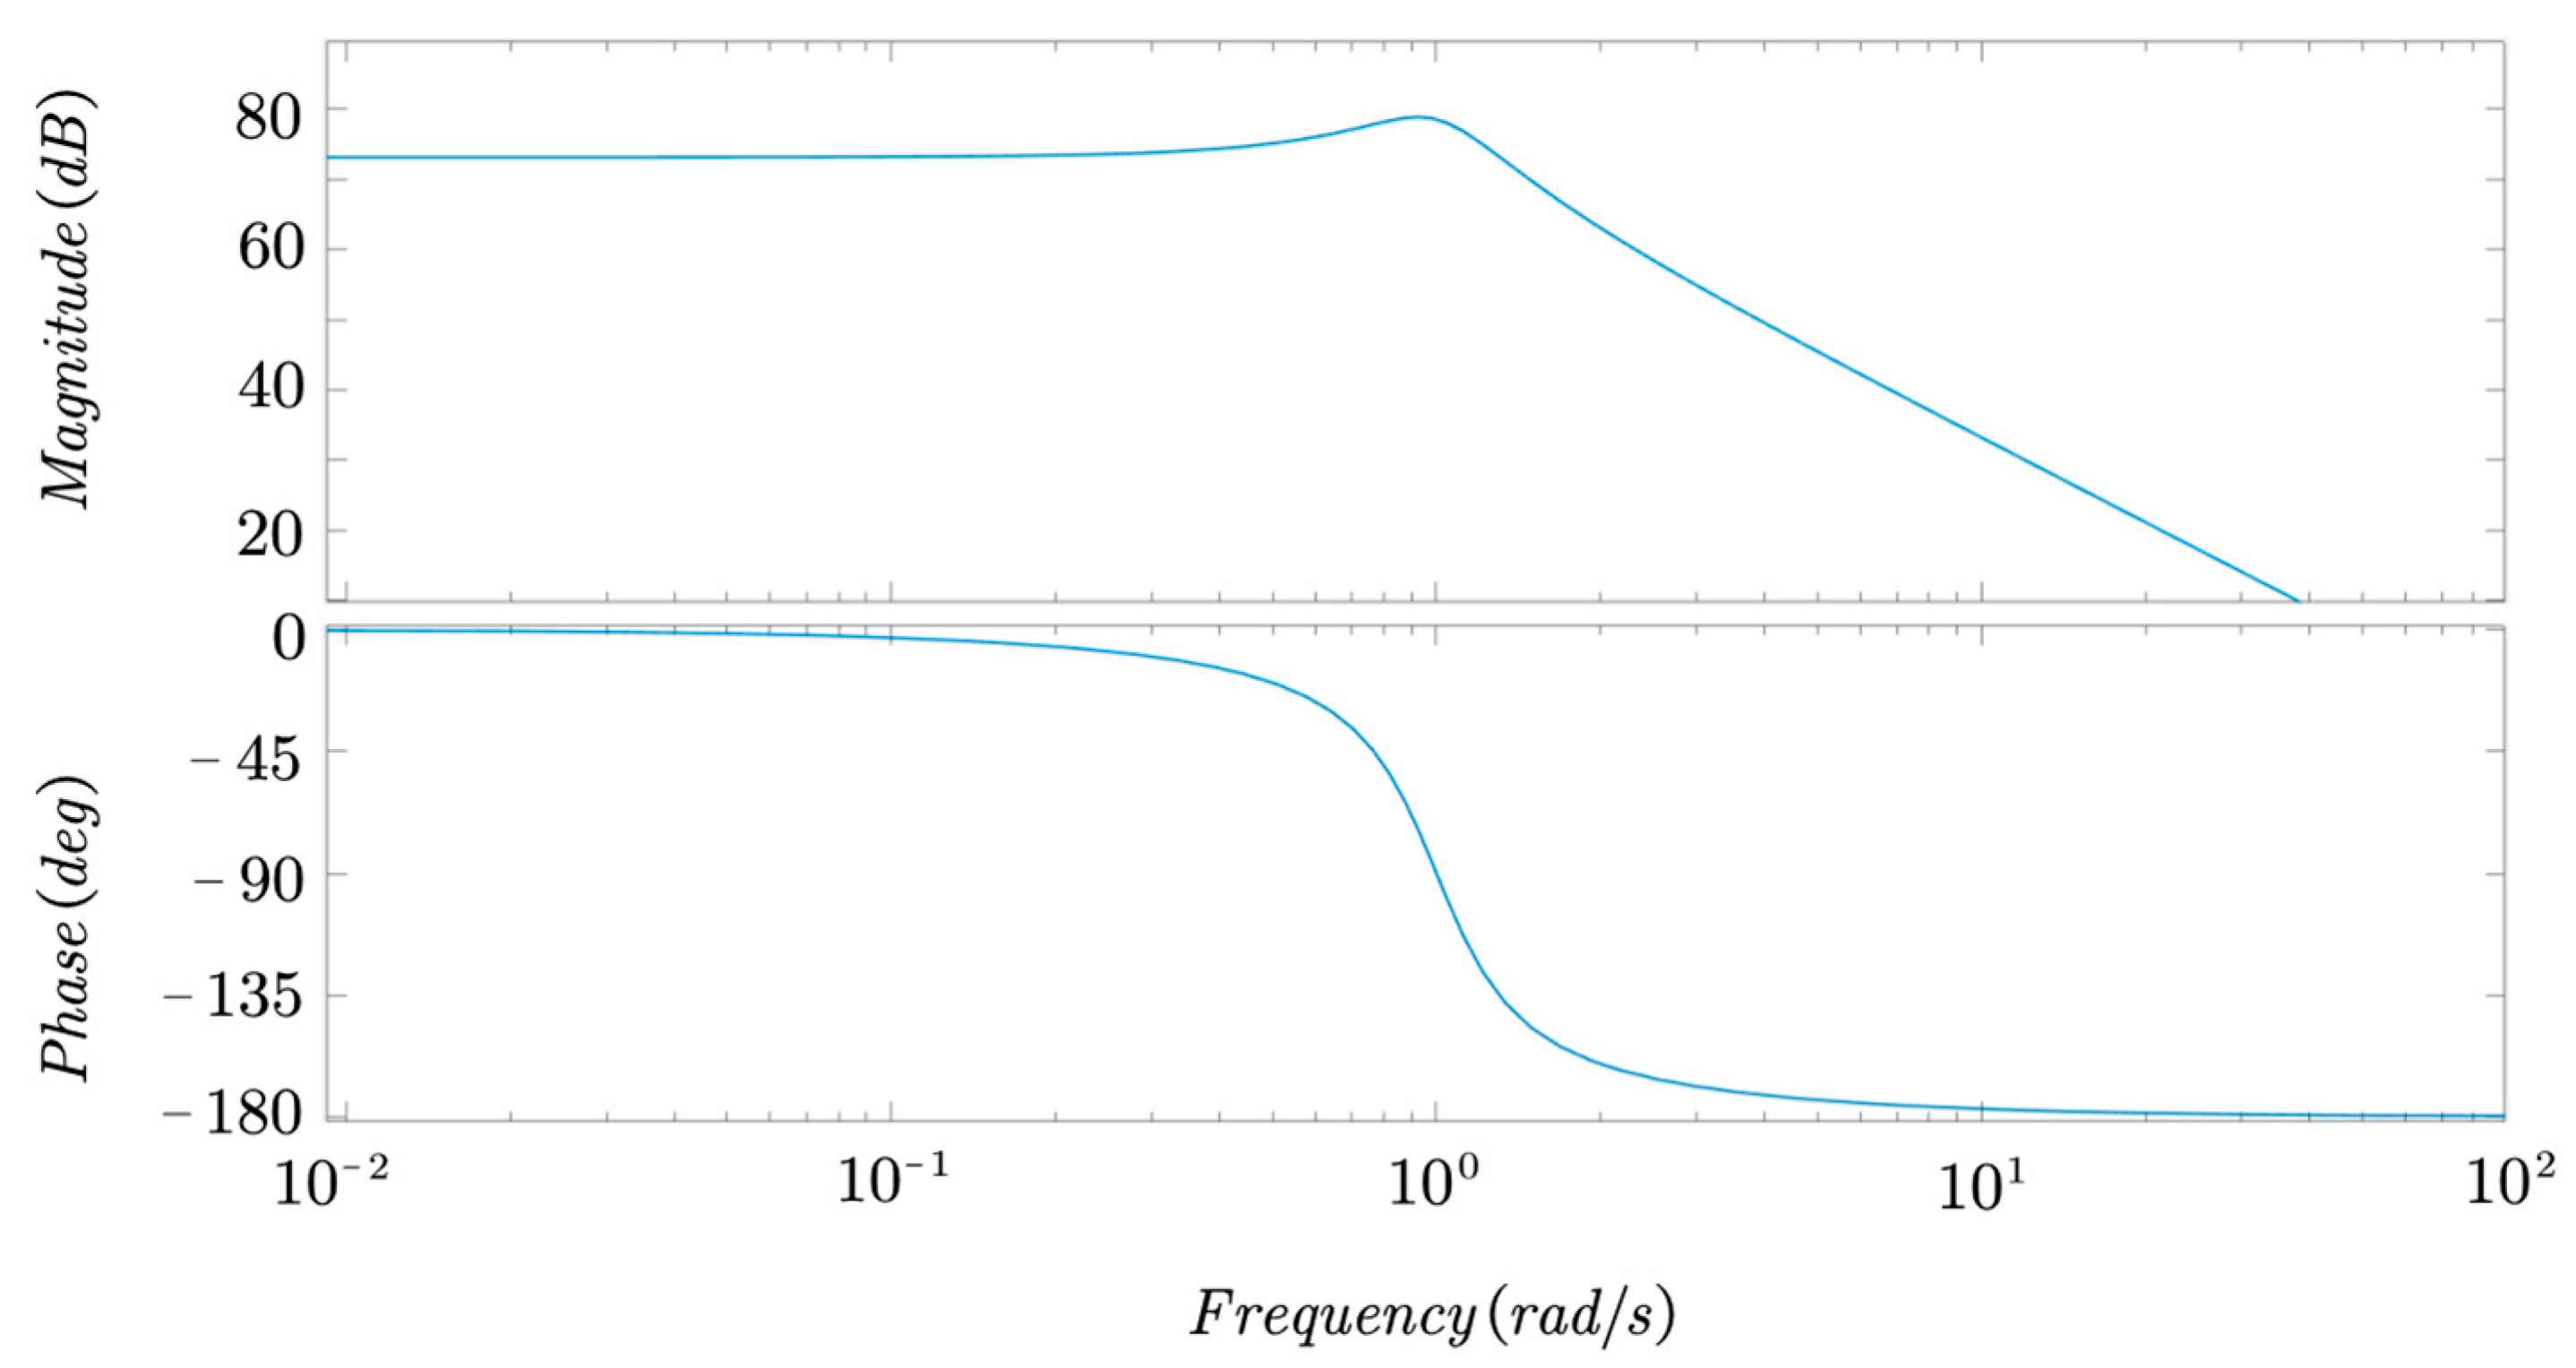
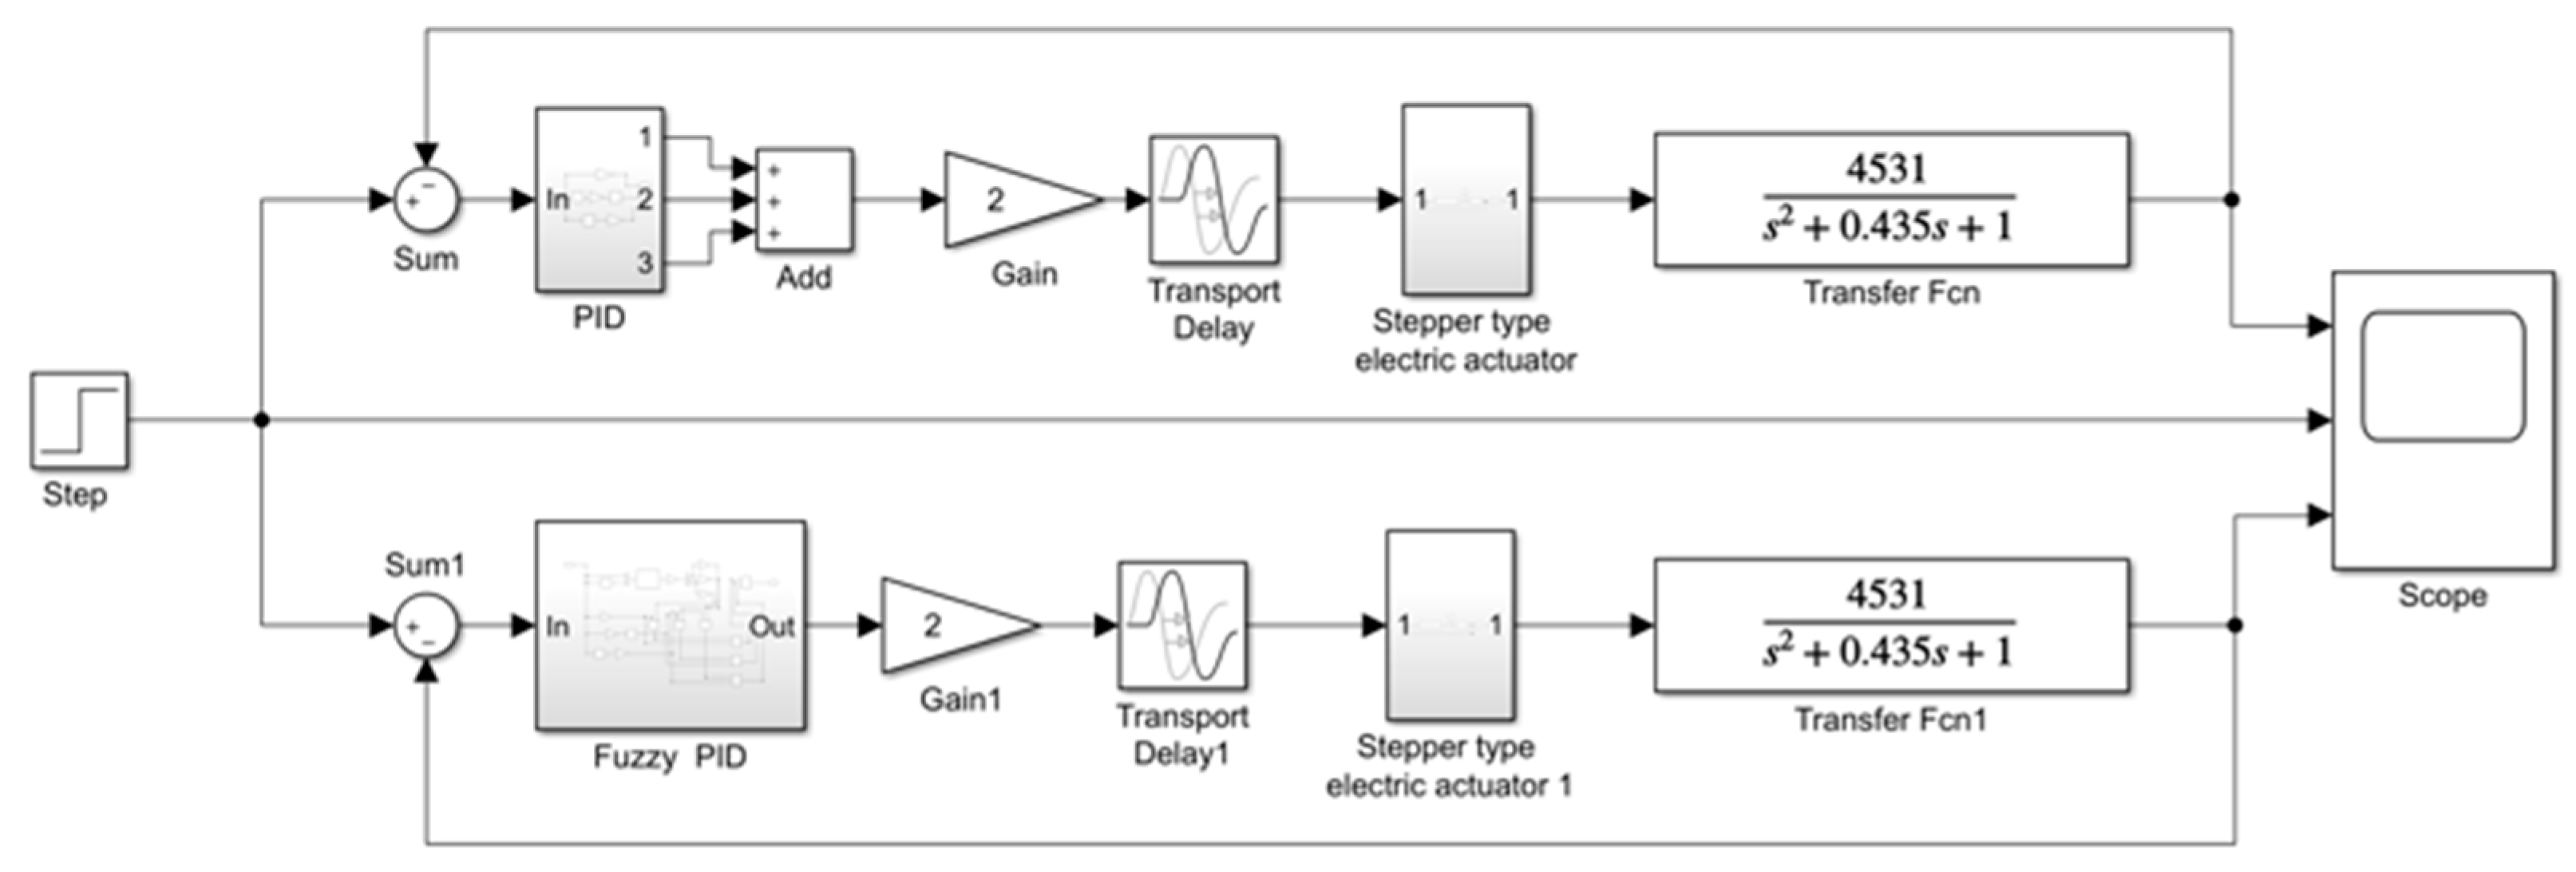
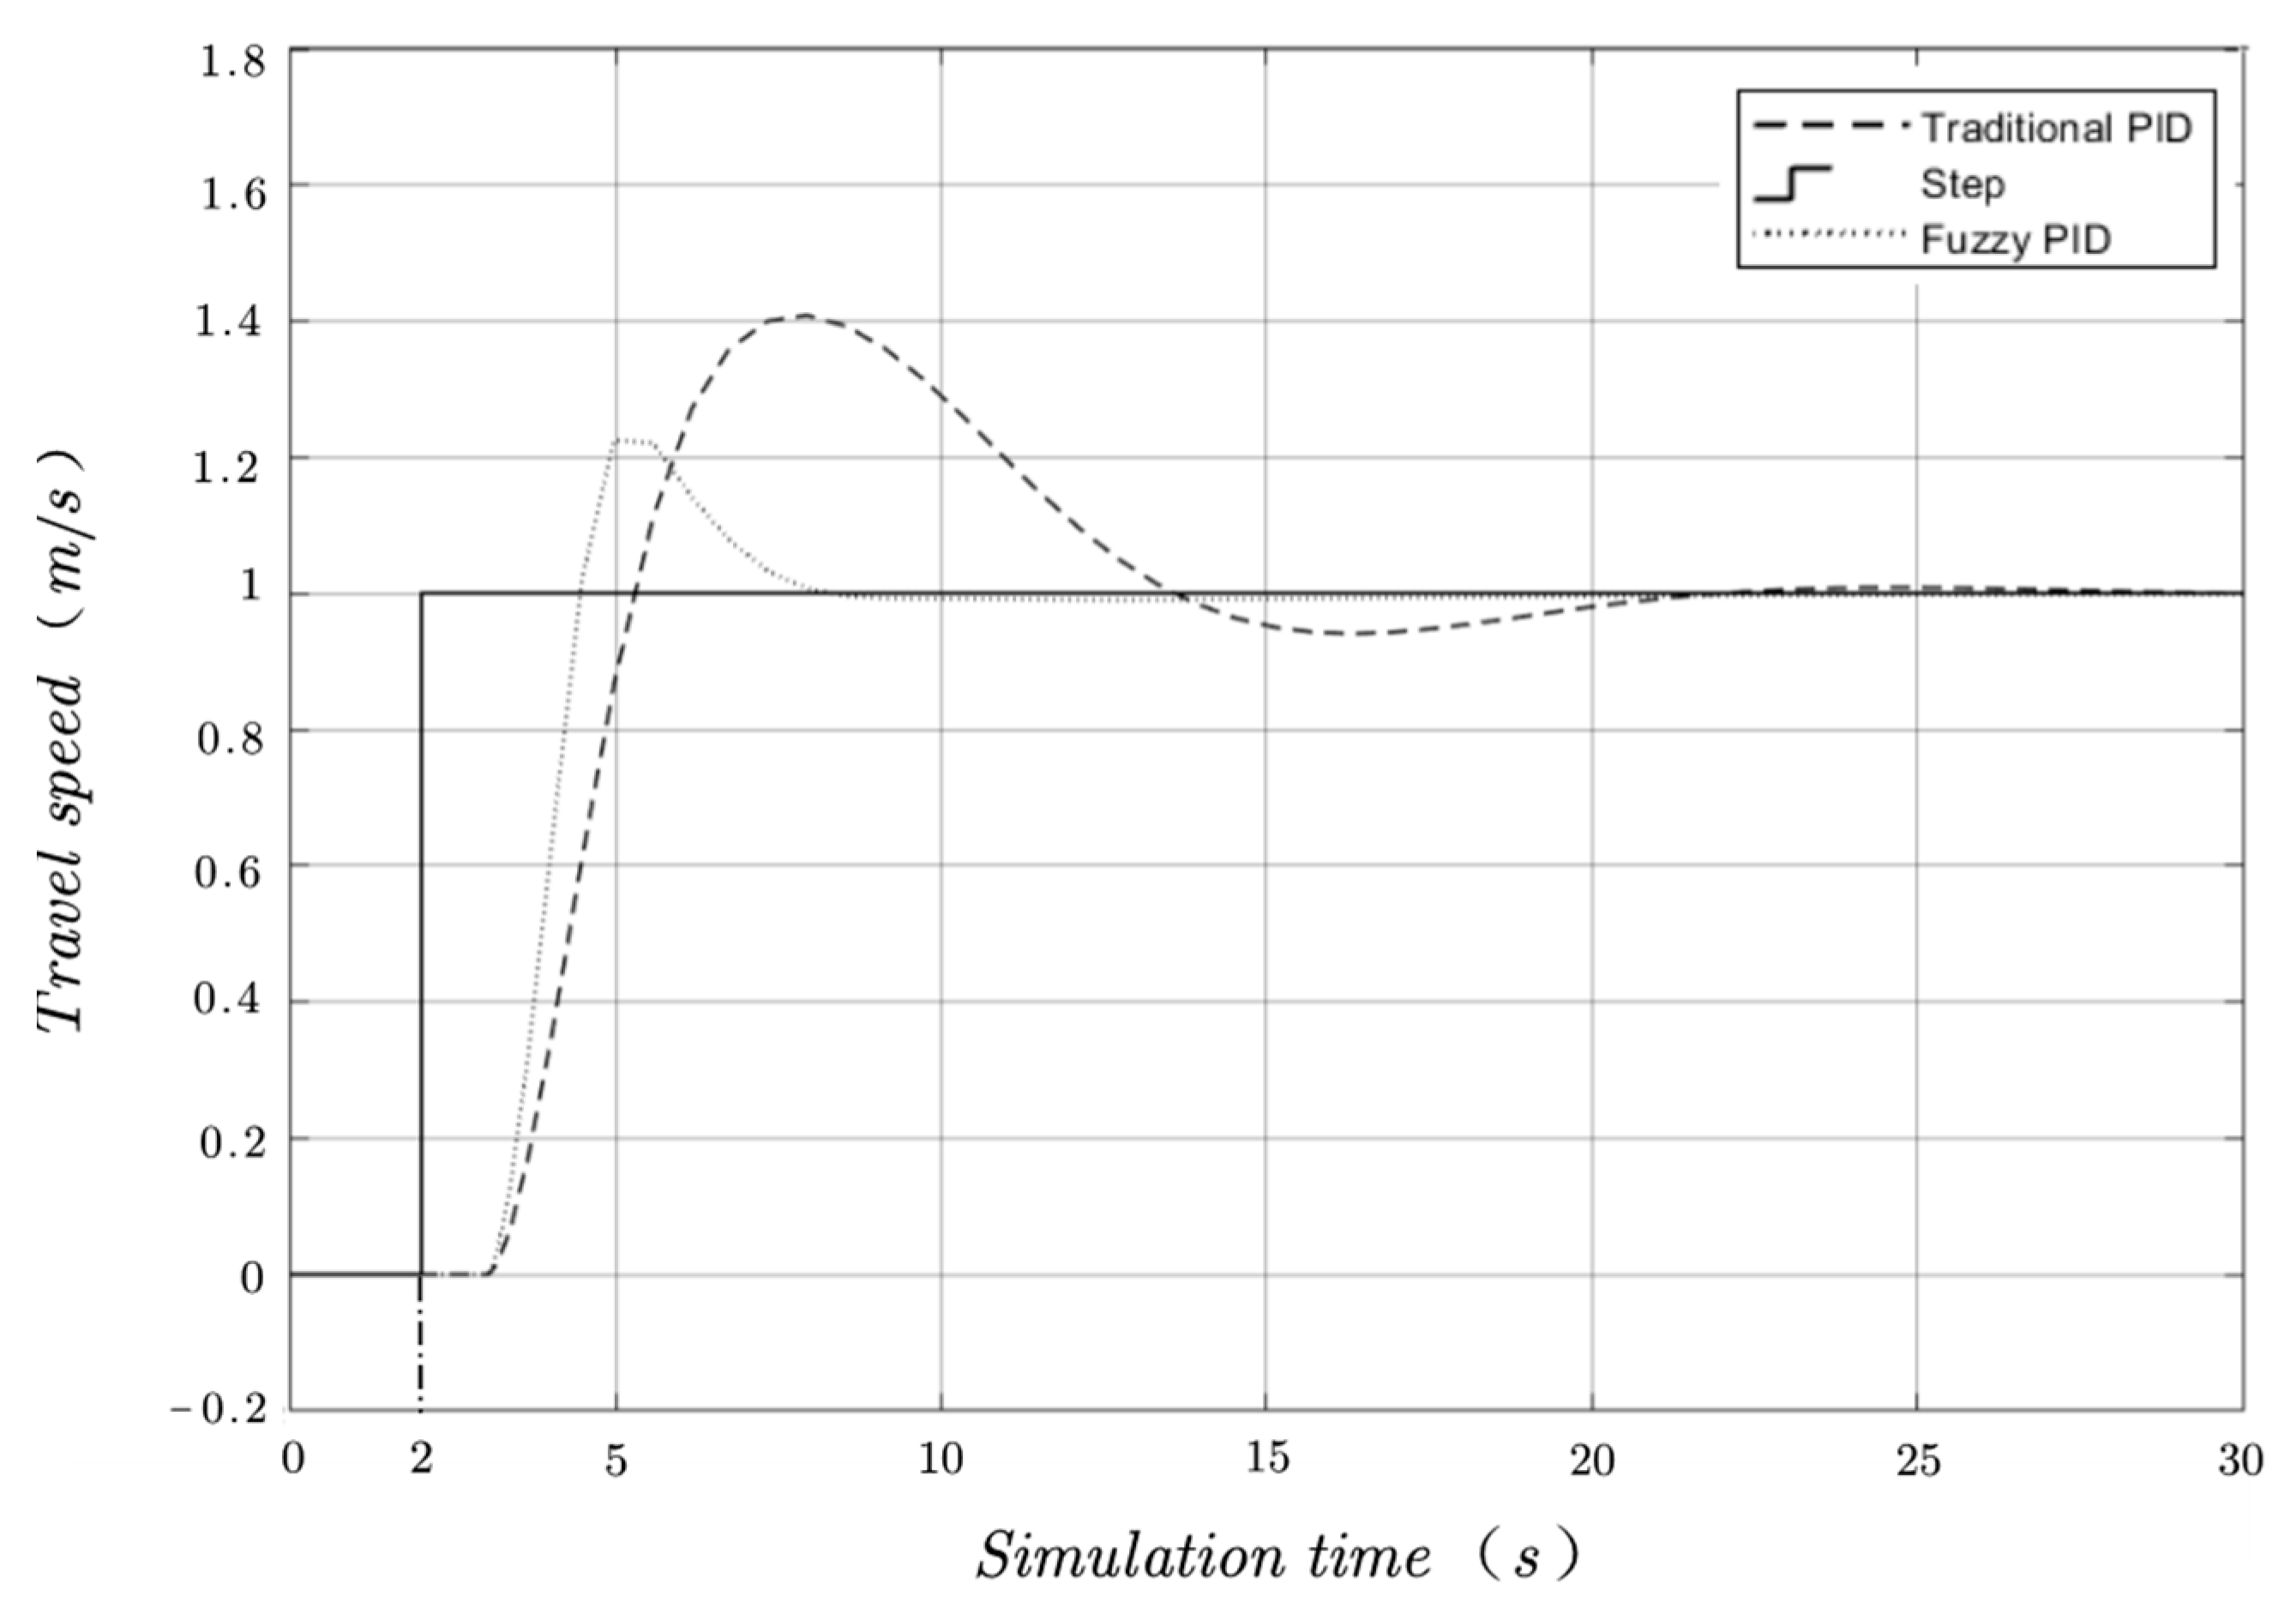
5.1.2. Simulation Comparison Test between Fuzzy PID and a Traditional PID System

The model for building a conventional PID and fuzzy PID controller is shown in Figure 13.
Based on the traditional PID and fuzzy PID controllers, we built the simulation model of the harvester’s adaptive traveling speed under the action of the two controllers, as shown in Figure 14.
The simulation test received a traveling speed step signal of 1 m/s as input, and we set the simulation time to 30 s. Figure 15 shows the adaptive simulation results of the traveling speed under two control algorithms. The results show the harvester’s traveling speed variation rise time under the conventional PID algorithm t r = 3.2 s, peak time t m = 5.2 s. The time to reach the steady state was slower at about 20 s, with a significant overshoot. The rise time corresponding to the fuzzy PID t r = 1.8 s, peak time t m = 3.2 s, had a shorter time to steady state, at about 5.5 s, with almost no oscillation.

5.2. Field Trials

5.2.1. Trial Conditions

To verify the regulation effect of the Coupling System’s adaptive algorithm, a field trial was conducted in July 2022 in Yintang Township, Shuangfeng County, Loudi City, Hunan Province, China. The test area was 400 m2, and a buffer zone of 5 m was set up. We investigated the field conditions in the area before the test. The rice variety was Jingliangyou 1125, with plant rows spaced about 30 cm apart and distributed evenly. It had an average height of about 970 mm, no overturning, and approximately the same water content. The terrain was flat, with no obvious potholes. The harvesting trial site is shown in Figure 16.

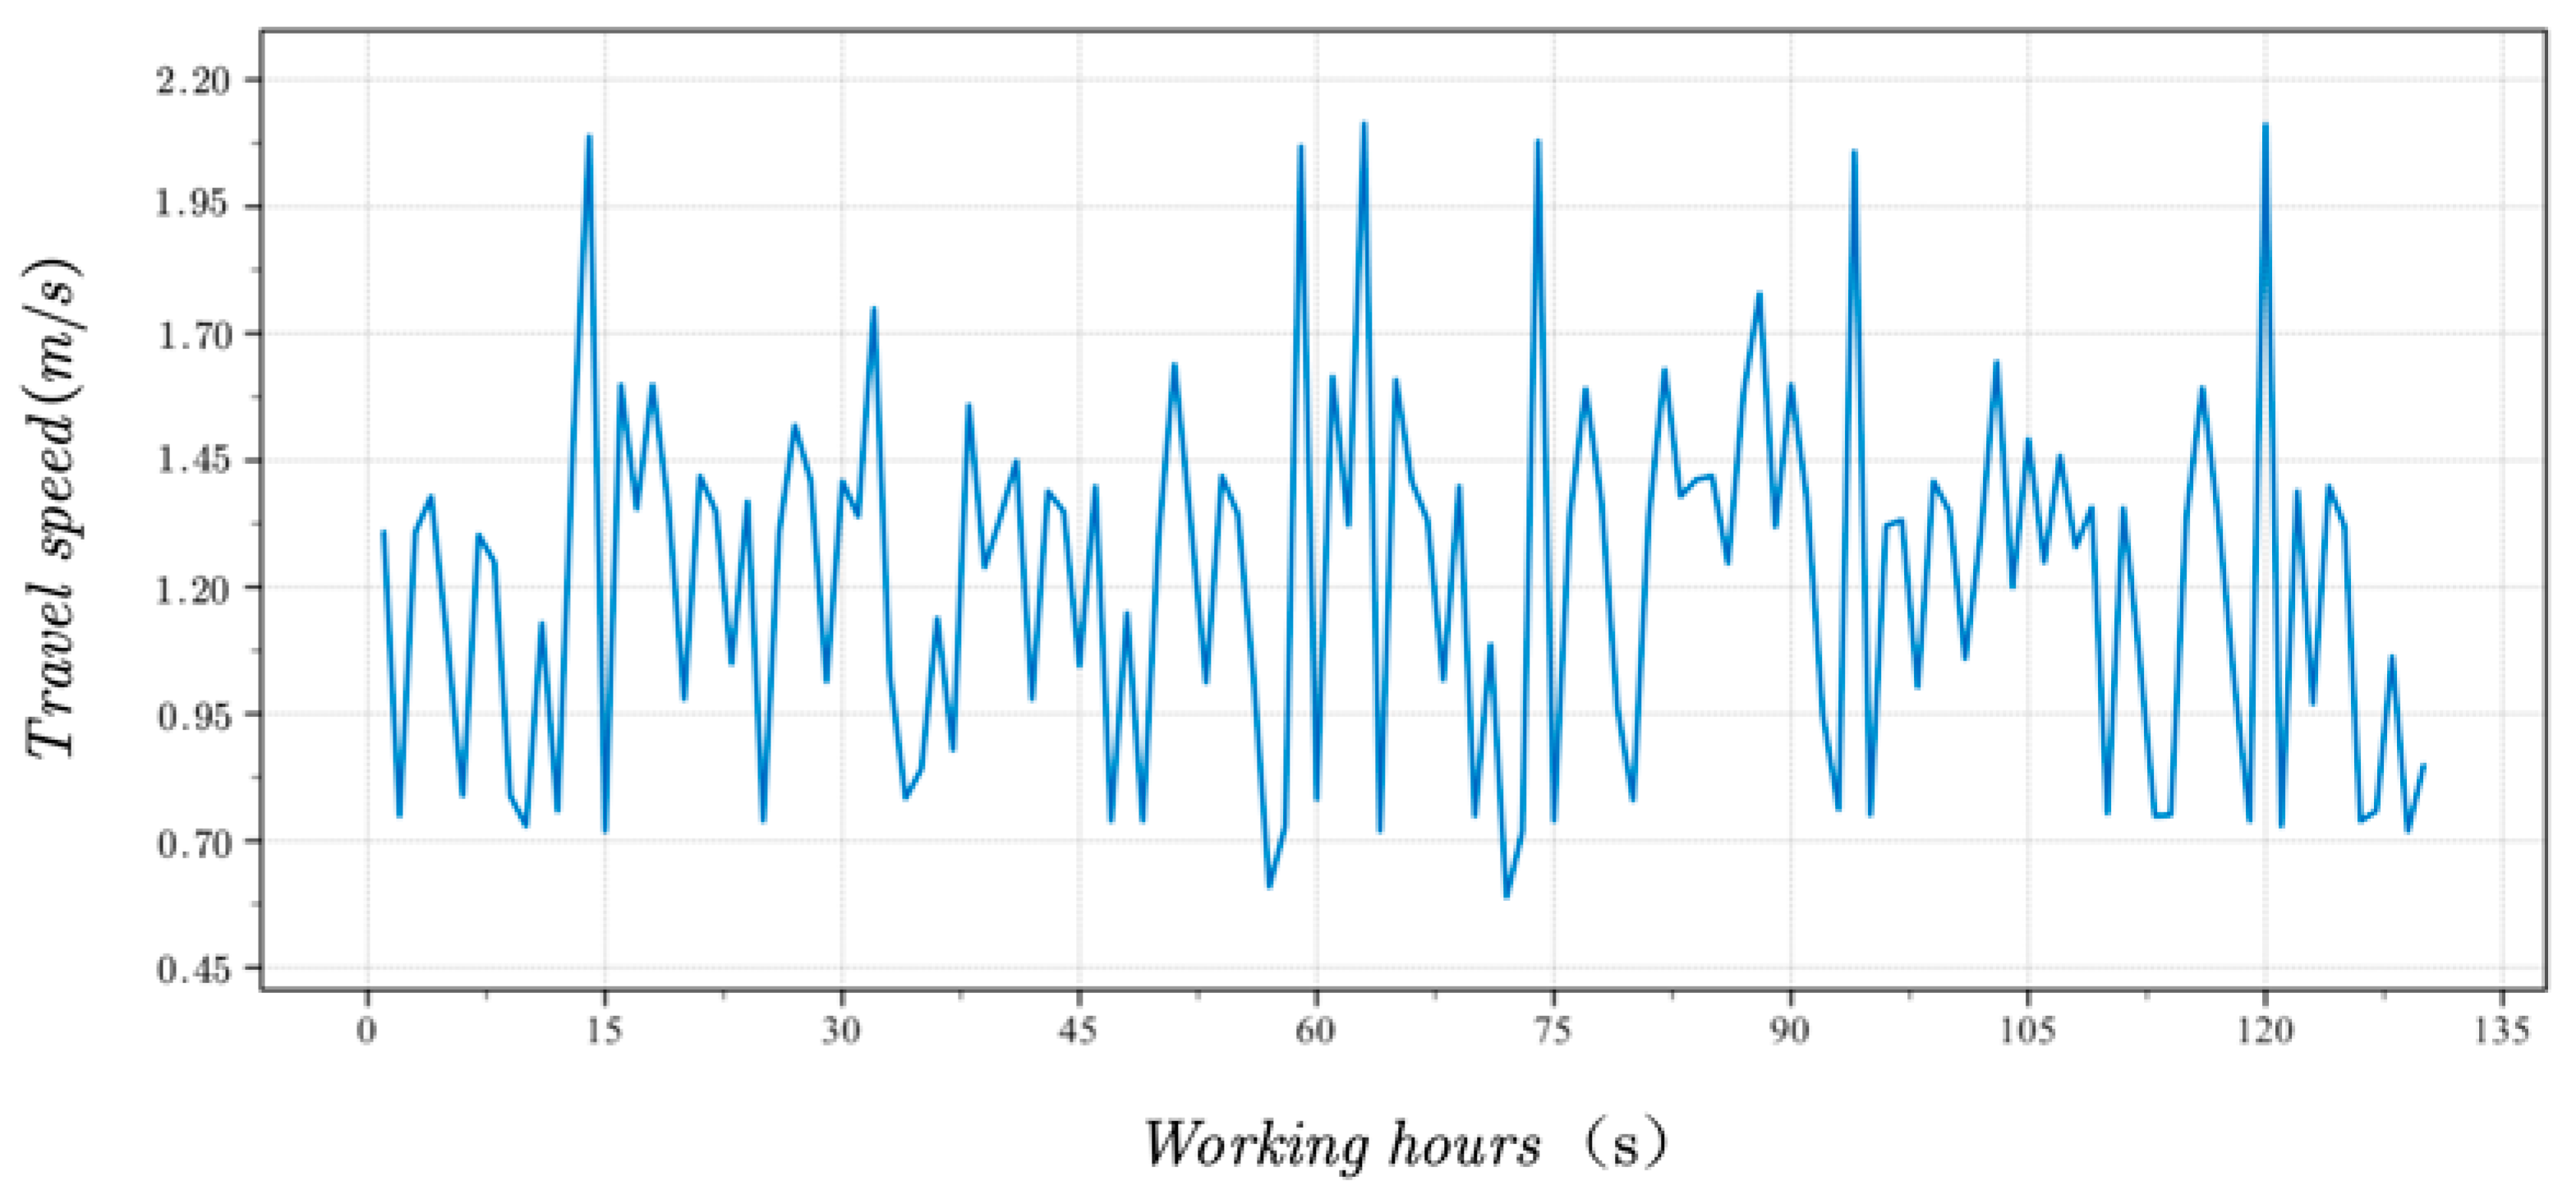
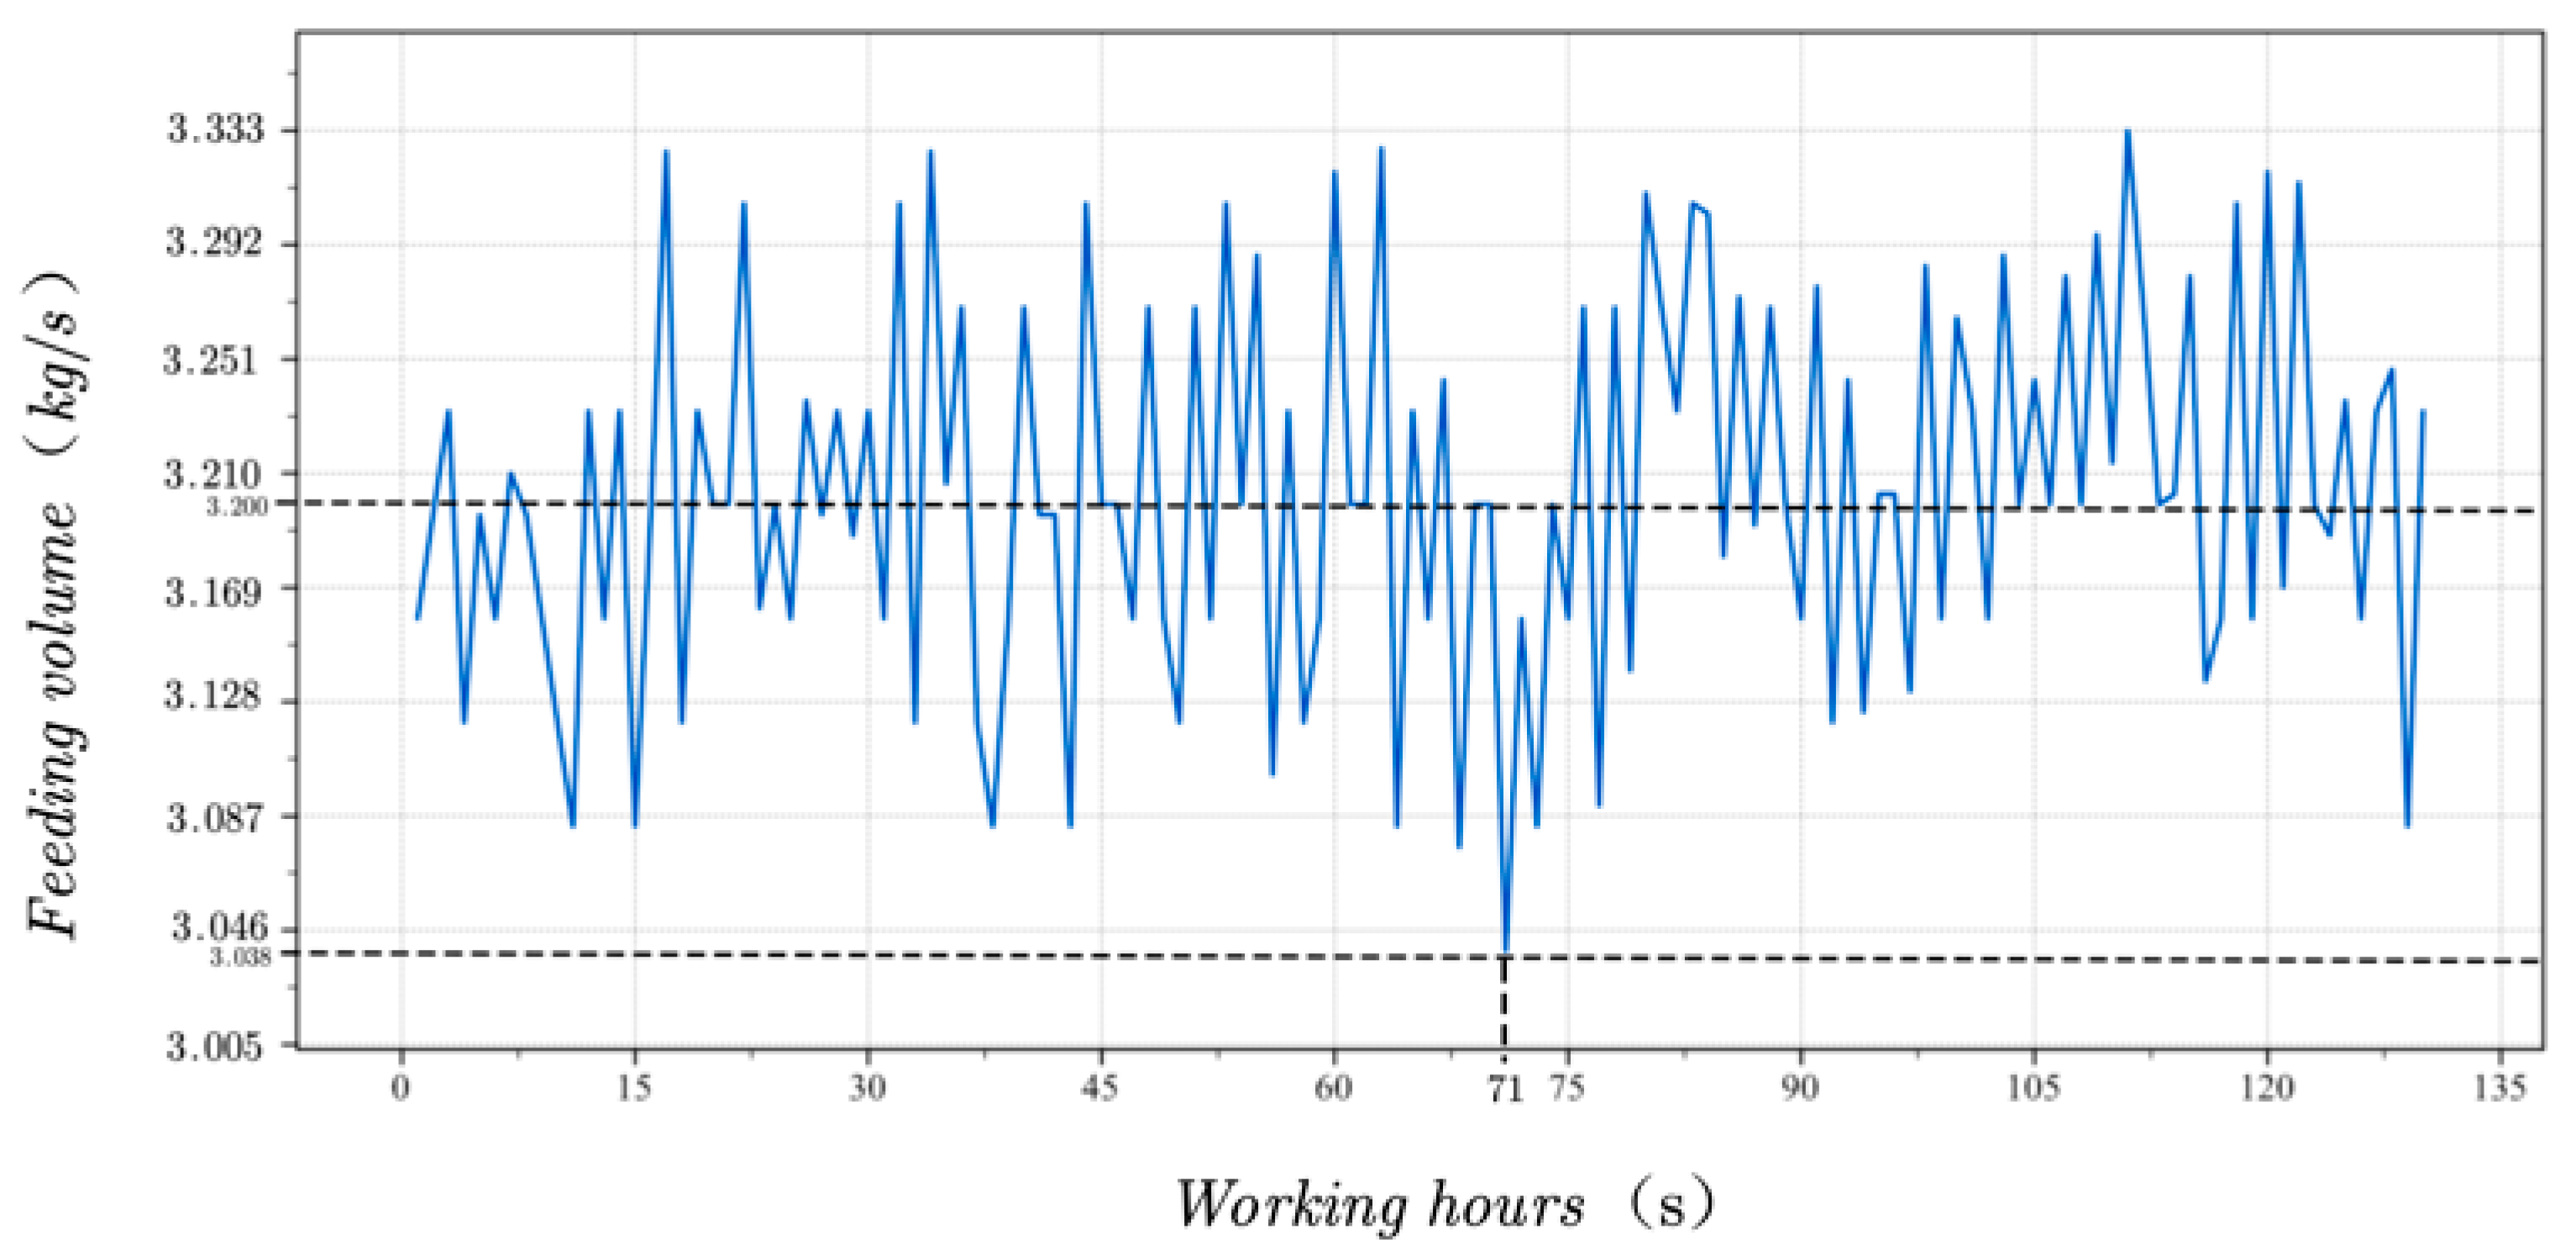
5.2.2. Experiment and Analysis

We used the following experimental method, since we only completed the electrification of the electric actuator and related hardware arrangement and did not make functional modifications to other modules. A person with rice harvesting experience drove the modified car to the test area and performed operations such as changing direction and stabilizing the height of the cutting platform while ensuring that changes in the harvester’s feeding volume were mainly affected by traveling speed. The 4LZ-3.2 Z full-feed grain combine harvester had a screen display function that displayed the traveling speed in real-time during operation. The industrial control computer read the harvester bridge’s output voltage signal and the Hall-type speed sensor’s pulse signal and substituted them into the power shaft of the tilting conveyor model to obtain the current feeding volume.
The test was timed with a stopwatch. Rice was harvested in 130.43 s from the measurement area with no blockage in the machinery’s operation process. Data starting at 0.43 s were excluded and rounded to 130 s to facilitate the subsequent data processing and analysis. The time domain diagram of the traveling speed is shown in Figure 17. The time domain diagram of the feeding volume is shown in Figure 18.
The response accuracy, speed and stability of the control system were evaluated by analyzing the time-domain curve characteristics of the feeding volume. In Figure 18, the maximum deviation of the feed curve from the rated feed (3.2 kg/s) occurred at 71 s with a value of 3.038 kg/s, corresponding to a maximum error of 0.162, an error rate of 5.2%, and an average error rate of 3.4% for the whole process. These results indicate the system’s high response accuracy. As seen in the curve change trend, most data points were between 3.17 and 3.23, indicating the system’s good stability. Compared to Figure 17, the feeding volume and traveling speed changes during the operation were nearly matched, indicating the system’s quick and effective response.

6. Conclusions and Outlook

In this paper, we proposed an adaptive algorithm based on fuzzy PID controls for coupled feeding volume–traveling speed systems in rice harvesters in southern China. It is suitable for rice harvesting needs in southern China, where harvesting areas are scattered across hilly and mountainous areas. The harvester’s speed could be adjusted instantly according to changes in rice feeding volume during the operation, which it subsequently optimized. Our experimental analysis showed that the harvester’s adaptive traveling speed algorithm based on fuzzy PID controls was better than the traditional PID control method in many control indexes. Our field test analysis showed that a harvester regulated by the algorithm could adapt to changing field operation conditions more quickly and stabilized the feeding volume in a reasonable range to meet the needs of practical applications. Our study can provide rice harvesters with a reference for designing threshing and loss reduction equipment in southern China.
The harsh operating environment in the field challenged the sensor’s stability, and the feeding volume detection error was significant. In the future, we must continue researching methods to improve the stability of sensor detection, adjust the acquisition circuit’s filtering effect, optimize data analysis and processing methods, and improve detection accuracy.
The system is suitable for modifying small- and medium-sized combine harvesters in hilly mountainous areas. Considering the lighter mass of the small- and medium-sized combine harvesters, as well as the limited optimization of their structures, the noise and vibration were more severe during the driving process, causing deviances in the system detection and expanding control. In the future, system improvement should focus on reducing the influence of vibration and noise on the system.
In order to improve the performance of rice harvesters and develop more effective and efficient control methods, a long-term task of this research project is to compare the fuzzy PID control strategies proposed in this paper with each other and with other control methods. We plan to conduct both quantitative and qualitative studies to achieve this goal. For the quantitative study, we will design experiments to compare the performance of the fuzzy PID control system with other control methods, such as sliding mode control and model predictive control. We will measure various performance metrics, including fuel consumption, harvest efficiency and crop damage, to assess the effectiveness of each control method. For the qualitative study, we will conduct surveys and interviews with farmers and operators to gather feedback on ease of use, reliability and their overall satisfaction with each control method.

Author Contributions

Conceptualization, L.D. and T.L.; methodology, T.L.; software, L.D.; validation, L.D. and J.Z.; formal analysis, L.D. and W.Y.; investigation, L.D. and A.Q.; resources, T.L., P.J. and F.X.; data curation, L.D. and J.Z.; writing—original draft preparation, L.D.; writing—review and editing, L.D. and T.L.; visualization, L.D.; supervision, T.L. and F.X.; project administration, T.L. and P.J.; funding acquisition, T.L., P.J. and F.X. All authors have read and agreed to the published version of the manuscript.

Funding

This research was funded by the Hunan Education Department Scientific Research Project (No. 21C0126), the Hunan Agricultural Machinery Equipment and Technological Innovation R&D Project (Xiang Cai Nong Zhi [2020] No.107) and the Hunan Agricultural Machinery Equipment and Technological Innovation R&D Project (Xiang Cai Nong Zhi [2021] No.47).

Institutional Review Board Statement

Not applicable.

Informed Consent Statement

Not applicable.

Data Availability Statement

Not applicable.

Conflicts of Interest

The authors declare no conflict of interest.

References

  1. Xu, F.; Zhang, L.; Zhou, X.; Guo, X.; Zhu, Y.; Liu, M.; Xiong, H.; Jiang, P. The ratoon rice system with high yield and high efficiency in China: Progress, trend of theory and technology. Field Crops Res. 2021, 272, 108282. [Google Scholar] [CrossRef]
  2. Li, C.; Bremer, P.; Harder, M.K.; Lee, M.S.; Parker, K.; Gaugler, E.C.; Mirosa, M. A systematic review of food loss and waste in China: Quantity, impacts and mediators. J. Environ. Manag. 2021, 303, 114092. [Google Scholar] [CrossRef] [PubMed]
  3. Li, Z.; Wang, X.; Li, J.; Zhang, Q. Deep attributed network representation learning of complex coupling and interaction. Knowl.-Based Syst. 2021, 212, 106618. [Google Scholar] [CrossRef]
  4. Da Silveira, F.; Lermen, F.H.; Amaral, F.G. An overview of agriculture 4.0 development: Systematic review of descriptions, technologies, barriers, advantages, and disadvantages. Comput. Electron. Agric. 2021, 189, 106405. [Google Scholar] [CrossRef]
  5. Sood, S.; Singh, H. Computer vision and machine learning based approaches for food security: A review. Multimed. Tools Appl. 2021, 80, 27973–27999. [Google Scholar] [CrossRef]
  6. Sabzi, S.; Abbaspour-Gilandeh, Y.; Javadikia, H. Machine vision system for the automatic segmentation of plants under different lighting conditions. Biosyst. Eng. 2017, 161, 157–173. [Google Scholar] [CrossRef]
  7. Federico, D.; Matteo, C.; Daniele, D.A.; Andrea, A.; Francesco, T.; Matteo, S.S. Modeling, control design and experimental automatic calibration of a leveling system for combine harvesters. Control Eng. Pract. 2023, 132, 105411. [Google Scholar]
  8. Nevavuori, P.; Narra, N.; Lipping, T. Crop yield prediction with deep convolutional neural networks. Comput. Electron. Agric. 2019, 163, 104859. [Google Scholar] [CrossRef]
  9. Ma, W.; Zhu, Z.; Zhou, X. Agricultural mechanization and cropland abandonment in rural China. Appl. Econ. Lett. 2022, 29, 526–533. [Google Scholar] [CrossRef]
  10. Li, R.; Cheng, Y.; Xu, J.; Li, Y.; Ding, X.; Zhao, S. Research on on-line monitoring system of hydraulic actuator of combine harvester. Processes 2022, 10, 35. [Google Scholar] [CrossRef]
  11. Yang, Z.; Wang, H.; Sun, H.; Wang, P.; Cao, Q. Experimental Study on Electric Harvesting of Combine Harvester. J. Phys. Conf. Ser. 2022, 2218, 012064. [Google Scholar] [CrossRef]
  12. Wang, G.; Wang, L.; Yang, Y.; You, X. Optimal Design of Harvesting Speed and Forward Speed of Harvester Based on Adaptive Control System. J. Sens. 2022, 2022, 4176942. [Google Scholar] [CrossRef]
  13. Chen, J.; Lian, Y.; Zou, R.; Zhang, S.; Ning, X.; Han, M. Real-time grain breakage sensing for rice combine harvesters using machine vision technology. Int. J. Agric. Biol. Eng. 2020, 13, 194–199. [Google Scholar] [CrossRef]
  14. Kounalakis, T.; Triantafyllidis, G.A.; Nalpantidis, L. Deep learning-based visual recognition of rumex for robotic precision farming. Comput. Electron. Agric. 2019, 165, 104973. [Google Scholar] [CrossRef]
  15. Saleem, M.H.; Potgieter, J.; Arif, K.M. Automation in agriculture by machine and deep learning techniques: A review of recent developments. Precis. Agric. 2021, 22, 2053–2091. [Google Scholar] [CrossRef]
  16. Darwin, B.; Dharmaraj, P.; Prince, S.; Popescu, D.E.; Hemanth, D.J. Recognition of bloom/yield in crop images using deep learning models for smart agriculture: A review. Agronomy 2021, 11, 646. [Google Scholar] [CrossRef]
  17. Liu, T.; Ma, Y.; Yang, W.; Ji, W.; Wang, R.; Jiang, P. Spatial-temporal interaction learning based two-stream network for action recognition. Inf. Sci. 2022, 606, 864–876. [Google Scholar] [CrossRef]
  18. Looh, G.A.; Xie, F.; Zhang, Z.; Mangeh Iii, F.C. Development of Small Agricultural Machines in China: 4LZ–0.8 Mini Combine Harvester. Development 2019, 6, 9849–9854. [Google Scholar]
  19. Li, H. Research and Prospect of crawler chassis of agricultural machinery in mountainous and hilly areas. In Proceedings of the 2021 International Conference on Control and Intelligent Robotics, Guangzhou, China, 18–20 June 2021. [Google Scholar]
  20. Chapagain, T.; Raizada, M.N. Agronomic challenges and opportunities for smallholder terrace agriculture in developing countries. Front. Plant Sci. 2017, 8, 331. [Google Scholar] [CrossRef] [Green Version]
  21. Wang, H.; Li, Y.; Qing, Y. Current status and prospect of research on combine harvester header for rape. IOP Conf. Ser. Earth Environ. Sci. 2021, 742, 012001. [Google Scholar] [CrossRef]
  22. Li, W.; Shuo, L.; Dianji, L.; Ghay, E. Multi-Sensor Signal Acquisition and Data Processing Analysis of Combine Harvester. INMATEH-Agric. Eng. 2021, 63, 335–344. [Google Scholar]
  23. Jiang, T.; Guan, Z.; Li, H.; Mu, S.; Wu, C.; Zhang, M.; Wang, G.; Chen, X. A feeding quantity monitoring system for a combine harvester: Design and experiment. Agriculture 2022, 12, 153. [Google Scholar] [CrossRef]
  24. Sun, Y.; Liu, R.; Ou, H.; Zhang, Z.; Zhang, M.; Li, H. Analysis and comparison of feed rate detection methods of combine harvester based on power detection. Trans. Chin. Soc. Agric. Mach. 2020, 5, 5. [Google Scholar]
  25. Zhao, R.; Qin, D.; Chen, B.; Wang, T.; Wu, H. Thermal Management of Fuel Cells Based on Diploid Genetic Algorithm and Fuzzy PID. Appl. Sci. 2023, 13, 520. [Google Scholar] [CrossRef]
  26. Borase, R.P.; Maghade, D.K.; Sondkar, S.Y.; Pawar, S.N. A review of PID control, tuning methods and applications. Int. J. Dyn. Control 2021, 9, 818–827. [Google Scholar] [CrossRef]
  27. Maghfiroh, H.; Ramelan, A.; Adriyanto, F. Fuzzy-PID in BLDC Motor Speed Control Using MATLAB/Simulink. J. Robot. Control JRC 2022, 3, 8–13. [Google Scholar] [CrossRef]
  28. Chi, K.; Hsiao, Y.; Chen, C. Robust Feedback Linearization Control Design for Five-Link Human Biped Robot with Multi-Performances. Appl. Sci. 2023, 13, 76. [Google Scholar] [CrossRef]
  29. Li, F.; Shang, C.; Li, Y.; Yang, J.; Shen, Q. Approximate reasoning with fuzzy rule interpolation: Background and recent advances. Artif. Intell. Rev. 2021, 54, 4543–4590. [Google Scholar] [CrossRef]
  30. Hu, H.; Zha, M.; Chang, L.; Kong, W. Design of Double Redundancy Controller for Electric Actuator Based on Dual three-phase PMSM. In Proceedings of the 2021 IEEE 2nd China International Youth Conference on Electrical Engineering (CIYCEE), Chengdu, China, 15–17 December 2021. [Google Scholar]
  31. Sain, D.; Mohan, B.M. Modeling, simulation and experimental realization of a new nonlinear fuzzy PID controller using Center of Gravity defuzzification. ISA Trans. 2021, 110, 319–327. [Google Scholar] [CrossRef]
Figure 1. Sensor installation location diagram: 1: active shaft sensor for cutting platform, 2: screw conveyor shaft sensors, 3: tilt conveying active shaft sensor, 4: threshing drum active shaft sensor.
Applsci 13 04876 g001
Figure 2. Schematic diagram of the torque sensor detection principle. R1–4 represent torque strain gauges.
Applsci 13 04876 g002
Figure 3. Working diagram of combine harvester tilt conveyor: 1: crossbar strip chain rake, 2: tilt conveyor active shaft, 3: tilting conveyor bottom plate, 4: straw, 5: threshing drum, 6: concave plate.
Applsci 13 04876 g003
Figure 4. The 4LZ-3.2Z Whole Grain Combine.
Applsci 13 04876 g004
Figure 5. Hardware block diagram of the control system.
Applsci 13 04876 g005
Figure 6. Schematic diagram of the electric actuator module: 1: stepping electric actuator, 2: hydraulic transmission, 3: kinematic pair, 4: gear lever.
Applsci 13 04876 g006
Figure 7. Schematic diagram of PID type controller.
Applsci 13 04876 g007
Figure 8. Principle block diagram of the fuzzy PID controller.
Applsci 13 04876 g008
Figure 9. (a) The affiliation function and distribution of e and e c ; (b) the affiliation function and distribution of Δ K p ; (c) the affiliation function and distribution of Δ K i and Δ K d .
Applsci 13 04876 g009aApplsci 13 04876 g009b
Figure 10. (a) The fuzzy inference surface of Δ K p ; (b) the fuzzy inference surface of Δ K i ; (c) the fuzzy inference surface of Δ K d .
Applsci 13 04876 g010aApplsci 13 04876 g010b
Figure 11. Electric actuator simulation model.
Applsci 13 04876 g011
Figure 12. Bode Plot.
Applsci 13 04876 g012
Figure 13. (a) Traditional PID simulation model; (b) fuzzy PID simulation model.
Applsci 13 04876 g013
Figure 14. Simulation model of the harvester traveling speed adaptive regulation comparison test system.
Applsci 13 04876 g014
Figure 15. Simulation results of adaptive adjustment to the harvester’s traveling speed.
Applsci 13 04876 g015
Figure 16. Harvesting trial site.
Applsci 13 04876 g016
Figure 17. Time domain diagram of traveling speed.
Applsci 13 04876 g017
Figure 18. Time domain diagram of feeding volume.
Applsci 13 04876 g018
Table 1. The basic domain.
VariablesThe Basic DomainBased on
e [−6, 6]The traveling speed variation fluctuated greatly during the test, and the limit deviation was 6 m/s.
e c [−6, 6]The test’s rate of change in deviation was significant; the range was determined by simulation tests.
Δ K p [−6, 6]Affects the speed at which the system adjusts. In mountainous hilly areas, the speed and direction of the machine needed to be adjusted frequently, so the value should be extended. Determine the range by simulation test.
Δ K i [−0.3, 0.3]Affects the system’s steady-state error; too large will lead to overshoot. Determine the range by simulation test.
Δ K d [−0.3, 0.3]Affects the system response speed; too large will lead to a long response time. Determine the range by simulation test.
Table 2. Fuzzy rules of Δ K p , Δ K i and Δ K d .
eNBNMNSZOPSPMPB
ec
NBPB/NB/PSPB/NB/NSPM/NM/NBPM/NM/NBPS/NS/NBZO/ZO/NMZO/ZO/PS
NMPB/NB/PSPB/NB/NSPM/NM/NBPS/NS/NMPS/NS/NMZO/ZO/NSNS/ZO/ZO
NSPM/NB/ZOPM/NM/NSPM/NS/NMPS/NS/NMZO/ZO/NSNS/PS/NSNS/PS/ZO
ZOPM/NM/ZOPM/NM/NSPS/NS/NSZO/ZO/NSNS/PS/NSNM/PM/NSNM/PM/ZO
PSPS/NM/ZOPS/NS/ZOZO/ZO/ZONS/PS/ZONS/PS/ZONM/PM/ZONM/PB/ZO
PMPS/ZO/PSZO/ZO/PSNS/PS/PSNM/PS/PSNM/PM/PSNM/PB/PSNB/PB/PB
PBZO/ZO/PBZO/ZO/PMNM/PS/PMNM/PM/PMNM/PM/PSNB/PB/PSNB/PB/PB
Disclaimer/Publisher’s Note: The statements, opinions and data contained in all publications are solely those of the individual author(s) and contributor(s) and not of MDPI and/or the editor(s). MDPI and/or the editor(s) disclaim responsibility for any injury to people or property resulting from any ideas, methods, instructions or products referred to in the content.

