Article

An Image Processing Method for Measuring the Surface Area of Rapeseed Pods

1
College of Agronomy, Hunan Agricultural University, Changsha 410128, China
2
College of Information and Intelligence, Hunan Agricultural University, Changsha 410128, China
3
National Oilseed Crops Improvement Center in Hunan, Changsha 410128, China
*
Authors to whom correspondence should be addressed.
Appl. Sci. 2023, 13(8), 5129; https://doi.org/10.3390/app13085129
Submission received: 4 October 2022 / Revised: 2 March 2023 / Accepted: 25 March 2023 / Published: 20 April 2023
(This article belongs to the Special Issue Engineering of Smart Agriculture)

Abstract

:
An image processing method that considers pods to be irregular cylinders composed of several oblique cylinder slices with different diameters was proposed to achieve the “highly accurate, highly efficient and large-scale” target of measuring the surface area of rapeseed pods. The total side area of all the oblique cylinder slices, specifically the pod surface area, was calculated. A high-precision 3-dimensional method was used to measure and correct the actual area of the silique for the first time. The results of the measurement accuracy analysis showed that the image processing method could accurately measure the surface area of rapeseed pods. The average measurement error was 2.46%, and the root-mean-square error (RMSE) was 0.92 cm2. To prove the superiority of this method, we measured the same test samples using four other methods: the Clark formula, the Leng formula, flattening scanning, and quasi-cylinder side area methods. The accuracy and efficiency of the image processing method were much higher than the other four measurement methods. The surface area of multiple pods from 83 rape plants was measured using the image processing method; the results were consistent with the expectations of the experimental design. The 3D measurement and image processing technology were compared and analyzed, and the latter was preliminarily designed for future rape pod seed testing. Thus, this method can provide technical support to measure the surface area of numerous rapeseed pods.

1. Introduction

Unlike many other crops, the primary photosynthetic organs of rapeseed include branches, stems, and pods in addition to the leaves [1]. Once the plants enter the flowering stage, the pods rapidly proliferate. The surface area of pods reaches its maximum and tends to become constant after approximately 25 days of flowering. Simultaneously, the leaves wither gradually and their area decreases sharply; therefore, the pods gradually overtake the role of leaves as the primary photosynthetic organ in rape [1]. As an essential source of photosynthesis, pods function as the “source” [1,2,3] and “sink” for grain formation, significantly influencing the yield and quality of rape grain [4,5,6,7,8].
The surface area of rapeseed pods is an important index widely used to measure the photosynthetic capacity of pods. It is generally believed that cultivars that produce large pods with substantial surface areas are more efficient at photosynthesis and produce larger amounts of grain. Rape pods are irregularly shaped, with varying lengths and quantities of long-bead chains. Thus, measuring the surface area of rape pods is difficult [9]. The surface area of rape pods refers to the measured surface area of the functional part of the pods. The measurement of pod surface area can be divided into two dimensions: the single-pod surface area and the multi-pod surface area (Figure 1). These areas will be referred to as “single-pod measurement” and “multi-pod measurement,” with the former serving as the basis of the latter. Currently, the methods for single pod measurement are relatively well-established and include the Clark formula [10], Leng formula [9,11], flattening scanning [12,13], and quasi-cylinder side area methods [14]. The Clark and Leng formula methods have a similar principle of estimating the unknown pod surface area by establishing a regression equation between the pod length/width and the actual surface area. The principle and operation of these two methods are relatively simple and widely used [15,16,17,18,19,20,21]. The results of these methods are obtained indirectly through mathematical models; thus, the “actual area” of the pods used for their correlation analysis might not be accurate owing to the limitations of the measurement techniques and conditions at that time, i.e., the measurements may not be highly accurate. Flattening scanning obtains the area value by directly measuring the flattened pod peel. These results are more accurate than the two methods described earlier as the pod peel is directly measured. However, owing to the complex operation and inefficient measurements that result from these models, they are only used to measure the “actual area” when there are few pods [22]. In addition, it is difficult to completely flatten the pod peels because of the shape of their chain beads; this results in a measured value that is theoretically less than the “actual area”. The quasi-cylinder and the quasi-cone side area methods treat the pod as an approximate cylinder or cone. The pod length and average width are measured and inserted into the formula to calculate the cylinder or cone side area to obtain the measured value [23]. Although the operation of these methods is relatively simple, they exhibit calculation errors because the pods are not actually standard cylinders or cones.
In the past, the common method used to measure the surface area of rapeseed pods based on the dimensions of a single pod was inaccurate, primarily because there was no method at that time that could directly measure the surface area of irregularly shaped pods. Therefore, approximate measurement results were obtained by calculating these parameters based on formulas or flattening the skin shape. The measurement of the surface area of irregularly shaped objects became accurate when three-dimensional (3-D) measurement technology became commonplace; 3-D laser technology was recognized as one of the most favorable methods for the highly accurate measurements of objects [24]. 3-D measurement technology uses a computer vision method to reconstruct a 3-D model of the object [25]. It is necessary to use a laser scanning system to obtain the image and use image processing, vision technology, and point-cloud data processing technology [26] to perform in-depth mining and extract the features of the 3-D data of the measured object [27,28] to realize the 3-D digitization of the relevant measurement indices of the measured object. 3-D technology has been widely used in recent years to measure the related terrestrial space position and size because it can restore the actual shape and characteristics of the measured object truly. The relevant measurement indicators [29], such as distance and object surface area and volume, can be directly calculated. There are many application examples of the 3-D measurement technology in measuring the surface area and volume of objects, including the surface area and volume of fish [30], the surface area of coral [31], cranial volume [32], and the surface area of human feet [33] and female breasts [34]. In the field of agriculture, there are reports of the non-destructive measurement of the surface area and volume of sweet potato (Ipomoea batatas) [35] and storage roots [36] using an inexpensive 3-D scanner. Therefore, to our knowledge, a high-precision 3-D laser scanning system, which ensures the accuracy of measurement results, was used to measure the pod surface area for the first time. The results were compared and corrected with the measurement results of the image processing technology proposed in this experiment.
The multi-pod measurement is a process of the batch measurement of multiple rapeseed pods to obtain the total area value. It is widely used and has more practical significance than measuring a single pod. The primary methods used for this measurement include accumulating a single pod area and fresh-weight measurement methods. The accumulation of the area of a single pod was used to measure the surface area of all the pods; then, the measured value that had accumulated was obtained. The method used to measure the single pod measurement described above is still required to measure a single pod. The accumulation measurement of a single pod area can be challenging because of the highly complex operations and the heavy workload involved. Therefore, this technique has been briefly discussed in the experimental methods section of a few studies, and some systematic studies have reported it. The fresh-weight method is based on the area and mass of a few samples determined by single pod measurement, i.e., scanning flattening. The approximate area of the sampled pods can be obtained by data transformation on the ratio of the mass of the sampled pods to the mass of the pods with a known area. Although such methods are simple and efficient, they produce considerable errors owing to the uneven texture of rapeseed pods [14]. In summary, single pod measurement is currently the mainstay for measuring rapeseed pod surface areas because most methods have difficulty being both “highly accurate” and “highly efficient”.
This study is a subproject of the “Rapeseed Ideal Plant Type Breeding Project” of the Hunan Branch of the National Oilseed Crops Improvement Center (Changsha, China). This study aimed to screen ideal rapeseed plant types with high grain yields using multiple pod areas of a single plant dimension as important indices. Based on the results obtained by our group and focusing on the measurement goal of “highly accurate, highly efficient and large-scale”, we established a correction model using the measurement principle of oblique-cylinder side area calculus and the results with a high-precision 3-dimensional (3-D) laser scanner. We proposed a new method to determine the areas of rapeseed pod surfaces on image processing and to conduct precise and efficient measurements of multiple pod surface areas.

2. Materials and Methods

2.1. Experimental Materials and Equipment
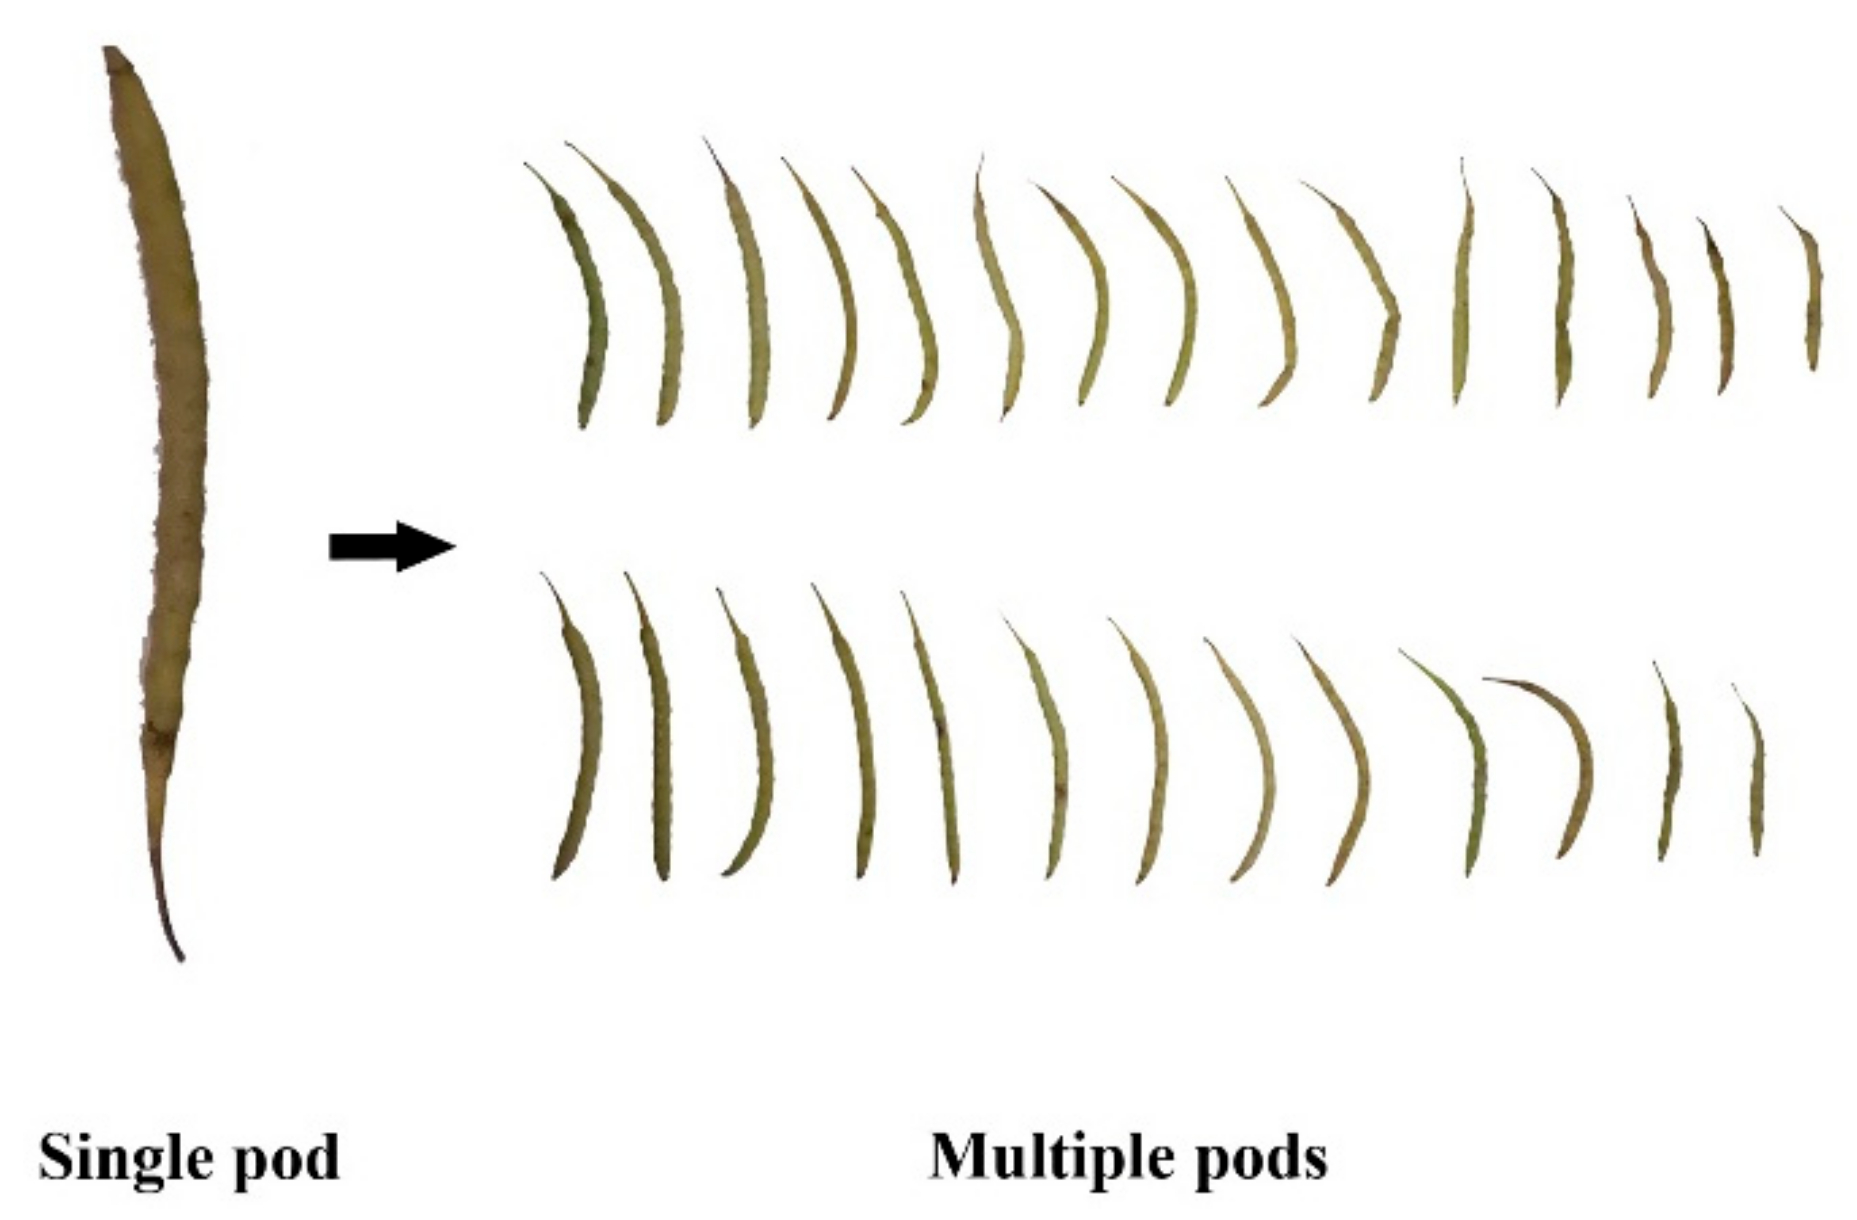
2.1.1. Materials

The single rape plant samples used in this experiment were from the rapeseed experimental base of Hunan Agricultural University, Changsha, China (conducted from October 2017 to May 2018). The cultivars included the early maturing cultivar 420 (winter Brassica napus L.A1, compact variety), medium maturing cultivar 1035 (winter B. napus L.A2, standard variety), and hybrid cultivar 991 (winter B. napus L.A3, tall variety). Three fertility treatments (compound fertilizer with total nutrient ≥ 45%, each containing 15% of N, P2O5, and K2O) were applied, specifically 0.053 kg/m2 (B1), 0.068 kg/m2 (B2), and 0.083 kg/m2 (B3). Each treatment was repeated three times. A total area of 10.8 m2 for each plot was planted with a density of 15 plants/m2. The rape plants were sown in October 2017, and inter-seedling and transplantation were conducted at the seedling stage. Different cultivars and fertilization levels were used to create single plant samples of different sizes and shapes. On 29 April 2018 (the pod maturity period), the pod surface area of 3~4 representative plants in each plot was measured in the dimension of a single plant, yielding a total of 83 plants that were measured. In this study, the pod surface area of a single plant refers to the total surface area of all pods of the plant, including the areas of pod beaks.

2.1.2. Equipment and Software

Equipment: ASUS integrated computer (Processor: CORE i5-8250U; Memory: 8 G/1 T; Display: 23.8 in LED; Graphics card: NVIDIA GeForce 930MX; Operating system: Windows 10 Home), an Apple iPhone 6 (Memory: 64 G; Display screen: 4.7 in, 326 ppi; Chip: A8; Camera: 8 million pixels, automatic focusing, f/2.2 aperture), an ultra-high precision and high-speed 3-D laser scanning system LDI-SurveyorZS (LDI-SLP250) [37], Li-3000C Portable Area Meter (LI-COR, Lincoln, NE, USA), Bluetooth remoter, white cardboard, Vernier caliper, and ruler.
Software: Image Processing System for measuring the surface area of rapeseed pods [38] (developed by our group: invention patent; referred to as Image Processing System from this point onward); DPSV7.05 statistical analysis software [39]; Adobe Photoshop CS (San Jose, CA, USA); Microsoft Office 2016 (Redmond, WA, USA).

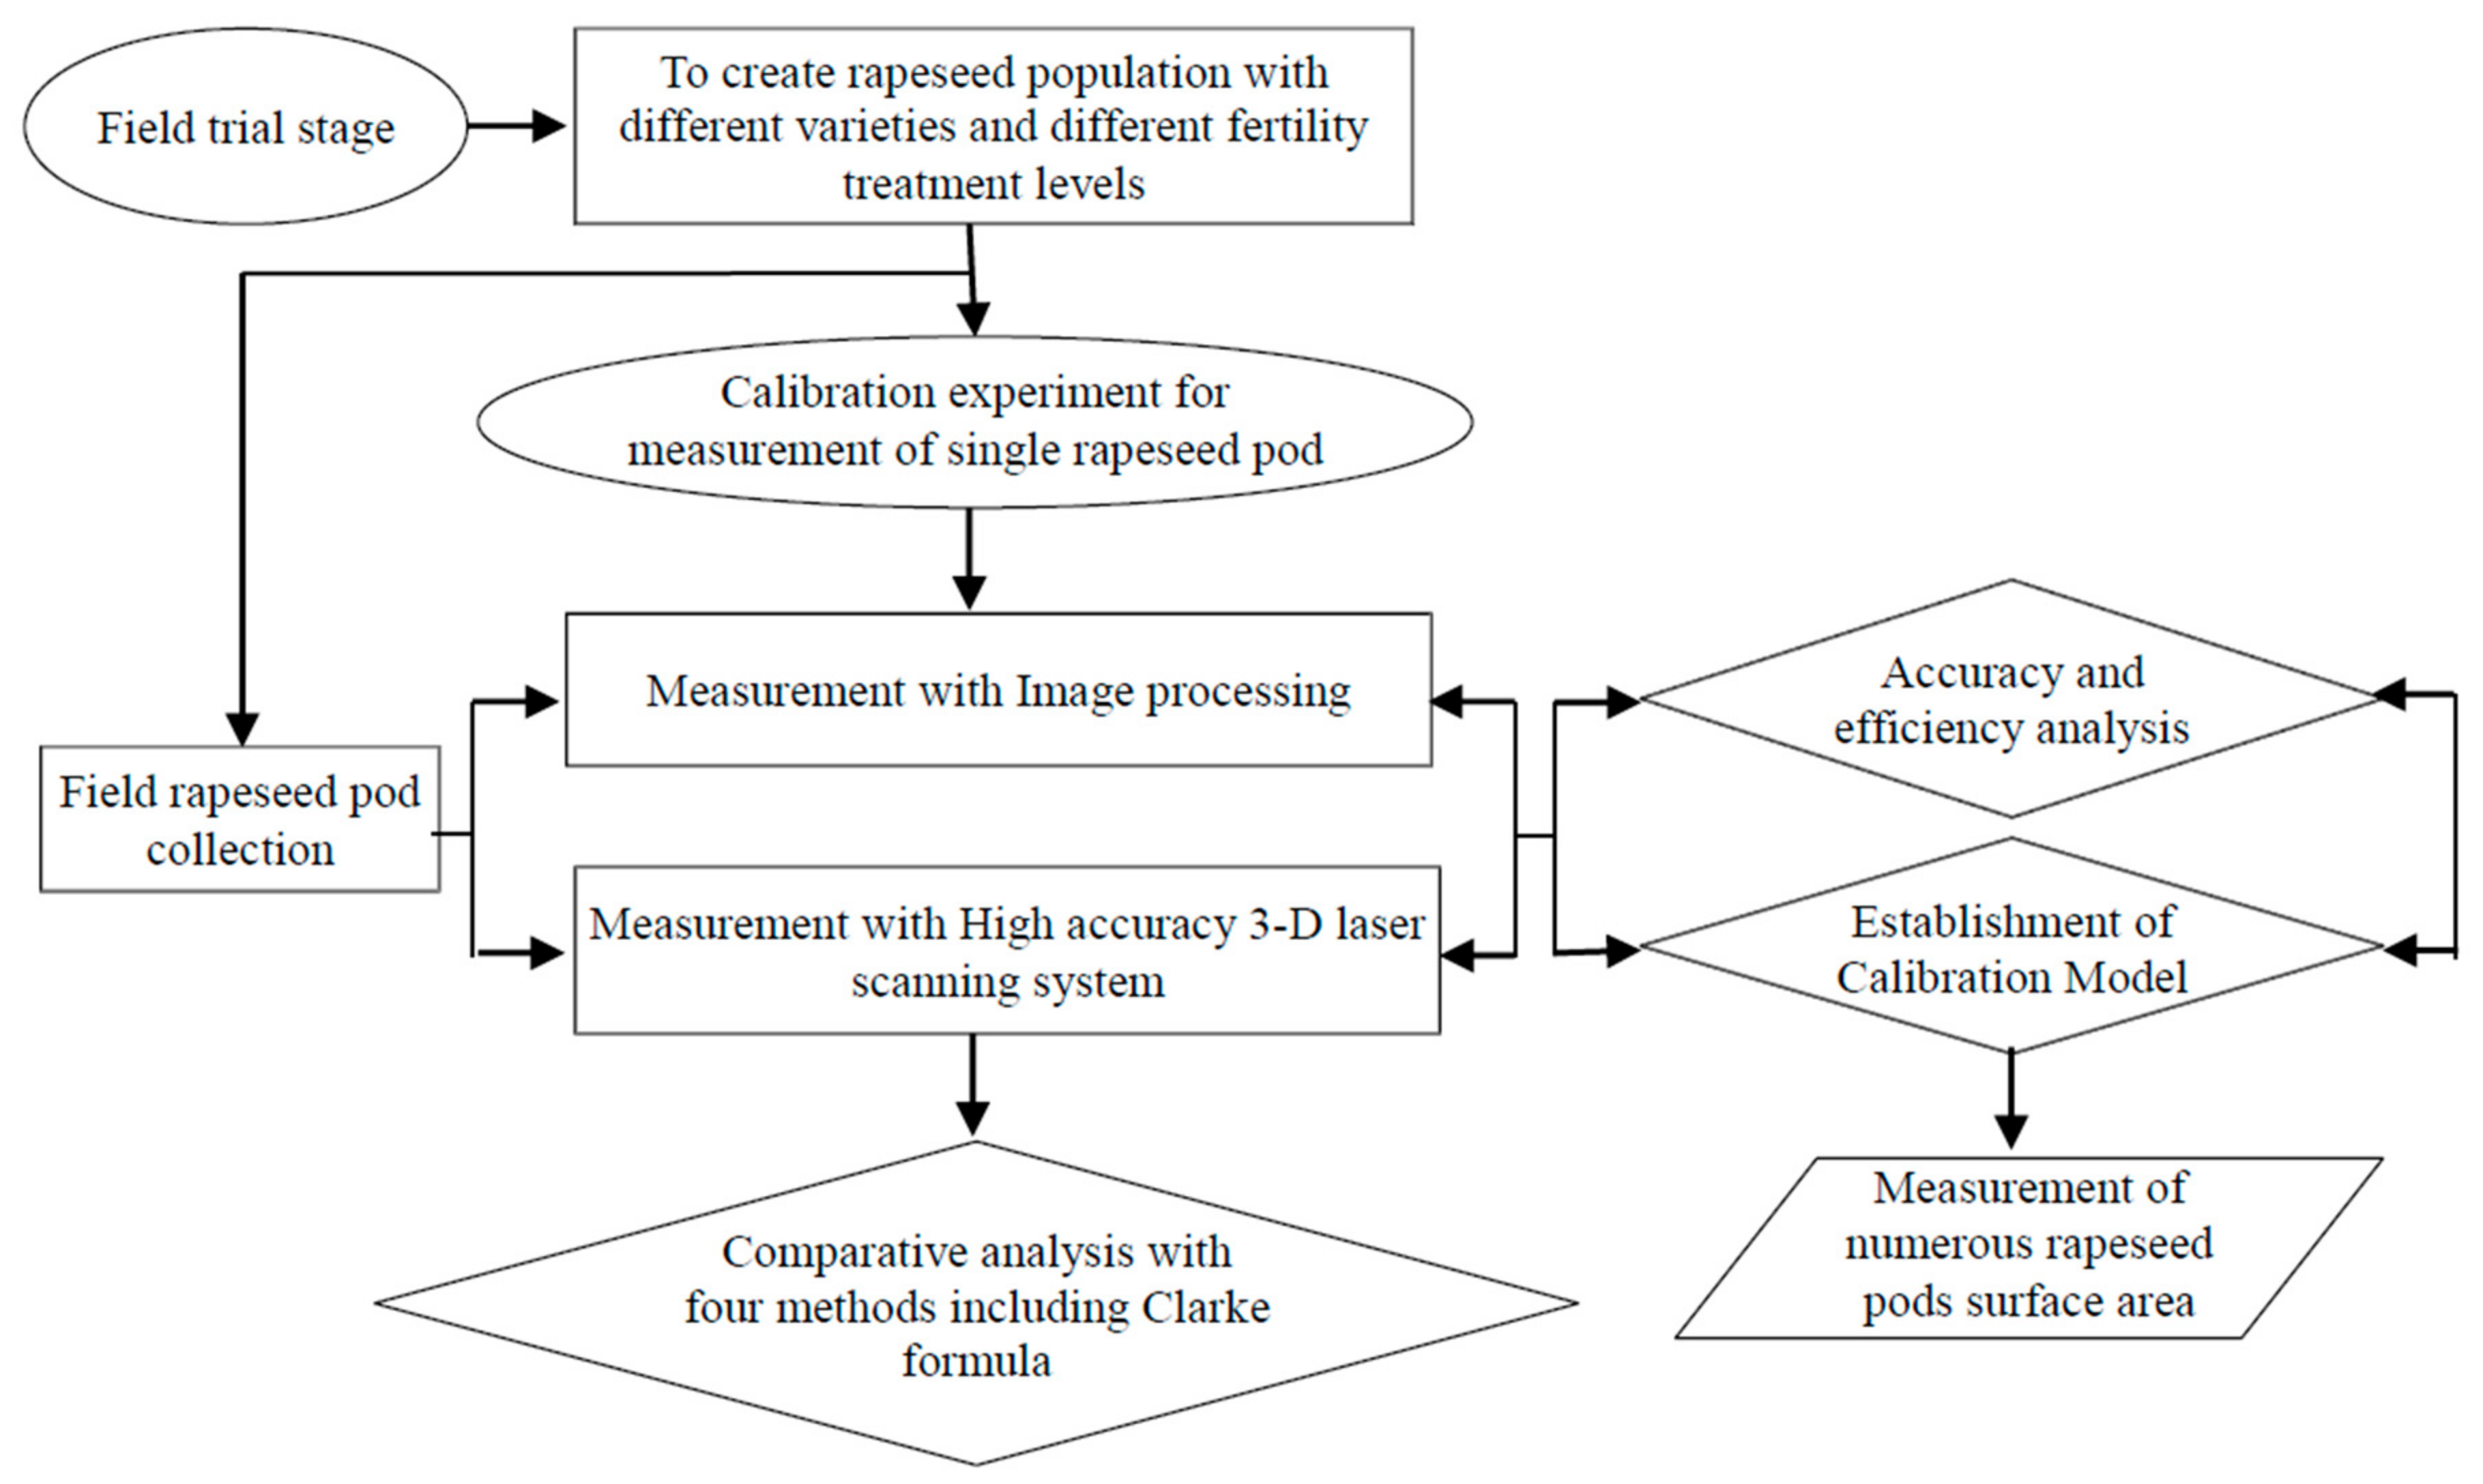
2.2. Measurement Method and Technical Roadmap

A correction model to measure the surface area of a single pod using the image processing method needed to be established before the batch measurements of multiple pod surface areas. Several pods of different sizes were collected from different cultivars and plants and sent to a dimension measurement and Data Services Company for single pod measurement using a high-precision 3-D laser scanning system (referred to as the “3-D method” from this point on). The measured value was then treated as the “actual surface area” (referred to as the “3-D area”). A portion of the pods sampled above were used as modeling samples, and the single pods were measured using the image processing method. The correlation between the measurement results of the image processing method and the corresponding 3-D area was analyzed, enabling the establishment of the correction model. The remaining sampled pods were used as test samples, for which the image processing method was also used to measure the surface area of single pods. The corrected area was obtained by correcting the measurement results of the image processing method based on the correction model. The accuracy was then tested by analyzing the relative error and RMSE of the corrected area and the corresponding 3-D area. Moreover, the single-pod measurement of the test samples was performed using the Clark formula, Leng formula, flattening scanning, and quasi-cylinder side area methods. Their accuracy was assessed by analyzing their relative error, RMSE, and the corresponding 3-D areas. We then compared the measurement accuracy of the image processing method and the other four methods; this enabled us to determine whether the image processing method had a relative advantage. In addition, the measurement efficiency of the image processing method and the other four methods was tested by the batch measurement of multiple pod surface areas using the image processing method. The results of measurements were corrected using the correction model, and the rationality of the measurement results was also analyzed. A technical flowchart of this study is shown in Figure 2.

2.3. Measurement Principle and Operation

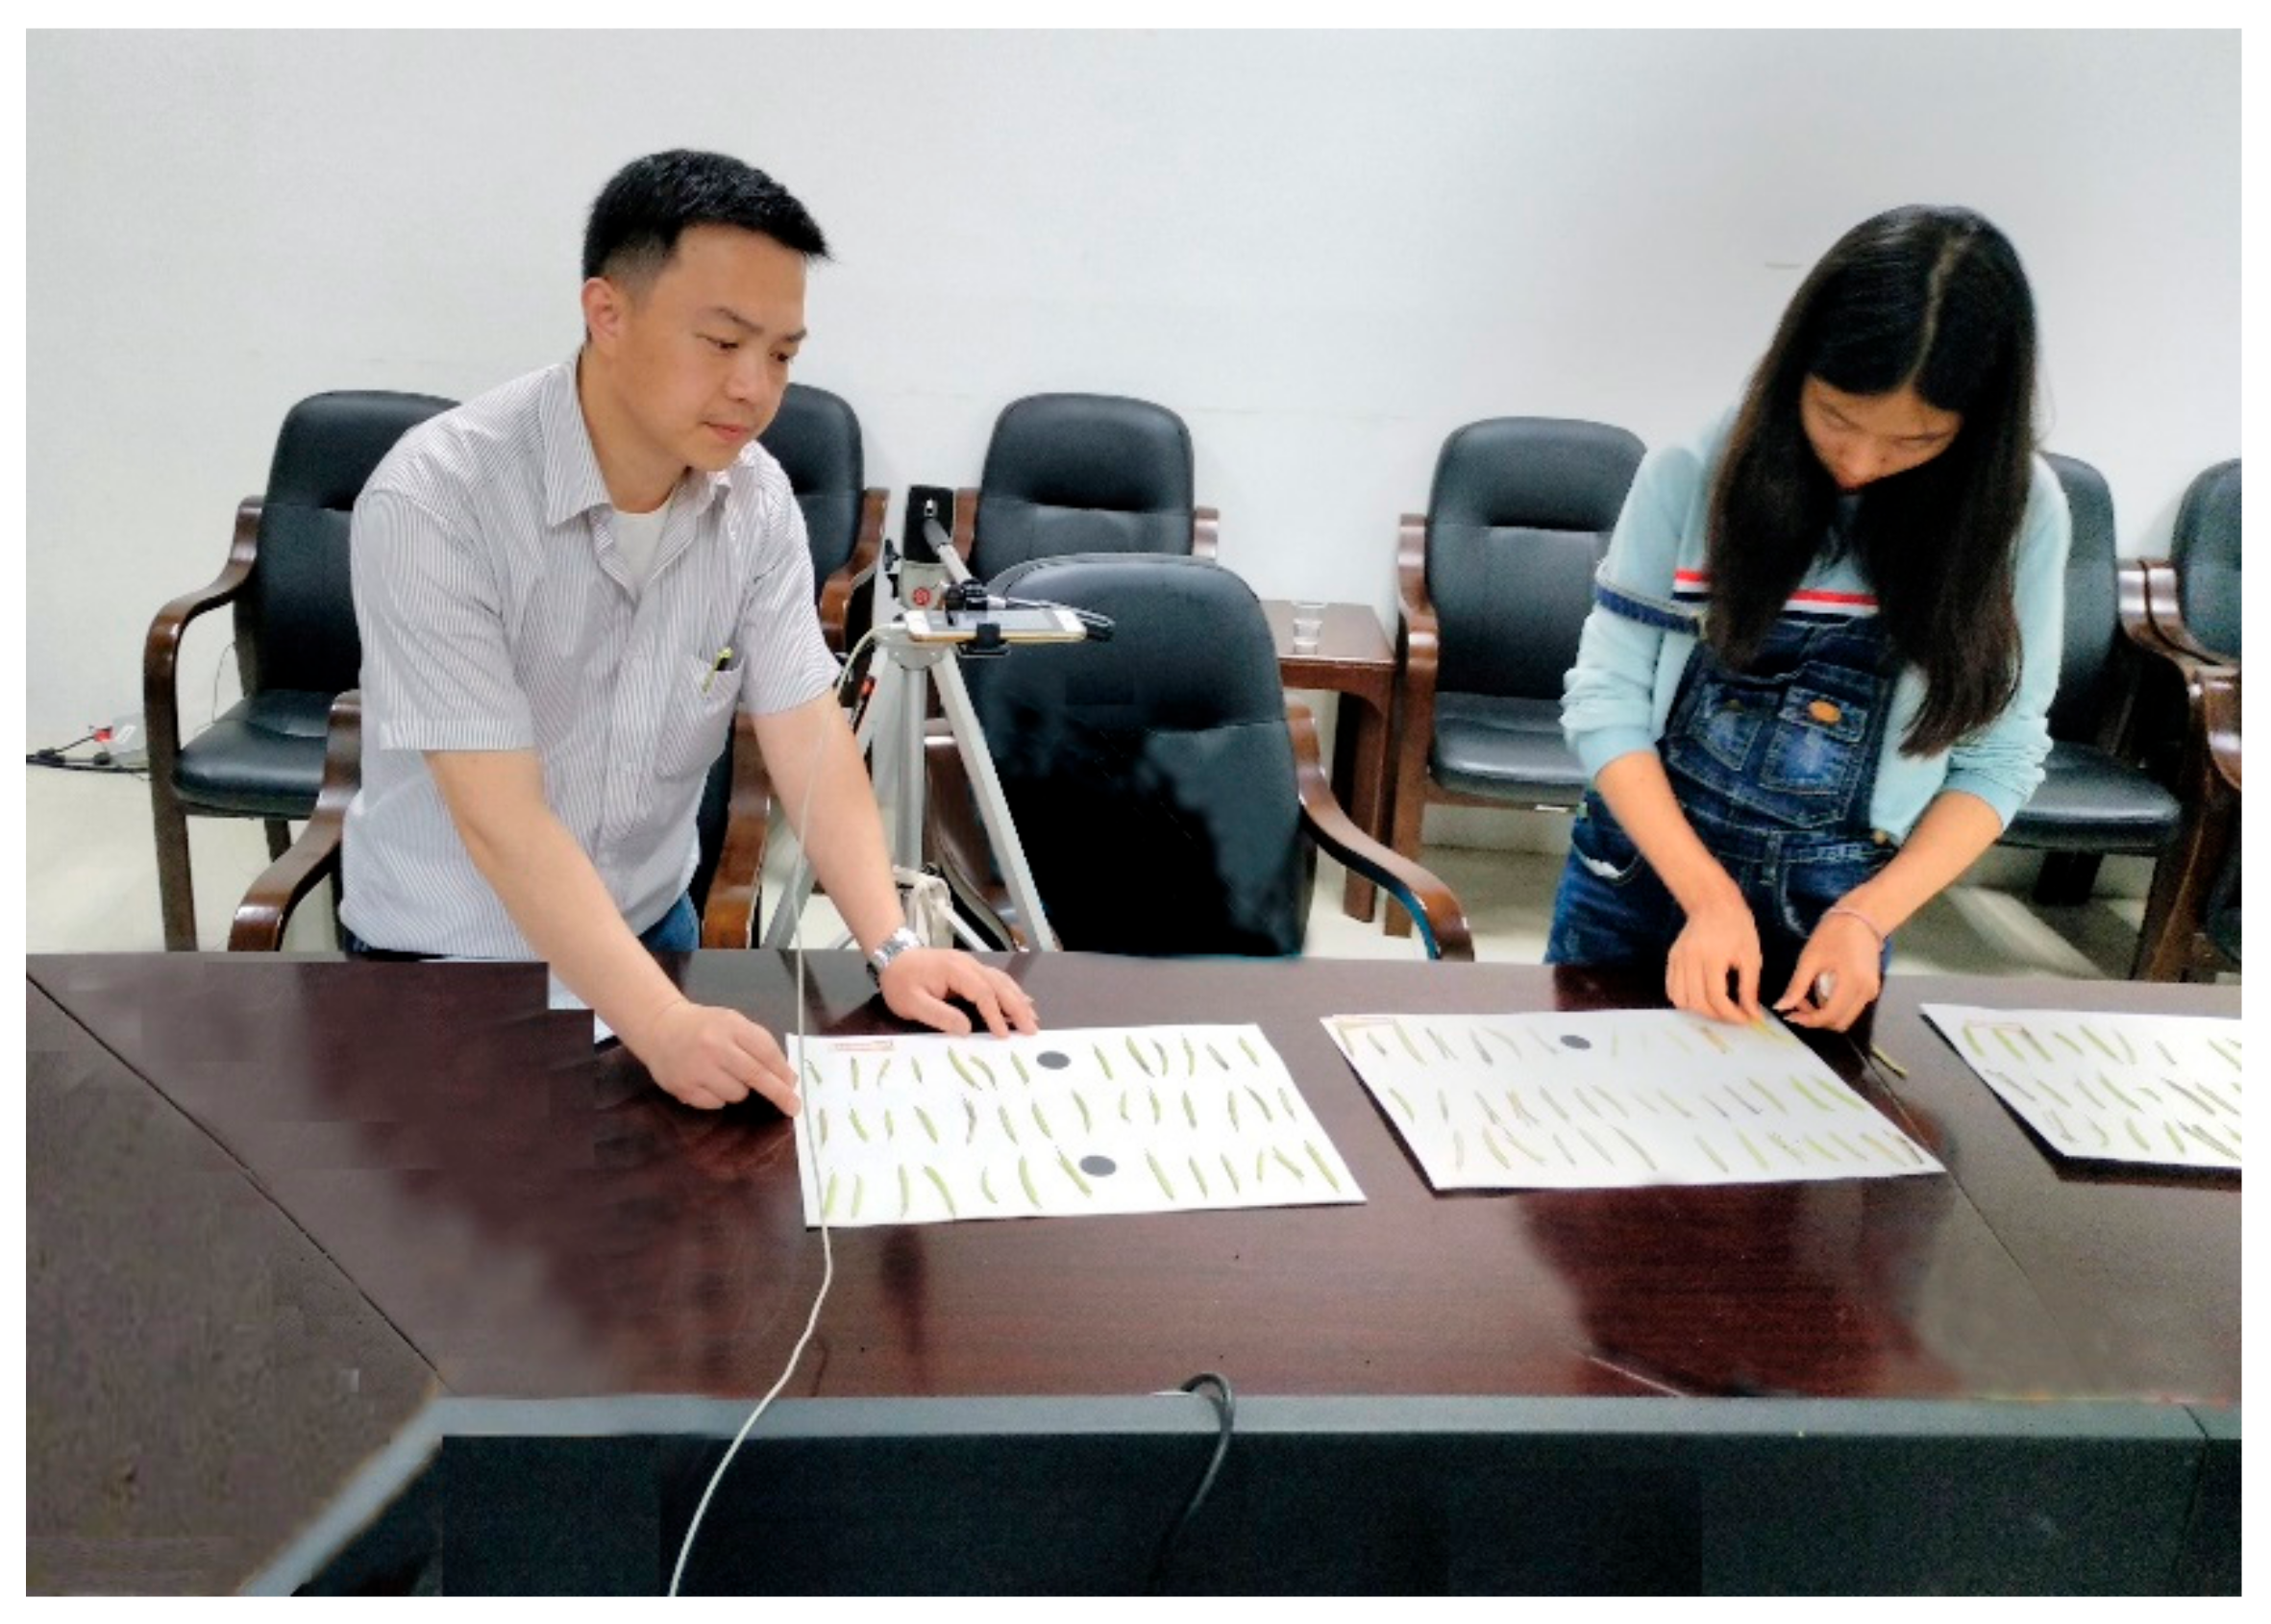
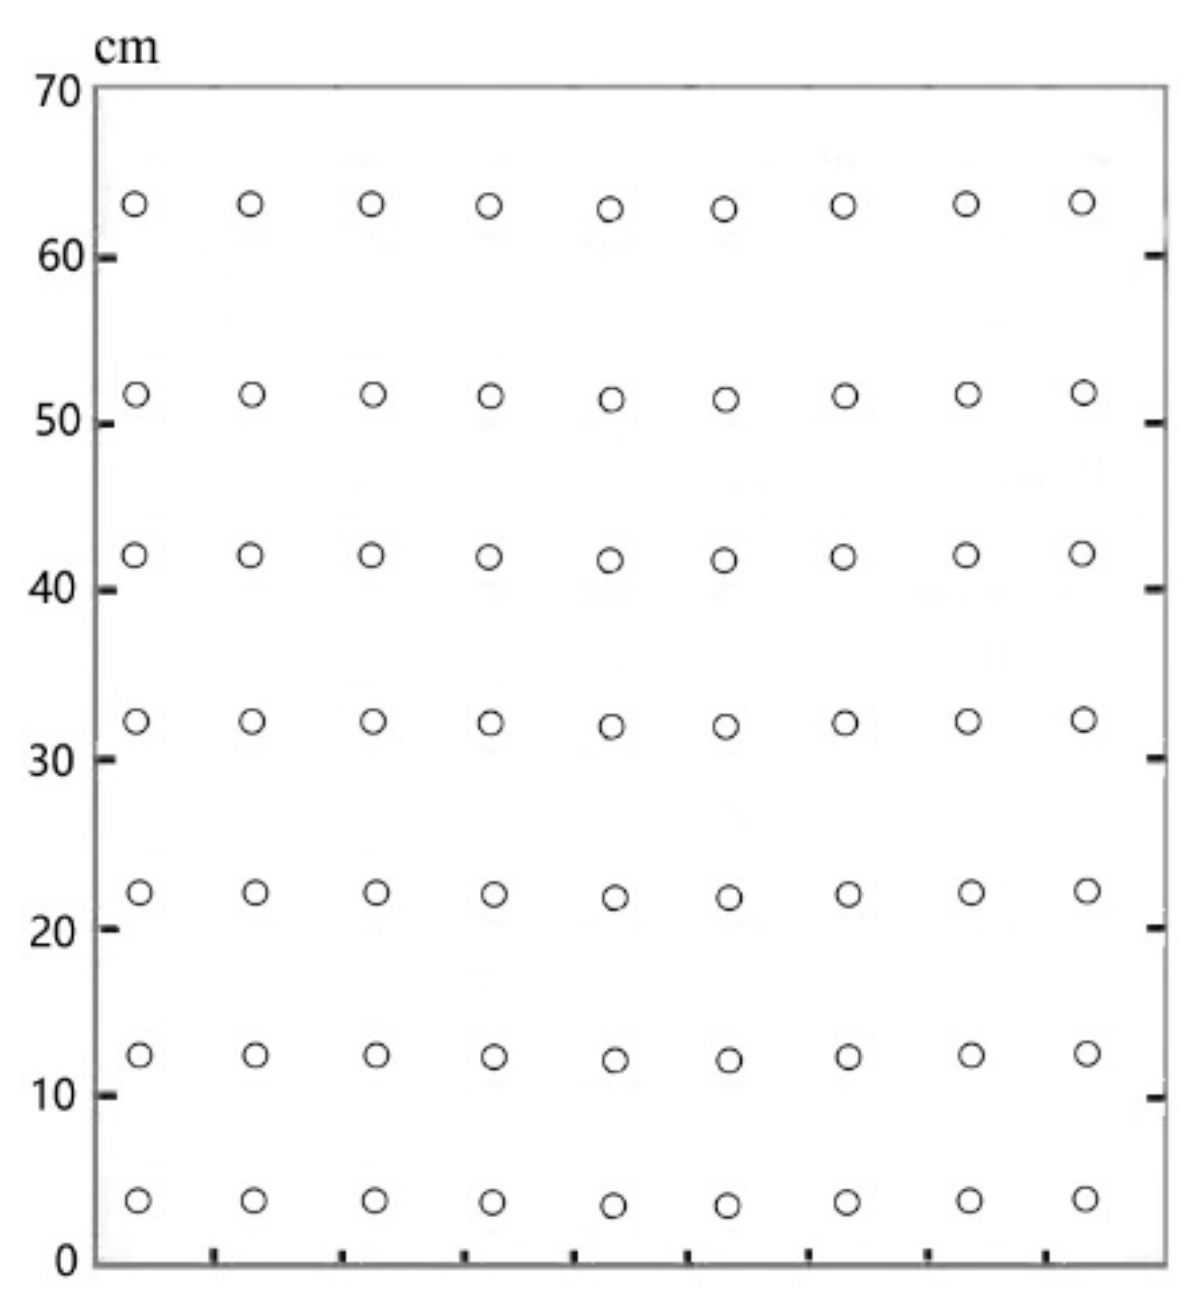
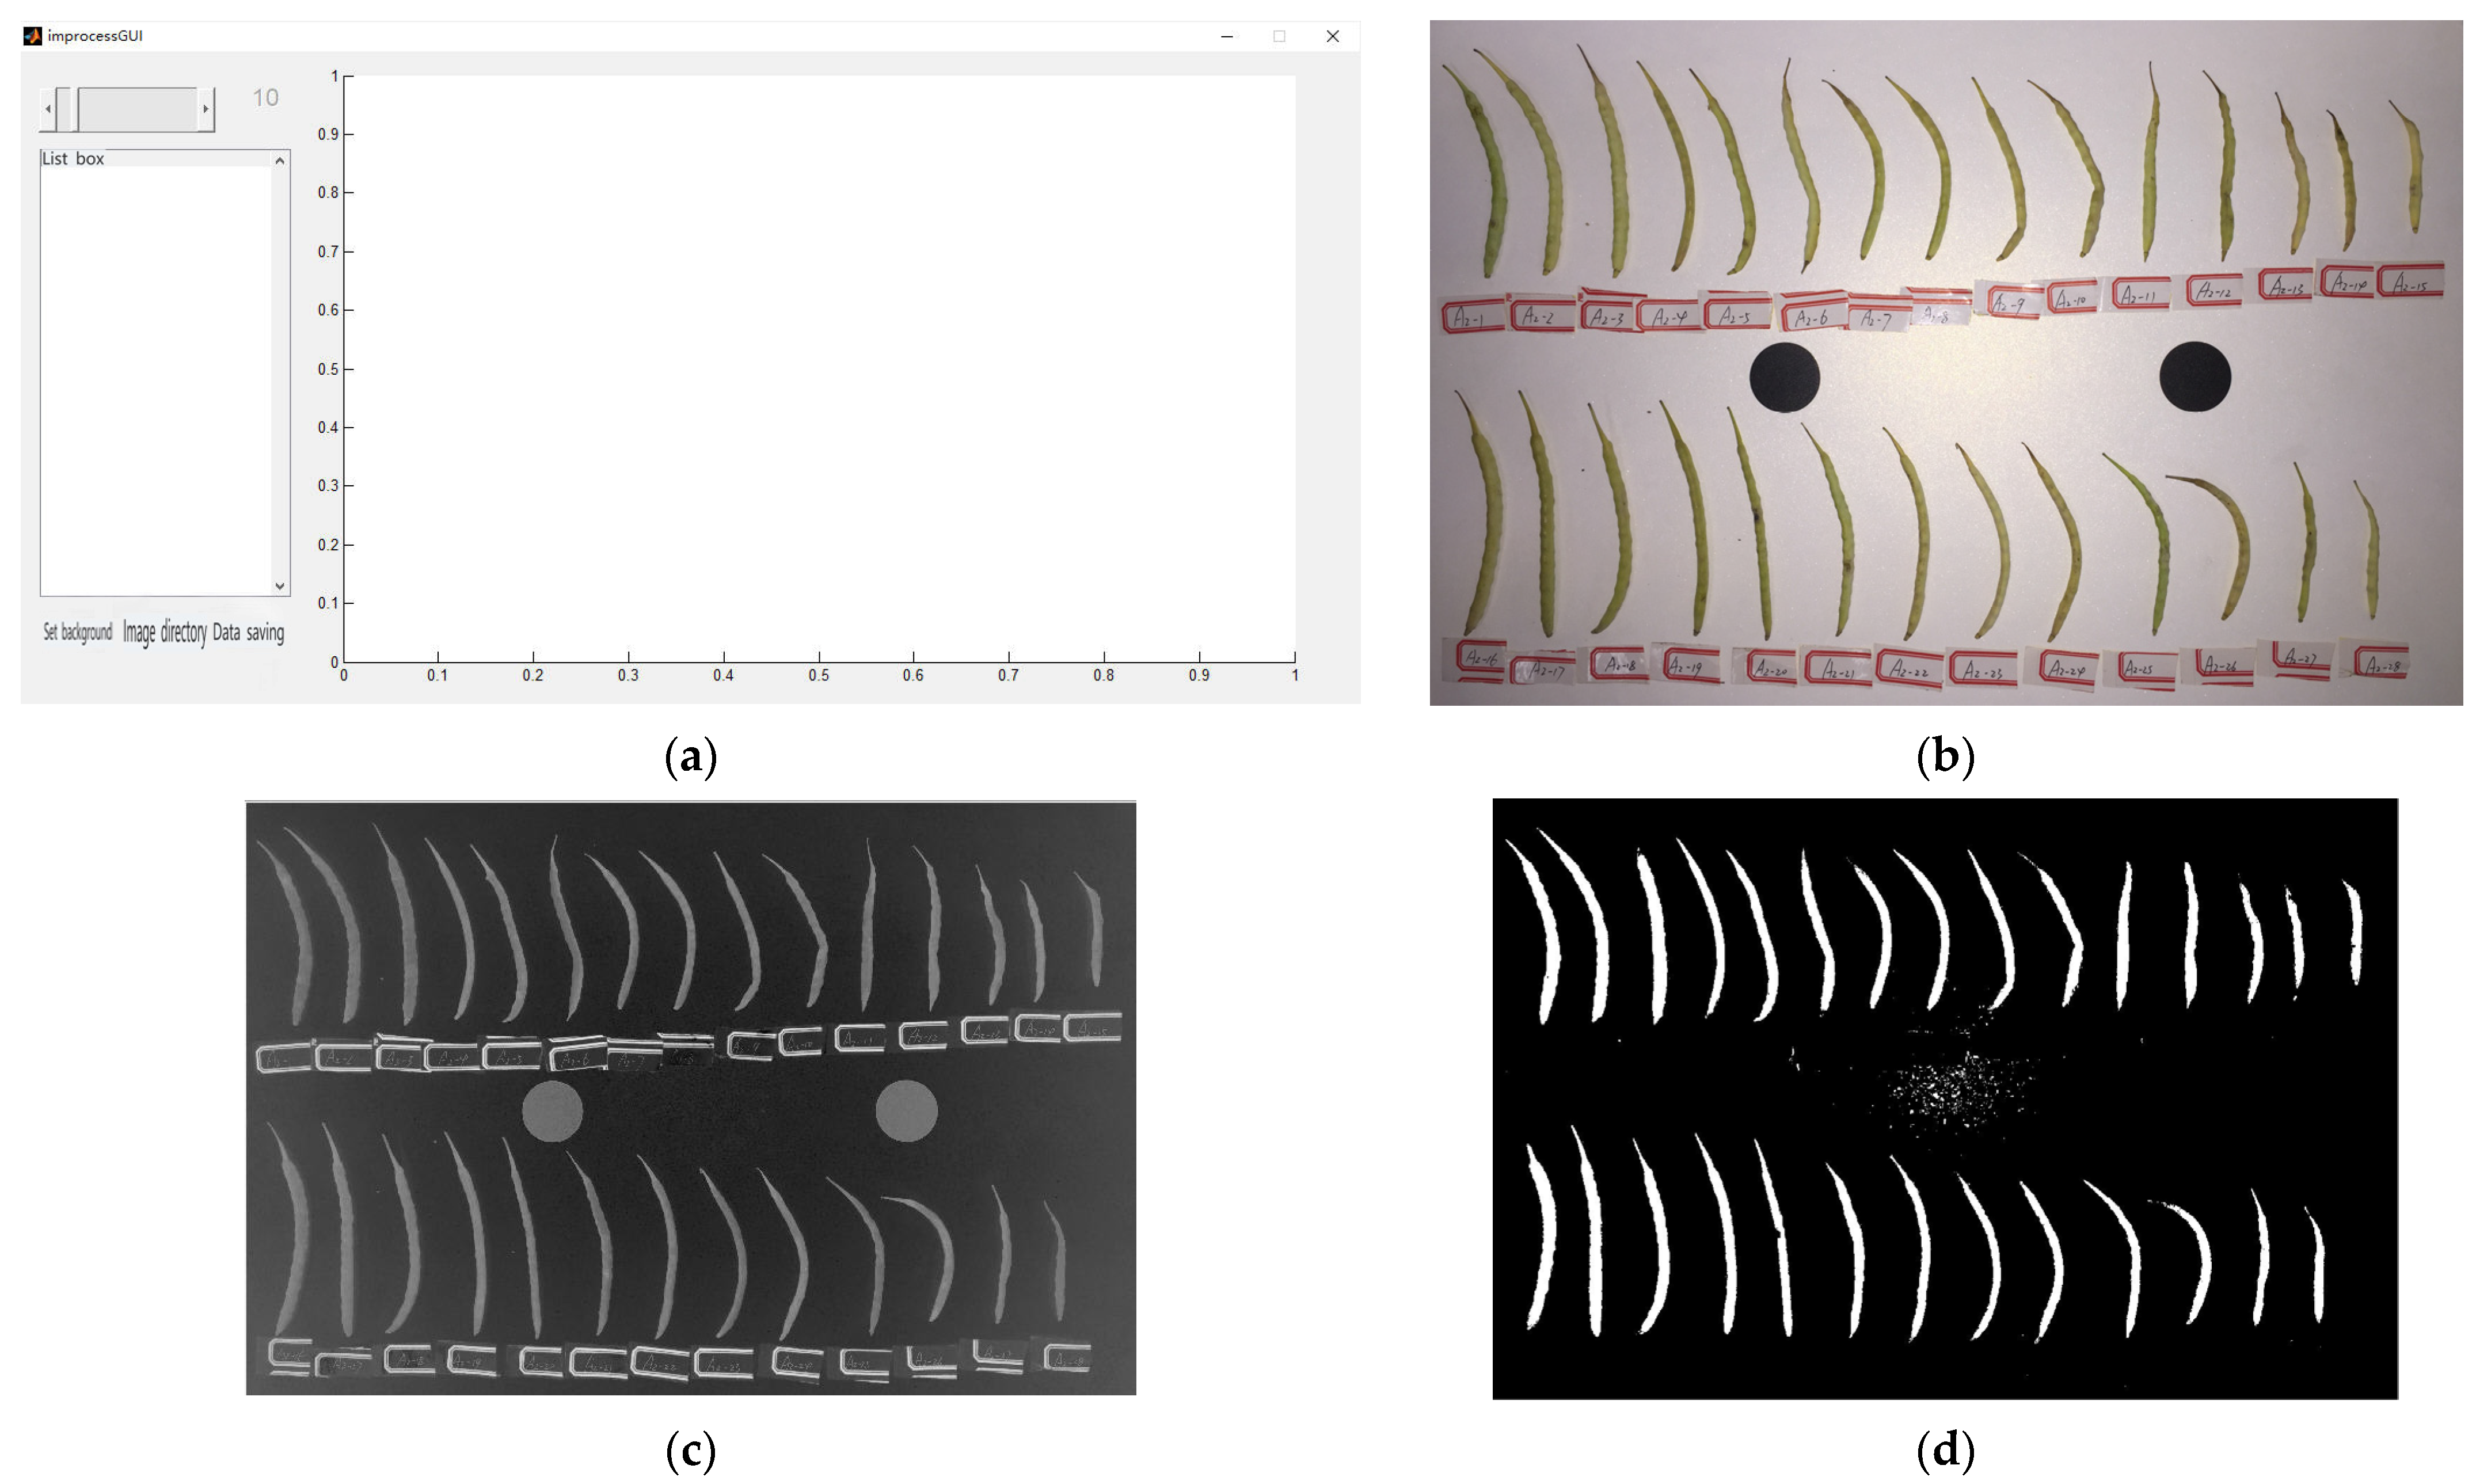
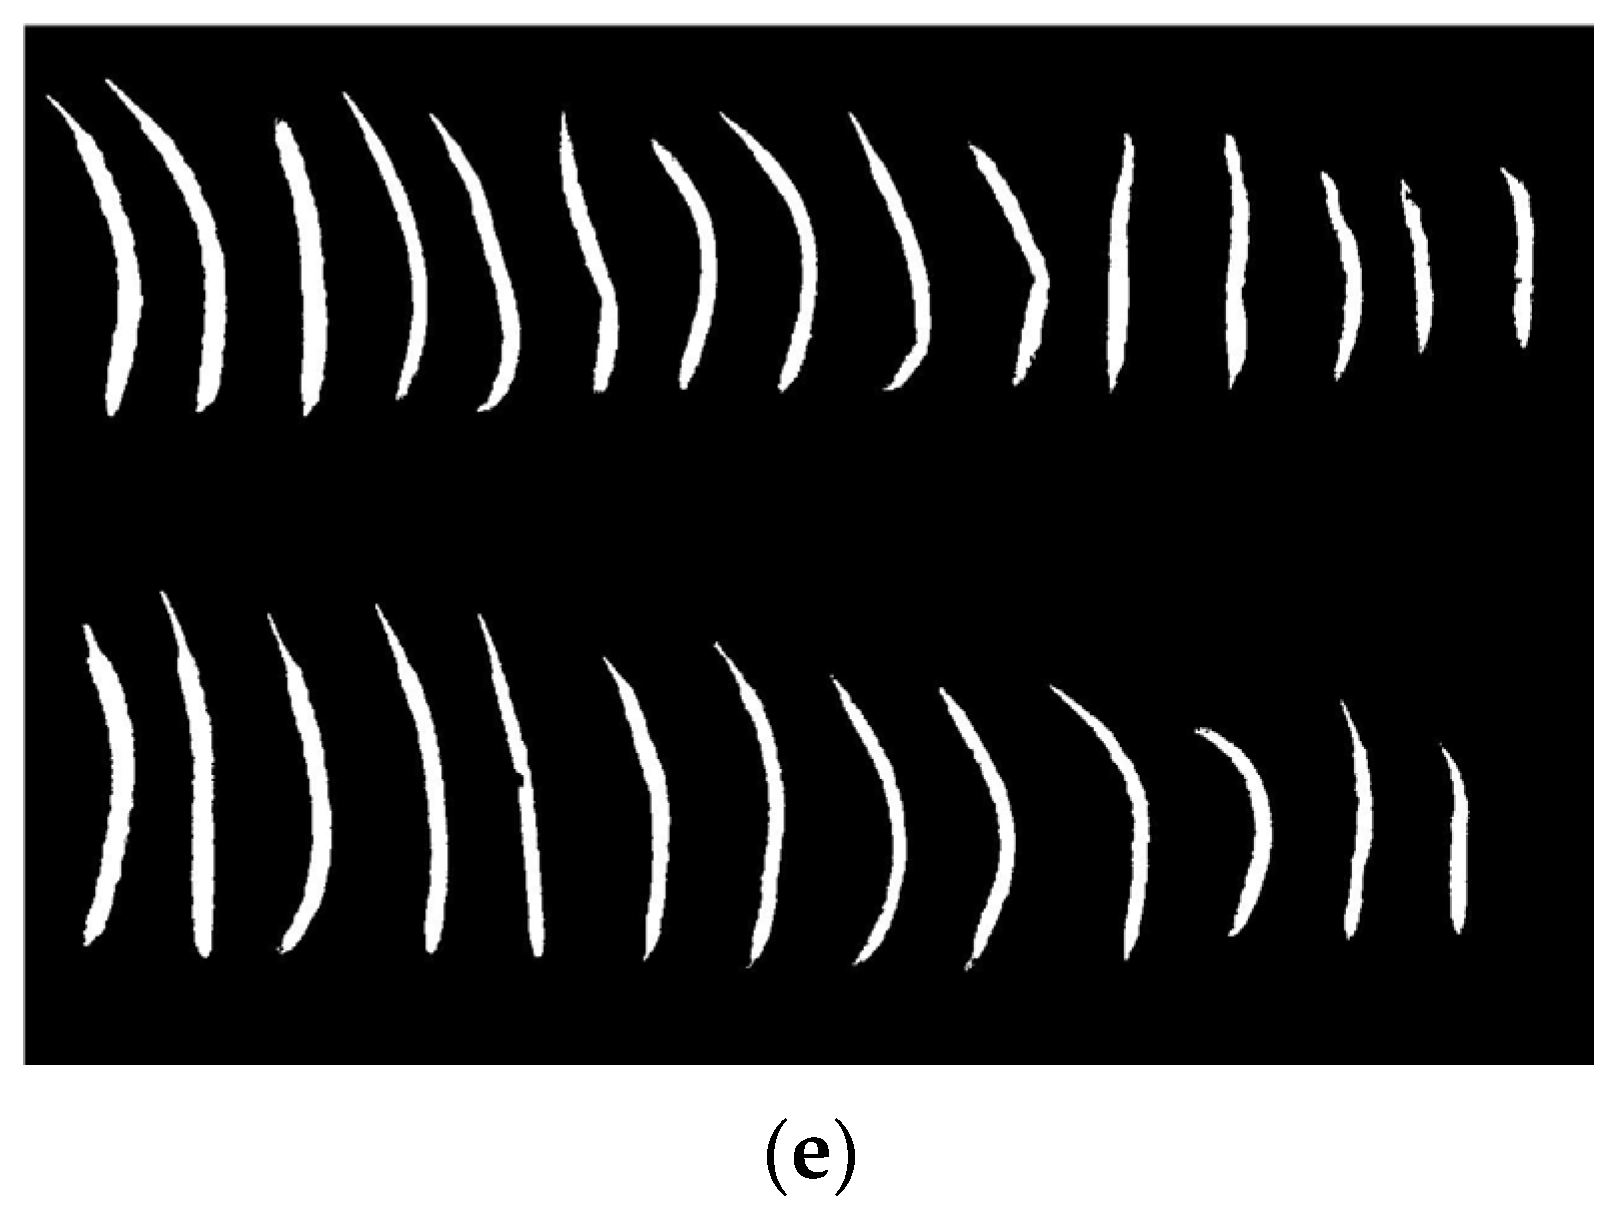
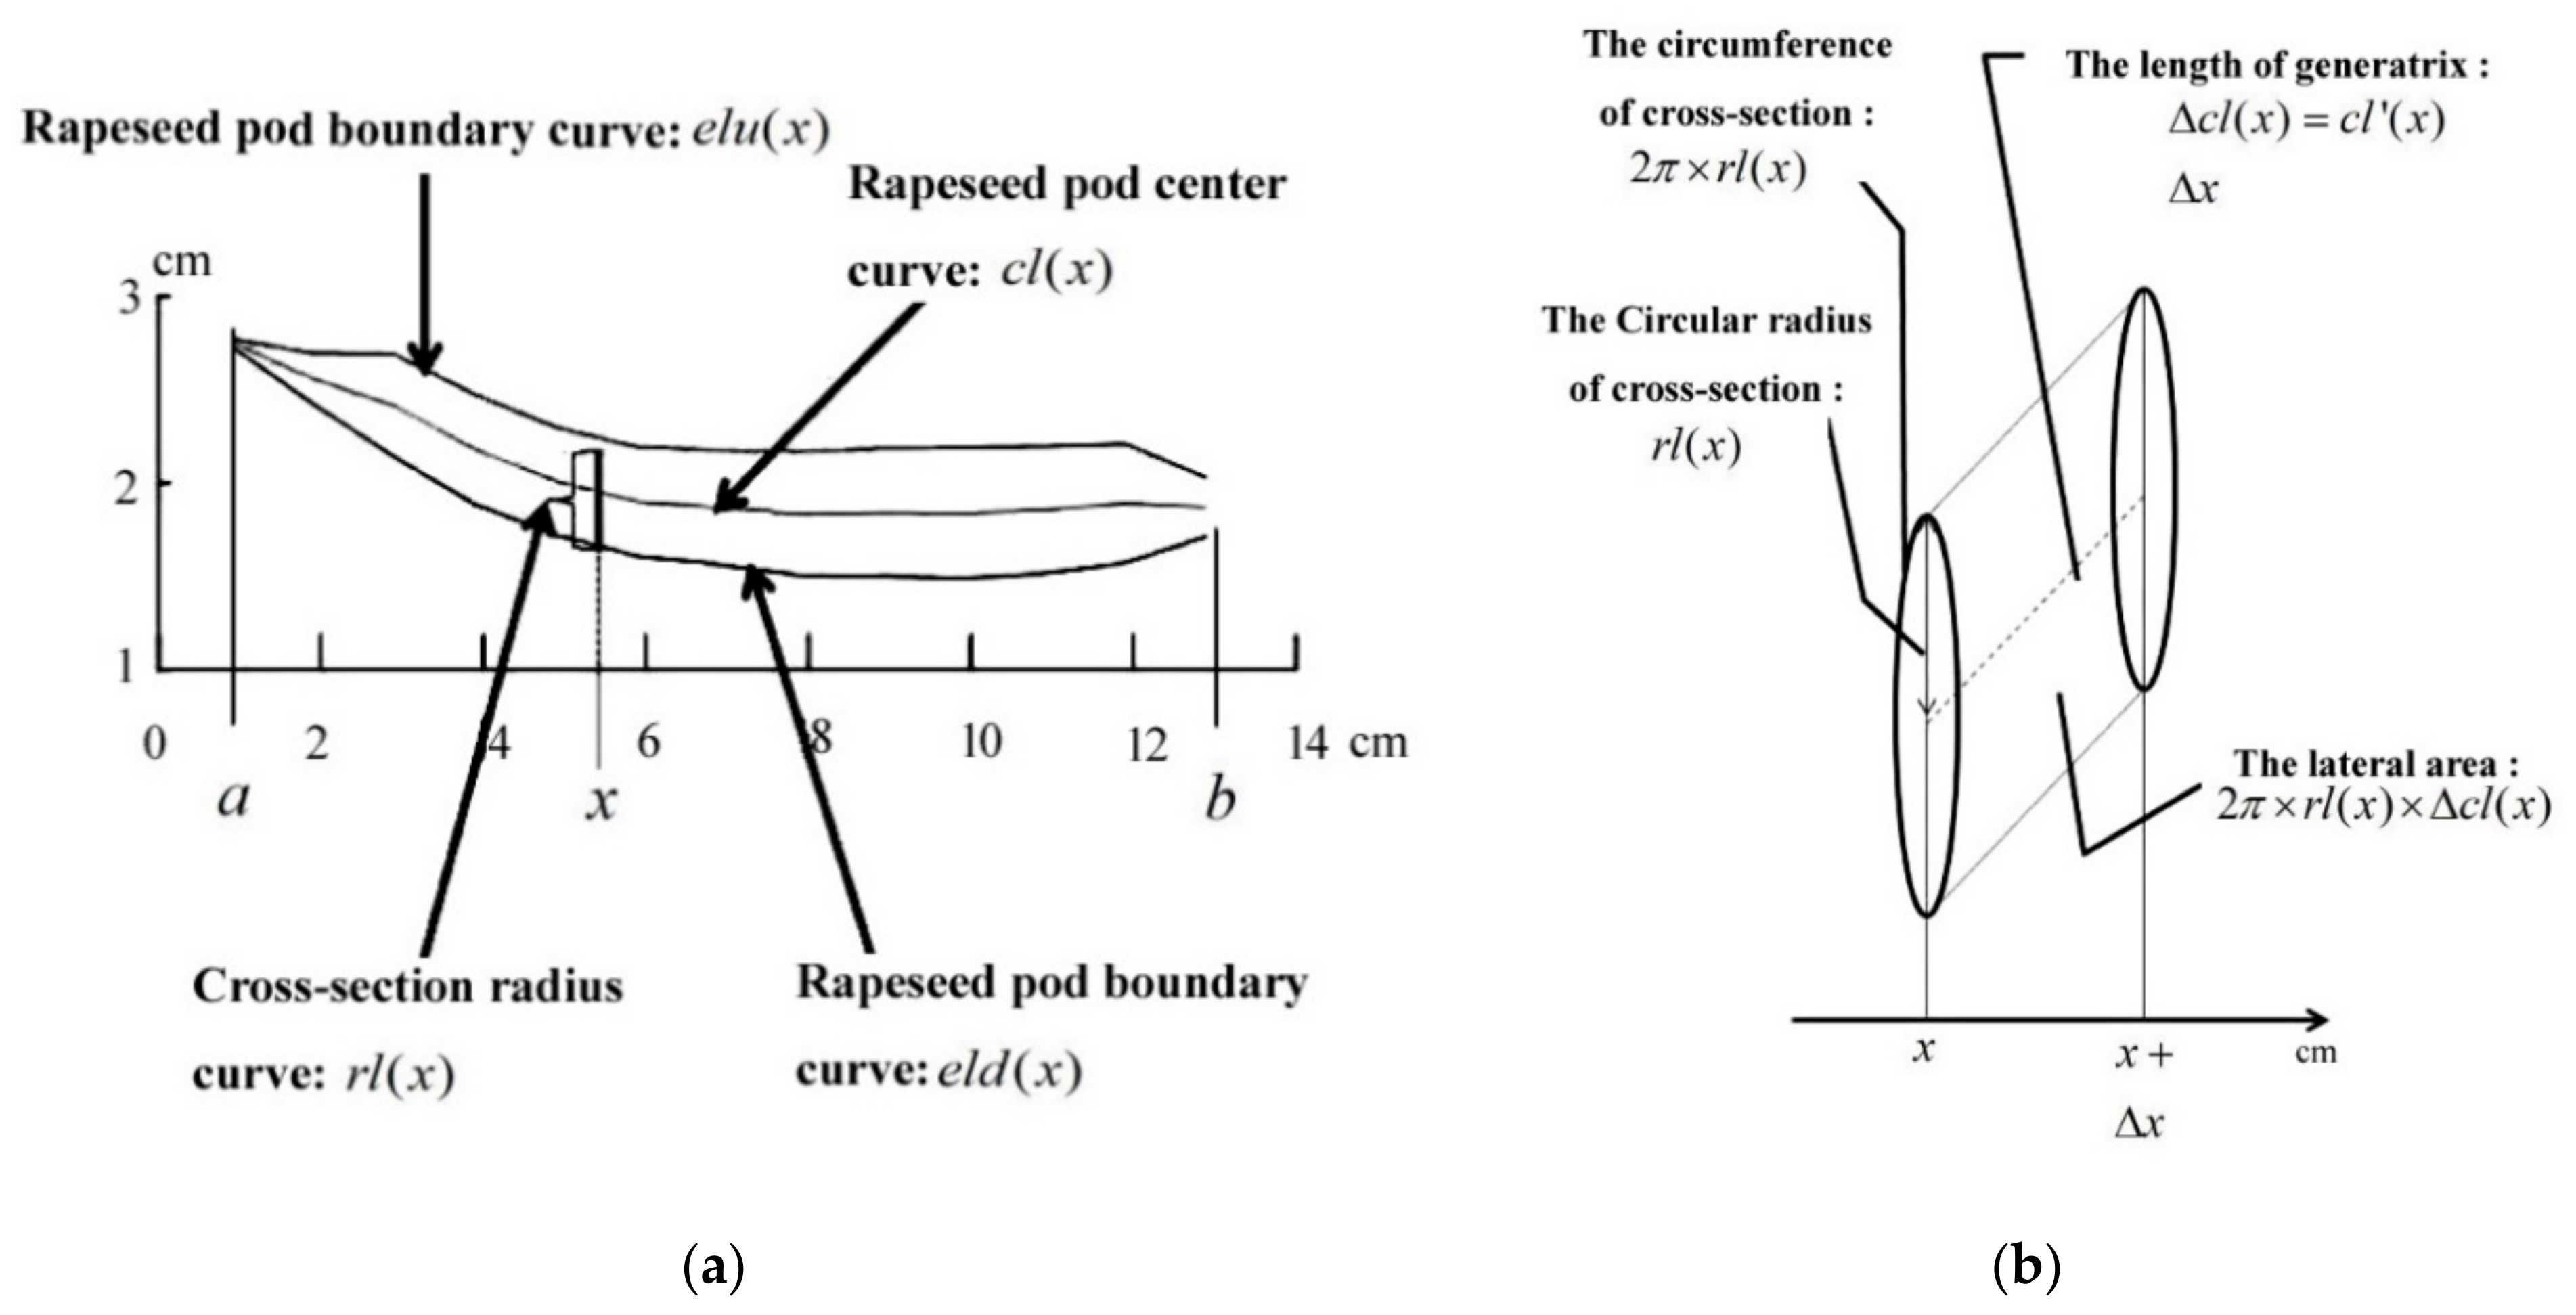
2.3.1. Image Processing Method

The application of the image processing method depends on the integrated use of image processing technology and data analysis. The basic principle is that the pod is considered an irregular column composed of several circular slices with different diameters. The length of the column is the length of the pod, and each circular slice can be regarded as an oblique cylinder with equal height and different diameters. The diameter of each circular slice represents the width of the corresponding position of the pod. The side area of the irregular column of the pod is the sum of the side areas of all the circular slices, which can be estimated using calculus [40], and is considered to be the approximate surface area of the pod. The process of image processing involves calculating the value of pod length and the width at different positions transformed from the image of pods; these are required for the use of calculus through image processing. The correlation between the estimated pod surface area and the corresponding pod “actual area” was then analyzed. A correction model was established to correct the measurement results of the other pod images. The specific procedure and methods were as follows:
(1) Image acquisition device. We configured an image acquisition device, as shown in Figure 3, which used consistent parameters to obtain highly defined and high-quality images. The device was primarily composed of five parts: a long-strip desktop, a self-use iPhone, a tripod for fixing the mobile phone, white background cardboard for placing the pods, and a remote Bluetooth device that can control the photography of the mobile phone. Using a long strip desktop, we established the batch placement of pods and the assembly line operation and improved the efficiency of imaging acquisition. The tripod fixed the shooting distance, unified the shooting background, and provided an identity guarantee for later image processing and comparison analysis. The selection of white background cardboard helped to separate the pod and background during later image segmentation. Bluetooth was used to prevent the mobile phone from shaking during shooting, which affects the image quality.
(2) The pixel transformation equation was generated. The image acquisition device was used to capture an object space frame of reference (Figure 4) and calculate the transformation equation of pixel coordinates and actual coordinates. The transformation equation of pixel position ( i , j ) and actual coordinates ( x , y ) used the binary quadratic functions Equation (1) [41], and the parameters were obtained by least-square fitting. The goal was to ensure that the distance between the adjacent points on the transformed coordinates of the transformation map was closer to their actual distance.
x = a 1 i 2 + b 1 i j + c 1 j 2 + d 1 i + e 1 j + f 1 y = a 2 i 2 + b 2 i j + c 2 j 2 + d 2 i + e 2 j + f 2
After calculation, the transformation equation between the position of the pixel ( i , j ) and the actual coordinate ( x , y ) applied the binary quadratic functions as follows:
x = 7.3314 × 10 6 i 2 + 6.7344 × 10 7 i j 2.2592 × 10 7 j 2 + 0.090528 i 0.0089604 j y = 1.4521 × 10 6 i 2 7.2268 × 10 6 i j + 7.7158 × 10 8 j 2 + 0.014176 i + 0.09199 j
(3) Image acquisition. The images can be acquired using multiple people (Figure 3). One person was designated to take photographs and the others were responsible for placing, numbering, recycling, and recording the pods. The pods should be arranged in parallel on the white cardboard, and their numbers on each whiteboard should be the same as that in principle (e.g., 40), which is convenient for later analysis. The flash function implemented in the mobile phone was used during the shooting process to acquire the image with consistent exposure.
(4) Image processing. First, the rapeseed pod photos were preprocessed through image binarization transformation and denoising. The primary purpose was to facilitate the segmentation of the later image. For comparison, gray-scale and super-green transformation can be selected as image transformation, and median filtering can be selected as denoising. Second, the images were segmented to separate the background and pods. The image obtained this time was a white background, and the green of the pods and white of background were significantly different in gray scale. Therefore, the threshold method based on the gray scale was used for segmentation. Repeated comparisons indicated that the Otsu threshold segmentation and the maximum inter-class and intra-class distance ratio methods were the best. The intra-class variance (ICV) provided by Nobuyuki Otsu was defined as follows:
I C V = P A × ( M A M ) 2 + P B × ( M B M ) 2
where M is the average of the image gray value. If any gray value t is taken, the histogram can be divided into the foreground color A and background color B. The average values of the two parts were MA and MB, respectively. The proportion of pixels in A and B to the total number of pixels was recorded as PA and PB, respectively. This optimal threshold t was the value that maximized the ICV.
The positions of each pod pixel set and the boundary pixel set were extracted from the pod batch. Using the transformation equation of the position of the pixel points and the actual coordinates described in step 2, the position sets of the pod and the boundary pixel points were transformed into their actual coordinates. The image processing process is shown in Figure 5.
(5) Surface area calculation. The surface area of each pod was estimated separately, and the steps were as follows:
A. The actual coordinates of the pod pixel set were fitted using a linear equation.
B. Coordinate rotation. The actual coordinates of the pod pixel set and the boundary pixel set were rotated based on the inclination angle of the fitting line, so that the fitting line of the new coordinates of the pod pixel set was parallel to the horizontal line. The new coordinates of the pod pixel set and the boundary pixel set were then obtained.
C. Fitting the boundary curve of the pods. The polynomial function was used to fit the pod boundary pixels (Figure 6) and the two pod boundary curves are shown below as follows:
e l u ( x ) = i = 1 n α i x i e l d ( x ) = i = 1 n β i x i x a , b
where, a , b is the value range of x , α i , β i is the corresponding i-order coefficient, and n is the maximum number of pod convex parts. The value here is 15. α i , β i is solved by least squares fitting.
D. Calculation of the central curve of pods c l x . The center curve of pods was calculated according to the two fitted pod boundary curves (Figure 6). The equation used to calculate the pod center curve was as Equation (5).
c l x = e l u x + e l d x / 2
E. Calculation of the cross-section radius curve of the pods. The cross-section radius curve of the pods was calculated based on the two fitted pod boundary curves, whereby the radius of the x-point was half the difference between the corresponding upper boundary and the lower boundary of the pod. The equation of calculation was as follows:
r l x = e l u x e l d x / 2
F. Estimation of the surface area S of the pods. The surface area of the pods was estimated based on the obtained center curve c l x and the cross-section radius curve r l x of the pods (Figure 6). The calculation algorithm used for the surface area of the pod was as follows:
S = 2 π a b r l ( x ) d c l ( x )
where r l x is the cross-section radius curve of the pods, c l x is the center curve of the pods, d c l x is the height of the cylinder for fitting the pod segments, and a and b are the range of x values.
(6) Correction of the pod surface area. The cross-section of the actual pod is not a regular circle but an ellipse. When the radius of a circle is the same as the long axis of the ellipse, the circumference of the circle becomes longer than that of the ellipse. Similarly, the pod surface area measured by the image processing method is theoretically larger than that of the actual pod, and therefore, it is necessary to correct the pod surface area measured by the image processing method. Consequently, pods from different cultivars with varying sizes and shapes were pooled separately for measurement. After the image sampling, the actual area was measured using a high-precision 3-D laser scanning system. The correlation between the measured value of the image processing method and the 3-D area value was analyzed and a correction model was then established to correct the surface area of pods sampled from other images.

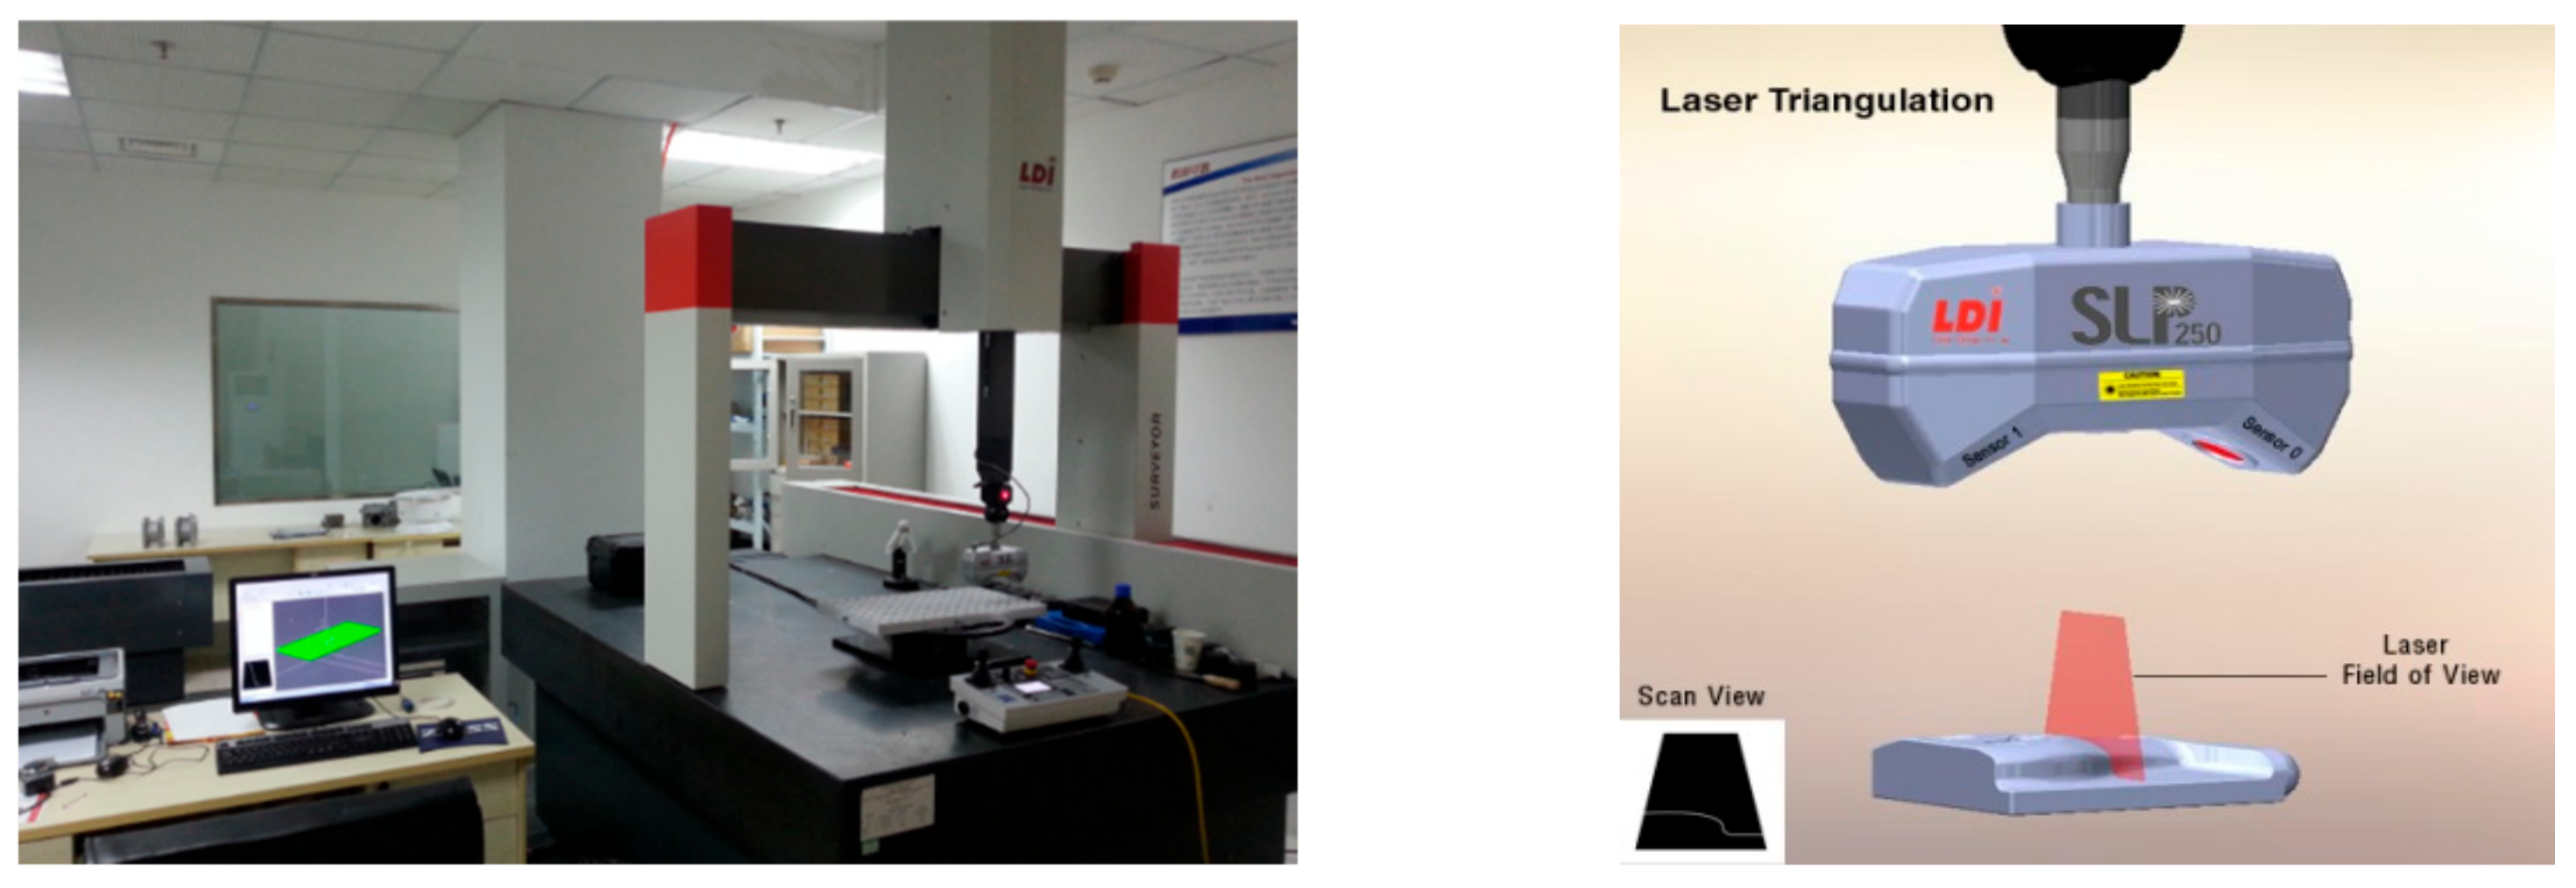
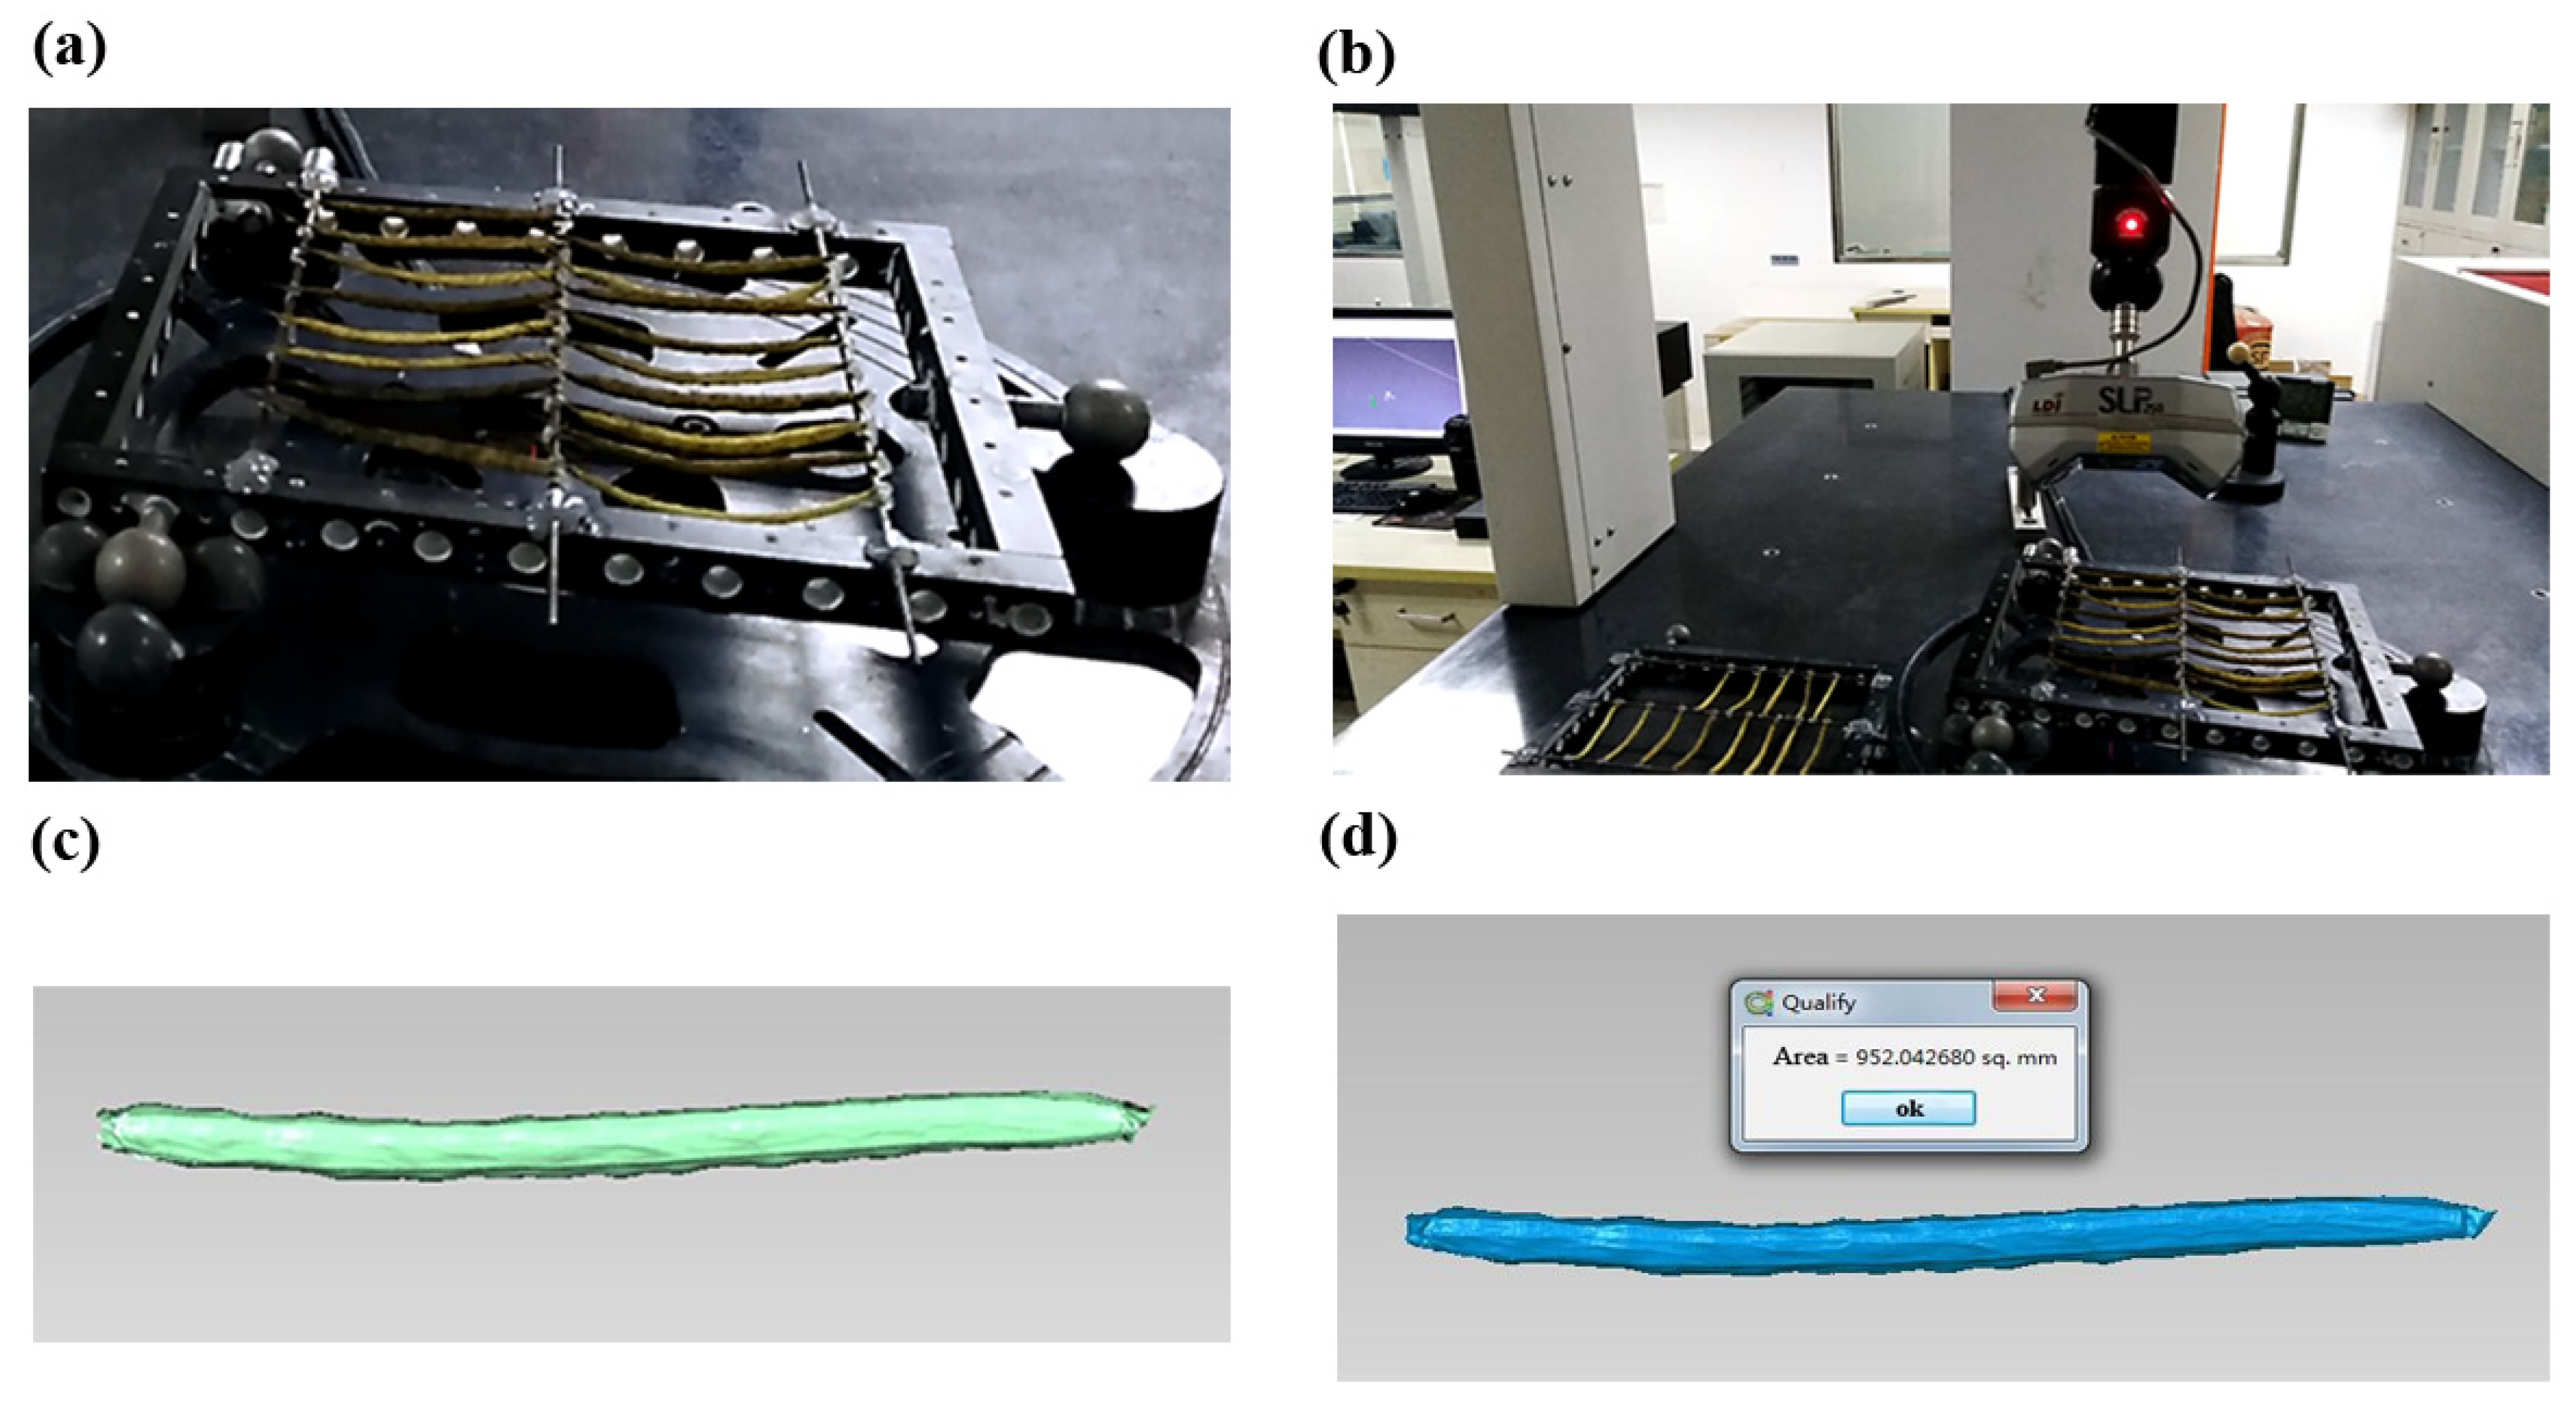
2.3.2. High-Precision 3-D Laser Scanner Measurement Method

The instrument used to measure the actual area of the pods was an LD-SurveyorZS ultra-high precision 3-D laser scanning system (LDI; Logistic Dynamics, Inc., Seattle, WA, USA) (Figure 7). The system configuration included a 3-D laser probe (sensor) system, a probe movement and positioning system, a 3-D laser scanning auxiliary fixture, scanning control software, and data processing software. The laser scanning probe used in this measurement was LDI-SLP250, which is accurate at scanning up to 0.01 mm. It can be used to detect the vast majority of industrial product sizes. The 3-D laser probe was installed on the probe movement and positioning system (mainframe) and calibrated so that the data detected could be converted to the coordinate system of the measuring machine. The 3-D laser probe system was the sensing device used for acquiring 3-D data. It works with a triangular measurement method comprising a high-precision laser transmitter located in the middle of the scanning probe and a CMOS image sensor with a certain angle with the laser projection installed on both sides of the probe. Upon projecting the laser onto the surface of an object, the laser line is misaligned by the different 3-D surface structures. The misalignments are then read and analyzed by the CMOS image sensor. This process, combined with the movement of the probe and the function of its positioning system, enables the 3-D structural data of the measured object surface to be obtained.
No pretreatment was required when the 3-D laser scanning system (described in Figure 7) was used to scan and measure the pods as long as the pods were arranged and fixed on the scanning fixture in sequence (Figure 8). Two fixtures can be used for clamping to improve the efficiency of laser scanning, and a remarkable scanning fixture can hold 20–30 pods at a time. The scanned data are encapsulated by Geomagic Qualify (ControlX; 3-D Systems, Cary, NC, USA). The geometric attributes, such as volume and surface area, can be calculated directly after encapsulating the point cloud data (Figure 8).

2.3.3. The Other Four Measurement Methods Used for Comparison

(1) The Clark formula method [42] is shown below:
S = π d ¯ h 1 + 1 3 π d ¯ h 2 h 1 = 0.8 H , h 2 = 0.2 H
where S is the surface area of the pods, H is the length of the pods, and d ¯ is the average width of the pods. The length and average width of the pods were measured using a ruler and Vernier caliper, respectively.
(2) The Leng formula method [43] is shown below:
S = 0.6 + 2.4 S m S m = L B m
where S is the surface area of the pods, L is the length of the pods, and B m is the maximum width of the pods. The method used for measurement was the same as that of the Clark formula method.
(3) Flattening scanning method: Pods were cut from the middle line, then the two peels were fully flattened and then wrapped with plastic. The surface area of each pod was scanned and measured using a leaf area meter (Li-3000C Portable Area Meter).
(4) Quasi-cylinder side area method [14]. The pods were considered regular cylinders, and the cylinder side area obtained represented the pod surface area as follows:
S = π H D ¯
where S is the surface area of the pods, H is the maximum length of the pods, and D ¯ is the average pod width. The measurement method was the same as that of the Clark formula method.

3. Results and Analysis

3.1. Analysis of the Accuracy of Measurement

Three rape plants were randomly selected from nine plots (three cultivars and three fertility treatments), and three pods of different sizes were picked from each plant, resulting in 81 pods. Among these pods, 54 pods of various sizes were collected from two randomly selected plants from each plot and used as modeling samples to establish a correction model using the image processing method. The remaining 27 pods of different sizes (collected from another plant in each plot) were used as samples to analyze and compare the accuracy and efficiency of measurement between the image processing method and the other four methods. The modeling and test samples described above were randomly selected and were in triplicate.

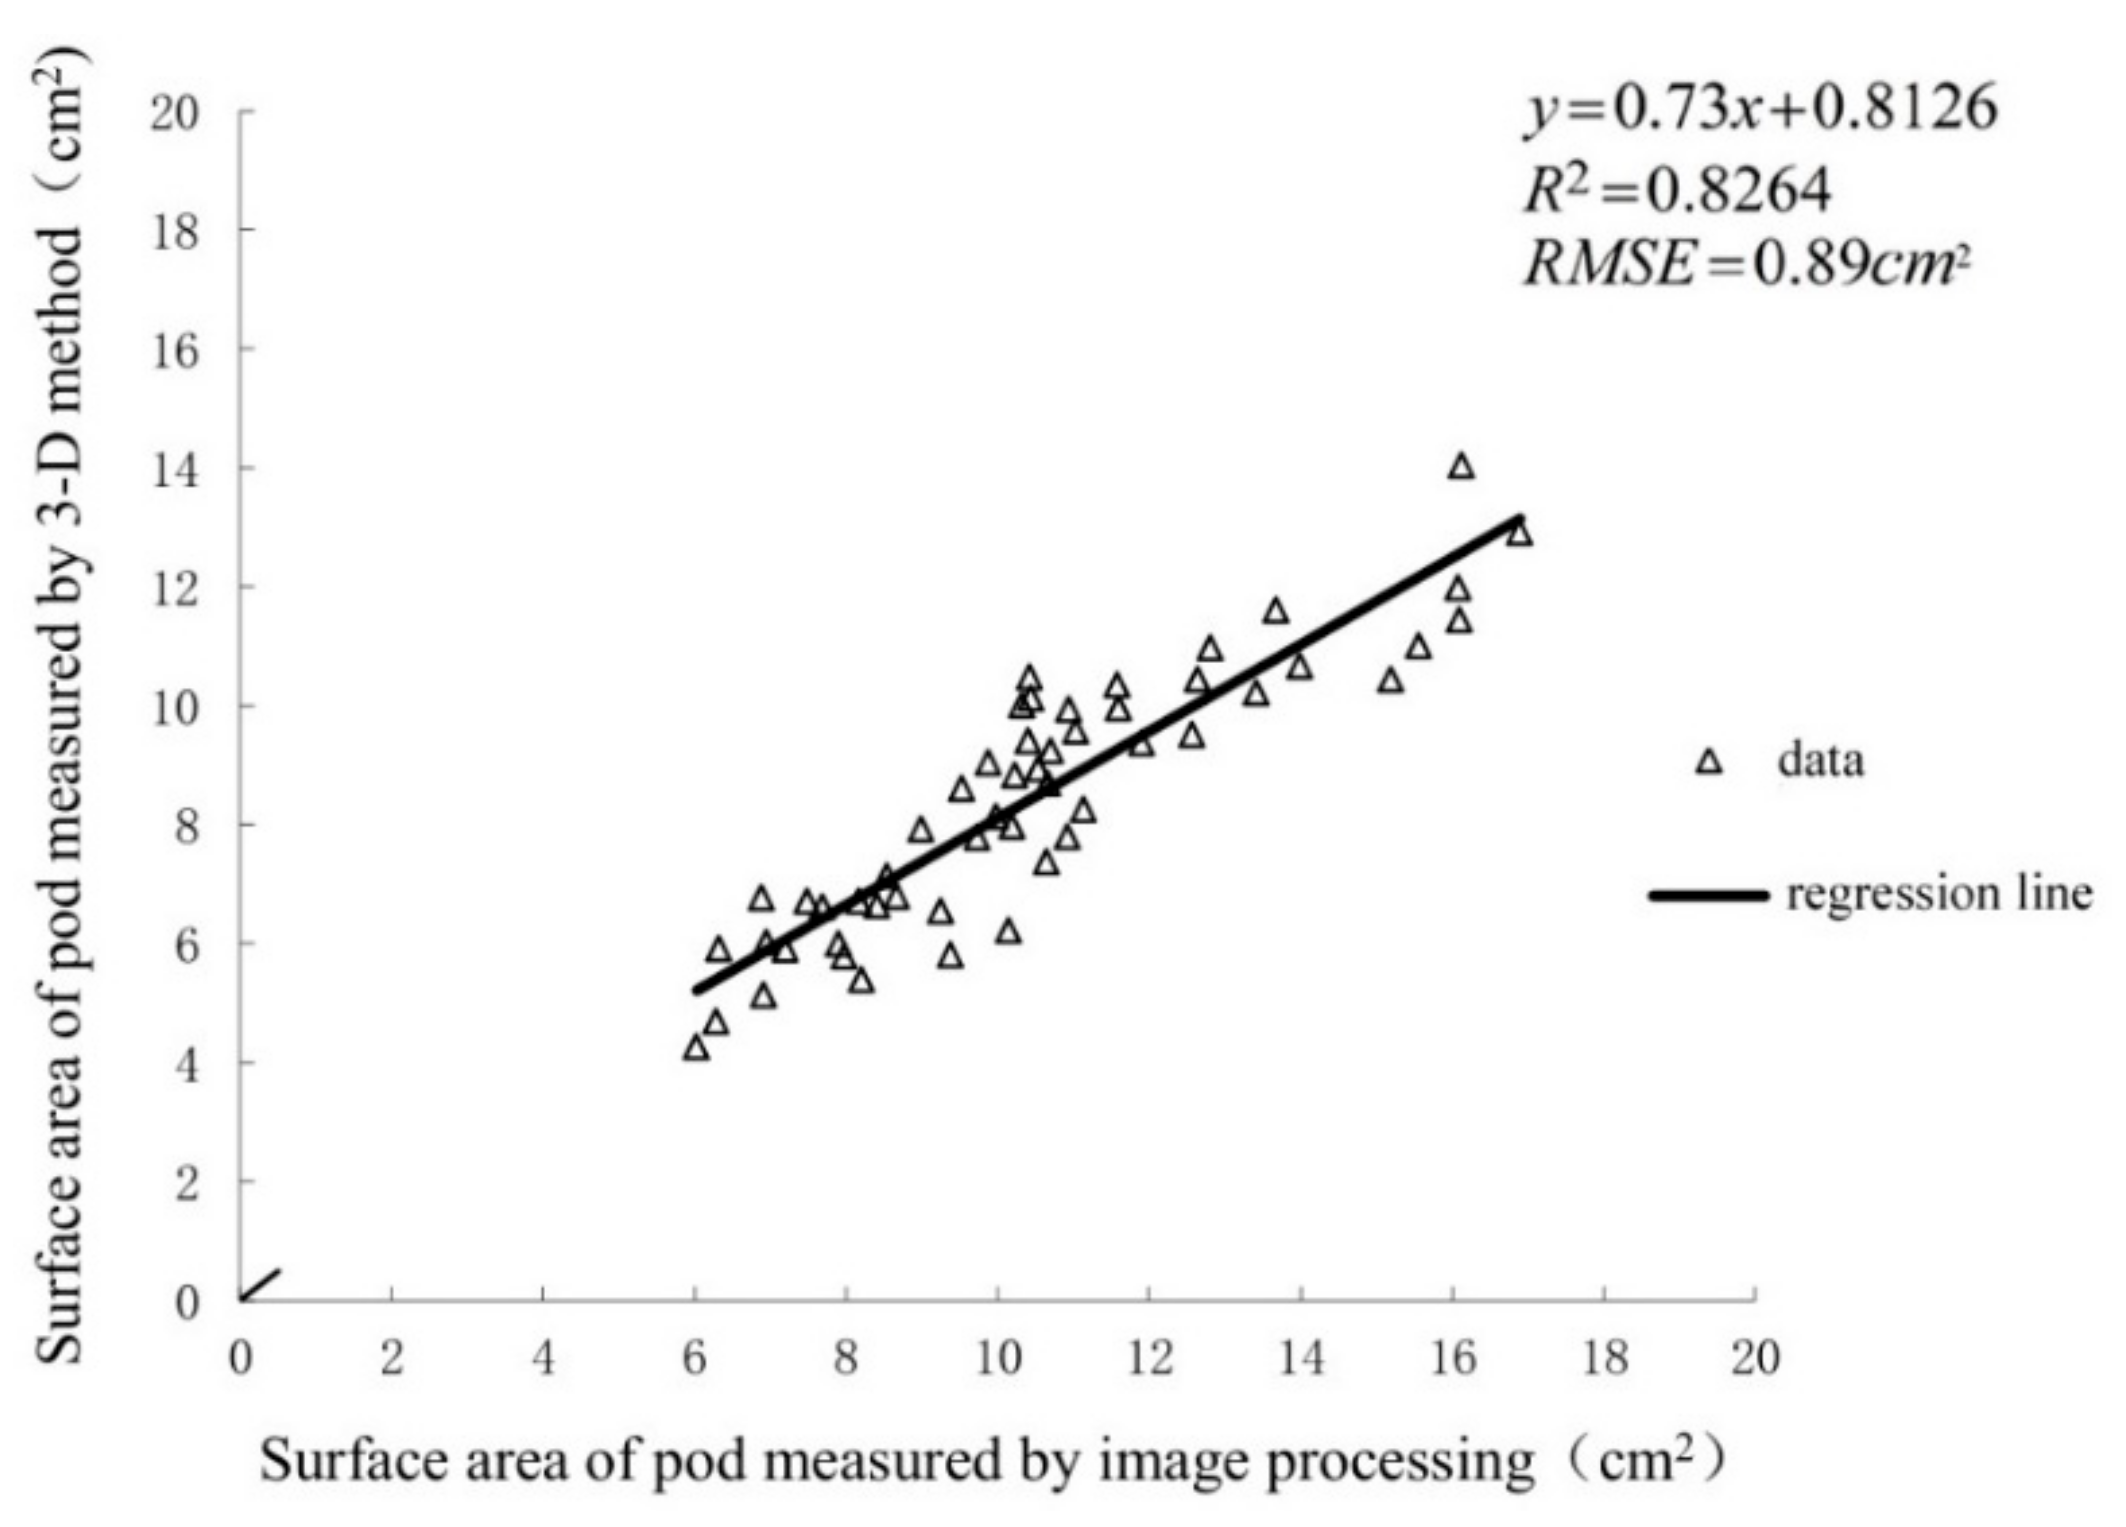
3.1.1. Comparison of the Measurement Results between the Image Processing and 3-D Methods

The measurement results of the modeling samples obtained by the image processing and the 3-D methods were significantly and linearly correlated; the average correlation coefficient R of the three replicates was 0.92 ** (** p < 0.01), which was the same as those used in the following contents. Before the correction, the average area of the modeled sample measured using the image processing method was 1.23-fold larger than that of the 3-D method; this is consistent with the previous proposition that it is essential to correct the measurement results of the image processing method. A univariate linear regression model established using the measurement results of the modeling sample (which utilized the image processing and 3-D methods) was used to correct the measurement results of samples measured using the image processing method. The average relative error of the corrected value compared with that of the 3-D method data was 2.46%, while the average RMSE was 0.92 cm2. An analysis of the accuracy of the image processing methods is shown in Table 1.

3.1.2. Comparison of the Results of the Other Four Measurement Methods with the 3-D Method

Single pods of the test samples described above were measured using the Clark formula, Leng formula, flattening scanning, and quasi-cylinder side area methods. A comparison with the measurement results of the corresponding 3-D method indicated significant measurement errors in the four methods. The flattening scanning method was the most accurate, followed by the Leng formula, Clark formula, and quasi-cylinder side area methods, with an average relative error of 16.53%, 19.51%, 22.10%, and 40.89%, respectively, and an average RMSE of 1.64 cm2, 2.27 cm2, 2.39 cm2, and 3.90 cm2, respectively. An analysis of the accuracy of the other four measurement methods is shown in Table 2. The flattening scanning method was relatively accurate because it involved the direct measurement of fully flattened pods. However, the pods were difficult to flatten completely because of the irregular bulge of the epidermis. In addition, the beak easily fell off during the unfolding of the pod epidermis, resulting in the loss of some portions of the epidermal area. Therefore, the value of the measured result was smaller than that of the corresponding 3-D area. The Leng formula method is similar to that of the Clark formula method, whose principal goal was to indirectly measure the seed pods by establishing the regression model between the pod length, width, and surface areas. The large relative error was because the cultivars and morphological characteristics of the pods used for modeling with the two methods were substantially different from those used in this experiment. For example, the rape cultivars used in the Leng formula method were spring B. napus and spring B. campestris, while the cultivar used in this experiment was winter B. napus. Therefore, when the surface area of the pods was measured using similar coefficient regression methods, the corresponding regression model should be established for the pod group from a particular cultivar and with a certain shape range before measurement. This is the so-called “one measurement and one coefficient” principle. In addition, the “actual surface area of pods” referred to in the regression model established using the Leng and Clark formula methods could be inaccurate owing to the limitation of measurement conditions at that time. The largest error in measurement of the quasi-cylinder side area method could be explained by the highly slender beak of the pods and the position close to the pod handle. The side area is smaller than the cylinder with the average fruit width. Moreover, the cross-sections of the pods were oval or irregular and not a regular circle, resulting in a measured value larger than the 3-D area. Therefore, the four methods could be used directly to accurately measure the pods in this experiment.

3.1.3. Comparison of the Results of Measurement Obtained by the Image Processing Method with Those of the Other Four Methods of Measurement

The same test samples were measured using image processing and the other four measurement methods described above, and the results were analyzed comparatively. The corresponding values of the relative error and the RMSE of measurement (reflecting the degree of dispersion) of the image processing method were lower than those of the other four methods. They were also approximately 14.07% and 0.72 cm2 lower than those of the flattening scanning method, which was the most accurate of the four measurement methods. Therefore, the accuracy was much higher when the image processing method was used when compared to the other four measurement methods. The primary reasons for the increased accuracy of the image processing method were as follows: (a) the image processing method regarded the pod as an irregular cylindrical body composed of several inclined cylinder slices with different diameters, which objectively restored the characteristics of the irregular long-chain bead shape for the pod; and (b) the models of measured values were corrected using image processing, and the 3-D methods were established, which substantially improved the accuracy of measurement. The use of a high-precision 3-D method to measure the actual area of pods had not been previously reported. The high accuracy of such a 3-D method directly determines the high accuracy of our image processing method.
Based on this analysis, we suggest that correcting the measurement results by establishing a correction model is necessary. We introduced the correction step into the image processing method to determine whether more accurate measurements could be obtained by correcting other measurement methods. The comparative analysis was conducted using the same modeling sample and detection sample, considering that the calculations of the Clark formula, Leng formula, and quasi-cylinder side area methods require different coefficients configured with pod length and pod width because modeling and correction using the same samples would lead to the same results. Thus, only the Clark formula method was selected as a representative for comparison. After the calculations, a significant linear correlation was observed between the measurement results of the modeling samples produced by the Clark formula, flattening scanning, and the 3-D method. The results of modeling and accuracy analysis are shown in Table 3. After correction, the measurement accuracy of the Clark formula and flattening scanning methods were significantly improved. The average relative error was 2.72% and 2.74%, respectively, and the average RMSE was 1.15 cm2 and 0.87 cm2, respectively. Comparatively, the modeling correlation coefficient of the image processing and flattening scanning methods was higher than that of the Clark formula method. The smallest average value of relative error was obtained using the image processing method. The flattening scanning method generated the smallest average value of the RMSE, followed by the image processing method. The Clark formula method yielded the largest value. A comprehensive analysis suggests that even if the other measurement methods are corrected, the image processing method still has comparative advantages in the correlation with the actual value, relative error, and degree of dispersion.

3.2. Analysis of Measurement Efficiency

The efficiency of measurement was tested using modeling and detection samples (81 pods) during the precision analysis of the experiment. Using the Leng formula and quasi-cylinder side area methods, we performed the calculations by only measuring the pod length and width with similar efficiency. The Clark formula was the only method that was selected as the representative for testing. The 81 pods were measured using image processing, flattening scanning, and Clark formula methods. Each method was conducted by the same person and timed with a stopwatch. Using the image processing method, the time for placing and shooting was 172 s. This value excluded the preparation time, such as preliminary numbering, which was the same as those used in the following methods. The time for subsequent image processing was 162 s, and the measurement time was 334 s. For the flattening scanning method, the common time of flattening and plastic wrapping, scanning, and measurement were 1620 s, 405 s, and 2025 s, respectively. The length and width measurement of pods using the Clark formula method was 567 s. Since data post-processing with these three methods could be performed in batches, the post-processing time was not recorded, and the operation time was the total measurement time. The analysis of the “efficiency test” used above found that the image processing method was the most efficient, followed by the Clark formula method. The flattening scanning method was the least efficient.

3.3. Analysis of the Results of Measurement for Multiple Pod Surface Areas

Multi-pod measurements were conducted on 83 rape plant samples in the pod stage using the image processing method. The results were corrected by the correction model established during replicate 2 of the accuracy test experiment (Figure 9). Five people were selected to take photos of the pods during the early period of the experiment, and four were responsible for image processing during the later period. A total of 1203 pod photos were processed; this took approximately 20 h. The measurement of 39,501 pods from 83 rape plant samples provided a total surface area of 330,189 cm2; the average surface area of pod per plant was 3978 cm2. The average surface area of the pods from each plant (A1, A2, A3, B1, B2, and B3) were 3403 cm2, 3943 cm2, and 4567 cm2, and 3435 cm2, 4127 cm2, and 4451 cm2, respectively. The measurement results of the pod surface areas of the samples from different cultivars and fertility treatments were significantly different, consistent with our experimental design concept.

4. Discussion

4.1. 3-D Measurement Method and a Comparison of Image Processing Methods

In this experiment, the “high accuracy, high efficiency, and large scale” measurement of rapeseed pods was realized using the image processing method. The key link was to use the 3-D measurement method to measure the “actual surface area” of a small number of rapeseed pods and use this value as the basis for correcting the measured value of the image processing method. A key question is: why not directly use the 3-D measurement method to measure the surface area of rapeseed pods and develop this image processing method? This is primarily because of the limitations and shortcomings of the 3-D measurement method itself. First, although the 3-D measurement method is highly accurate, many preparations are necessary before the values can be measured, and the operation is more complicated. It requires special measurement equipment and software, which has high requirements for the surveyor and is difficult for general staff to master. Secondly, the 3-D measurement is relatively inefficient. According to the 3-D measurement reported in this experiment as an example, it is necessary to pack the pods, scan with the 3-D scanning camera, and perform calculations with platform-specific software. Among them, only the scanning link takes a long time. For example, this experiment takes 7 or 8 min to scan 12 pods at a time, so it is difficult to scan thousands of pods in a short time. In addition, freshly harvested pods generally stay fresh for approximately 3 days, which does not allow adequate time for their measurement. Third, the 3-D measurement equipment and platform are expensive, and the construction needed to use them is very expensive [44]. The ultra-precision and high-speed 3-D laser scanning system LDI-SurveyorZS (LDI-SLP250) used in this experiment is worth more than one million RMB. The image processing method is typically more convenient to operate. The only equipment needed is a digital camera, tripod, and other conventional equipment. It is also highly efficient at measuring. Because the correction link for the measurement result is designed, the measurement accuracy can also meet the needs of crop science research. Therefore, combining the image processing method and the 3-D measurement method for the “actual area” measurement of a few rape pods establishes a correction model of the image processing method, which is easier to operate, more efficient, and economical for measuring the surface area of several rapeseed pods.

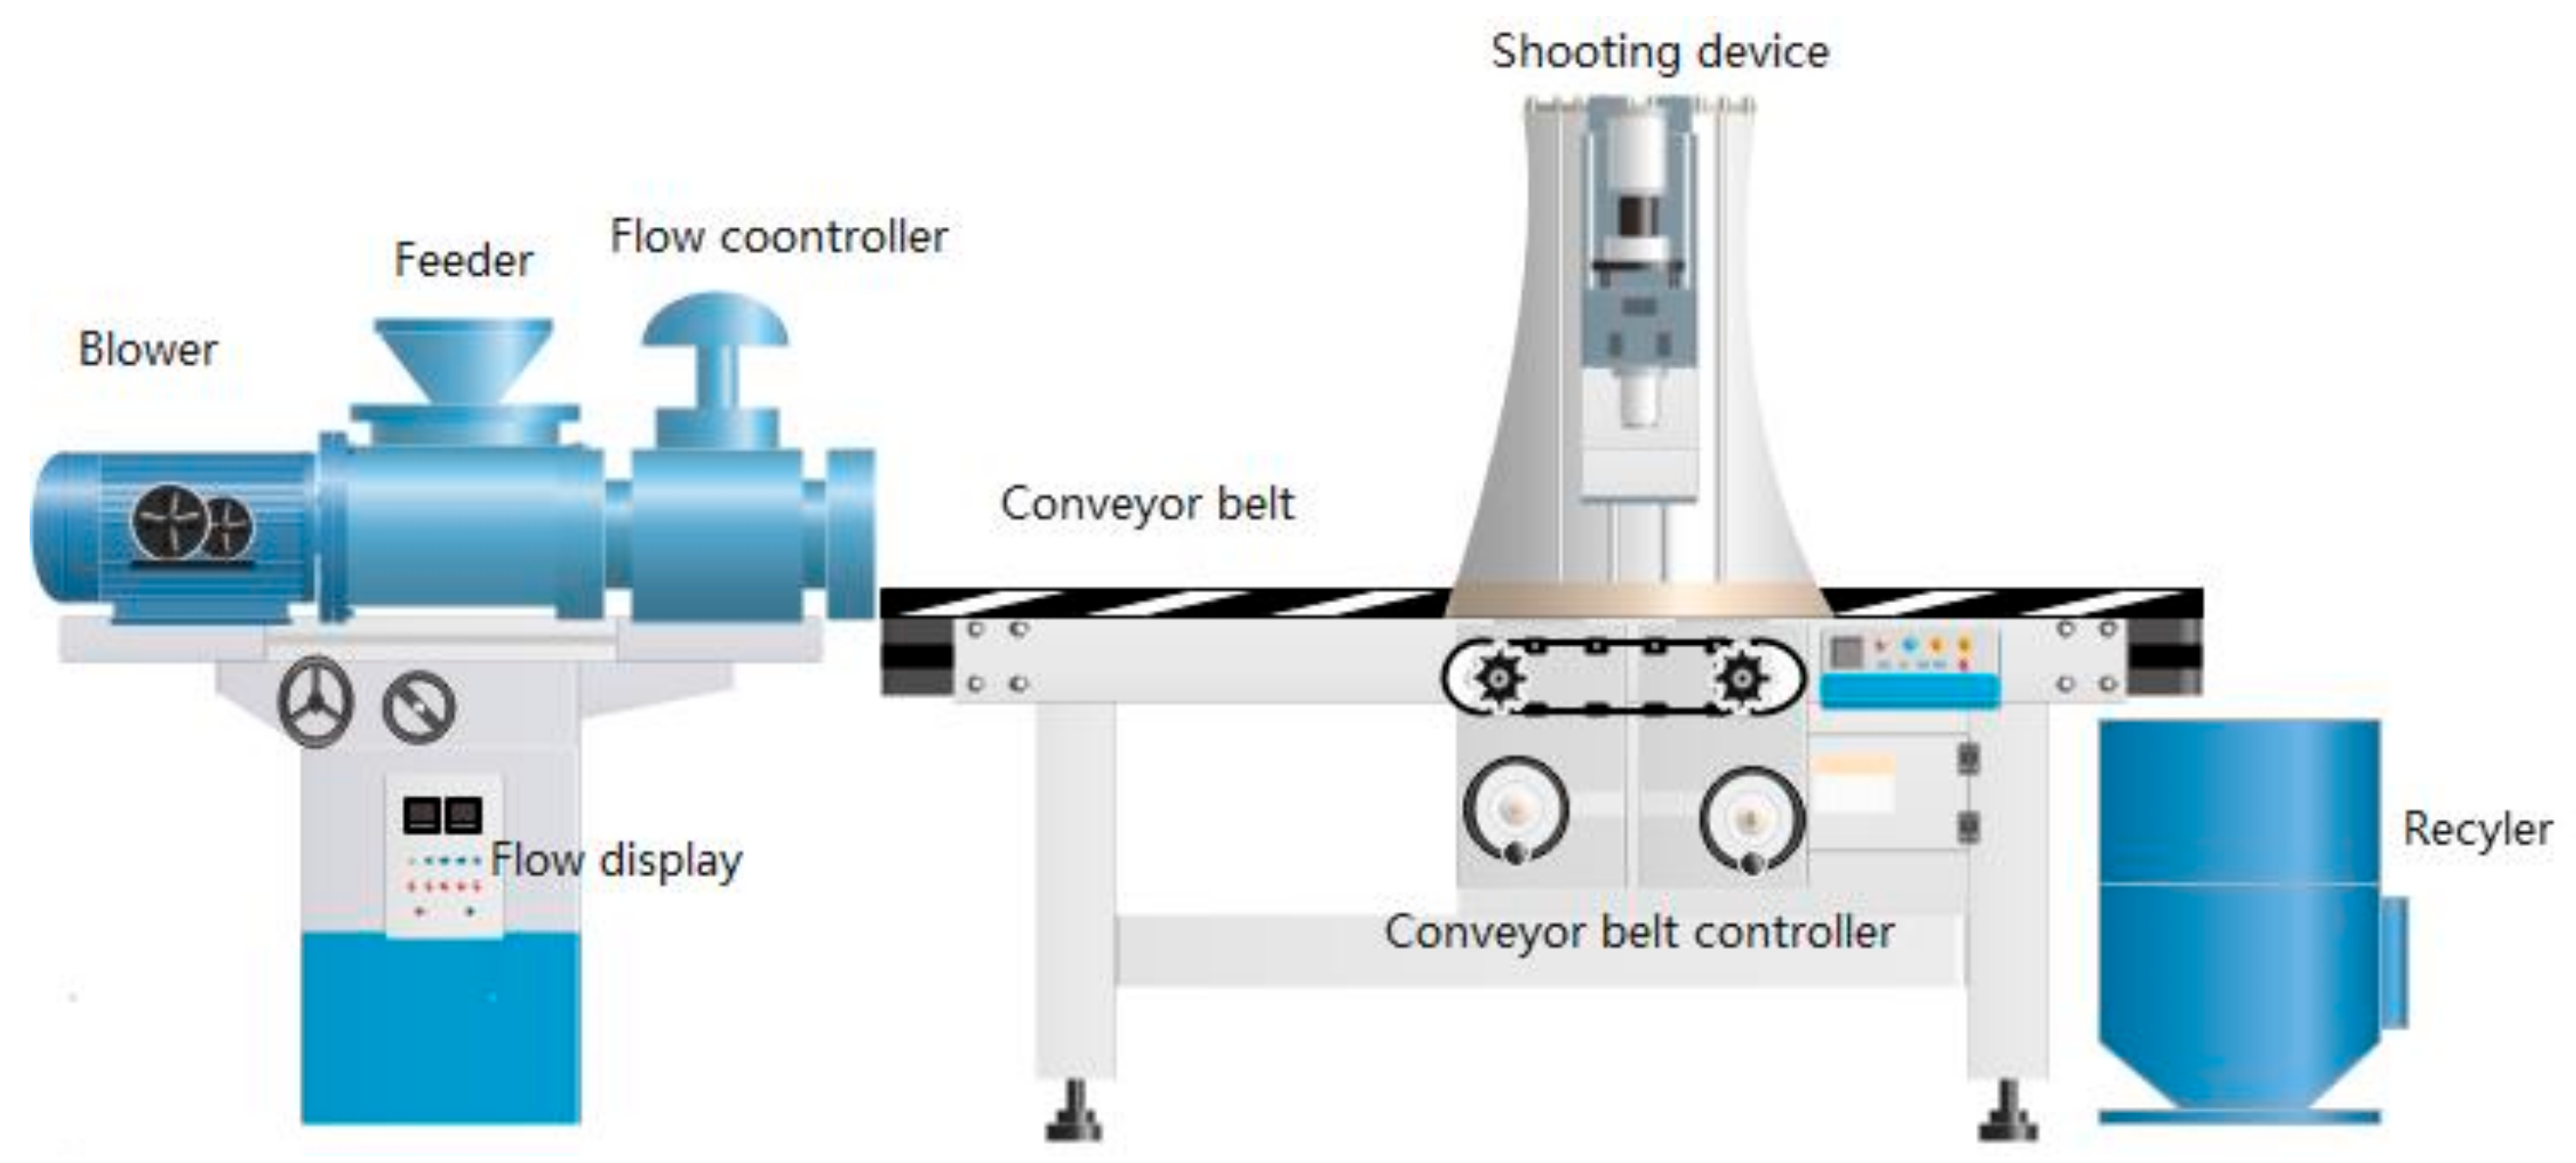
4.2. The Application of Image Processing Technology in a Future Rapeseed Pod Testing Machine

With the continuous increase in crop phenomics, researchers are committed to developing various phenomics analytical platforms [45]. The combination of these platforms with various “omics” studies will trigger a new technological revolution, and the “high-throughput phenomics era” [46] will profoundly affect the development of various fields of crop science. As an important index of rapeseed plant type, the technology for measuring the surface areas of rapeseed pods will be reconstructed from theory and technology by integrating robot technology, sensor technology, optics, cloud computing, and artificial intelligence. The technology will then be developed to ensure automation, high efficiency and accuracy, mass, and simple and easy operation. The image processing measurement technology of the rapeseed pod surface area proposed in this study will provide a design principle for the future design of a rapeseed pod testing machine with high-throughput characteristics. The basic framework and design ideas are as follows:
(1) Conceptual design. The rapeseed pod testing machine is roughly composed of three parts: a pod transmission device, an image acquisition device, and a data processing software platform. The pod transmission device primarily automates pod placement, eliminating the involvement of people in the placement process. The pods are automatically and efficiently evenly placed through the transmission device. After the image acquisition device takes photos, it automatically places and transmits the next set of pods. The image acquisition device closely cooperates with the pod transmission device and rhythmically takes photos that conform to the later image segmentation and data processing. The data processing software platform is primarily used to process the pod images and calculate the related phenotypic indices.
(2) Overall design. The conceptual design described above indicates that the rapeseed pod test machine primarily comprises three parts, as shown in Figure 10. The pod conveying device primarily comprises a feeder, blower, flow controller, conveyor belt, rapeseed pods, and other components. The blower evenly disperses many accumulated pods, which fall evenly on the conveyor belt without overlapping and blocking. The flow controller includes a valve to control the density of the pod by controlling the size of the airflow from the blower. The conveyor belt is a pod conveyance device and a background for pod shooting made of white plastic material. The image acquisition device is permanently installed on the conveyor belt and made as a dark box to prevent external light interference. The top surface of the interior is equipped with a mobile phone or a digital camera bracket, and an LED flat lamp is installed to ensure that the shooting light source is stable and sufficient. The data processing software platform primarily comprises computer and special data processing software. For the convenience of operation, the data processing platform can also operate and control the machine.
(3) Operational process. The device is started after manual feeding, and the accumulated pods are evenly blown onto the conveyor belt under the combined action of gravity and the blower. The scattered pods keep a certain rhythm and speed in the dark box. The system software controls the mobile phone or digital camera to shoot the scattered pods and then performs the subsequent image processing and data calculation.

5. Conclusions

In this study, we proposed an image processing method in which the pod was regarded as an irregular cylinder composed of several inclined cylinder slices with different diameters. We showed that the surface area of the pods could be calculated as the sum of the side areas of all the inclined cylinder slices by calculus, and the corresponding empirical study was also conducted. The application of this method allows for “highly accurate, highly efficient and large-scale” measurement of numerous rapeseed pods. “Highly accurate” stems from the fact that this method uses image processing technology and calculus principles to transform the pod image into a mathematical model that can be calculated by a computer, which restores the basic characteristics of rapeseed pods. The high-precision 3-D method was first used to measure and correct the actual area of pods, which is also a vital premise to ensure “high accuracy.” Our experiment proved that the image processing method is more accurate than the four commonly used methods, such as the Clark formula. “Highly efficient” can be explained by the fact that no manual or instrumental measurement is needed for the pods, which only need an orderly arrangement in a suitable background and position for photography. This process is completed by multiple people, which substantially improves measurement efficiency. Currently, pods are arranged and photographed manually during the measurement process. Thus, the measurement efficiency will be significantly improved if automatic batch operation by machines can be achieved in the future. “Large scale” primarily lies in the achievement of measuring multiple pods. Since an assembly line operation process has been established for placing and photographing the pods, the corresponding photos serve as records, facilitating subsequent inspection, thus avoiding repeated and missed measurements or errors. This study measured the surface area of nearly 40,000 pods from three different rape cultivars subjected to three different fertility treatments. The process did not involve many people, and neither was it time-consuming. The measurement results met the expectations of the experimental design and achieved the measurement aim of “highly accurate, highly efficient, and large-scale” for the surface area of rapeseed pods. Therefore, this method provides technical support for the surface area measurement of numerous rapeseed pods.

Author Contributions

Conceptualization, C.G., M.G., H.H. and F.L.; methodology, X.L. and F.L.; software, X.L. and H.X.; data analysis, F.L.; investigation, F.L. and X.L.; writing—original draft preparation, F.L.; writing—review, M.G. and H.H.; funding acquisition, M.G., F.L. and X.L.; All authors have read and agreed to the published version of the manuscript.

Funding

This research was funded by the China Agriculture Research System of MOF and MARA (CARS-13); Hunan Agriculture Research System of DARA, China; the Project from the Department of Education of Hunan Province, China (20C0970); and the Key research projects of Science and Technology Department of Hunan Province, China (2022NK2047).

Institutional Review Board Statement

Not applicable.

Informed Consent Statement

Not applicable.

Data Availability Statement

Not applicable.

Conflicts of Interest

The authors declare no conflict of interest.

References

  1. Guan, C.Y. Fruiting Organs and Yield Formation in Rapeseed; Science Press: Beijing, China, 2017. [Google Scholar]
  2. Ling, Q.H. Crop Population Quality; Shanghai Scientific & Technical Publishers: Shanghai, China, 2000. [Google Scholar]
  3. Leng, S.H.; Tang, Y.; Li, Q.L.; Zuo, Q.S.; Yang, P. Studies on source and sink of rapeseed Ⅰ. Regulation of pod size on source and sink in rapeseed after flowering. Chin. J. Oil Crop Sci. 2005, 27, 37–40. [Google Scholar]
  4. Guan, C.Y. Physiological Ecology and Modern Cultivation Techniques of High-Quality Rapeseed; China Agriculture Press: Beijing, China, 2013. [Google Scholar]
  5. Inanaga, S.; Kumura, N.; Murata, Y. Research on material production on rapeseed- characteristics of photosynthesis and material production in pod layer. Chin. J. Oil Crop Sci. 1981, 3, 84–87. [Google Scholar]
  6. Inanaga, S.; Kumura, N.; Murata, Y. Research on material production on rapeseed-photosynthesis, respiration and carbon metabolism of pod. Chin. J. Oil Crop Sci. 1981, 3, 74–78, 81. [Google Scholar]
  7. Chen, T. Influence of Leaf and Silique Photosynthesis on Seeds Yield and Seed Soil Quality of Oilseed Rape; Northwest A&F University: Yangling, China, 2016. [Google Scholar]
  8. Li, N.; Song, D.J.; Peng, W.; Zhan, J.P.; Shi, J.Q.; Wang, X.F.; Liu, G.H.; Wang, H.Z. Maternal control of seed weight in rapeseed (Brassica napus L.): The causal link between the size of pod (mother, source) and seed (offspring, sink). Plant Biotechnol. J. 2019, 17, 736–749. [Google Scholar] [CrossRef]
  9. Leng, S.H.; Zhu, G.R. Calculation Method of Rapeseed pod Surface Area. Chin. J. Oil Crop Sci. 1991, 13, 76–77. [Google Scholar]
  10. Liu, H.L. Cultivation of Rape; Shanghai Scientific & Technical Publishers: Shanghai, China, 1987. [Google Scholar]
  11. Wang, H.X. Effects of Seeding Quantity and Fertilizer Treatments on the Structural Characters of Rape Silique Layer. J. Anhui Agric. Sci. 2017, 45, 33–36. [Google Scholar]
  12. Liu, R.F.; Huang, S.Y.; Nie, Y.P.; Xu, S.Y. Automated detection research for number and key phenotypic parameters of rapeseed silique. Chin. J. Oil Crop Sci. 2020, 42, 71–77. [Google Scholar]
  13. Wang, C.L.; Hai, J.B.; Yang, J.L.; Tian, J.H.; Chen, W.J.; Chen, T.; Luo, H.B.; Wang, H. Influence of leaf and silique photosynthesis on seeds yield and seeds oil quality of oilseed rape (Brassica napus L.). Eur. J. Agron. 2016, 74, 112–118. [Google Scholar] [CrossRef]
  14. Chen, X.C.; Wang, H.H.; Gu, Z.Q. Study on the Measurement of Rape Pod Surface Area. J. Hubei Agric. Coll. 2004, 24, 170–173. [Google Scholar]
  15. Zhang, Y.W.; Wang, Z.Y.; Li, D.R.; Zhang, X.; Chen, W.J.; Tian, J.H. Study on Diurnal Changes of Photosynthetic Characteristics in Pods of Brassica napus. Acta Agric. Boreali-Occident. Sin. 2008, 17, 174–180. [Google Scholar]
  16. Leng, S.H.; Yang, G.; Chen, X.L.; Chen, W.D.; Ye, J.A. Effects of N application on pod characteristics among different layer of pod canopy in Ningza No. 1 (Brassica napus L.). Chin. J. Oil Crop Sci. 2002, 24, 25–28. [Google Scholar]
  17. Gao, J.Q.; Pu, H.M.; Long, W.H.; Chen, X.J. Changes in dry matter and oil accumulation during pod development of rapeseed. Jiangsu Agric. Sci. 2007, 35, 50–52. [Google Scholar]
  18. Ding, X.Q. Study on characters of silique and seed in spring rape (B. campestris L.). Chin. J. Oil Crop Sci. 1996, 18, 28–30. [Google Scholar]
  19. Bai, Y.Z. The research for the growing course of three kinds rapeseed and rapefruit. J. Xinjiang Norm. Univ. (Nat. Sci. Ed.) 1993, 12, 54–57. [Google Scholar]
  20. Pu, H.M.; Qi, C.K.; Fu, S.Z. The growth characteristics and source-sink effect of pods in rapeseed. Jiangsu Agric. Sci. 1993, 21, 22–25. [Google Scholar]
  21. Zhao, H.; Sun, C.C. Study on the Relationship between the morphological differences of pod and seeds in Brassica napus. Shanghai Agric. Sci. Technol. 1990, 20, 17–19. [Google Scholar]
  22. Wang, C.L.; Wang, Z.L.; Chen, T.; Yang, J.L.; Chen, W.J.; Mu, J.X.; Tian, J.H.; Zhao, X.G. Relationship between Yield and Photosynthesis of Leaf and Silique of Different Brassica napus L. Varieties during Reproduction Period. Acta Bot. Boreali-Occident. Sin. 2016, 36, 1417–1426. [Google Scholar]
  23. Li, C.F.; Wang, C.F. Effects of nitrogen nutrition on pods development in rape (B. napus). Acta Agron. Sin. 1988, 14, 329–335. [Google Scholar]
  24. Mao, F.R.; Wang, L. Measurement Technology of 3D Laser Scanning. J. Astronaut. Metrol. Meas. 2005, 25, 1–6. [Google Scholar]
  25. Tong, S.; Xu, X.G.; Yi, C.T.; Shao, C.Y. Overview on vision-based 3D reconstruction. Appl. Res. Comput. 2011, 28, 2411–2417. [Google Scholar]
  26. Yang, B.S.; Liang, F.S.; Huang, R.G. Progress, Challenges and Perspectives of 3D LiDAR Point Cloud Processing. Acta Geod. Cartogr. Sin. 2017, 46, 1509–1516. [Google Scholar]
  27. Sun, Y.C.; Ge, B.Z.; Zhang, Y.M. Review for the 3D Information Measuring Technology. J. Optoelectron.·Laser 2004, 15, 248–254. [Google Scholar]
  28. Nguyen, H.; Nguyen, D.; Wang, Z.Y.; Kieu, H.; Le, M. Real-time, high-accuracy 3D imaging and shape measurement. Appl. Opt. 2015, 54, A9–A17. [Google Scholar] [CrossRef] [PubMed]
  29. Ma, L.G. Classification and Application of Terrestrial Laser Scanners. Geospat. Inf. 2005, 3, 60–62. [Google Scholar]
  30. Rantung, J.; Oh, J.M.; Kim, H.K.; Oh, S.J.; Kim, S.B. Real-Time Image Segmentation and Determination of 3D Coordinates for Fish Surface Area and Volume Measurement based on Stereo Vision. J. Inst. Control. Robot. Syst. 2018, 24, 141–148. [Google Scholar] [CrossRef]
  31. Reichert, J.; Schellenberg, J.; Schubert, P.; Wilke, T. 3D scanning as a highly precise, reproducible, and minimally invasive method for surface area and volume measurements of scleractinian corals. Limnol. Oceanogr.-Methods 2016, 14, 518–526. [Google Scholar] [CrossRef]
  32. Sholts, S.B.; Warmlander, S.K.T.S.; Flores, L.M.; Miller, K.W.P.; Walker, P.L. Variation in the Measurement of Cranial Volume and Surface Area Using 3D Laser Scanning Technology. J. Forensic Sci. 2010, 55, 871–876. [Google Scholar] [CrossRef]
  33. Telfer, S.; Woodburn, J. The use of 3D surface scanning for the measurement and assessment of the human foot. J. Foot Ankle Res. 2010, 3, 19. [Google Scholar] [CrossRef]
  34. Lee, H.Y.; Hong, K.; Kim, E.A. Measurement protocol of women’s nude breasts using a 3D scanning technique. Appl. Ergon. 2004, 35, 353–359. [Google Scholar] [CrossRef]
  35. Villordon, A.; Gregorie, J.C.; LaBonte, D. Direct Measurement of Sweetpotato Surface Area and Volume Using a Low-cost 3D Scanner for Identification of Shape Features Related to Processing Product Recovery. Hortscience 2020, 55, 722–728. [Google Scholar] [CrossRef]
  36. Villordon, A.Q.; LaBonte, D. Using a Low-cost 3D Scanner for Non-destructive Measurement of Surface Area and Volume of Storage Roots in Postharvest Research. Hortscience 2017, 52, S65. [Google Scholar]
  37. SGKS. LDI Ultra-High Precision 3D Laser Scanning Measurement System. 2022. Available online: http://www.sgkslabs.com/resources-v.asp?id=2 (accessed on 20 August 2022).
  38. Li, X.M.; Deng, Y.P.; Wang, X.H.; Li, F.Y.; Guan, C.Y. A New Method for Rapid Estimation of Rapeseed Pod Surface Area. China CN201911170476, 21 February 2020. [Google Scholar]
  39. Tang, Q.Y.; Zhang, C.X. Data Processing System (DPS) software with experimental design, statistical analysis and data mining developed for use in entomological research. Insect Sci. 2013, 20, 254–260. [Google Scholar] [CrossRef]
  40. James, S. Calculus; World Publishing Corporation: Beijing, China, 2004. [Google Scholar]
  41. Li, X.M.; Wang, X.H.; Wei, H.L.; Zhu, X.G.; Peng, Y.L.; Li, M.; Li, T.; Huang, H. A technique system for the measurement, reconstruction and character extraction of rice plant architecture. PLoS ONE 2017, 12, e0177205. [Google Scholar] [CrossRef] [PubMed]
  42. Li, C.; Chen, J.H.; Shang, W.Y. Study on the processes of the development of pods and seeds in Brassica napus L. Chin. J. Oil Crop Sci. 1988, 10, 23–26. [Google Scholar]
  43. Leng, S.H.; Hui, F.H.; Zuo, Q.S.; Tang, Y. Regulations of N application on pod qualities of different branches in rapeseed. Chin. J. Oil Crop Sci. 2003, 25, 60–63. [Google Scholar]
  44. Zhang, Q.F.; Sun, X.S. Measuring Principle and Developmental Prospect of 3D Laser Scanner. Beijing Surv. Mapp. 2011, 25, 39–42. [Google Scholar]
  45. Duan, L.F.; Yang, W.N. Research advances and futurescenarios of rice phenomics. Chin. Bull. LifeSciences 2016, 28, 1129–1137. [Google Scholar]
  46. Mu, J.H.; Chen, Y.Z.; Feng, H.; Li, W.J.; Zhou, L.B. A new revolutionin crop breeding: The era of high-throughput phenomics. Plant Sci. J. 2016, 34, 962–971. [Google Scholar]
Figure 1. Two dimensions of the surface area measurement of rapeseed pods.
Applsci 13 05129 g001
Figure 2. Research flowchart of the proposed methodology for measuring the rapeseed pod surface area.
Applsci 13 05129 g002
Figure 3. The image acquisition scheme.
Applsci 13 05129 g003
Figure 4. Diagram of coordinate transformation points.
Applsci 13 05129 g004
Figure 5. Image processing process: (a) Image processing system interface; (b) Loading the artwork; (c) Image preprocessing; (d) Image segmentation; (e) Filling and removing impurities.
Applsci 13 05129 g005aApplsci 13 05129 g005b
Figure 6. The indices related to rapeseed pods and their surface area calculation. (a) Rapeseed pod curve of calculations of the boundary, center, and cross-section radius curves; (b) Calculation of the side area of the cylinder of rape pod slice.
Applsci 13 05129 g006
Figure 7. LDI-Surveyor ZS/SLP ultra-high accuracy high-speed 3-D laser scanning system and the structure of scanning probe.
Applsci 13 05129 g007
Figure 8. Scanning of rapeseed pods using a 3-D laser scanning system and the data processing process: (a) Pod scanning fixture; (b) Process for the 3-D laser scanning system to scan pods; (c) Pod selection; (d) Calculation of the pod surface area.
Applsci 13 05129 g008
Figure 9. Correction model established by image processing method and the 3-D method. The range of the pod surface area was measured as 6.03–16.89 cm2.
Applsci 13 05129 g009
Figure 10. Design model of rapeseed pod testing machine.
Applsci 13 05129 g010
Table 1. Analysis of the accuracy of results measured by the image processing method.
ExperimentThe Model Established with the Modeling SamplesAccuracy Analysis of the Testing Samples
Number of SamplesThe Average Measurement Value of the 3-D Method (cm2)The Average Measurement Value of the Image Processing Method (cm2)Correlation CoefficientNumber of SamplesThe Average Measurement Value of the 3-D Method (cm2)The Average Measurement Value of the Image Processing Method (cm2)Relative ErrorRMSE (cm2)
Replicate 1548.4410.250.92 **278.428.743.78%0.95
Replicate 2548.4610.470.91 **278.398.251.67%0.89
Replicate 3548.4010.410.91 **278.498.331.93%0.93
Average548.4310.380.92 **278.438.442.46%0.92
Note: The model established with the modeling samples: A total of 54 pods from different sizes of two rapeseed plants were randomly selected from each plot as modeling samples. The surface area of pods was measured by 3-D and image processing methods, respectively. The values measured by the two methods were analyzed by regression analysis and a correction model was established. An analysis of the accuracy of the testing samples was performed as follows: A total of 27 pods with different sizes of another rapeseed plant in each plot were used as test samples. The surface area of pods was measured using a 3-D method and image processing, respectively, and then the correction model was used to correct the measured value of the image processing method. The corrected value was compared with the measured value of the 3-D method, i.e., an accuracy analysis. “**” means significant test p < 0.01.
Table 2. Analysis of the accuracy of the measurement results using the other four methods.
ExperimentNumber of SamplesThe Average Measurement Value of the 3-D Method (cm2)Clark Formula MethodLeng Formula MethodFlattening Scanning MethodQuasi-Cylinder Side Area Method
The Average Measurement Value (cm2)Relative ErrorRMSE (cm2)The Average Measurement Value (cm2)Relative ErrorRMSE (cm2)The Average Measurement Value (cm2)Relative ErrorRMSE (cm2)The Average Measurement Value (cm2)Relative ErrorRMSE (cm2)
Replicate 1278.4210.6326.25%2.6410.4323.80%2.527.2114.43%1.6612.2745.67%4.24
Replicate 2278.3910.0820.15%2.129.8517.44%1.996.7819.10%1.7811.6338.63%3.61
Replicate 3278.4910.1919.92%2.409.9617.30%2.327.1316.05%1.4911.7538.37%3.86
Average278.4310.3022.10%2.3910.0819.51%2.277.0416.53%1.6411.8840.89%3.90
Note: The 27 test samples used in the accuracy analysis of these image processing methods were also used to measure the pod surface area with the 3-D method and the other four methods shown above. The values measured by these four methods were compared with the 3-D method.
Table 3. Comparison of the accuracy of measurement of the correction results between the image processing method and the other two methods.
ExperimentNumber of SamplesThe Average Measurement Value of the 3-D Method (cm2)Image Processing MethodClark Formula MethodFlattening Scanning Method
Correlation Coefficient of ModellingThe Average Measurement Value (cm2)Relative ErrorRMSE (cm2)Correlation Coefficient of ModellingThe Average Measurement Value (cm2)Relative ErrorRMSE (cm2)Correlation Coefficient of ModellingThe Average Measurement Value (cm2)Relative ErrorRMSE (cm2)
Replicate 1278.420.92 **8.743.78%0.950.87 **8.784.21%1.090.96 **8.713.47%1.18
Replicate 2278.390.91 **8.251.67%0.890.85 **8.251.59%1.090.92 **8.044.15%0.86
Replicate 3278.490.91 **8.331.93%0.930.88 **8.292.37%1.260.90 **8.540.59%0.58
Average278.430.92 **8.442.46%0.920.87 **8.442.72%1.150.92 **8.432.74%0.87
Note: The correction method of the image processing, Clark formula, and the flattening scanning methods were modeled, and the values measured were corrected with the same modeling and testing samples. The correction values measured by the two methods were compared with those measured by the image processing method. “**” means significant test p < 0.01.
Disclaimer/Publisher’s Note: The statements, opinions and data contained in all publications are solely those of the individual author(s) and contributor(s) and not of MDPI and/or the editor(s). MDPI and/or the editor(s) disclaim responsibility for any injury to people or property resulting from any ideas, methods, instructions or products referred to in the content.

