1. Introduction
The current energy transition, required by the environmental sustainability problem of recent decades, is changing the paradigm of electricity generation. The current centralized generation model is being replaced by a model of distributed generation and an increasing presence of generation capacity based on renewable energy sources (RESs).
The energy transition is changing the characteristics of the electric power system (EPS). One of the most important properties of an EPS is system stability, especially transient stability.
The power system is constantly exposed to disturbances of various kinds: faults, power imbalances due to load or generation changes, circuit breaker switching, and so on. These contingencies cause quantities such as frequency, voltages, and rotor angles of generators to deviate from nominal values. Transient stability is the ability of the system to withstand the transients caused by the disturbance event and restore nominal operating conditions.
In this context, two concepts of power stability that are generally accepted in definitions of electric power systems are considered, such as [
1]:
- (a)
Rotor angle stability: when all synchronous machines in a power system run synchronously with each other even after a disturbance, the power system is said to have rotor angle stability;
- (b)
Frequency stability: is the ability of the system to maintain stable frequencies after disturbances due to discrepancies between generation and load.
Transient stability analysis is generally concerned with the analysis of the effects of major disturbances, such as line faults [
2].
When a three-phase fault occurs near a generator, the ability of that machine to transfer power changes from possibly 100% to 0%. Therefore, a much wider range of system responses must be considered, and the analysis is essentially nonlinear. Several variables affect transient stability, so improving transient stability can be achieved either by reducing fault severity (e.g., faster fault clearance) or by increasing critical clearing time. Techniques to improve the stability of the system aim to achieve one or more of the following effects [
3]:
- (a)
Reducing the impact of the fault or fault severity: this effect can be achieved by faster fault clearing times, by fast breakers, and thus by reducing the fault severity by decreasing the clearing angle;
- (b)
Increasing synchronization forces to restore stable operation after a disturbance. This effect can be achieved by FACTS by providing the voltage support on a long transmission line;
- (c)
Reducing acceleration or deceleration power by controlling the prime mover to balance mechanical and electrical power;
- (d)
Applying artificial load to a synchronous generator to reduce the acceleration power by increasing the electrical power.
Improvement solutions can also be divided into structural and operative solutions. Structural solutions aim to reduce system reactance, which can be achieved by adding parallel transmission lines and/or using a transformer with low leakage reactance. Since these two techniques for reducing system reactance are quite expensive, other techniques such as fixed or variable series compensation based on FACTS can be considered as cost-effective alternatives. Operative solutions can be again divided into preventive and emergency techniques. In preventive control, generator rescheduling and series compensation are commonly used in practice, while in emergency control, most of the techniques aim at supporting the voltage under fault conditions. A significant improvement in transient stability can be achieved with fast-response excitation systems of synchronous generators by increasing the field current to increase the internal machine voltage and thus evacuating more electrical power during the fault, which reduces the acceleration area and leads to an increase in the critical clearing cime (CCT). This solution is very effective for faults that occur further away from the generator and where the voltage on the generator bus is greater than zero. Static VAr compensator (SVC) and static synchronous compensators (STATCOM) are able to control the voltage/reactive power at their connection point. They can improve the voltage profile of the system by controlling the voltage on one of the required buses [
3,
4,
5,
6,
7].
The diffusion and the increasing interest in the introduction of innovative solutions in the power grid are also justified by the objective of increasing the production of electricity from RES (as indicated in the European Roadmap and by ENTSO-E) [
8]. However, achieving this goal brings some challenges related to the stability of the electrical system. In order to overcome these challenges, TSOs are implementing various modernization measures based on power electronic devices and the conversion of phased-out production units (e.g., coal) for the provision of ancillary services (e.g., synchronous condenser), in line with circular economy principles. These modernization actions can also be carried out by revising the current grid structure when the solutions presented so far are not effective, such as the construction of new power lines.
The transient stability studies allow verifying if the system can withstand the transients caused by a disturbance event. The stability limit is determined by calculating the maximum clearing angle and the critical clearing time (CCT), which describes the time that it takes for the generator to go from the initial rotor angle to the critical rotor angle. The greater the CCT, the more severe the disturbance the generator or system can withstand.
For a complete comparison, the technical analysis alone is not sufficient to fully assess the actual feasibility of a solution under study. It is also important to consider the economic aspect of the solution in question. Cost can be one of the most important decision criteria for both TSOs and utilities. For this reason, there are different types of economic evaluations in the literature, see the work of [
6,
9].
In this paper, a comparative analysis of solutions to improve transient stability, both rotor angle stability and frequency stability, is performed. These solutions are SVC, STATCOM, a fast excitation system, and the doubling of a transmission line. The objective is to understand and evaluate what advantages these solutions bring to transient stability. The numerical simulations are performed using PowerWorld Simulator. The IEEE 9-bus system is used as a case study [
7].
This is the real contribution of this paper:
Sensitivity analyses were performed to determine: the worst-case location of a three-phase line fault for rotor angle stability and the most effective location to install the double line and SVC or STATCOM;
An analysis of the impact on rotor angle stability is performed for different network strength by varying the SCR (short-circuit ratio) values at the FACTS installation bus;
An evaluation of the impact on transient frequency stability, specifically, the impact of installing SVC and STATCOM. These solutions provide TSOs with dynamic control during contingencies;
An economic assessment of the use of FACTS will be conducted. This economic analysis focuses on the economic savings, e.g., avoided load shedding, achieved by TSOs when using these devices.
The paper is organized as follows.
Section 2 presents the solutions to improve transient stability. The studied system and the steps of the simulation are described in
Section 3. In
Section 4, the proposed solutions to improve the rotor angle stability are tested. The same devices are then used to improve the frequency stability: This analysis is described in
Section 5. Economic considerations of FACTS devices, SVC and STATCOM, are developed in
Section 6. Conclusions are presented in
Section 7, where the improvement solutions are summarized, and their main features are highlighted.
2. Description of Enhancement Solutions
Many different techniques/solutions are known for improving transient stability margins in power systems. As described in the work of [
3], these are divided into conventional and RES-based techniques. In this study, only conventional techniques for transient stability improvement are considered. Since no OPF study is performed, the re-dispatching technique is not considered.
The improvement solutions considered in this study are preventive control of transient stability:
And emergency transient stability control:
Fast excitation system: it quickly controls the field-excitation circuit to improve the voltage at the generator terminals under transient conditions, thus reducing the oscillations in the electrical system;
Variable shunt compensation: FACTS with the ability to regulate the voltage at selected points of the power system by varying reactive power can help improve transient stability by increasing the synchronization power flow between generators.
Among FACTS, the following two solutions have been implemented:
SVC (static var compensator): based on power electronic devices and passive elements. They allow fast voltage regulation at the interconnection nodes by injecting suitable reactive power. The effectiveness of this device depends on the installation position in the network;
STATCOM (static synchronous compensator): consists of a voltage source converter, a shunt coupling transformer, and a DC source, usually a capacitor. This device is used to regulate the connection point voltage in a power system by injecting and absorbing reactive power into the system.
3. IEEE 9 Bus System Description
IEEE 9-bus system is a widely used test system template for a variety of steady-state and dynamic simulation studies by researchers and engineers to simulate new algorithms, especially power system stability studies [
7,
10,
11]. The limited number of nodes of this test system is indeed useful to fully analyze and compare the effects of different parameters, such as the faulty line or the node where FACTS can be installed. In addition, the electrical and mechanical relationships between the different decisions and effects become clear.
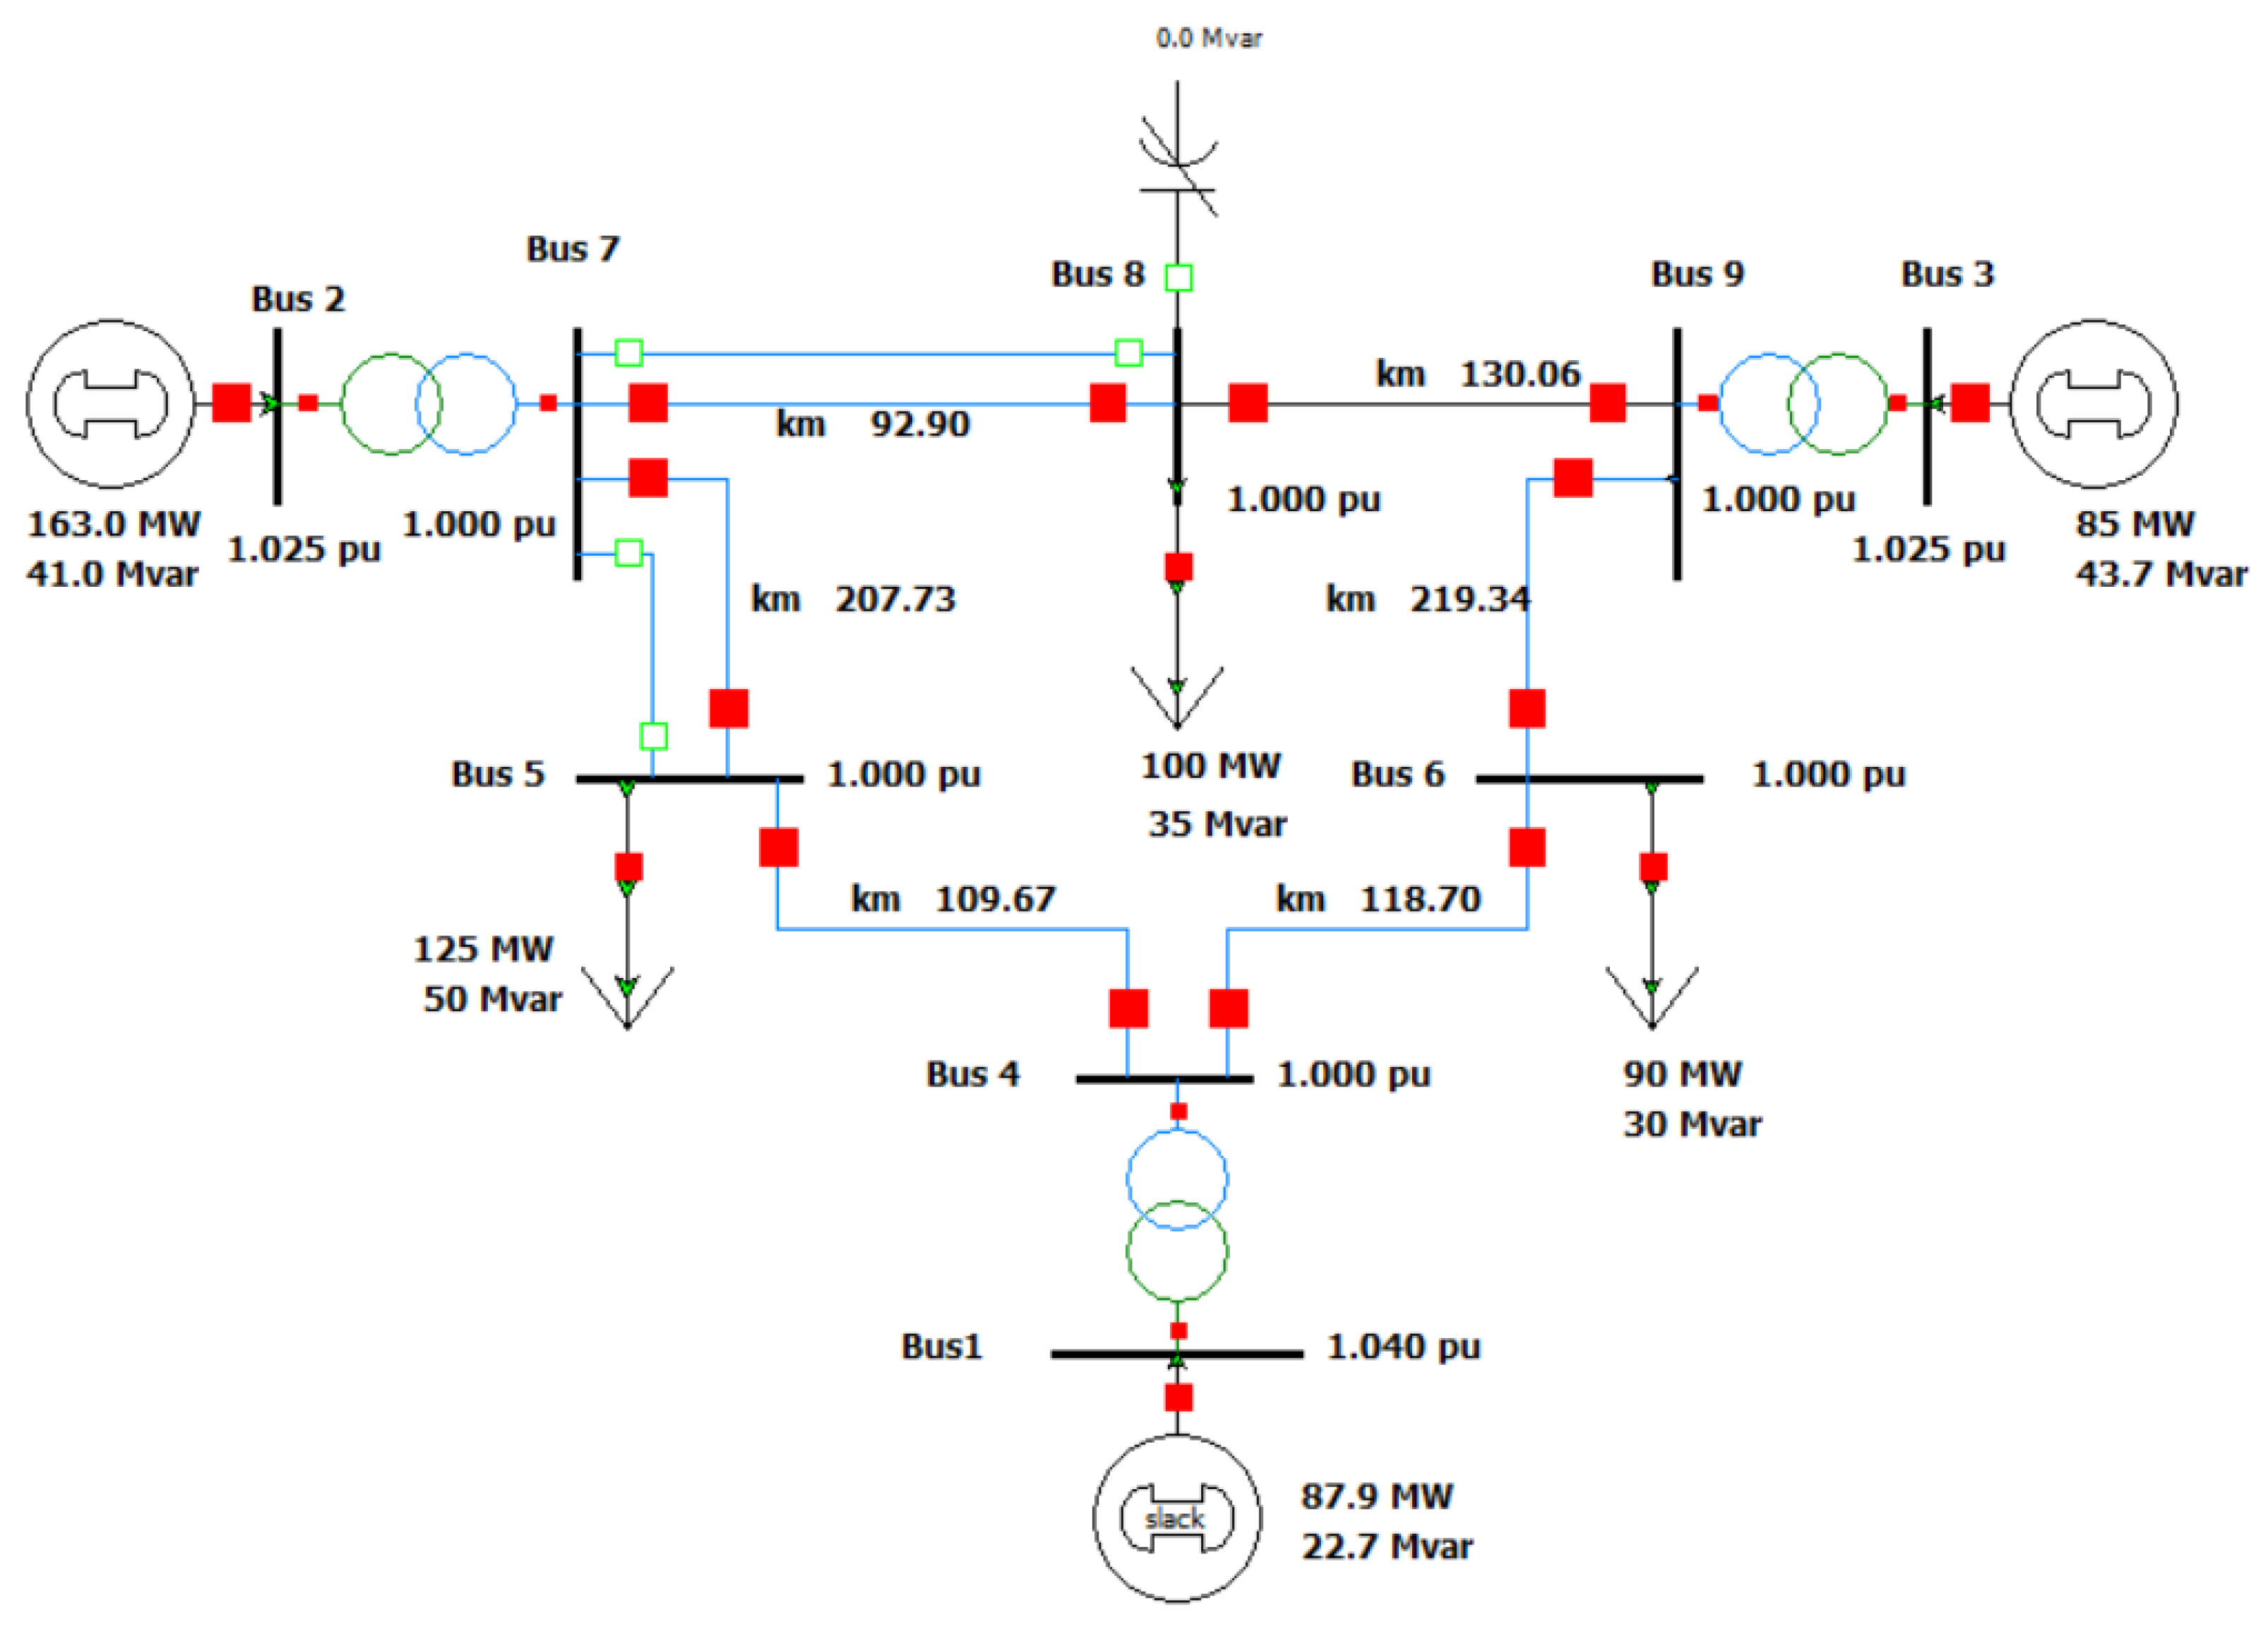
The system consists of three loads, three transformers, and three generators interconnected by a network of nine buses. In this paper, a modified version of the IEEE 9-bus system, shown in
Figure 1, is simulated using PowerWorld Simulator software for transient stability studies.
The base power for the system is 100 MVA according to the work of [
12], while the base power values of the generators are given in
Table 1. The length of the lines is determined starting from the typical parameters for the 230 kV transmission lines in the work of [
13], equating to the p.u. values for the reactance of the lines in the work of [
7,
12].
In addition, the system in
Figure 1 is modified by a parallel line between buses 5 and 7 and a FACTS device at bus 8. These choices are justified by sensitivity analyses shown later in this section.
In the base case, whose load flow analysis results are shown in
Figure 1, the two systems are disconnected.
The transient stability analysis of the test network is performed by simulating a three-phase short circuit. In this context, the system engineering solutions to improve the transient stability of the network are analyzed and compared. In order to perform the transient stability analysis, the dynamic models of each component must be adequately implemented. The models used to implement the synchronous generators of the IEEE 9-bus system are summarized in
Table 1, where all parameters are set to default values. The frequency response of the load is not considered because, as can be seen in the work of [
14], the most commonly used load model for static and dynamic studies is the constant power load model. Moreover, as reported in the work of [
15], the effect of the exponential load model, where only the voltage term of the model is considered while the frequency term is neglected, depends on its parameters. This type of study requires a deep analysis of the load model, which is beyond the scope of this paper. This choice is in line with other similar studies [
7,
10,
11]. In this way, the results reported in this work can be compared with those published in the literature.
For this case study, the transient stability analysis is divided into the following steps:
Initialize the system with the load flow analysis;
At 1 s, a three-phase symmetrical short-circuit fault is applied to a transmission line;
The duration of the fault, FCT (fault clearing time), is 0.35 s;
The duration of the simulation is 10 s;
The simulation time step is 5 ms.
To analyze the effect of the short circuit on the rotor angle stability, a sensitivity analysis of the fault location is performed by applying the fault in each line of the system. In addition, to determine the best bus location for the improving solutions, a sensitivity analysis is performed for the device location by connecting the device to each load bus of the system. For simplicity,
Table 2a shows the results of these sensitivity analyses obtained without the contribution of the improvement device and on the other hand with STATCOM. The decision to show only the results obtained with the STATCOM is due to the fact that the difference between these results and those obtained with SVC is very small (as shown in the following sections). These results show that the most critical fault is in lines 7–8. For this fault location, the best bus location for the improving solution is bus 8.
To understand which line needs to be doubled to achieve the most effective improvement, the two longest lines (with higher reactance), lines 5–7 and 6–9, are considered. These sensitivity analyses are shown in
Table 2b. It can be seen that the smallest value of maximum rotor angle is obtained by doubling lines 5–7.
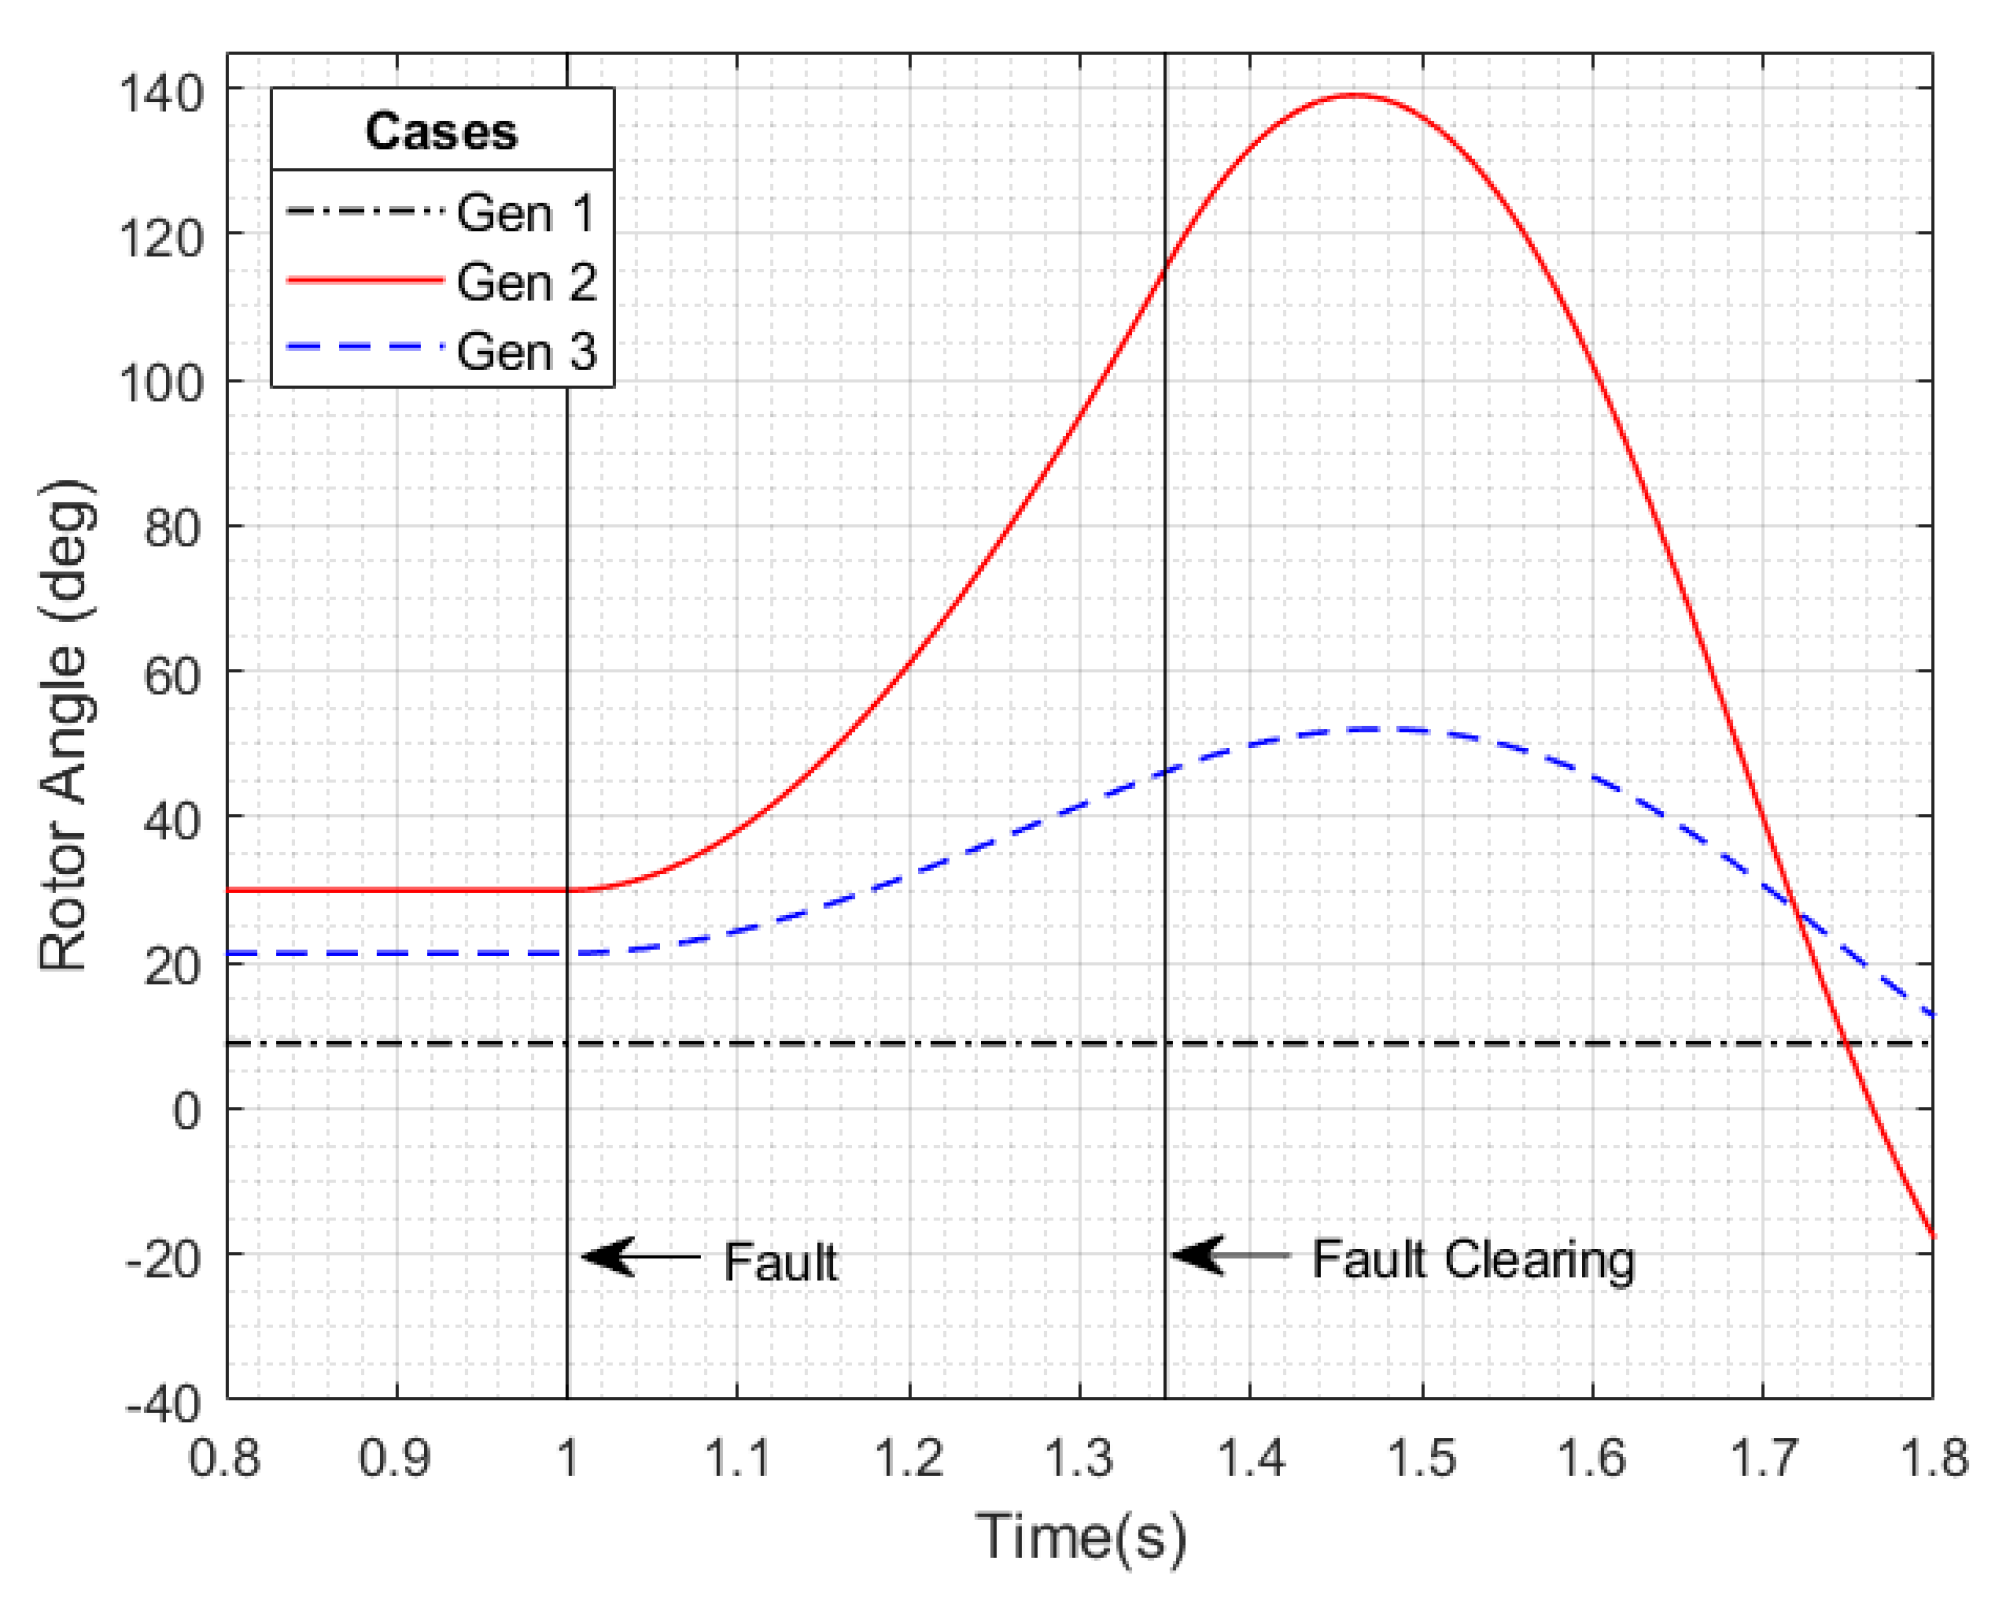
The short-circuit fault in the transmission line leads to oscillations of the rotor angle of the generators.
Figure 2 shows the rotor angle curves of the three generators before and after the fault. The angles are calculated about the load angle of generator 1. generator 2 is the most stressed generator. Its rotor angle reaches the maximum value of 139.02°, so the focus in the following sections is on generator 2.
4. Improved System Description
The improvement solutions, described in Parag. II, are now connected to the IEEE 9 bus system. See
Figure 1 in order to analyze their effects on the rotor angle stability. The main features of such systems are:
4.1. Improved IEEE 9 Bus System Transient Stability Analysis
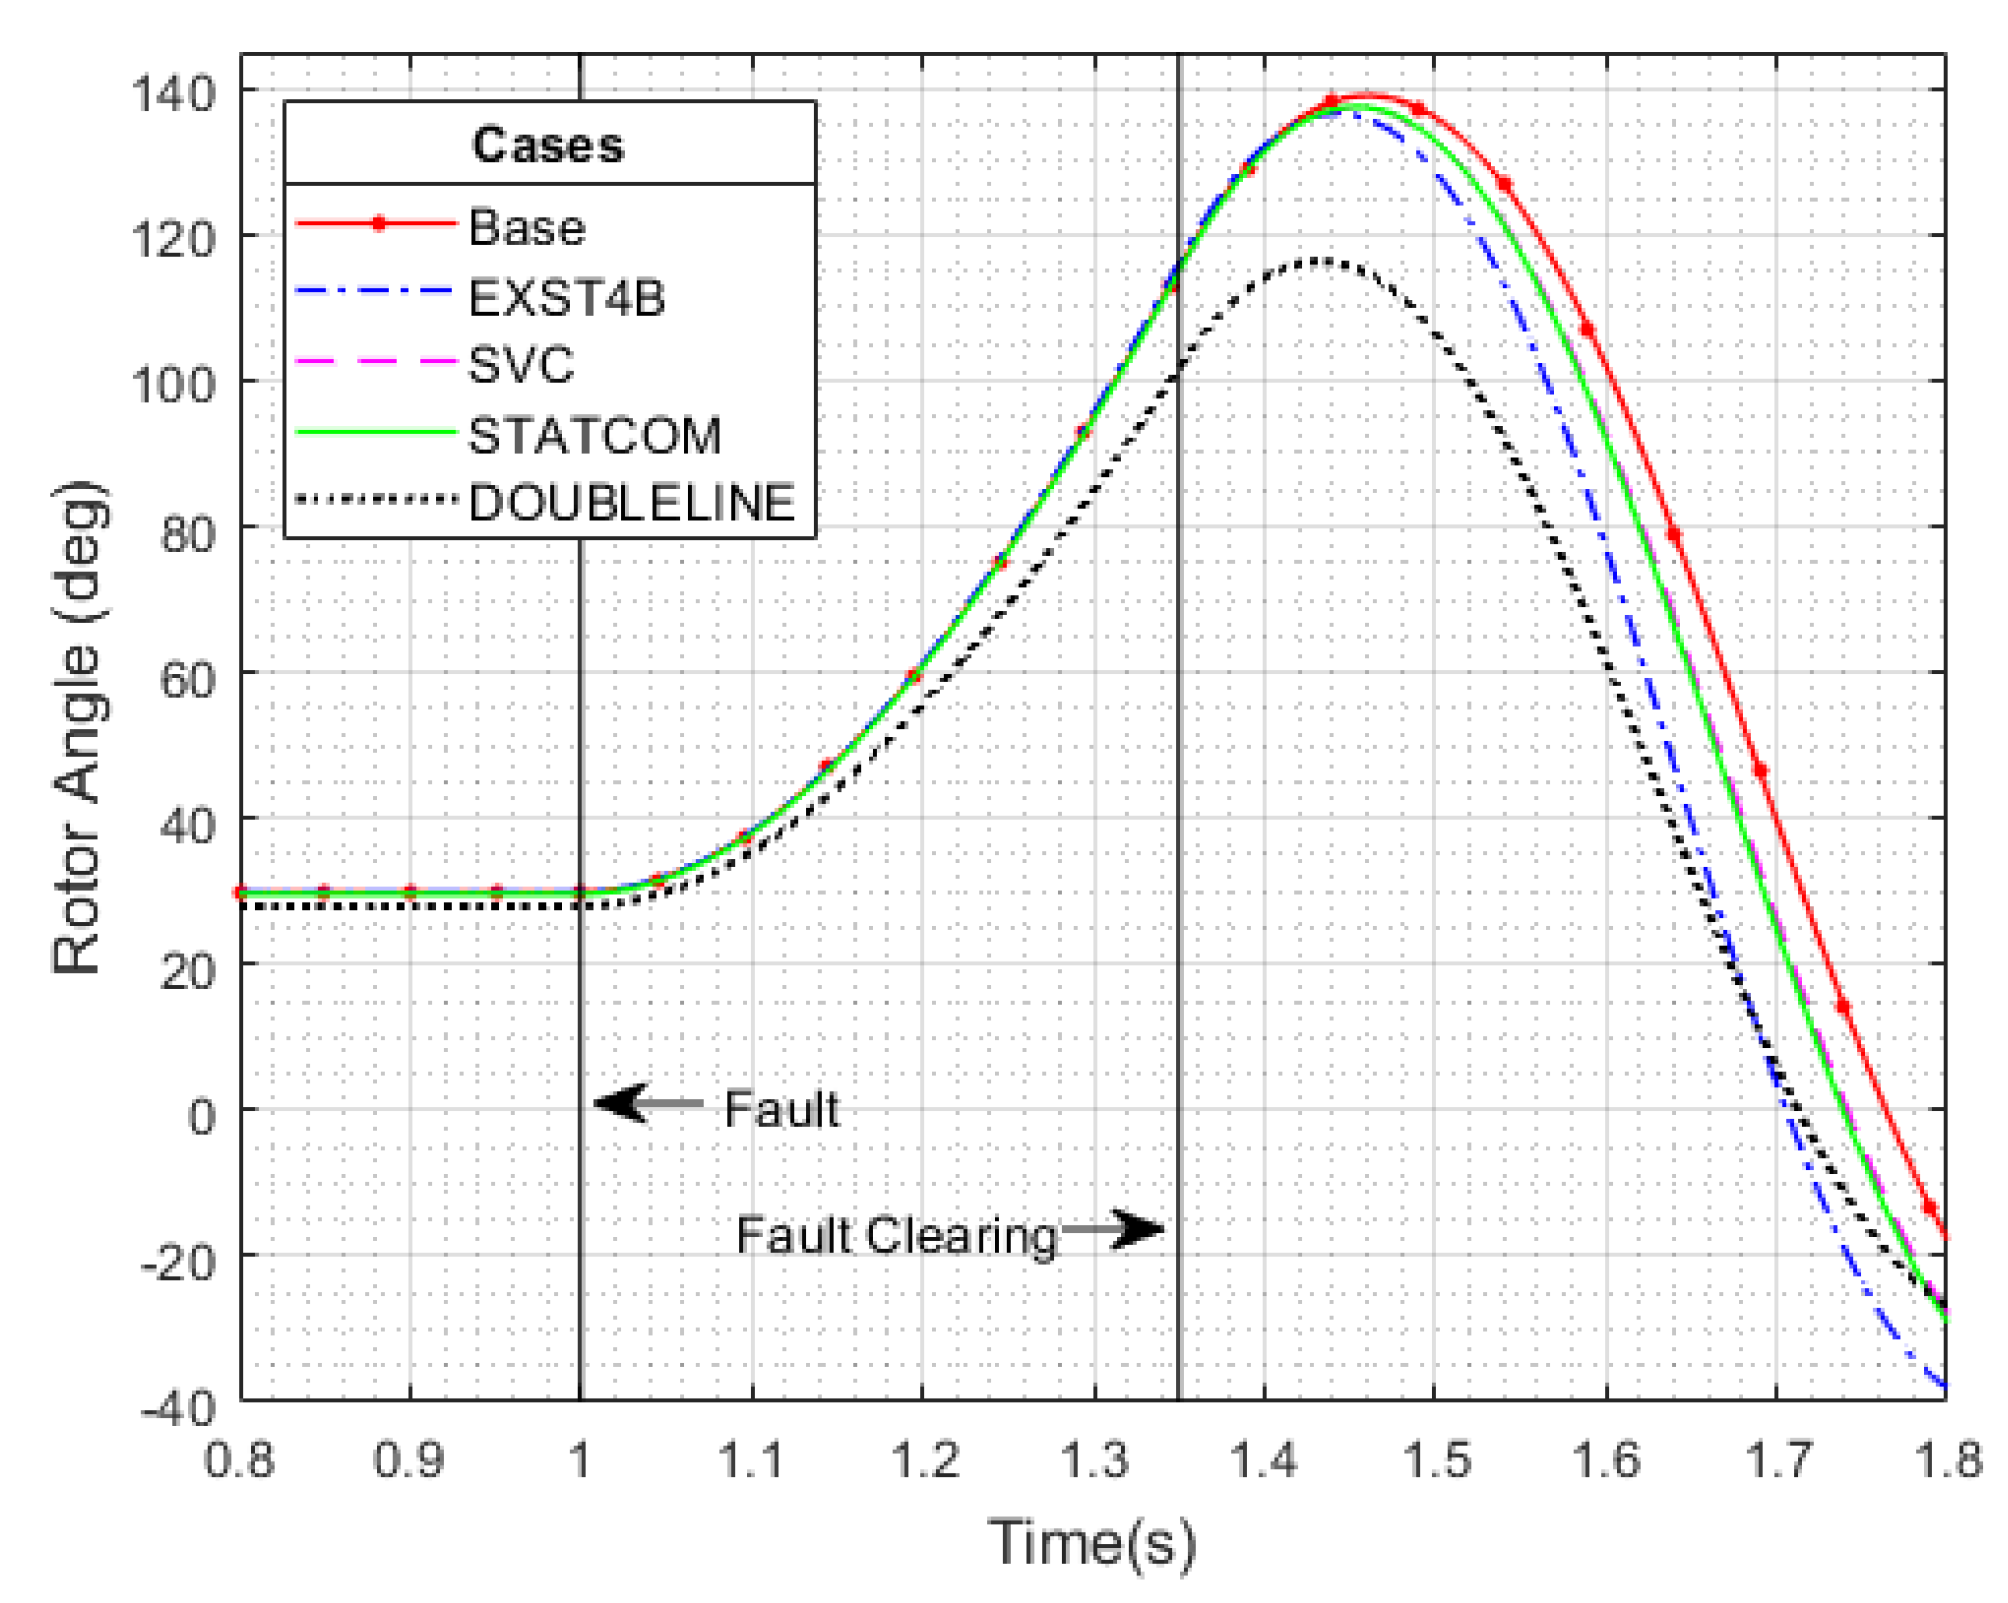
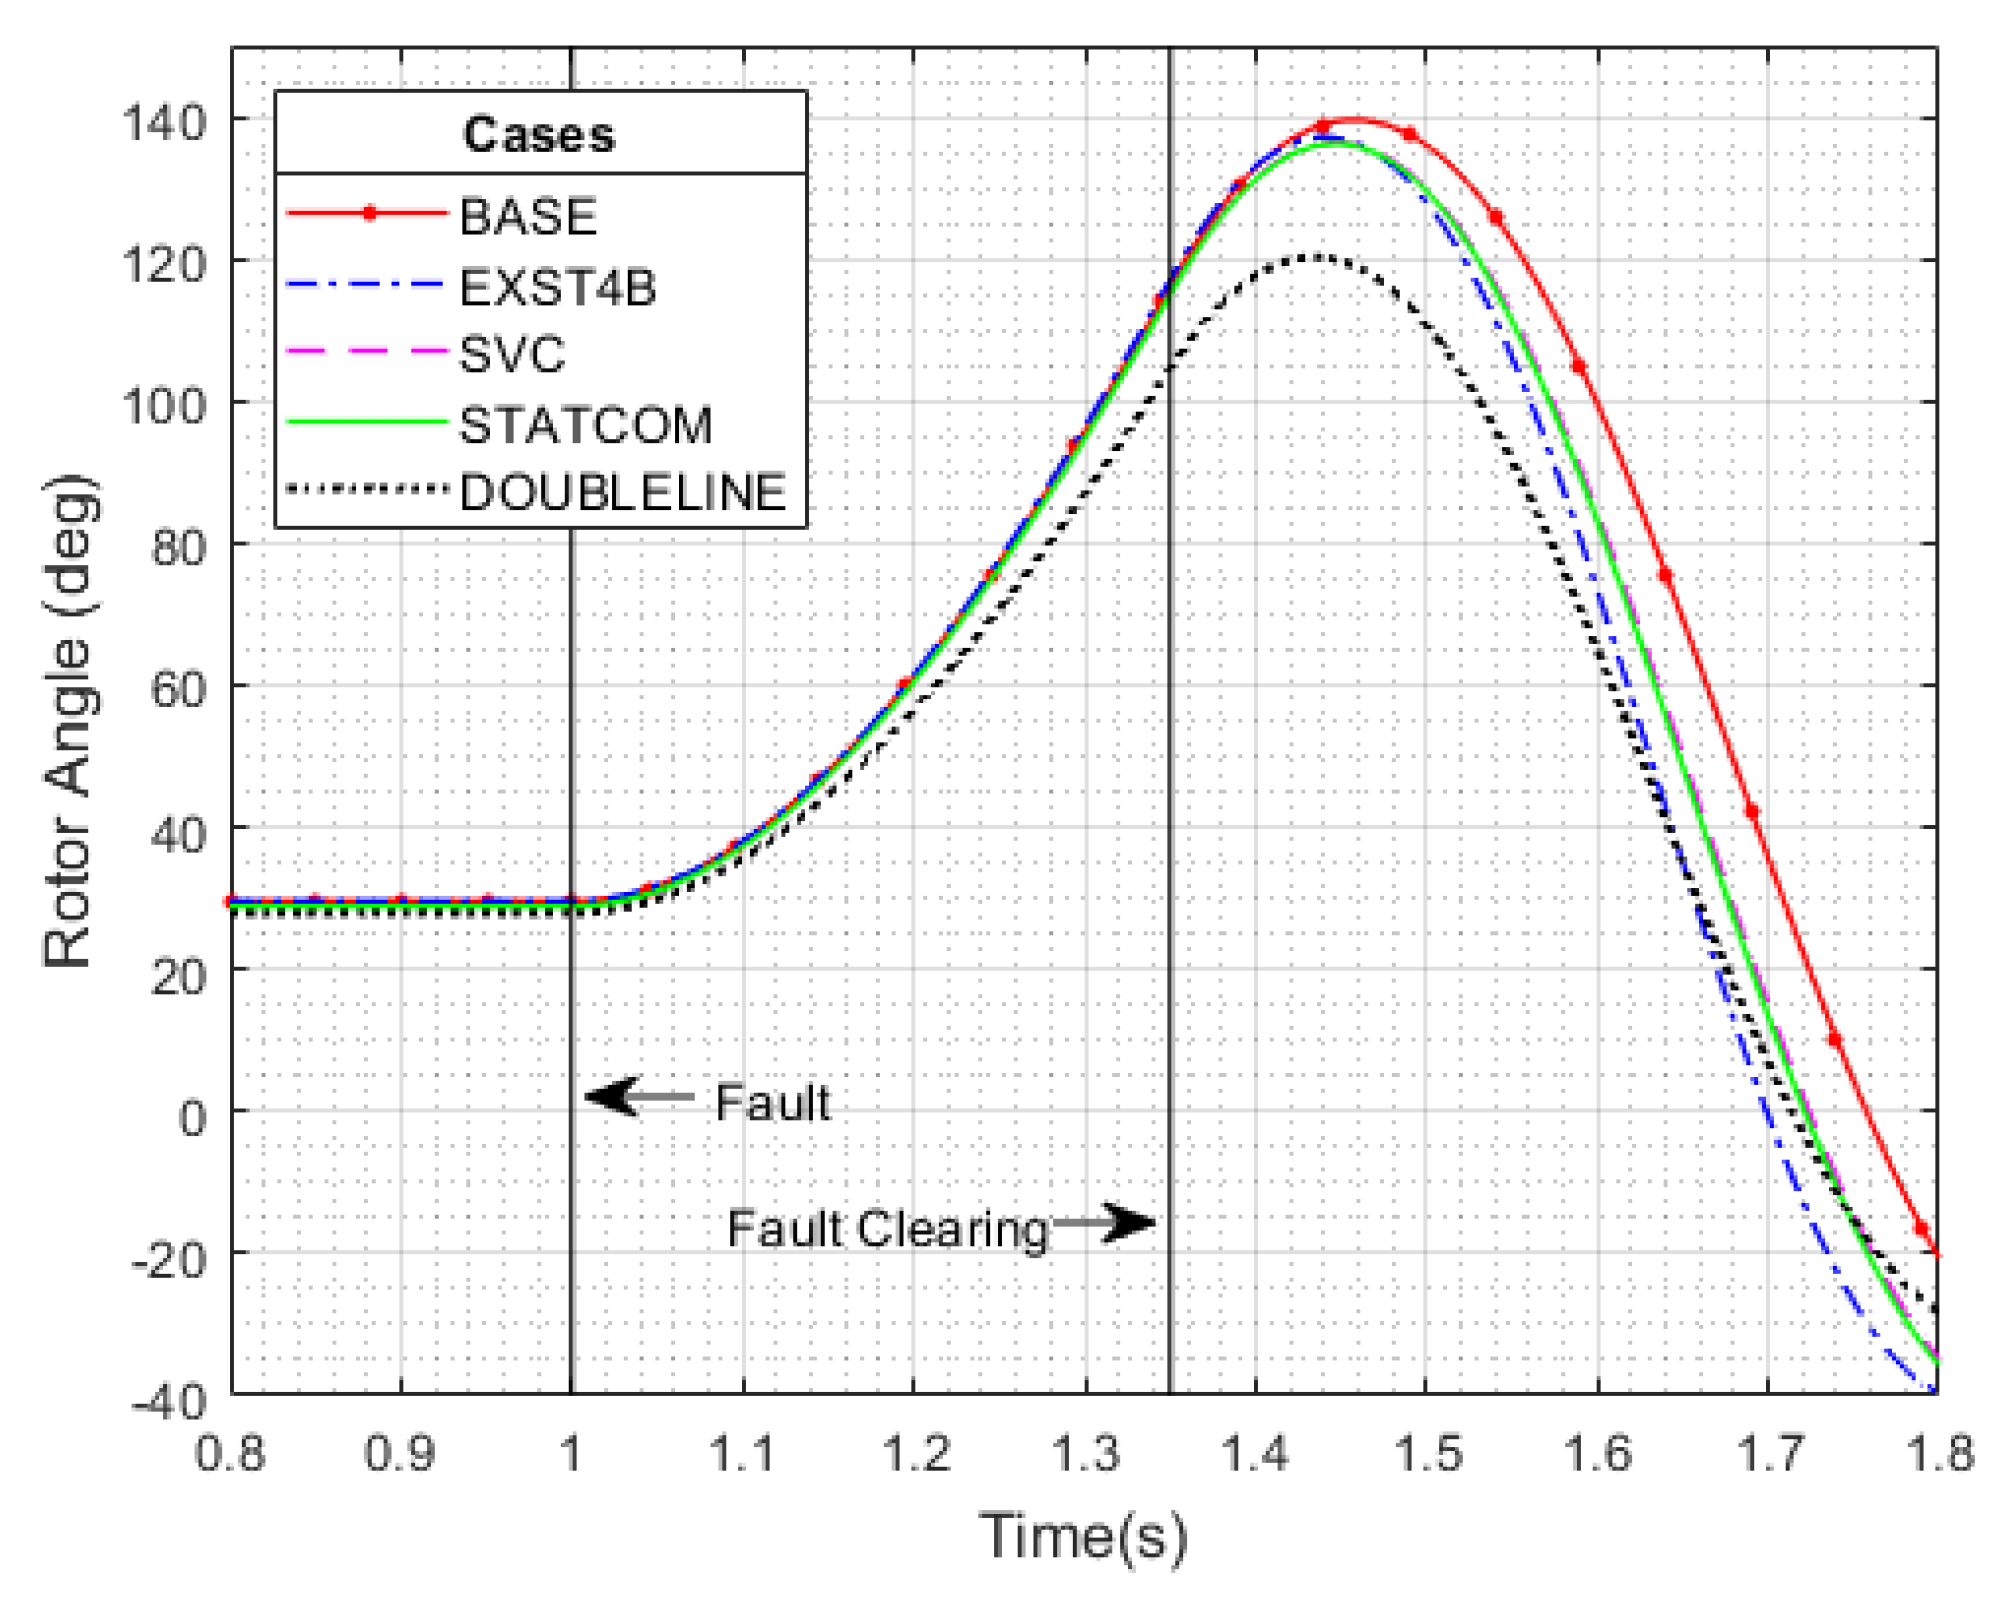
The results of the analysis carried out to study the effects of the solutions presented are shown in
Figure 3, which describes the rotor angle plots of generator 2 obtained for each case. From
Figure 4, it can be seen that the addition of a new parallel line is the most effective solution to contain the rotor angle variations; moreover, thanks to its effect on the system admittance matrix, it allows reducing the initial rotor angle, increasing the stability margin.
Looking at the solutions SVC and STATCOM in
Figure 3, they have a limited effect on the rotor angle stability. On the other hand, the fast-acting exciter EXST4B allows anticipating the moment when the rotor angle reaches the maximum value, thus increasing the stability margin.
The effectiveness of using these four solutions to improve the rotor angle stability is illustrated by the results presented in
Table 5 and
Table 6. These tables show the assumed values for the maximum rotor angle and the critical clearing time CCT.
Looking at the results in
Table 5 and
Table 6, the best improvement solution is to double lines 5–7. This solution gives the lowest maximum rotor angle and allows to obtain the higher CCT. The values of the maximum rotor angle confirm that the contribution of SVC and STATCOM to the rotor angle stability is limited for the analyzed system. As for the CCT, STATCOM leads to a slightly higher value, while SVC worsens it.
The values shown in
Table 5 and
Table 6 for the fast-acting exciter confirm that this solution allows improving the transient stability thanks to its effect on the rotor angle stability. Comparing the Values of FCT and CCT, in All Five Cases, the FCT Values Are Smaller than the Corresponding CCT Values, Which Allows a Transient Stable Operation of the System.
4.2. Improved IEEE 9 Bus System Modeling with Different SCR Value
The results of the previous analysis show similar behavior for SVC and STATCOM solutions, although they are devices based on different operating principles.
For a more comprehensive analysis, the four solutions are now tested for three different network configurations simulating different network strengths. The purpose of this analysis is to see how these technologies perform under different operating conditions based on different grid strength values. System strength is important for maintaining normal power system operation, for the dynamic response of the power system in the event of a disturbance, and for the return of the power system to stable operating conditions. The concept of system strength refers to the short-circuit power at the nodes. The magnitudes of a strong node are not greatly affected by a disturbance in another node of the network. On the other hand, the magnitudes of a node with low short-circuit power are strongly affected by the disturbance. [
16]
The most basic and easy-to-use metric for determining the relative strength of a power system is the short circuit ratio (SCR). SCR is defined as the ratio between the short-circuit apparent power (SCMVA) of a 3LG fault at a given location in the power system and the rated power of the resource connected to that location [
17].
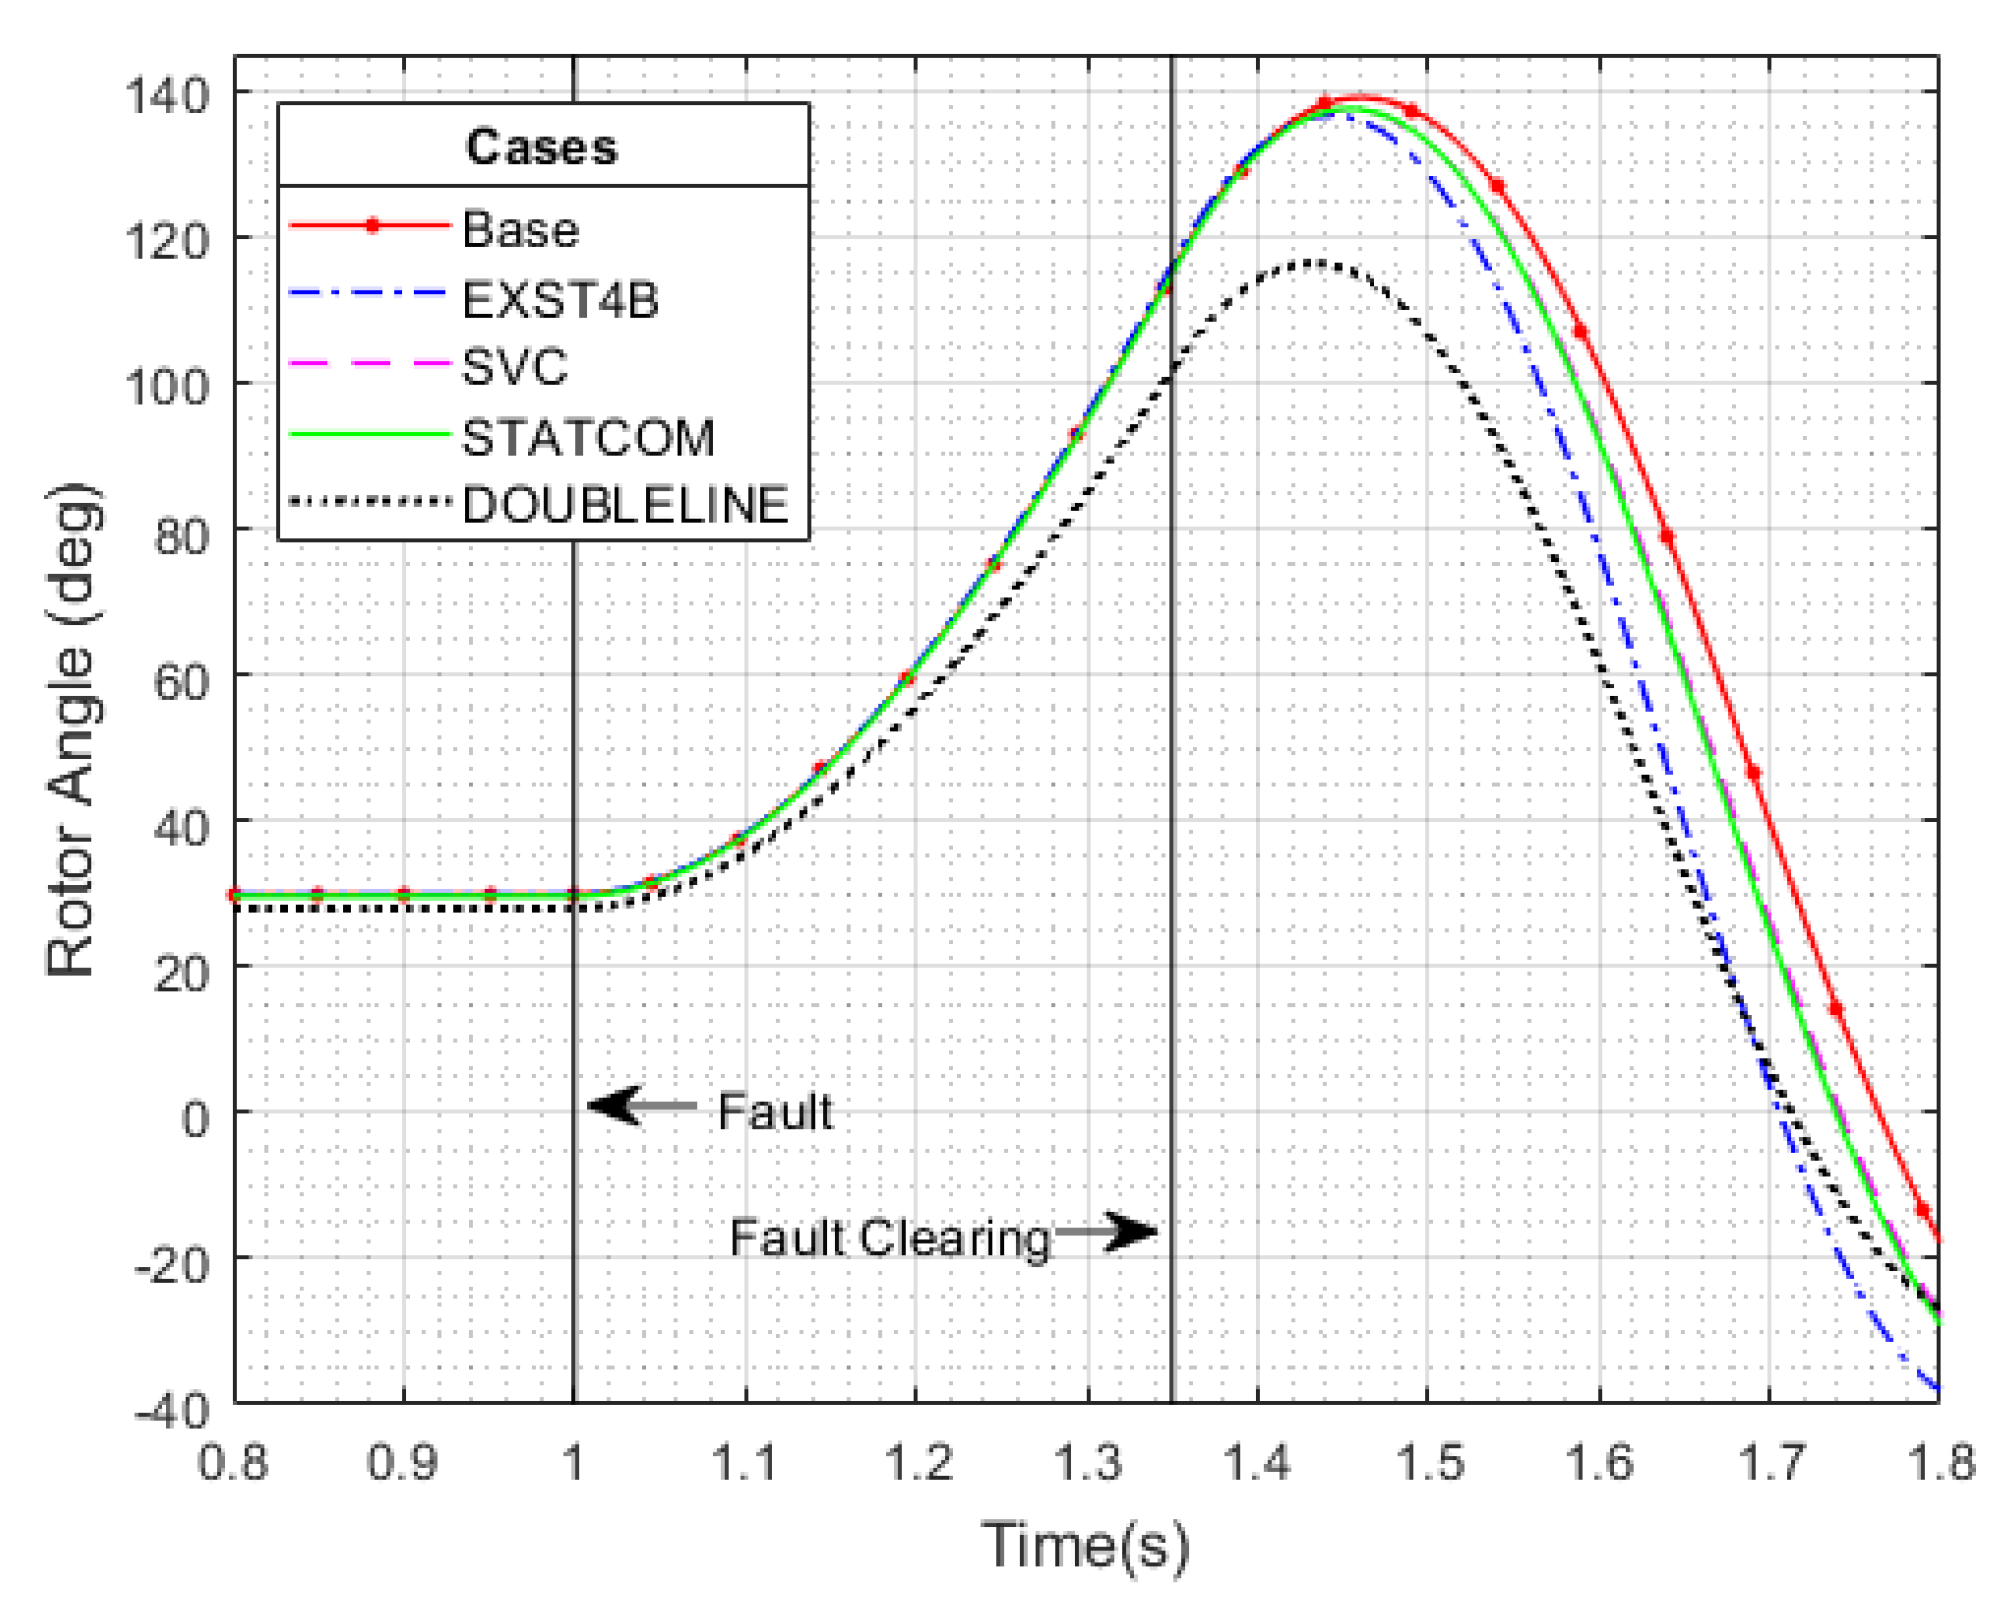
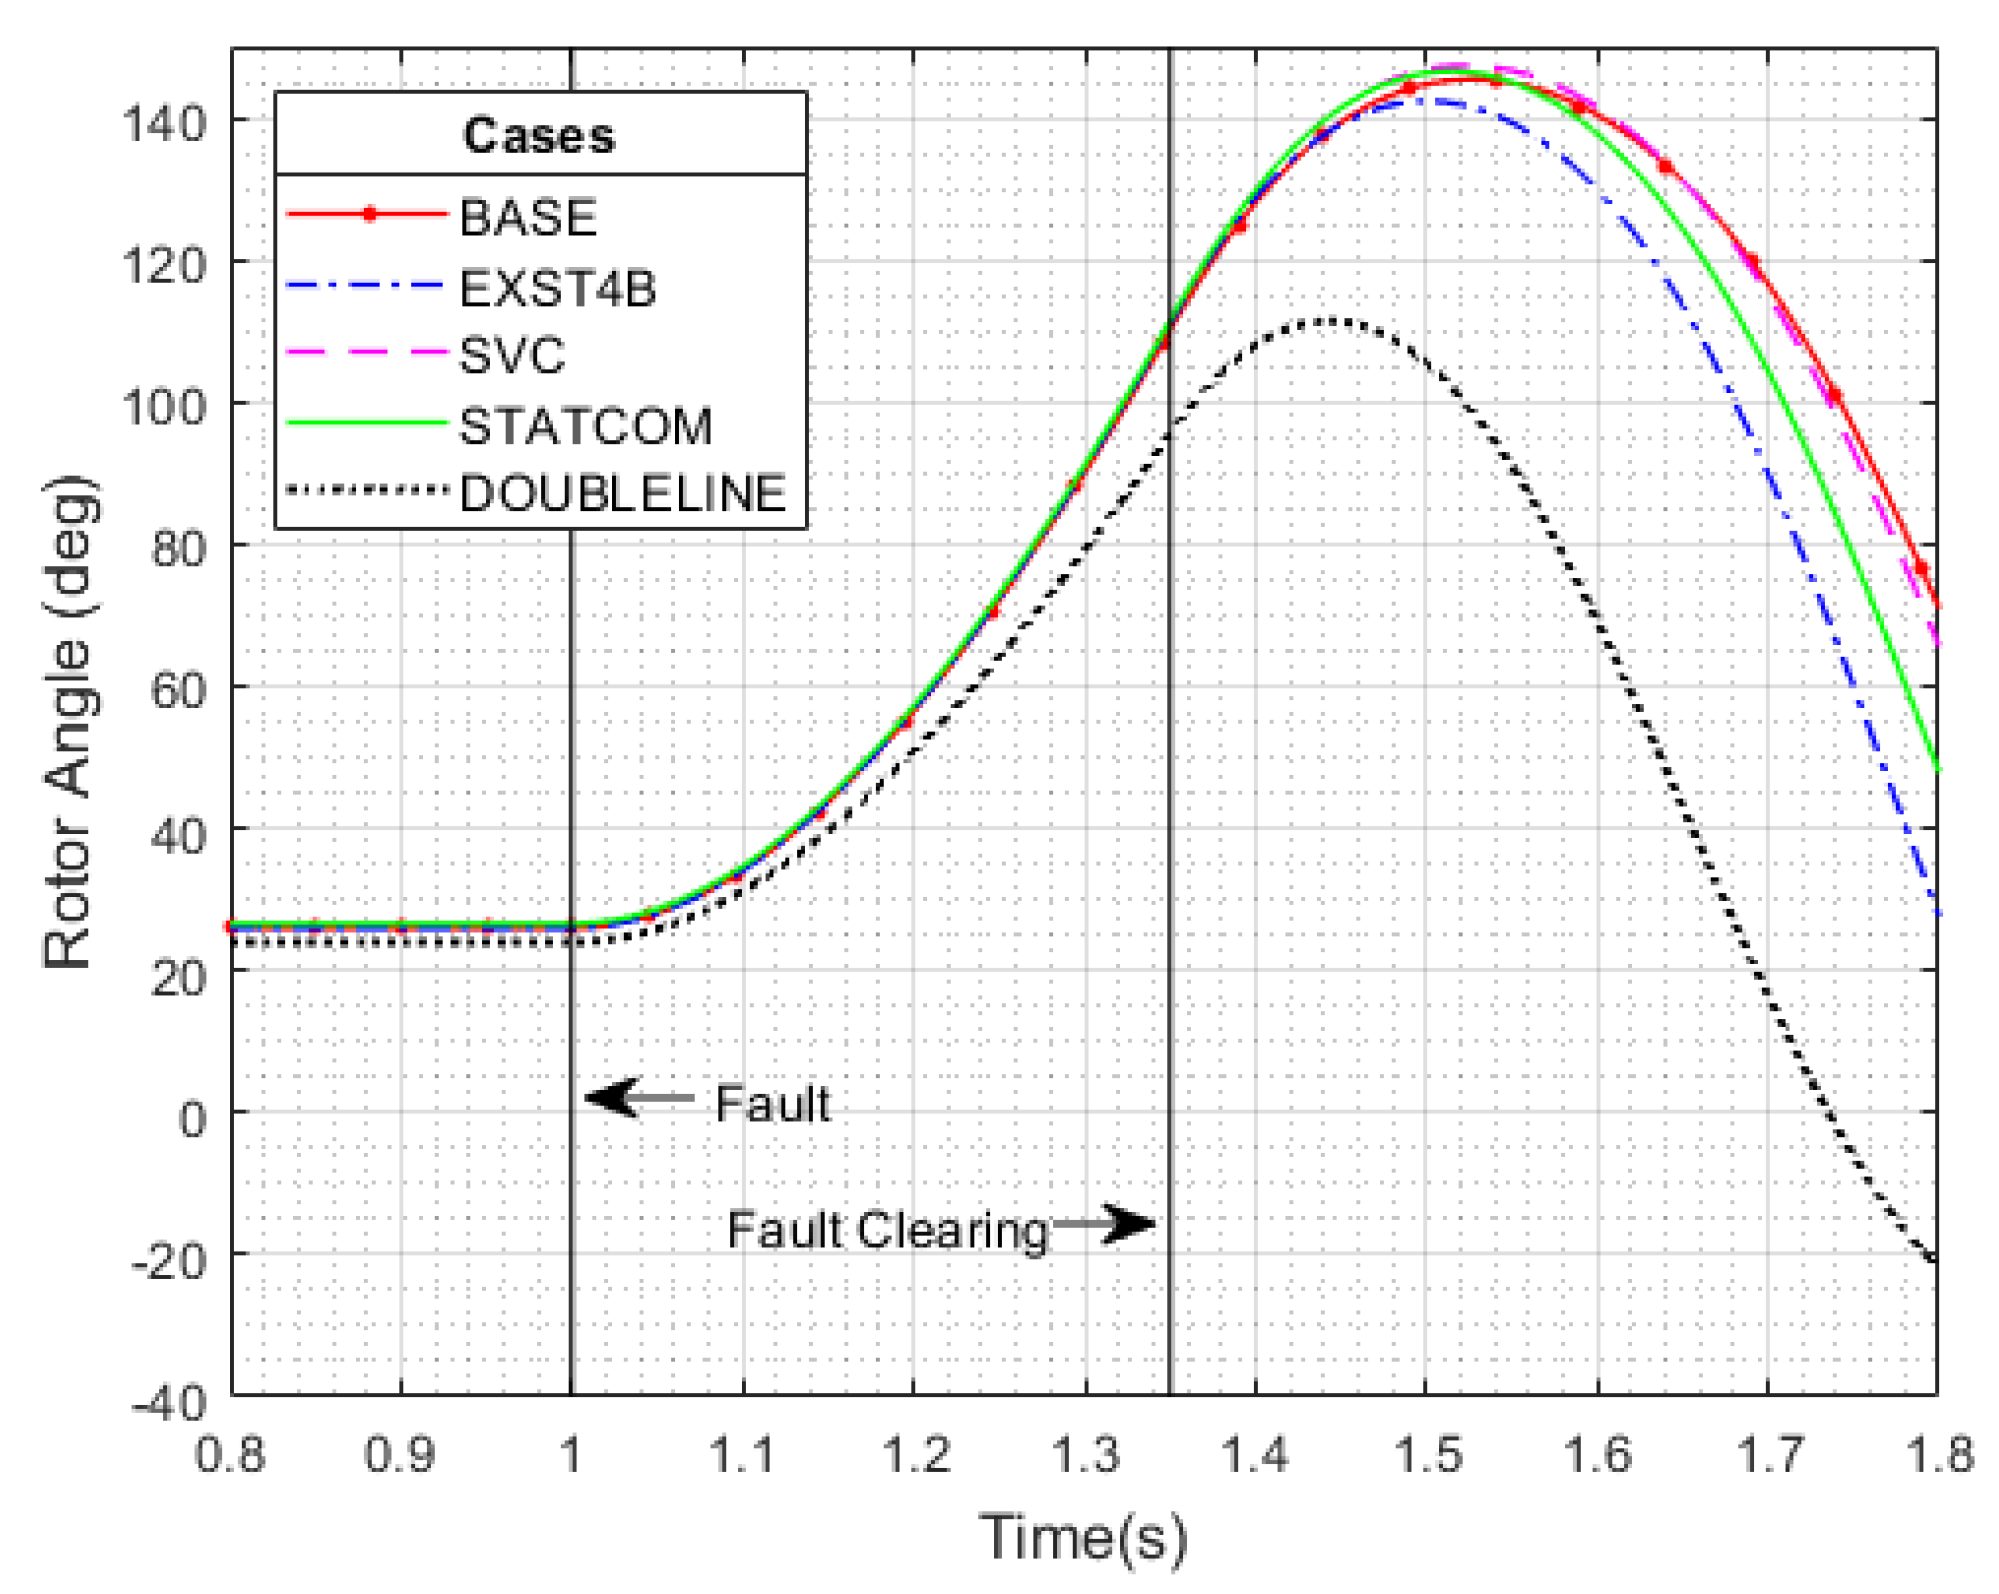
To obtain three different network configurations with different system strengths, the analysis is divided into three different cases, applying the same short-circuit fault as in the previous analyses: Case A: The four improvement solutions were tested on the system shown in
Figure 2, which was used for the base case. The resource used to determine SCR is the SVC/STATCOM connected to bus 8. Case B: The four enhancement solutions were tested by adding the double line 7–8 to improve the system strength (lower impedance); Case C: The enhancement solutions were tested by opening lines 9–8 to weaken the system strength (more impedance).
The value SCR for each of these cases is shown in
Table 7, where the power of the resource connected to bus 8 is 50 MVA.
To check the effects of the improvement solutions with a different SCR value, the variation of the Gen.2 rotor angle is considered. The results of the analyses for cases A, B, and C are shown in
Figure 4,
Figure 5 and
Figure 6, respectively.
From the graph shown in
Figure 5, it can be seen that at higher system strength (higher SCR), the rotor angle oscillations are limited to lower maximum values; in contrast, at lower SCR values, see
Figure 6, a higher maximum rotor angle value is obtained, corresponding to the lower strength of the system.
In all three cases, shown in
Figure 4,
Figure 5 and
Figure 6, the double line and the fast-acting exciter represent the best improvement solutions due to their effects on the system structure and the direct effect on the generator, respectively.
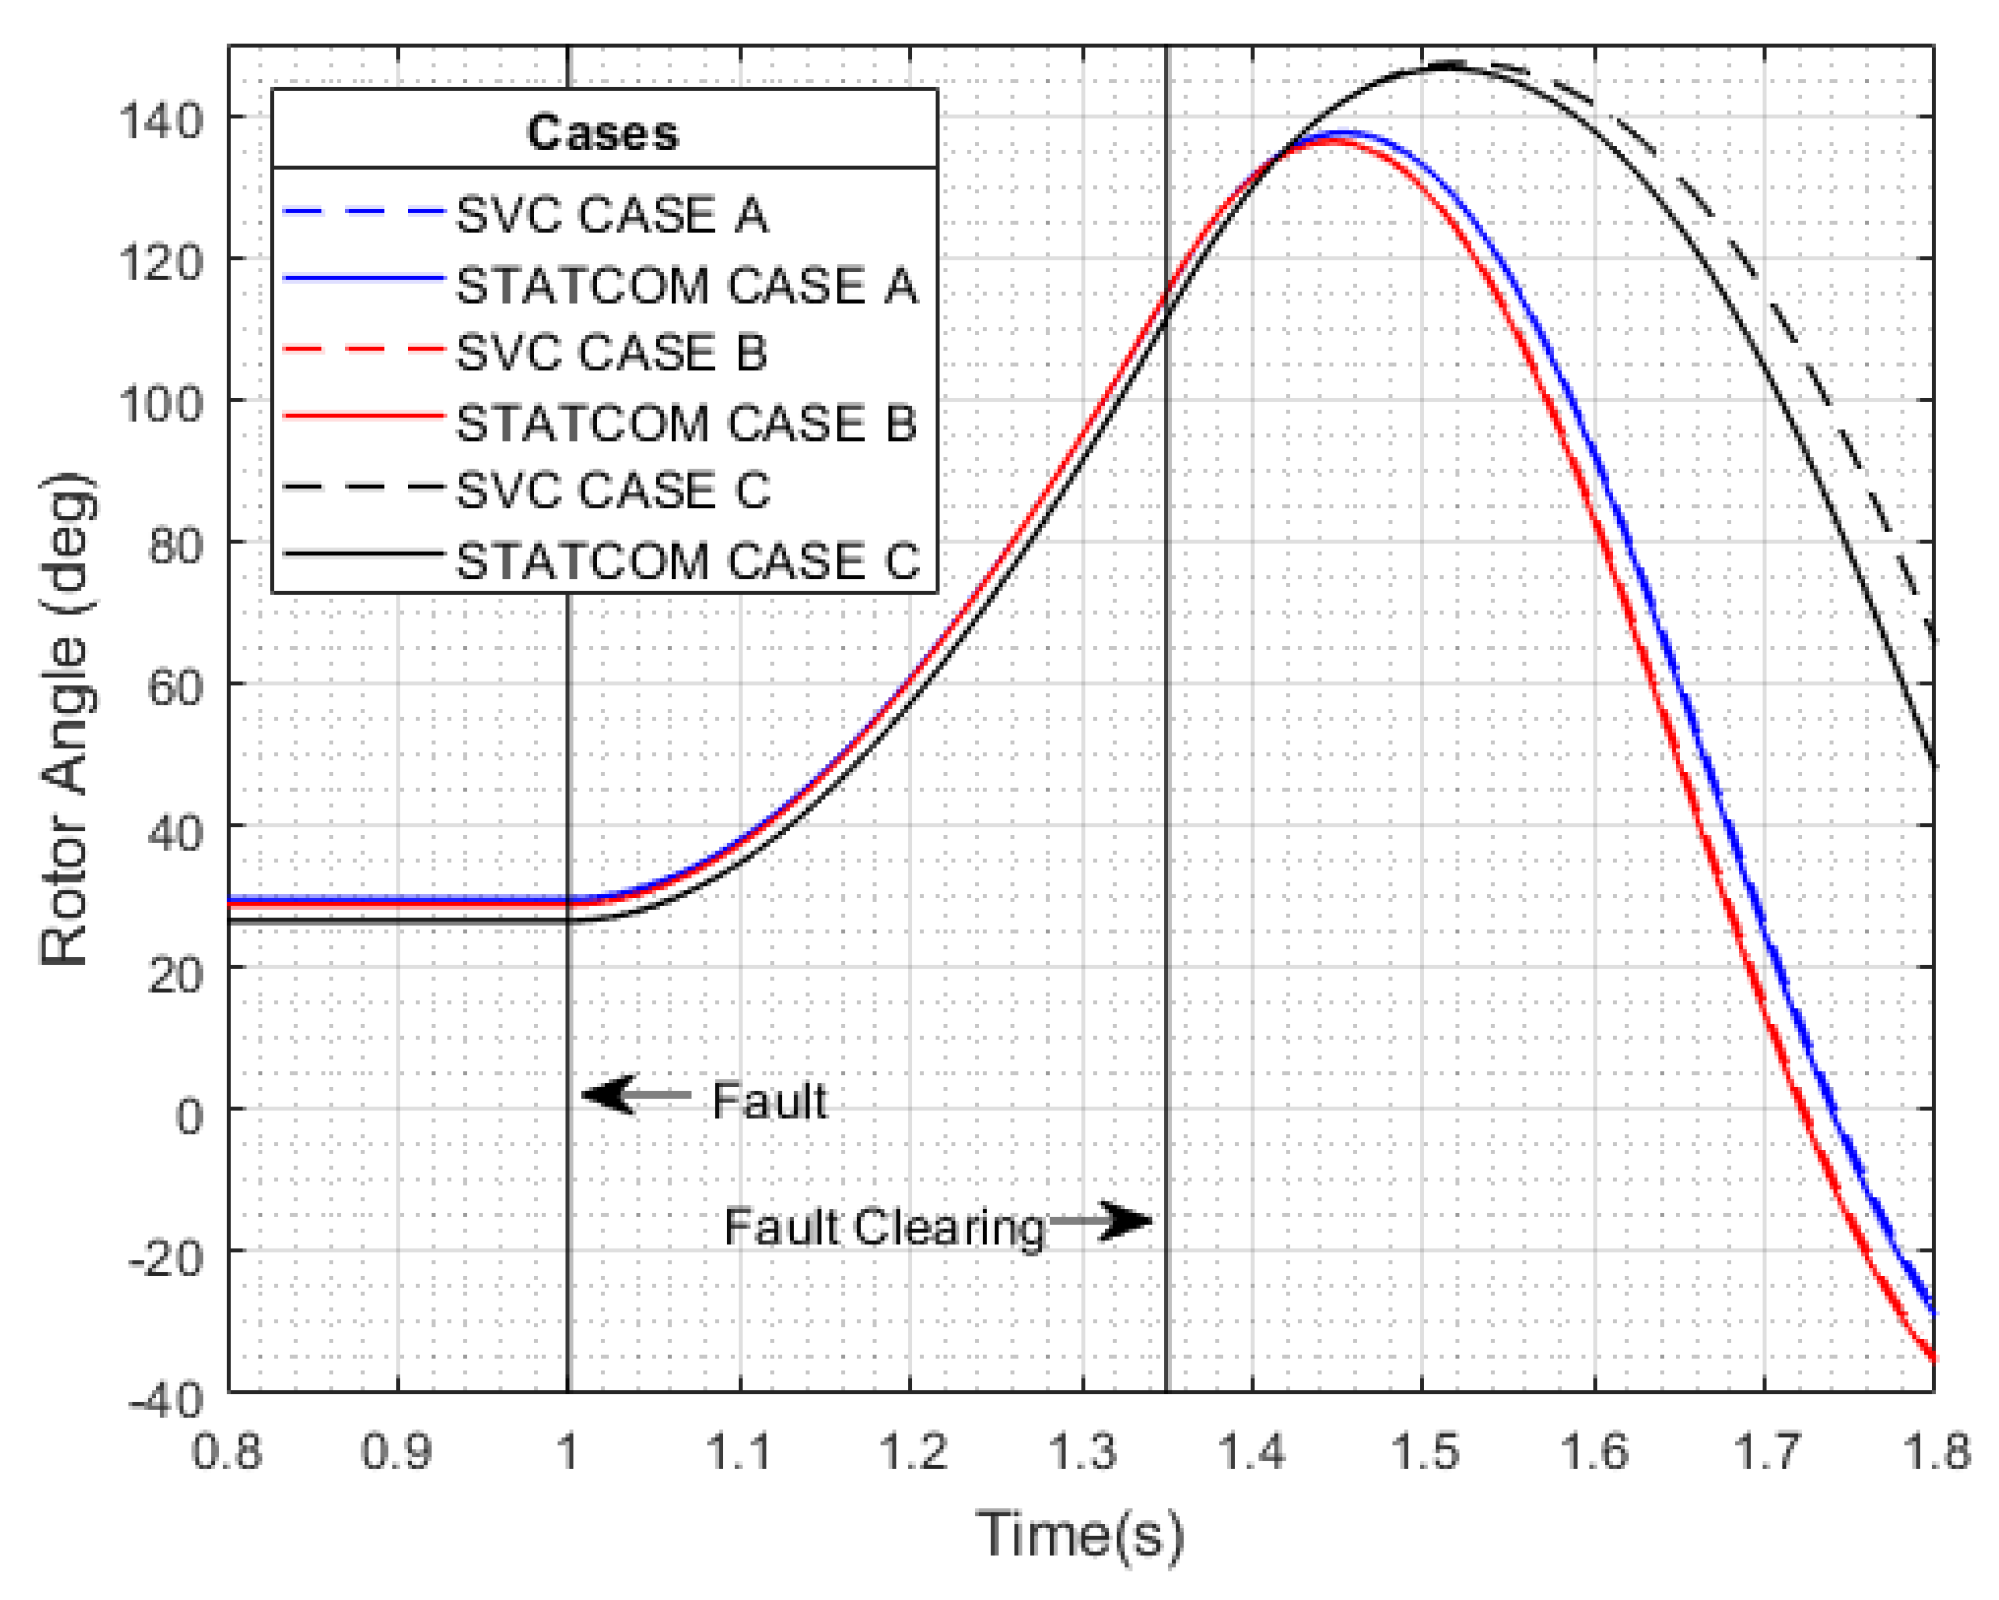
To compare the behavior of the two FACTS devices, the focus is on the different responses of SVC and STATCOM in the three cases, as shown in
Figure 7.
These plots show that for strong systems, Case A and B, the solutions SVC and STATCOM have similar effects on the evolution of the rotor angle. On the other hand, in case C, the STATCOM solution gives a better result than SVC in terms of stability of the rotor angle. This is due to the different operating principles of these two devices. The maximum reactive power output of STATCOM is independent of the bus voltage level, while that of SVC is strongly affected by the bus voltage level.
5. Frequency Stability
In this section, the solutions presented are tested to analyze their impact on frequency stability, analyzing the same network and contingency as before.
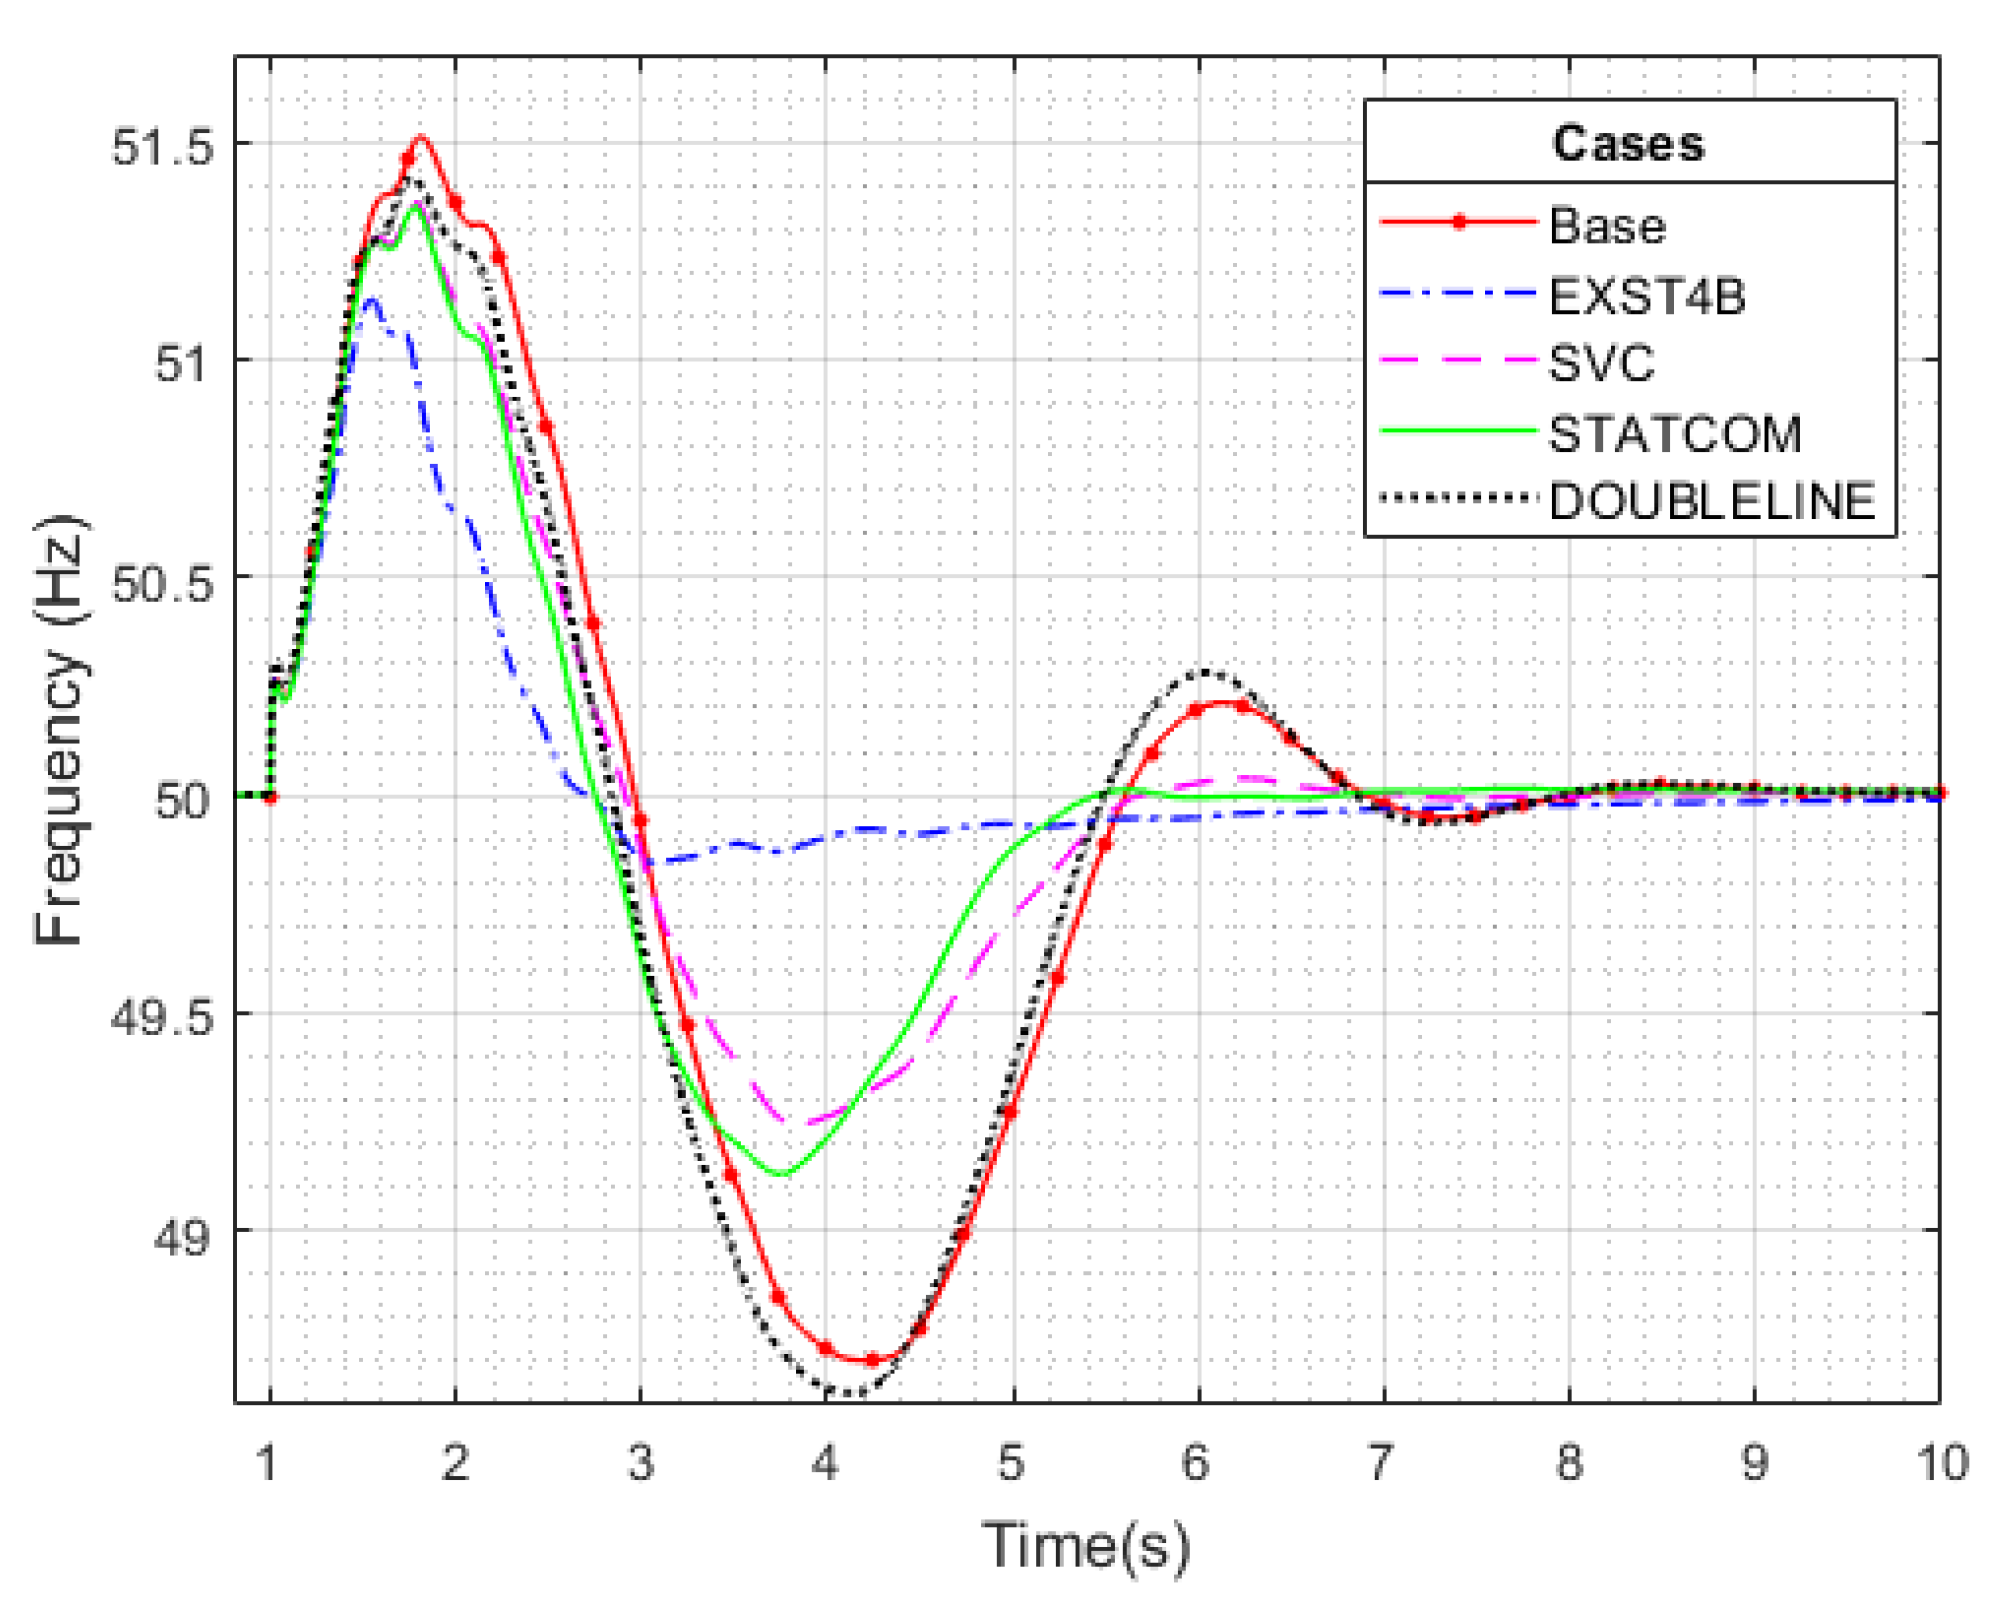
The simulations are performed for each solution already presented (SVC, STATCOM, EXST4B, and a new parallel line) and the frequency trends obtained are shown in
Figure 8.
The three-phase short circuit causes a frequency transient characterized by oscillations. It can be seen from
Figure 8 that the oscillations occurring in the base case are suppressed with the solution considered in this paper.
The structural and preemptive solution, i.e., the addition of a parallel line, has a small effect on the frequency stability. On the other hand, the emergency solutions implemented with FACTS, especially SVC and STATCOM, and the fast-acting exciter, i.e., EXST4B, have a better impact on the frequency stability, especially during the underfrequency period. This is because these devices also operate under dynamic conditions, which allows the control of electrical quantities such as voltage during the transient. SVC, STATCOM, and the fast exciter act mainly on the voltage of the bus to which they are connected, which is a crucial variable during a transient caused by a short circuit.
Among the different solutions, the fast exciter is the most effective for frequency stability, and its fluctuations are the most damped, resulting in the lowest oscillation, which reaches a low point of 49.85 Hz.
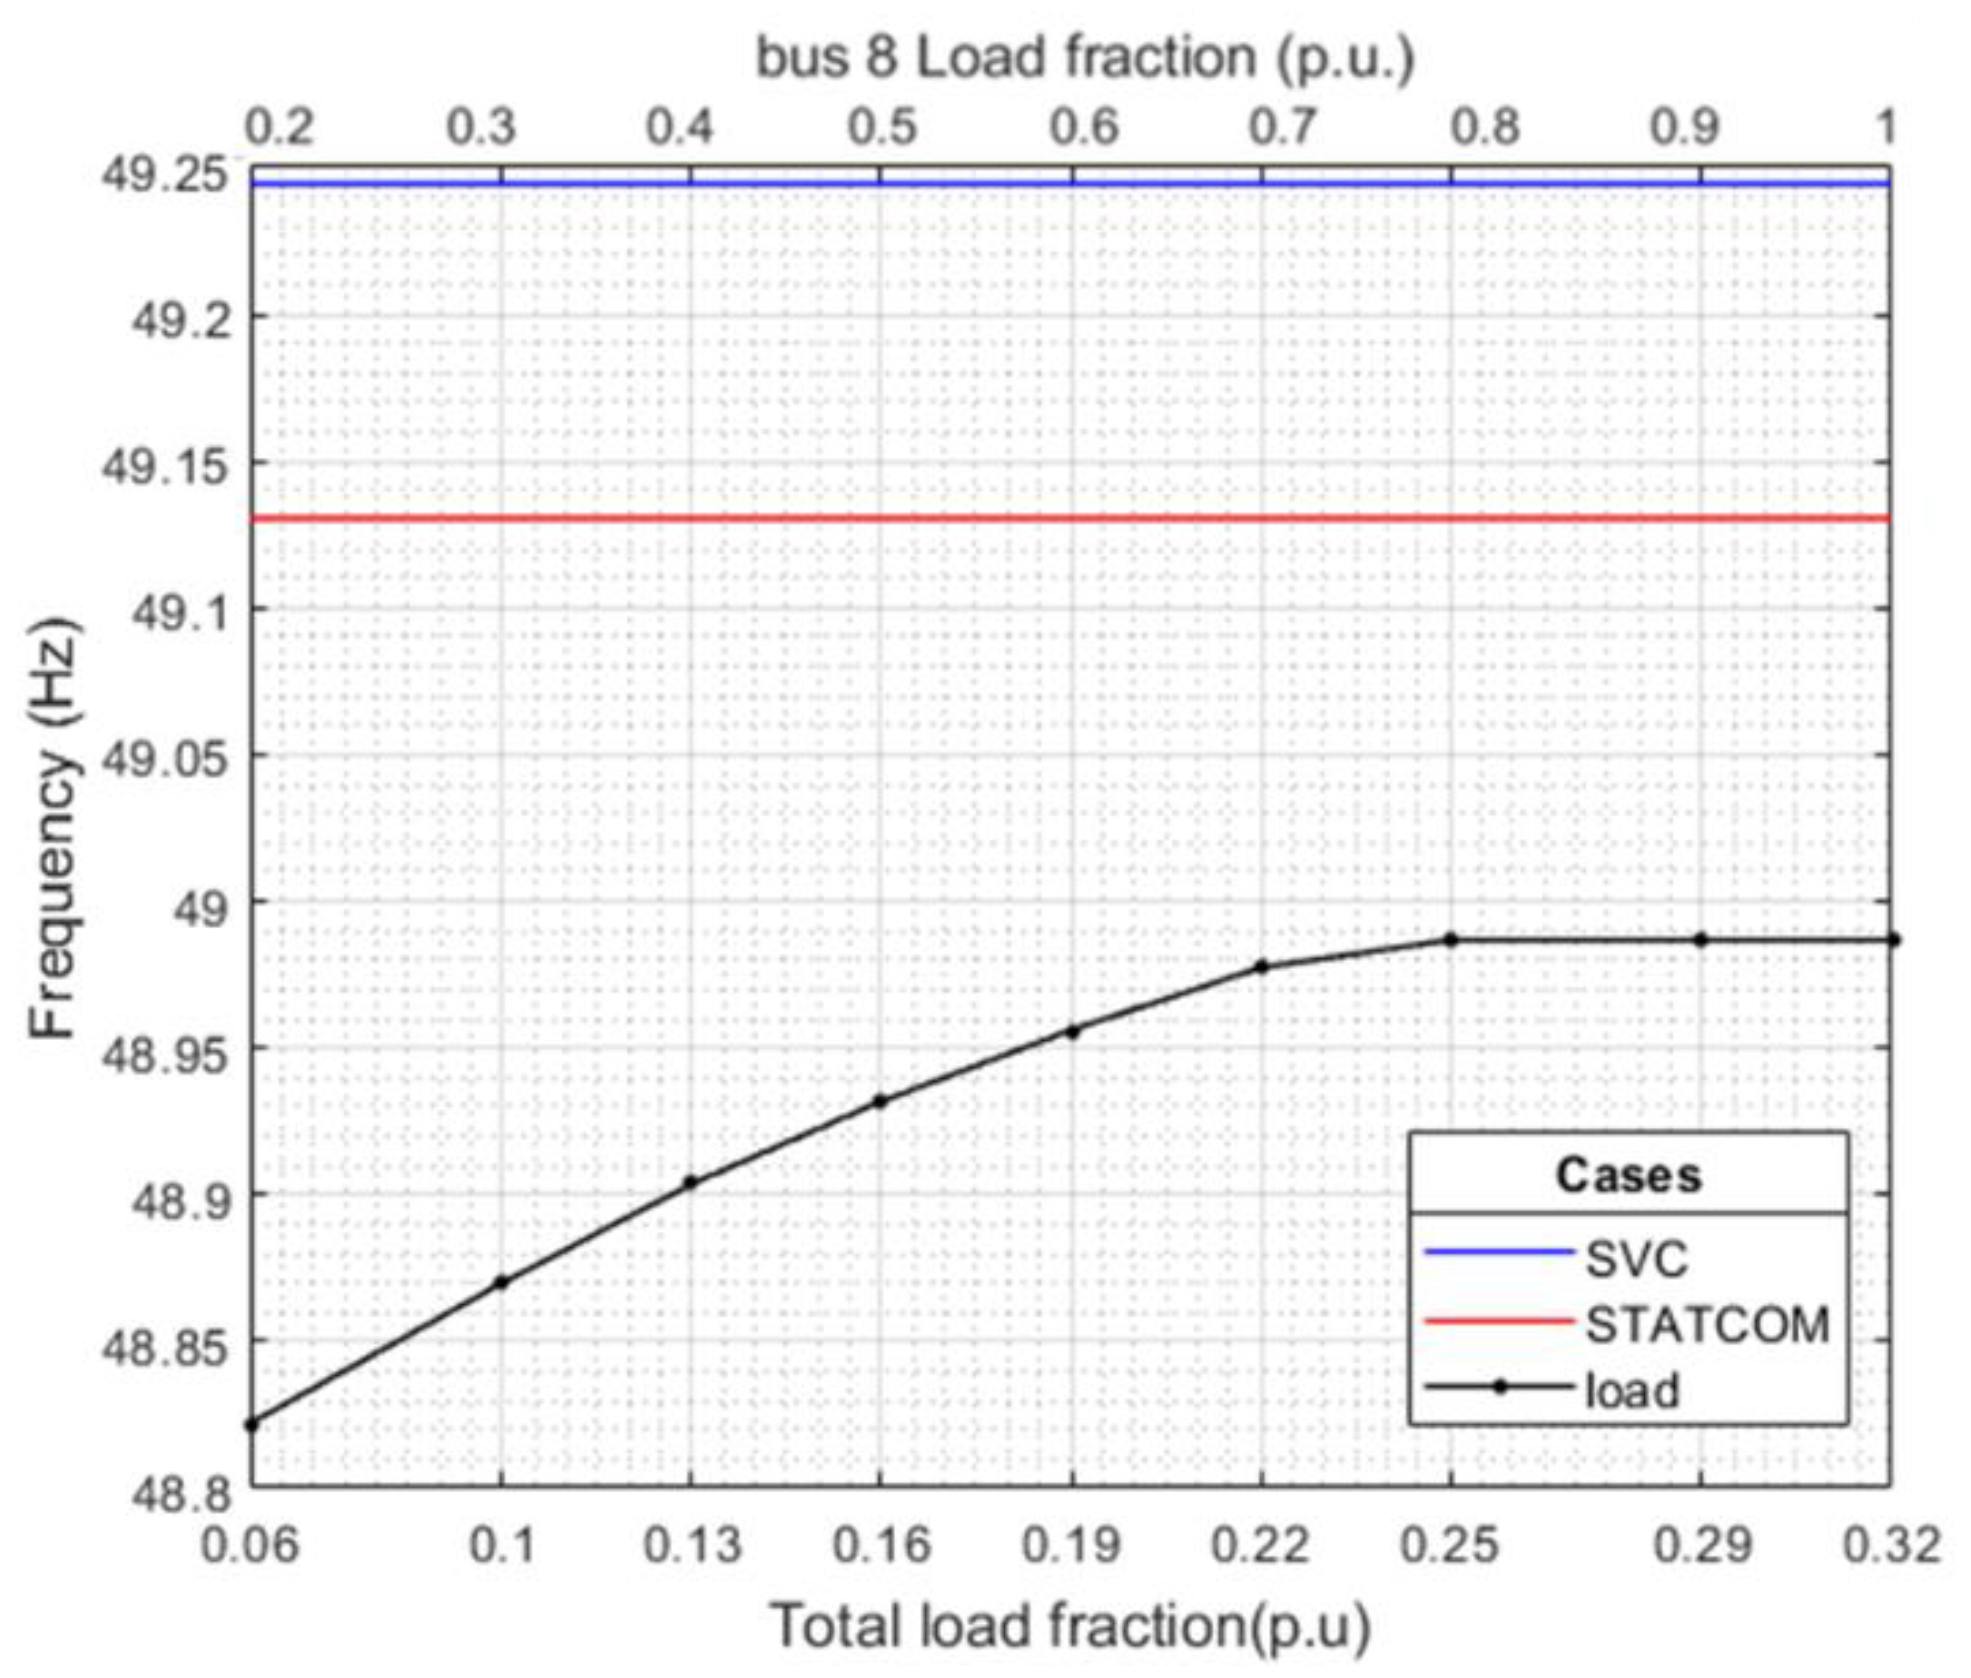
In order to measure the effect of the SVC and STATCOM solutions on frequency stability, they are compared with an existing solution used in underfrequency problems, namely, load shedding.
The criterion used for this comparison is expressed by (1).
The comparison based on the frequency nadir is performed by varying the percentage of the load to be disconnected from bus 8 to achieve the same minimum frequency achieved with the tested devices. The simulations are performed by switching off an increasing percentage of the load from bus 8, the same bus to which the devices are connected.
The disconnection is performed using the frequency relay of the load, which is set to 49.0 Hz [
18].
The results of this comparison are shown in
Figure 9.
From
Figure 9, it can be seen that even with a 100% load shedding at bus 8, the frequency nadir never reaches the value obtained with FACTS devices. Looking at this, the use of these devices makes it possible to avoid load shedding and thus save money for the system.
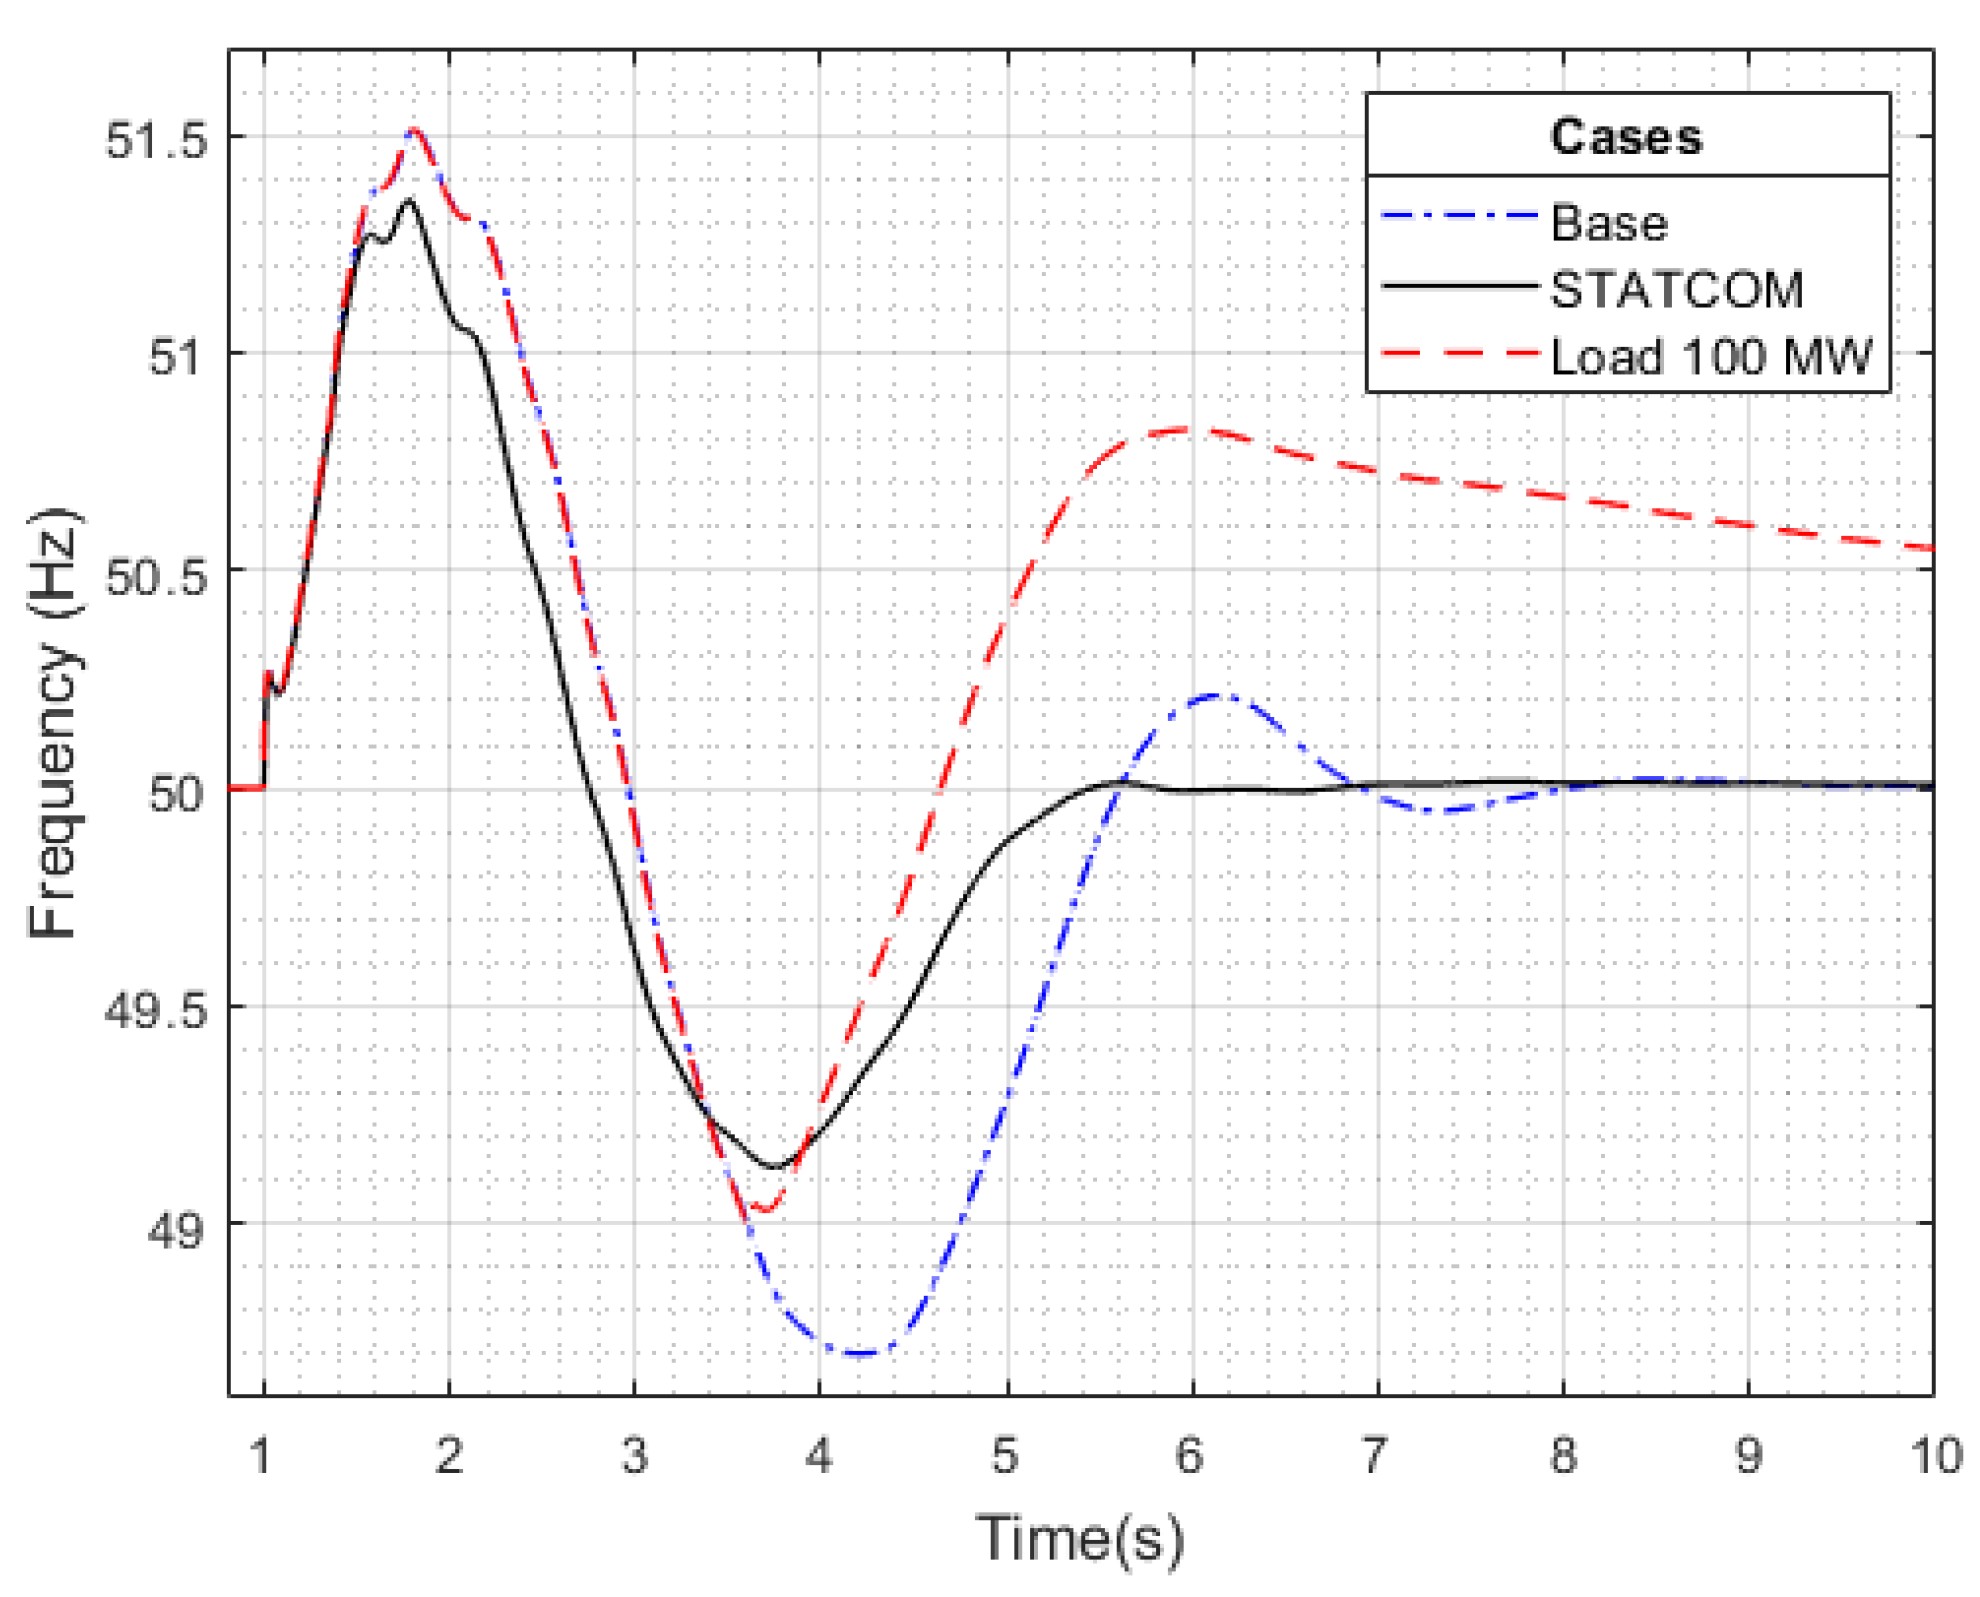
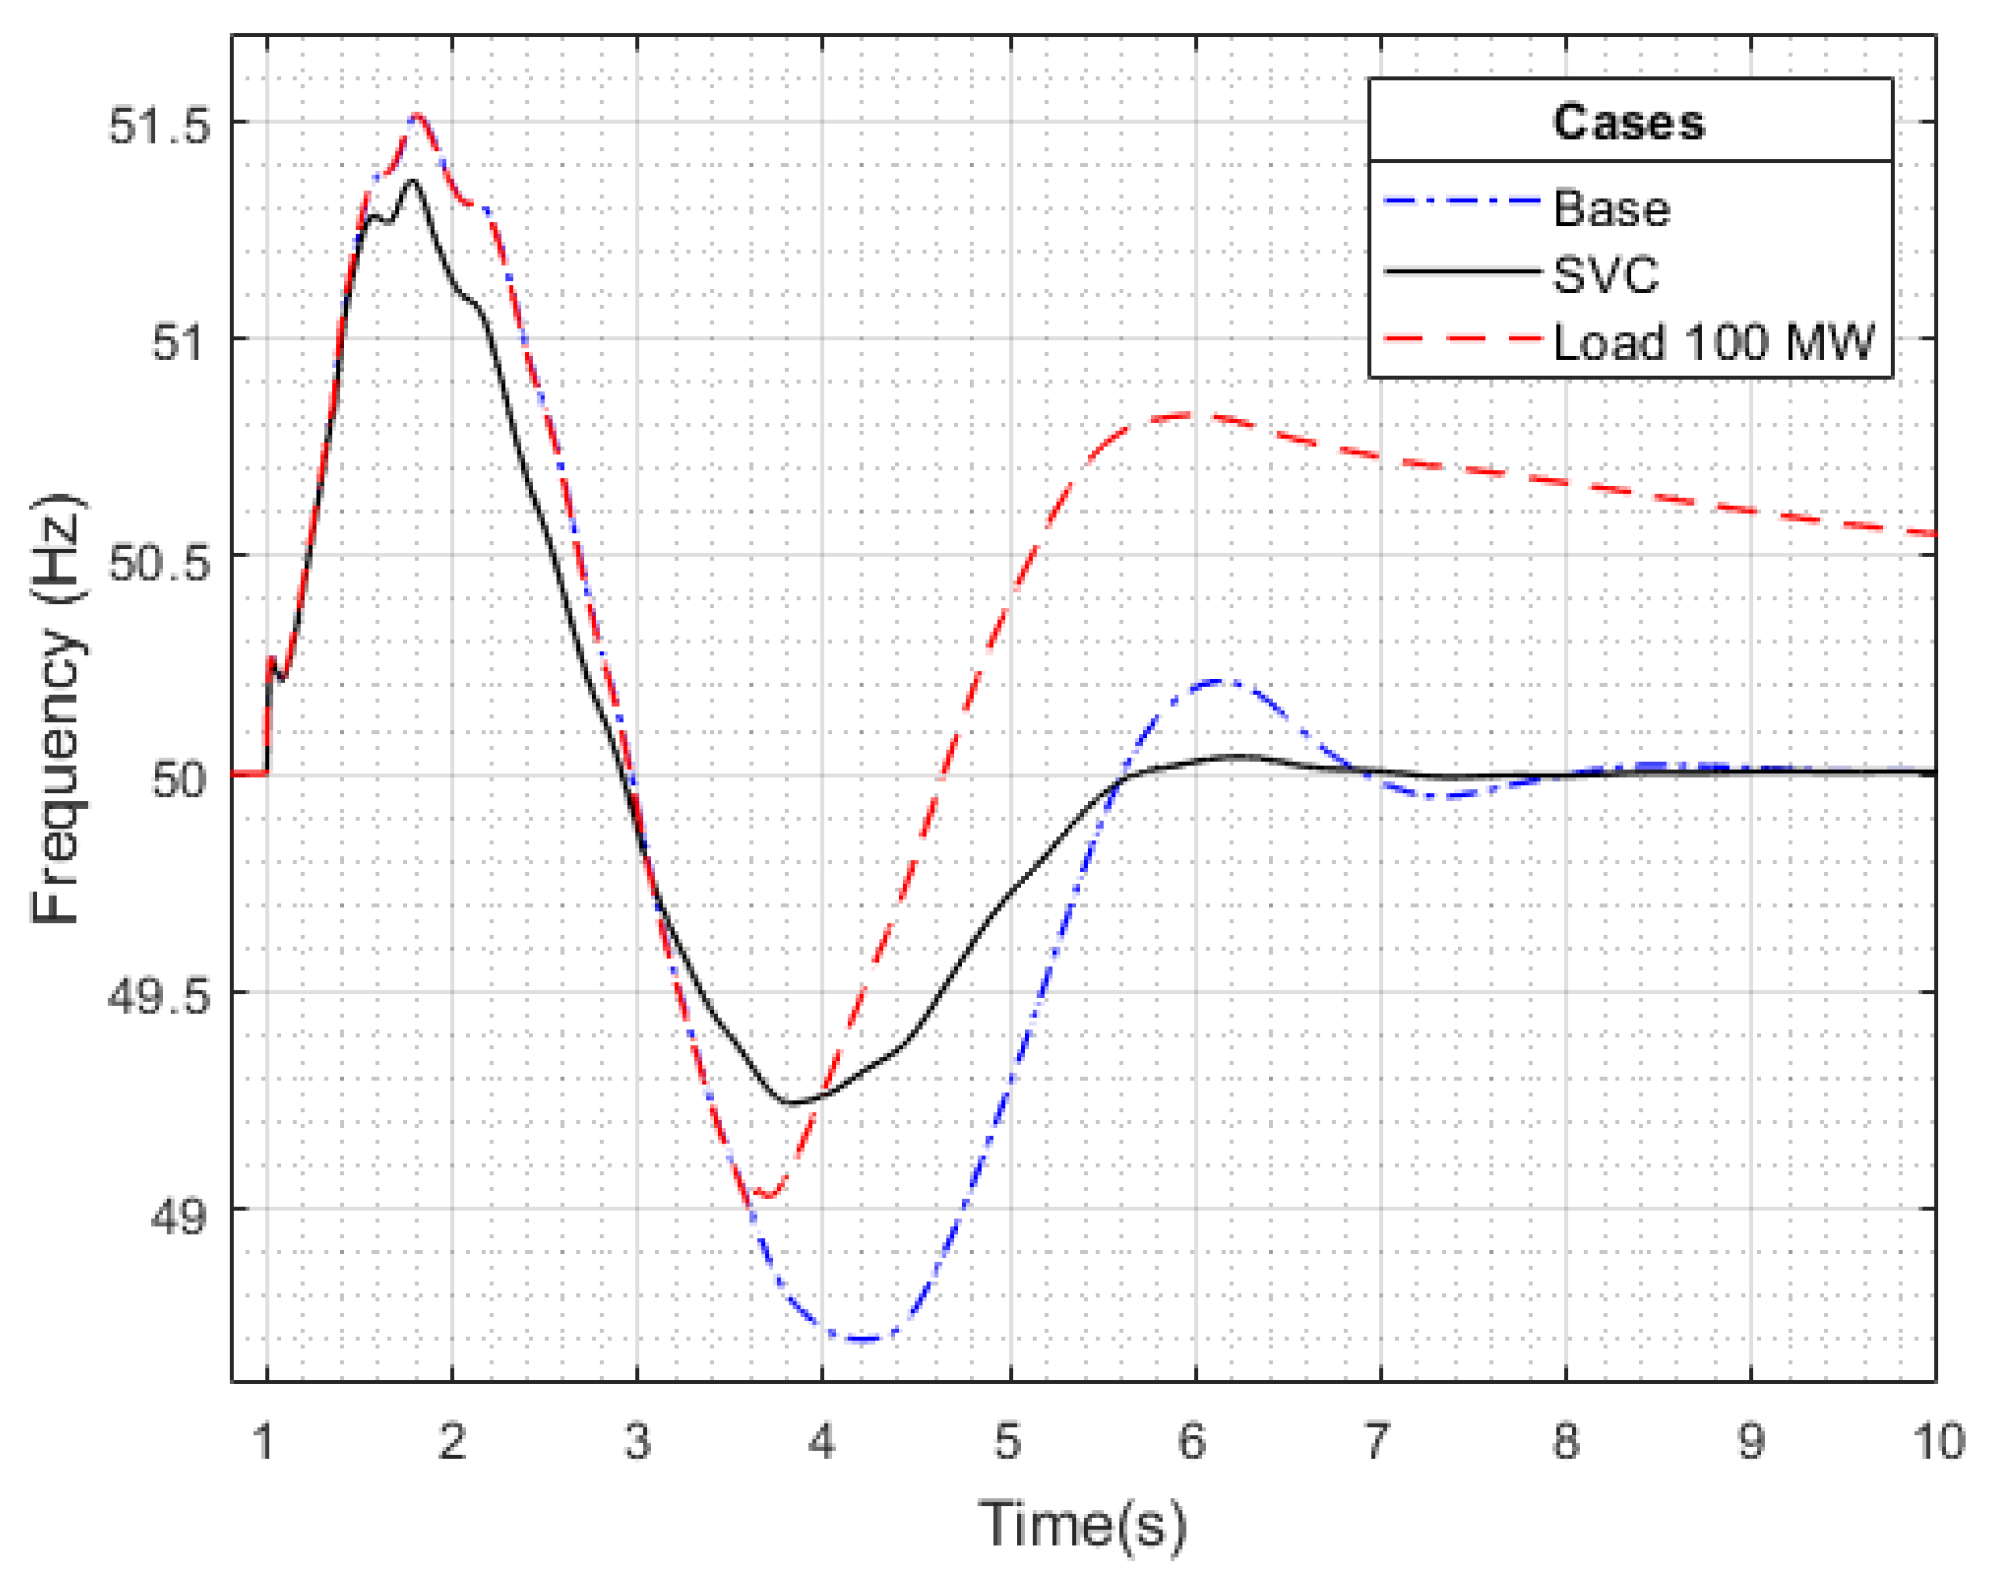
Using these values for the load to be shed, the obtained frequency trends are compared with the frequency trends obtained with both SVC and STATCOM. The comparisons of the frequency trends are shown in
Figure 10 and
Figure 11. From these figures, it can be seen that SVC and STATCMOM provide faster settling time, higher damping of frequency oscillations at underfrequency, and slight attenuation of overfrequency response. Another important feature of the two diagrams is that the disconnection of loads introduces a power imbalance between the generation and the load, which leads to different steady-state values for the frequency after the transient periods so that secondary frequency control is required.
6. Economic Evaluation
In the previous sections, the effects of FACTS, SVC, and STATCOM on the transient stability have been analyzed, considering the rotor angle and frequency stability problems.
In this section, the comparative analysis between SVC and STATCOM focuses on the economic aspects. This is useful to evaluate whether it is worth the investment.
In the following economic analysis, only SVC and STATCOM are considered, while the parallel line and fast-acting exciter are neglected. This assumption is due to the following reasons:
The following economic calculation is based only on the savings margins associated with the frequency stability service. This is because there is currently no compensation for stability support. This justifies the exclusion of the transmission line, whose contribution to this service is close to zero;
The economic evaluation is based on the savings margins for the TSOs due to the installation of the equipment in the transmission system, which is directly operated by them. In contrast, in a deregulated electricity system, the excitation systems of the synchronous generators are owned and operated only by the generation companies;
For this purpose, a simple payback analysis is performed. This type of analysis is a very simple and widely used method that allows evaluating the period required to amortize the initial investment, taking into account the costs and the periodic savings [
5]. The unit cost of the STATCOM device, including the installation cost, was derived from the data in the work of [
19]. Using the data contained in the work of [
4,
5,
6,
9], the unit cost of the device SVC is determined.
SVC: 194.4 €⁄kVAr;
STATCOM 240 €⁄kVAr;
With these values and taking into account the MVAr rating of the two devices, the total cost can be easily determined:
As can be seen in
Section 5,
Figure 10 and
Figure 11, SVC and STATCOM allow load shedding of 100 MW for the analyzed case study. The load shedding is converted using VOLL, which has a mean value of 30 k€/MWh in Italy. [
20]
The benefit of SVC and STATCOM is the avoided cost of load shedding. The expression used to determine the total avoided cost is based on the product of the duration of load shedding due to faults (TFT, Total Fault Time) in the transmission system in one year and the VOLL. The TFT can be calculated as the product between the typical annual independent failure rate of the high voltage transmission line λL [
21] and the total length of the transmission lines L (878.4 km for the modified system IEEE with nine buses). In addition, a total system recovery time of 10 s, TSRT (0.0027 h/year), is considered.
Then, the total avoided cost for SVC and STATCOM (2) can be determined:
It should be noted that the economic consideration developed in this paragraph does not take into account other benefits of SVC and STATCOM, such as voltage regulation and power factor correction, improvement of transient rotor angle stability, and damping of power oscillations. This is because these types of benefits are not remunerated, so it is difficult to assign an economic value to them.
The avoided costs identified in this context have no impact on the valuation of the corresponding investment.
Given these results, it is clear that the two investments are not financially worthwhile if only the contribution to transient frequency stability is considered. This may suggest the introduction of new market products to encourage the use of these devices, such as compensation for voltage stability, rotor angle stability, or reactive power control.
Moreover, the results of this study show that SVC is cheaper than STATCOM. This is due to the higher cost of the power electronic converter required for the STATCOM.
However, as indicated in
Table 8 [
4], the STATCOM is a more compact device with a lower cost of structural measures and, therefore, can be more easily installed in different locations. In addition, the STATCOM requires less maintenance due to the reduced number of passive components and losses.
7. Conclusions
The analyzes developed in this work show that, limited to the considered network, the best solutions to improve the rotor angle stability are the fast-acting exciter and the addition of a new parallel line. On the other hand, in the case of frequency stability, the best solution is the fast-acting exciter, while the addition of a new parallel line has a limited effect.
The use of SVC and STATCOM, even if they improve the rotor angle stability, shows limited effects. On the other hand, SVC and STATCOM are suitable solutions for improving frequency stability. Their use makes it possible to contain frequency fluctuations during the transient phase and avoid load shedding by installing them in the considered network. At SVC and STATCOM, the economic aspect is also taken into account. The result of the simple cost-benefit analysis shows that the investment required for these devices is not profitable, considering only the impact on the stability of the transient phase.
The results obtained in this paper can be summarized as follows: Due to their reactive power and voltage support, SVC and STATCOM devices are useful for improving transient stability. The SVC is slightly ahead of the considered grid, but in the case of a weak grid, its performance deteriorates, while the STATCOM solution guarantees better performance in terms of rotor angle stability in the case of a weak grid or a case characterized by a low percentage of synchronous generation (e.g., high penetration of renewable energy sources); the higher cost of STATCOM compared to SVC is justified by the widest power range and the ease of allocation and maintenance; the modernization of the excitation systems is also a very effective solution thanks to the direct impact on the generators, for which an economic incentive could be created if the provision of voltage regulation services were remunerated.
Investing in the power grid by doubling important lines is not only crucial to avoid congestion problems, but also to significantly improve grid stability. This improvement would also allow for the installation of more RES generation units [
10,
11,
22], which can have a significant impact on stability if they are not technologically predisposed to participate in regulation.
This paper provides a preliminary examination of the impact of new inverter-based technologies on improving the security of modern power systems. Future developments will include the following topics: the impact of the considered technologies on transient stability and frequency stability in a case study IEEE with a large number of RES generators, especially wind and photovoltaic plants; the effects of load models (e.g., exponential model, ZIP model, etc.) are carefully studied. As the photovoltaic plants are mainly installed in the distribution networks, this event will change the behavior of mixed loads in the transmission networks; from an economic point of view, new market products, e.g., ancillary services, need to be developed to encourage not only utilities to provide services based on new technologies but also TSOs to procure cost-effective resources to manage power systems safely.
Finally, an important step to confirm and generalize the results obtained in this work for the IEEE 9-bus network is to apply this analysis to real power systems. However, many characteristics of power systems can affect the final results (e.g., generation technologies, transmission network characteristics, etc.), so it is important to perform a comparative analysis between two power systems in this case as well. For example, comparing the behavior of the power systems of two major Italian islands (i.e., Sicily and Sardinia) can be a useful test. This step is under development [
23].


