Article

Simulation-Based Shading Loss Analysis of a Shingled String for High-Density Photovoltaic Modules

1
Department of Electrical and Computer Engineering, Sungkyunkwan University, Suwon 16419, Korea
2
Department of Electronics, Chosun College of Science and Technology, Gwangju 61453, Korea
*
Author to whom correspondence should be addressed.
Appl. Sci. 2021, 11(23), 11257; https://doi.org/10.3390/app112311257
Submission received: 27 October 2021 / Revised: 16 November 2021 / Accepted: 24 November 2021 / Published: 27 November 2021
(This article belongs to the Special Issue Power Electronic Applications in Power and Energy Systems)

Abstract

:
Shingled photovoltaic (PV) modules with increased output have attracted growing interest compared to conventional PV modules. However, the area per unit solar cell of shingled PV modules is smaller because these modules are manufactured by dividing and bonding solar cells, which means that shingled PV modules can easily have inferior shading characteristics. Therefore, analysis of the extent to which the shadow affects the output loss is essential, and the circuit needs to be designed accordingly. In this study, the loss resulting from the shading of the shingled string used to manufacture the shingled module was analyzed using simulation. A divided cell was modeled using a double-diode model, and a shingled string was formed by connecting the cell in series. The shading pattern was simulated according to the shading ratio of the vertical and horizontal patterns, and in the case of the shingled string, greater losses occurred in the vertical direction than the horizontal direction. In addition, it was modularized and compared with a conventional PV module and a shingled PV module. The results confirmed that the shingled PV module delivered higher shading output than the conventional PV module in less shade, and the result of the shading characteristic simulation of the shingled PV module was confirmed to be accurate within an error of 1%.

1. Introduction

Global warming has caused the intensity and frequency of heat waves, droughts, and typhoons to intensify worldwide [1]. As a result, many countries are increasingly interested in the generation of renewable power to replace the use of thermal power [2]. In addition, international participation, such as that stipulated by the Kyoto Protocol and the Paris Climate Change Accord, has increased the demand for renewable energy. As of the end of 2019, global photovoltaic (PV) installations reached 627 GW, representing an annual increase of 115 GW from 2018 [3].
Building-integrated photovoltaic power generation, which produces electricity from PV modules installed on roofs, windows, and other exterior parts of buildings, has recently begun to attract attention [4,5]. As a result, the solar generation market requires high-efficiency modules to generate power in a limited space. However, conventional PV modules are manufactured by connecting 6-inch solar cells with metal ribbons, and because this type of system requires space for installing insulation between solar cells, these modules experience spatial output loss [6,7]. The shingled technology of PV modules involves dividing each solar cell into a 3–6 pattern, applying an electrically conductive adhesives (ECA) to the front side of the divided cell, and bonding it to the rear side of another divided cell [8,9]. As a result, the divided cells overlap with each other, producing a shingled string of structures without a busbar. In addition, the space required for insulation between solar cells is reduced, potentially making them more efficient than conventional PV modules [10]. However, shingled PV modules are often affected by shading. This is because the divided cells used in shingled PV modules are connected in series and are smaller than the solar cells of conventional PV modules [11]. Therefore, it is necessary to analyze the output loss of a shingled PV module with high accuracy according to the shading type and design the module structure such that the shading loss is minimized.
In this paper, the shading characteristics of shingled PV modules and conventional PV modules were compared and analyzed. In the case of a shingled PV module, the shading characteristics in the shingled string were additionally analyzed for analysis. In addition, PSpice® simulation software (OrCAD 17.2, Cadence, San Jose, CA, USA) was used to model the shingled PV module as a divided cell, and enabled the shading characteristics of the shingled PV module to be simulated.

2. Materials and Methods

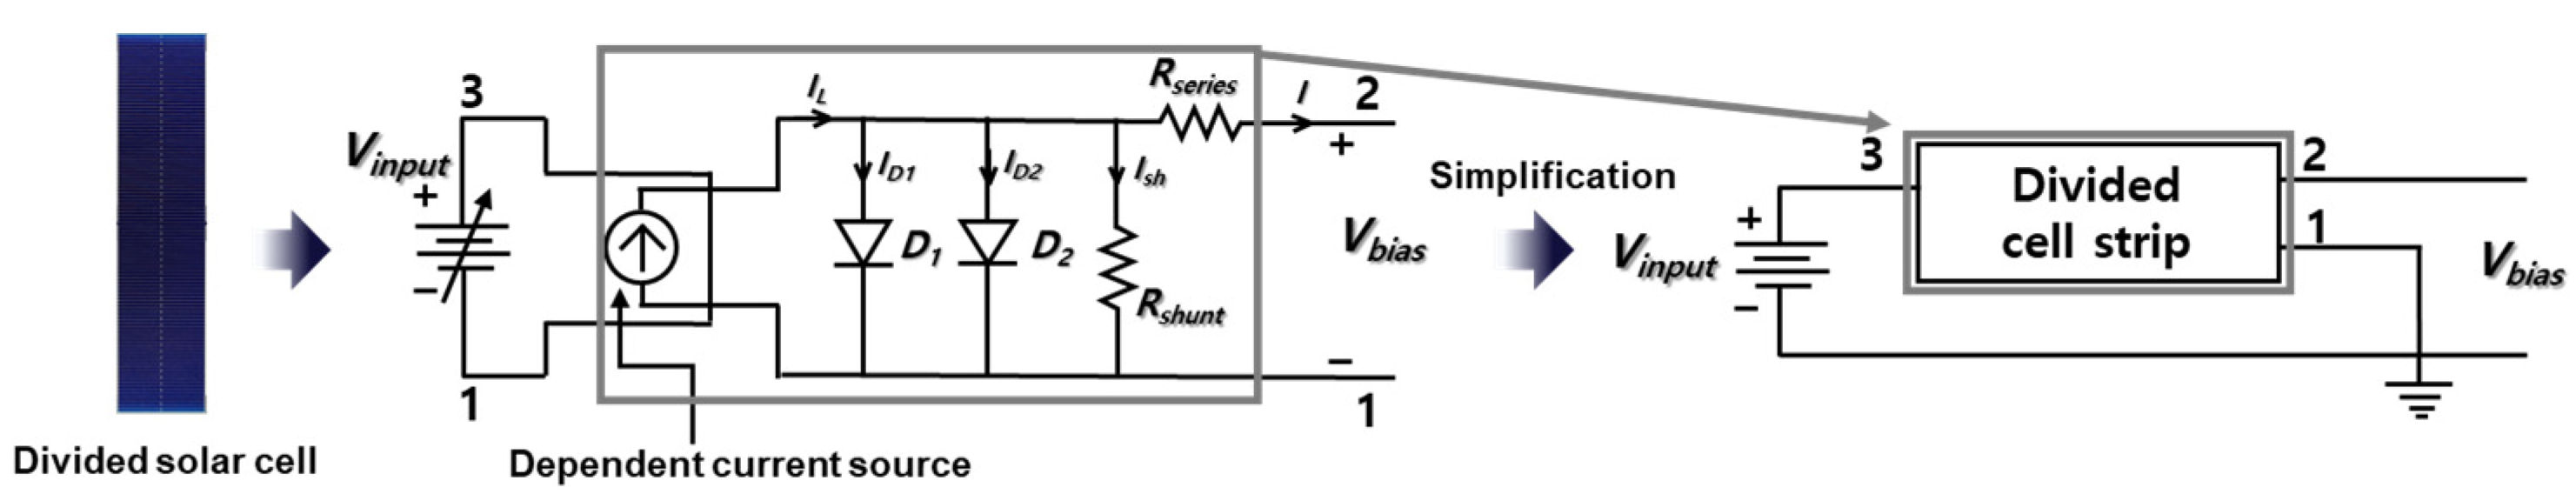
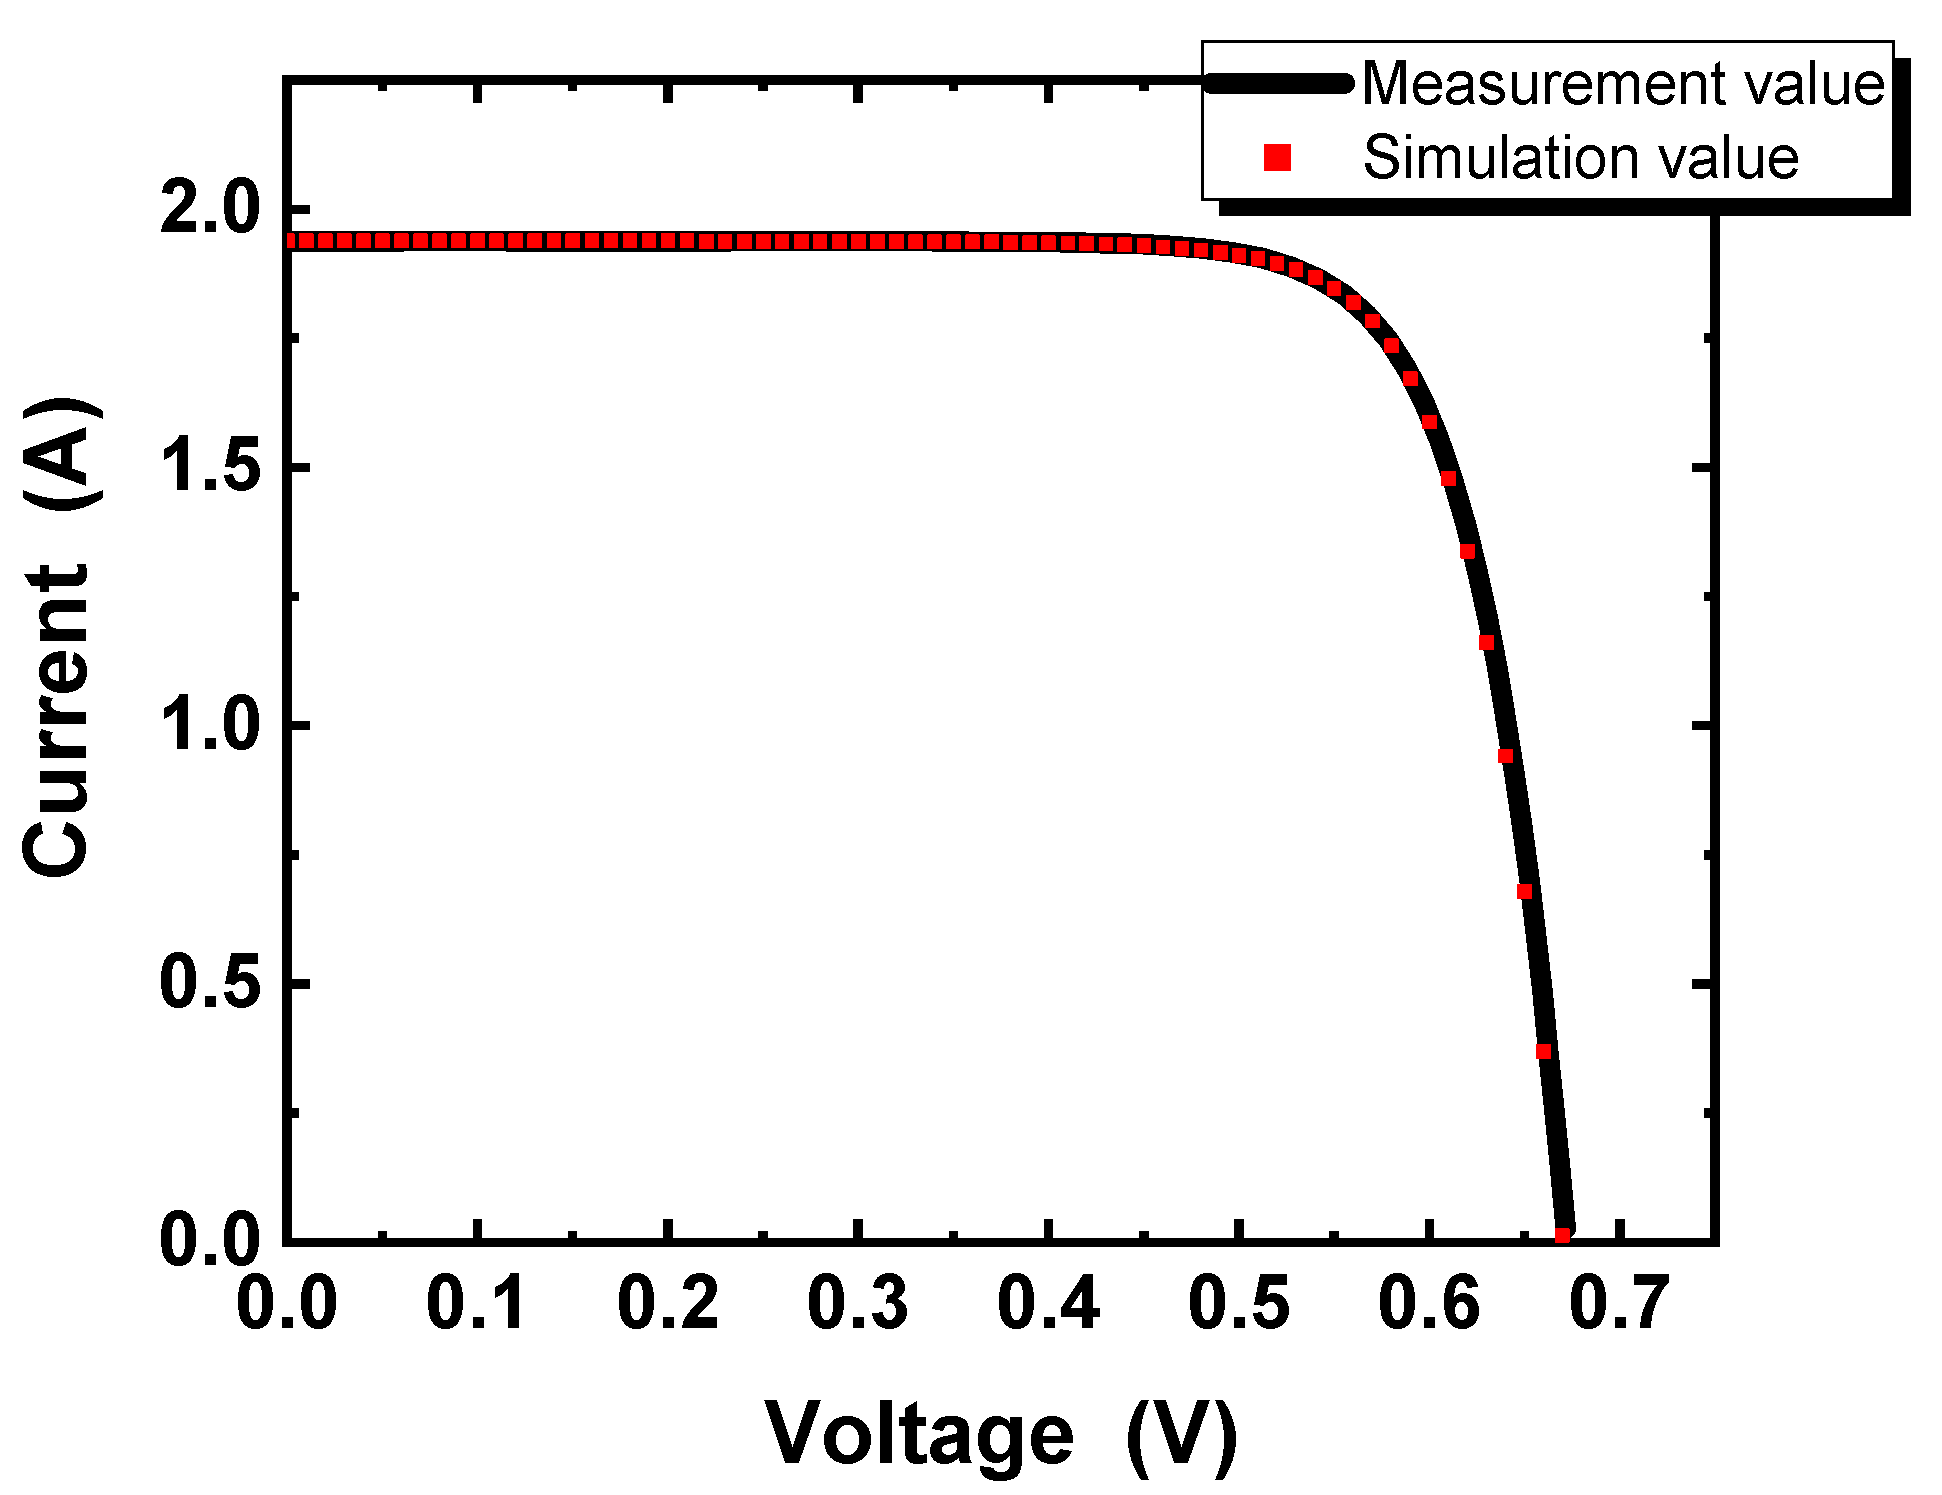
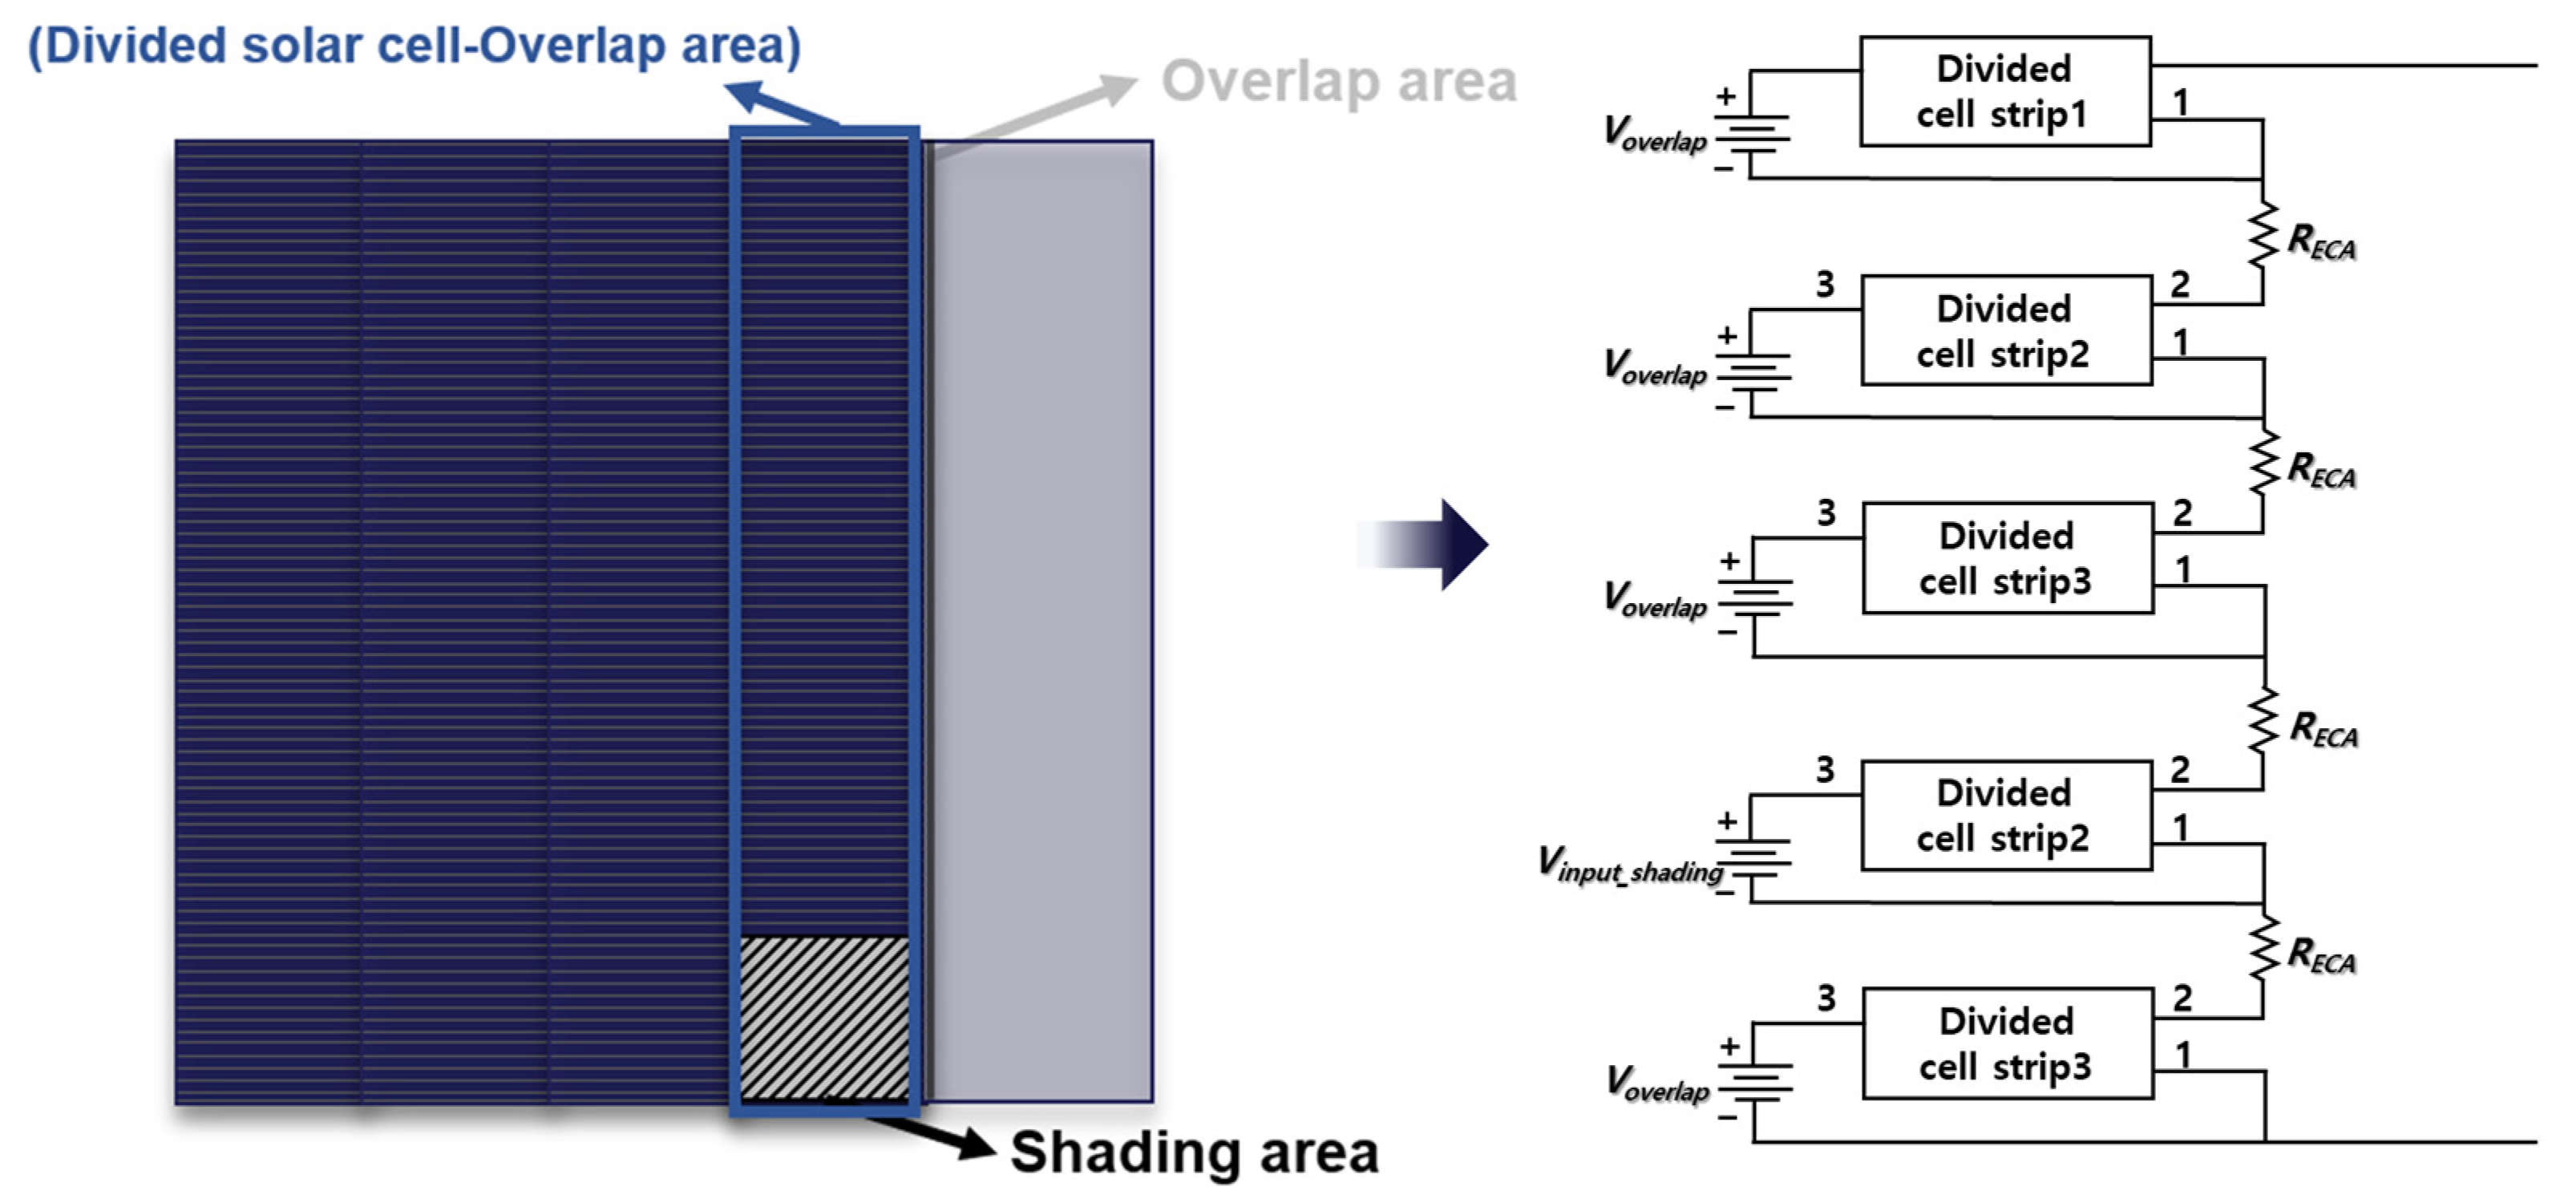
2.1. Divided Solar Cell Circuit Modeling

A passive emitter and rear cell (PERC) were used in this study. The M2 size (156.75 mm) solar cell was divided into five sections and used to manufacture a shingled PV module, which was modeled first. The divided cell was modeled using a double diode model, and the required parameters were measured using a solar simulator (WXS-155S-L2, Wacom, Fukaya, Japan) and current–voltage analyzer (DKSCT-3T, Denken, Yufu, Japan) under standard test conditions (STC, AM 1.5, solar irradiance: 1000 W/m2, temperature: 25 °C). The voltage–current characteristics of the double-diode model are expressed by Equation (1) [12,13,14]. The parameters used to conduct the modeling were the short-circuit current (Isc), open-circuit voltage (Voc), maximum power (Pm), maximum power voltage (Vpm), maximum power current (Ipm), series resistance (Rs), and parallel resistance (Rsh) [12,15]. Figure 1 shows the circuit of the double-diode model that was used for modeling the divided cell. To simulate the output loss resulting from shading, the light generated current (IL) of the modeled divided cell was adjusted with a voltage source (Vinput) and simulated as though shading had occurred. Vinput replaces the current source of the double diode model. The control range of Vinput is 0 V~1000 V, and when it is set to 1000 V, the amount of light in the simulation is the same as 1000 W/m2. A comparison of the measurement efficiency and output values of the double diode model with those of actual divided cells showed that the two are similar. Table 1 presents the characteristics of the modeled split solar cell and the simulated solar cell and Figure 2 presents the I–V curve of the modeled split solar cell and the simulated solar cell. This confirms that the modeled divided cell has almost the same characteristics as the actual divided solar cell, verifying that the loss analysis according to the shading of the shingled string was successfully simulated using the double-diode model.
I = I L I s 1 ( e x p V + I R s V T 1 ) I s 2 ( e x p V + I R s 2 V T 1 ) V + I R s R s h  

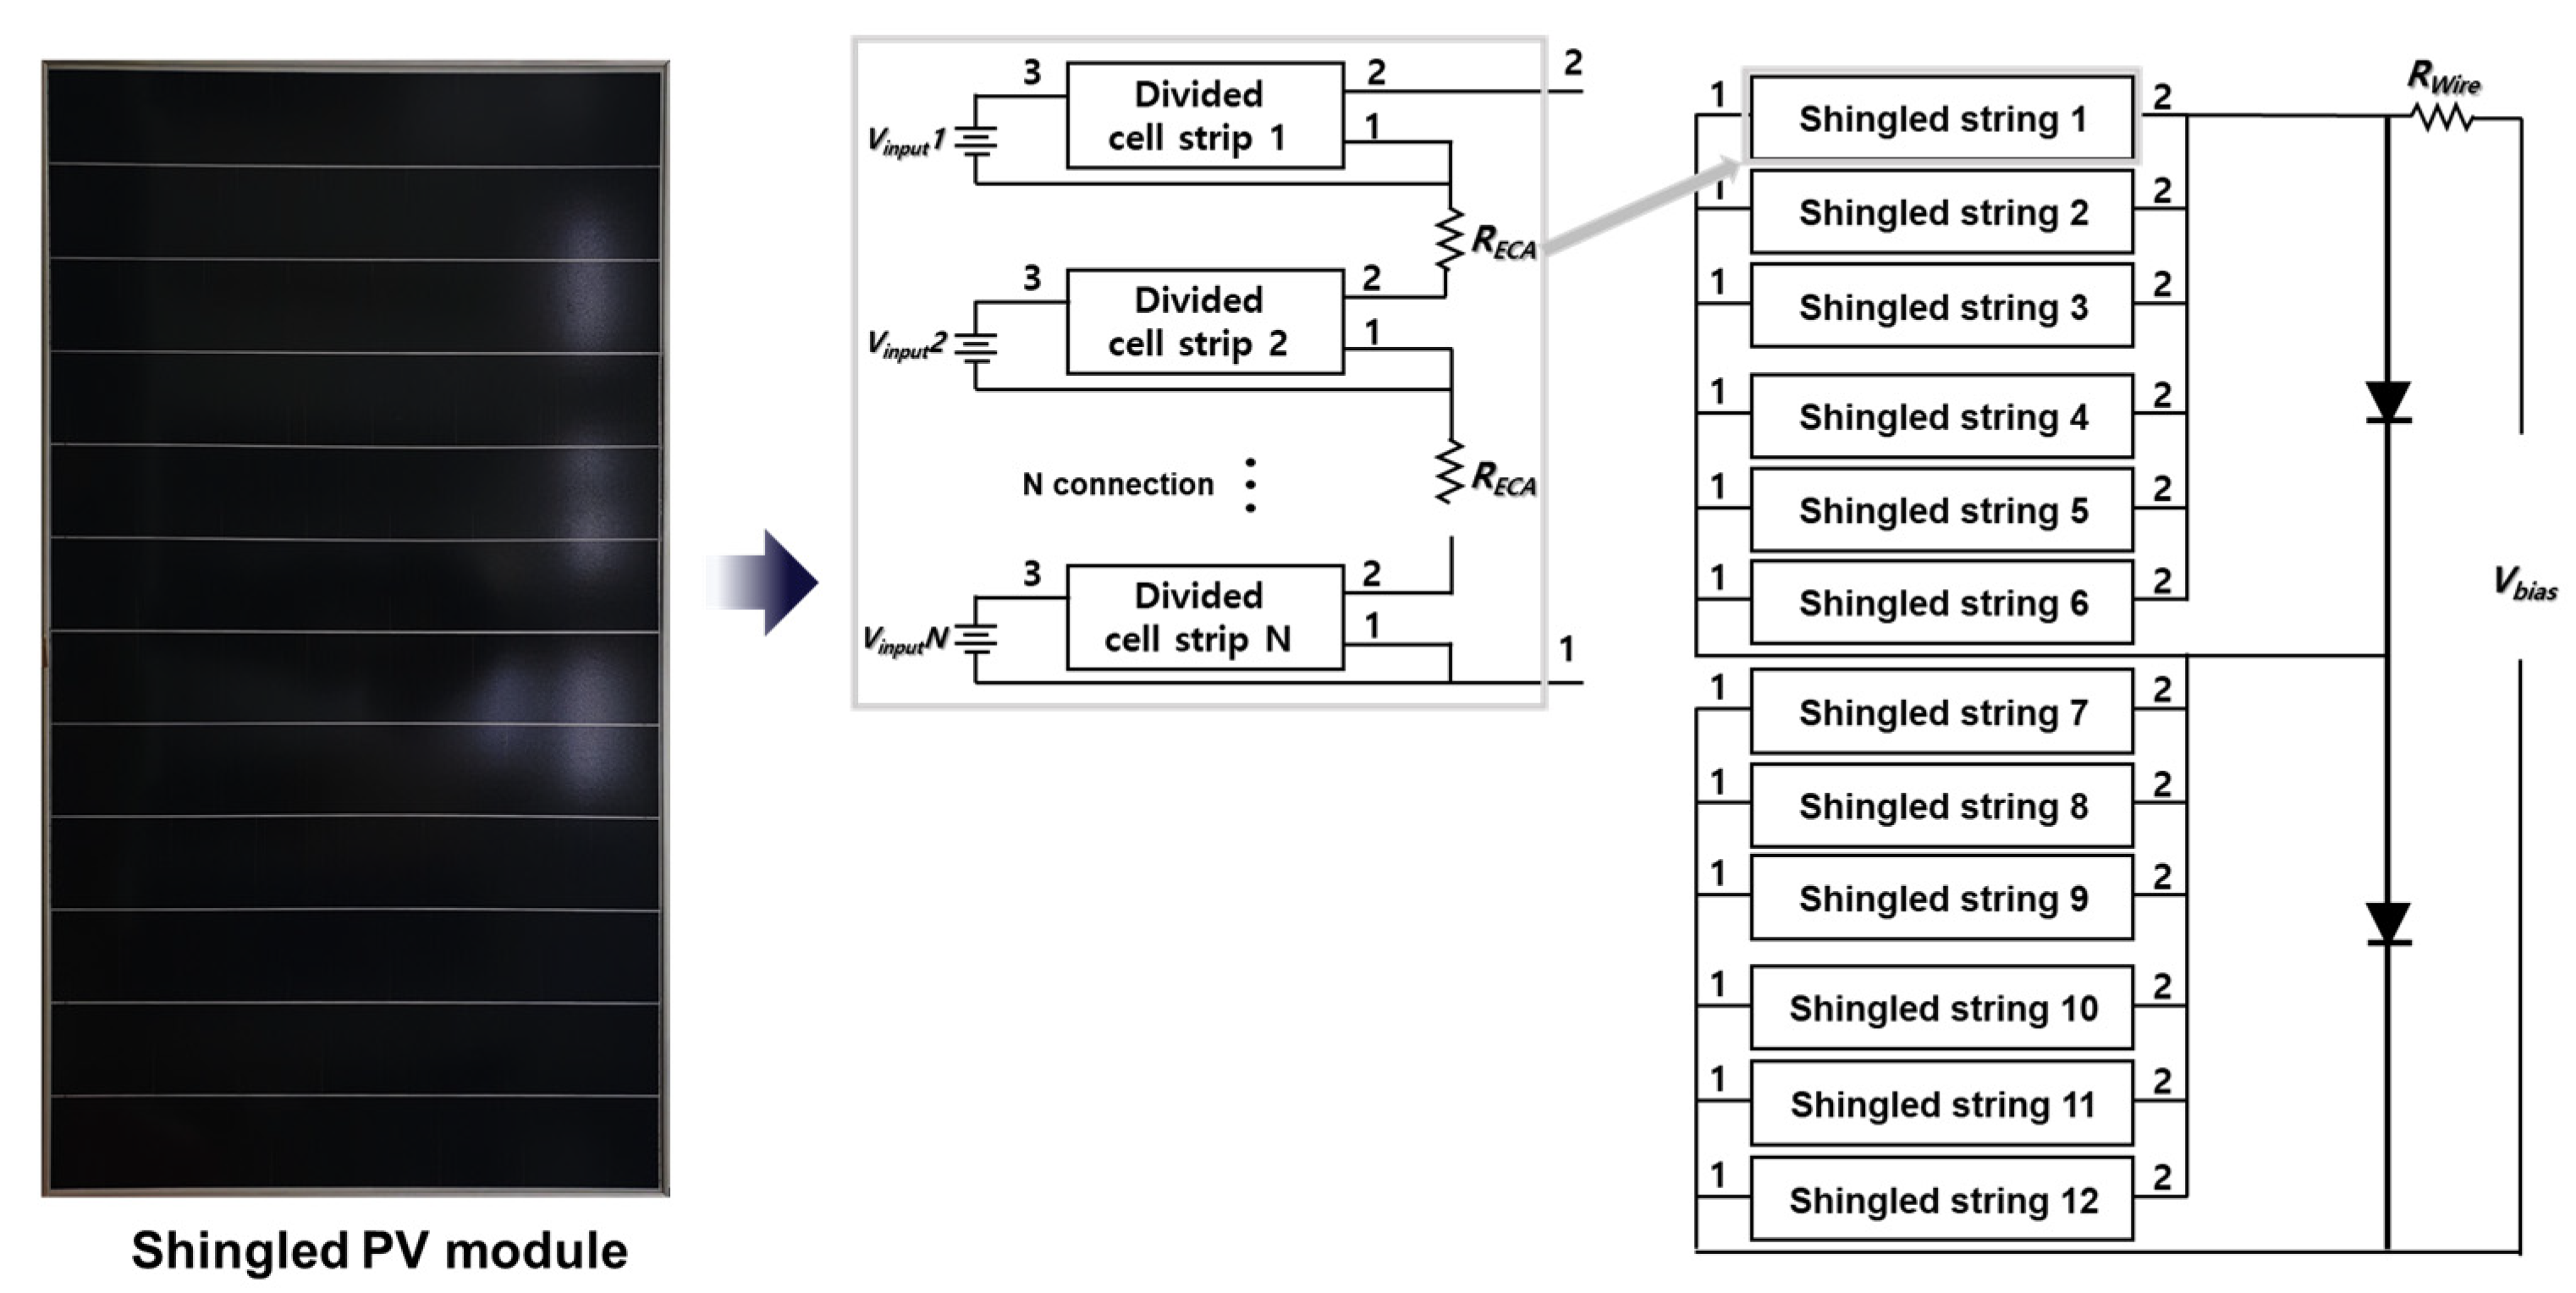
2.2. Shingled PV Module Circuit Modeling

Figure 3 shows a schematic of the model that was used to simulate a shingled string. To produce a shingled string, each divided solar cell was bonded using an ECA. However, in the bonding process, each divided cell overlaps and is bonded, as shown in Figure 2, and the lower divided cell is shaded [16]. Equation (2) was used to calculate the voltage overlap to represent the shading loss of the divided solar cell in the lower part as a voltage source [17]. The modeled divided cells were connected in series to simulate the shading of a shingled string. In addition, a shingled string circuit was formed by adding the resistance value of the ECA used for manufacturing the shingled string between each pair of interconnected cells. An ECA resistance value of 2.2 mΩ, obtained by varying the ECA resistance reported by Park et al. [18], was used.
V o v e r l a p = ( A D i v i d e d   c e l l A o v e r l a p A D i v i d e d   c e l l A b u s b a r ) × 1000
The modeled shingled string was connected in series and parallel, as shown in Figure 4. The shingled PV module used in this study consists of 6 parallel 2 series circuits and two bypass diodes. The wiring resistance was calculated and added based on the wiring length of the designed shingled PV module, and the resistance value of the 6 mm wide wiring ribbon was 9.5 mΩ/m. In addition, photovoltaic modules generally exhibit light loss that occurs in the front cover glass and Ethyl Vinyl Acetate (EVA) sheet. The shingled PV module modeled in this study was simulated by multiplying the Vmodule calculated as in Equation (3) by a loss of −2.28%.
V m o d u l e = V o v e r l a p × 0.9772

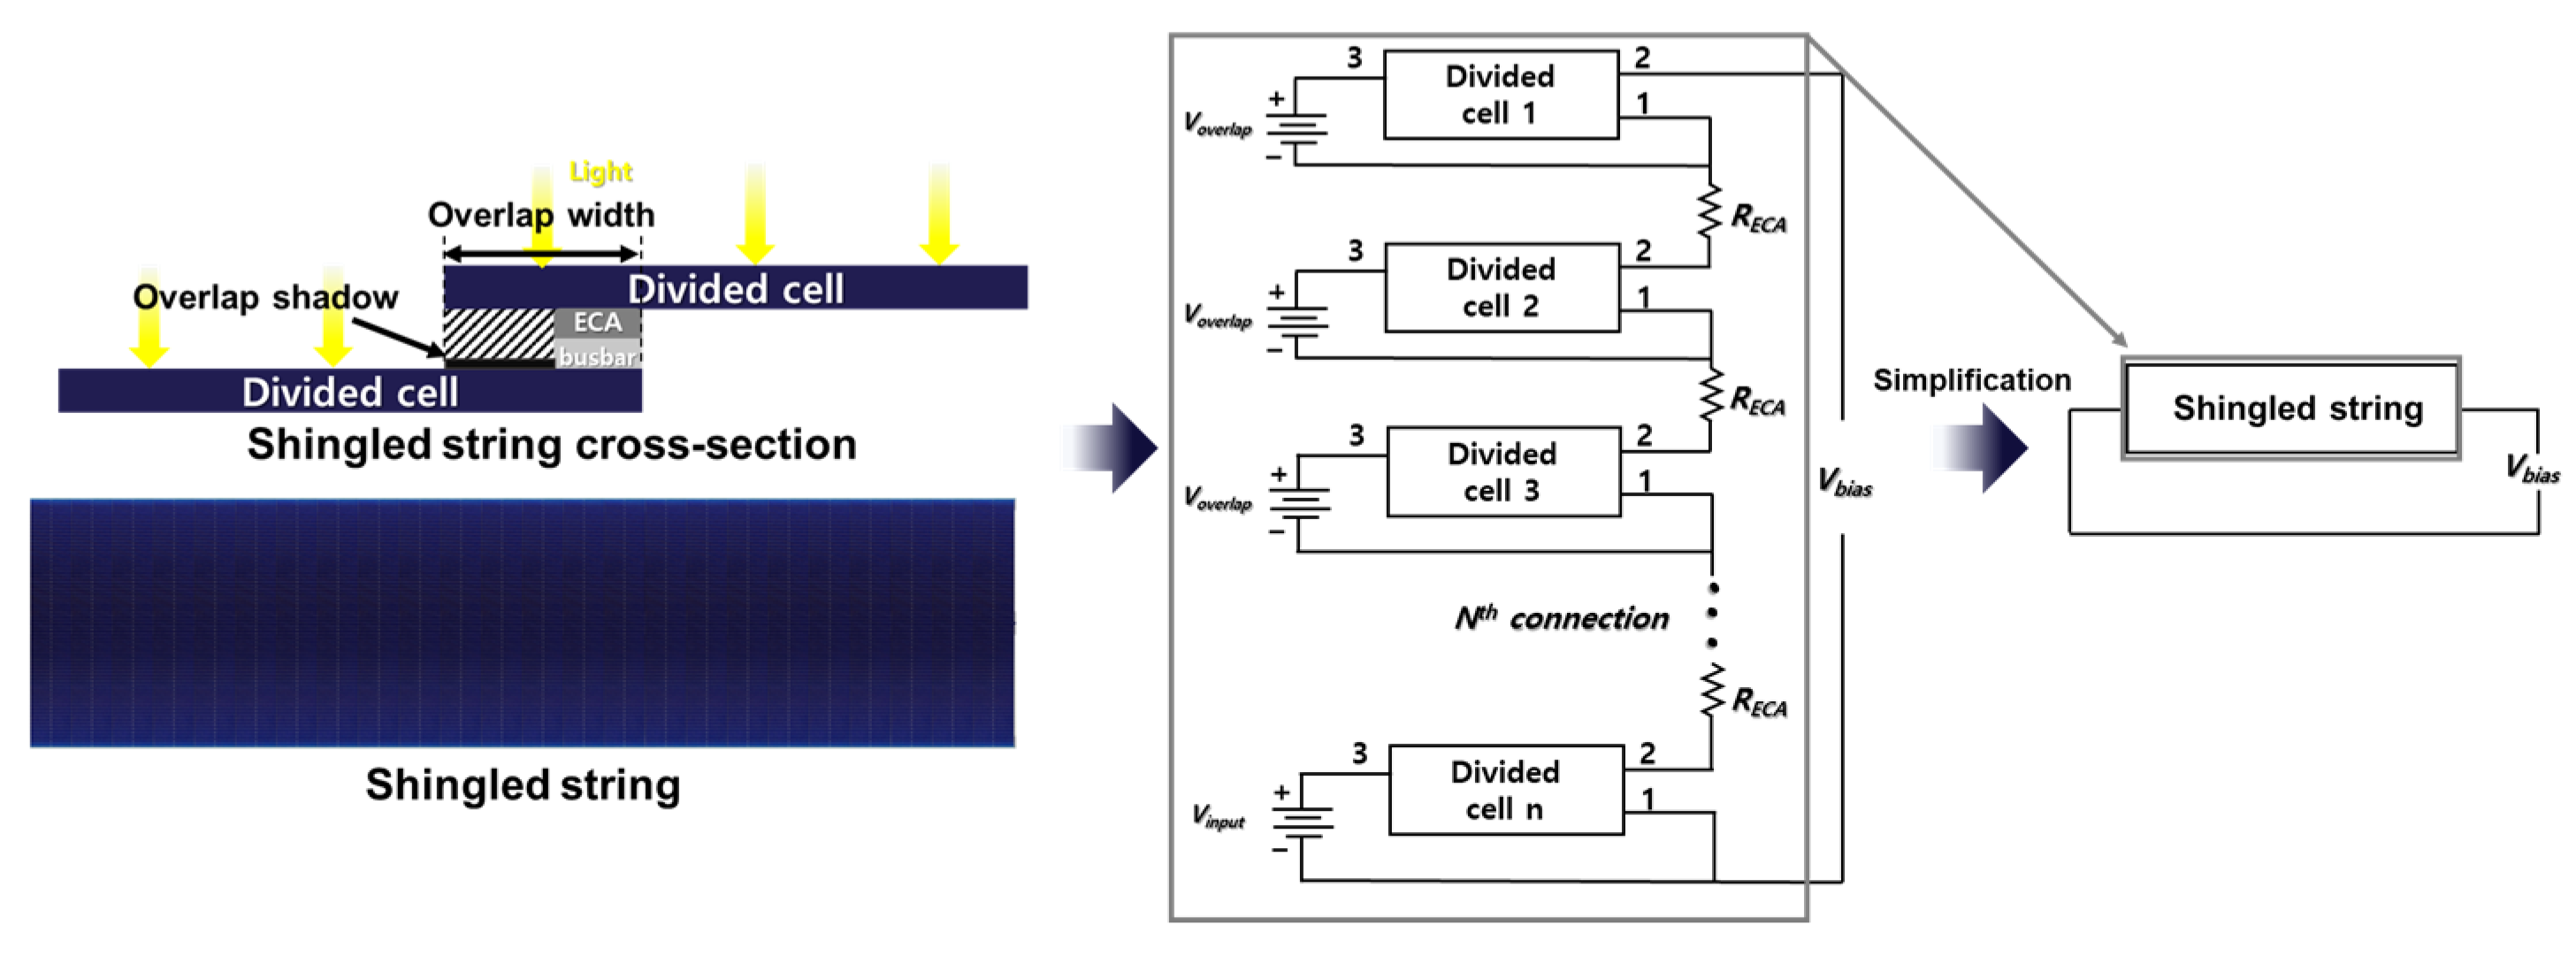
2.3. Modeling the Shading of Shingled PV Modules

First, to understand the shading characteristics of the shingled string, a 5-bonding shingled string was produced. In the case of the manufactured shingled string, an overlap of 0.17 cm was applied. The fabricated shingled string was measured using a solar simulator under STCs without lamination. The shading pattern applied to the shingled string was measured by extending the shading in the horizontal and vertical directions. Figure 5 and Figure 6 schematically show the shading pattern applied to the shingled string.
When modeling the shingled string, we applied the overlap loss that occurs as a result of the shadow caused by the use of the shingled technique. Vstring_shading is expressed using Equation (4) to apply the shading to the front surface of the PV module in addition to the overlap loss. In the case of Vinput, as a device for controlling the photovoltaic current value of the divided solar cells, shading was also input by calculating the shaded area in each divided cell. In addition, to exclude the already reflected overlap shadow loss, the overlap area was subtracted from the total divided cell area. Figure 7 schematically explains the parameters in Equation (4) and shows the corresponding equivalent circuit diagram used for the PSpice simulation.
V s t r i n g _ s h a d i n g = ( 1 S h a d i n g   a r e a   i n   d i v i d e d   s o l a r   c e l l ( D i v i d e d   s o l a r   c e l l   a r e a O v e r l a p   a r e a ) ) × V o v e r l a p
The shingled sun module simulates the shading characteristics by adjusting Vinput in the same way as the shingled string. However, in the case of a shingled PV module, the simulation was conducted in consideration of the loss caused by the front cover glass and EVA sheet, and the voltage value used as input to each divided cell was calculated using Equation (5).
V m o d u l e _ s h a d i n g = ( 1 S h a d i n g   a r e a   i n   d i v i d e d   s o l a r   c e l l ( D i v i d e d   s o l a r   c e l l   a r e a O v e r l a p   a r e a ) ) × V m o d u l e
The shading pattern applied to the shingled PV module was measured by extending the shading in a horizontal direction in the same way as the shingled string and compared with the simulation. The solar module was measured using a module solar simulator (DKSMT-1520SUL, Denken, Yufu, Japan). Figure 8 shows the shading pattern that was applied to the shingled PV module.
Additionally, the same shading pattern was analyzed with the shingled PV module by measuring the shading characteristics of the conventional PV module. Figure 9 and Figure 10 show the circuit of a shingled PV module and a conventional PV module. In the shingled PV module, 12 shingled strings were connected in series and each string consisted of 34 divided cells, which were connected in series. For this module, two bypass diodes were used. The conventional PV module consisted of 72 solar cells, which were connected in series, and a total of three bypass diodes were used.

3. Results and Discussion

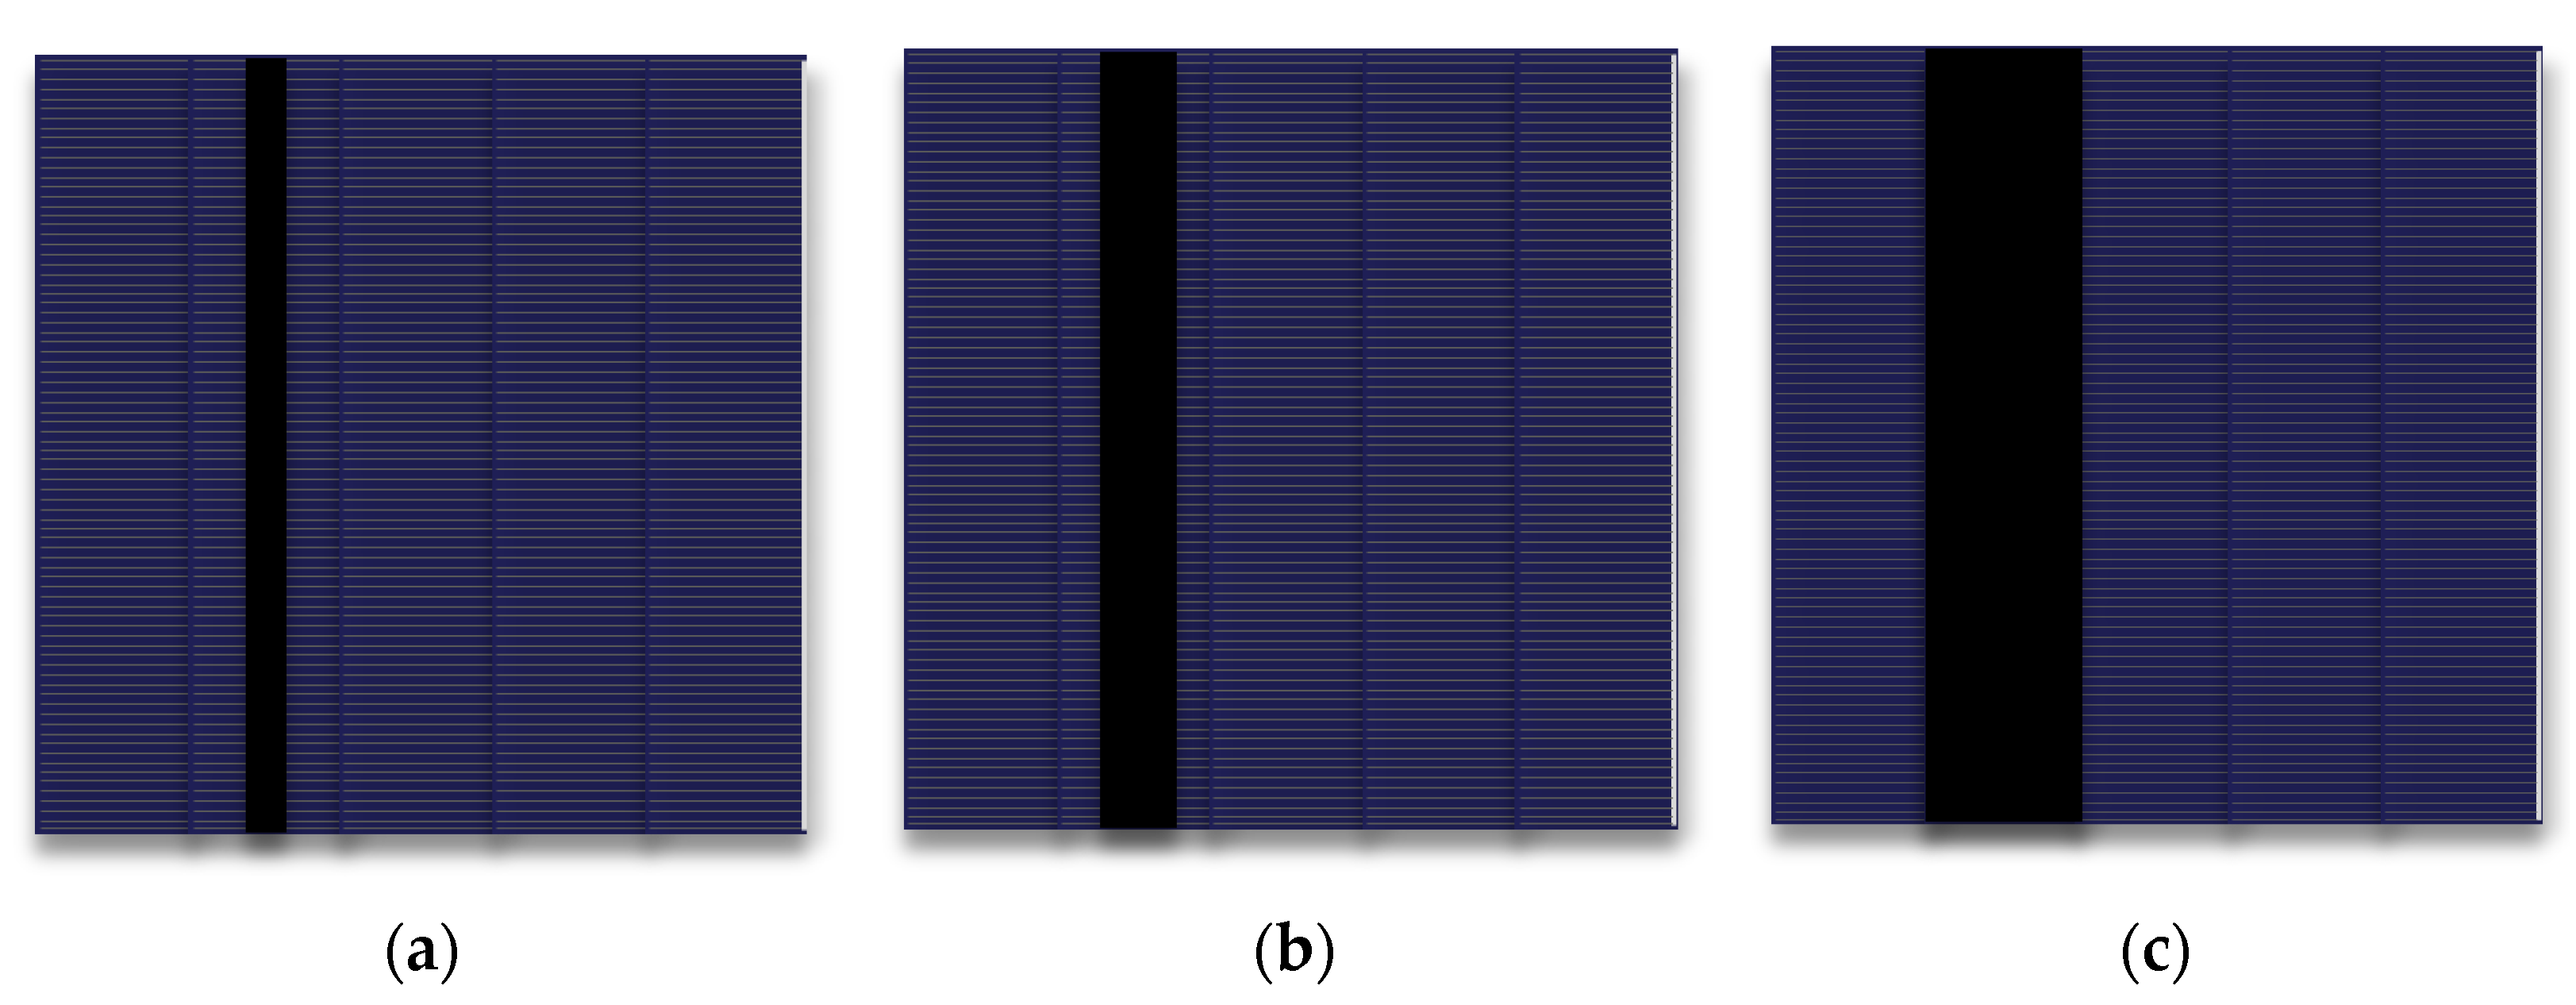
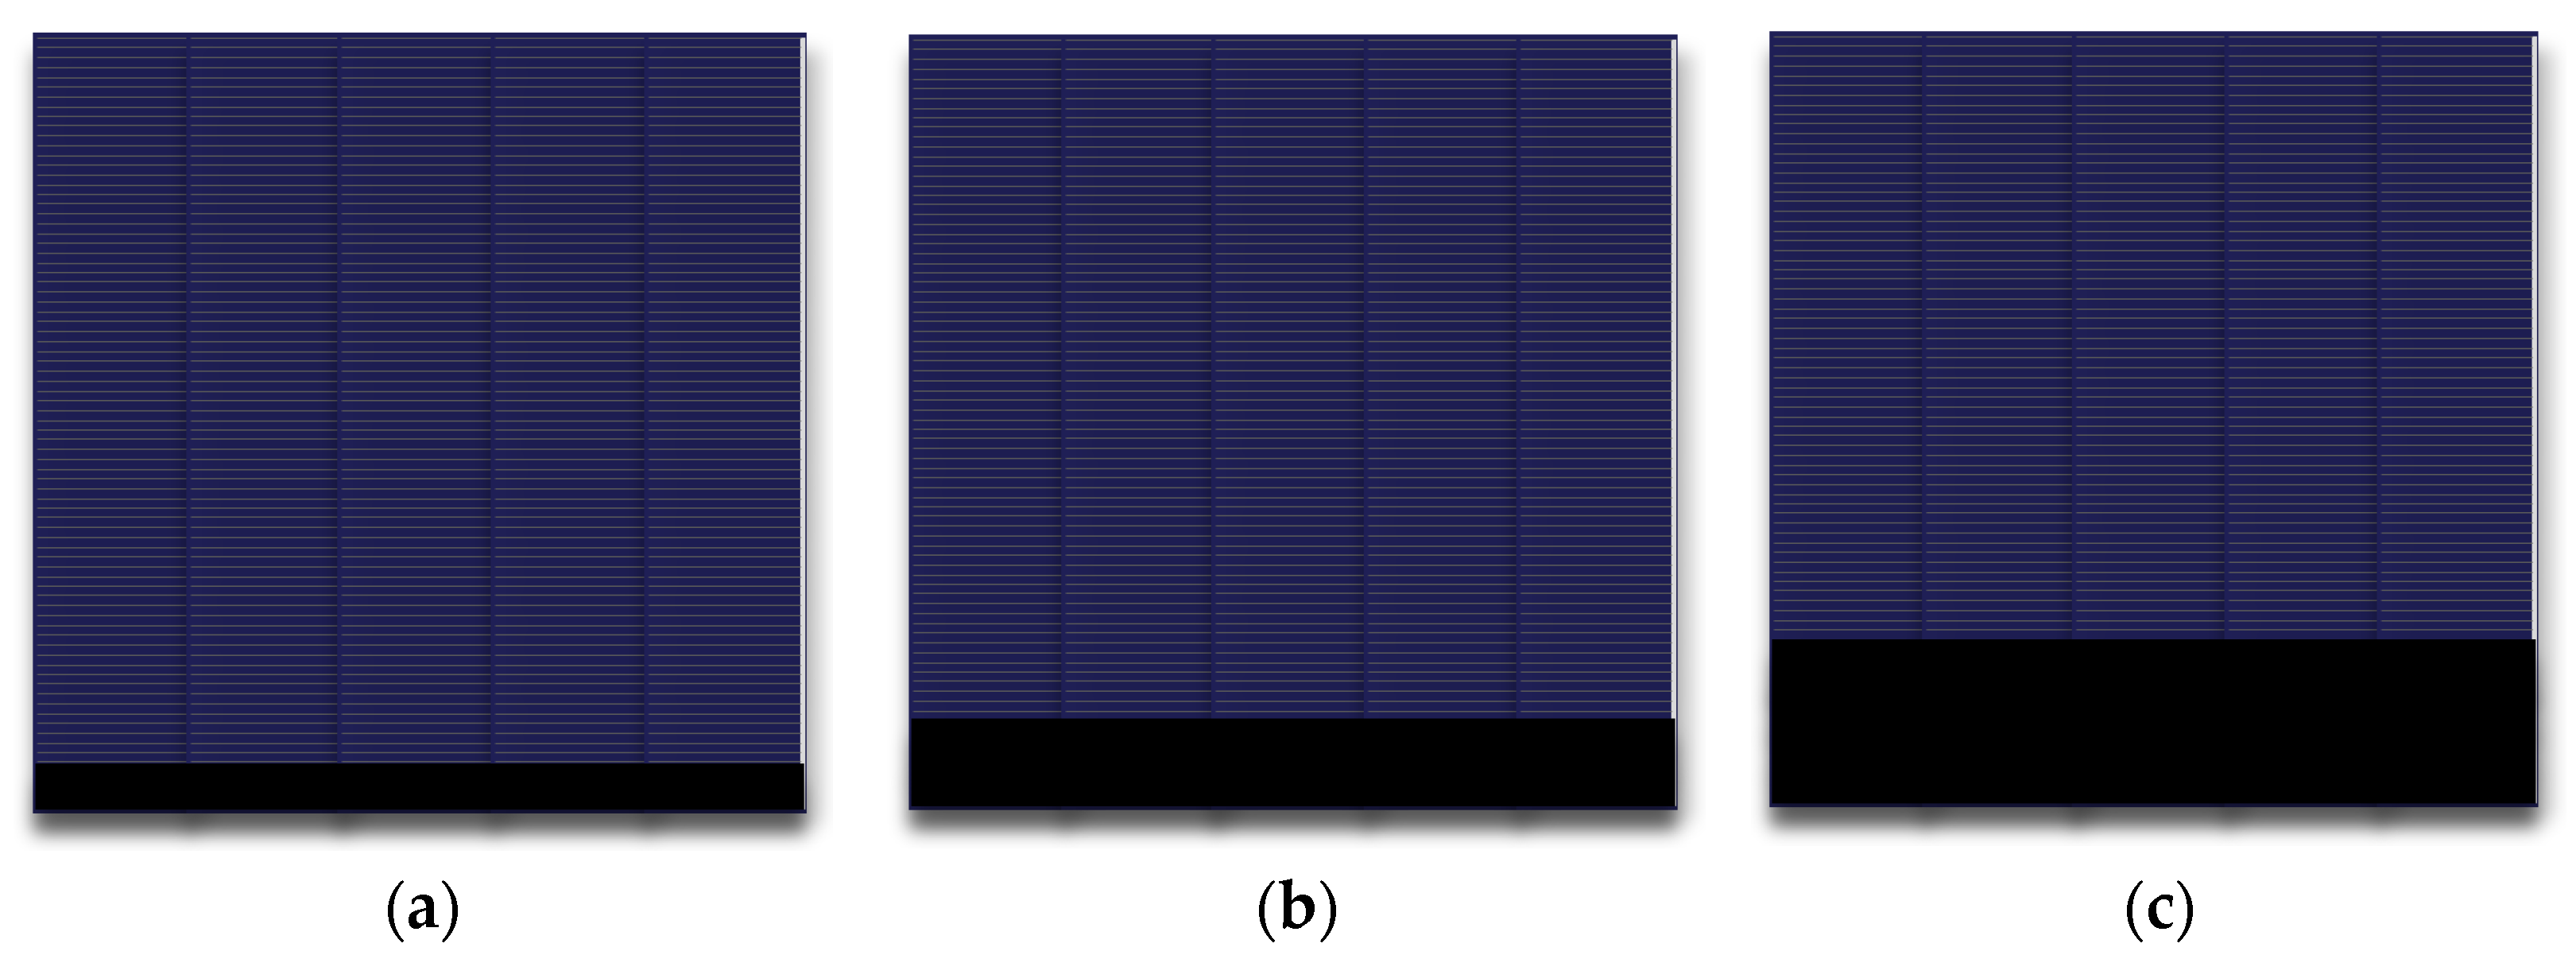
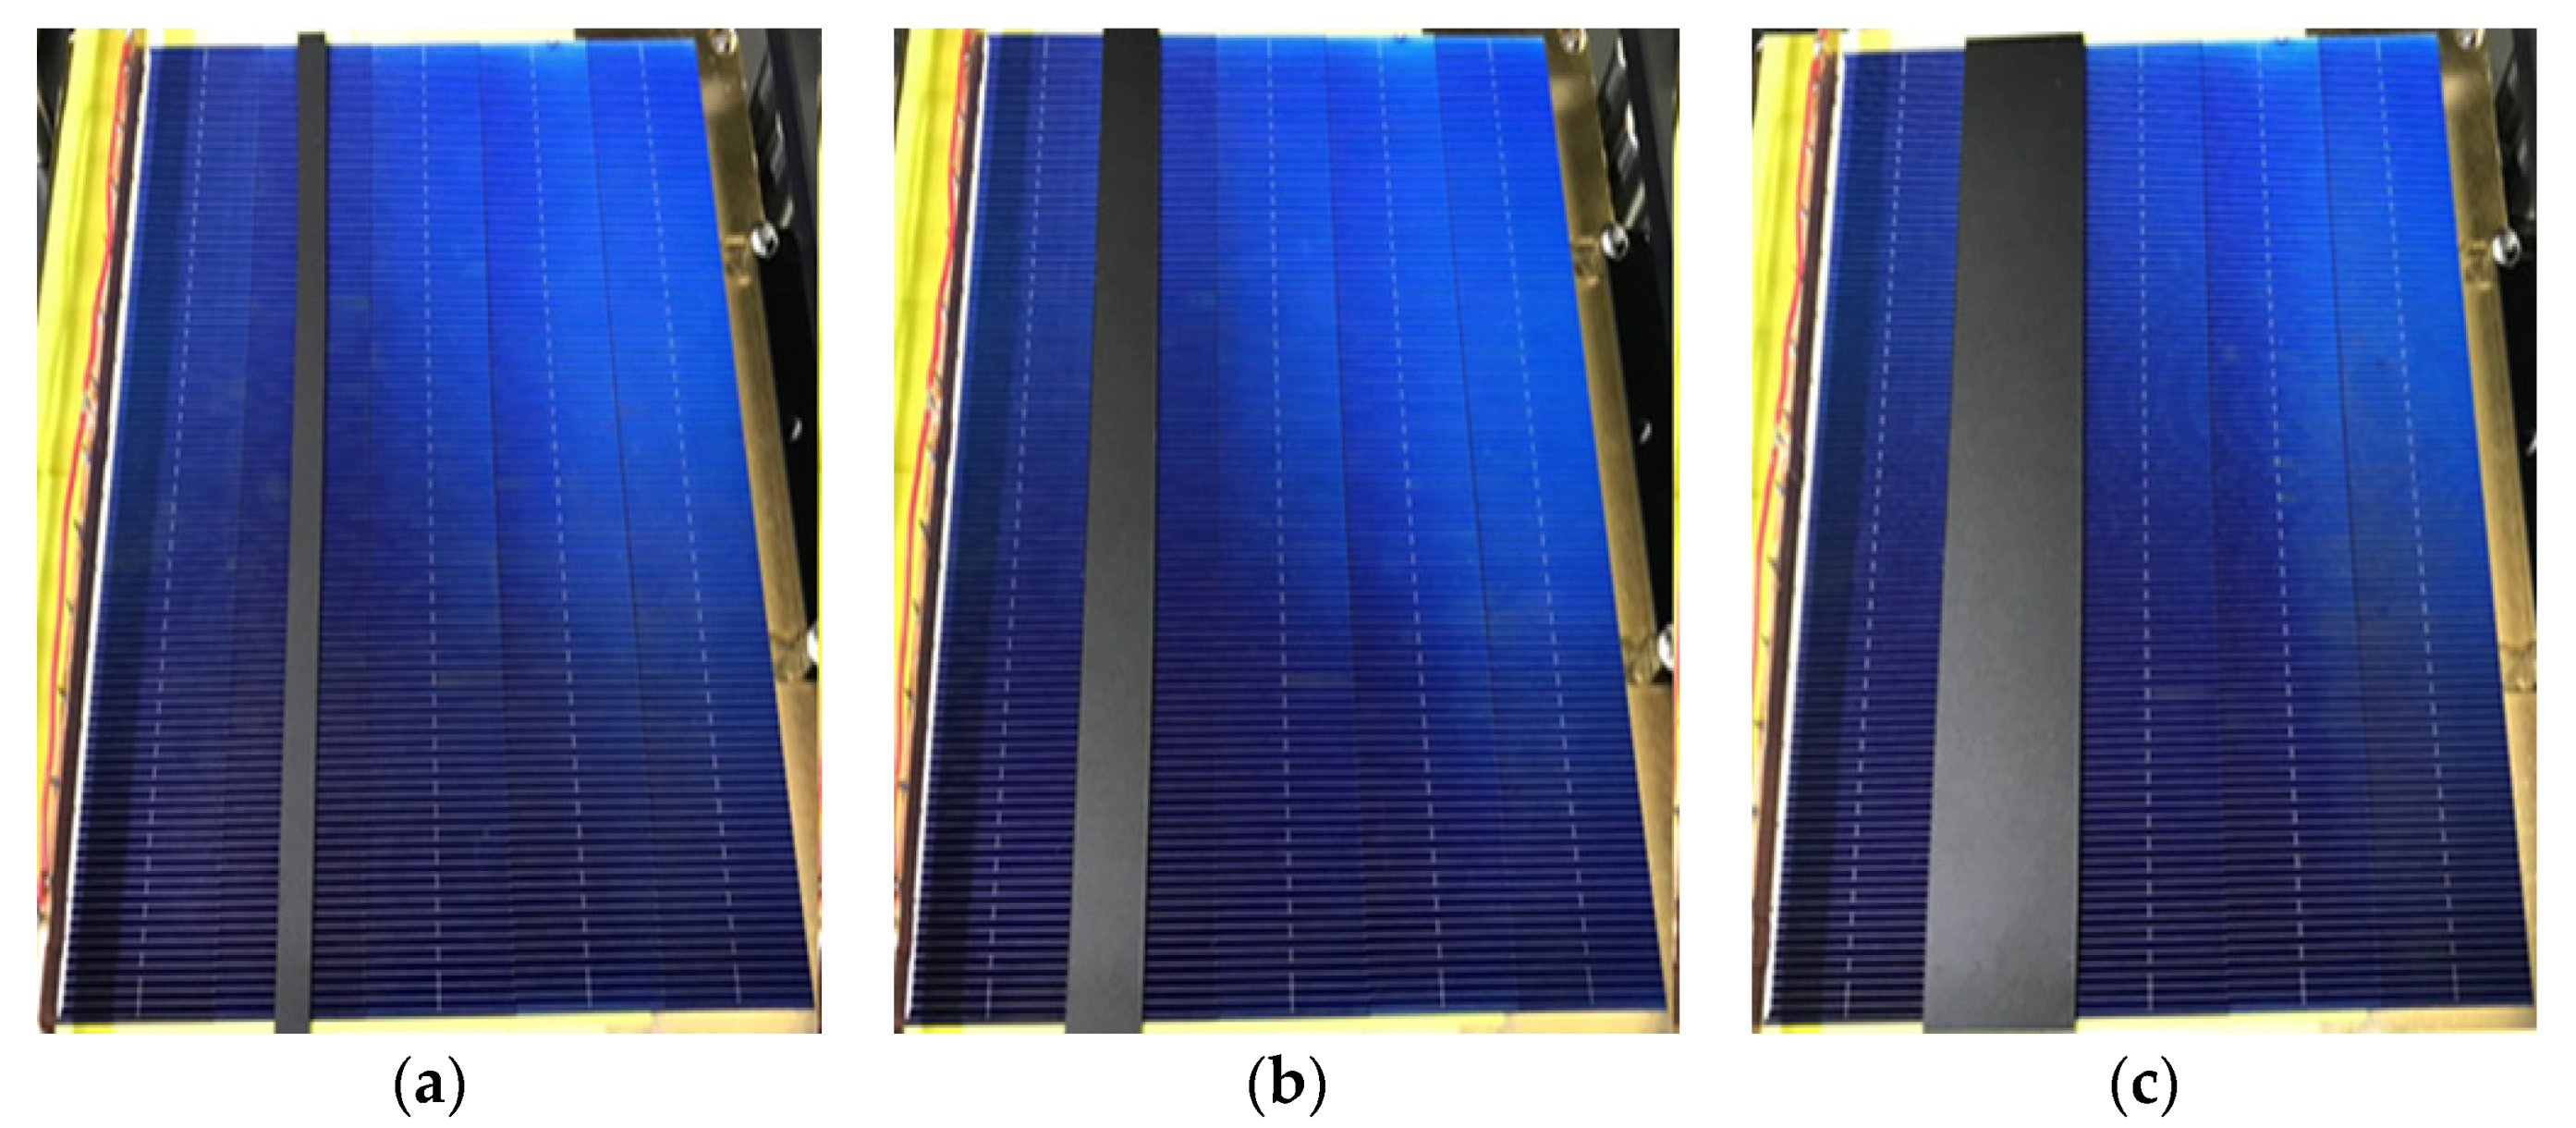
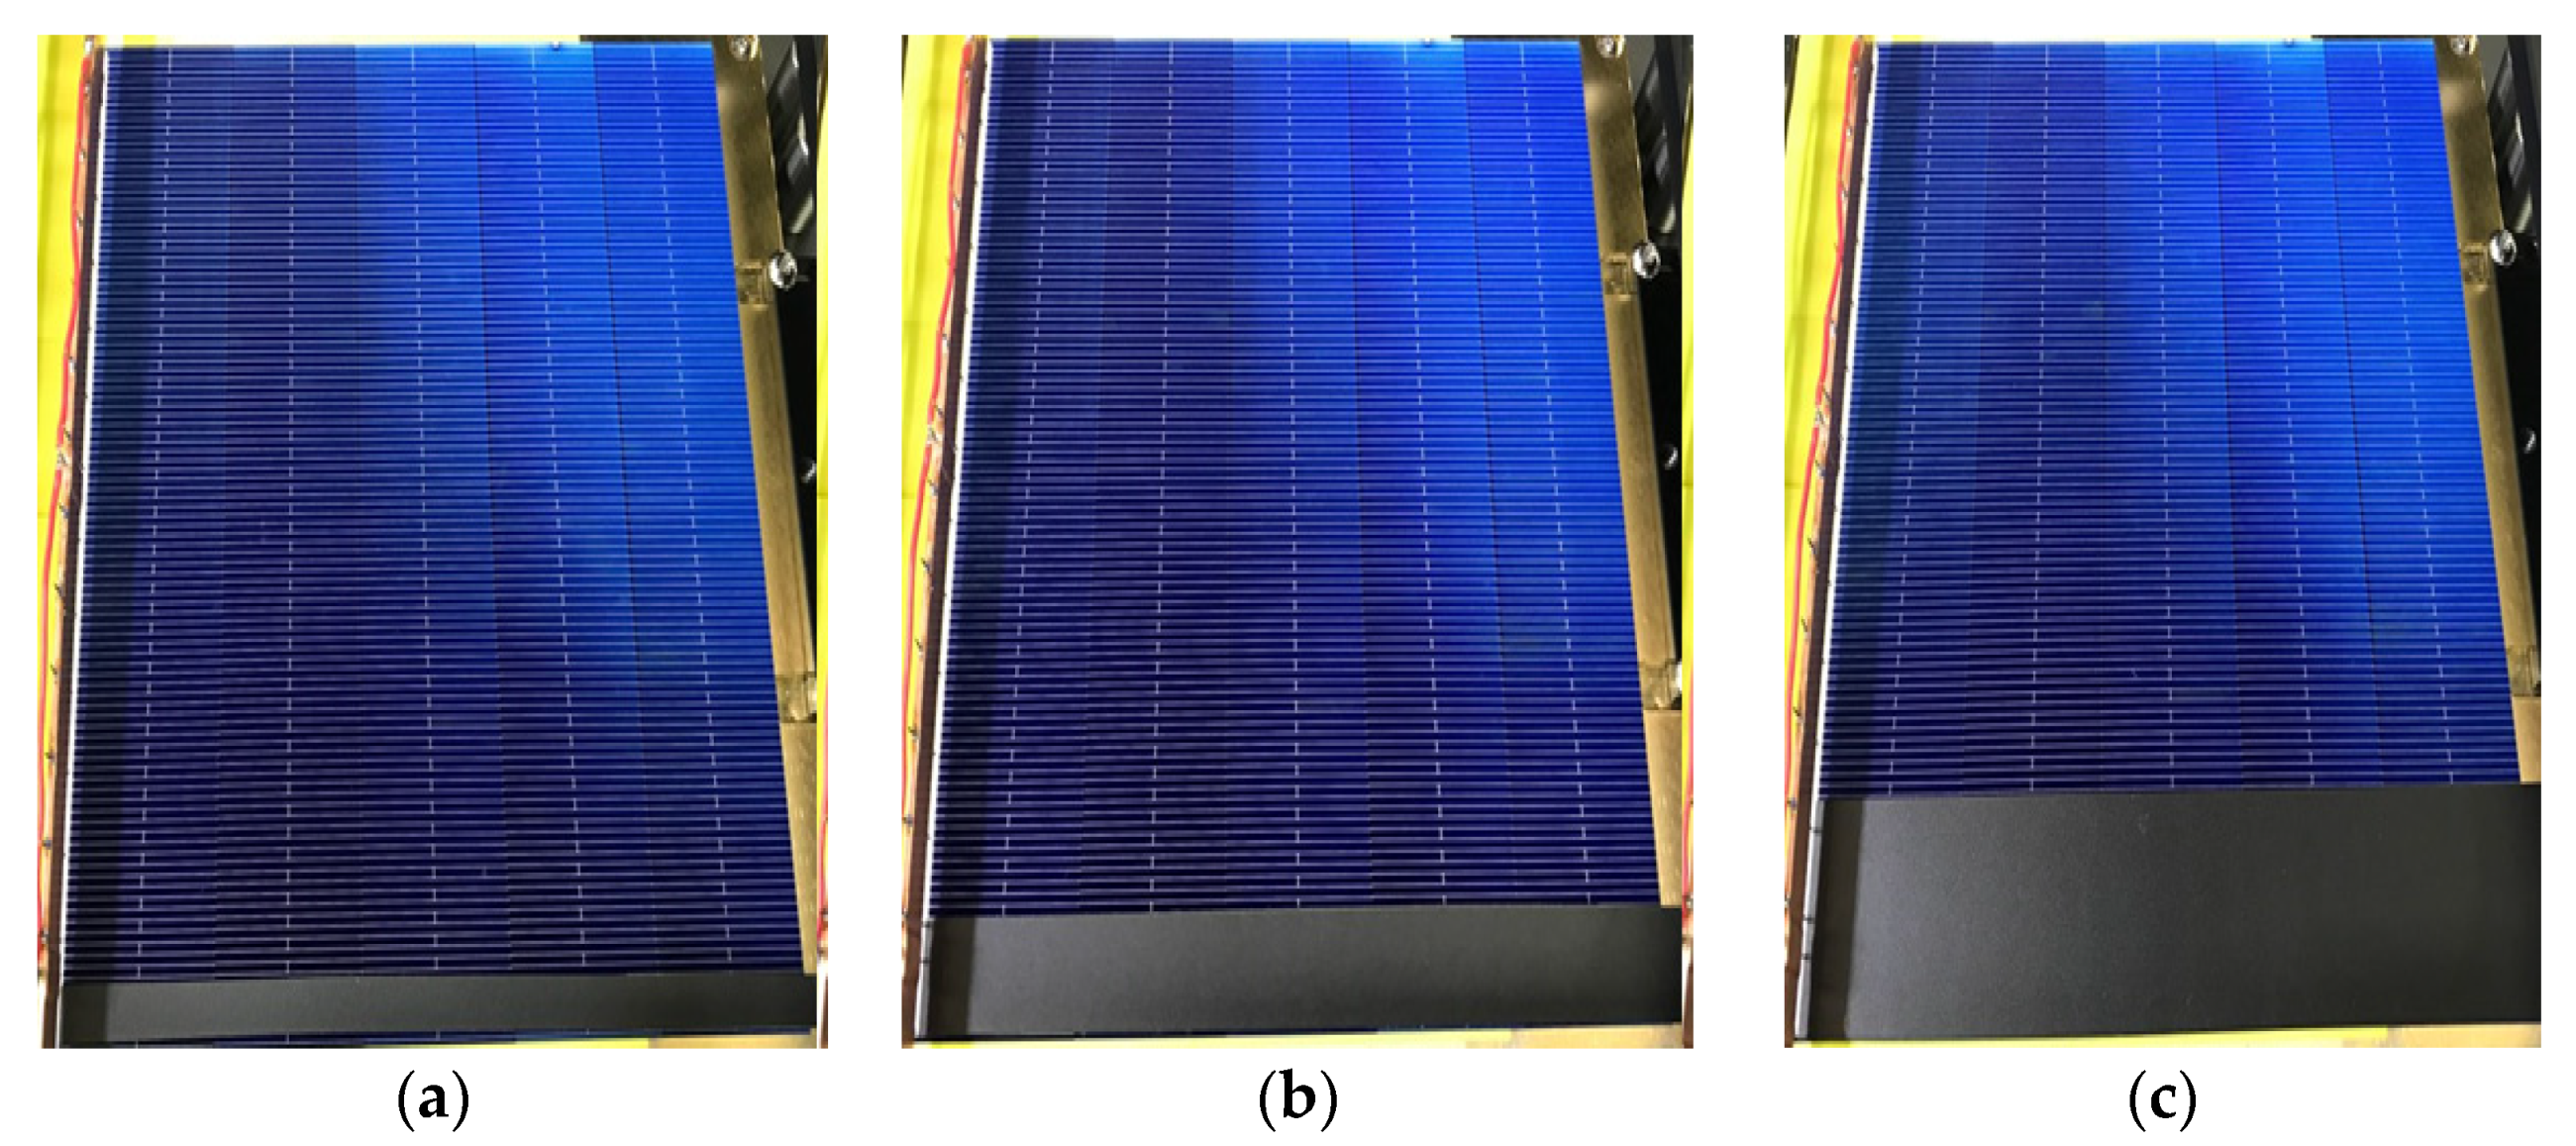
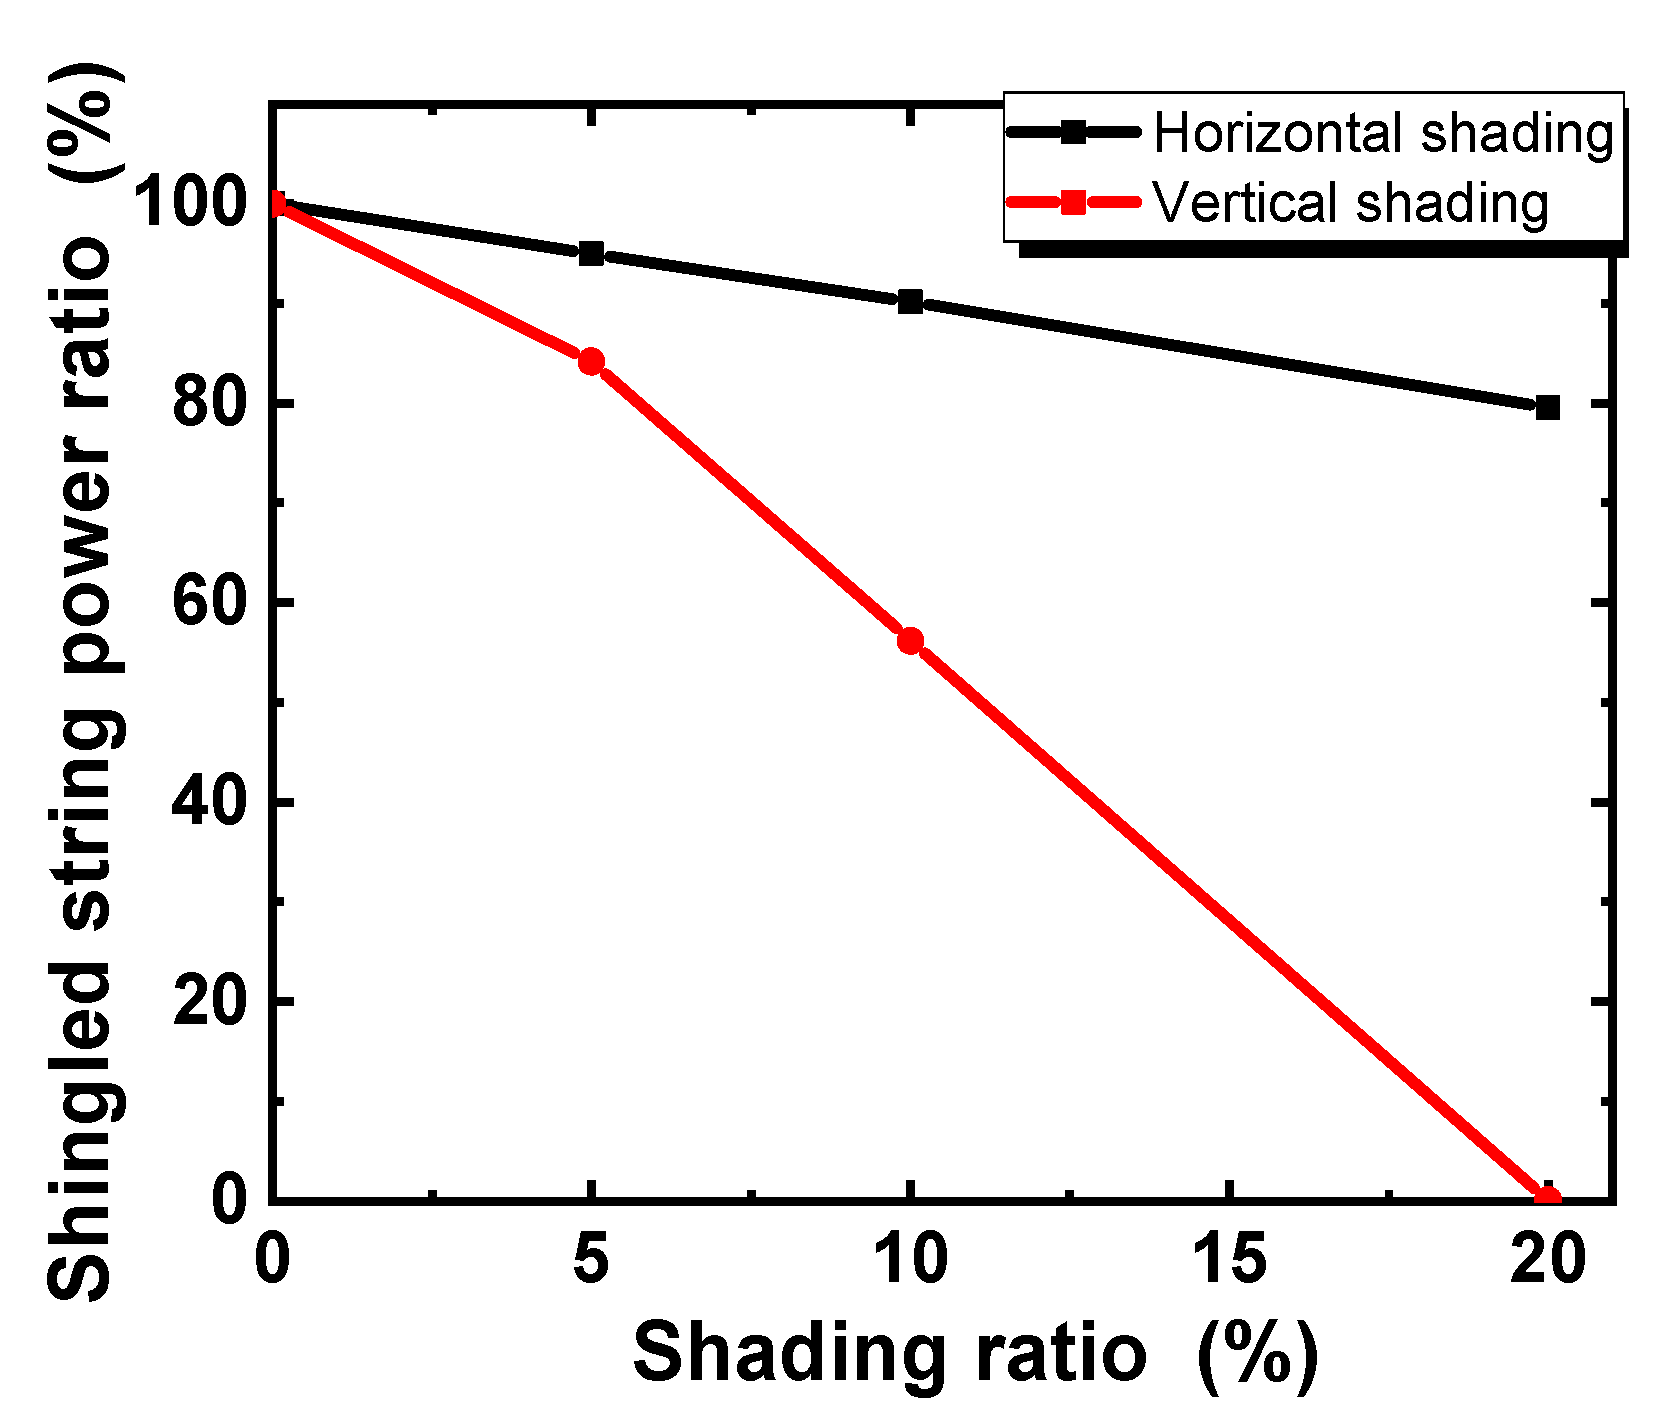
3.1. Shading Characteristics of Shingled Strings

The shingled string shown in Figure 11 consists of five divided solar cells. These five cells, which were used to create a shingled string, were shaded using shading ratios of 5%, 10%, and 20% in the vertical direction, as shown in the Figure 11. In this paper, we analyzed the power ratio before and after shading to determine the shading characteristics of shingled PV modules. Table 2 presents the simulation results based on the vertical shading ratio of the shingled string. As the shading ratio increased, the Isc value of the shingled string decreased. In particular, when the shading ratio was 20%, one divided cell was completely covered, resulting in an efficiency approaching 0%. Table 3 presents the values that were actually measured. The measured power ratio of the shingled string was 84.16%, and the simulation value was 84.17% for a shading ratio of 5%. When the shading ratio was raised to 10%, the measured and simulated power ratios were 55.71% and 56.18%, respectively. When the shading ratio was 20%, the measured and simulated values were both close to 0%. Thus, the simulation and measurement confirmed the accuracy of the model, which had an error rate of less than 1%.
Figure 12 shows images of shingled strings with shading ratios of 5%, 10%, and 20% in the horizontal direction of the shingled string. The simulated and measured values of the shading characteristics of the shingled string as a function of the horizontal shading ratio are presented in Table 4 and Table 5, respectively. In the case of horizontal shading, the Isc and efficiency decreased as the shading ratio increased, but the reduction in these values was less compared to the reductions observed for vertical shading. This is because, in the case of vertical shading, the shaded area of one divided cell is very large, the Isc of the divided cell is very low, and the current of the other divided cells also decreases owing to the current mismatch [19,20]. In contrast, in the case of horizontal shading, when viewed as a single divided cell, less shading occurred compared to that in the vertical direction, resulting in a smaller loss of output and Isc compared to the cell with vertical shading. A comparison of the simulated and measured results for horizontal shading indicates that the shading ratios of 5%, 10%, and 20% yield similar efficiencies and the decrease in Isc is much less compared to vertical shading. Thus, even with horizontal shading, the simulation and measurement confirmed the accuracy of the model, which had an error rate of less than 1%.
A graph of the power rate of a shingled string versus horizontal and vertical shading is shown in Figure 13. The efficiency of the shingled string decreased sharply with vertical shading compared with horizontal shading. This result shows that the shingled module is also more susceptible to shading in the vertical direction than in the horizontal direction. In addition, the results indicate that when developing a PV module in an installation area with a high frequency of vertical shading, the shading loss can be reduced by configuring strings of modules in parallel or by placing diodes.

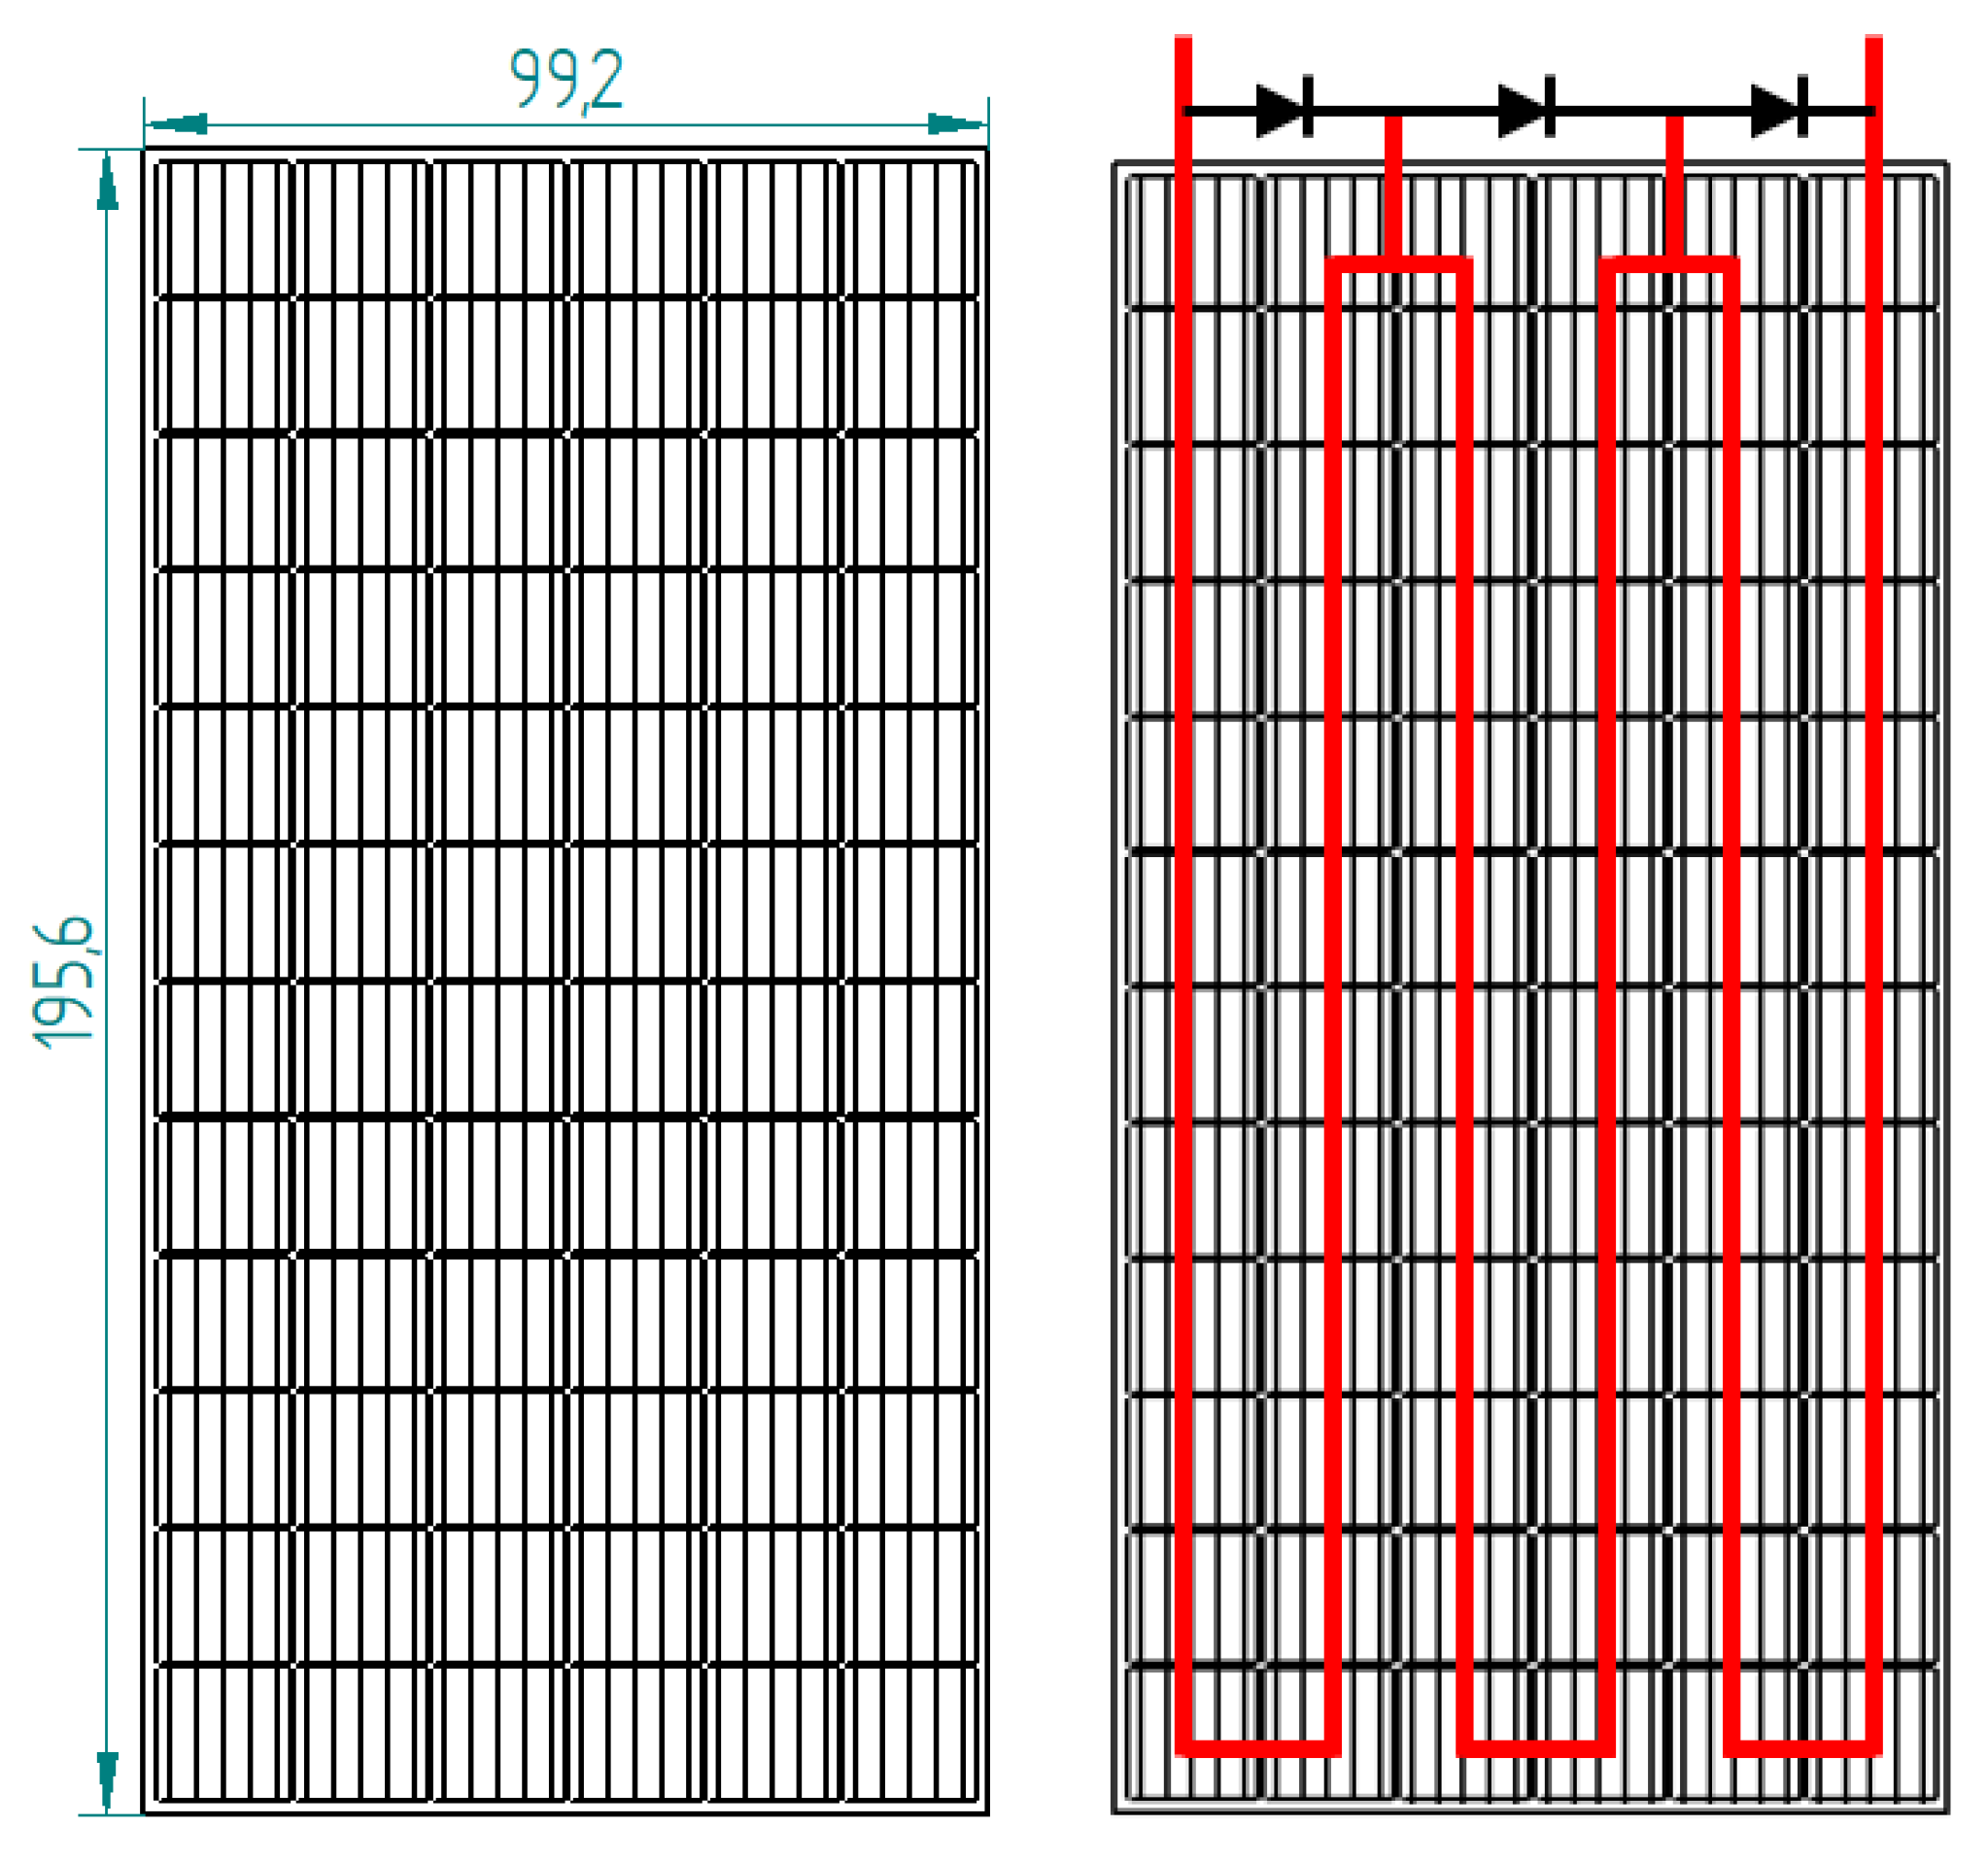
3.2. Shading Characteristics of Conventional Module

Figure 14 shows an image of the conventional PV module that was used for the measurement of the shading characteristics. In this case, the bottom shading was measured by generating artificial shading of 5 cm, 10 cm, and the size of one cell (156.75 mm).
Table 6 presents the measured shading characteristics of conventional PV modules. In the case of a conventional PV module, one solar cell of each string is located at the bottom. Therefore, when bottom shading occurs, bypassing is not performed and it can be seen that the overall output of the module is reduced. This clearly indicates that conventional PV modules are more vulnerable to bottom shading than shingled PV modules.

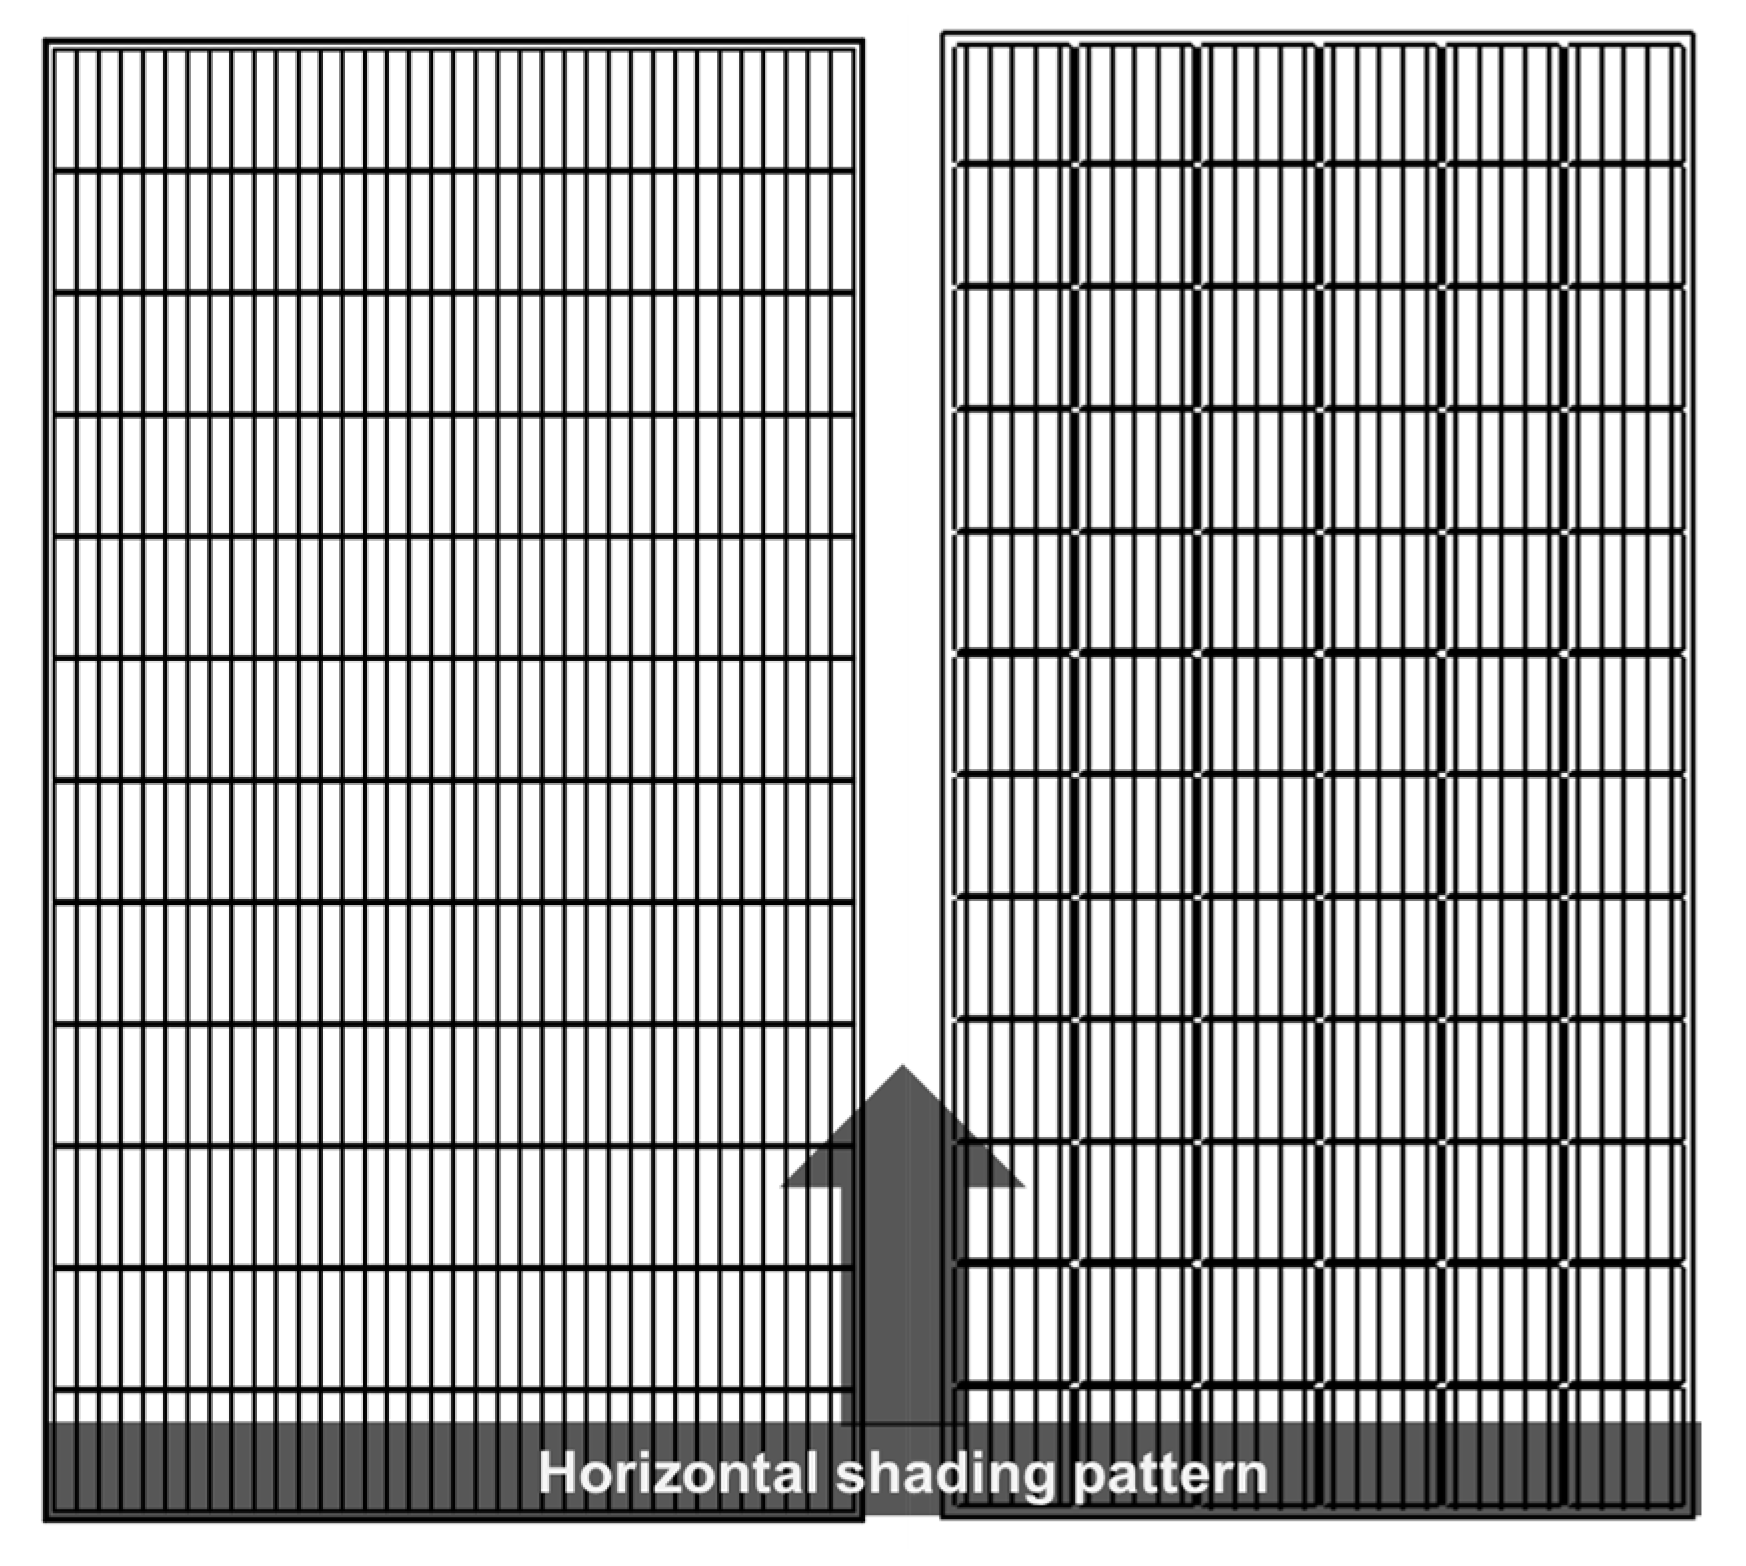
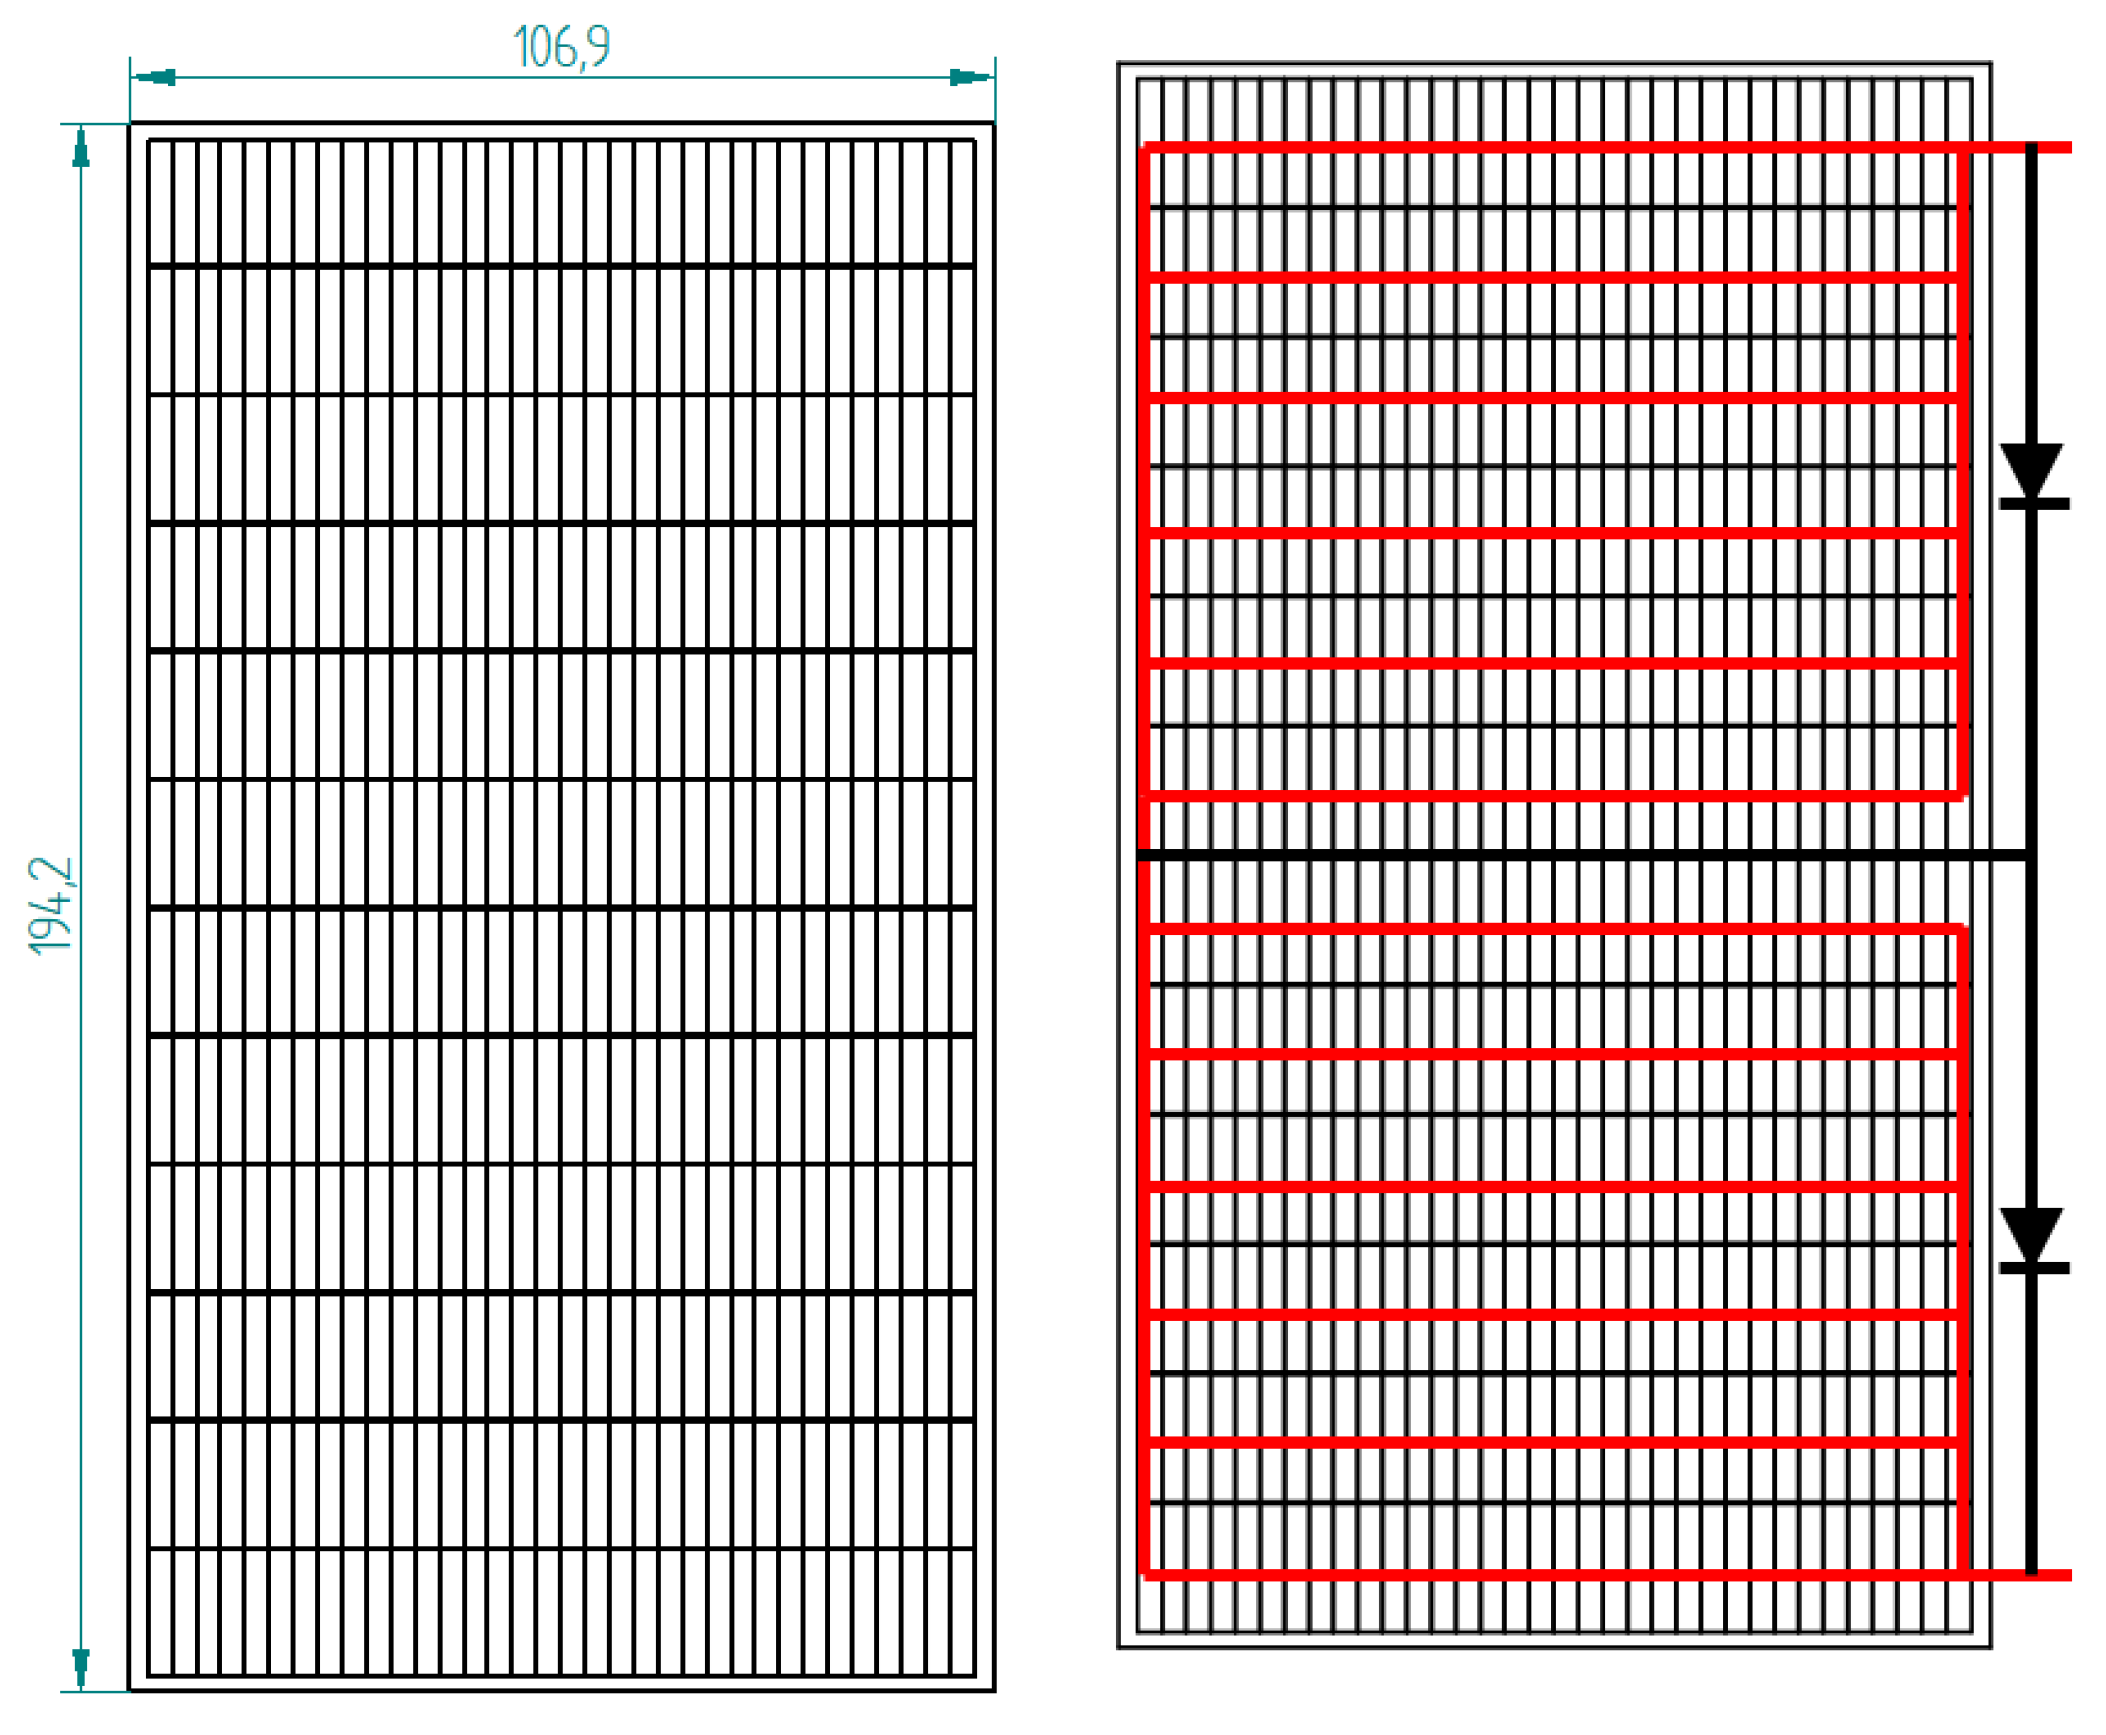
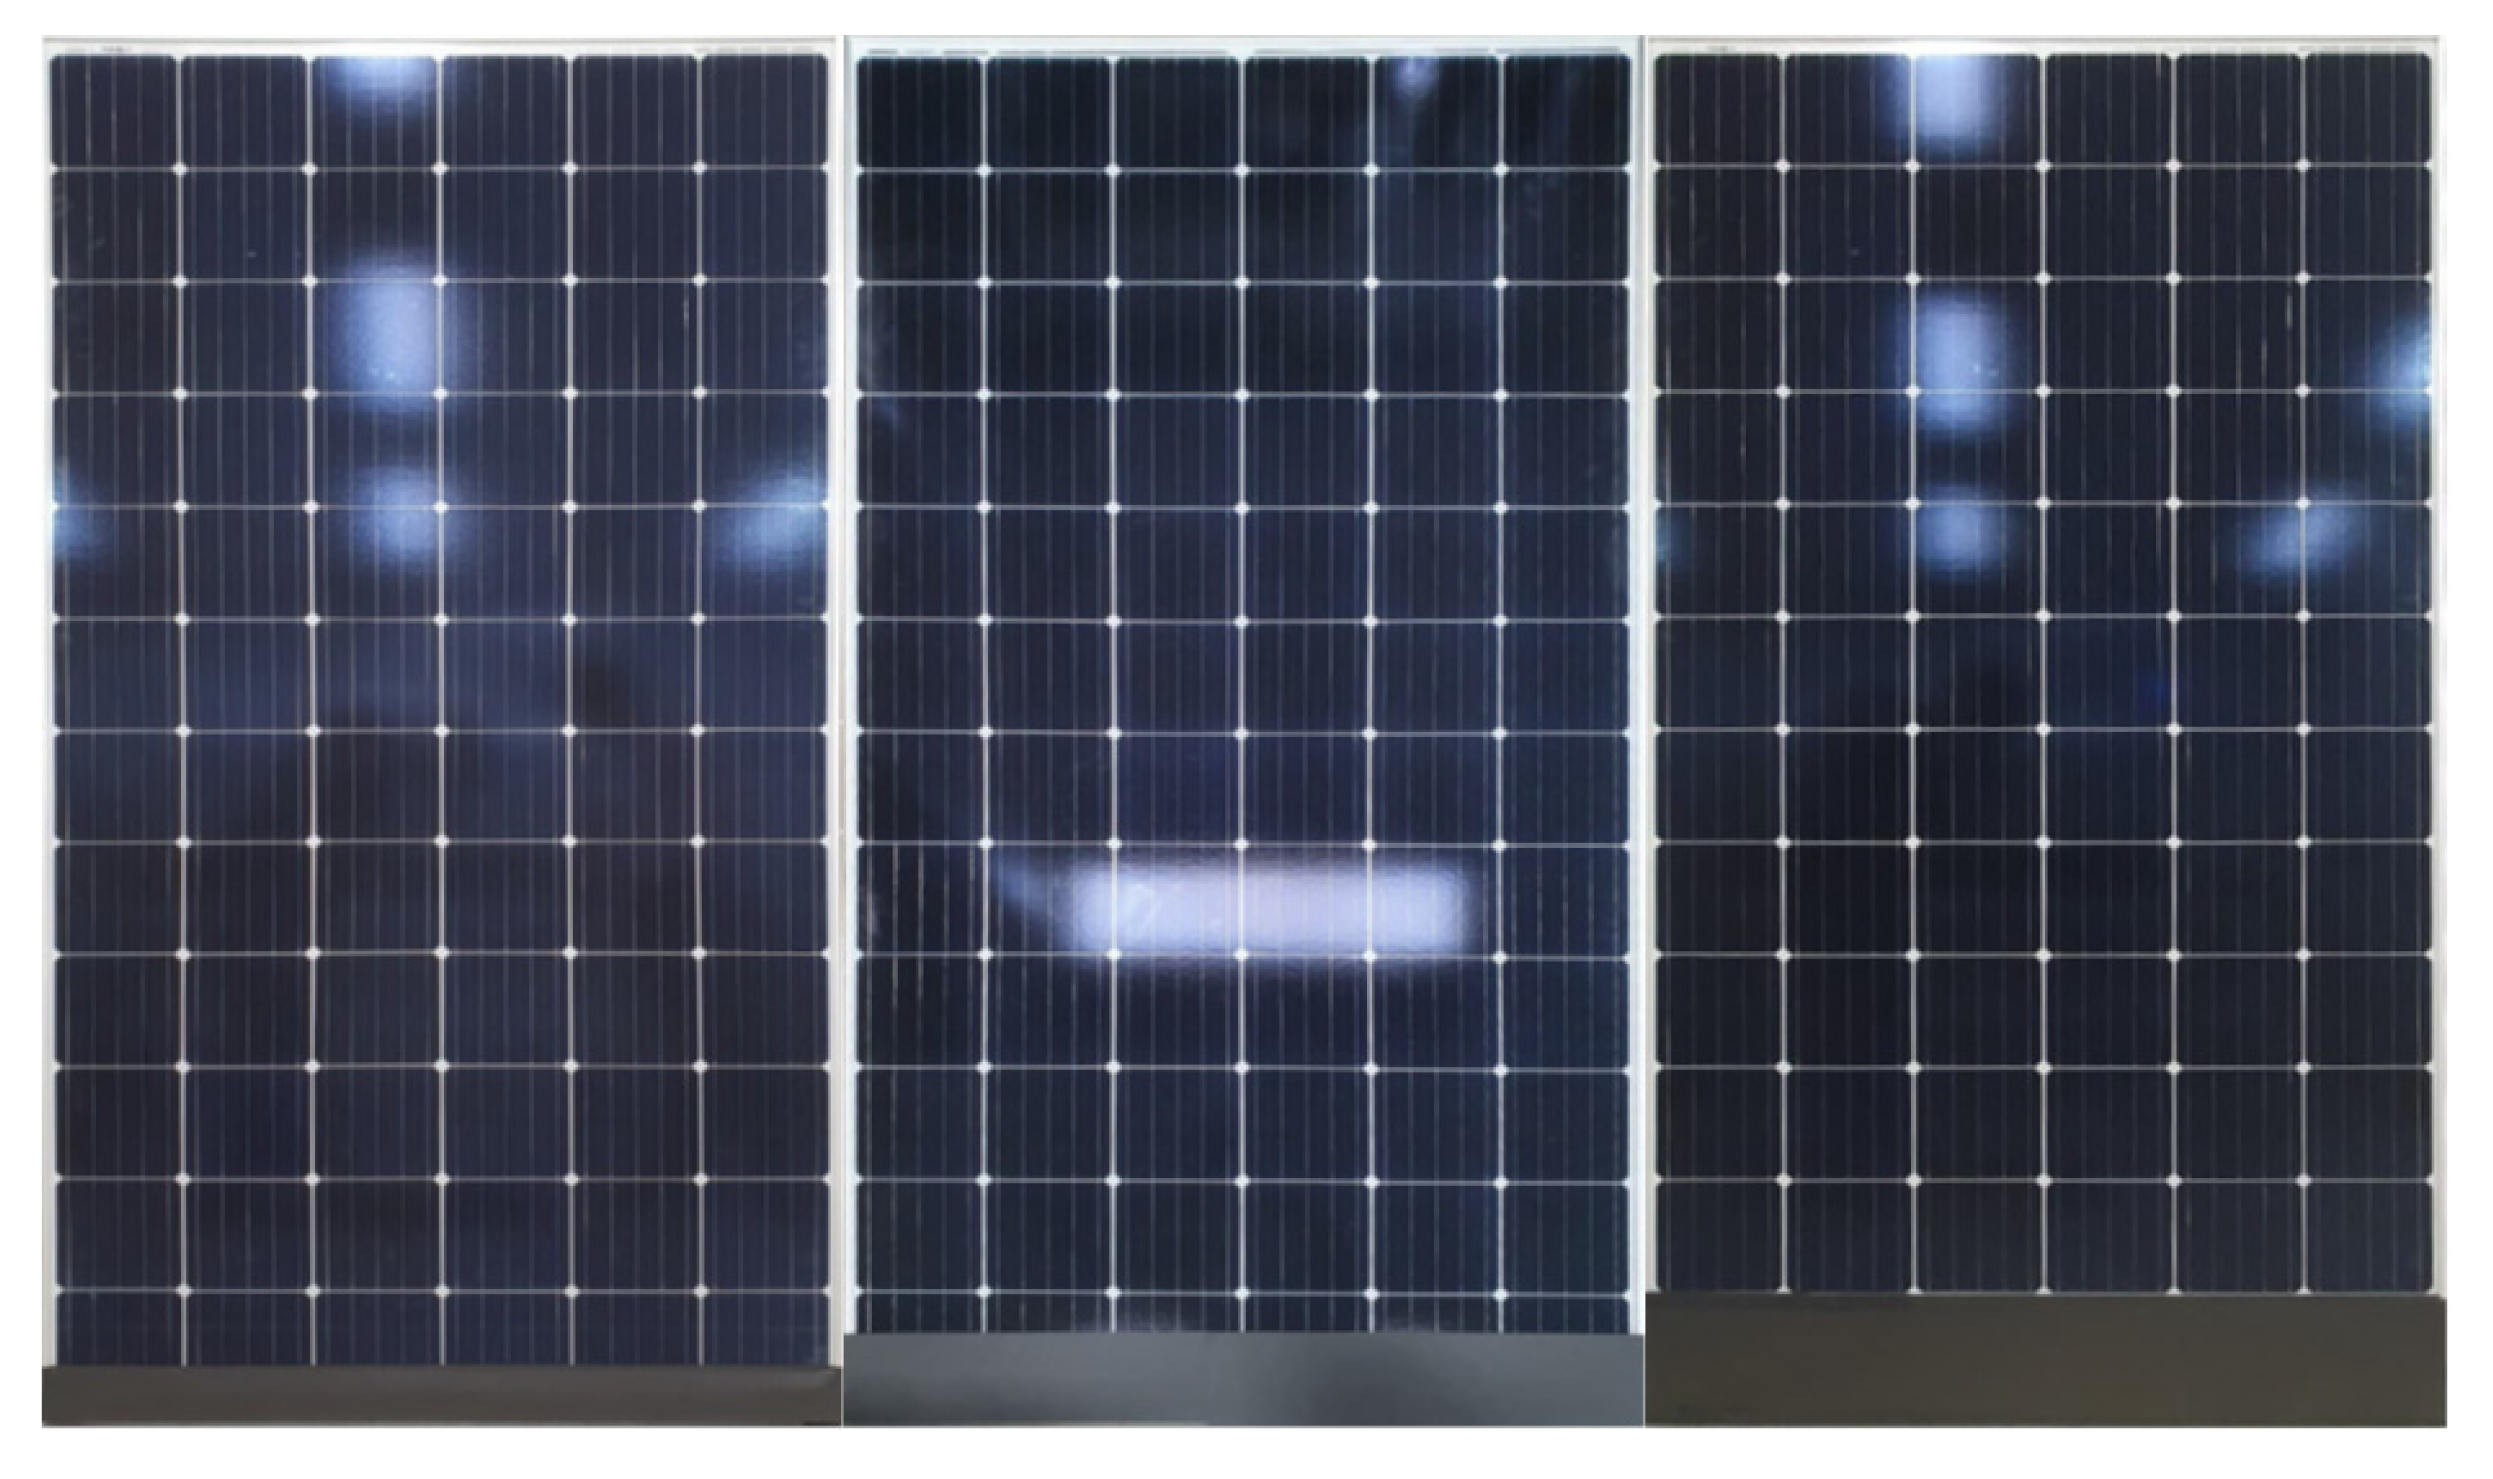
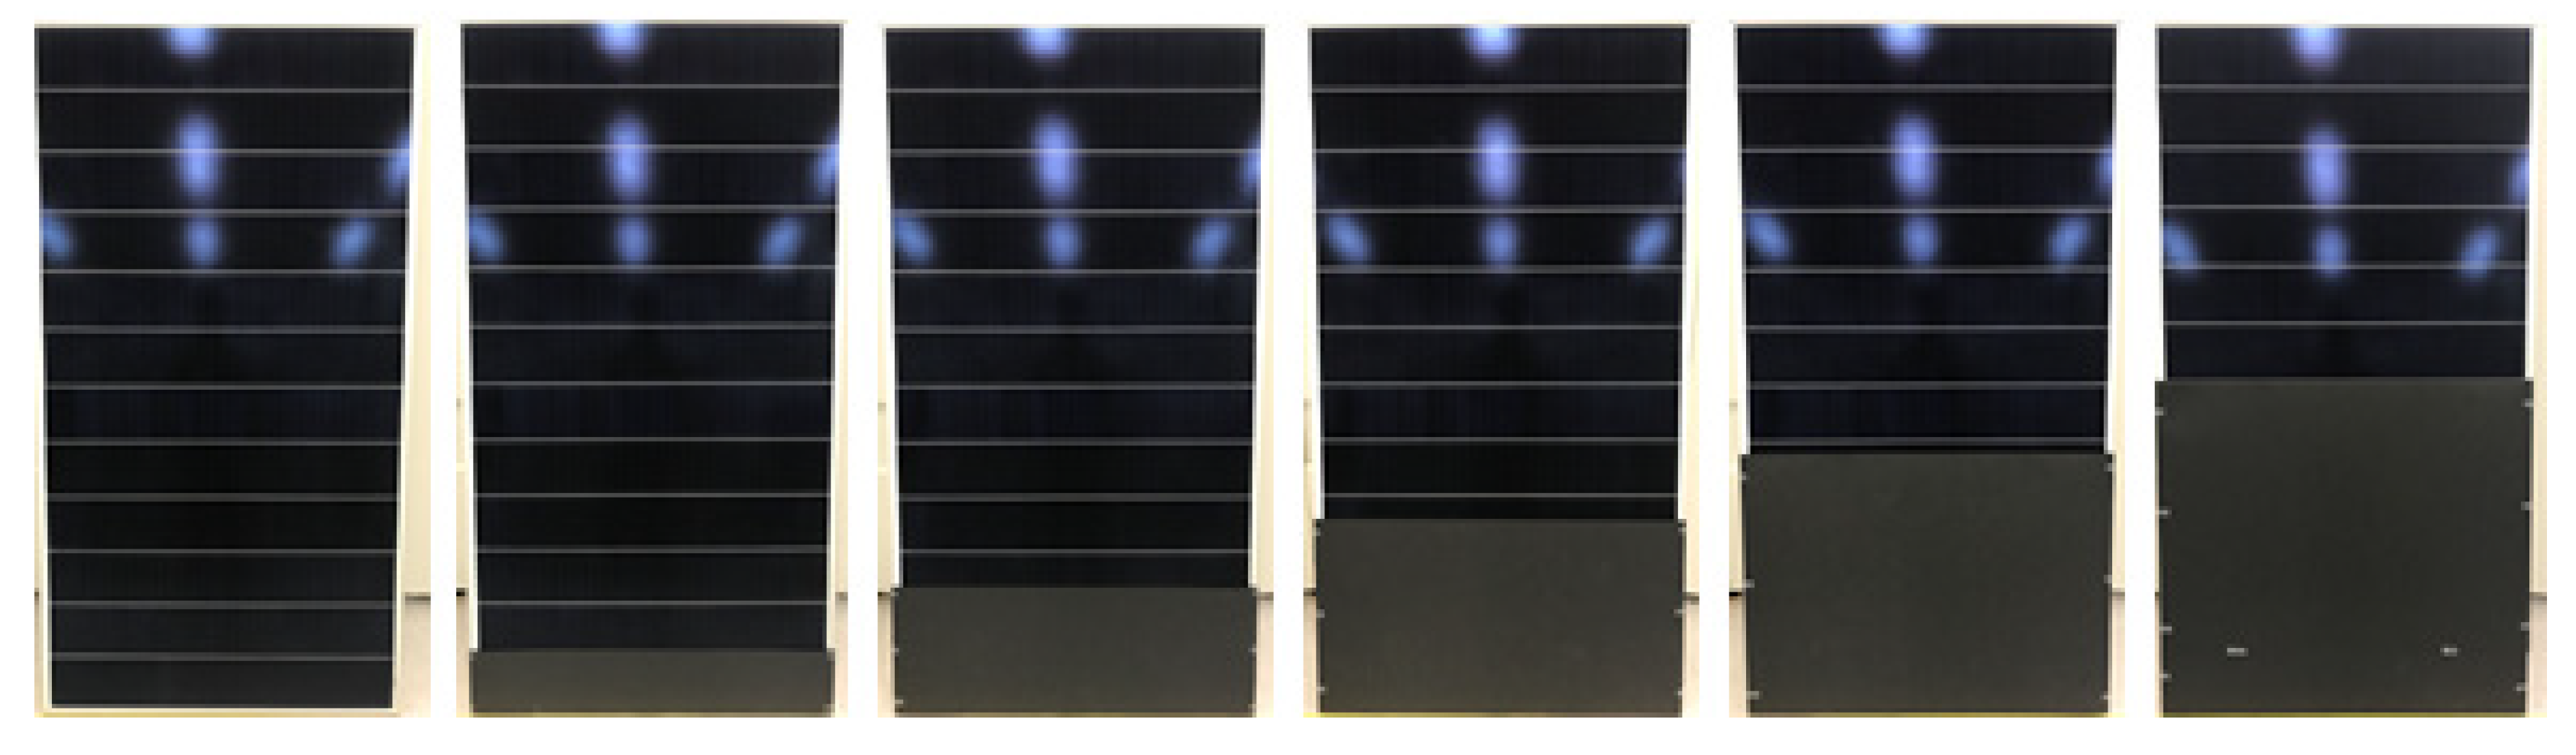
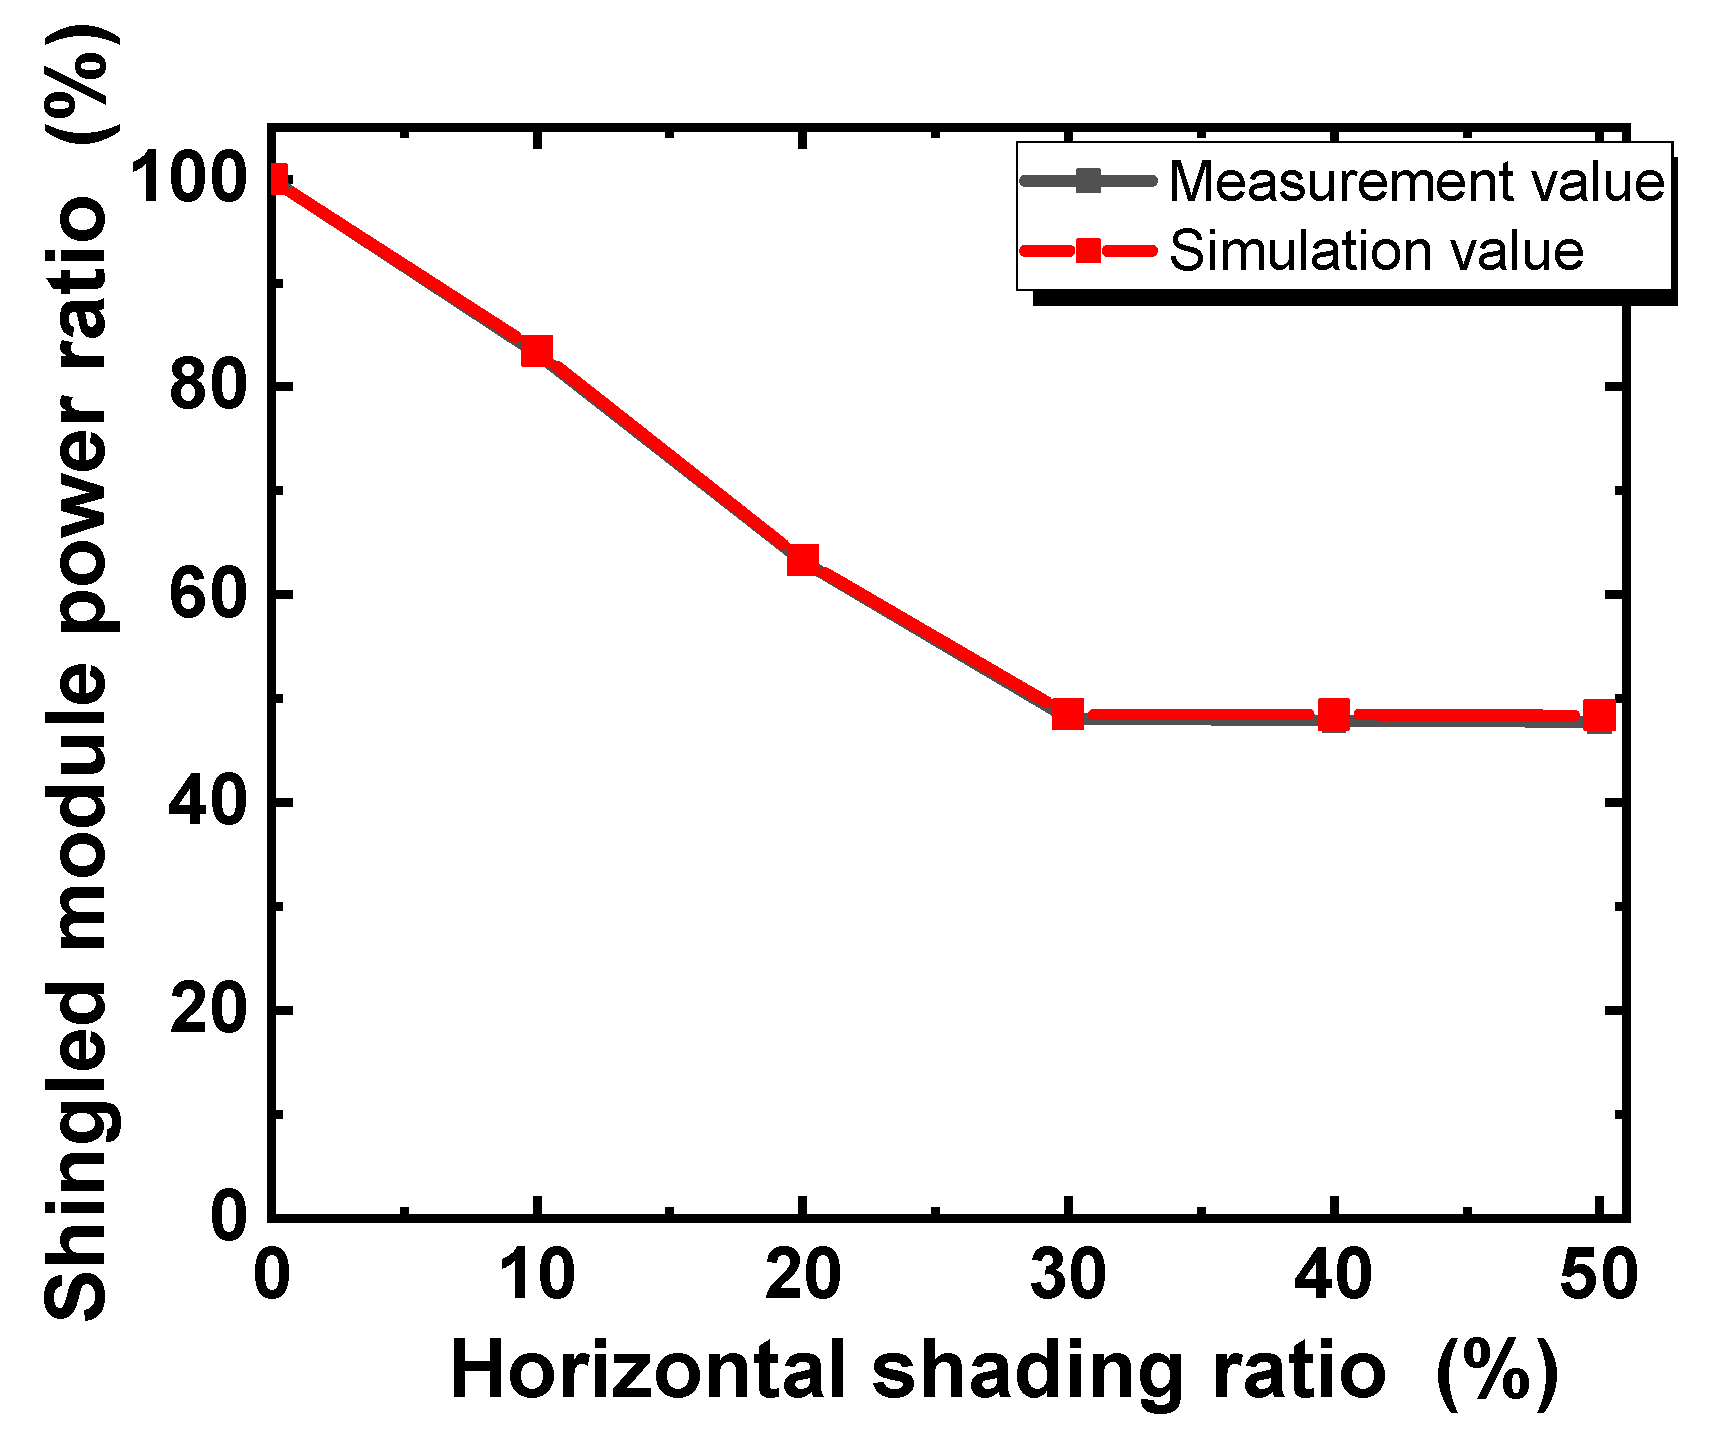
3.3. Shading Characteristics of Shingled PV Module

Figure 15 shows an image of the shading characteristics of the shingled PV module on which the measurements were carried out. The shading characteristics of the shingled PV module were measured by increasing the shading from 0% to 50% in increments of approximately 10%.
Table 7 lists the measured shading characteristics of the shingled PV modules. The measured results indicate that the output continuously decreased until 30% of the module was shaded, after which the output stabilized. The shading characteristics of the shingled PV module shaded at the bottom were more favorable than those of the conventional module. In the case of a shingled PV module, the shingled string itself has a higher voltage characteristic than a solar cell, so a shingled PV module can be manufactured by connecting each shingled string in parallel. As a result of this characteristic, the current mismatch is reduced even though the lower part is shaded, and thus the output loss is reduced. This can be analyzed through the fact that there is no change in the short-circuit current even though the shingled string occurs in the lower shadow. In comparison, since the shingled string is manufactured by connecting several divided cells in series cells, most of the shading loss in the shingled string appears as output loss due to current reduction or current mismatch.
As a result, when the shaded area covered 30% or more of the shingled PV modules, the output stabilized at approximately 47% and did not decrease any further. This is because the bypass diode installed in the shingled PV module operates and bypasses the bottom parallel structure.
The PSpice simulation of the shingled PV module was performed by changing the value of Vinput of the divided cell affected by shading. Table 8 presents the simulated results of the shading characteristics of the shingled PV module. These results show that the maximum error rate of the measured characteristics of the shingled PV module and the power ratio value was approximately 0.65, and the output decreased with a similar trend. Similarly, when the amount of shade covering the bottom of the module was 30% or higher, the bypass diode operated, resulting in a similar output with a power ratio of less than 1%.
As a result, in this study, the shading characteristics generated from shingled strings to shingled PV modules were analyzed and compared with those of conventional modules. In addition, PSpice modeling was performed to analyze the shading characteristics of the shingled PV module, and it was confirmed that the error in the power ratio remained within 1%. A graph comparing the power rate between the simulation and the measured value is shown in Figure 16. This makes it possible to predict the shadow loss of a shingled PV module by analyzing the size and shape of the shadow that occurs in a specific area in the future. In addition, simulation of the shading characteristics of the shingled PV module according to the design of the circuit and bypass diode is expected to verify the circuit design. This would enable an optimal shading loss reduction circuit to be constructed accordingly.

4. Conclusions

In this paper, the shading characteristics of shingled PV modules and the shading loss of conventional PV modules were compared and analyzed. As a result of the measurement, the shingled PV module showed better characteristics than the conventional PV module in the horizontal shading pattern. The reason for this is that the shingled string has a higher voltage characteristic than a typical solar cell, so it is possible to manufacture a PV module with a parallel connection. A shingled PV module fabricated in parallel is less affected by current mismatch due to horizontal shading compared to a conventional PV module. Additionally, simulation was conducted to predict the exact loss of output of a shingled solar PV module affected by shading and to design a diode circuit. The divided cell was modeled using a double diode model; a five-cell shingled string was produced to assess the accuracy of the simulation, and then artificial shading was generated, and the output was measured. The difference between the measured and simulated output values was within 1%. In addition, by generating horizontal and vertical shading patterns in the shingled string, it was possible to confirm the output loss of the shingled string according to the shading pattern. These shading patterns were expanded to analyze the shading characteristics of shingled PV modules and conventional PV modules, and the simulation result of the shingled PV module was also accurate in that it differed from the actual measured value by less than 1%. Based on this study, designing a circuit considering the shading loss of a shingled PV module can compensate for the disadvantages of the shingled PV module.

Author Contributions

Conceptualization, J.B., H.J. and Y.P.; methodology, J.B. and H.J.; investigation, J.B. and H.J.; data curation, J.B.; writing—original draft preparation, J.B.; writing—review and editing, J.B. and J.L.; supervision, J.L. All authors have read and agreed to the published version of the manuscript.

Funding

This research was supported by the Korea Electric Power Corporation (Grant number: R17XA05-1) and the Korean Institute of Energy Technology Evaluation and Planning (KETEP) by the Ministry of Trade, Industry, & Energy (MOTIE) of the Republic of Korea. (No. 20203030010200).

Data Availability Statement

The data that support the findings of this study are available from the corresponding author, J.L., upon reasonable request.

Conflicts of Interest

The authors declare no conflict of interest.

References

  1. Lee, J.S. An analysis for current status and legal issues of energy transition policy. Korea Environ. Law Assoc. 2020, 42, 85–128. [Google Scholar]
  2. Hang, H.; Mun, J.; Kim, J. Economic benefits of integration of supplementary biopower and energy storage systems in a solar-wind hybrid system. Korean Inst. Chem. Eng. 2020, 58, 381–389. [Google Scholar]
  3. David, F.; Robert, M. Q4 2019/Q1 2020 Solar Industry Update; National Renewable Energy Laboratory: Golden, CO, USA, 2020. [Google Scholar]
  4. Kuhn, T.E.; Erban, C.; Heinrich, M.; Eisenlohr, J.; Ensslen, F.; Neuhaus, D.H. Review of technological design options for building integrated photovoltaics (BIPV). Energy Build. 2021, 231, 110381. [Google Scholar] [CrossRef]
  5. Pelle, M.; Lucchi, E.; Maturi, L.; Astigarraga, A.; Causone, F. Coloured BIPV technologies: Methodological and experimental assessment for architecturally sensitive areas. Energies 2020, 13, 4506. [Google Scholar] [CrossRef]
  6. Mau, S.; Krametz, T.; Jahna, W.; Fechner, H. Quality testing for PV-modules according to standards and performance control for supporting manufacturing. In Proceedings of the 19th European Photovoltaic Solar Energy Conference, Paris, France, 7–11 June 2004; pp. 2626–2628. [Google Scholar]
  7. Rajput, A.S.; Rodriguez-Gallegos, C.D.; Ho, J.W.; Nalluri, S.; Aberle, A.G.; Singh, J.P. Fast extraction of front ribbon resistance of silicon photovoltaic modules using electroluminescence imaging. Sol. Energy 2019, 194, 688–695. [Google Scholar] [CrossRef]
  8. Jee, H.; Lee, S.; Jeong, C.; Lee, J. Electrically conductive adhesives and the shingled array cell for high density modules. J. Nanosci. Nanotechnol. 2019, 19, 1360–1363. [Google Scholar] [CrossRef] [PubMed]
  9. Lee, S.E.; Park, J.S.; Oh, W.J.; Lee, J.H. Effect of laser scribing in high efficiency crystal photovoltaic cells to produce shingled photovoltaic module. J. Korean Inst. Electr. Electron. Mater. Eng. 2020, 33, 291–296. [Google Scholar]
  10. Park, J.; Oh, W.; Joo, J.; Yi, J.; Hong, B.; Lee, J. Design of high-power and high-density photovoltaic modules based on a shingled cell string. J. Nanosci. Nanotechnol. 2020, 20, 6996–7001. [Google Scholar] [CrossRef] [PubMed]
  11. Kunz, O.; Evans, R.J.; Juhl, M.M.; Trupke, T. Understanding partial shading effects in shingled PV modules. Sol. Energy 2020, 202, 420–428. [Google Scholar] [CrossRef]
  12. Chan, D.S.H.; Phang, J.C.H. Analytical methods for the extraction of solar-cell single- and double-diode model parameters from I-V characteristics. IEEE Trans. Electron Devices 1987, 34, 286–293. [Google Scholar] [CrossRef]
  13. Masmoudi, F.; Salem, F.B.; Derbel, N. Single and double diode models for conventional mono-crystalline solar cell with extraction of internal parameters. In Proceedings of the 13th International Multi-Conference on Systems, Signals & Devices, Leipzig, Germany, 21–24 March 2016; pp. 720–728. [Google Scholar]
  14. Shannan, N.M.A.A.S.; Yahaya, N.Z.; Singh, B. Single-diode model and two-diode model of PV modules: A comparison. In Proceedings of the IEEE International Conference on Control System, Computing and Engineering, Penang, Malaysia, 29 November–1 December 2013; pp. 210–214. [Google Scholar]
  15. Cibira, G.; Koscova, M. Photovoltaic module parameters acquisition model. Appl. Surf. Sci. 2014, 312, 74–80. [Google Scholar] [CrossRef]
  16. Park, M.; Song, J.; Moon, D.; Jeong, C.; Jee, H. Improvement in the Power of Shingled-Type Photovoltaic Module by Control of the Overlapped Width. J. Korean Phys. Soc. 2020, 77, 1040–1045. [Google Scholar] [CrossRef]
  17. Mittag, M.; Zech, T.; Wiese, M.; Blasi, D.; Ebert, M.; Wirth, H. Cell-to-Module (CTM) Analysis for Photovoltaic Modules with Shingled Solar Cells. In Proceedings of the IEEE 44th Photovoltaic Specialist Conference, Washington, DC, USA, 25–30 June 2018; pp. 1531–1536. [Google Scholar]
  18. Park, J.; Oh, W.; Park, H.; Jeong, C.; Choi, B.; Lee, J. Analysis of solar cells interconnected by electrically conductive adhesives for high-density photovoltaic modules. Appl. Surf. Sci. 2019, 484, 732–739. [Google Scholar] [CrossRef]
  19. Wilson, K.; Ceuster, D.D.; Sinton, R.A. Measuring the effect of cell mismatch on module output. In Proceedings of the 4th World Conference on Photovoltaic Energy Conference, Waikoloa, HI, USA, 7–12 May 2006; pp. 916–919. [Google Scholar]
  20. Maki, A.; Valkealahti, S.; Leppaaho, J. Operation of series—Connected silicon—Based photovoltaic modules under partial shading conditions. Prog. Photovolt. Res. Appl. 2011, 20, 298–309. [Google Scholar] [CrossRef]
Figure 1. Double diode model and divided cell circuit diagram.
Applsci 11 11257 g001
Figure 2. Simulated and measured I–V curve of a divided solar cell.
Applsci 11 11257 g002
Figure 3. Schematic illustration of shingled string modeling.
Applsci 11 11257 g003
Figure 4. Model for the simulation of the shingled PV module.
Applsci 11 11257 g004
Figure 5. Vertical shading pattern applied to shingled string. The width of the shading pattern was varied as follows: (a) 0.7 cm, (b) 1.5 cm, (c) 3.135 cm.
Applsci 11 11257 g005
Figure 6. Horizontal shading pattern applied to shingled string. The height of the shading pattern was varied as follows: (a) 0.7 cm, (b) 1.5 cm, (c) 3.135 cm.
Applsci 11 11257 g006
Figure 7. Schematic explanation of each shading parameter and a schematic drawing of the PSpice circuit.
Applsci 11 11257 g007
Figure 8. Shading pattern applied to shingled and conventional PV module.
Applsci 11 11257 g008
Figure 9. Circuit diagram and structure diagram of shingled PV module.
Applsci 11 11257 g009
Figure 10. Circuit diagram and structure diagram of conventional PV module.
Applsci 11 11257 g010
Figure 11. Vertical shading patterns of a shingled string with a shading ratio of (a) 5%, (b) 10%, and (c) 20%.
Applsci 11 11257 g011
Figure 12. Horizontal shading pattern of a shingled string with a shading ratio of (a) 5%, (b) 10%, and (c) 20%.
Applsci 11 11257 g012
Figure 13. Power rate of shingled string according to horizontal and vertical shading.
Applsci 11 11257 g013
Figure 14. Image of the conventional PV module used for measuring the shading characteristics for various amounts of shading at the bottom.
Applsci 11 11257 g014
Figure 15. Image of the shingled PV module that was used for measuring the shading characteristics by varying the amount of bottom shading.
Applsci 11 11257 g015
Figure 16. Shading characteristic graph of shingled PV module (measurement and simulation value).
Applsci 11 11257 g016
Table 1. Simulated and measured values of a solar cell divided into five.
ParameterMeasurement ValueSimulation Value
Size (cm2)49.1449.14
Isc (A)1.9371.937
Voc (V)0.6690.670
FF (%)78.4478.40
Eff (%)20.7220.72
Pm (W)1.0181.018
Table 2. Dependence of the simulated shading characteristics on the vertical shading ratio of a 5-cell shingled string.
ParameterNo Shading5% Shading10% Shading20% Shading
Size (cm2)235.05235.05235.05235.05
Isc (A)1.881.440.9330.0042
Voc (V)3.343.34043.323.06
FF (%)78.3586.2689.4840.08
Eff (%)21.0017.6611.820.02
Pm (W)4.934.152.770.005
Power ratio (%)10084.1756.180.104
Table 3. Dependence of the measured shading characteristics on the vertical shading ratio of a 5-cell shingled string.
ParameterNo Shading5% Shading10% Shading20% Shading
Size (cm2)235.05235.05235.05235.05
Isc (A)1.901.470.9430.0099
Voc (V)3.333.323.302.98
FF (%)78.4585.8189.3861.14
Eff (%)21.2517.8811.850.07
Pm (W)4.994.202.780.018
Power ratio (%)10084.1655.710.36
Table 4. Dependence of the simulated shading characteristics on the horizontal shading ratio of a 5-cell shingled string.
ParameterNo Shading5% Shading10% Shading20% Shading
Size (cm2)235.05235.05235.05235.05
Isc (A)1.881.791.701.50
Voc (V)3.343.343.333.31
FF (%)78.3578.4478.5178.60
Eff (%)21.0020.0418.9416.69
Pm (W)4.934.714.453.92
Power ratio (%)10095.5390.2679.51
Table 5. Dependence of the measured shading characteristics on the horizontal shading ratio of a 5-cell shingled string.
ParameterNo Shading5% Shading10% Shading20% Shading
Size (cm2)235.05235.05235.05235.05
Isc (A)1.901.821.731.53
Voc (V)3.333.323.323.30
FF (%)78.4578.0478.2278.38
Eff (%)21.2520.2019.1716.93
Pm (W)4.994.744.503.97
Power ratio (%)10094.9890.1879.55
Table 6. Dependence of the measured shading characteristics of conventional PV modules on the amount of shading.
ParameterNo ShadingBottom 5 cm ShadingBottom 10 cm ShadingBottom 1 Cell Size Shading
Size (cm2)19,403.5219,403.5219,403.5219,403.52
Isc (A)9.797.083.260.08
Voc (V)48.7048.4548.3847.66
FF (%)77.1482.5686.5544.78
Eff (%)18.9614.617.050.09
Pm (W)367.97283.50136.881.777
Power ratio (%)10077.0437.190.48
Table 7. Dependence of the measured shading characteristics on the amount of shading of shingled PV modules.
ParameterNo Shading10% Shading20% Shading30% Shading40% Shading50% Shading
Size (cm2)20,763.620,763.620,763.620,763.620,763.620,763.6
Isc (A)10.7310.6610.6510.710.710.66
Voc (V)44.8544.6144.343.943.1722.65
FF (%)80.0767.4451.639.4439.9676.2
Eff (%)18.5715.4511.738.938.898.87
Pm (W)385.58320.8243.67185.44184.7184.18
Power ratio (%)10083.1963.1948.0947.947.76
Table 8. Dependence of the simulated shading characteristics of a shingled PV module on the amount of shading.
ParameterNo Shading10% Shading20% Shading30% Shading40% Shading50% Shading
Size (cm2)20,763.620,763.620,763.620,763.620,763.620,763.6
Isc (A)11.0311.0211.0211.0211.0211.02
Voc (V)45.4445.2044.8944.4343.5922.39
FF (%)77.7565.3249.3338.6439.2976.37
Eff (%)18.7715.6711.899.109.099.09
Pm (W)389.869325.5247189.11188.9188.74
Power ratio (%)10083.4863.3548.5048.4548.41
Publisher’s Note: MDPI stays neutral with regard to jurisdictional claims in published maps and institutional affiliations.

