Article

An Enhanced Adaptive Perturb and Observe Technique for Efficient Maximum Power Point Tracking Under Partial Shading Conditions

by
Altwallbah Neda Mahmod Mohammad
1,2,*,
Mohd Amran Mohd Radzi
1,2,*,
Norhafiz Azis
1,2,
Suhaidi Shafie
1 and
Muhammad Ammirrul Atiqi Mohd Zainuri
3
1
Department of Electrical and Electronic Engineering, Universiti Putra Malaysia, Selangor 43400, Malaysia
2
Advanced Lightning, Power and Energy Research (ALPER) Centre, Universiti Putra Malaysia, Selangor 43400, Malaysia
3
Department of Electrical, Electronic and Systems Engineering, Universiti Kebangsaan Malaysia, Selangor 43400, Malaysia
*
Authors to whom correspondence should be addressed.
Appl. Sci. 2020, 10(11), 3912; https://doi.org/10.3390/app10113912
Submission received: 25 February 2020 / Revised: 21 March 2020 / Accepted: 23 March 2020 / Published: 5 June 2020
(This article belongs to the Special Issue Power Electronic Applications in Power and Energy Systems)

Abstract

:

Featured Application

This work presents a perfect technique for optimizing the operation of photovoltaic systems by continuously extracting the maximum power even under the worst cases of atmospheric variations. The proposed technique provides a robust solution that can overcome the drawbacks of power tracking algorithms under partial shading conditions, such as the failure of actual maximum power extraction, low tracking speed, complexity in the required computations and in implementation, low accuracy, and high oscillation around the tracked maximum power. Therefore, the proposed algorithm will enable the best performance for any applied photovoltaic configuration without any extra cost and complexity, thus enhancing the utilization of photovoltaic renewable energy for significant applications.

Abstract

In this paper, we propose enhanced adaptive step size Perturb and Observe (P&O) maximum power point tracking (MPPT) with properly organized comparison sequences which lead to achieving the actual maximum power point (MPP) effectively in the presence of partial shading conditions, taking into account the optimization of all aspects of high-performance MPPT to be novel, simpler, fast, and accurate, with the best efficiency reaching up to almost 100%. In this study, the proposed algorithm, along with a boost converter, was designed and simulated in MATLAB/Simulink to validate the performance of the suggested technique. Four different levels of partial shading conditions were considered for system examination: weak, moderate, and two different levels of strong shading. Each case was applied separately first and then combined in a sequence arrangement to provide robust and comprehensive testing which can provide a guaranteed assessment of the proposed algorithm. The performance of the suggested technique is discussed and compared with that of conventional P&O and conventional incremental conductance (IC) MPPT techniques. The failure of the conventional techniques to work efficiently in the presence of partial shading conditions was observed from the simulation results. Meanwhile, the success of the proposed technique and its high performance were clearly confirmed under partial shading conditions with no increase in complexity or convergence time.

1. Introduction

Photovoltaic (PV) energy has grown enough to be the most processed sustainable energy source that could be considered as a substitute for fossil-fuel energy, as it is inexpensive, clean, requires little maintenance, and emits no noise, among other properties. Solar cells are the major component that converts light energy from the sun to DC electrical energy [1]. However, PV—like most of the approaches for harvesting clean and sustainable solar energy, such as photocatalysis, electrocatalysis, and photo-electrocatalysis—has non-steady energy extraction [2] and is affected by conditions such as illumination, temperature, and panel age [2,3,4,5]. PV systems can work under both uniform irradiance and partially shaded conditions; in the presence of partial shading conditions, the PV array P–V curve contains numerous power peaks which are called the local maximum power points (LMPPs), while the peak of the highest power is known as the global maximum power point (GMPP). The common target is to maximize the efficiency of the PV system by keeping the PV module at its maximum power operation [6], and for that reason, a maximum power point tracking (MPPT) method is essential to control such problems and check whether the PV system operates at the MPP [7]. Many different MPPT algorithms have been presented in recent years, and the conventional MPPT algorithms, such as Perturb and Observe (P&O) and incremental conductance (IC), are considered economical and easy to implement [8]. Moreover, the soft computing techniques, such as fuzzy logic control [9], artificial neural network [10], and particle swarm optimization [11], are complex techniques and have extended computation time and low convergence speed [12]. However, in uniform weather conditions, the conventional algorithms perform accordingly and can track the MPP, while under partial shading conditions, the conventional methods may fail to track the global peak power with a key drawback such as oscillations at the operating power point [13]. Meanwhile, the soft computing techniques can seek the GMPP but with considerable drawbacks such as long computation time, low convergence speed, high complexity, and low accuracy [14]. In recent years, many research works and proposed algorithms have been presented to overcome the problems related to partial shading conditions, and each algorithm provided a certain process with different aspects such as efficiency, convergence speed, and complexity [15]. Among the conventional techniques, P&O is the most extensively used due to its simplicity and low cost. Besides, this technique is considered very accurate as it is based on the direct measurement of voltage and power, and it has a faster response compared to other conventional techniques [16]. Nevertheless, it suffers from two major disadvantages: the high oscillations that happen when the MPP is achieved, and its failure to obtain the maximum available power from a partially shaded PV array. Many researchers have made modifications to P&O to overcome its drawbacks. In [17], the authors proposed a variable step P&O and global scanning technique (VSPO & GS) which contributed better tracking speed and precision. However, its drawback is that the work did not include any comparison with other techniques, so its effectiveness could not be confirmed.
A new enhanced P&O algorithm with variable step size was suggested in [18], using fuzzy logic control to provide variable step size convergence to enhance the efficiency of the PV system. In [19], the suggested approach aimed to avert the drift issue by integrating information of change in current, voltage, and power into the decision procedure to track the MPP precisely. The authors concluded that the simple P&O algorithm suffers from drift problems due to the wrong decision-making ability of the algorithm, particularly in the case of high insolation. The methods presented in [18] and [19] are expensive, complicated, and require prior knowledge to handle. A modified P&O algorithm which is basically different from the conventional one by considering a third test in its flowchart—that is, the change in the PV current—was suggested in [20]. The algorithm considered eight cases of operating point perturbation: four were with fixed irradiance, and four were investigated to illustrate the cases of fast weather variation. The results confirmed that this controller can track MPPs very well under uniform conditions; however, this algorithm has to be improved to be able to work under partial shading conditions. Also, a novel adapted variable step size P&O was proposed in [6]. This work was based on the Pythagorean theorem, which can overcome the weaknesses and restrictions of conventional P&O MPPT under fast weather changes, while the performance was still not efficient under partial shading conditions. For efficient tracking, the author of [21] suggested a new GMPP tracking (GMPPT) technique based on the Perturbed-based Extremum Seeking Scheme (PESC). A new autoscaling variable step size MPPT technique which can regulate the step size of the procedure in order to obtain the fast dynamic was proposed in [22]. In the proposed modified P&O technique, a large perturbation step is considered when the current operating point is far from the MPP, whereas a small step size is adopted in close proximity to the MPP. Another technique which can find the characteristic curve from on-site measurements was proposed in [23]. During the process of defining the characteristic curve, the values of both current and voltage at the MPP are also specified. The simulation and experimental outcomes proved the capability of the algorithm to determine the characteristic curve and to fix the GMPP voltage and current values under variations in shading conditions [23]. GMPPT using the Fuzzy Logic methodology based on IC was proposed in [24] to track the GMPP. The suggested fuzzy controller takes the P–V curve slope as an input and produces output adaptable as the duty ratio of the boost converter for MPP tracking. The algorithm robustness was validated via a comparative study. The Fuzzy-Logic-based global MPPT algorithm was also applied in [25], and the simulation evaluation successfully showed that the suggested method is superior to the conventional P&O in terms of tracking efficiency and convergence speed. A GMPPT algorithm was proposed in [26]. The proposed algorithm is Moth-Flame Optimization (MFO) depending on the power optimization at the boost converter output. A combination of two methods was proposed, in which the first one is for tracking the GMPP for the case of a 100 kW array [26], and the second method is the distributed maximum power point tracking (DMPPT) structure for the case of a 1 MW PV plant under different partial shading conditions. The simulation results demonstrated the ability of the proposed algorithm to track the GMPP of the PV array system, but the algorithm is considered complex with low convergence speed. An effective and extremely precise hybrid MPPT controller which combines fuzzy logic control and the P&O method in order to track the MPP of PV under partial shading conditions was proposed in [27]. The proposed technique had the ability to enhance both steady-state and dynamic conditions. The results of simulations clarified the strength and effectiveness of the suggested process under intense atmospheric fluctuations. However, the algorithm suffers from two major drawbacks: the high cost and the difficulty of implementing a stable efficient controller. Another contribution was also made to the conventional MPPT algorithm to improve its effectiveness under partial shading conditions. An enhanced P&O algorithm based on global MPPT integrated with a DC/DC Buck converter was proposed in [1] to work under partial shading conditions. The presented procedure consists mainly of two further parts: the foremost MPP algorithm for unchanging weather conditions and a GMPP algorithm for partial shading conditions. The simulation results confirmed that the suggested technique is speedier and more precise than the existing algorithms. The GMPP was achieved in 0.15 s with an efficiency of 99.19%.
From the review above, the research gaps for the modified P&O techniques under partial shading include tracking the GMPP accurately, reducing the oscillation near the GMPP, limiting the computation time, increasing the convergence speed, and keeping the algorithm at the same simplicity level as the conventional P&O. Taking into account all of these limitations, an enhanced adaptive P&O algorithm is proposed herein for tracking the GMPP of a PV system under partial shading conditions. The proposed technique has considerable prominent features that are not available for any other classical or soft computing method, as follows: (1) it is simpler than any modified P&O; (2) GMPP achievement is quicker than that by any available method; (3) there are nil oscillations near the MPP; and (4) the GMPP is precisely achieved with the best efficiency. Various patterns involving diversified weather situations were tested by simulation. The performance of the suggested algorithm under partial shading conditions was investigated and compared with that of the standard P&O and IC methods. The comparisons illustrated most of the performance aspects, such as tracking time, efficiency, precision, and presence of oscillations around the MPP under partial shading conditions.

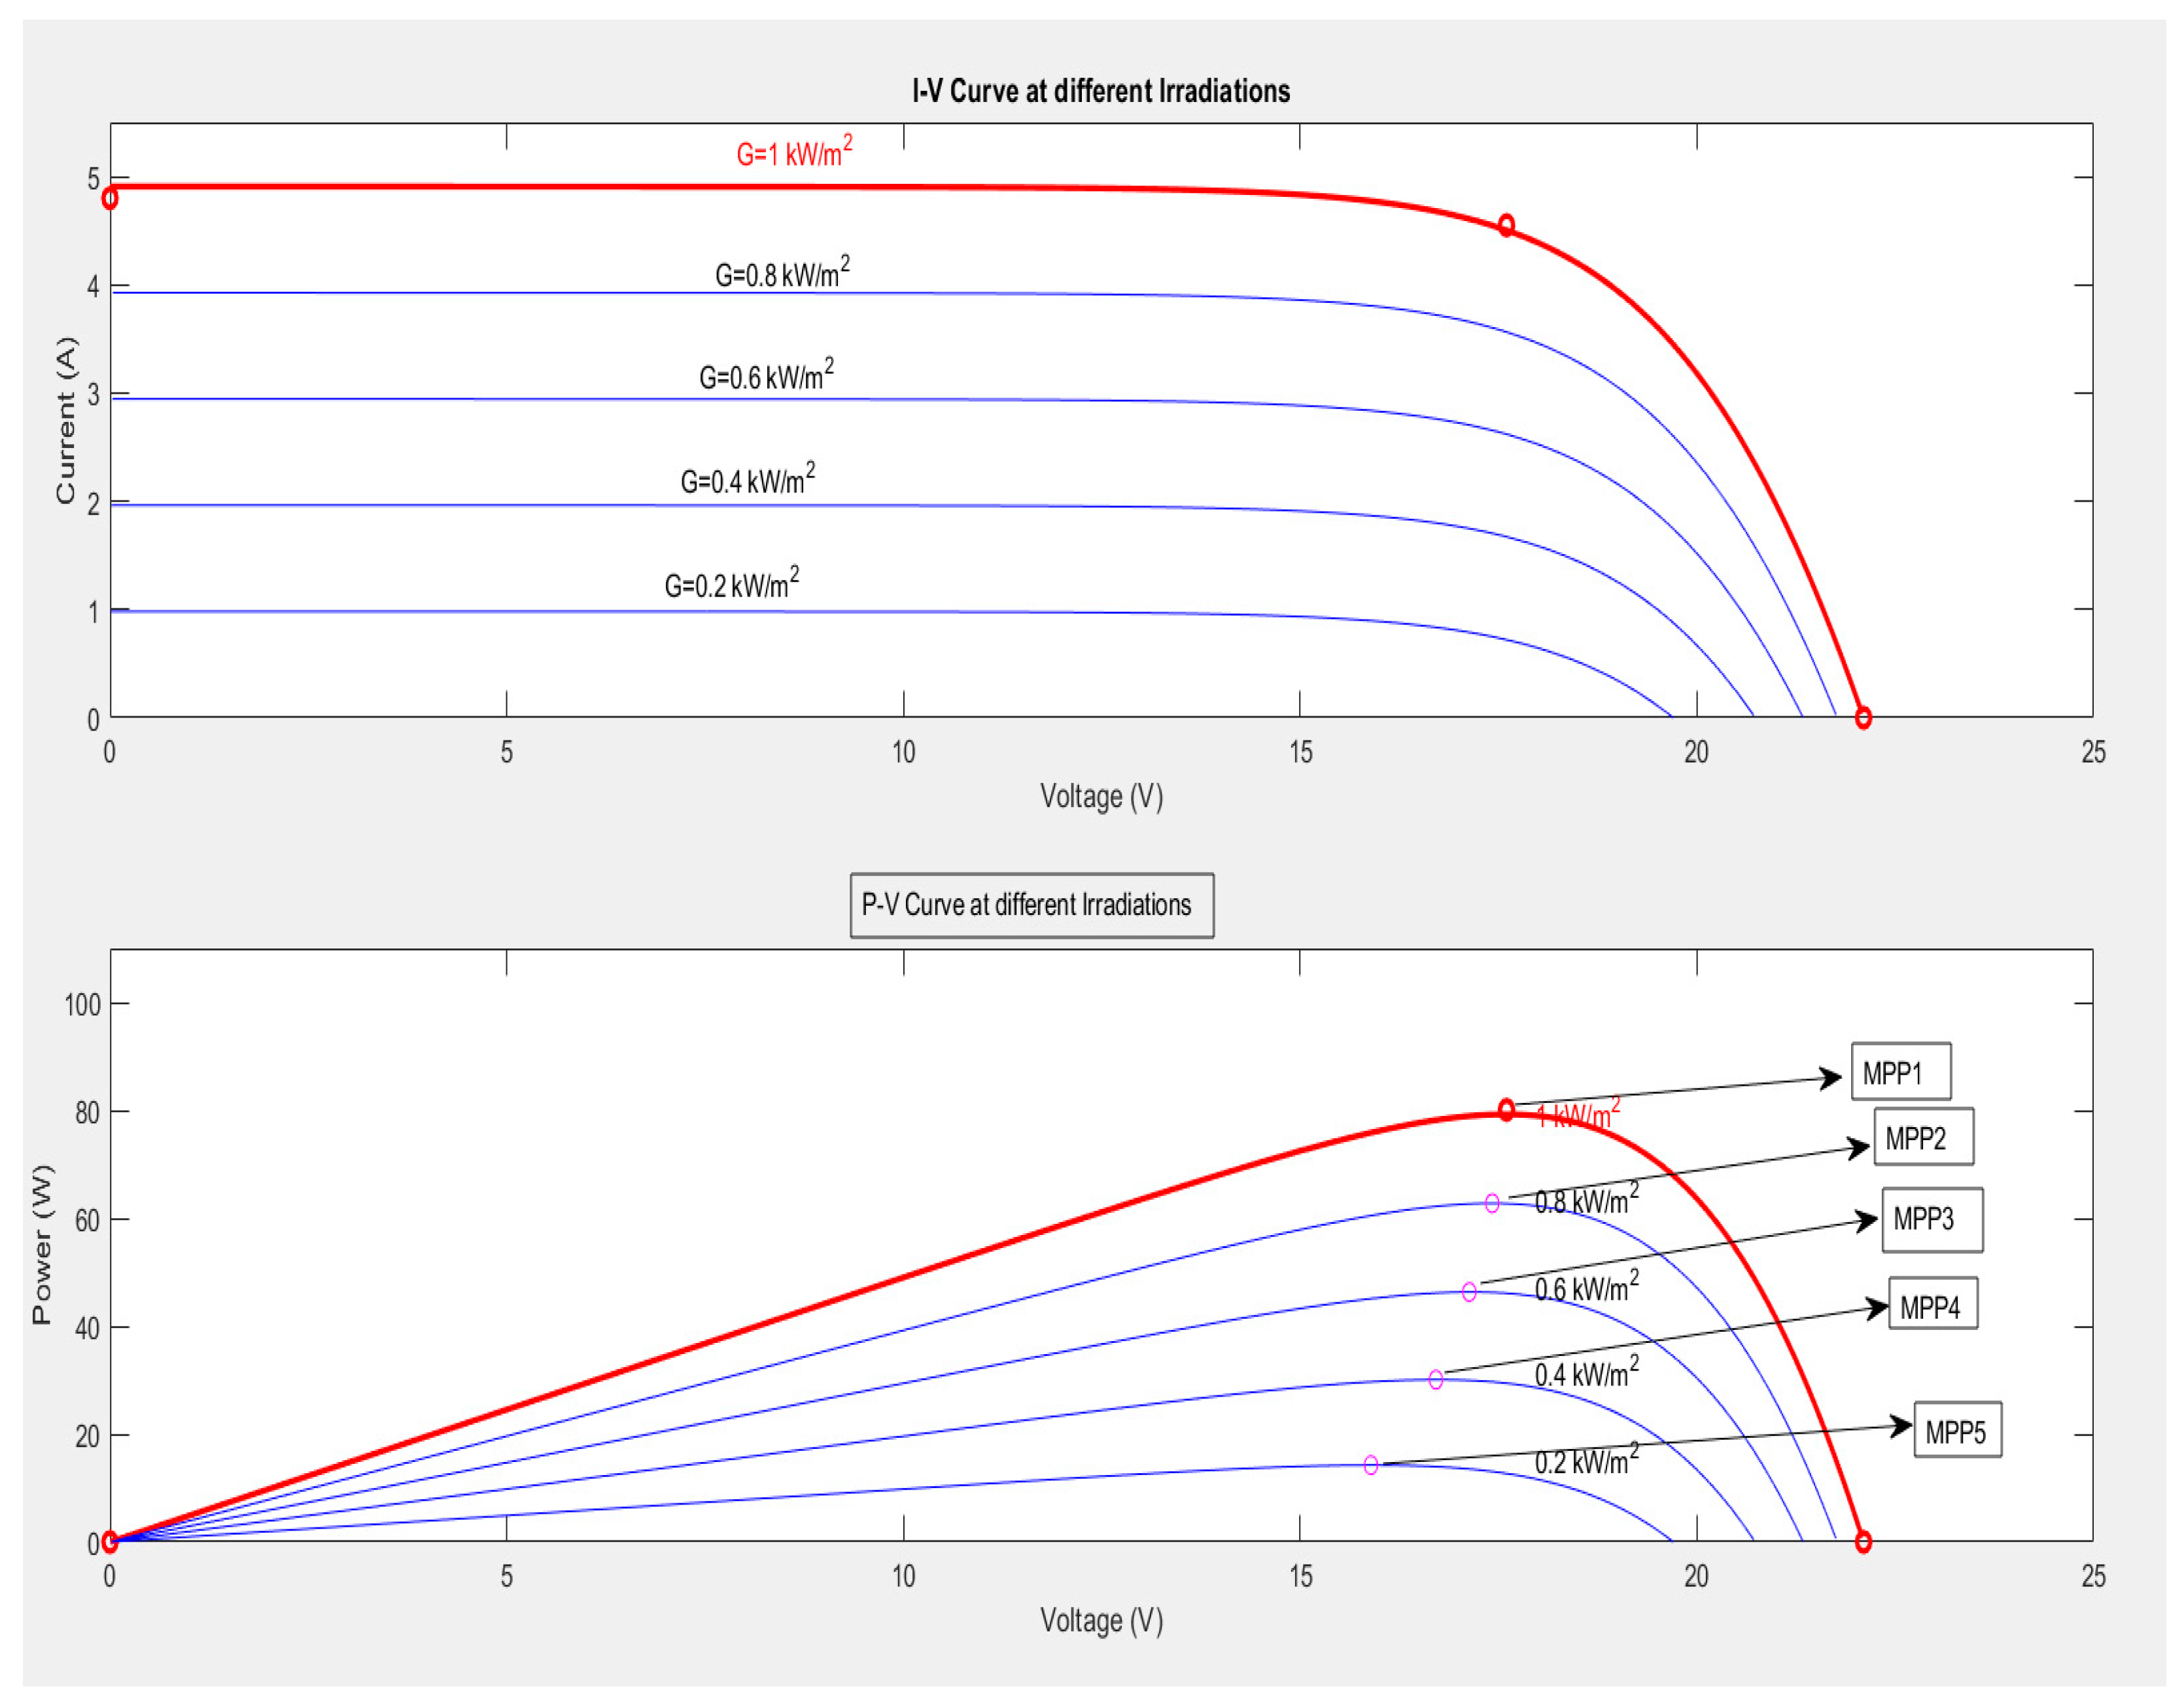
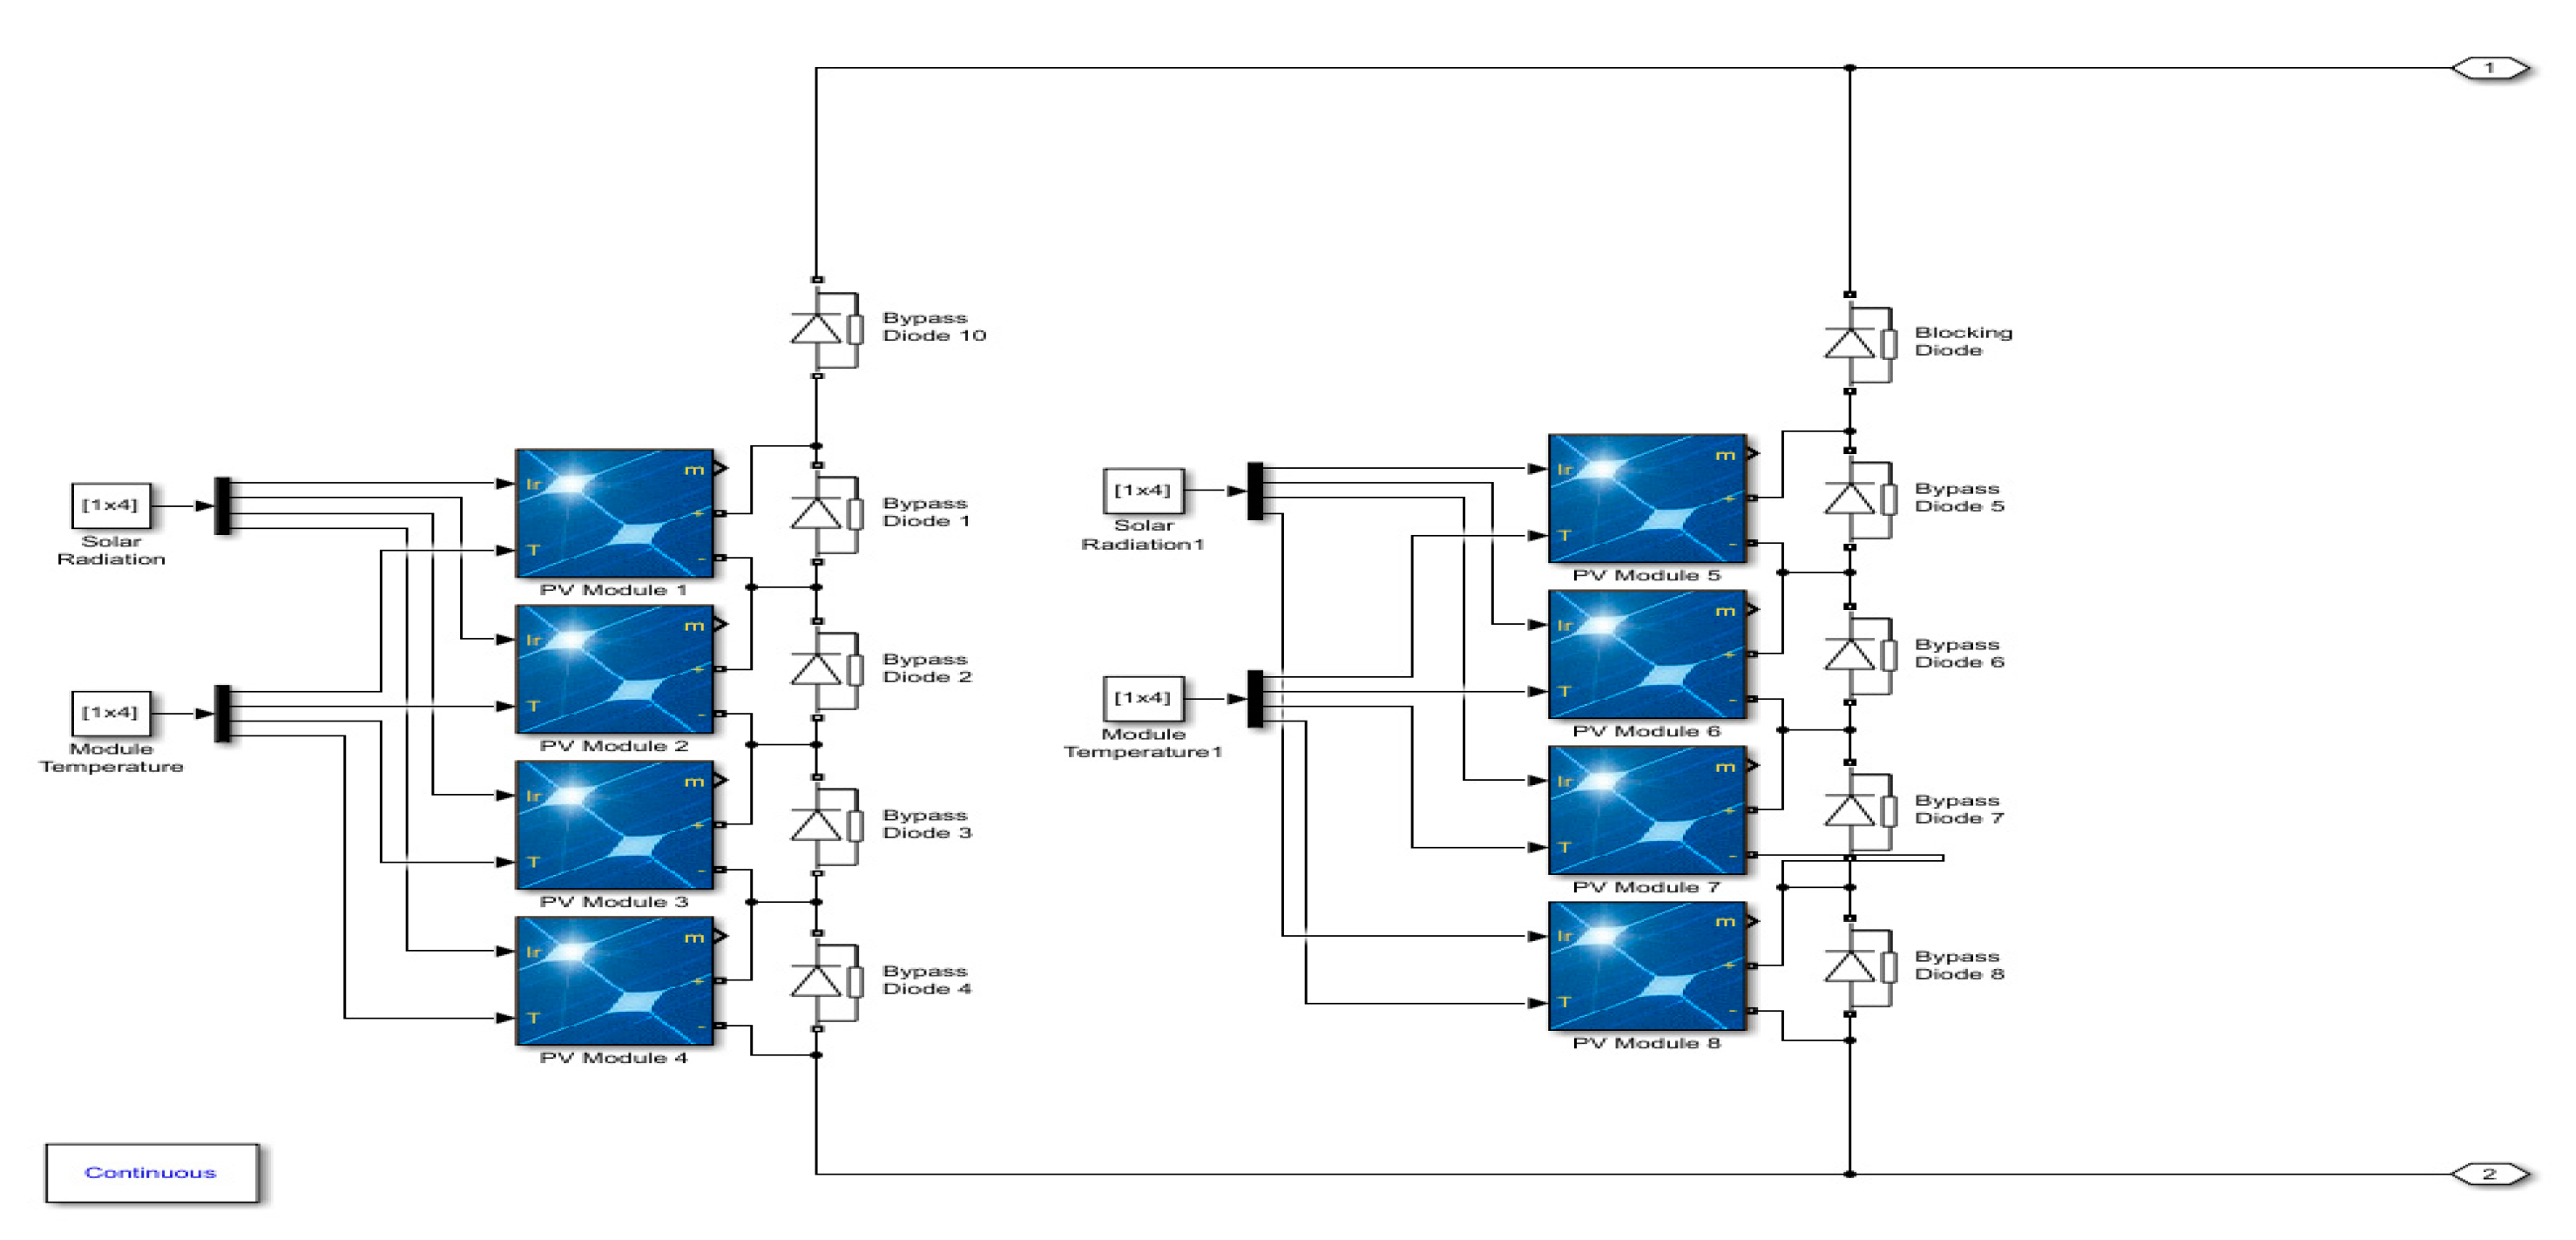
2. Partial Shading Effect Implementation

A PV module simulation was performed using MATLAB-Simulink. Thirty-six solar cells in series connection form a module. The open circuit voltage Voc of each cell is 22.1 V, and the short circuit current Isc is 4.8 A. The solar array is formed by the combination of such modules. The maximum power is 80 W with voltage at maximum power Vmp of 17.6 V, and the current at maximum power Imp is 4.55 A. Figure 1 presents the variation through the I–V and P–V curves taken from the solar cell module with MPP behavior when the irradiance changes from 200 to 1000 W/m2.
A PV array formed from two parallel connections of four modules in series was used in the simulations, as shown in Figure 2. In order to avoid “hotspots”, bypass diodes were applied [28], and to discontinue the “reverse flow of current”, blocking diodes were applied [29]. In a uniform illumination situation, a unique maximum point was produced in the P–V curve, while numerous peaks were created in the P–V curve under partial shading conditions based on the intensity of shading.
Numerous scenarios were simulated to demonstrate the P–V characteristics of the studied PV array under partial shading conditions with different levels of strength. Because of the presence of numerous peaks of power in the PV array P–V curve, a suitable procedure which can precisely and effectively track the GMPP is required. The overall efficiency of the PV system will be affected by the employed technique’s performance.

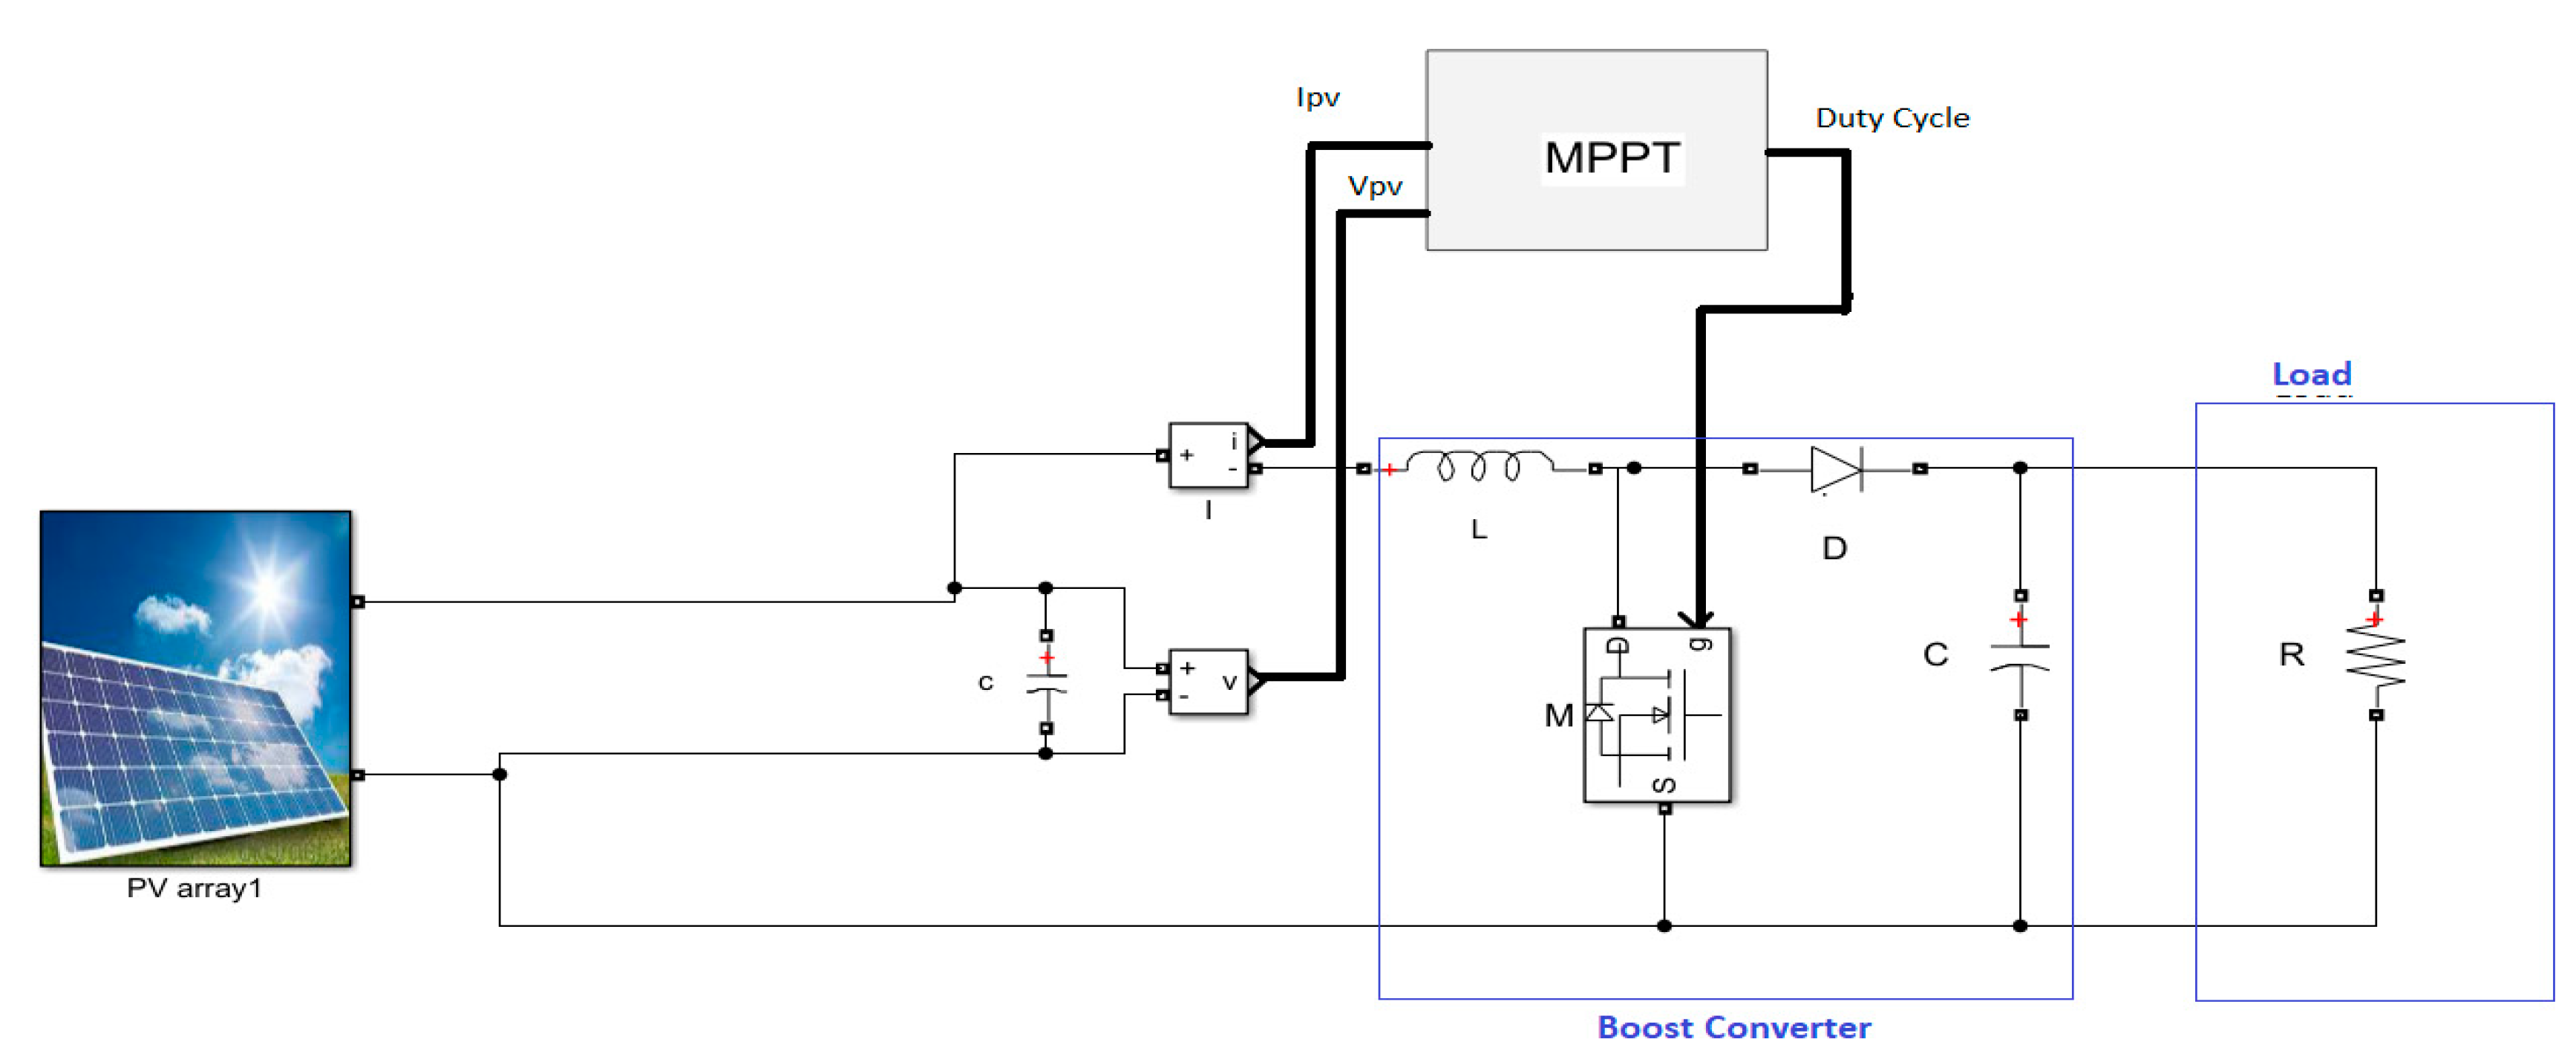
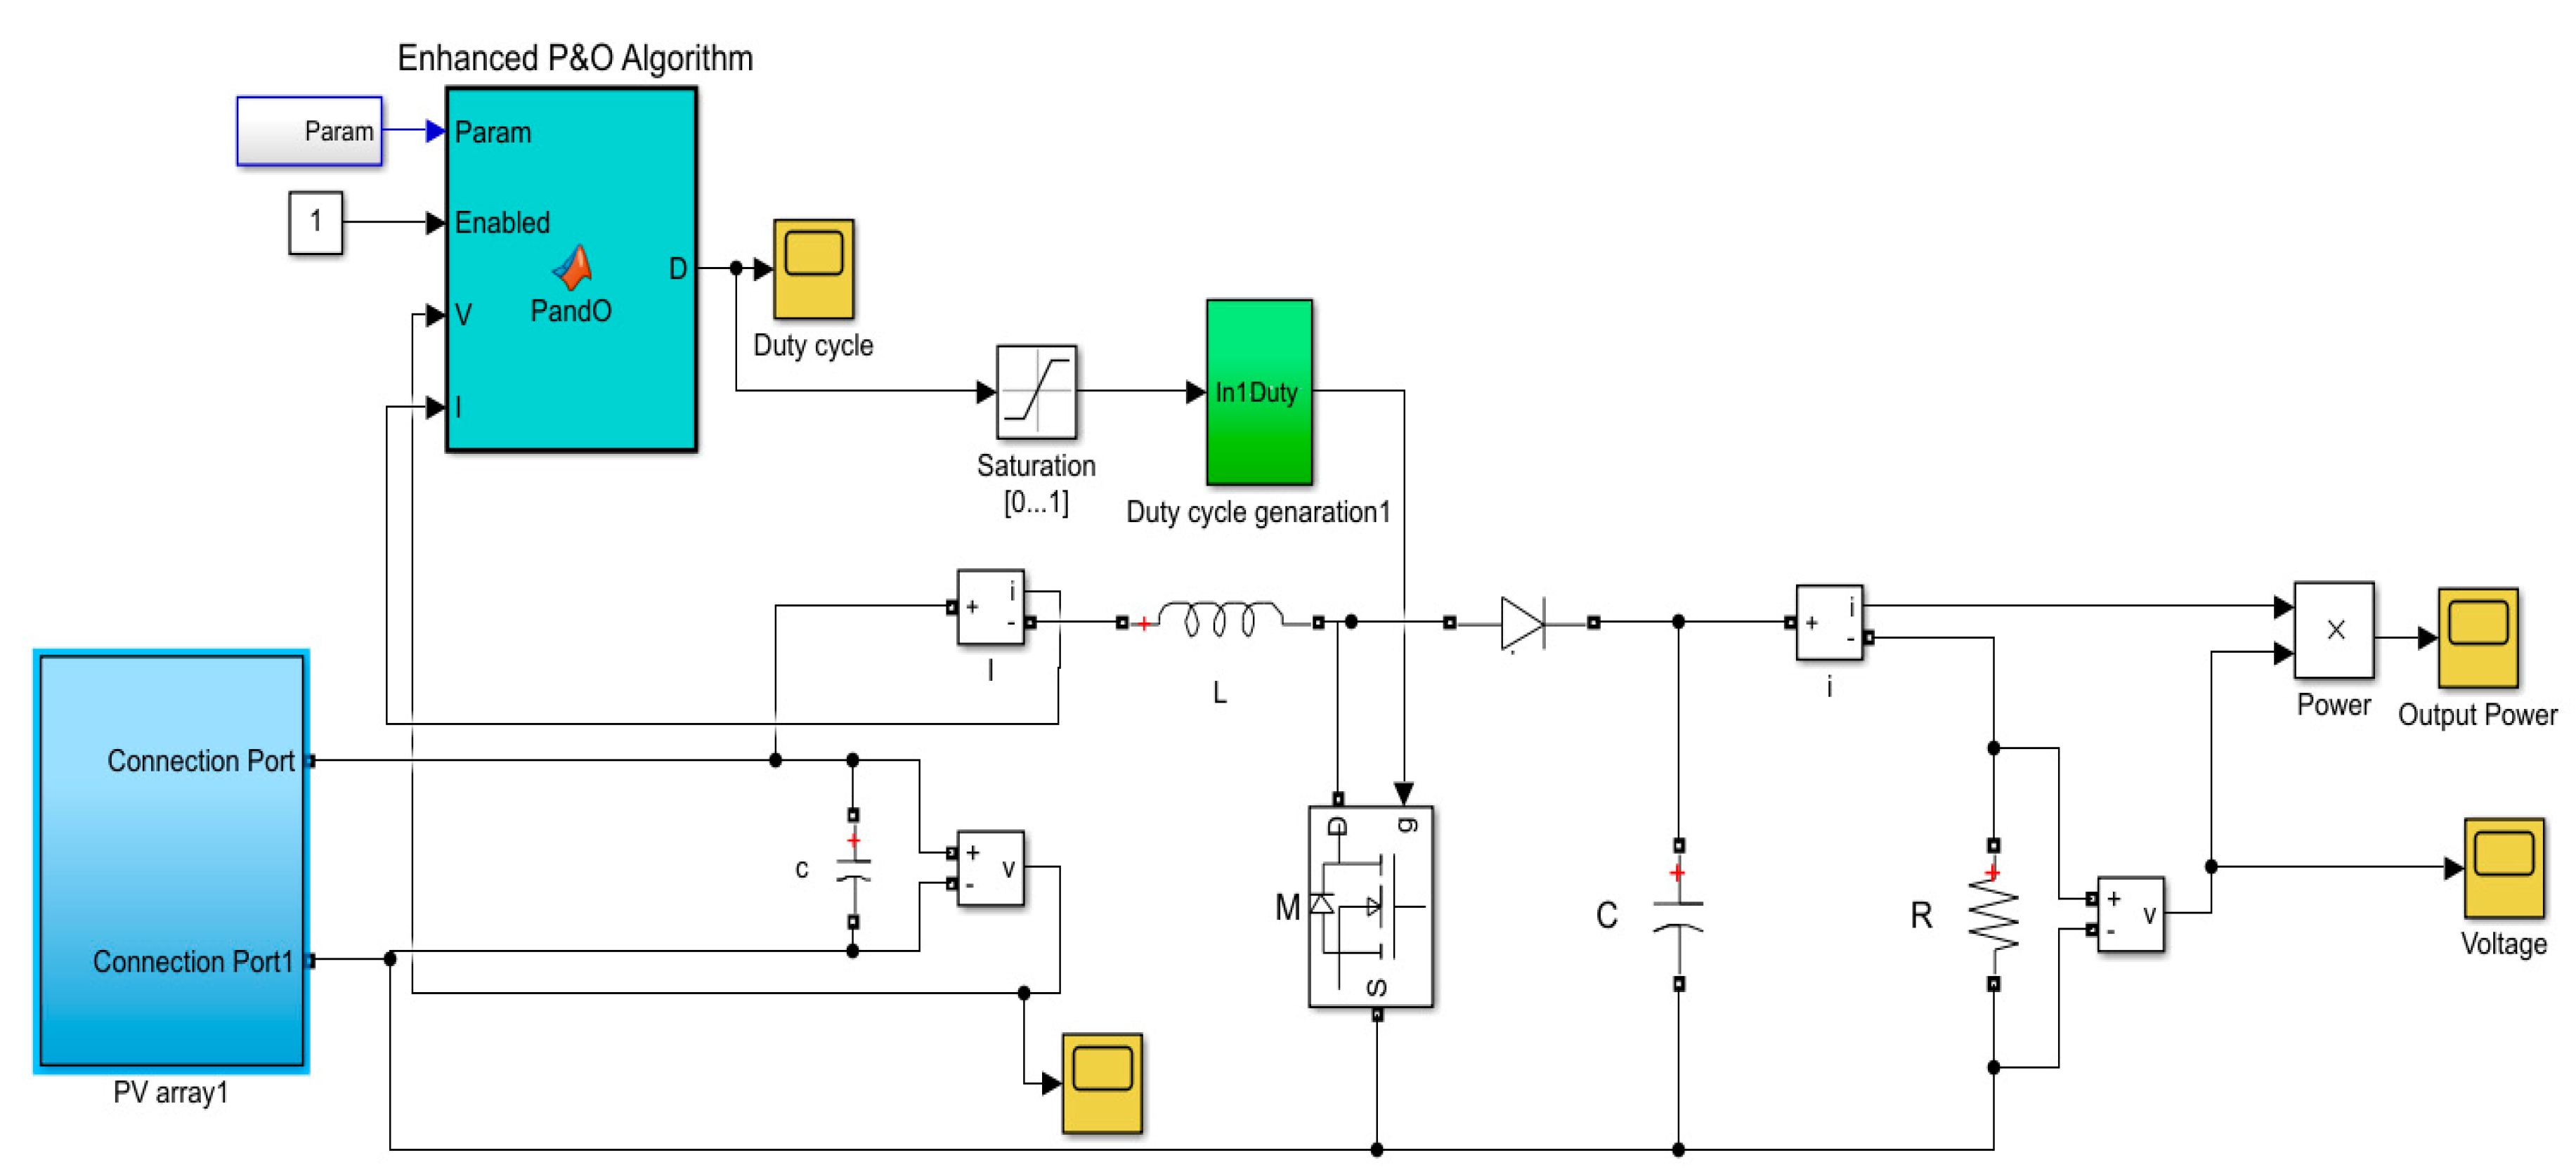
3. DC/DC Boost Converter Design

A DC–DC converter is installed between the PV module and load in an MPPT system to alter a DC voltage to another level of DC voltage. It is important to design the DC–DC converter correctly to ensure that the PV system is working at the best efficiency, as desired. In this work, a boost converter was chosen to alter the input voltage and control the level of output power to the load, as shown in Figure 3. Principally, the boost converter structure is established by an inductor, a diode, a high-frequency power metal oxide semiconductor field effect transistor (MOSFET) switch, and a capacitor [30]. The input voltage of the boost converter is controlled by the PV array output, and the duty cycle variation of the converter is performed according to the output of the MPPT. The operation of a boost converter mainly relies on the opening and closing of the switch, to enter the charging and discharging states, respectively [31]. For low to moderate power applications, a standard power diode and power MOSFET are frequently used [32].
Selection of the resistor: The load resistance ( R L ) of the boost converter is related to the ideal internal resistance of the PV array at the MPP ( R M P P ) by the following equation, as illustrated in [33]:
R L = R M P P ( 1 D M P P ) 2
For the target of maximum power extraction, the ideal internal resistance at the MPP has to be less than the load resistance of the boost converter ( R L R M P P ) [34], since the domain of the duty ratio ( D M P P ) is between 0 and 1. For determining the range of R M P P , we can simulate the array under rapidly varying solar illumination; two diverse levels of irradiance were chosen, among which the higher was at G = 1000 W/m2 and the lower was at G = 200 W/m2 [35]. Figure A1 in Appendix A illustrates the characteristic alteration of the curves of P–V, I–V, and ideal internal resistance for the PV array under three illumination intensities. The MPP declined from 640.6 W to 70.4 W when the radiation level was reduced from 1000 W/m2 to 200 W/m2. Accordingly, the RMPP rose from 7.74 Ω to 35.5 Ω; thus, the load resistance value was selected as 50 Ω for this work, to be greater than R M P P in the case of lowermost illumination.
The output voltage of the converter V O is specified for a load resistance of 50 Ω, supposing a lossless converter ( P O = P p v ) . Therefore, V O and the duty ratio D M P P were determined as
V O = ( P O × R L ) = 178.96 V
D M P P = 1 V p v V O = 0.61
The output voltage V O and current I O of the converter at the MPP were determined as
V O = V M P P 1 D M P P
I O = P M P P V O
Selection of the inductor: The value of the boost inductor is chosen depending on the maximum amount of acceptable current ripple at the MPP in the case of uppermost solar radiation (1000 W/m2) [34]. When the inductor value is high, the output current ripple will be low, and the opposite is also true, as shown in Equation (6). The switching frequency f s was fixed at 10 kHz in this work, in order to reduce the oscillations at the MPP, and the value of the inductor was considered for input current ripple Δ I p v of 1 % [35]. Therefore, the minimum value of the inductor was designed as follows [34,35,36]:
L min = V p v × D M P P 2 × Δ I p v × f s
L min = 0.59   mH .
In this work, we chose L to be 1.6   mH to ensure minimal current ripple at the output of the boost converter, which is very important for this application.
Selection of the capacitor: The minimum value of the output capacitor was determined according to the output voltage ripple Δ V O of 1 % as given below [34,35,36,37]:
C min = V O × D M P P 2 × Δ V O × R × f s
C min = 60.6 μ F .
In this work, we chose C as 0.5   mF to ensure that we maintained the permissible voltage ripple limit for efficient MPP tracking under any radiation variations [33].
Using all the equations above, Table 1 summarizes the PV array characteristics in the cases of higher and lower solar irradiances at the temperature of 25 °C.

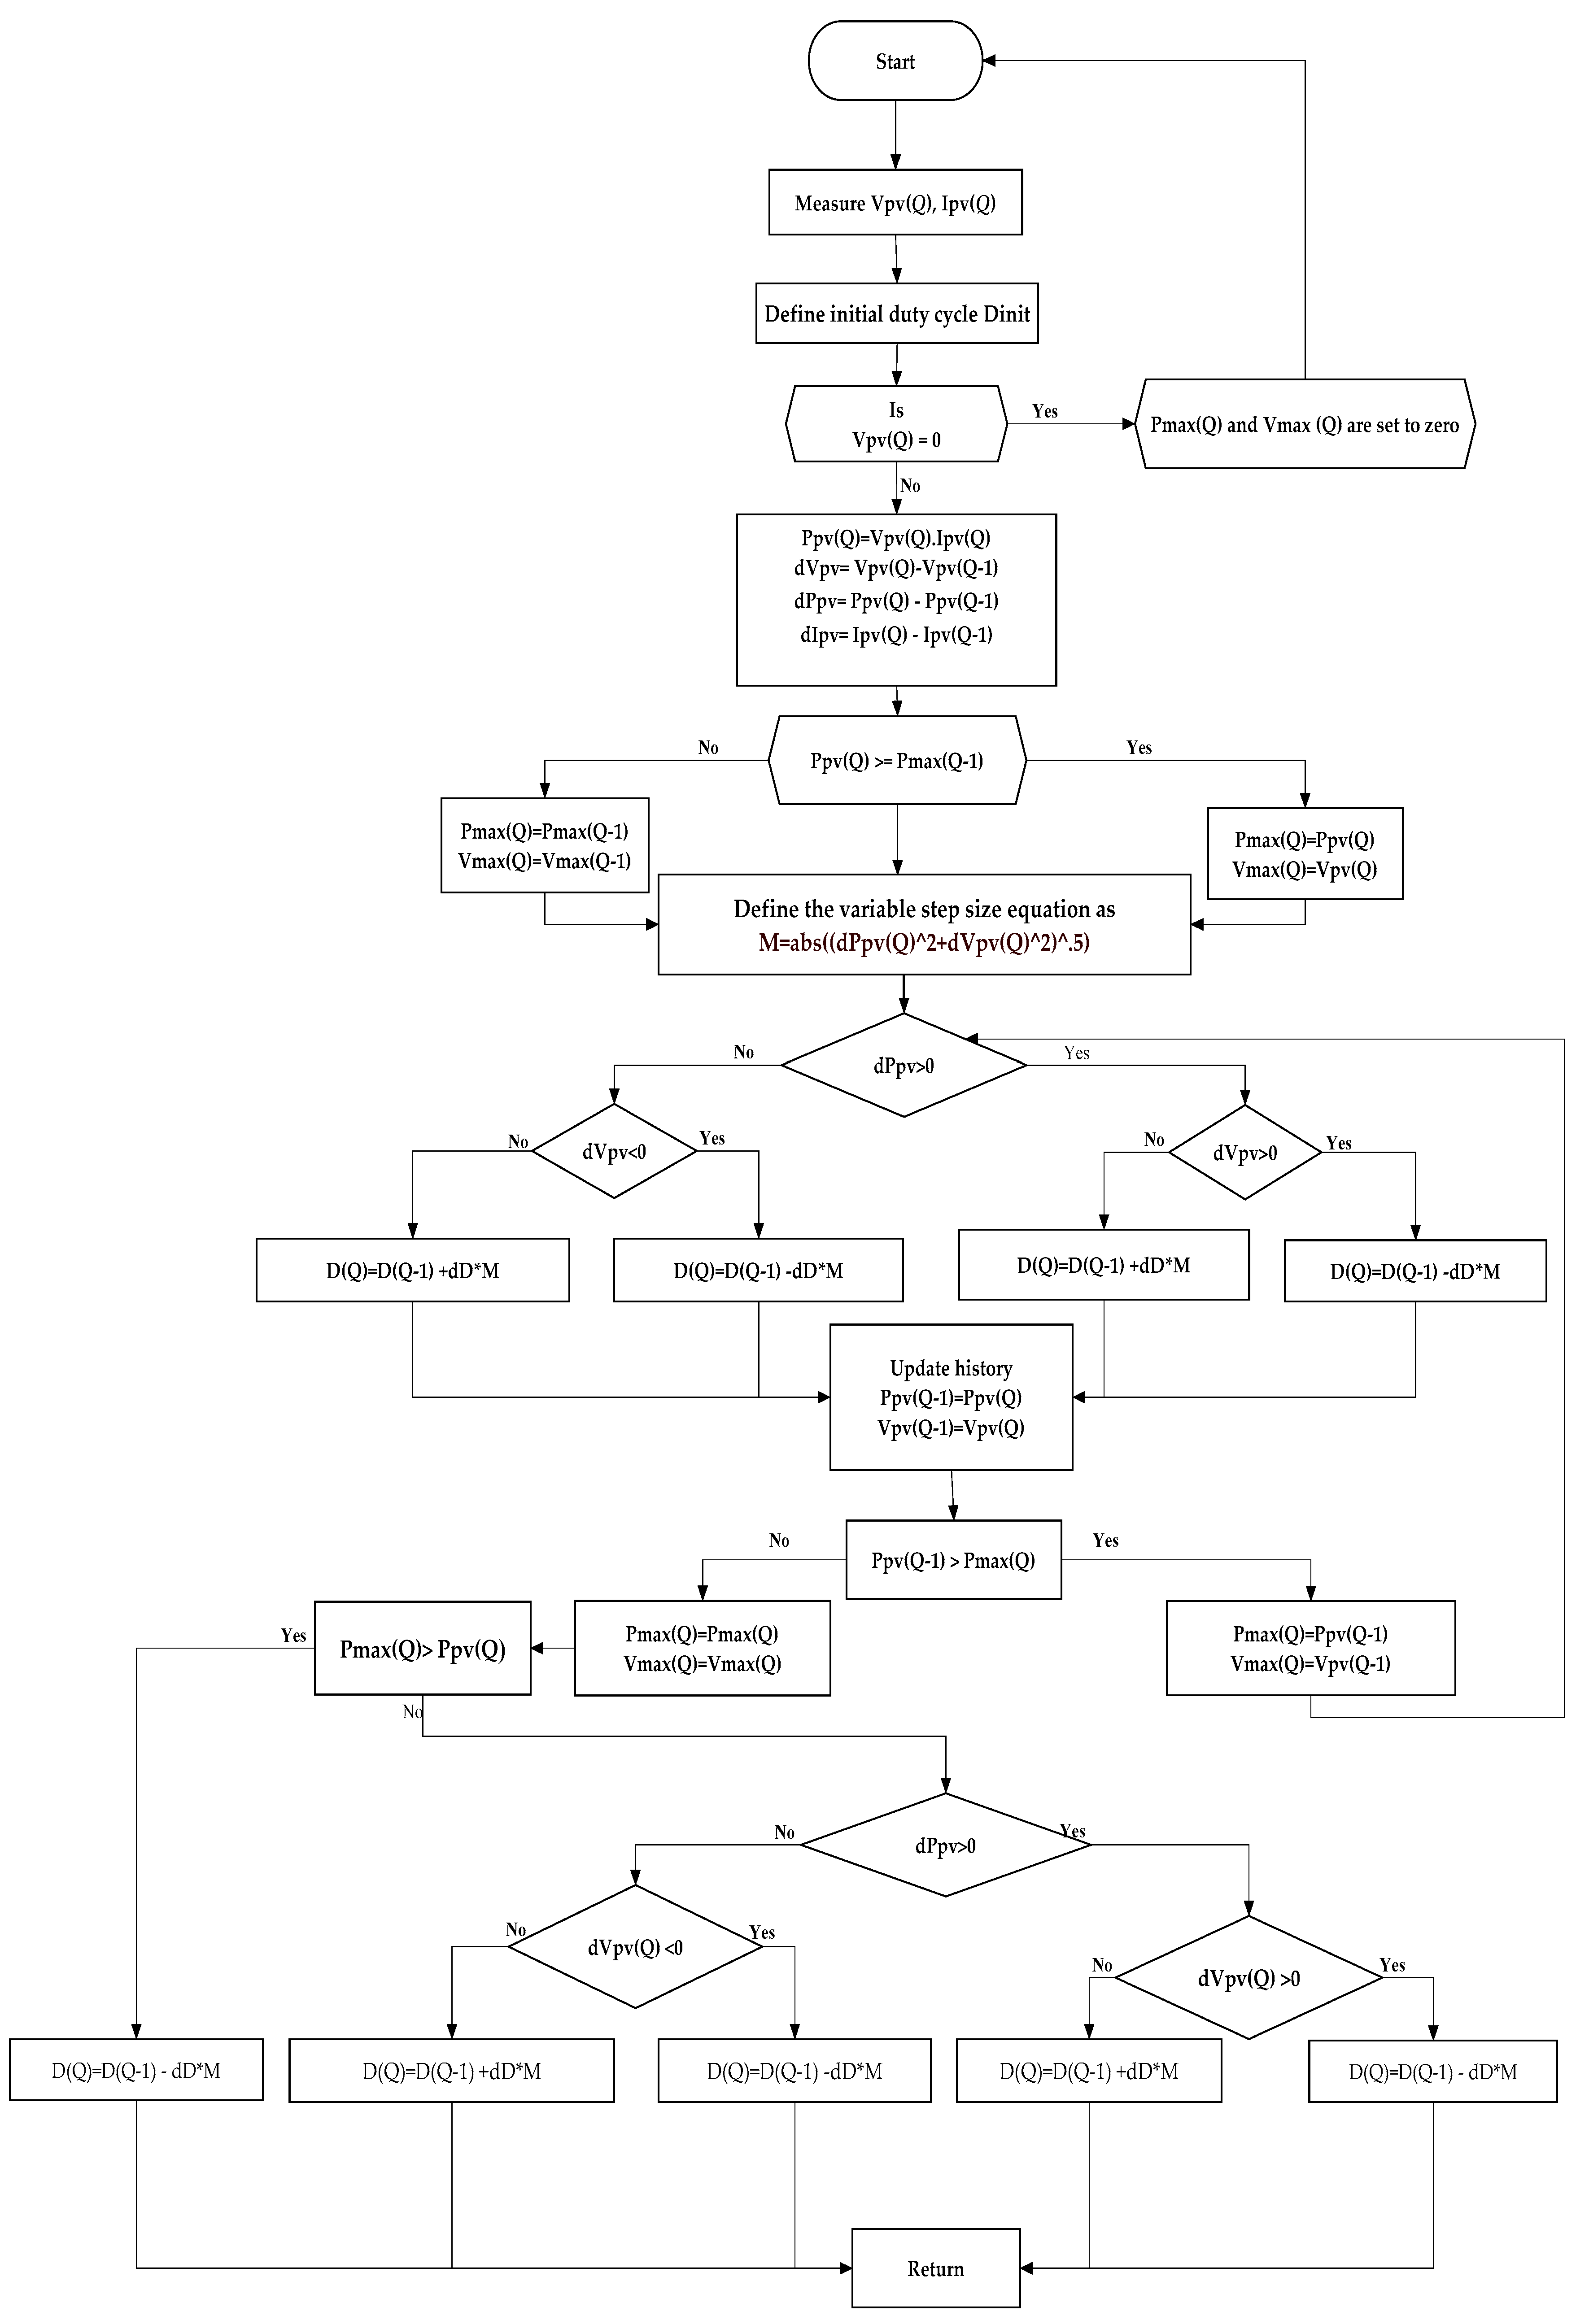
4. Enhanced P&O Algorithm

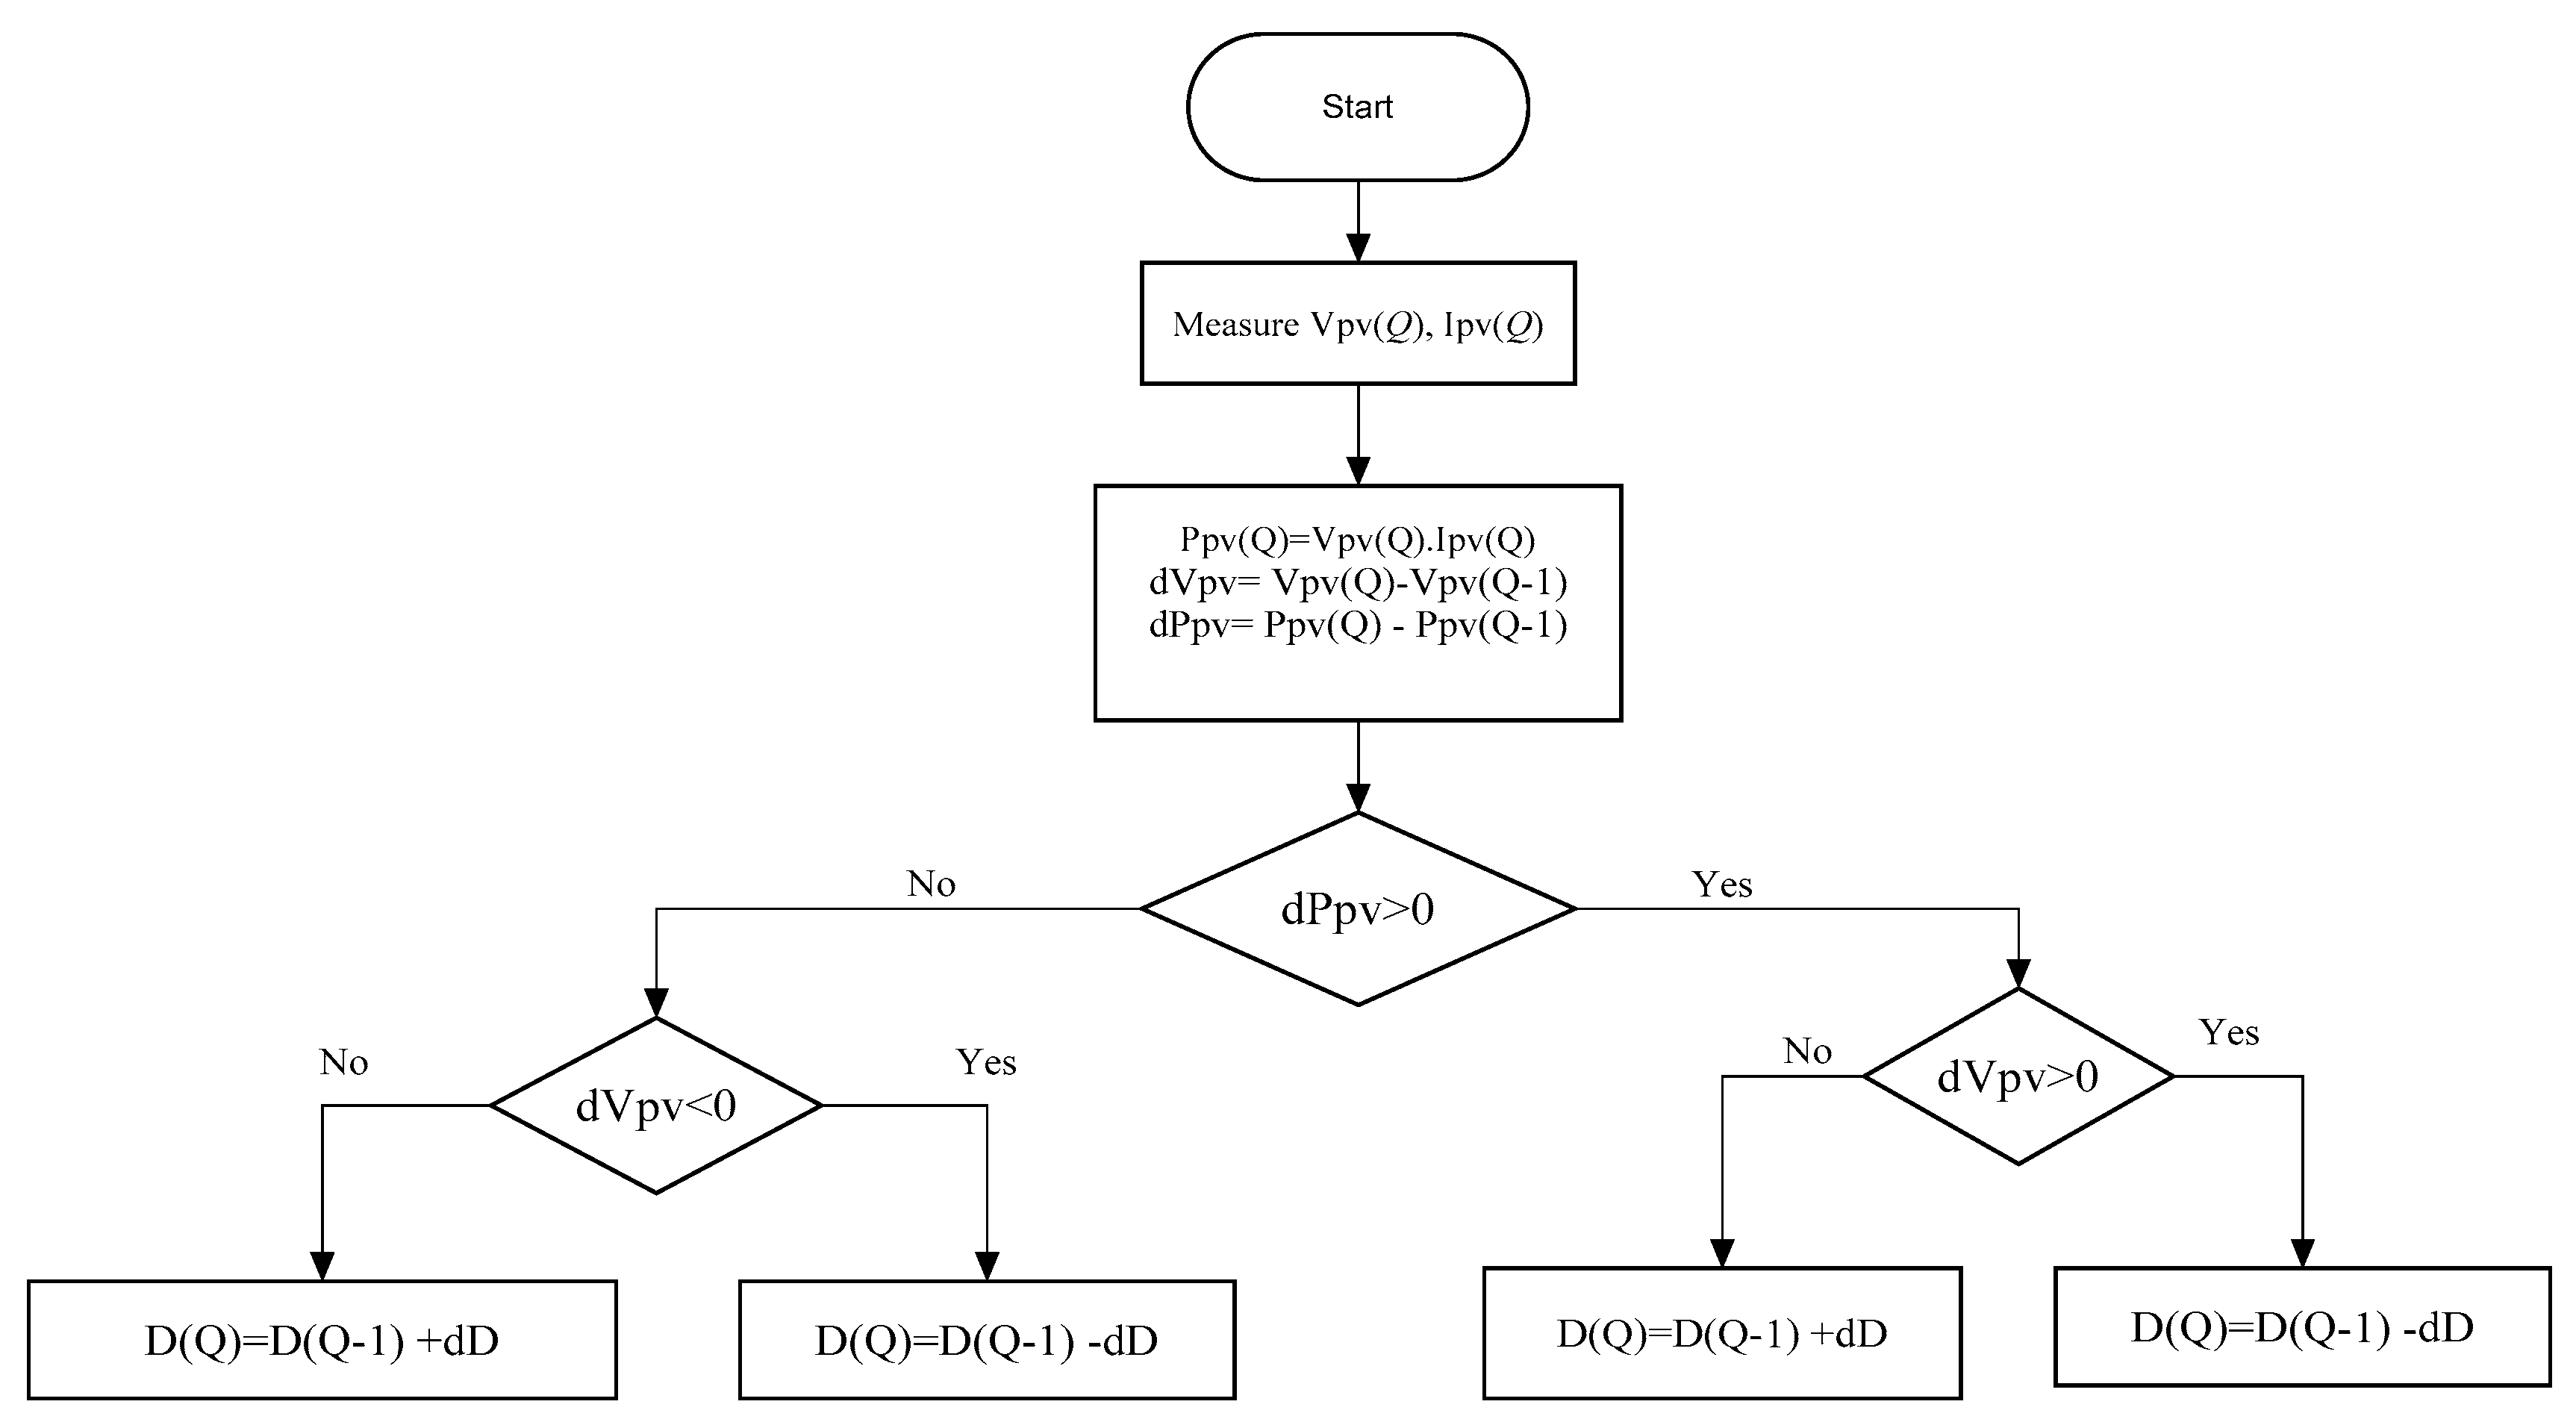
4.1. The Conventional P&O Technique

Among the existing MPPT techniques, the most popular and frequently used is the P&O technique due its simplicity [8]. The operation principle is based on periodical perturbation on the terminal voltage of the PV module and comparison between the current power value of the PV output and the power at the previous perturbation. The operating point is continuously moving in the same direction if the PV module power rises with increasing operating voltage; otherwise, the operating point direction will be reversed. Figure 4 explains the MPP tracking procedure of the P&O technique.
In general, regarding the issues facing the P&O, the first main disadvantage is its oscillations around the MPP, which can impact the tracking speed. Another drawback is that under fast changes in radiation, the P&O may lose the correct direction of tracking and, consequently, a considerable energy loss would be accrued [35]. Furthermore, the classical form of P&O is not efficient under partial shading conditions. In this work, the classical P&O algorithm is enhanced to conquer these weaknesses.

4.2. Enhanced P&O MPPT

The proposed modification consists of specified systematic comparison sequences which lead to tracking the GMPP with a very simple process based on an adaptable step size P&O strategy; this algorithm comprises three procedures. The first step starts by initiating the tracking process with the measured V P V and I P V , and if starting from zero, V m a x and P m a x are set to zero at the beginning of the process. By starting simulation of the PV array, I p h and V p h and the corresponding power P p h are obtained for the Q t h instants. The second step is to make an auto-adjustment to the perturbation step size in order to improve the tracking response speed and reduce the oscillation around the MPP by using variable step size instead of a fixed step size. This idea was applied in [6] for MPPT under uniform conditions and is based on estimating the distance between the current power value and the MPP. This distance can be calculated based on the Pythagorean theorem, which is an essential relation in geometry among the three sides of a right-angled triangle. It states that the square of the hypotenuse is equal to the sum of the squares of the other two sides [6]. However, the parameters of this triangle are the voltage, the power, and the hypotenuse, where the value of hypotenuse indicates the distance between the current power value and the MPP; this means the possibility of estimating the best step using Equation (8).
M = a b s ( d P 2 + D V 2 )
Therefore, the duty cycle in the adaptive step length P&O MPPT scheme becomes very dynamic and changes based on the power and voltage values. This concept is applied during the comparison process between the current power P p v ( Q ) and the previous maximum power P max ( Q 1 ) to track the actual maximal power P max ( Q ) and its voltage V max ( Q ) . If the current power P p v ( Q ) is higher than the previous maximum power P max ( Q 1 ) , then the actual maximum power P max ( Q ) is equal to the current power P p v ( Q ) ; otherwise, the actual maximum power P max ( Q ) keeps its original value. In the final step, the value of V max corresponding to the resulting P max is updated for a new comparison between V P V ( Q ) and V max ( Q ) to achieve the GMPP with accurate voltage and duty cycle by applying the P&O process with variable step size. The proposed algorithm is illustrated in detail in the flowchart in Figure 5. The proposed procedure is capable of GMMP tracking under any strength of partial shadowing with the presence of local and global maximum points, during initial conditions or fluctuating weather conditions, as validated and shown in the next section.

5. Simulation Results

A DC/DC boost converter was selected for this validation. The applied boost converter design was illustrated in the previous section. A complete Simulink model of the MPPT controller is shown in Figure 6.
The performance evaluation of the proposed enhanced P&O algorithm and comparison with the conventional P&O and IC algorithms were executed in MATLAB/Simulink in order to prove the GMPP tracking ability under various partial shading conditions. Different cases were considered in simulations where the GMPP location changes in P–V characteristics for weak and strong partial shading patterns to confirm the effectiveness of the algorithm.

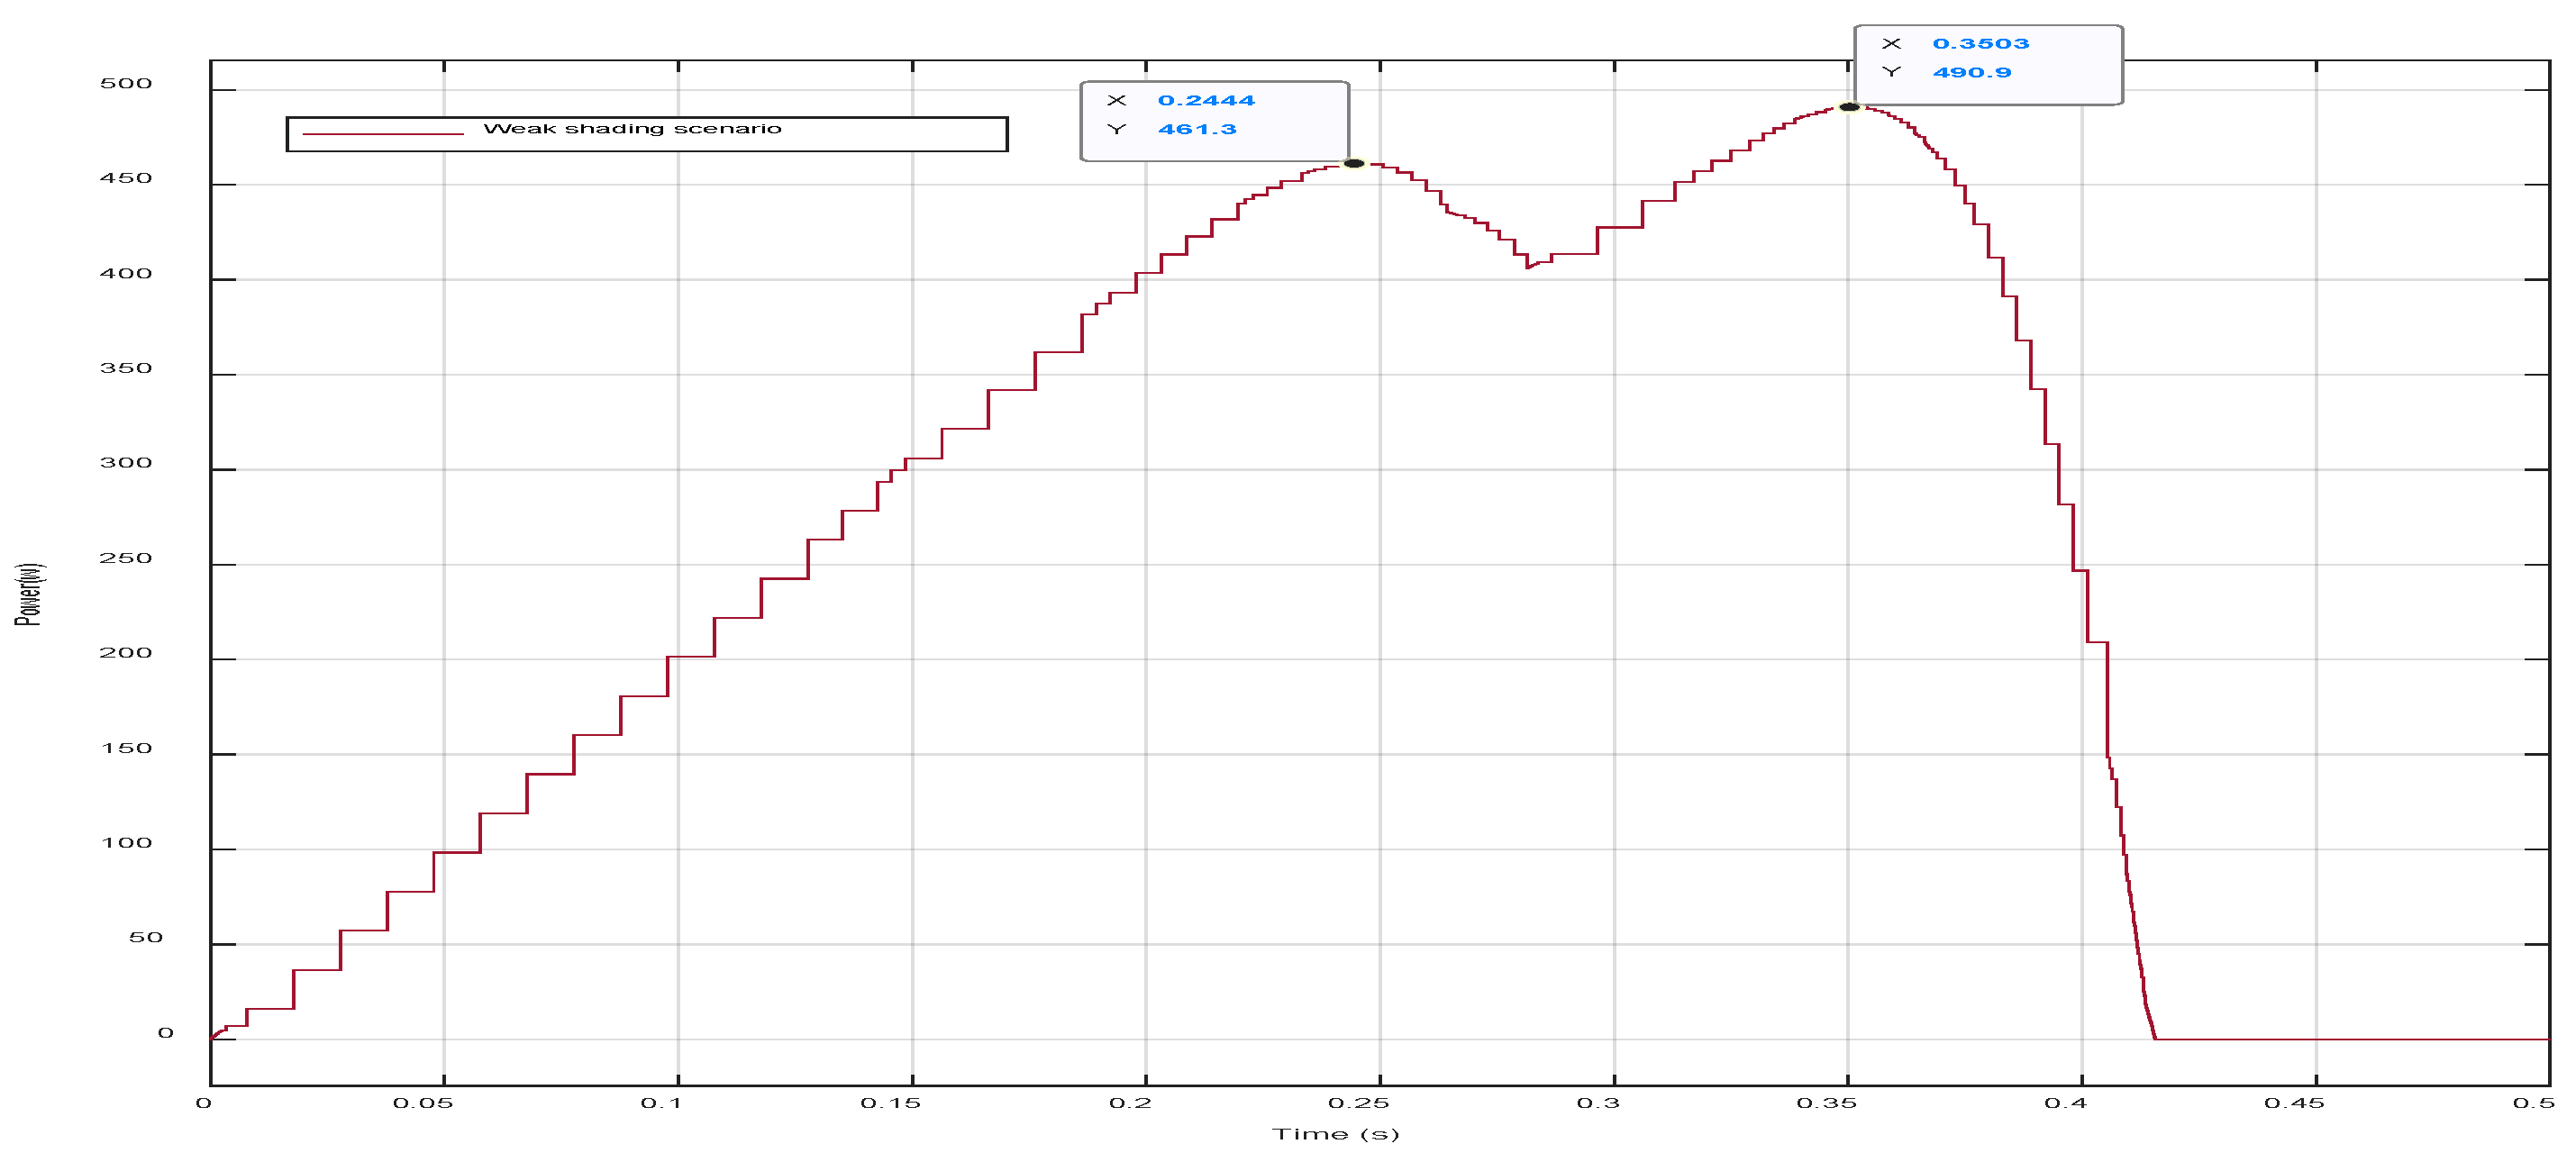
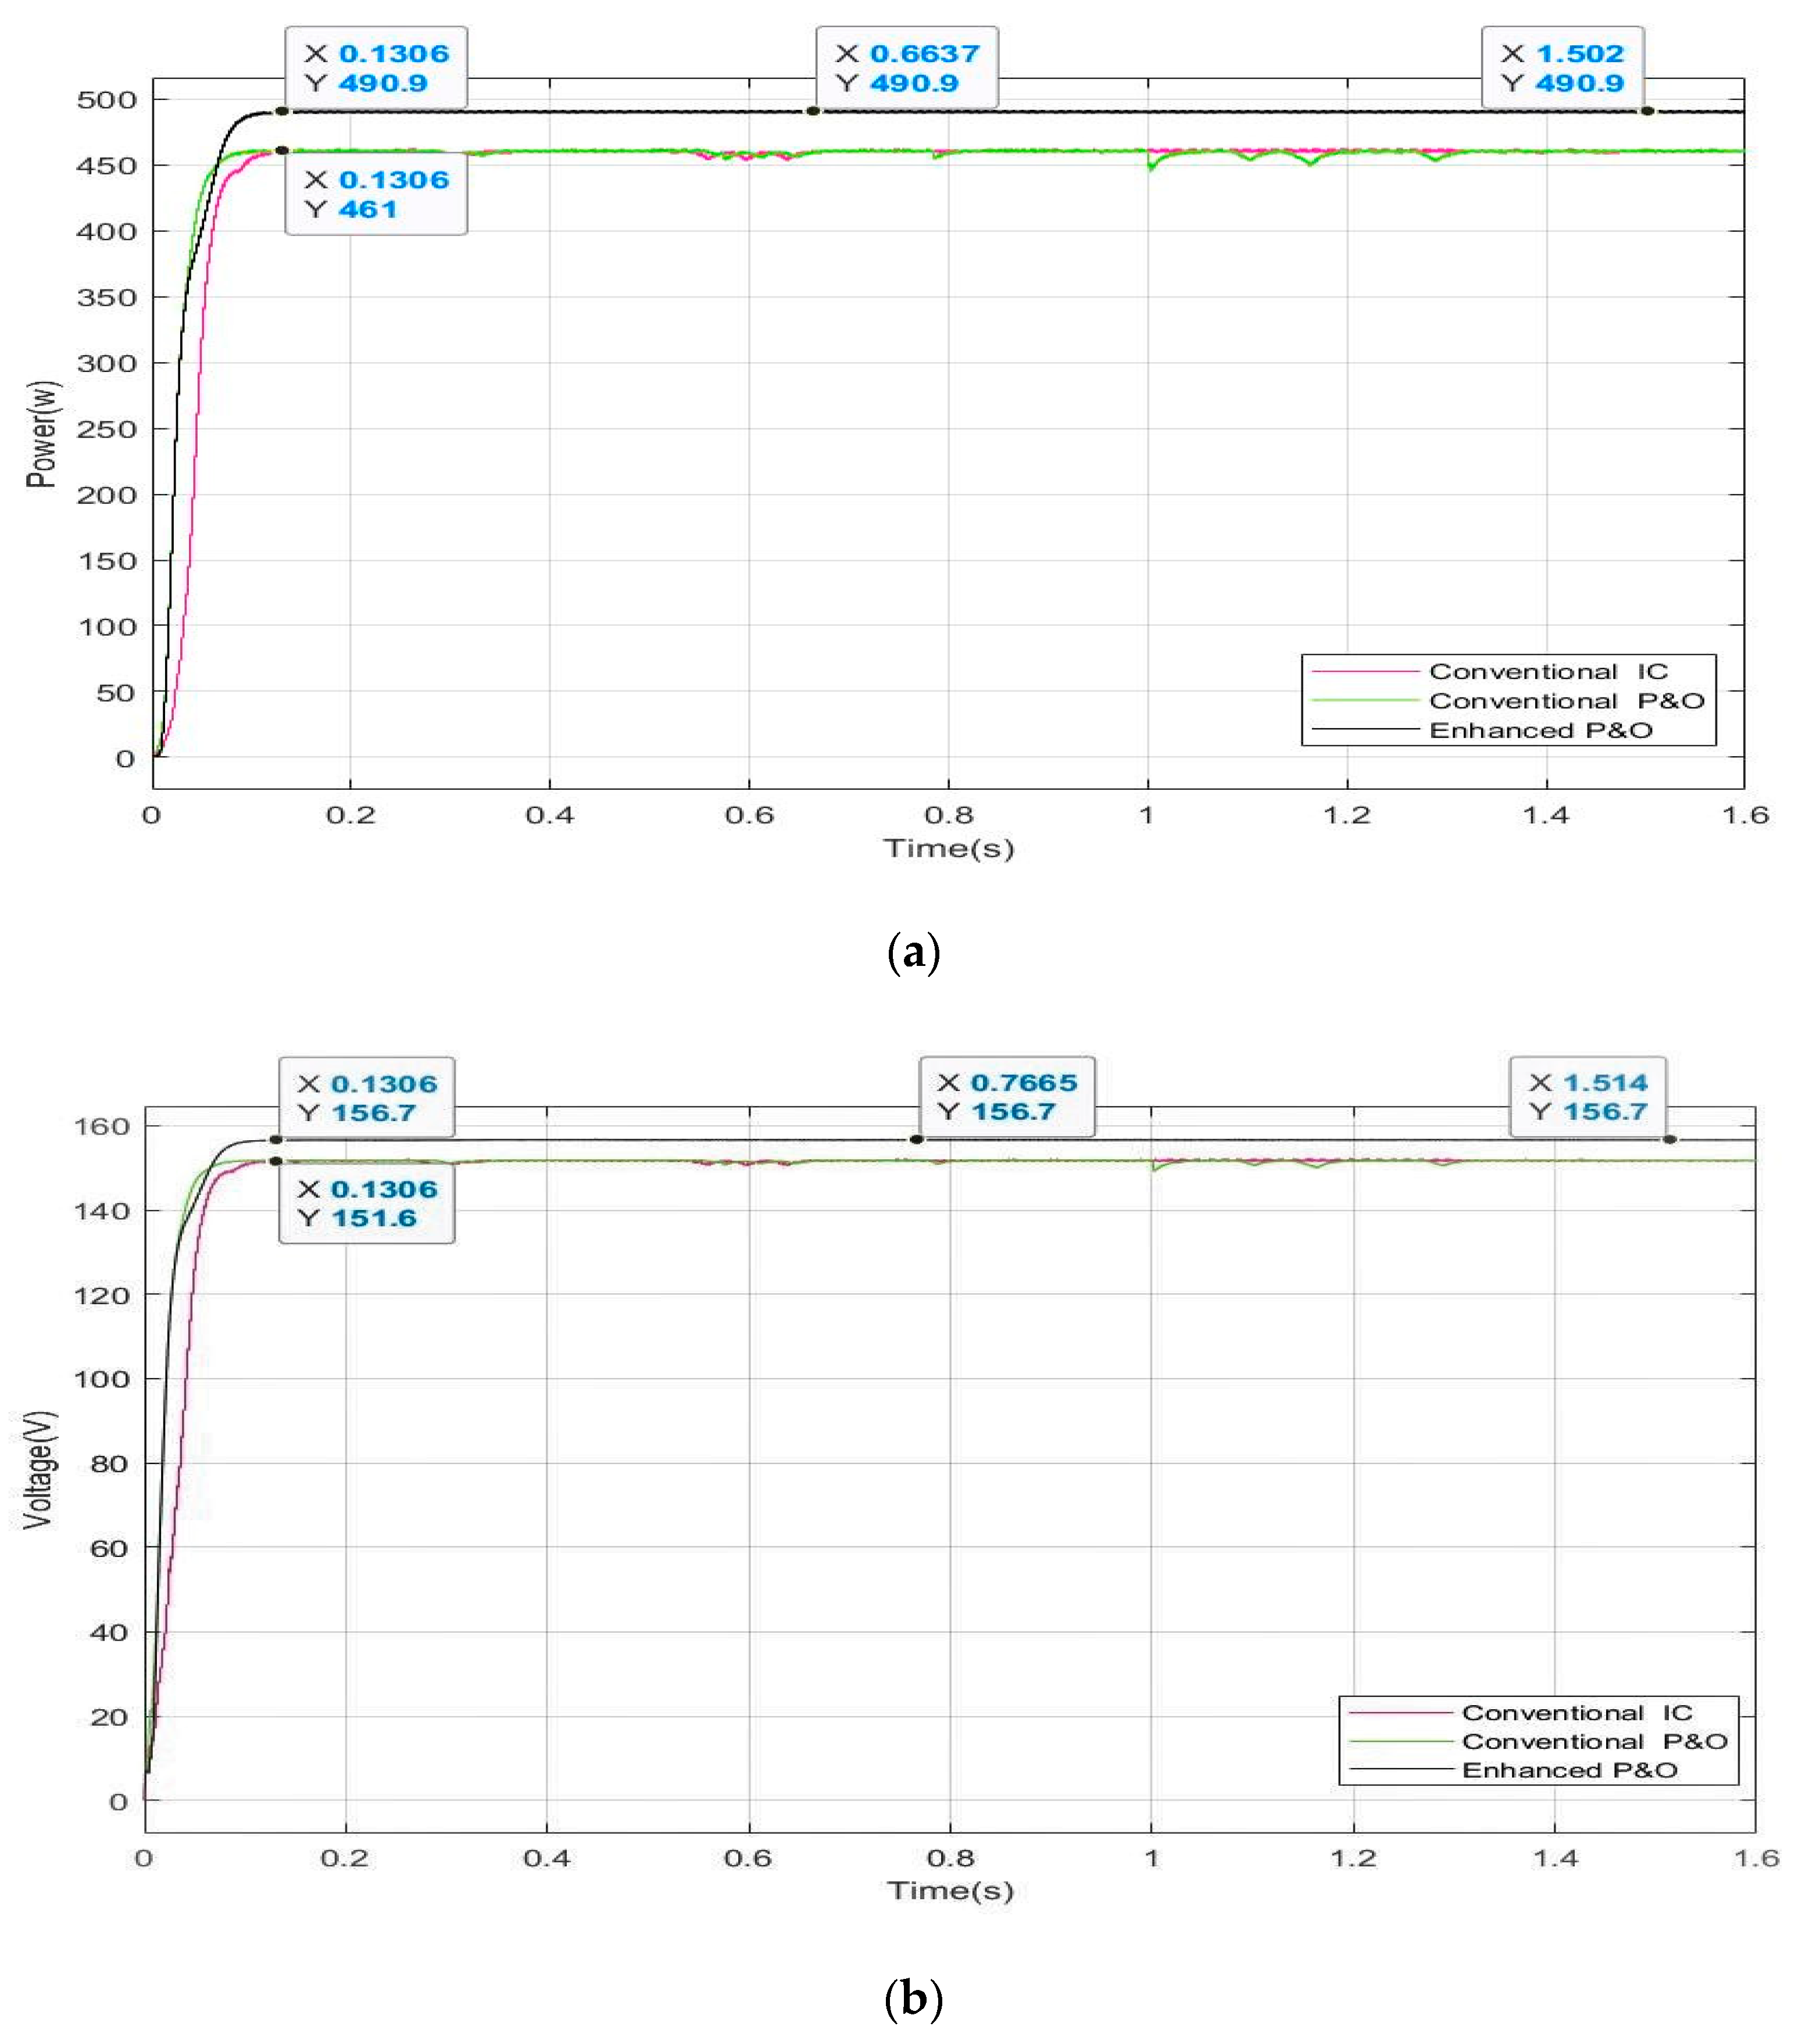
5.1. Case One: Weak Shading Pattern

In this case, six connected panels receive uniform radiation condition (1000 W/m2 radiation), while one receives 800 W/m2 and one receives 600 W/m2. The arrangement is illustrated in Table 2. Multiple maxima occur in the P–V characteristics. The location of the GMPP is shown in the characteristics in Figure 7. Figure 8 illustrates the simulation results for this case with a performance comparison between the proposed technique and the conventional P&O and IC techniques.

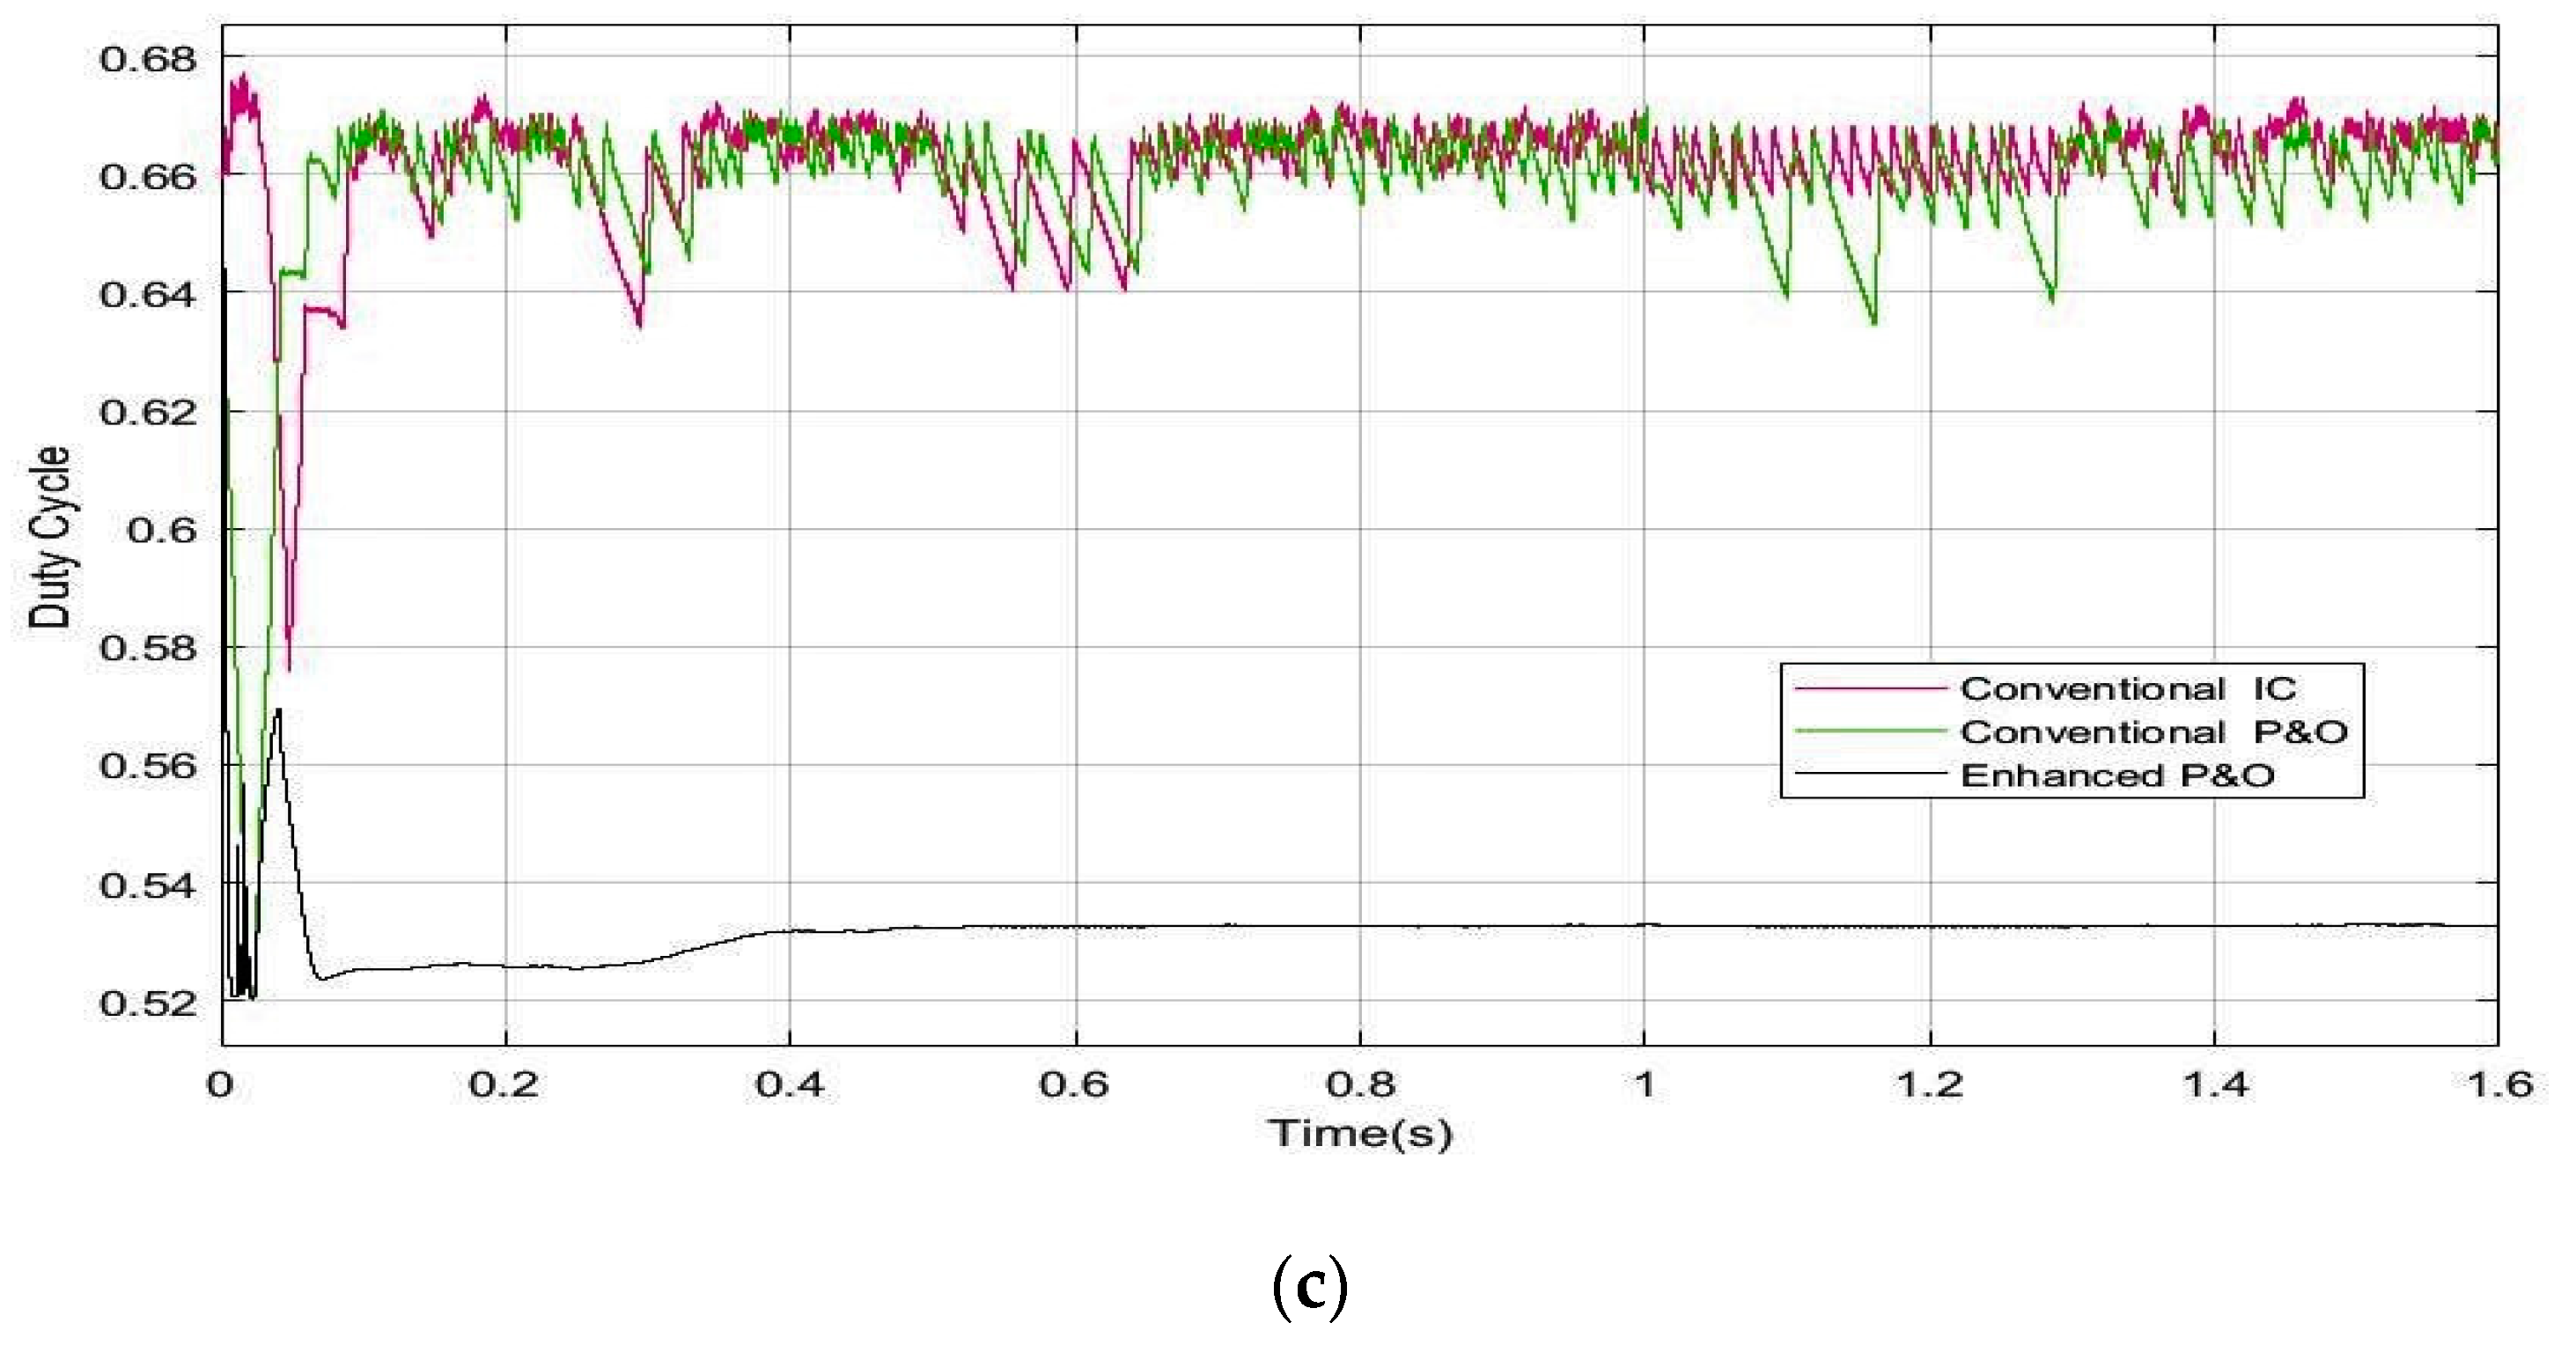
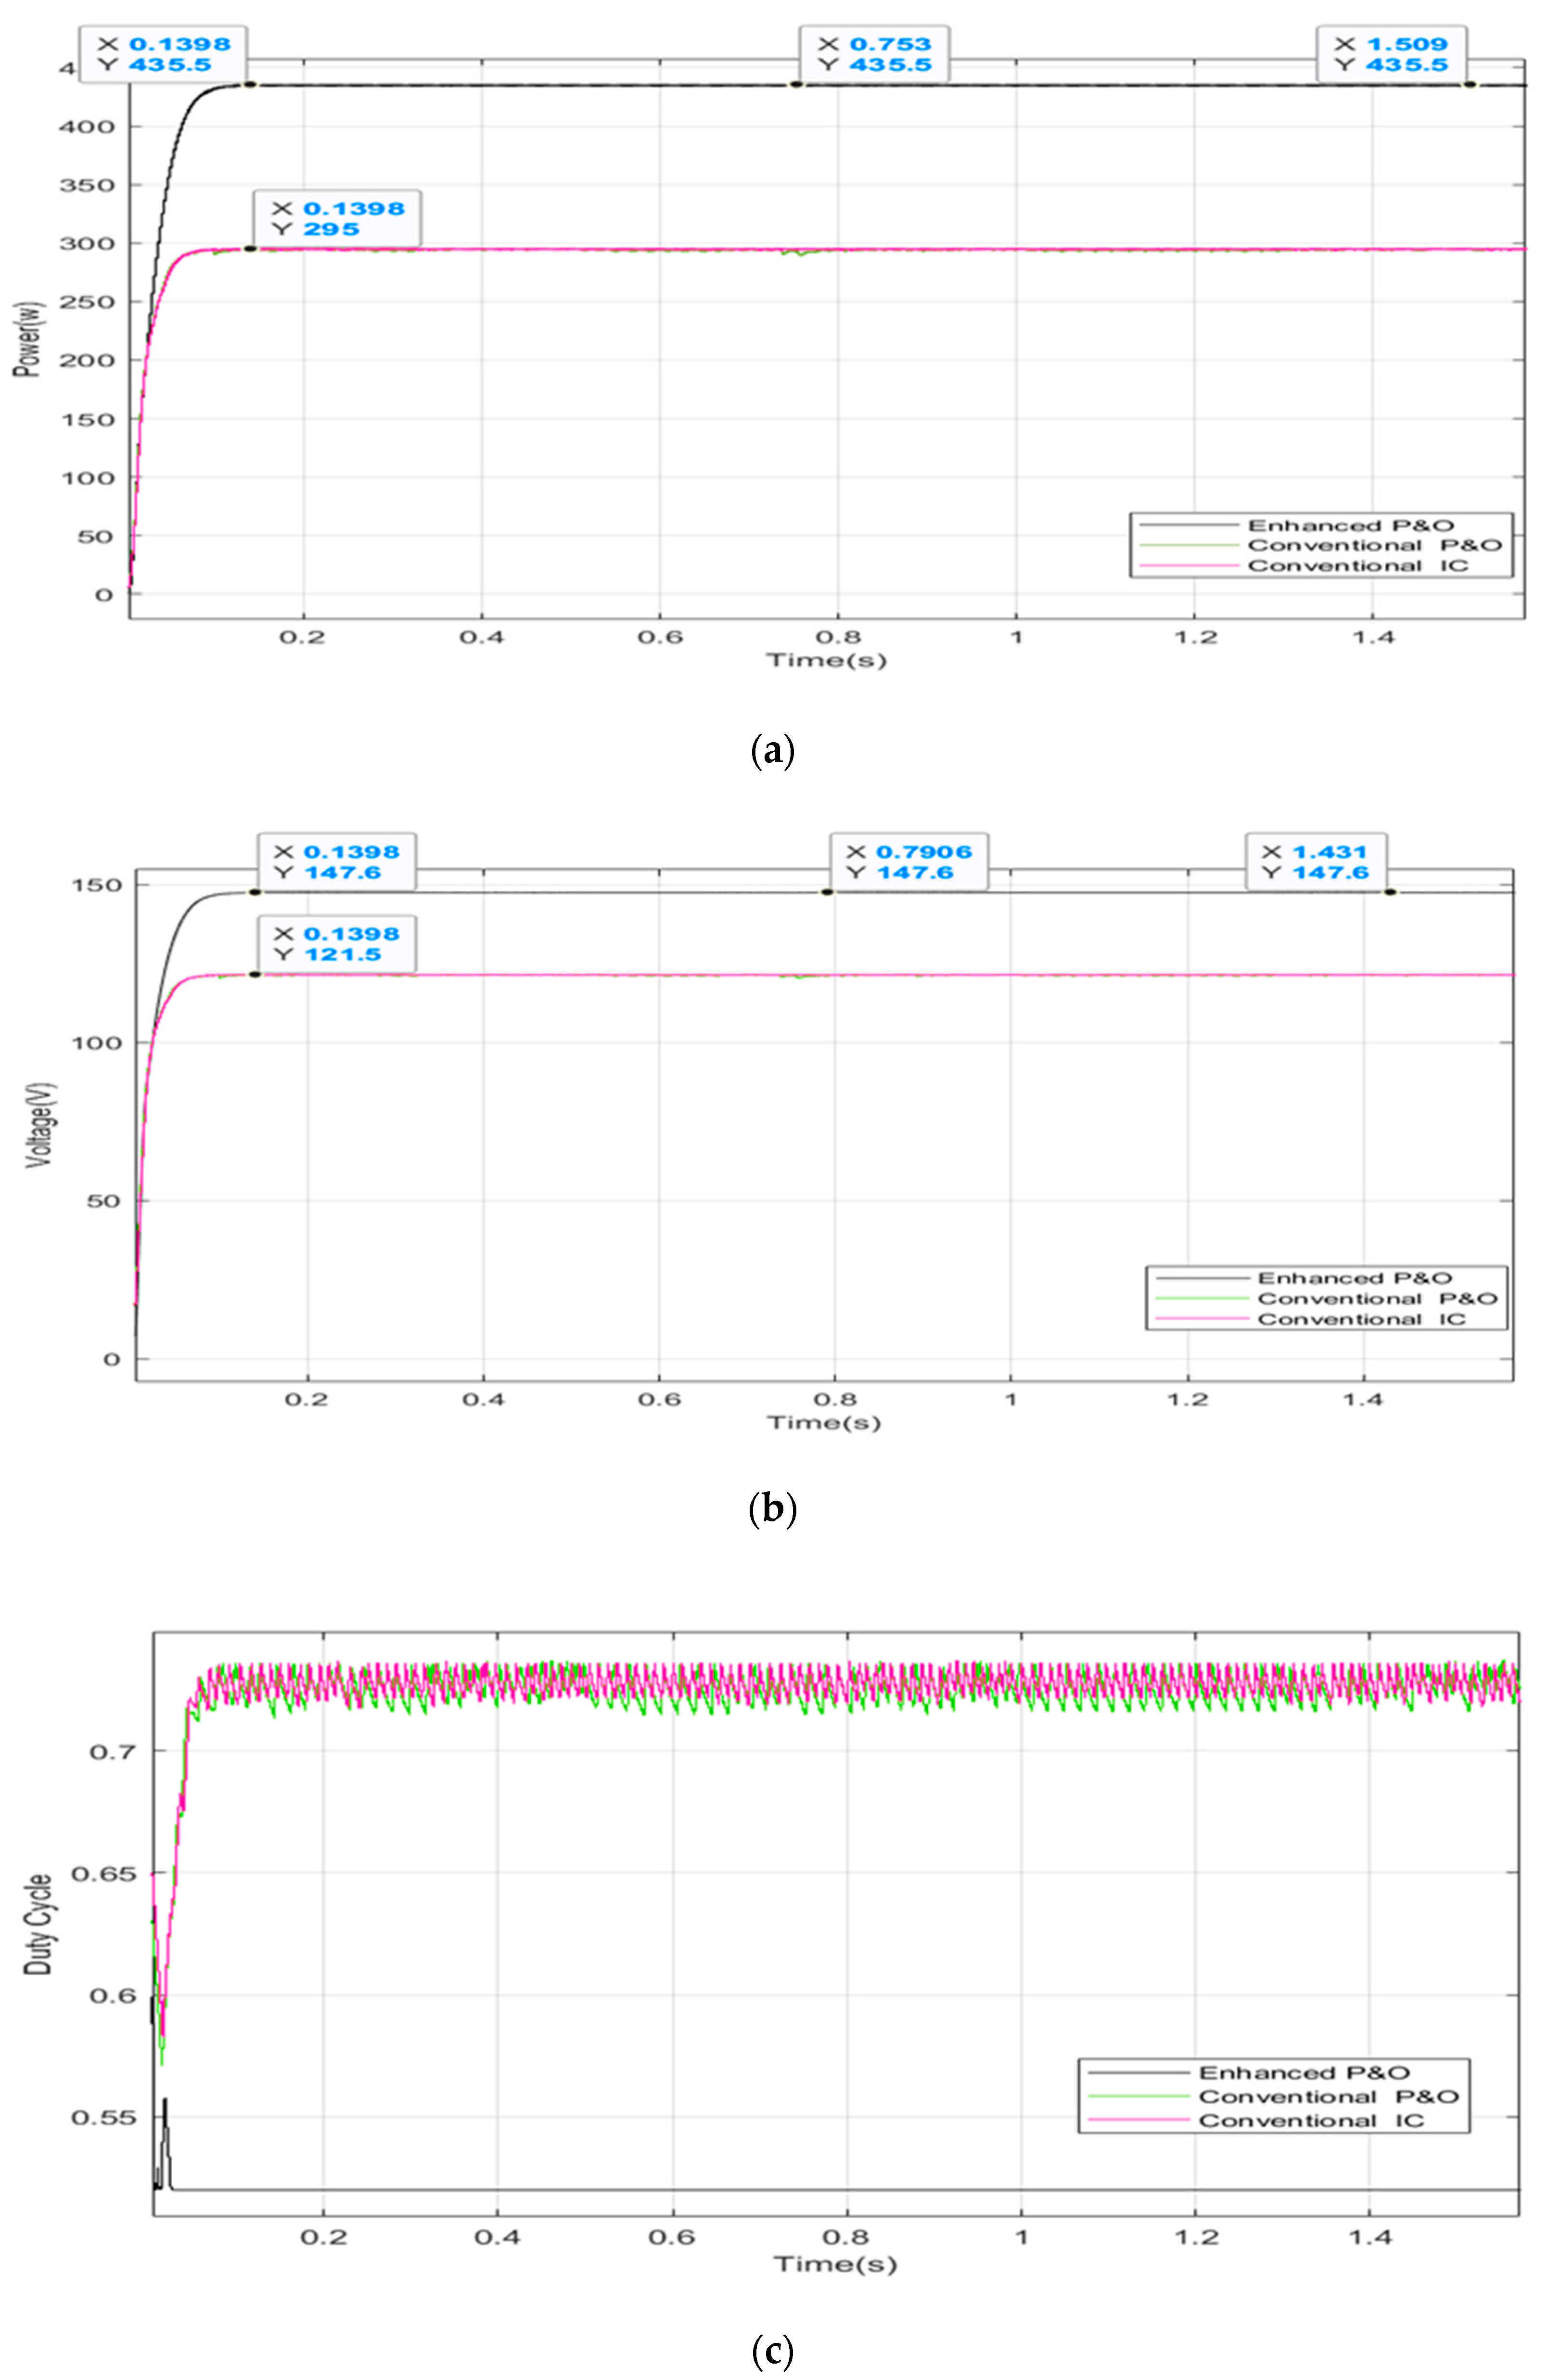
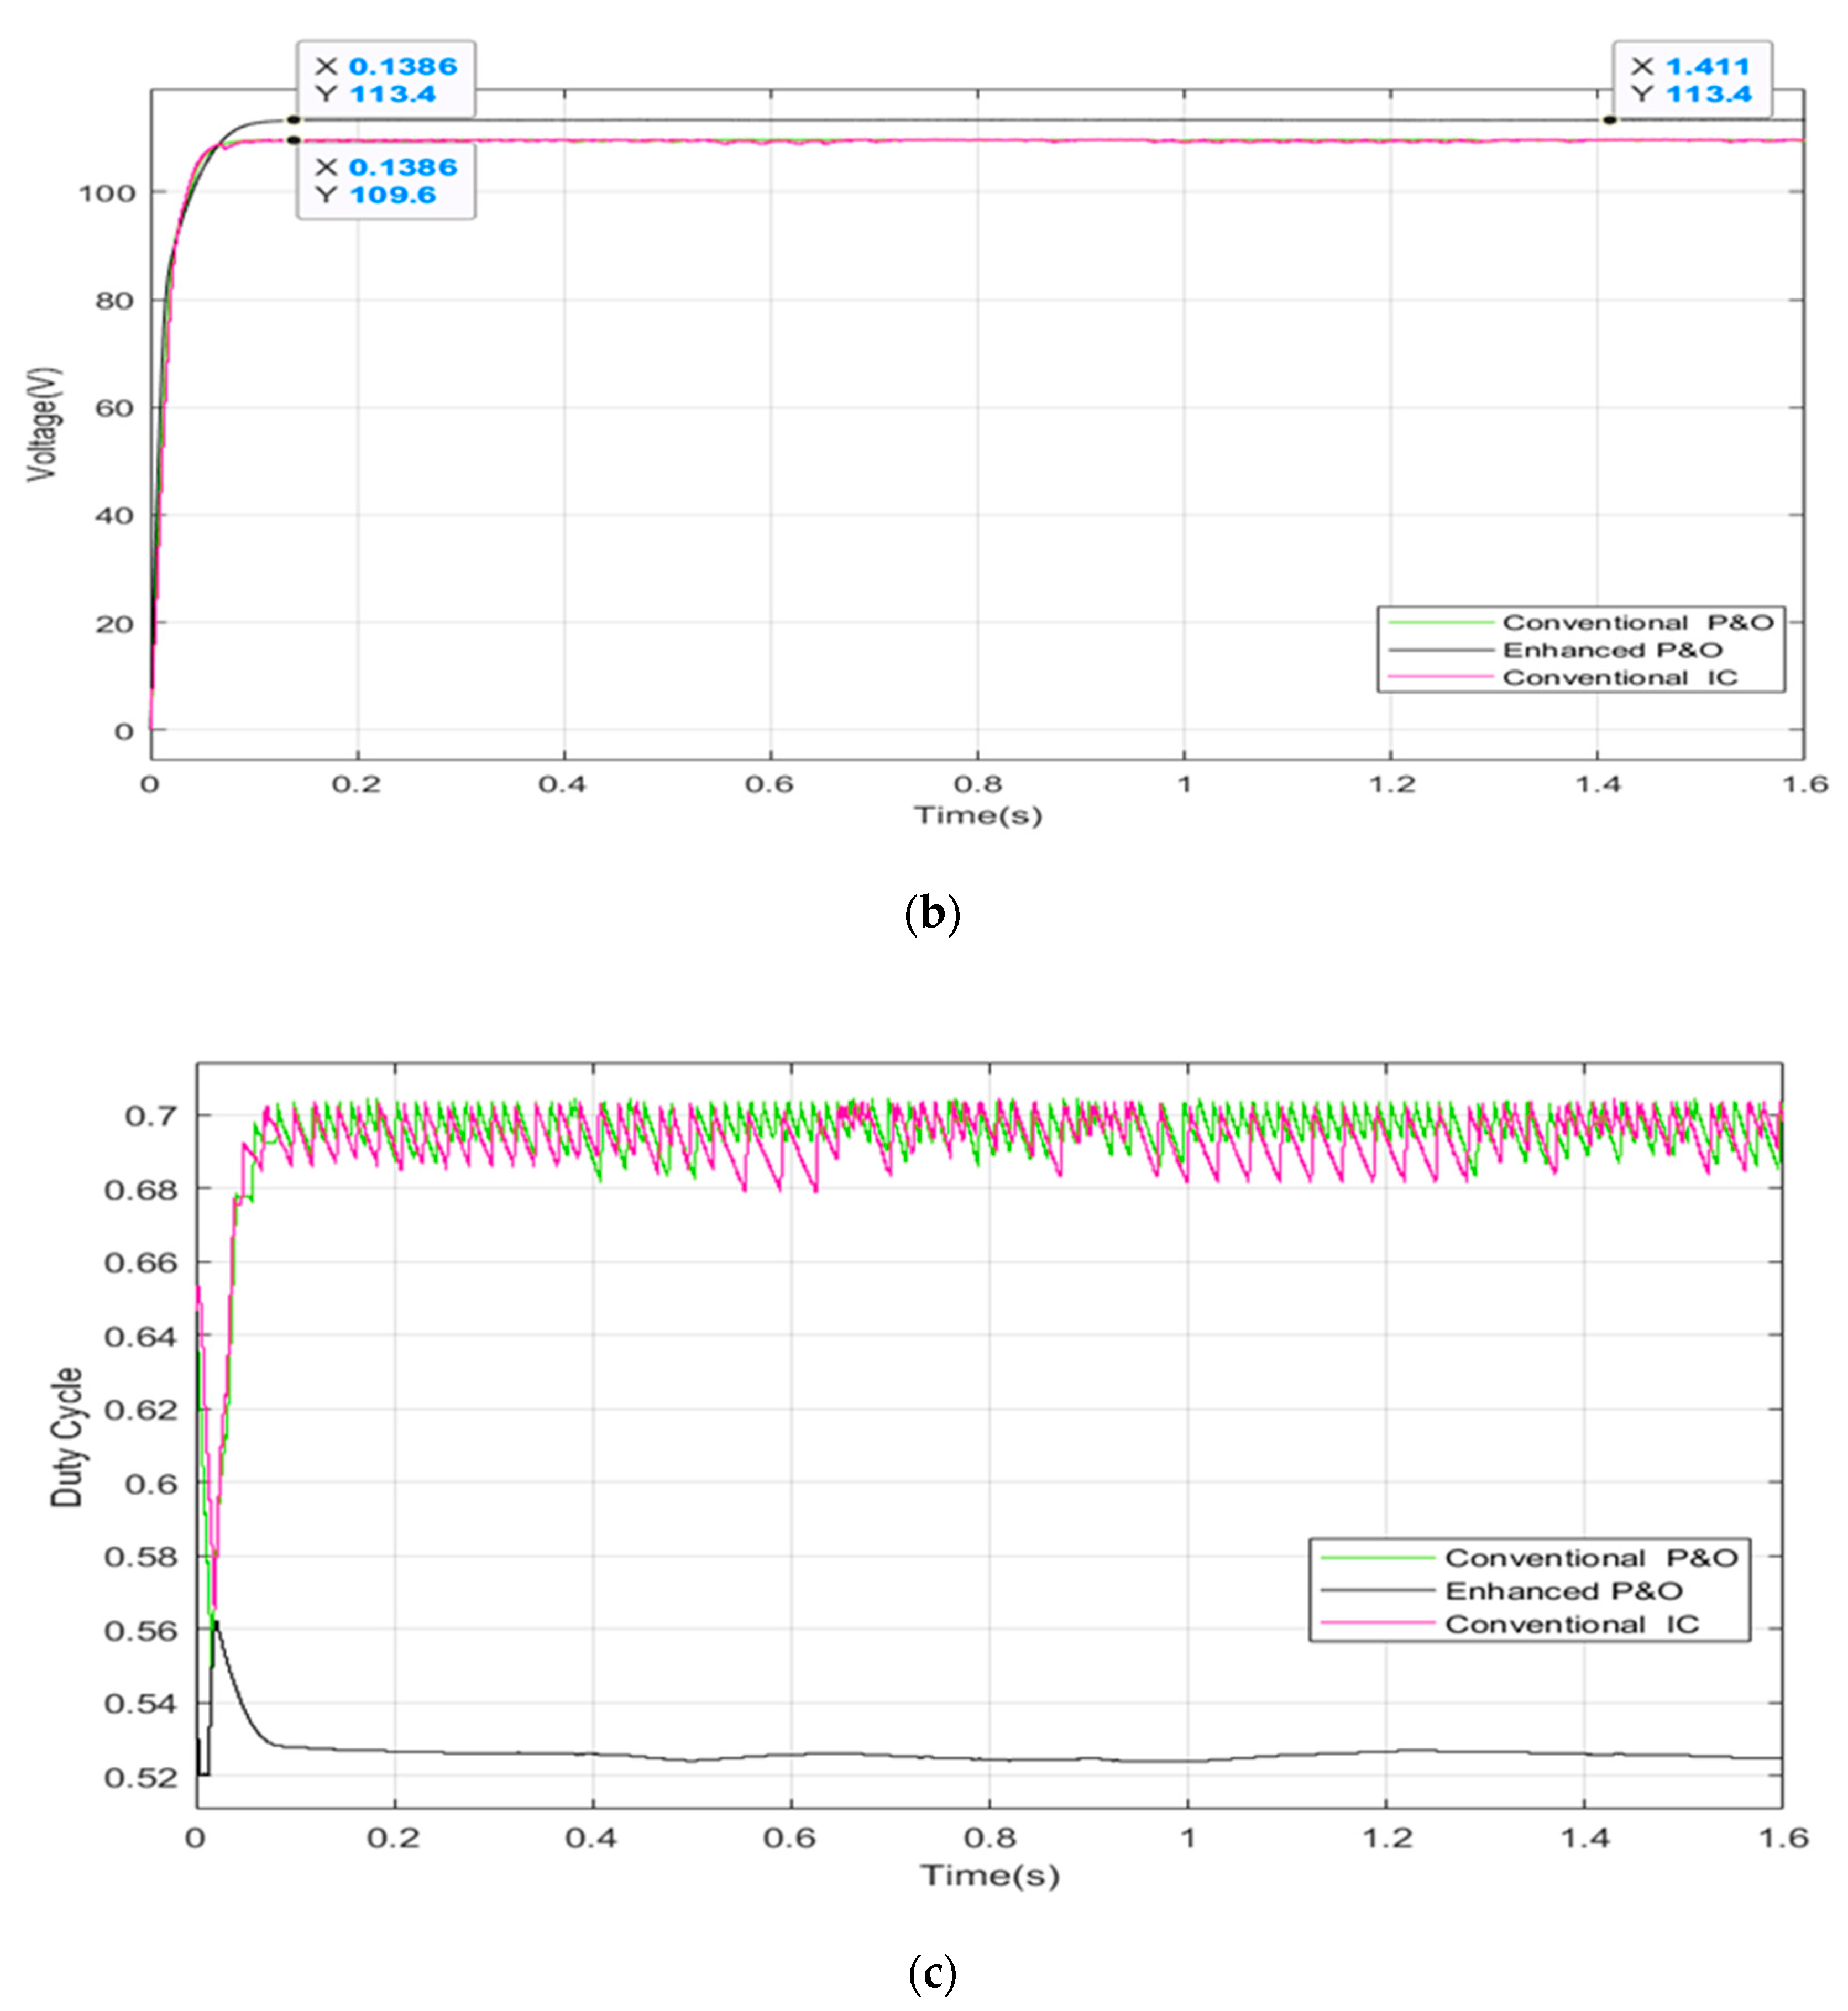
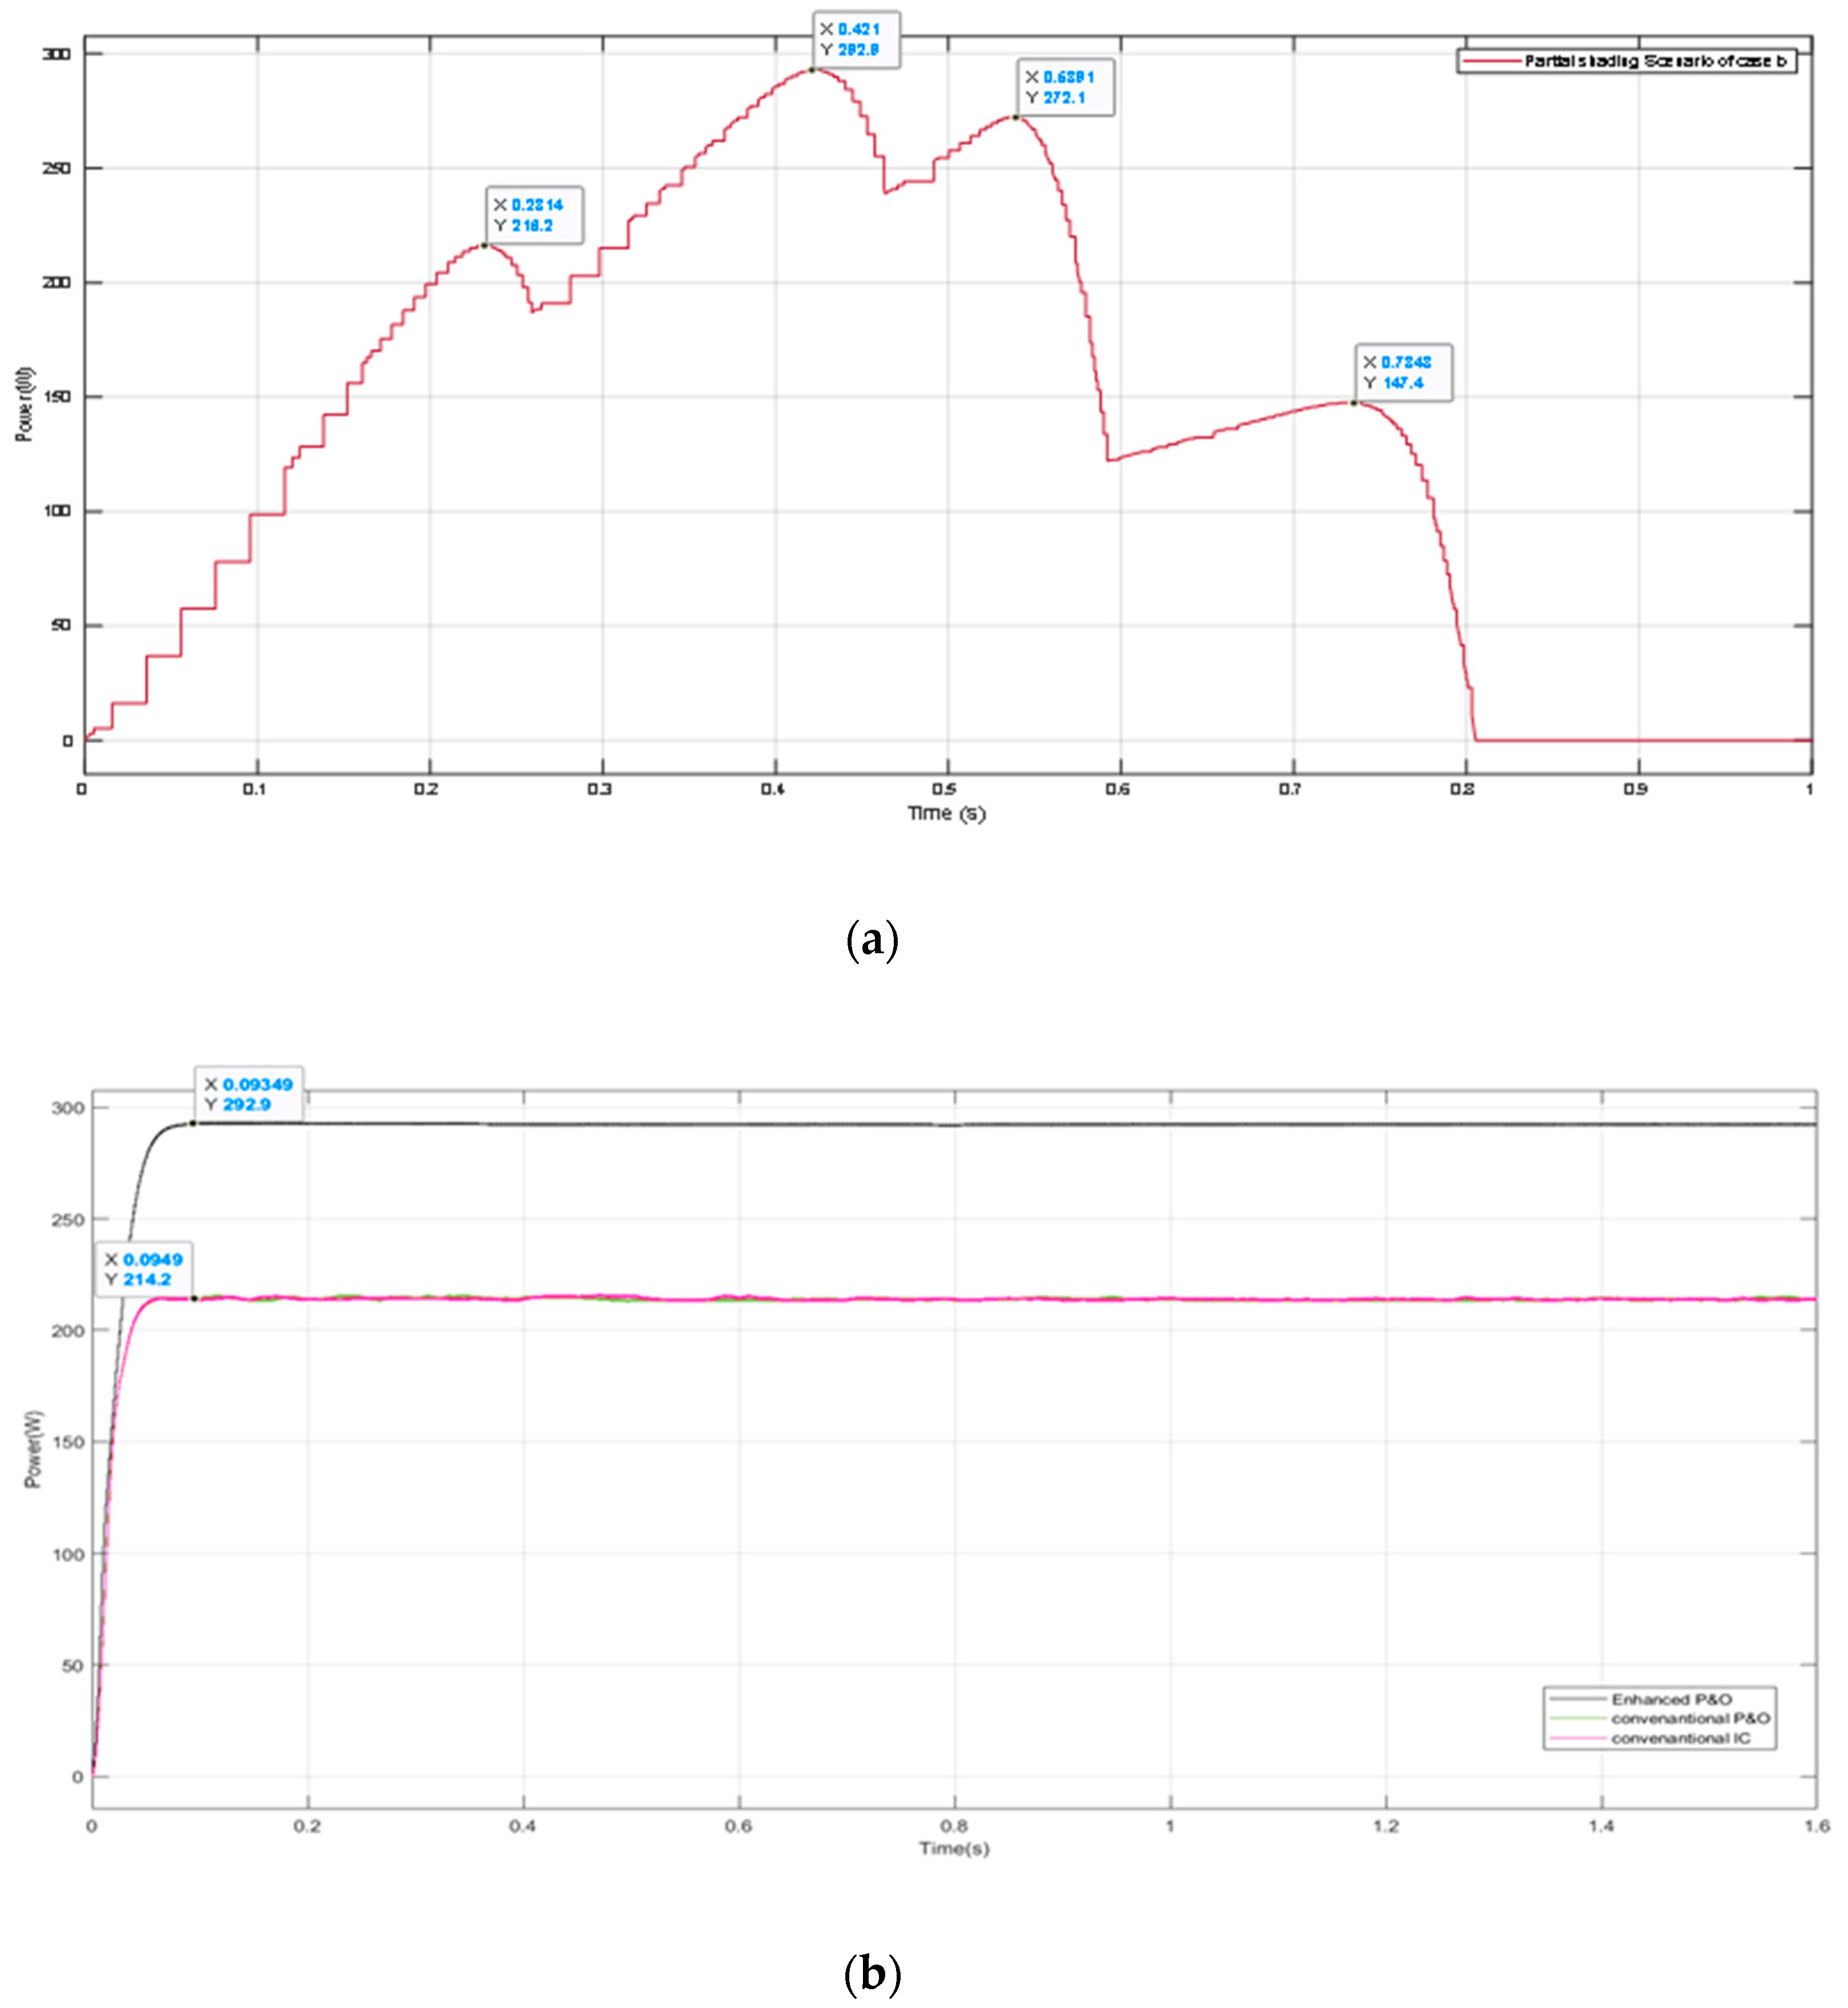
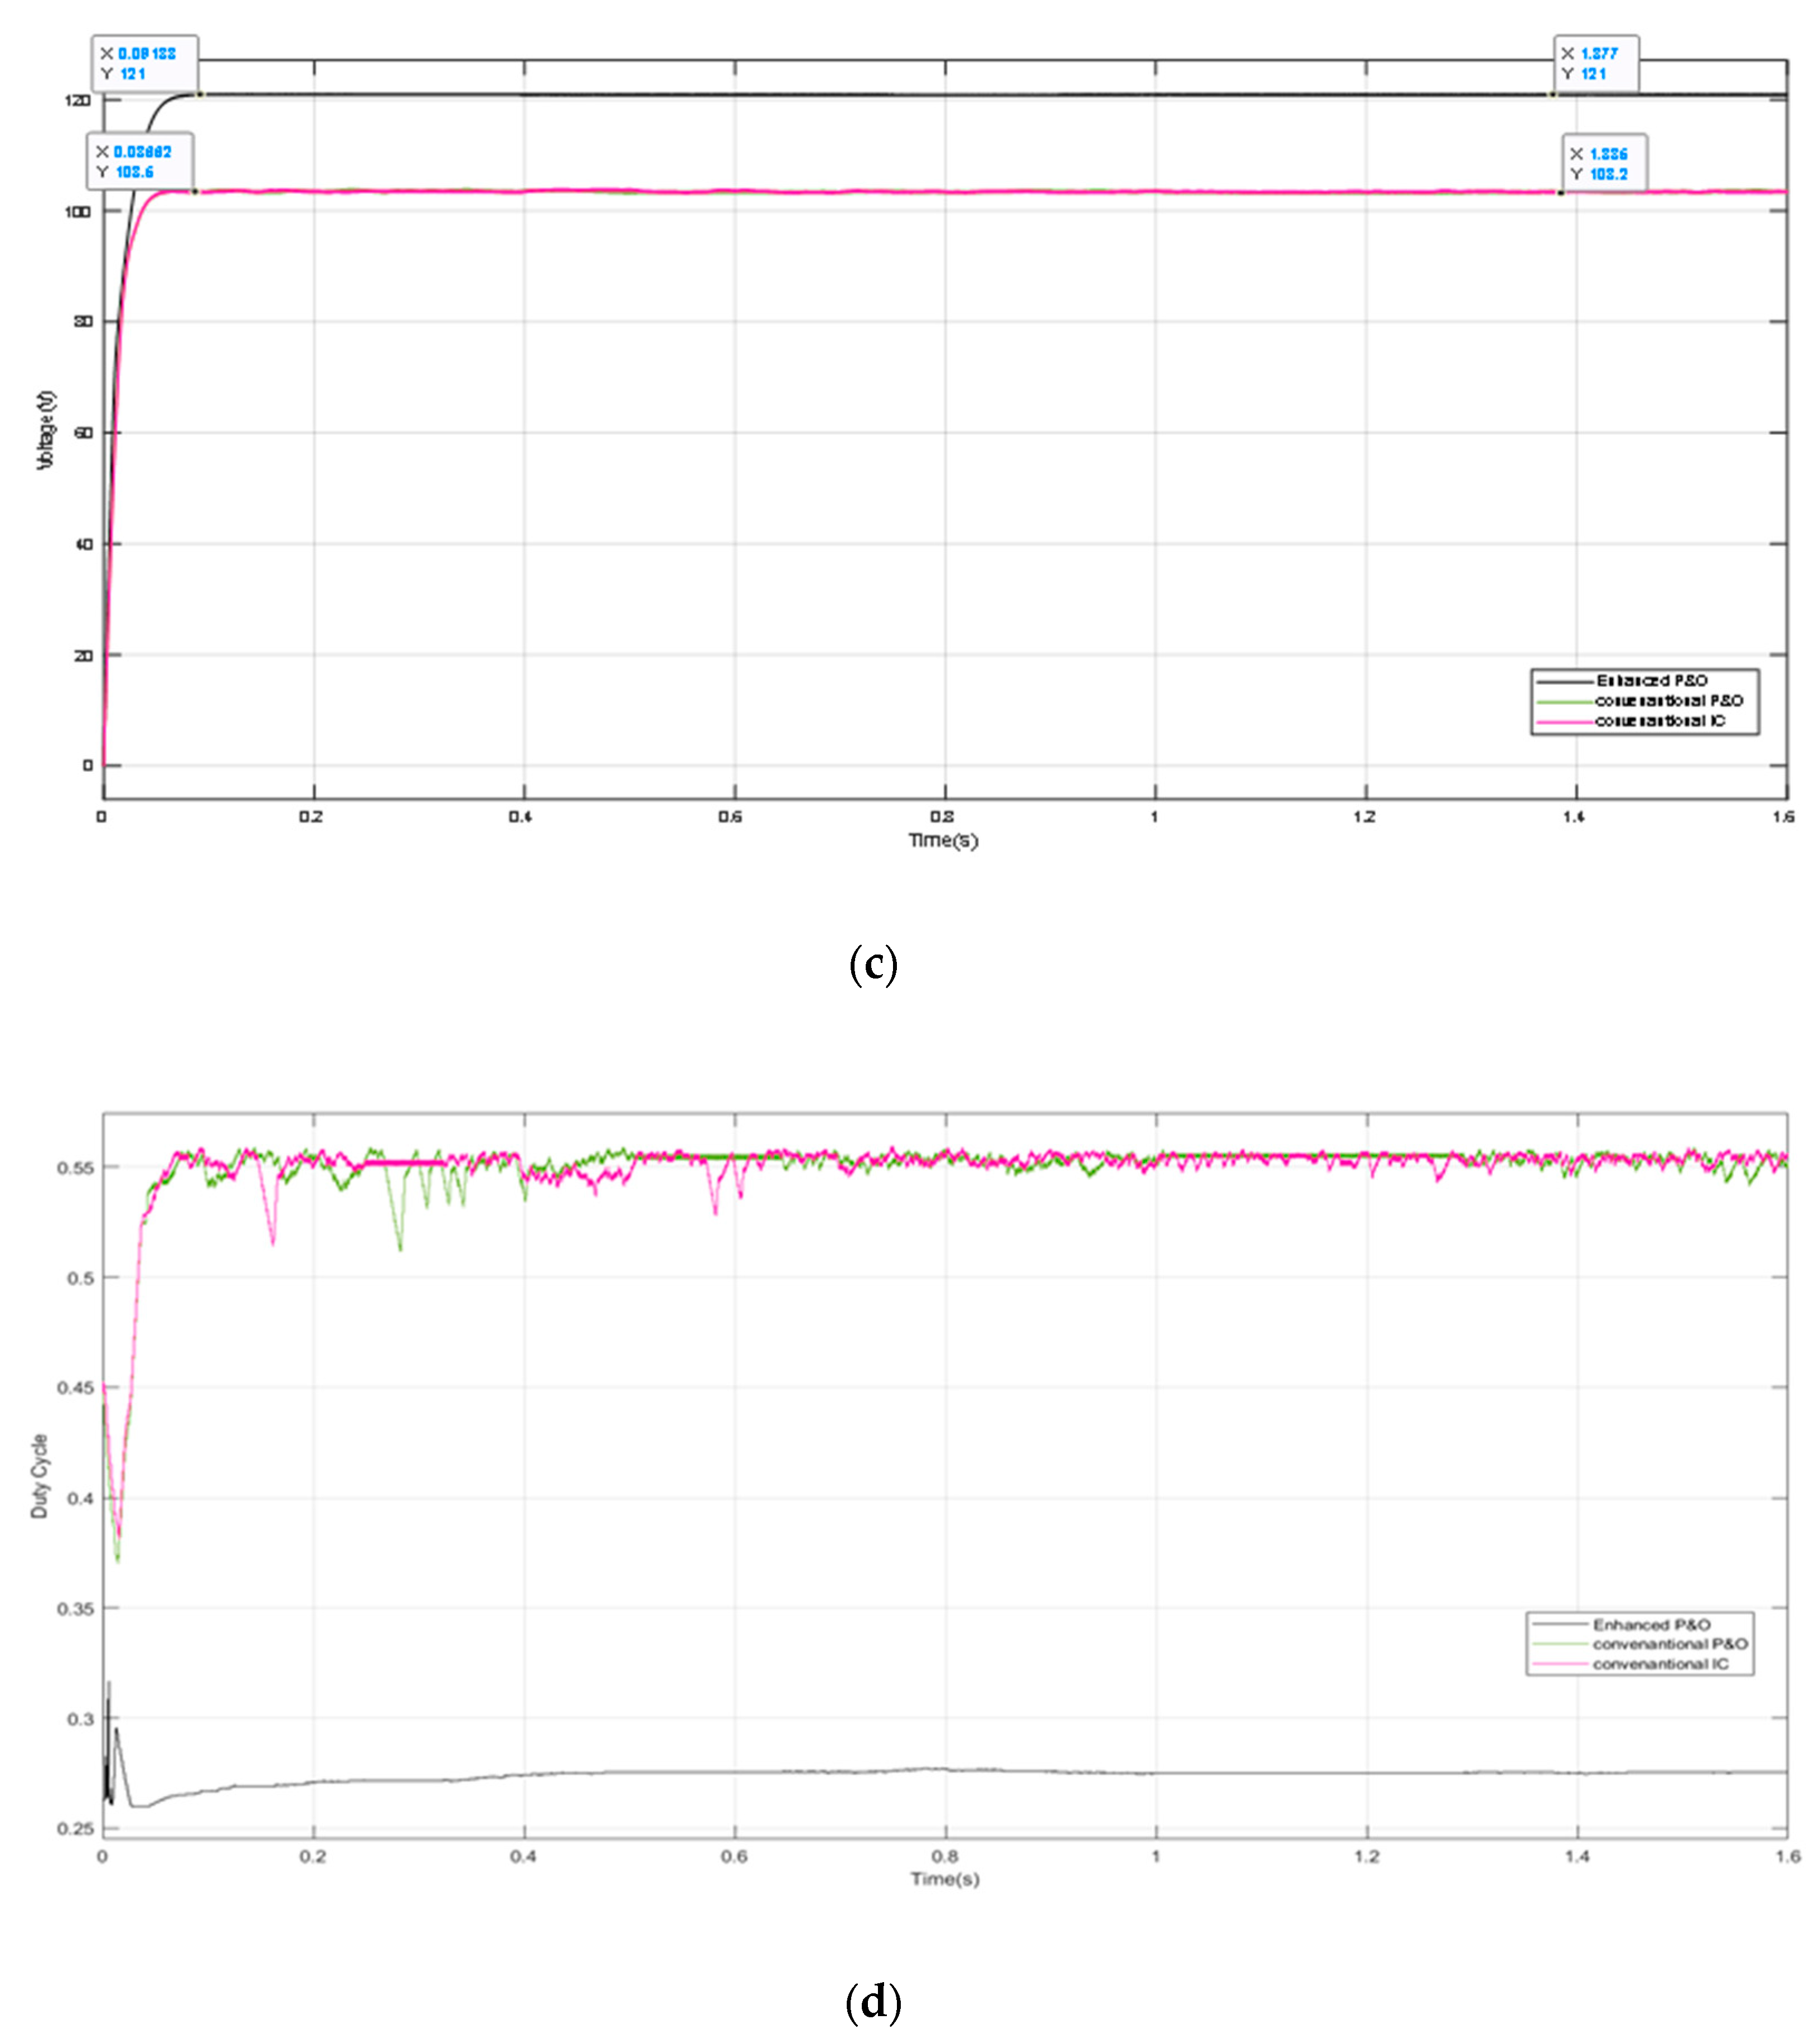
5.2. Case Two: Moderate Partial Shading Pattern

In this case, four connected panels receive uniform radiation conditions (1000 W/m2 radiation), while two receive 800 W/m2 and two receive 500 W/m2. The arrangement is illustrated in Table 2. Multiple maxima occur in the P–V characteristics. The location of the GMPP is shown in the characteristics in Figure 9. Figure 10 illustrates the simulation results for this case with a performance comparison between the proposed technique and the conventional P&O and IC techniques.

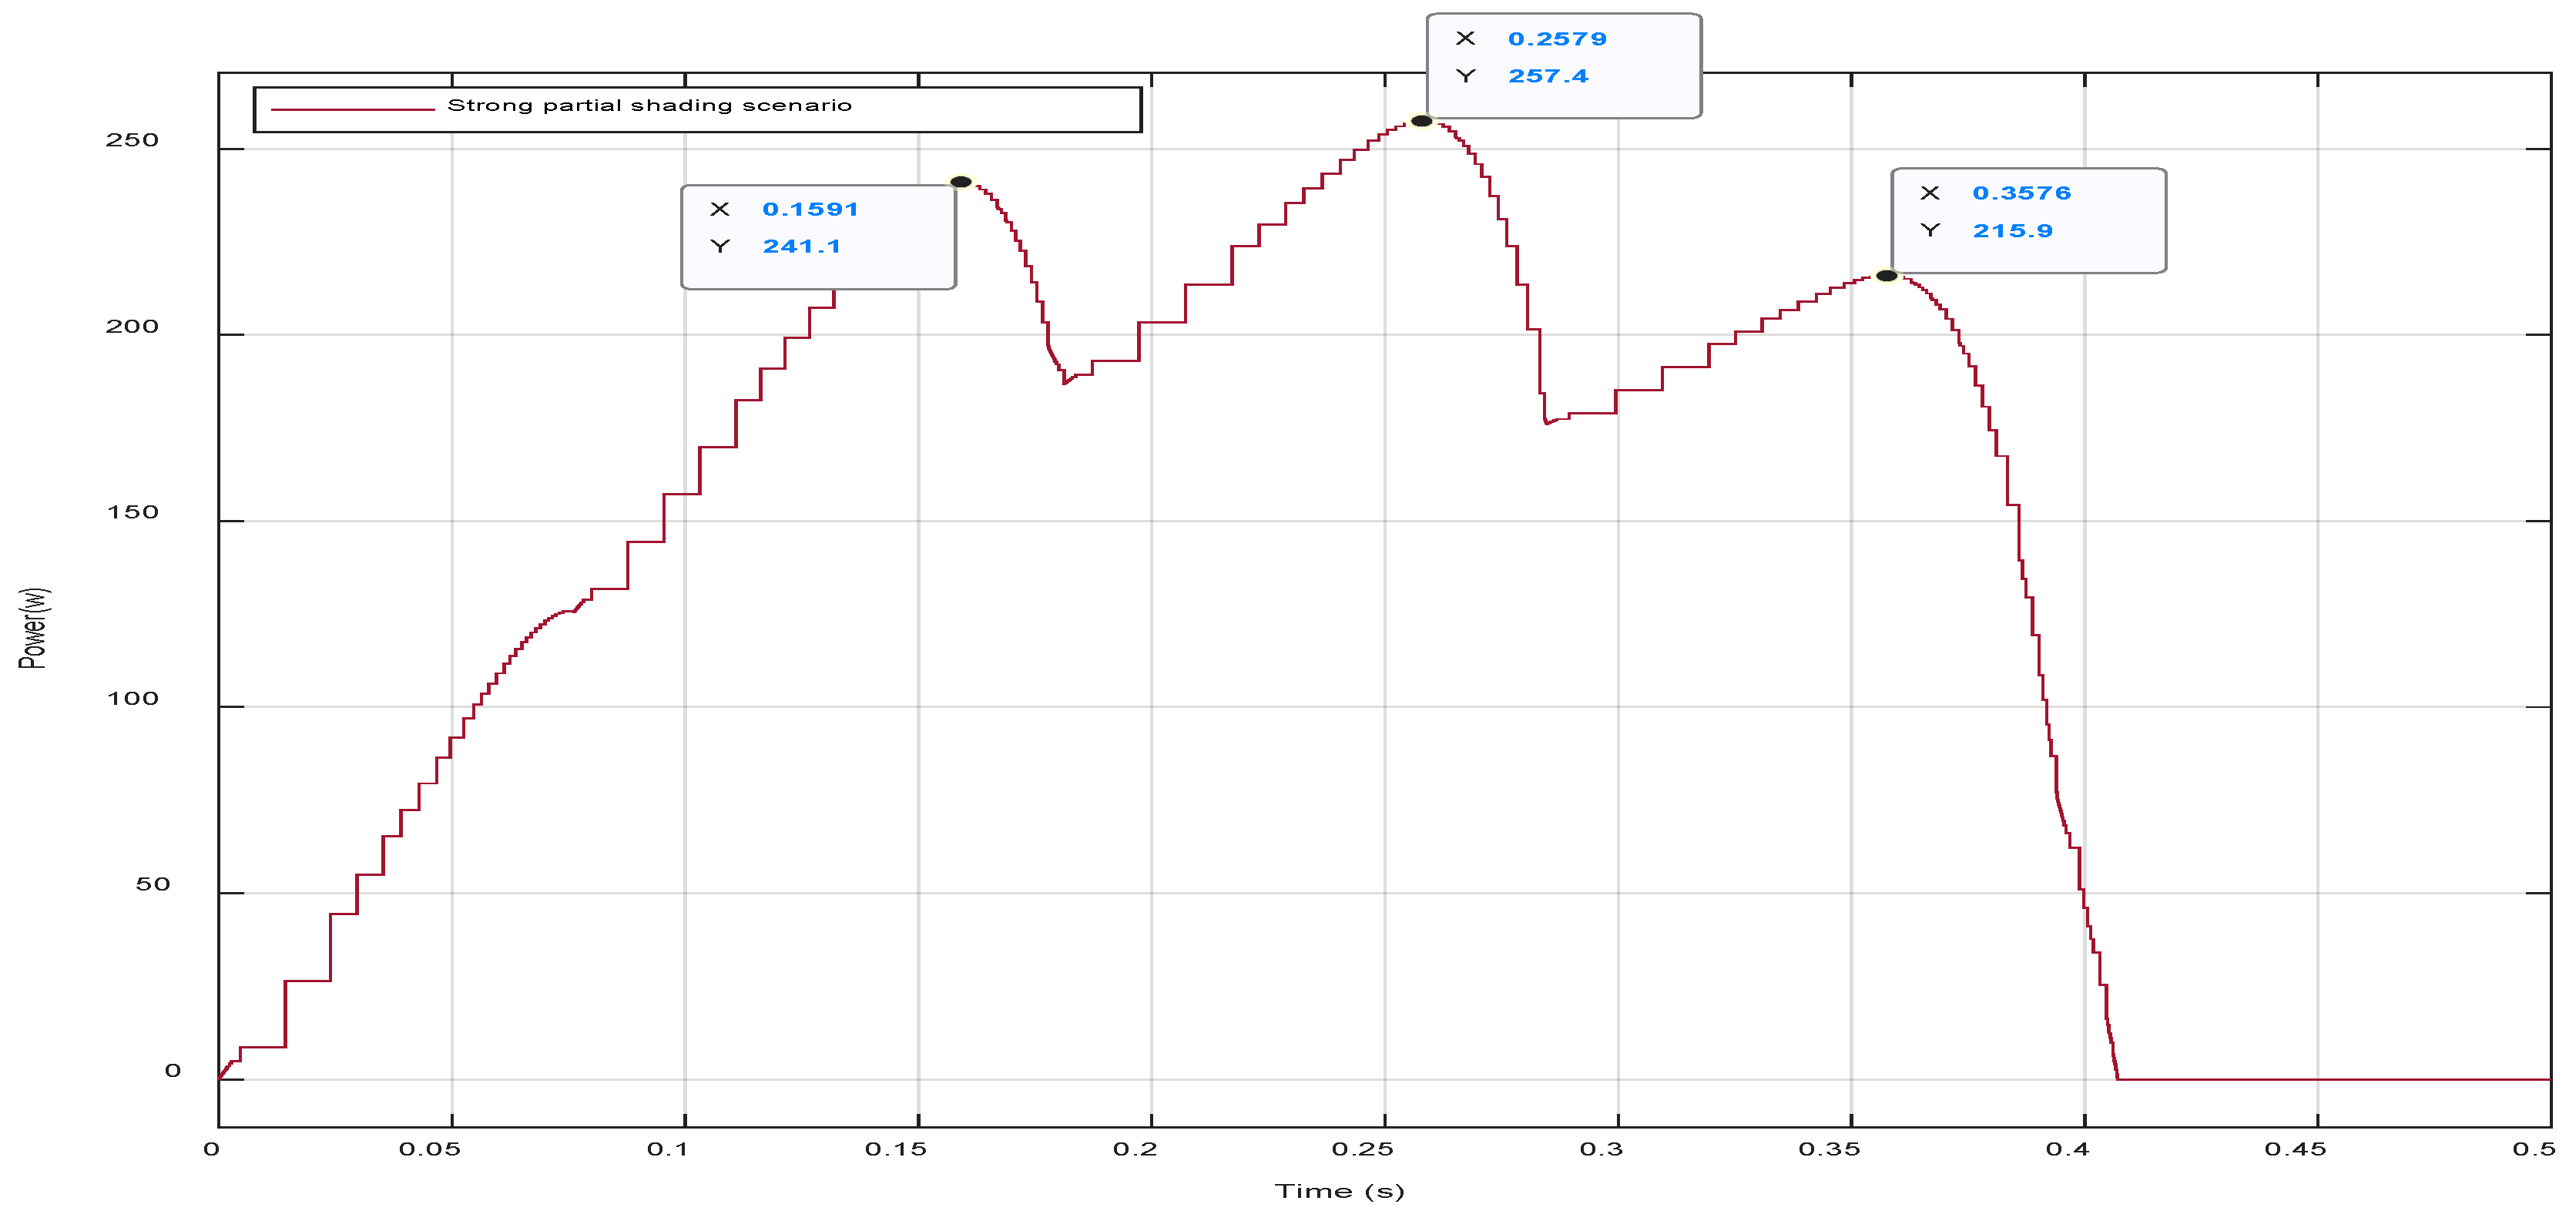
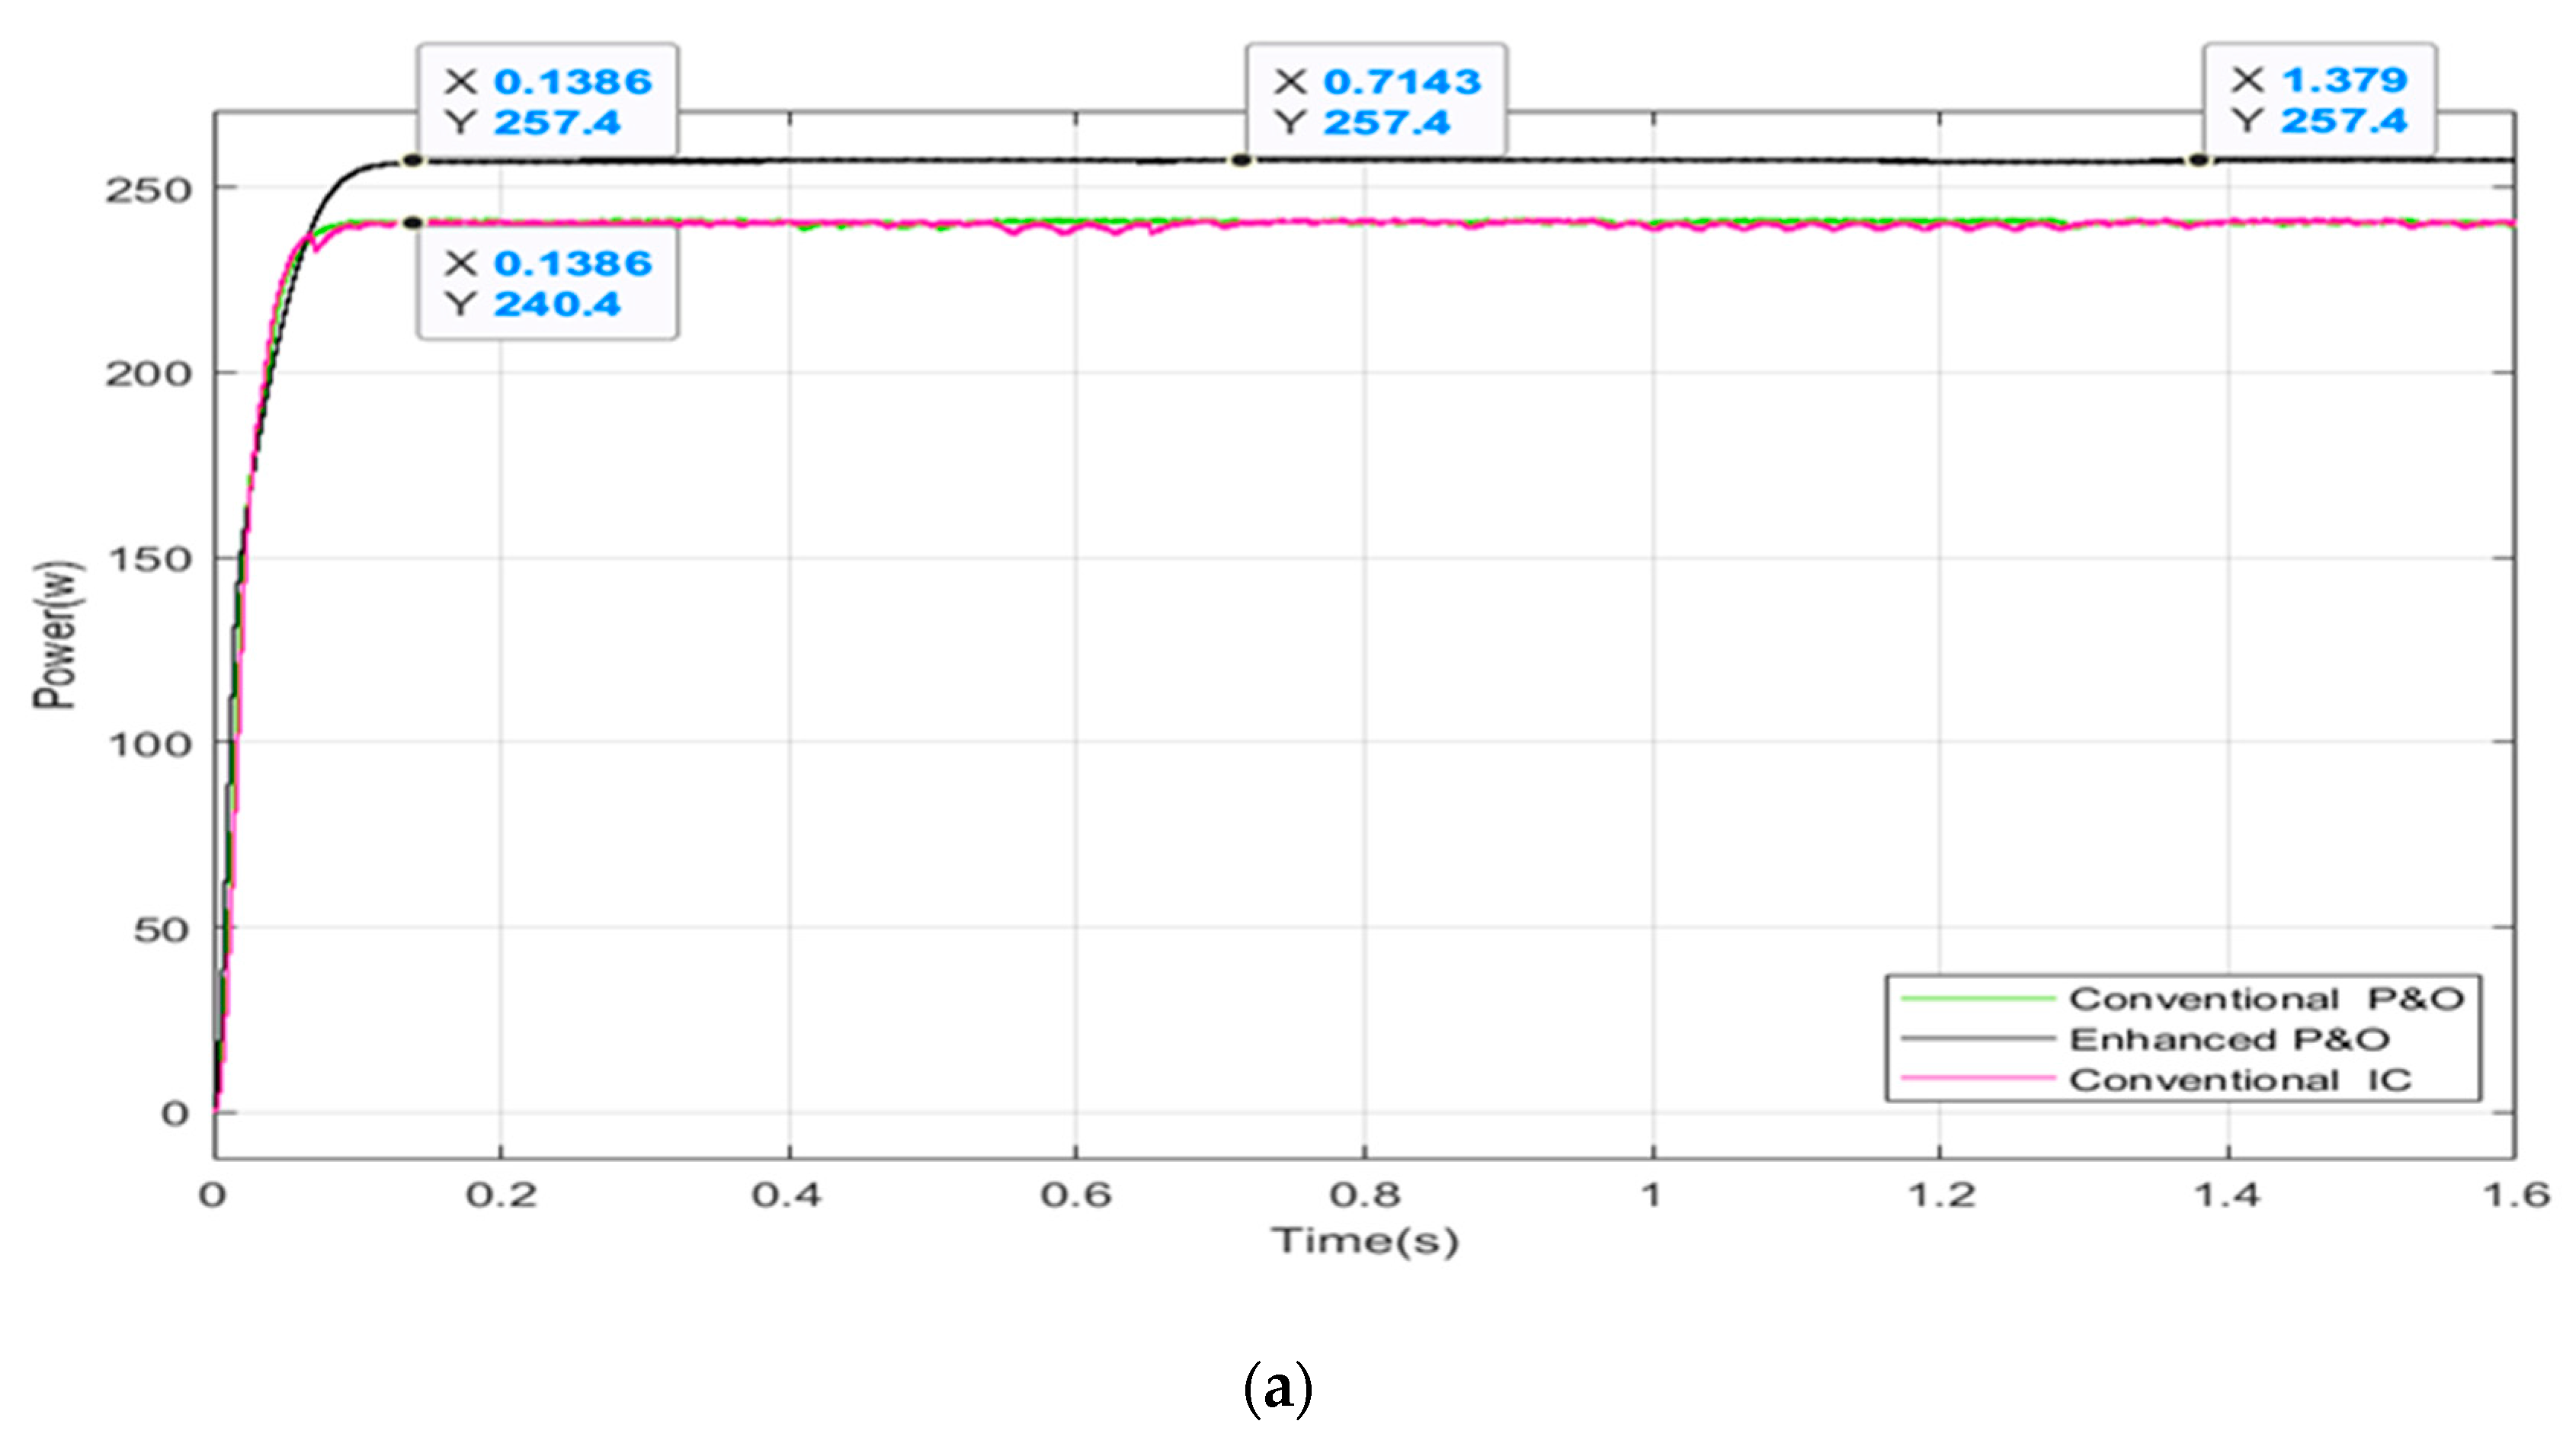
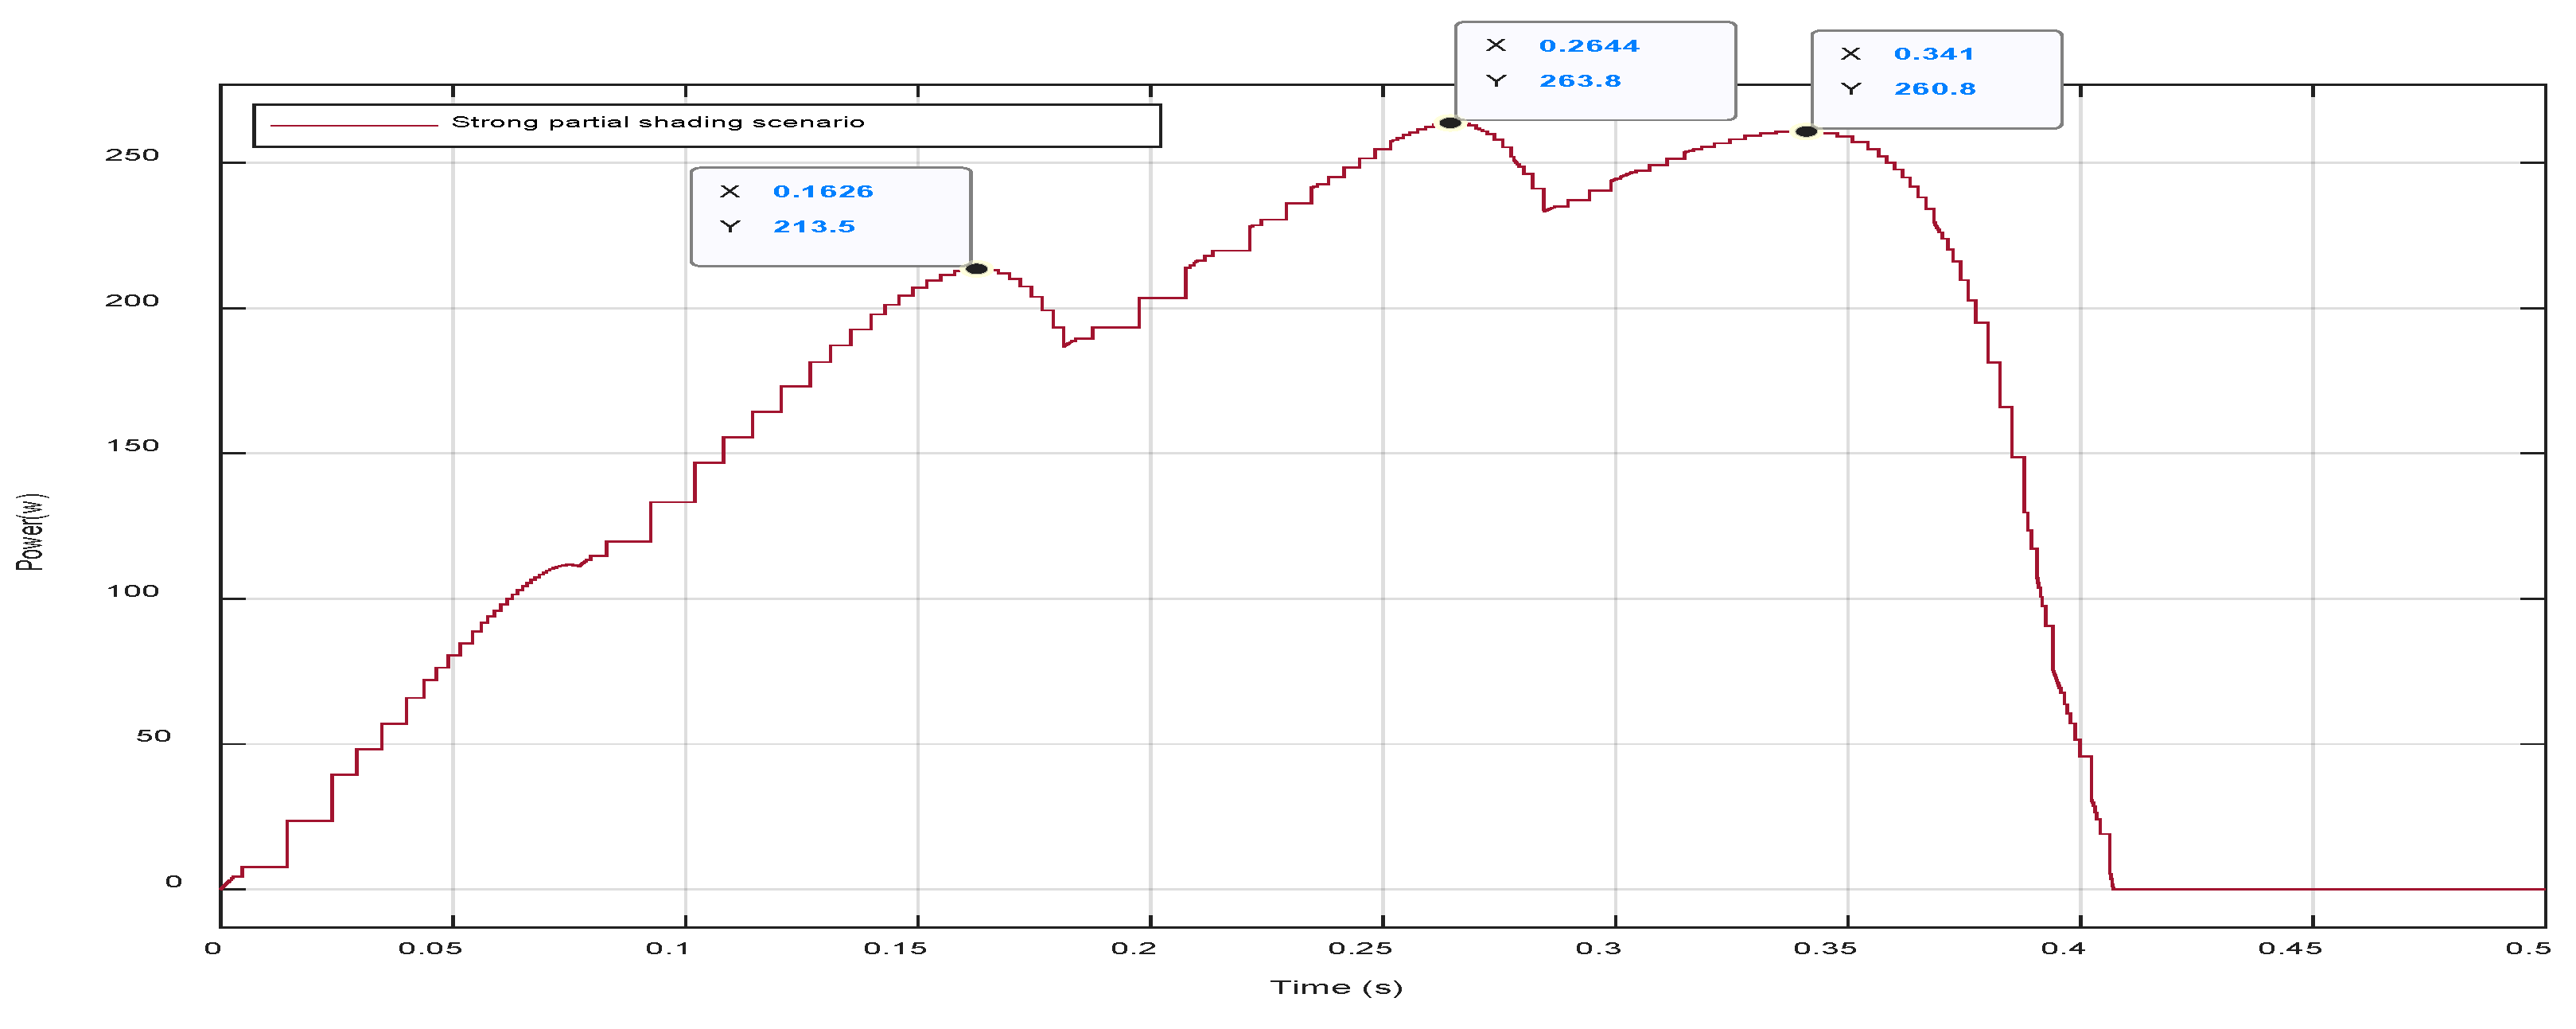
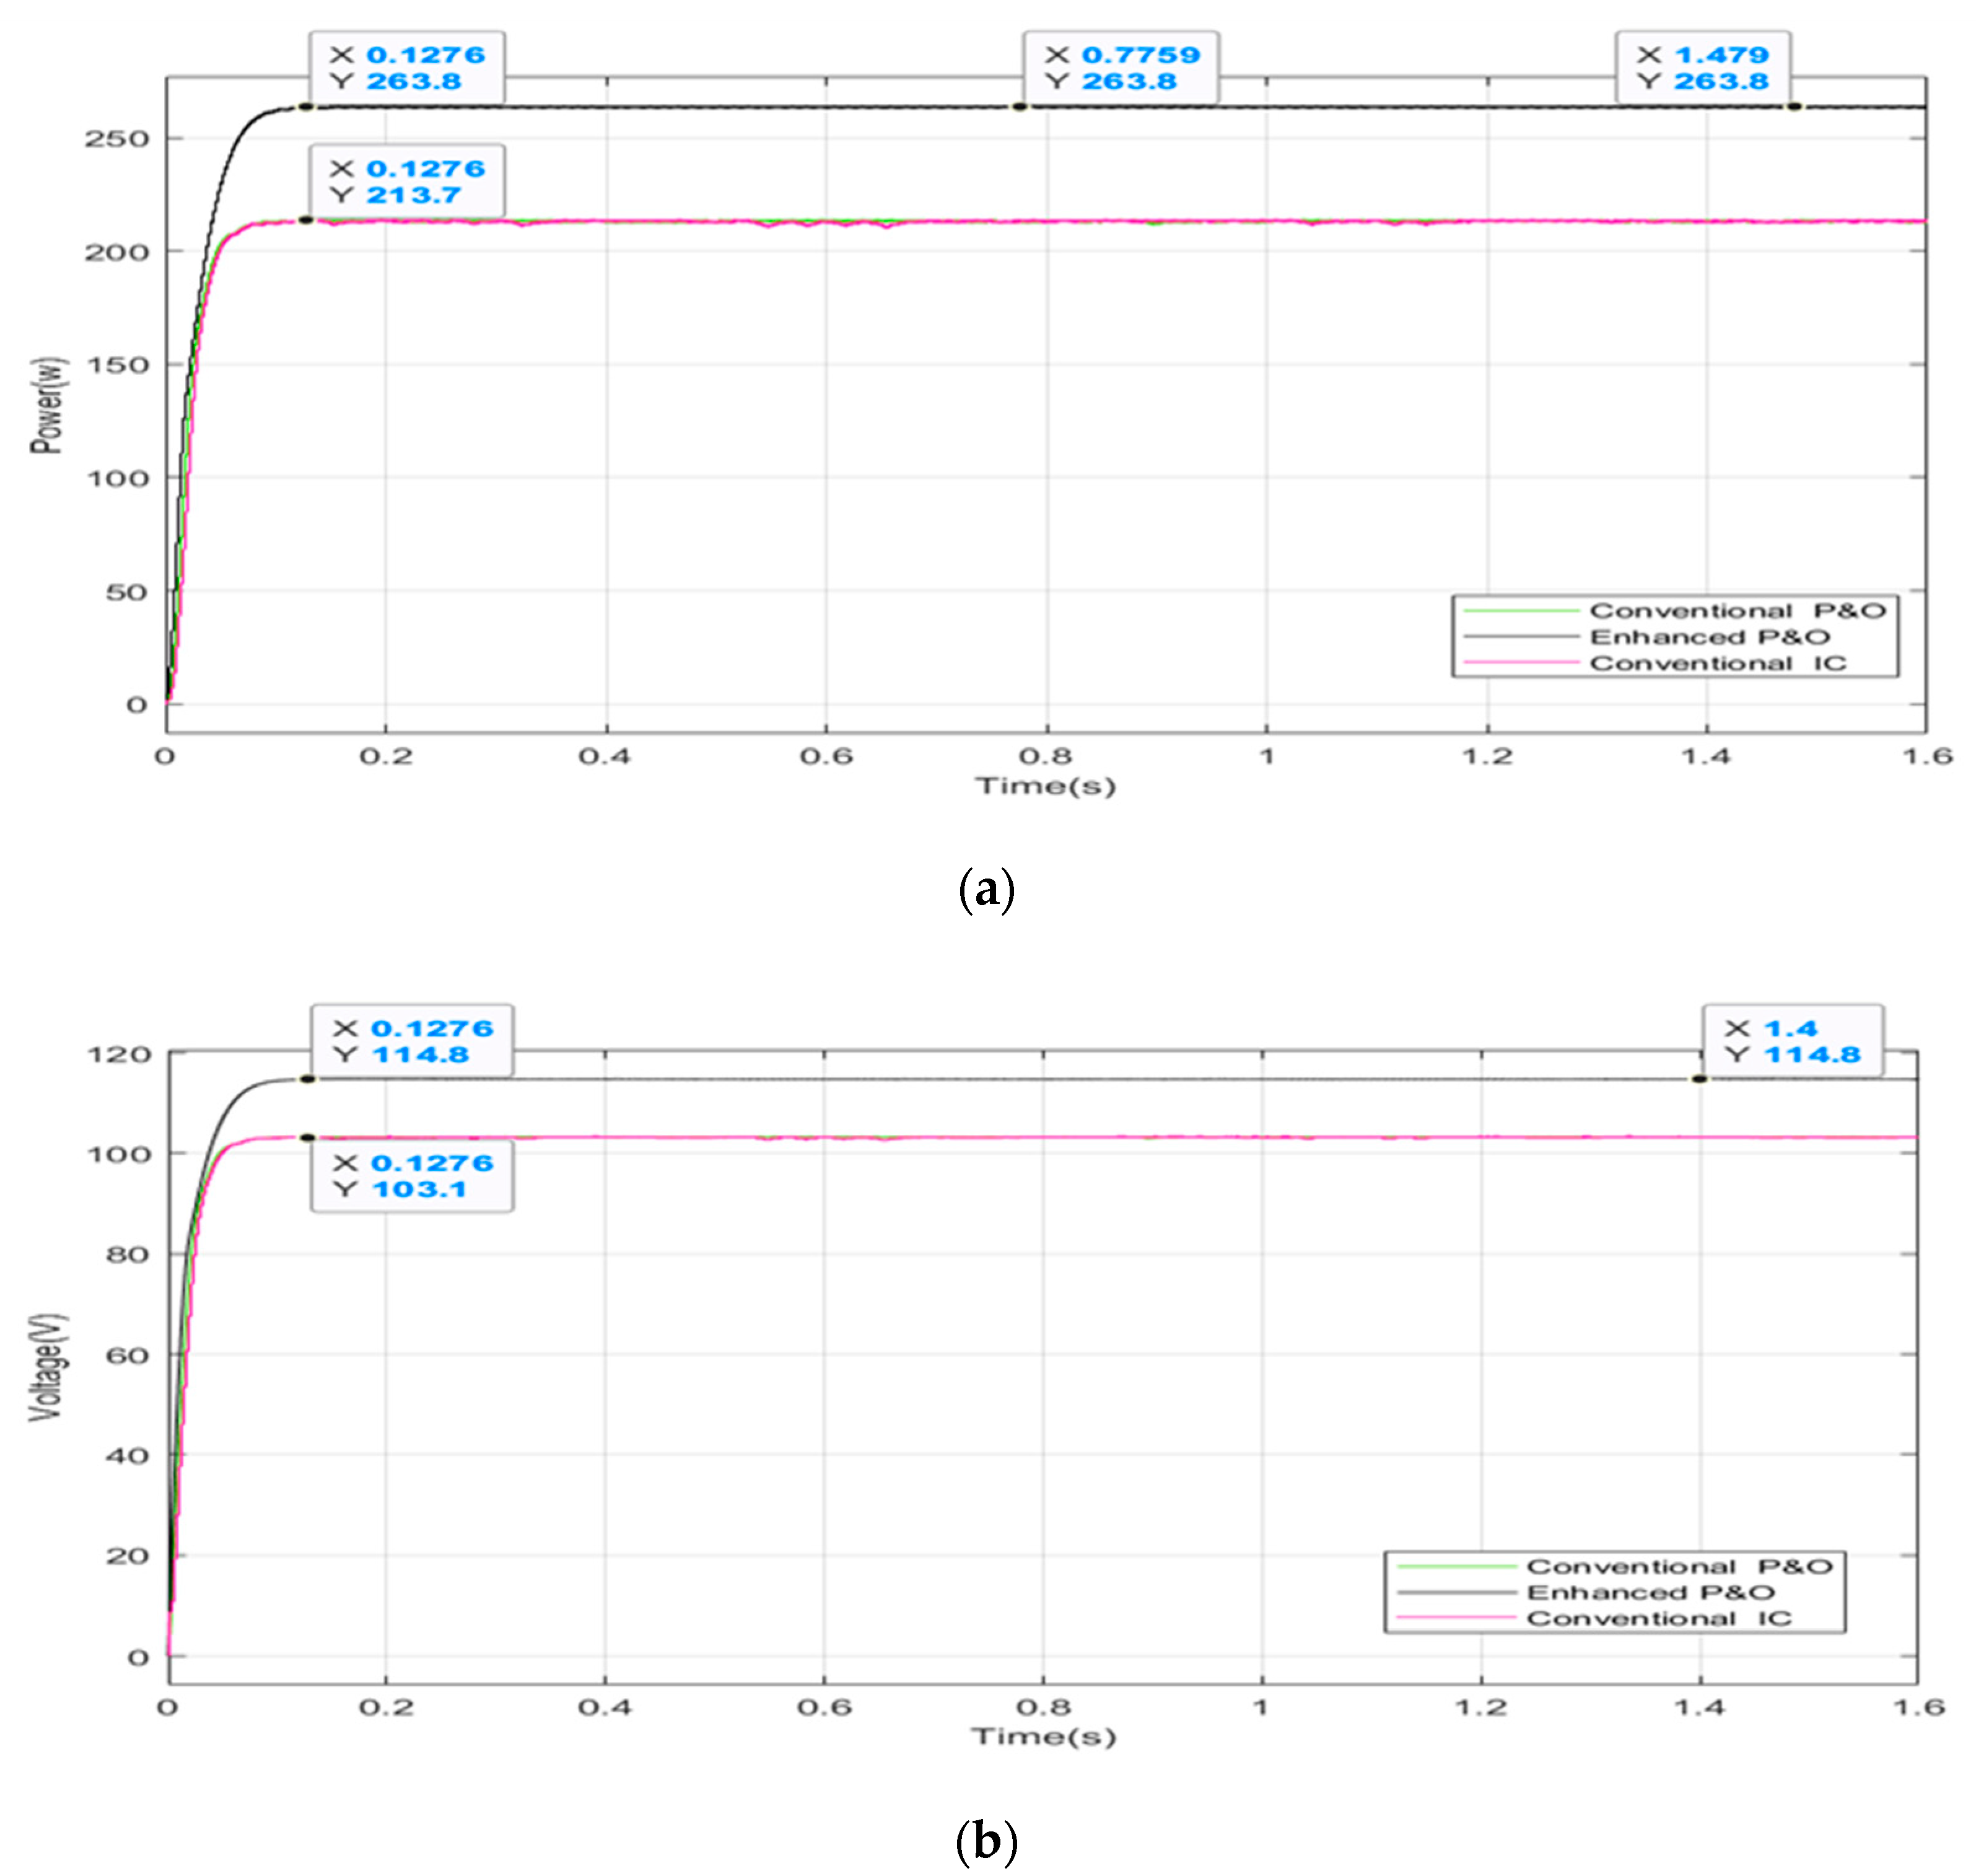
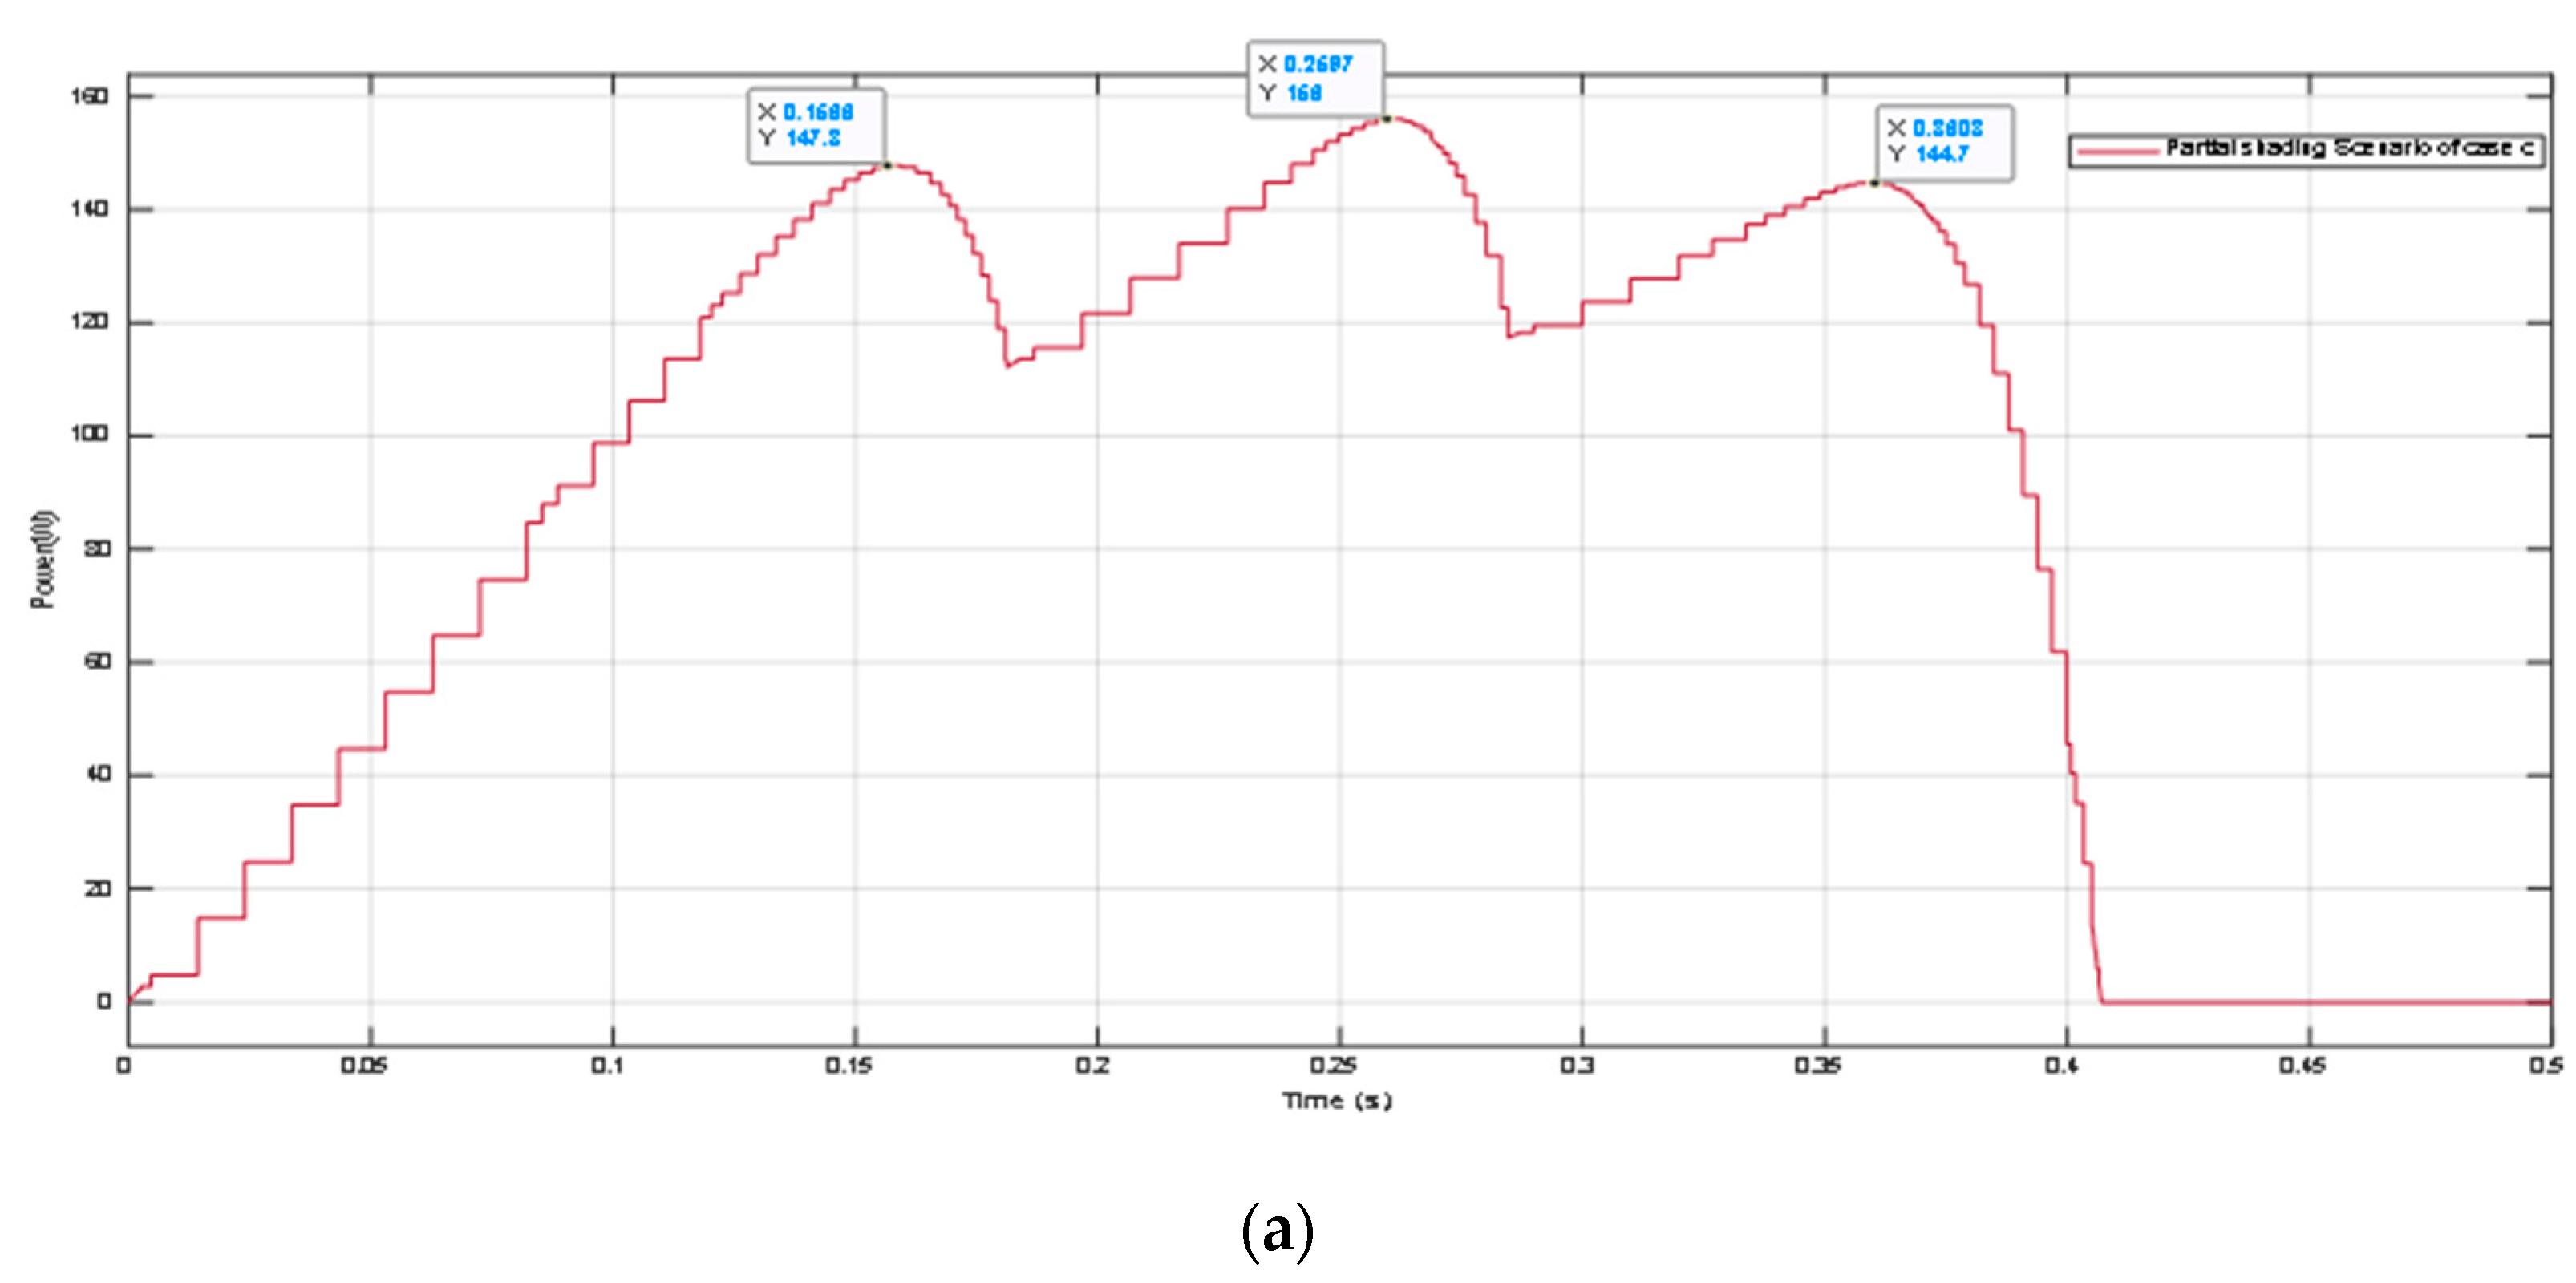
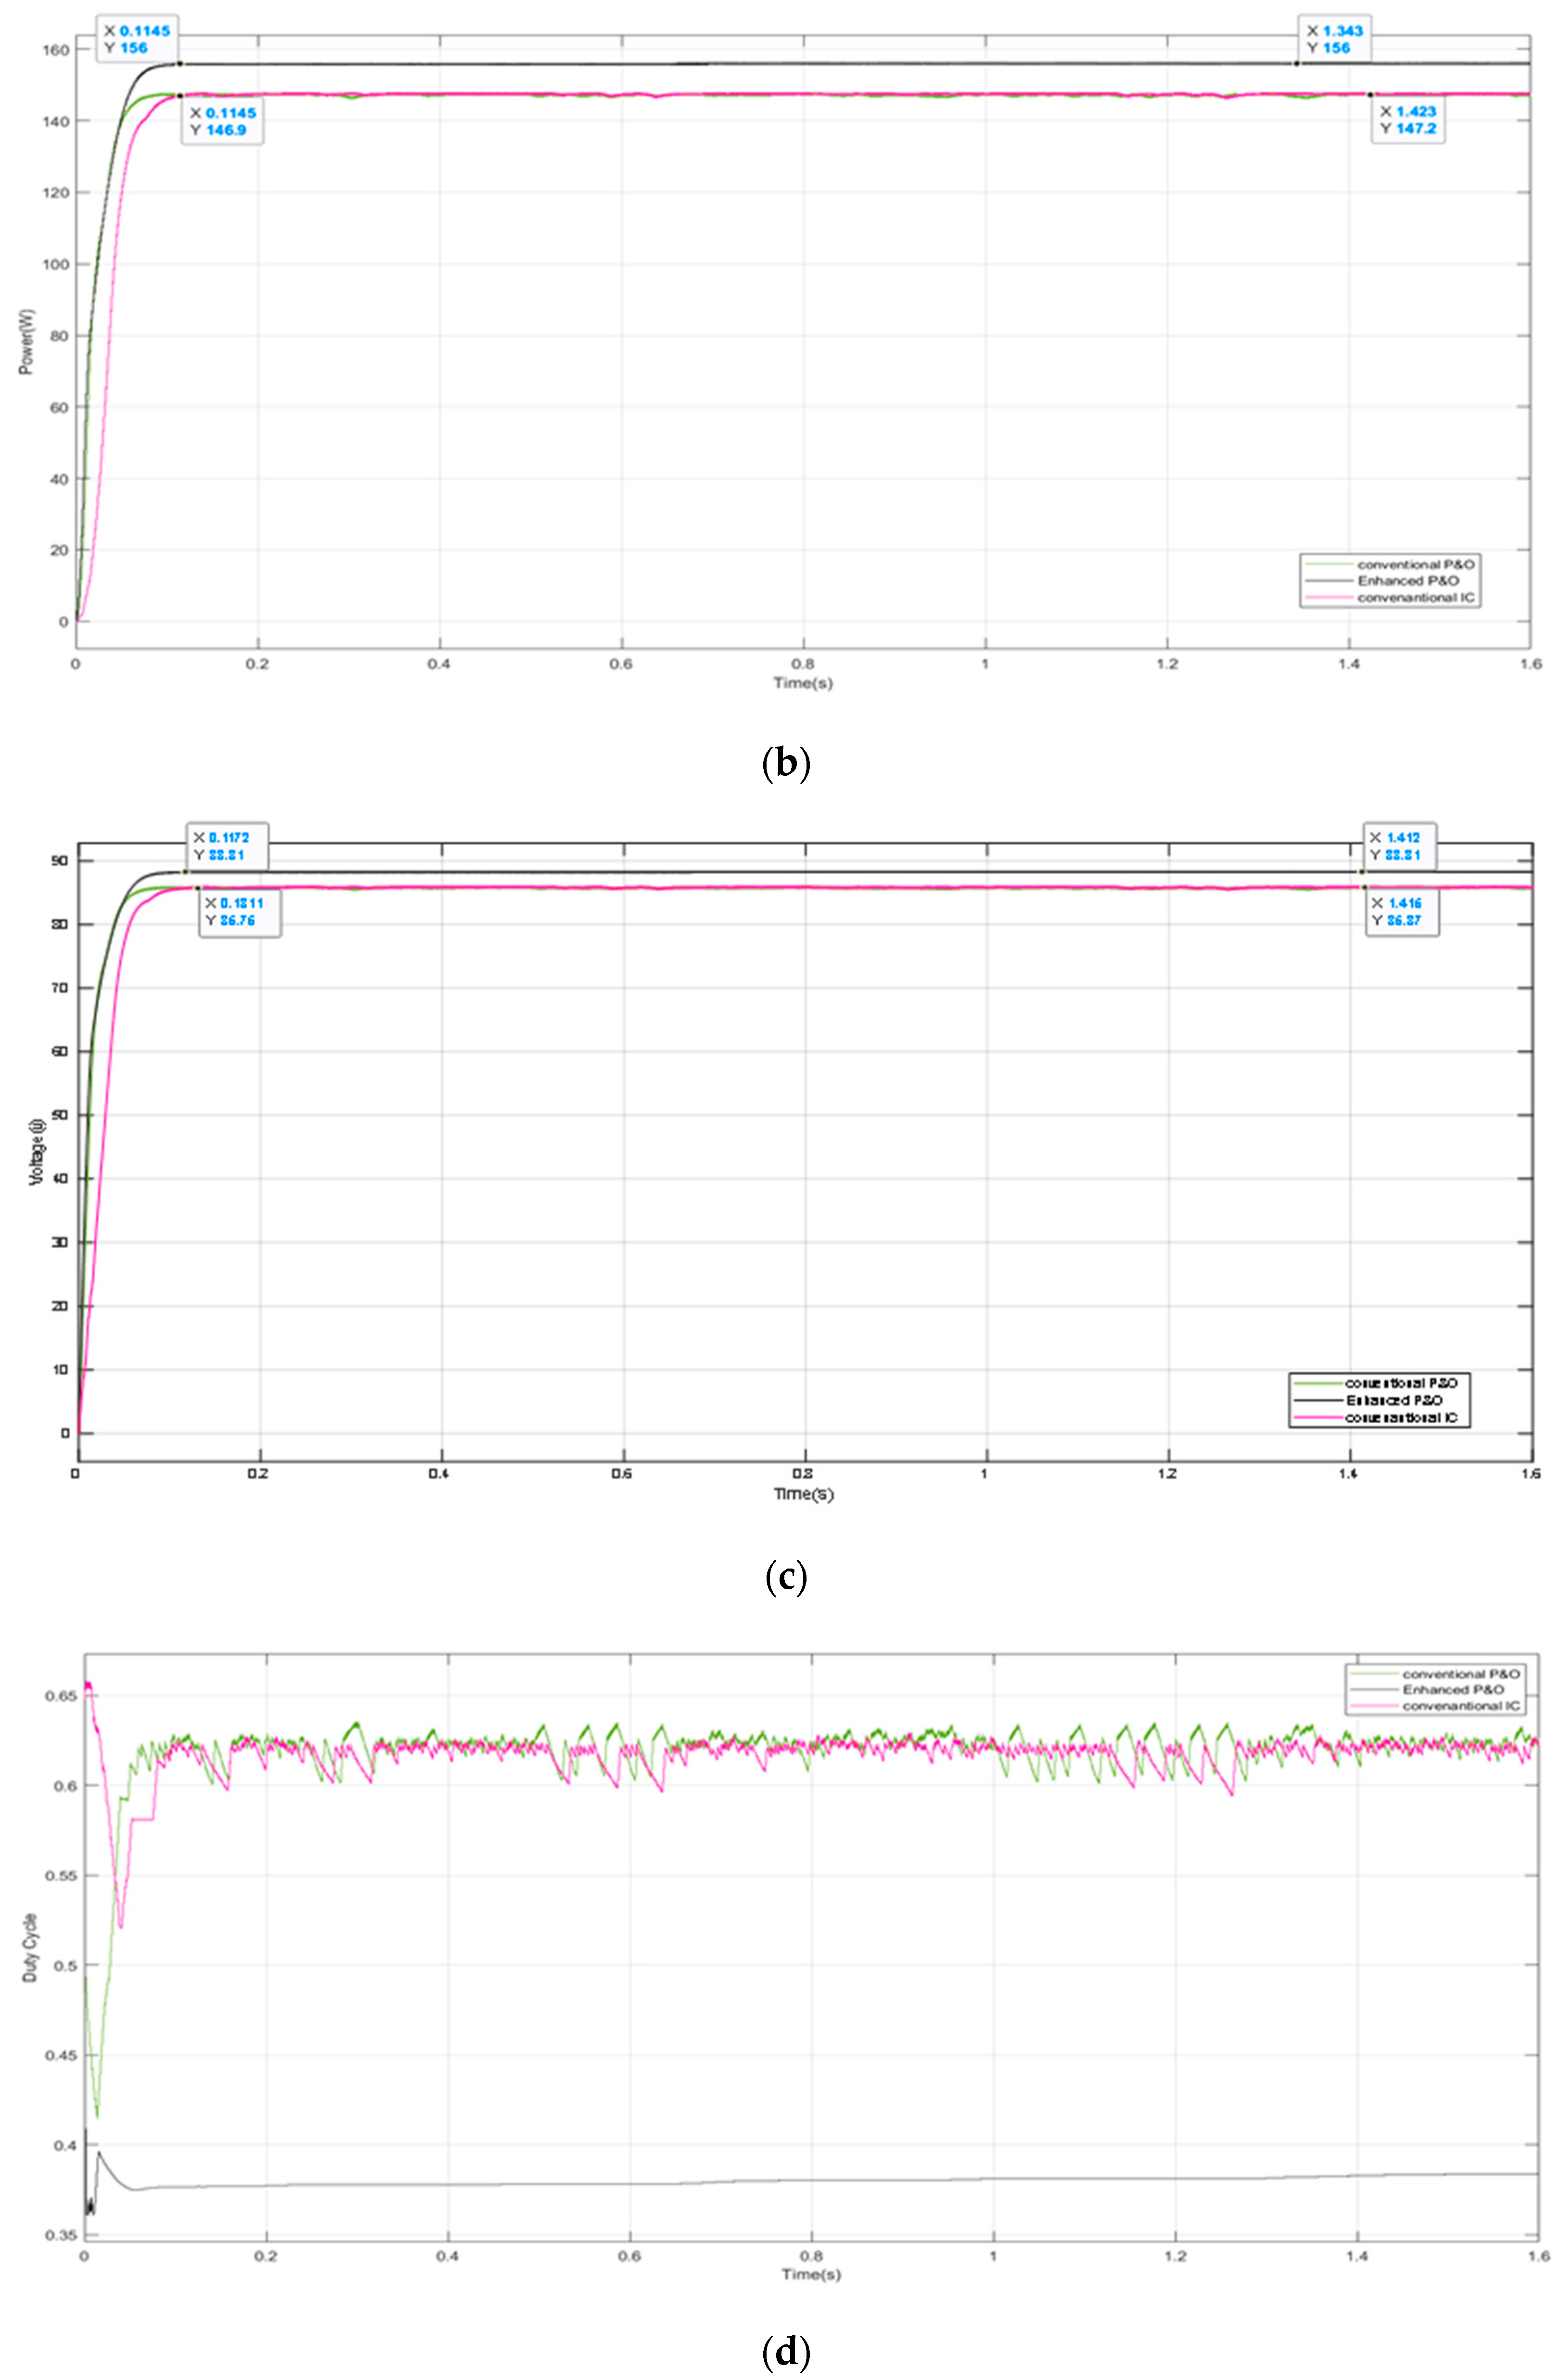
5.3. Case Three: Strong Partial Shading Pattern

In this case, two connected panels receive uniform radiation conditions (1000 W/m2 radiation), while one receives 800 W/m2, two receive 600 W/m2, two receive 400 W/m2, and one receives 200 W/m2. The arrangement is illustrated in Table 2; it creates five peaks in the P–V characteristics curve and forms a more complex situation for tracking the GMPP. The GMPP is located as shown in the characteristics in Figure 11. The simulation results for Case Three with a performance comparison between the proposed technique and the conventional P&O and IC techniques are illustrated in Figure 12.

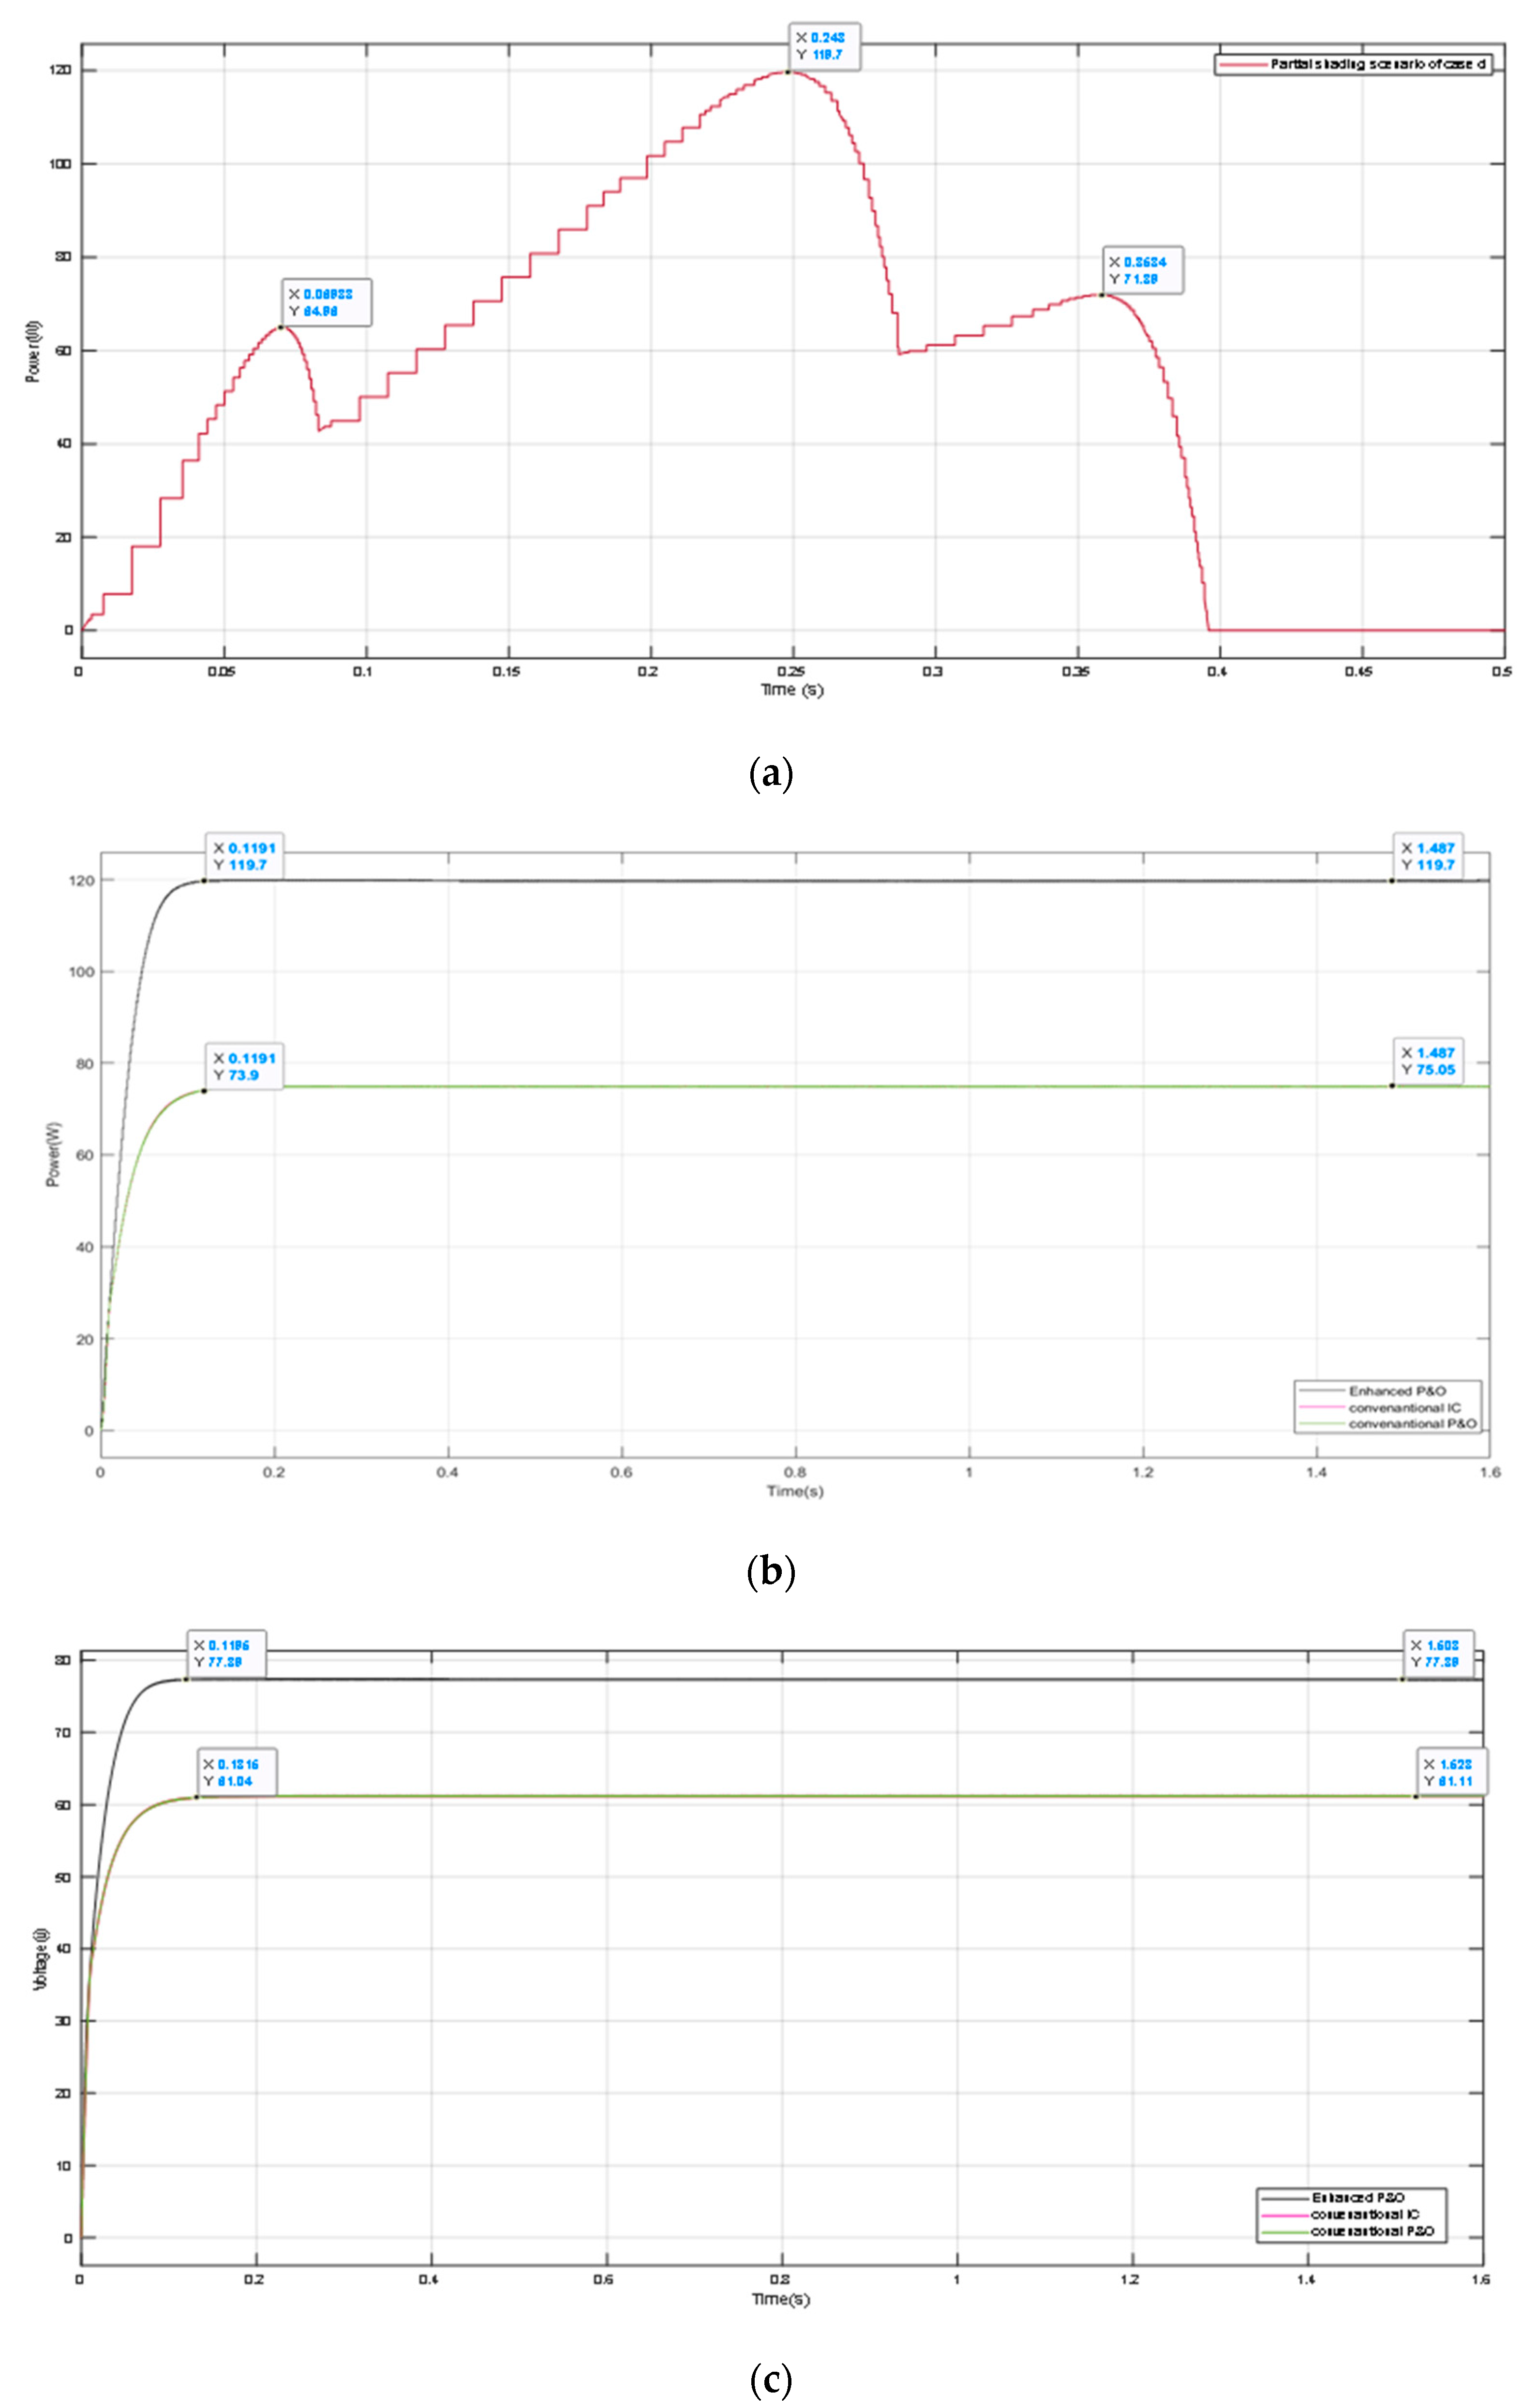
5.4. Case Four: Strong Partial Shading Pattern

In this case, two connected panels receive uniform radiation conditions (1000 W/m2 radiation), while two receive 600 W/m2 and four receive 400 W/m2. The arrangement is illustrated in Table 2. Four maxima occur in the P–V characteristics. The location of the GMPP is shown in the characteristics in Figure 13. The simulation results for Case Four with a performance comparison between the proposed technique and the conventional P&O and IC techniques are illustrated in Figure 14.

5.5. Discussion of the Simulation Results

The achieved power and tracking time at the maximum voltage of 156.7 V of the proposed algorithm were 490.9 W in 0.13 s with efficiency of 100%; for the conventional P&O and IC algorithms, the extracted powers were 461.9 W and 461.4 W, respectively, both at a maximum voltage of 151.6 V, indicating the failure of both algorithms to track the GMPP, instead just managing to track a LMPP. Therefore, the results illustrated in Figure 8 clarify that the proposed enhanced P&O technique performs with the best efficiency and precision with zero oscillation around the GMPP and definitely outperforms both the IC and P&O techniques in terms of power extraction accuracy and speed. The same effectiveness was validated in the moderate shading condition, in which the GMPP of 435.5 W was tracked at maximum voltage of 147.6 V by the proposed algorithm with 100% efficiency in 0.139 s. However, the extracted powers by the conventional IC and P&O algorithms at maximum voltage of 121.5 V were 295.5 W and 292.5 W, respectively, showing the same failure in tracking the actual MPP. The best efficiency of 100% was also confirmed under strong partial shading conditions, as shown in the third and fourth cases of different strong partial shading patterns (Figure 11, Figure 12, Figure 13 and Figure 14). Figure 12 and Figure 14 confirmed the high performance of the proposed algorithm under two of the worst cases of shading conditions, illustrating the ability to accurately track the correct MPPs, which were 257.4 W at 113.4 V and 263.8 W at 114.8 V for the third and fourth cases, respectively, and both within a time of 0.140 s. For the conventional P&O and IC algorithms, the wrong MPP was tracked in each case. Moreover, the stability of the duty cycle is clear for the proposed algorithm, on the contrary to the conventional P&O and IC algorithms in all cases. Table 3 presents detailed performance indicators for the studied scenarios.

6. Analysis of the Proposed Enhanced P&O for Partial Shading

The performance of the proposed Enhanced P&O technique was further evaluated for different cases to confirm the effectiveness of the algorithm under fluctuations of weather conditions. The algorithm was tested under weak, moderate, and strong partial shading conditions. Figure 15 shows an assessment of the Enhanced P&O technique performance under the sequence of Case Three to Case Two, followed by Case Four, then, finally, Case One. This sequence is the most comprehensive to cover any weather fluctuation. The increase and decrease in irradiation due to the presence of anything that can prevent or reduce the amount of received illumination was taken into account and simulated, and the results are shown in Figure 15.
The success of the proposed enhanced P&O technique can clearly be observed in the three parts of Figure 15, which are the tracked power, the maximum voltage, and the duty cycle. The sequence started with strong partial shading (Case Three) for 0.4 s, then the PV array experienced moderate partial shading (Case Two) for another 0.4 s. Then, the PV array underwent strong partial shading (Case Four), and after 1.2 s, the array came under weak partial shading (Case One). The proposed method conserved its performance in all four cases in terms of tracking speed, tracking precision, and stability (oscillations were less than 0.5 W and can be neglected). The performance and comprehensive analysis of the enhanced P&O algorithm under the sequence of these four cases is summarized in Table 4. In order to support more confirmation of its effectiveness, the performance evaluation of the proposed algorithm compared with well-known MPPT algorithms is presented in Table 5.

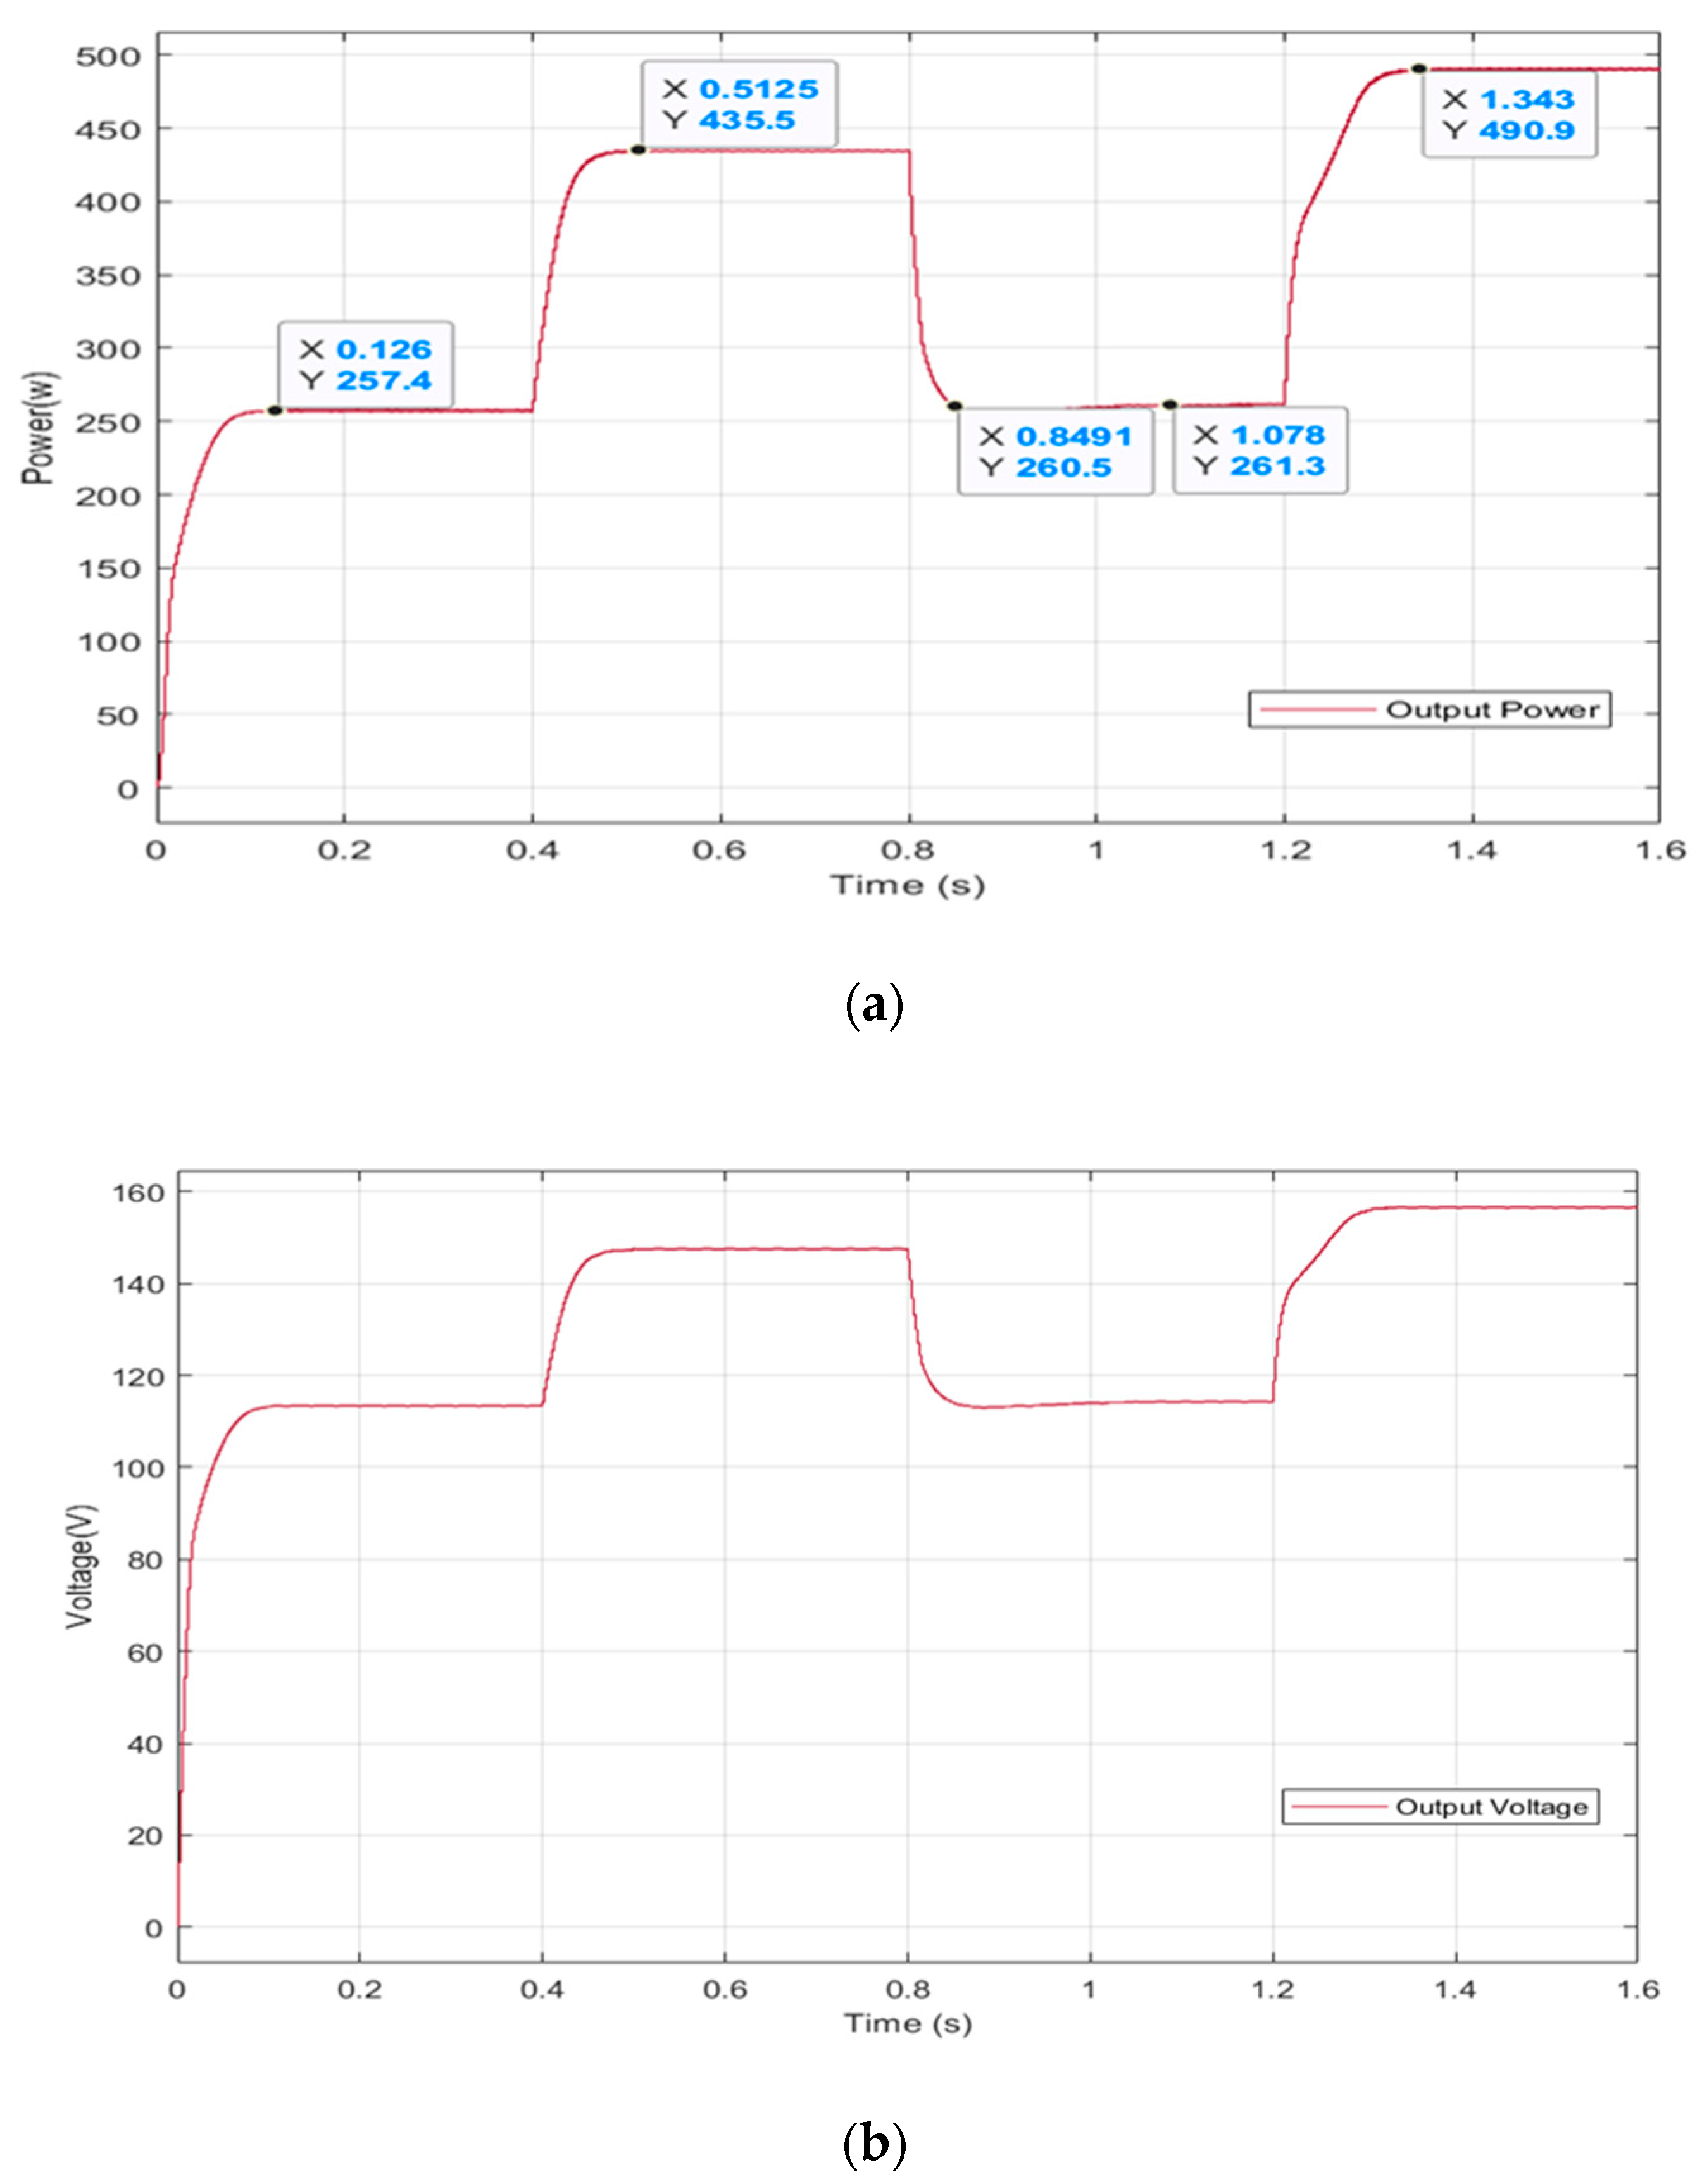
7. Additional Configuration Testing

To confirm the robustness and high performance of the proposed method for any PV array configuration under any irradiation fluctuation conditions, more configuration tests were executed with comprehensive comparisons in the overall performance between the suggested method and the conventional P&O and IC techniques under different shading conditions. The configuration of eight PV modules in series (8S) is presented in cases “a” and “b” of Figure 16 for two diverse shading conditions. Moreover, four modules in series (4S) is the PV configuration as illustrated in cases “c” and “d” of Figure 16 for two different shading situations.
The characteristic curves for all the configurations of Figure 16 with the acquired outputs of the different algorithms are presented in Figure 17, Figure 18, Figure 19 and Figure 20. The powers at the GMPPs for cases “a” and “b” of the (8S) PV array were 246.2 W and 292.9 W, respectively. For cases “c” and “d” of the (4S) PV array, the powers at the GMPPs were 156 W and 119.7 W, respectively. These results prove the ability of the proposed technique to track the GMPP for each case with the best efficiency and accuracy with no oscillation or power loss in perfect tracking time, less than 0.14 s, working at the desired maximum voltage in all cases of shading conditions. Moreover, the results show that the proposed technique performed far better than both the IC and P&O techniques in terms of extracted power, speed, and efficiency.

8. Future Work

In future work, we will move on to experimentally confirming the proposed algorithm performance. Also, it would be an interesting objective to check its validity on other converter structures.

9. Conclusions

An enhanced P&O MPPT procedure with appropriate organized comparison sequences which can track the GMPP effectively under partial shading conditions was presented in this paper. The performance of this procedure was successfully tested and evaluated using different and comprehensive shading patterns. The simulation results showed that this proposed algorithm is fast and precise for GMPP tracking, even when fast-changing partial shading conditions occur. The simulation results confirmed the success of the presented algorithm for maximum power extraction with high accuracy, tracking speed, and simplicity with the best efficiency.

Author Contributions

Author Contributions: A.N.M.M. developed the simulation model, conducted the tests, analyzed all the important findings, and wrote the manuscript; M.A.M.R. verified the simulation study and written manuscript; N.A., S.S. and M.A.A.M.Z. revised and finalized the drafted manuscript. All authors have read and agreed to the published version of the manuscript.

Funding

This research received no external funding.

Conflicts of Interest

The authors declare no conflict of interest.

Appendix A

Figure A1. I–V and P–V curves of the PV array under different irradiance levels.
Applsci 10 03912 g0a1

References

  1. Fazal, M.R.; Kamran, M.; ul Haq, I.; Abbas, Z.; Ayyaz, M.N.; Mudassar, M. Modified Perturb and Observe MPPT algorithm for partial shading conditions. Int. J. Renew. Energy Res. 2019, 9, 721–731. [Google Scholar]
  2. Suhadolnik, L.; Pohar, A.; Novak, U.; Likozar, B.; Mihelic, A.; Ceh, M. Continuous photocatalytic, electrocatalytic and photo-electrocatalytic degradation of a reactive textile dye for wastewater-treatment processes: Batch, microreactor and scaled-up operation. J. Ind. Eng. Chem. 2019, 72, 178–188. [Google Scholar] [CrossRef]
  3. Khanam, J.J.; Simon, Y.F. Modeling of a Photovoltaic Array in MATLAB Simulink and Maximum Power Point Tracking Using Neural Network. J. Electr. Electron. Syst. 2018, 2, 40–46. [Google Scholar]
  4. Bjelajac, A.; Kopač, D.; Fecant, A.; Tavernier, E.; Petrović, R.; Likozar, B.; Janaćković, D. Micro-kinetic modelling of photocatalytic CO2 reduction over undoped and N-doped TiO2. Catal. Sci. Technol. 2020. [Google Scholar] [CrossRef]
  5. Bitenc, M.; Horvat, B.; Likozar, B.; Drazi, G.; Orel, Z.C. The impact of ZnO load, stability and morphology on the kinetics of the photocatalytic degradation of caffeine and resazurin. Appl. Catal. B Environ. 2013, 136–137, 202–209. [Google Scholar] [CrossRef]
  6. Loukriz, A.; Messalti, S.; Harrag, A. Design, simulation, and hardware implementation of novel optimum operating point tracker of PV system using adaptive step size. Int. J. Adv. Manuf. Technol. 2019, 101, 1671–1680. [Google Scholar] [CrossRef]
  7. Gounden, N.A.; Ann Peter, S.; Nallandula, H.; Krithiga, S. Fuzzy logic controller with MPPT using line-commutated inverter for three-phase grid-connected photovoltaic systems. Renew. Energy 2009, 34, 909–915. [Google Scholar] [CrossRef]
  8. Subudhi, B.; Pradhan, R. A comparative study on maximum power point tracking techniques for photovoltaic power systems. IEEE Trans. Sustain. Energy 2013, 4, 89–98. [Google Scholar] [CrossRef]
  9. Kwan, T.H.; Wu, X. Maximum power point tracking using a variable antecedent fuzzy logic controller. Sol. Energy 2016, 137, 189–200. [Google Scholar] [CrossRef]
  10. Bouselham, L.; Hajji, M.; Hajji, B.; Bouali, H. A New MPPT-based ANN for Photovoltaic System under Partial Shading Conditions. Energy Procedia 2017, 111, 924–933. [Google Scholar] [CrossRef]
  11. Ishaque, K.; Salam, Z.; Amjad, M.; Mekhilef, S. An Improved Particle Swarm Optimization (PSO)-Based MPPT for PV with Reduced Steady-State Oscillation. IEEE Trans. Power Electron. 2012, 27, 3627–3638. [Google Scholar] [CrossRef]
  12. Afzal Awan, M.; Mahmood, T. A Novel Ten Check Maximum Power Point Tracking Algorithm for a Standalone Solar Photovoltaic System. Electronics 2018, 7, 327. [Google Scholar] [CrossRef] [Green Version]
  13. Ram, J.P.; Babu, T.S.; Rajasekar, N. A comprehensive review on solar PV maximum power point tracking techniques. Renew. Sustain. Energy Rev. 2017, 67, 826–847. [Google Scholar] [CrossRef]
  14. Lukasik, S.; Kowalski, P.A. Study of Flower Pollination Algorithm for Continuous Optimization. In Advances in Intelligent Systems and Computing, Proceedings of the 7th IEEE International Conference Intelligent Systems IS’2014, Warsaw, Poland, 24–26 September 2014; Springer: Cham, Switzerland, 2015. [Google Scholar]
  15. Ahmad, R.; Murtaza, A.F.; Sher, H.A. Power tracking techniques for efficient operation of photovoltaic array in solar applications—A review. Renew. Sustain. Energy Rev. 2019, 101, 82–102. [Google Scholar] [CrossRef]
  16. Ishaque, K.; Salam, Z.; Lauss, G. The performance of Perturb and Observe and incremental conductance maximum power point tracking method under dynamic weather conditions. Appl. Energy 2014, 119, 228–236. [Google Scholar] [CrossRef]
  17. Qichang, D.; Jiajun, L.; Pan, D.; Bei, H.; Mingxuan, M. An Improved Variable Step PO and Global Scanning MPPT Method for PV Systems under Partial Shading Condition. In Proceedings of the 2015 7th International Conference on Intelligent Human-Machine Systems and Cybernetics, Hangzhou, China, 26–27 August 2015; Volume 1, pp. 382–386. [Google Scholar]
  18. Aashoor, F.A.O.; Robinson, F.V.P. A variable step size Perturb and Observe algorithm for photovoltaic maximum power point tracking. In Proceedings of the 2012 47th International Universities Power Engineering Conference (UPEC), London, UK, 4–7 September 2012. [Google Scholar]
  19. Killi, M.; Samanta, S. Modified Perturb and Observe MPPT Algorithm for Drift Avoidance in Photovoltaic Systems. IEEE Trans. Ind. Electron. 2015, 62, 5549–5559. [Google Scholar] [CrossRef]
  20. Belkaid, A.; Colak, I.; Kayisli, K. Implementation of a modified P&O-MPPT algorithm adapted for varying solar radiation conditions. Electr. Eng. 2017, 99, 839–846. [Google Scholar]
  21. Bizon, N. Global Maximum Power Point Tracking (GMPPT) of Photovoltaic array using the Extremum Seeking Control (ESC): A review and a new GMPPT ESC scheme. Renew. Sustain. Energy Rev. 2016, 57, 524–539. [Google Scholar] [CrossRef]
  22. Almi, M.F.; Belmili, H.; Arrouf, M.; Bendib, B. A novel adaptive variable step size p&o mppt algorithm. Acad. J. Sci. 2016, 6, 533–540. [Google Scholar]
  23. Spertino, F.; Ahmad, J.; Di Leo, P.; Ciocia, A. A method for obtaining the I-V curve of photovoltaic arrays from module voltages and its applications for MPP tracking. Sol. Energy 2016, 139, 489–505. [Google Scholar] [CrossRef]
  24. Shah, N.; Rajagopalan, C. Experimental evaluation of a partially shaded photovoltaic system with a fuzzy logic-based peak power tracking control strategy. IET Renew. Power Gener. 2016, 10, 98–107. [Google Scholar] [CrossRef]
  25. Choudhury, S.; Rout, P.K. Comparative study of M-FIS FLC and modified P&O MPPT techniques under partial shading and variable load conditions. In Proceedings of the 2015 Annual IEEE India Conference (INDICON), New Delhi, India, 17–20 December 2015. [Google Scholar]
  26. Aouchiche, N.; Aitcheikh, M.S.; Becherif, M.; Ebrahim, M.A. AI-based global MPPT for partial shaded grid connected PV plant via MFO approach. Sol. Energy 2018, 171, 593–603. [Google Scholar] [CrossRef]
  27. Bataineh, K.; Eid, N. A hybrid maximum power point tracking method for photovoltaic systems for dynamic weather conditions. Resources 2018, 7, 68. [Google Scholar] [CrossRef] [Green Version]
  28. Sundareswaran, K.; Peddapati, S.; Palani, S. MPPT of PV Systems Under Partial Shaded Conditions Through a Colony of Flashing Fireflies. IEEE Trans. Energy Convers. 2014, 29, 463–472. [Google Scholar]
  29. Kolsi, S.; Samet, H.; Amar, M.B. Design Analysis of DC-DC Converters Connected to a Photovoltaic Generator and Controlled by MPPT for Optimal Energy Transfer throughout a Clear Day. J. Power Energy Eng. 2014, 2, 42166. [Google Scholar] [CrossRef] [Green Version]
  30. Erickson, R.W.; Maksimovic, D. Fundamentals of Power Electronics; Springer: New York, NY, USA, 2001. [Google Scholar]
  31. Hayat, A.; Faisal, A.; Javed, M.Y.; Hasseb, M.; Rana, R.A. Effects of input capacitor (cin) of boost converter for photovoltaic system. In Proceedings of the 2016 International Conference on Computing, Electronic and Electrical Engineering (ICE Cube), Quetta, Pakistan, 11–12 April 2016. [Google Scholar]
  32. Nayak, B.; Mohapatra, A.; Mohanty, K.B. Selection criteria of dc-dc converter and control variable for MPPT of PV system utilized in heating and cooking applications. Cogent Eng. 2017, 4, 1363357. [Google Scholar] [CrossRef]
  33. Hashim, N.; Johari, D.; Ismail, N.F.N.; Salam, Z. DC-DC boost converter design for fast and accurate MPPT algorithms in stand-alone photovoltaic system. Int. J. Power Electron. Drive Syst. 2018, 9, 1038–1050. [Google Scholar] [CrossRef]
  34. Hart, D.W. Power Electronics; Tata McGraw-Hill: New Delhi, India, 2011. [Google Scholar]
  35. Ishaque, K.; Salam, Z. A comprehensive MATLAB Simulink PV system simulator with partial shading capability based on two-diode model. Sol. Energy 2011, 85, 2217–2227. [Google Scholar] [CrossRef]
  36. Kollimalla, S.K.; Mishra, M.K. A Novel Adaptive P&O MPPT Algorithm Considering Sudden Changes in the Irradiance. IEEE Trans. Energy Convers. 2014, 29, 602–610. [Google Scholar]
  37. Bennett, T.; Zilouchian, A.; Messenger, R. A proposed maximum power point tracking algorithm based on a new testing standard. Sol. Energy 2013, 89, 23–41. [Google Scholar] [CrossRef]
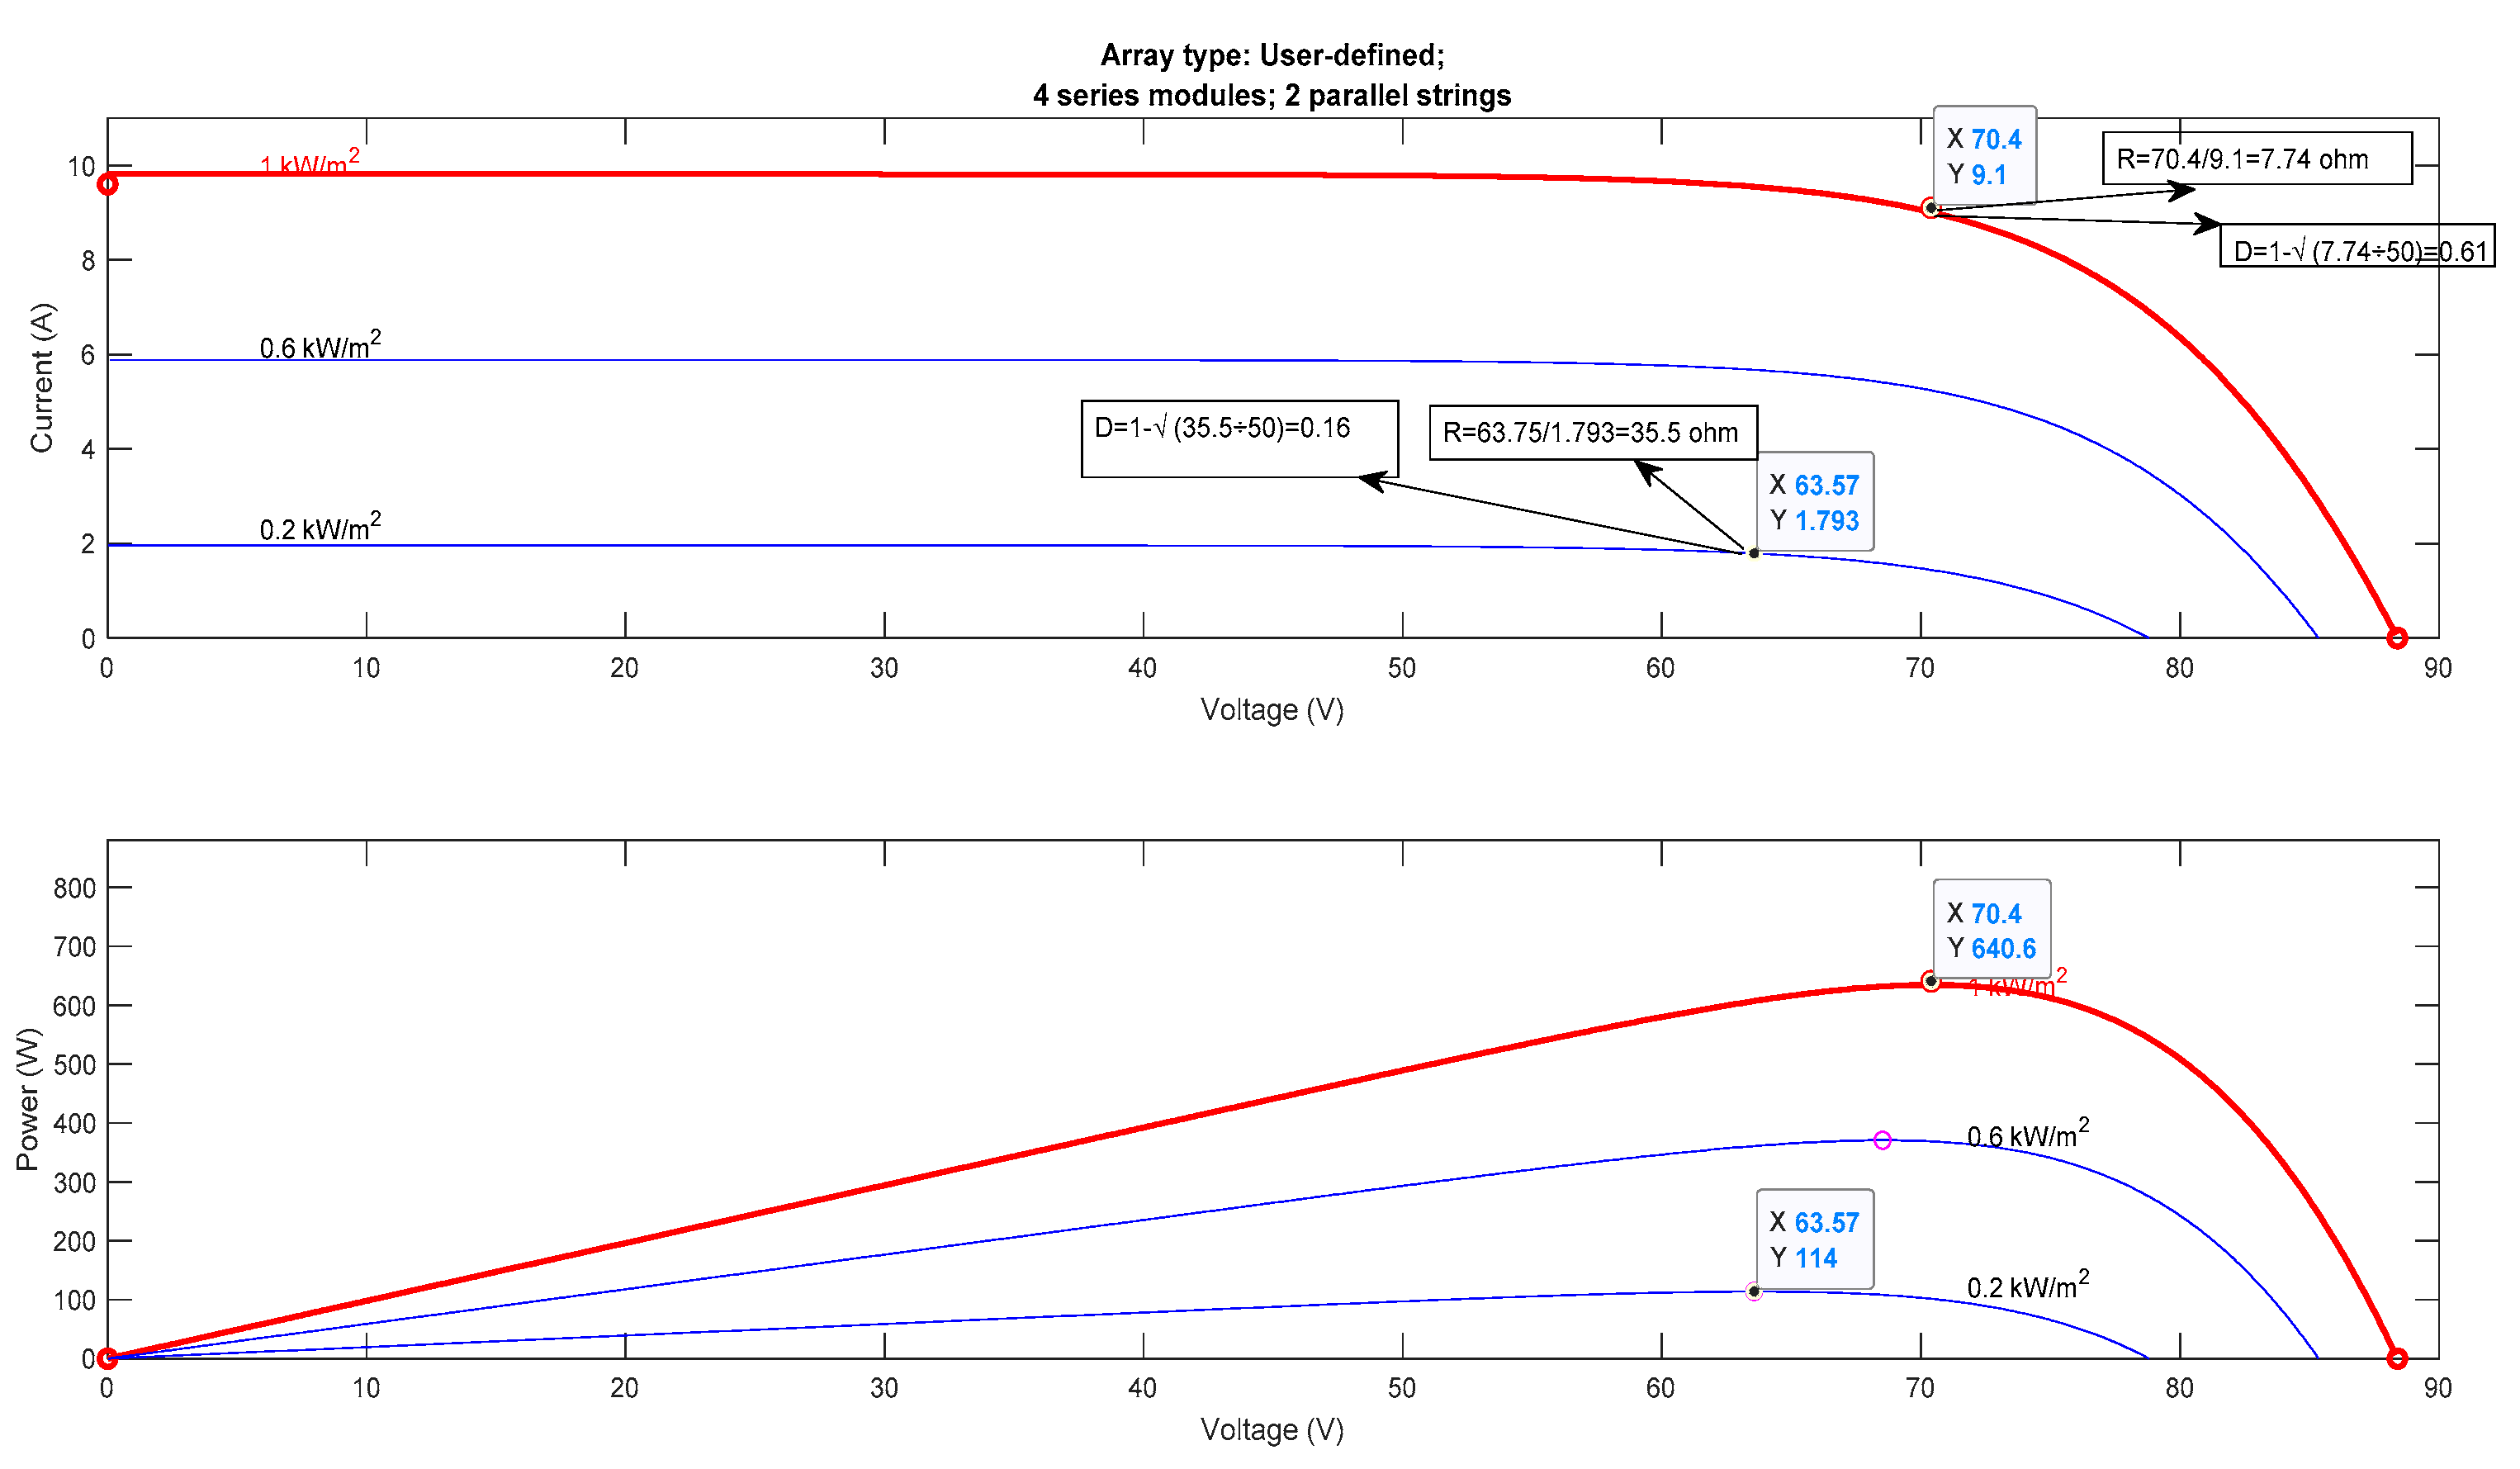
Figure 1. I–V and P–V curves of a photovoltaic (PV) module at different solar irradiation levels.
Applsci 10 03912 g001
Figure 2. Modelling of the PV array.
Applsci 10 03912 g002
Figure 3. Simulink model of the maximum power point tracking (MPPT) controller using a boost converter.
Applsci 10 03912 g003
Figure 4. Flowchart of the conventional Perturb and Observe (P&O) algorithm.
Applsci 10 03912 g004
Figure 5. Flowchart of the proposed algorithm.
Applsci 10 03912 g005
Figure 6. Simulink model of the MPPT controller using a boost converter.
Applsci 10 03912 g006
Figure 7. Scenario of Case One (Weak shading pattern).
Applsci 10 03912 g007
Figure 8. The simulation results of the proposed technique and the conventional P&O and incremental conductance (IC) techniques for Case One: (a) Tracked output power; (b) Output voltage of the boost converter; (c) Duty cycle behaviors.
Applsci 10 03912 g008aApplsci 10 03912 g008b
Figure 9. Scenario of Case Two (Moderate partial shading pattern).
Applsci 10 03912 g009
Figure 10. The simulation results of the proposed technique and the conventional P&O and IC techniques for Case Two: (a) Tracked output power; (b) Output voltage of the boost converter; (c) Duty cycle behaviors.
Applsci 10 03912 g010
Figure 11. Scenario of Case Three (Strong shading pattern).
Applsci 10 03912 g011
Figure 12. The simulation results of the proposed technique and the conventional P&O and IC techniques for Case Three: (a) Tracked output power; (b) Output voltage of the boost converter; (c) Duty cycle behaviors.
Applsci 10 03912 g012aApplsci 10 03912 g012b
Figure 13. Scenario of Case Four (Strong partial shading pattern).
Applsci 10 03912 g013
Figure 14. The simulation results of the proposed technique and the conventional P&O and IC techniques for Case Four: (a) Tracked output power; (b) Output voltage of the boost converter; (c) Duty cycle behaviors.
Applsci 10 03912 g014aApplsci 10 03912 g014b
Figure 15. Performance of the combined sequence of Cases Three, Two, Four, and One in terms of (a) the output power, (b) the output voltage, and (c) the duty cycle.
Applsci 10 03912 g015aApplsci 10 03912 g015b
Figure 16. Shading condition cases of two configurations: (a) The first case of (8S); (b) The second case of (8S); (c) The first case of (4S); and (d) The second case of (4S).
Applsci 10 03912 g016
Figure 17. (a) Scenario of case “a” of the (8S) PV array; (b) The extracted power by the proposed technique and the conventional P&O and IC techniques; (c) The voltage at the boost converter output; (d) The duty cycle behaviors.
Applsci 10 03912 g017aApplsci 10 03912 g017b
Figure 18. (a) Scenario of case “b” of the (8S) PV array; (b) The extracted power by the proposed technique and the conventional P&O and IC techniques; (c) The voltage at the boost converter output; (d) The duty cycle behaviors.
Applsci 10 03912 g018aApplsci 10 03912 g018b
Figure 19. (a) Scenario of case “c” of the (4S) PV array; (b) The extracted power by the proposed technique and the conventional P&O and IC techniques; (c) The voltage at the boost converter output; (d) The duty cycle behaviors.
Applsci 10 03912 g019aApplsci 10 03912 g019b
Figure 20. (a) Scenario of case “d” of the (4S) PV array; (b) The extracted power by the proposed technique and the conventional P&O and IC techniques; (c) The voltage at the boost converter output; (d) The duty cycle behaviors.
Applsci 10 03912 g020aApplsci 10 03912 g020b
Table 1. PV array and boost converter characteristics under the lower and higher solar irradiances.
Irradiance (W/m2)Vmpp (V)Impp (A)Pmpp (W)Rmpp (Ω)DmppVout (V)Iout (A)RL (Ω)L (mH)C (µF)
1000 (Higher)70.49.1640.67.740.611793.6501.6500
200 (Lower)63.571.79311435.50.1675.71.5
Table 2. Incident irradiation for the PV system array with the corresponding power at the global maximum power point (GMPP).
CaseIrradiation of the First Four Series ModulesIrradiation of the Second Four Series ModulesPower at GMPP
One (Weak shading)[1000,1000,1000,800][1000,1000,1000,600]490.9 W
Two (Moderate shading)[1000,1000,800,800][1000,1000,500,500]435.5 W
Three (Strong shading)[1000,1000,600,400][800,600,400,200]257.4 W
Four (Strong shading)[1000,1000,600,400][600,400,400,400]263.8 W
Table 3. Detailed performance of the proposed algorithm.
CaseIrradiation of the Parallel First and Second Series ModulesIdeal Power at GMMP (A)Tracked Power at GMMP (B) Efficiency   ( B A × 100 ) Tracking Speed
One (Weak shading)[1000,1000,1000,800] [1000,1000,1000,600]490.9 W490.9 W100%0.13 s
Two (Moderate shading)[1000,1000,800,800] [1000,1000,500,500]435.5 W435.5 W100%0.139 s
Three (Strong shading)[1000,1000,600,400] [800,600,400,200]257.4 W257.4 W100%0.137 s
Four (Strong shading)[1000,1000,600,400] [600,400,400,400]263.8 W263.8 W100%0.127 s
Table 4. Performance analysis of the proposed algorithm under a sequence of four cases.
Case Three (Strong Shading 0–0.4 s)257.4 W257.4 W100%
Case Two (Moderate shading 0.4–0.8 s)435.5 W435.5 W100%
Case Four (Strong shading 0.8–1.2 s)260.3 W263.8 W98.67%
Case One (Weak shading 1.2–1.6 s)490.9 W490.9 W100%
Table 5. Performance evaluation of the proposed algorithm compared with well-known MPPT algorithms.
Ref.YearConverter TypeSteady State OscillationsSpeed of TrackingTracking EfficiencyComplexity
Proposed algorithm2020Boost ConverterNilHighestHighestVery Low
[1]2019DC/DC Buck converterLowHighHighReasonable
[27]2018Boost ConverterLowHighHighHigh
[17]2015Boost ConverterLowHighAverageReasonable
[16]2015SEPIC converterLowHighLowMedium
[18]2012Buck converterHighHighMediumHigh
[28]2018Boost converterHighHighMediumHigh
[10]2017Boost converterMediumHighMediumHigh
[9]2016SEPIC converterLowHighHighHigh

