
High-Rise Residential District Morphology Optimization for Enhancing the Green Space Cooling Effect

Abstract
:1. Introduction
1.1. Mitigation Effects of Urban Green Spaces on UHI
1.2. Residential Block Spatial Morphology and Urban Climate
1.3. Motivation and Objective
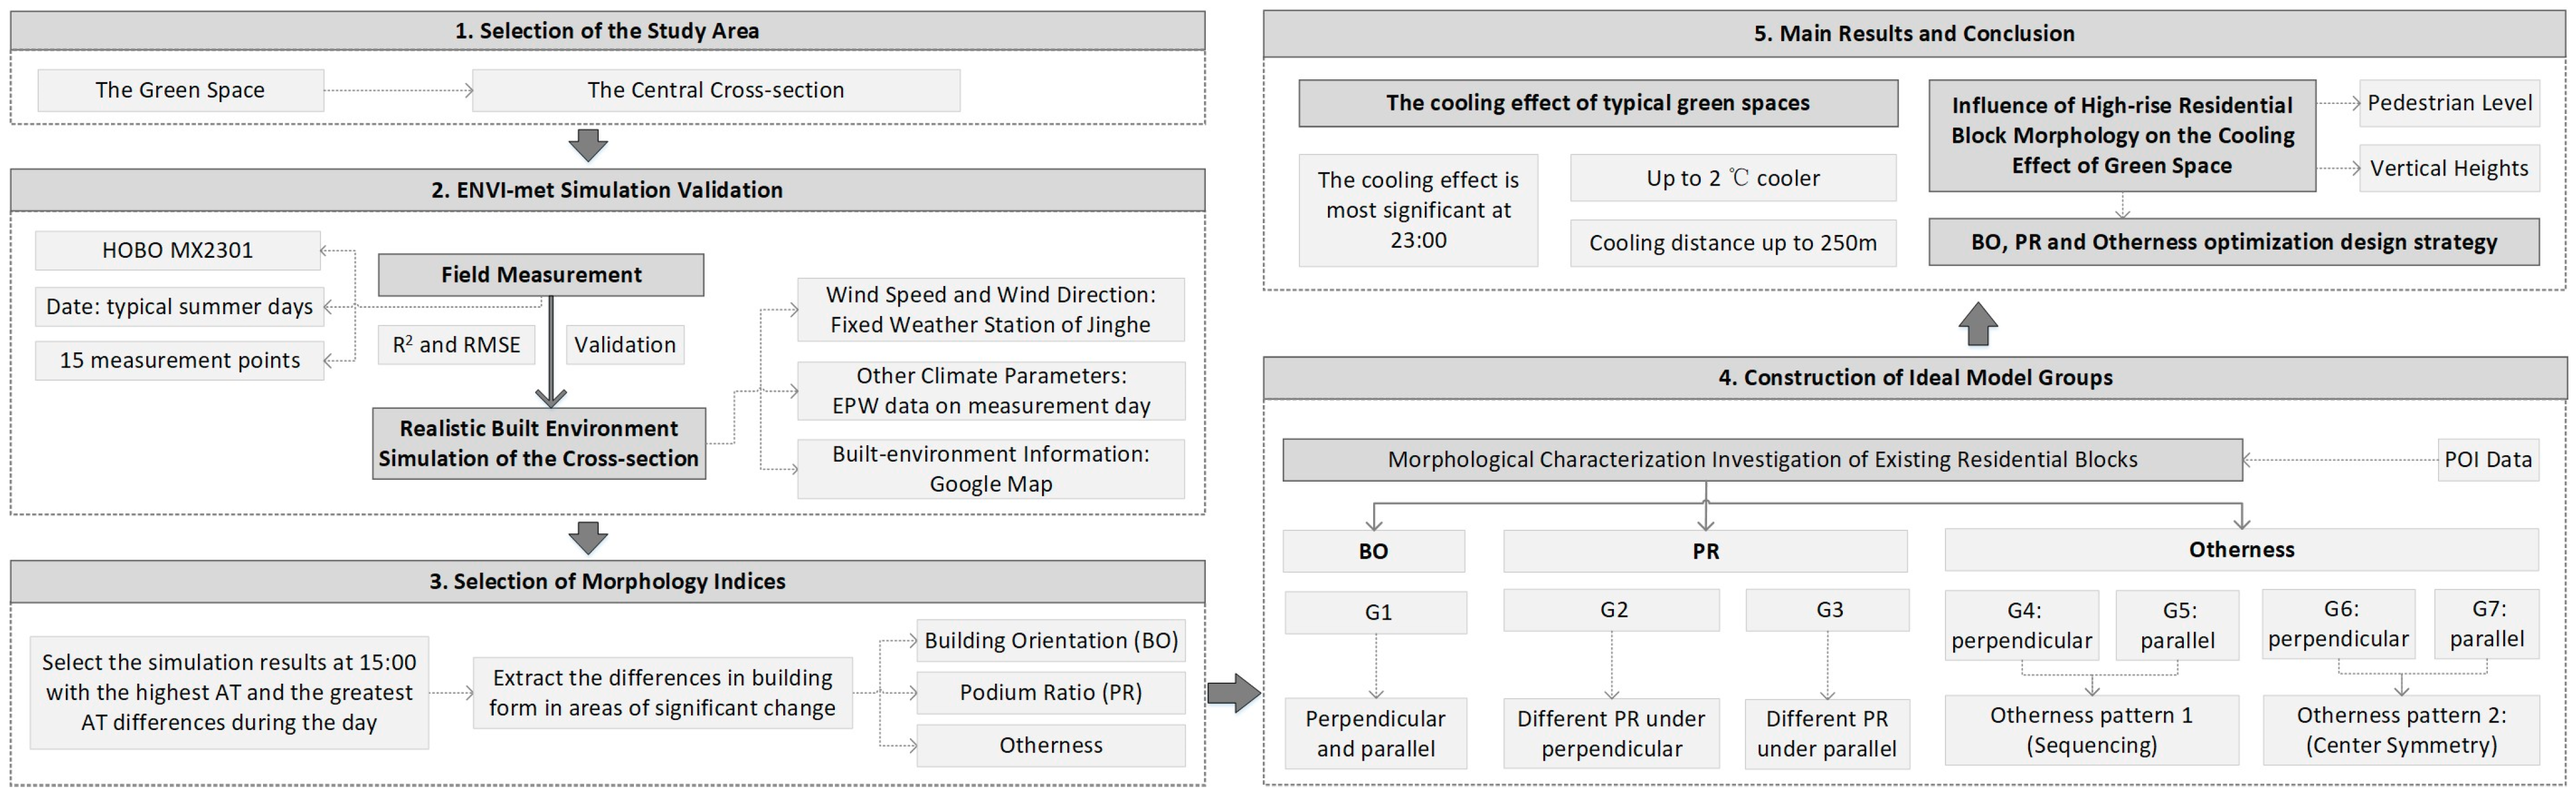
2. Materials and Methods
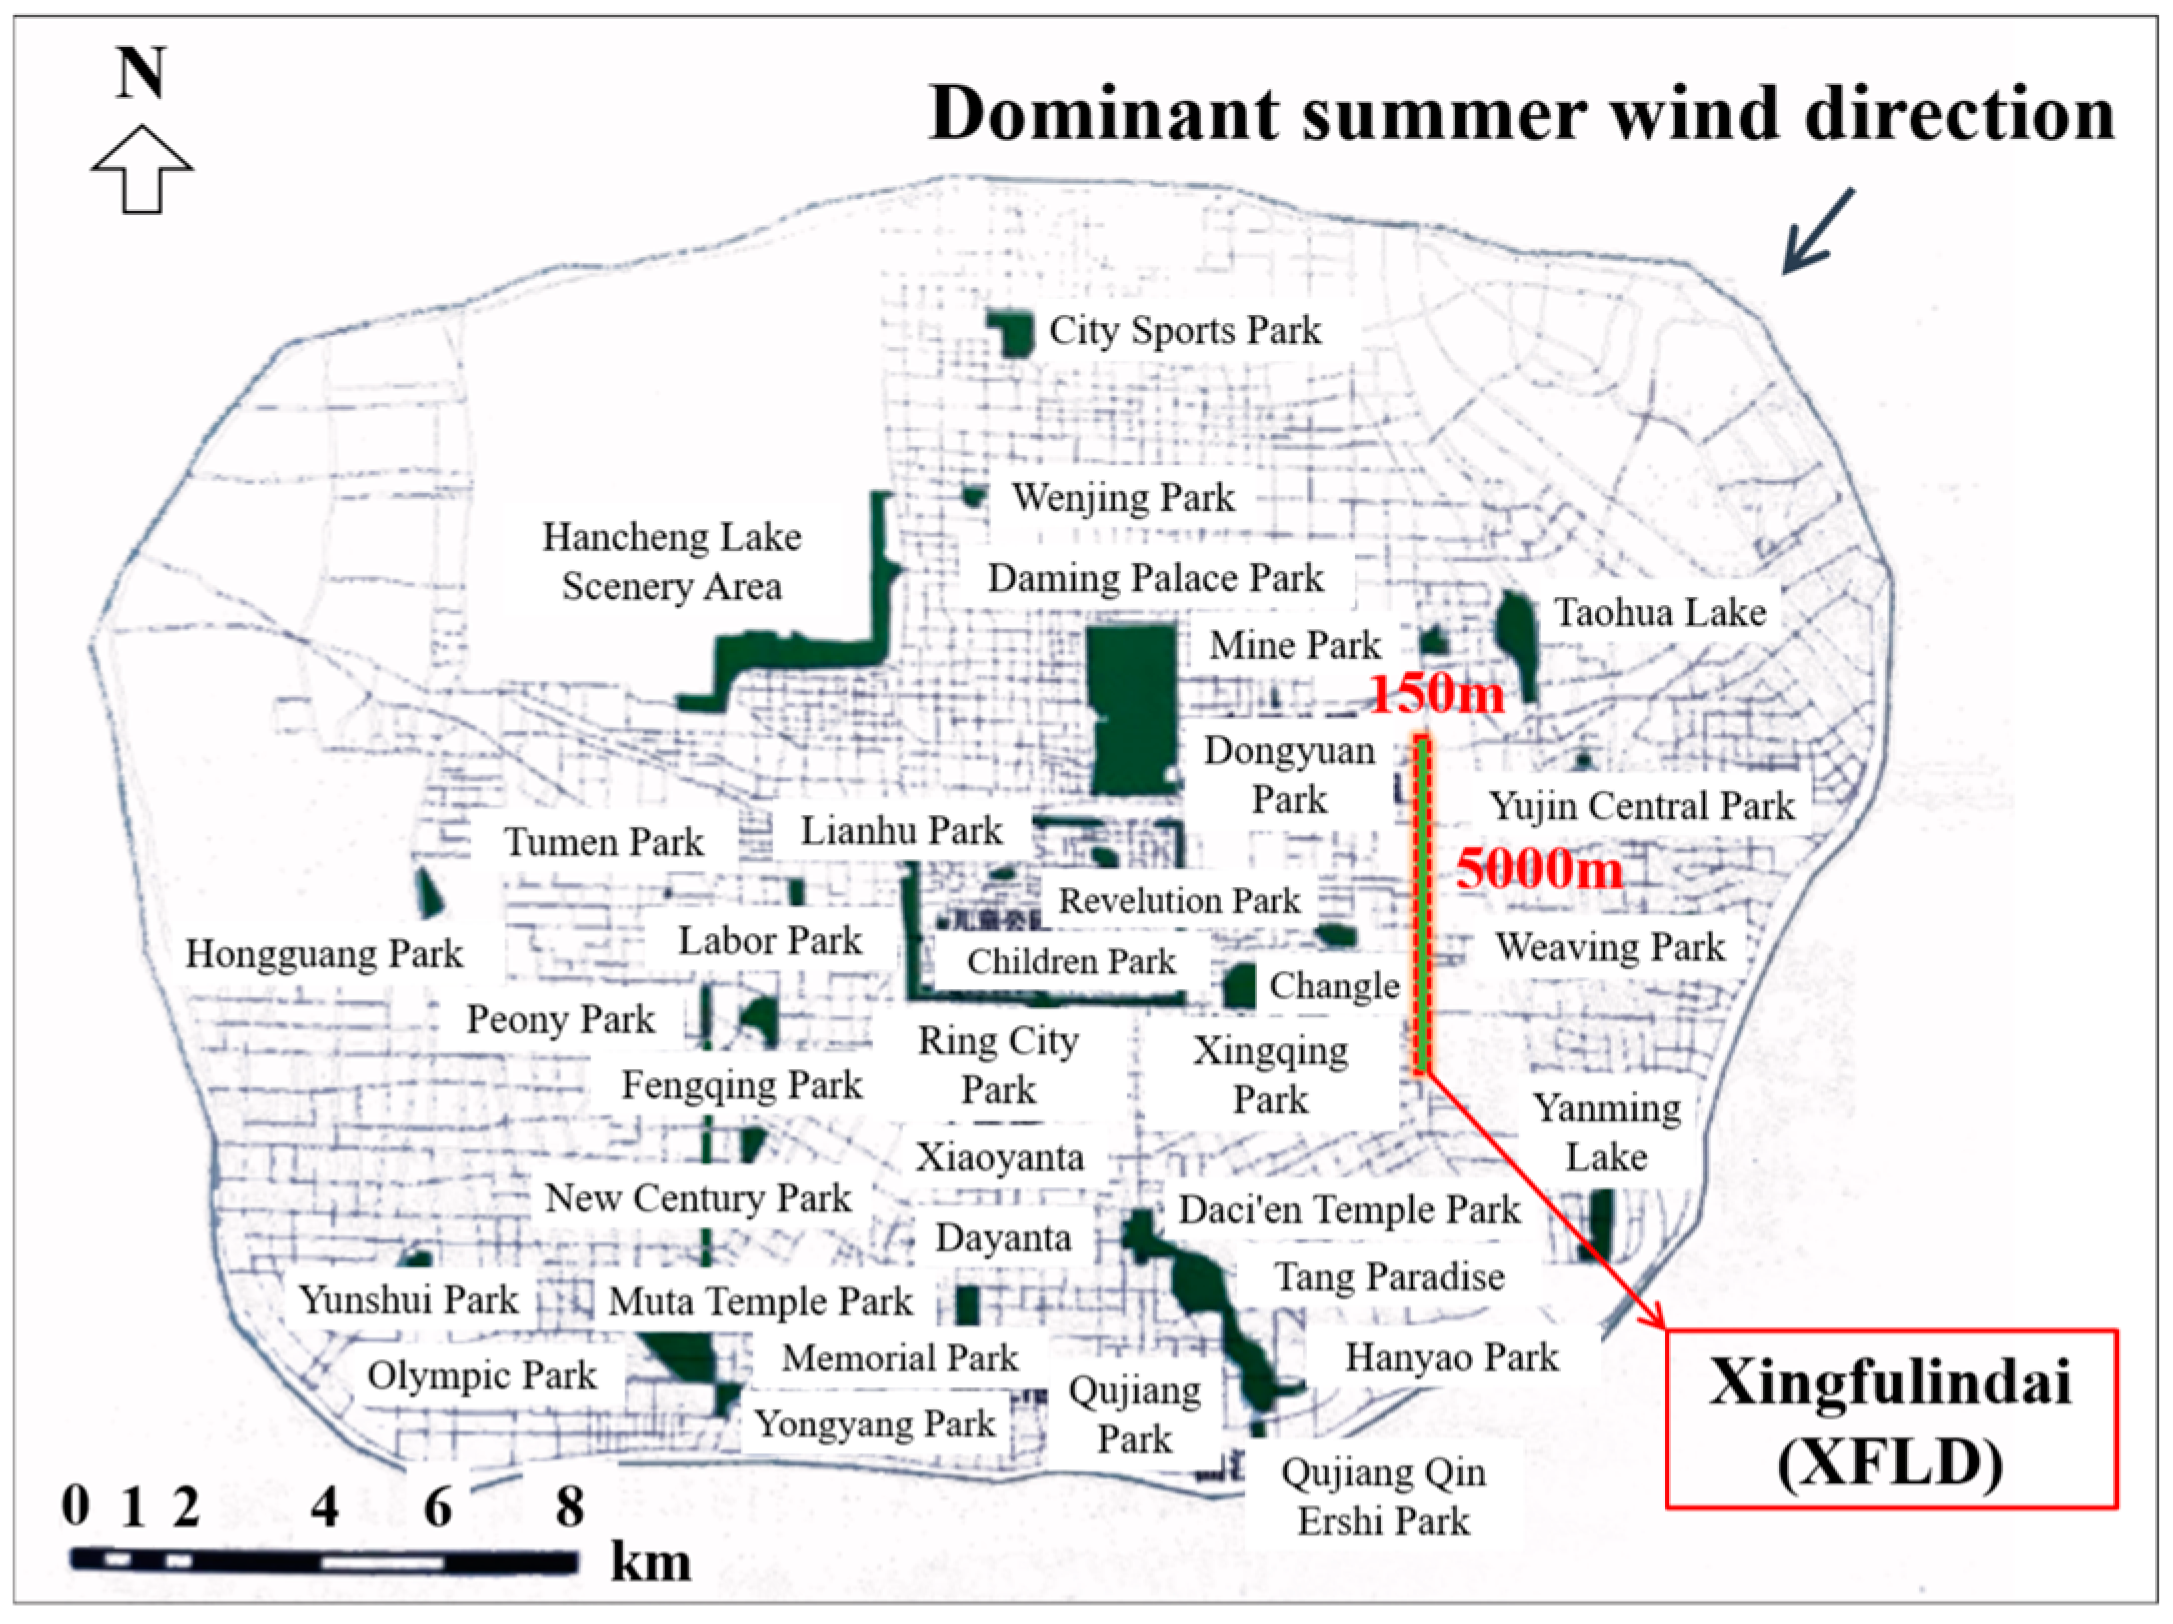
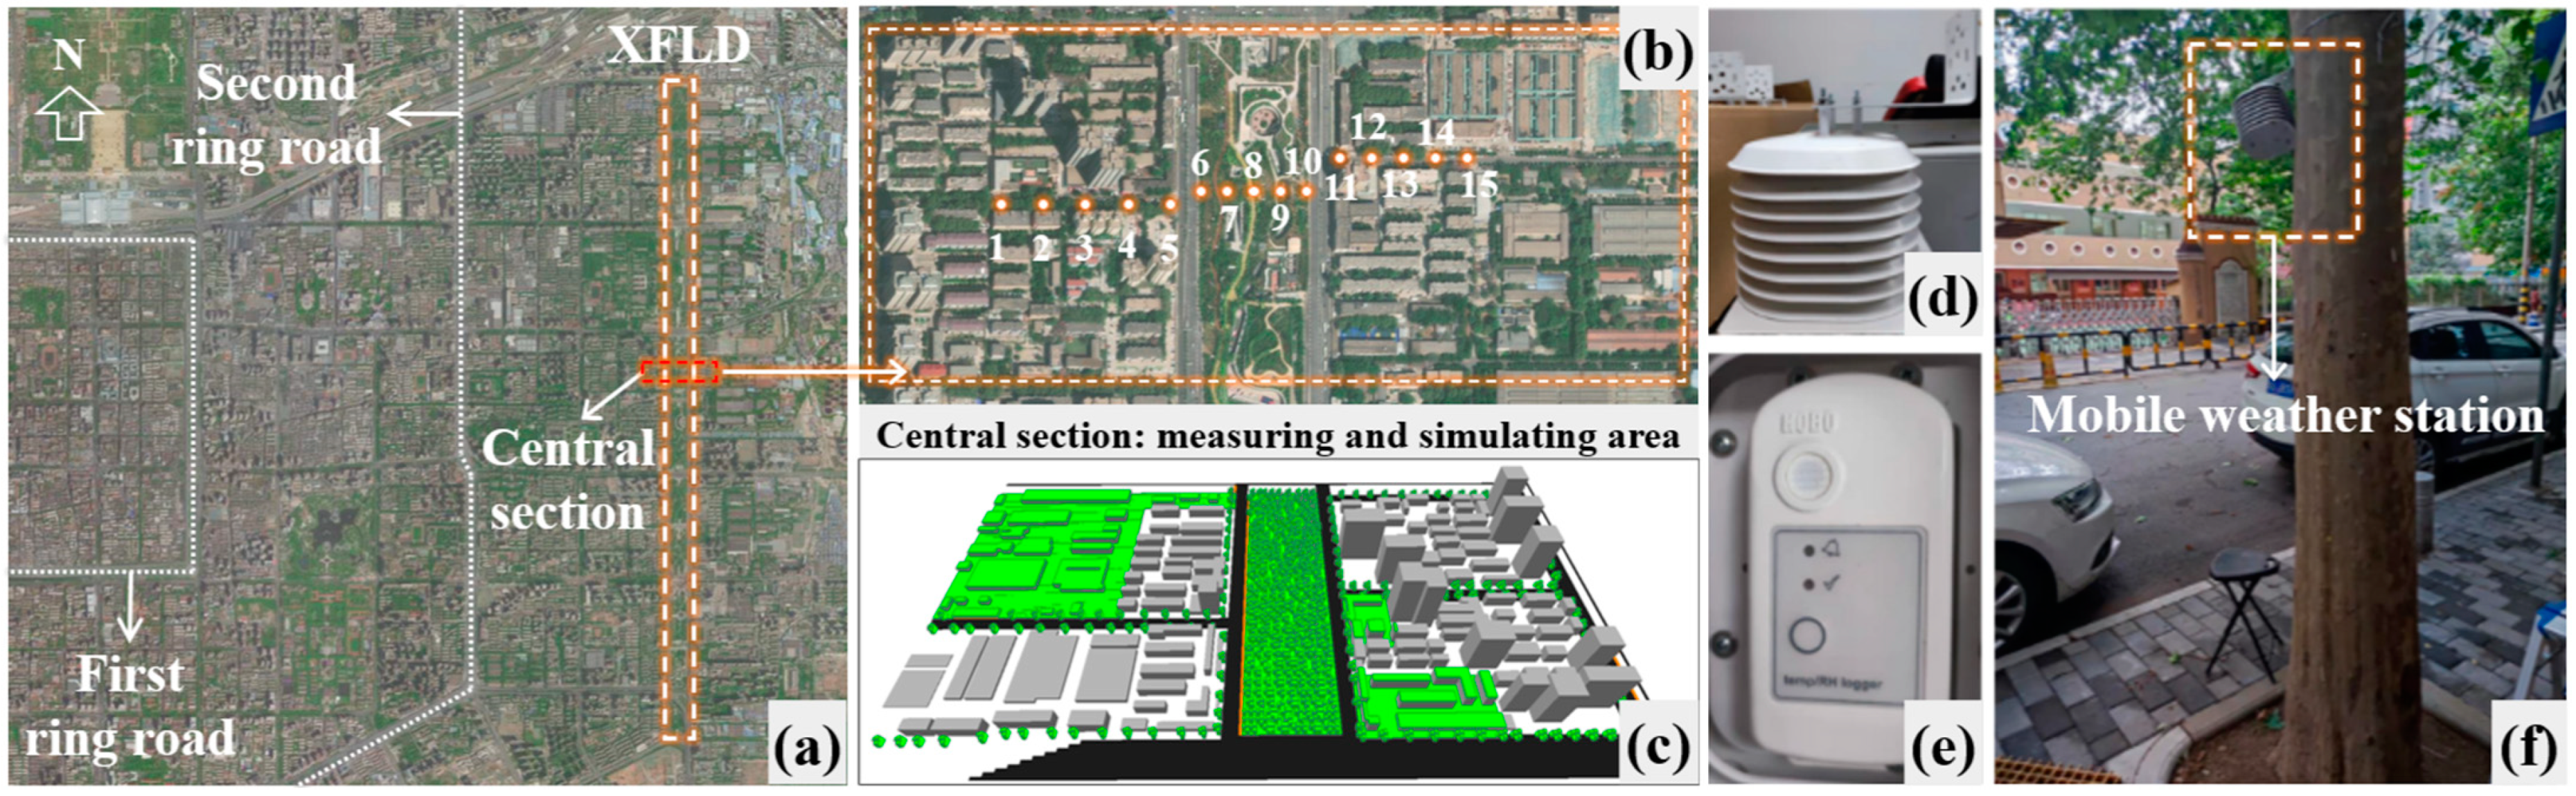
2.1. Selection of Study Area
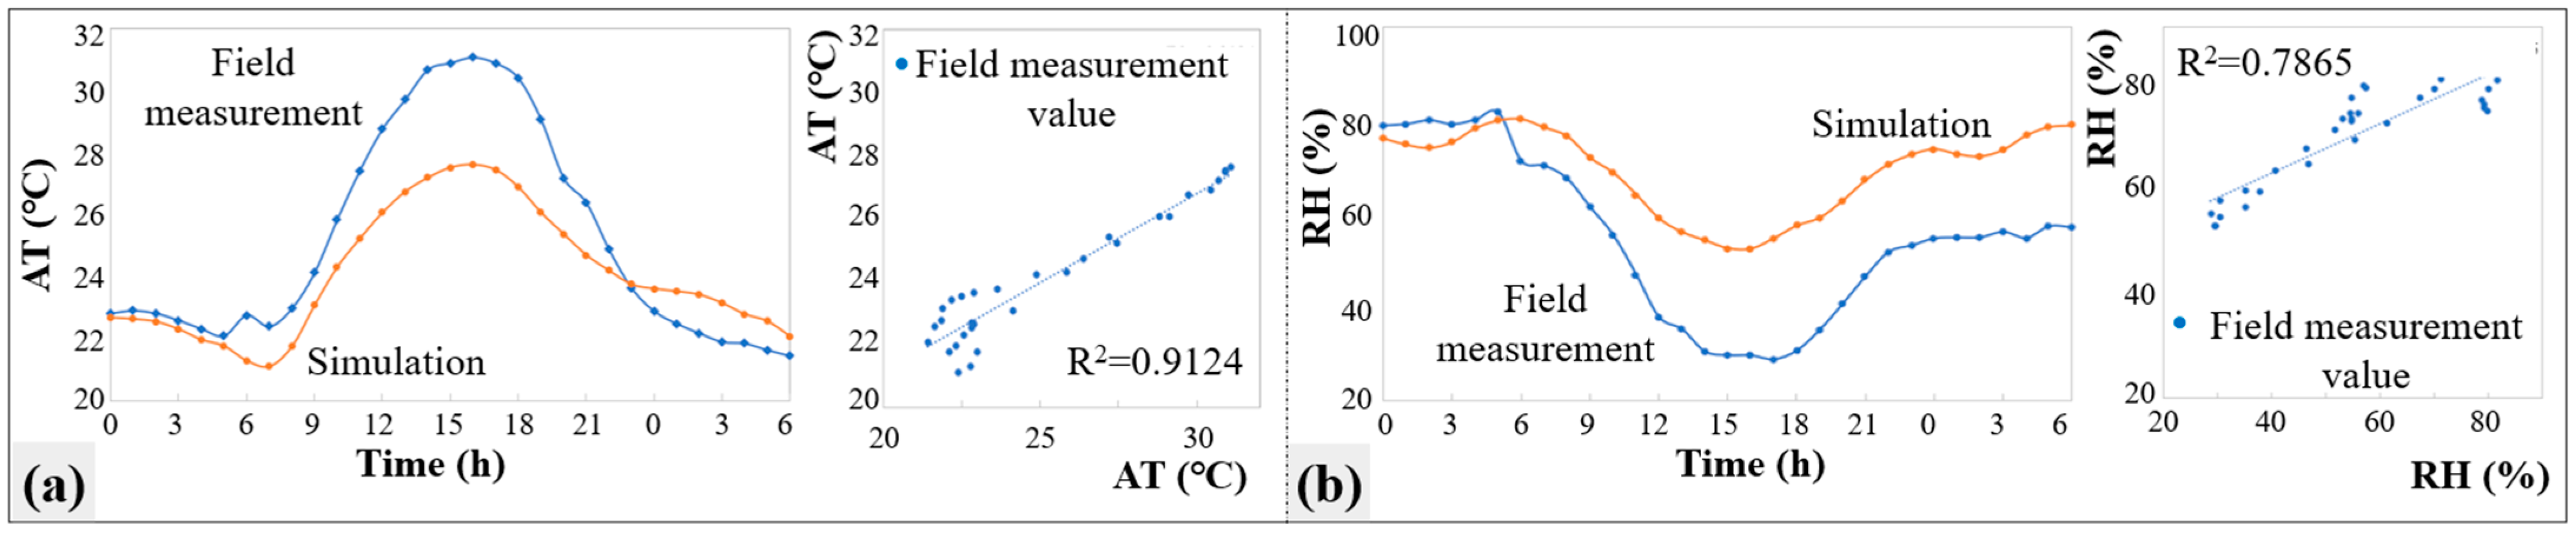
2.2. Evaluation of Simulation Software
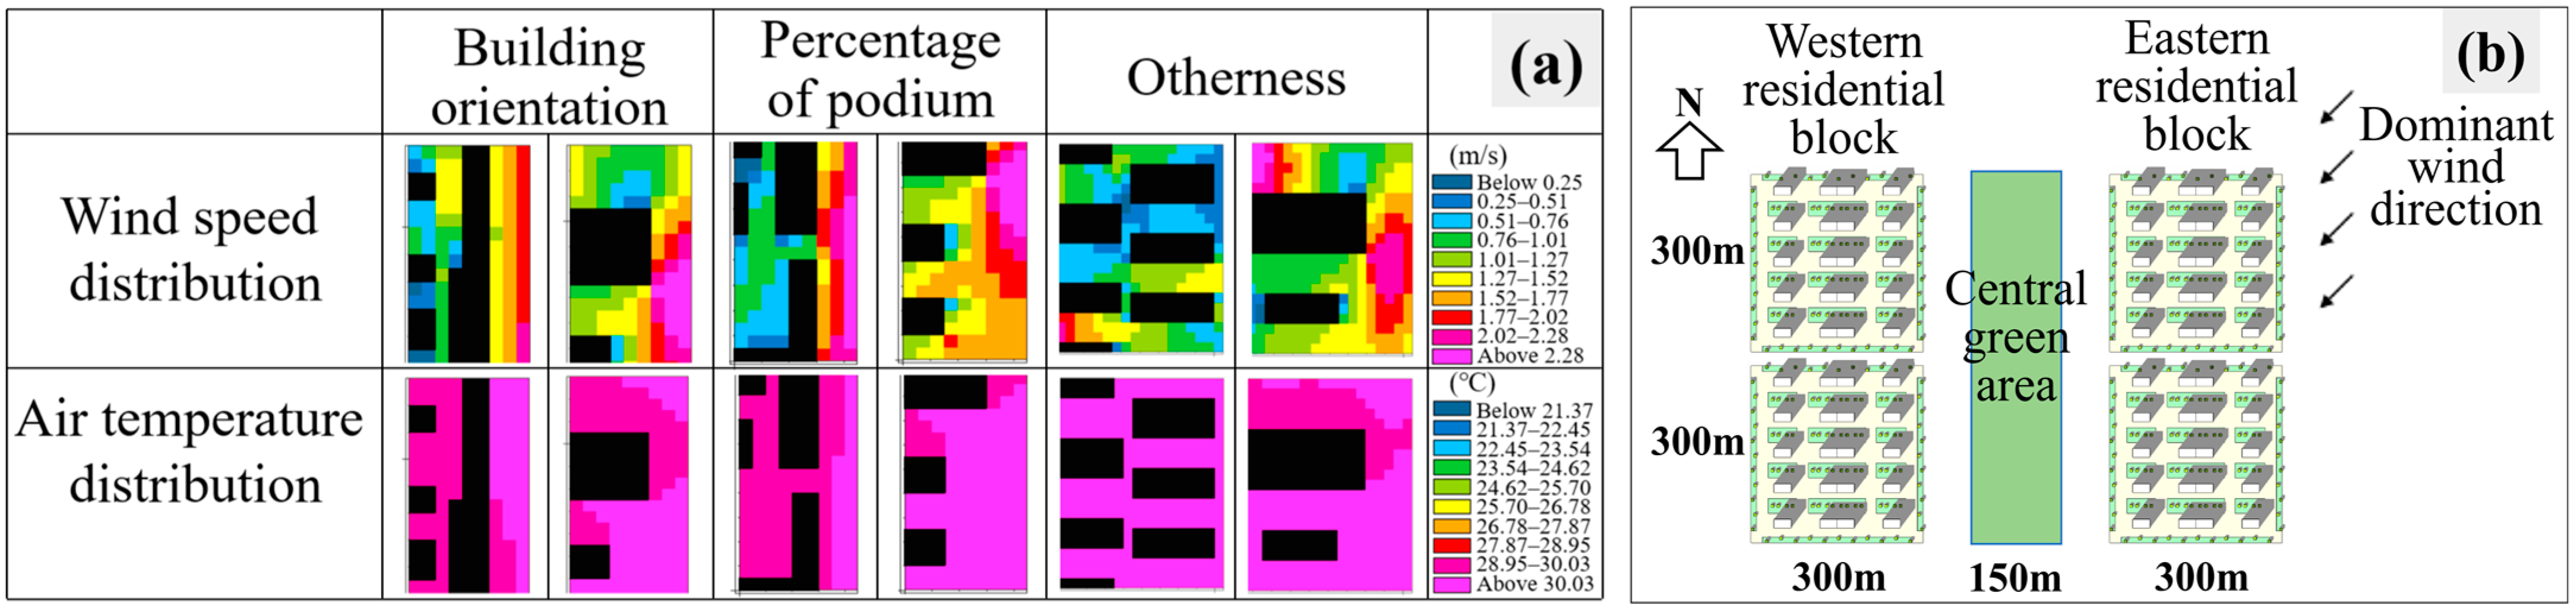
2.3. Selection of Morphological Indices
2.4. Modeling of Typical Residential Blocks
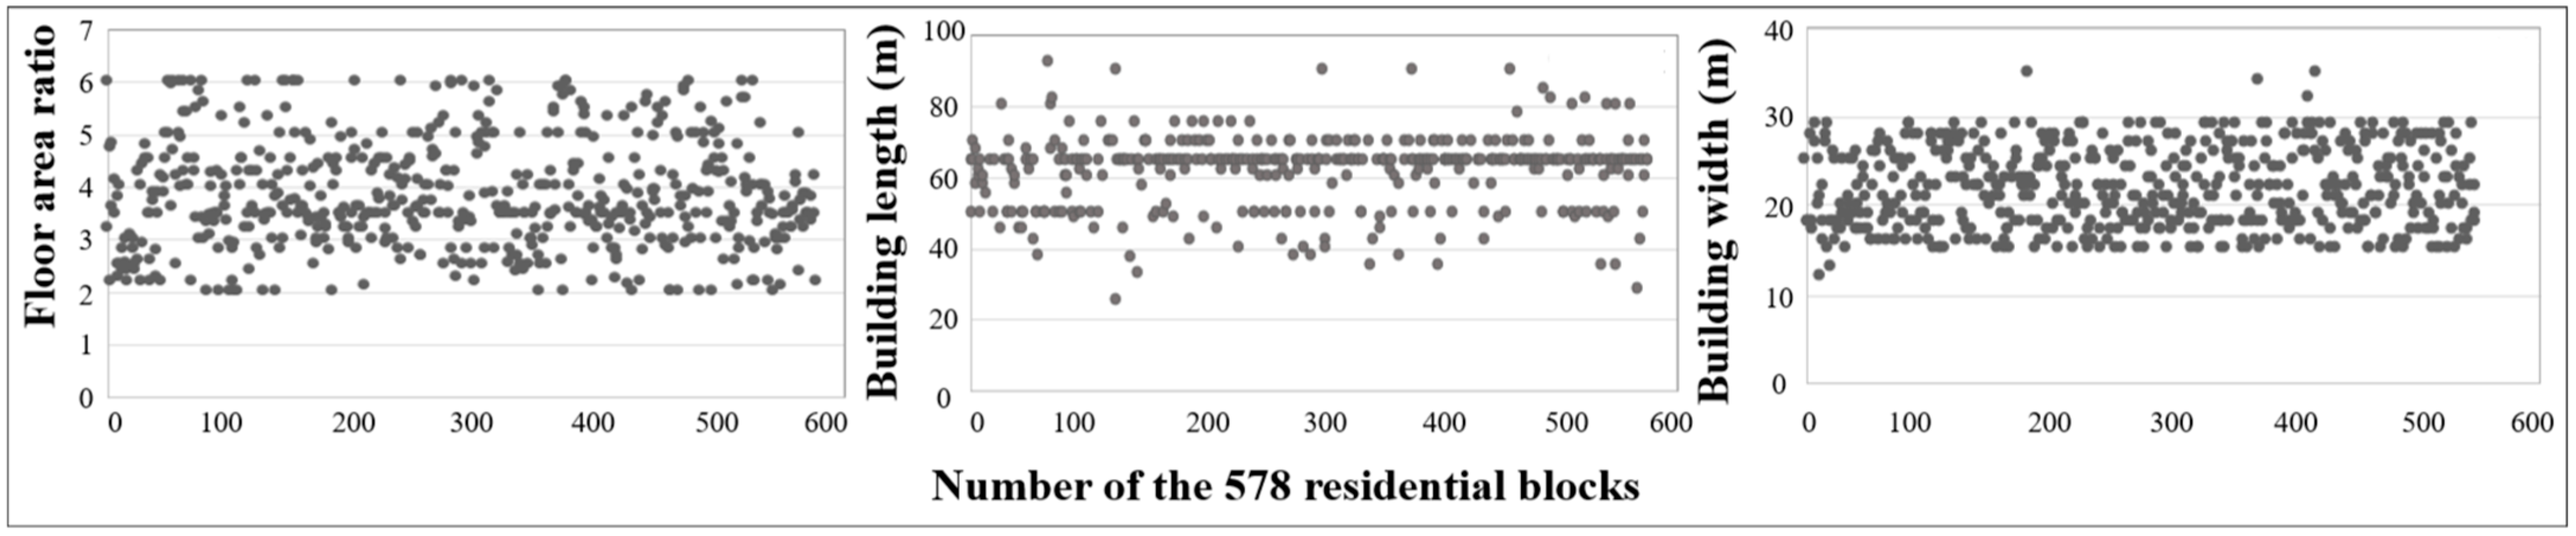
2.4.1. Morphological Characterization Investigation of Existing Residential Blocks
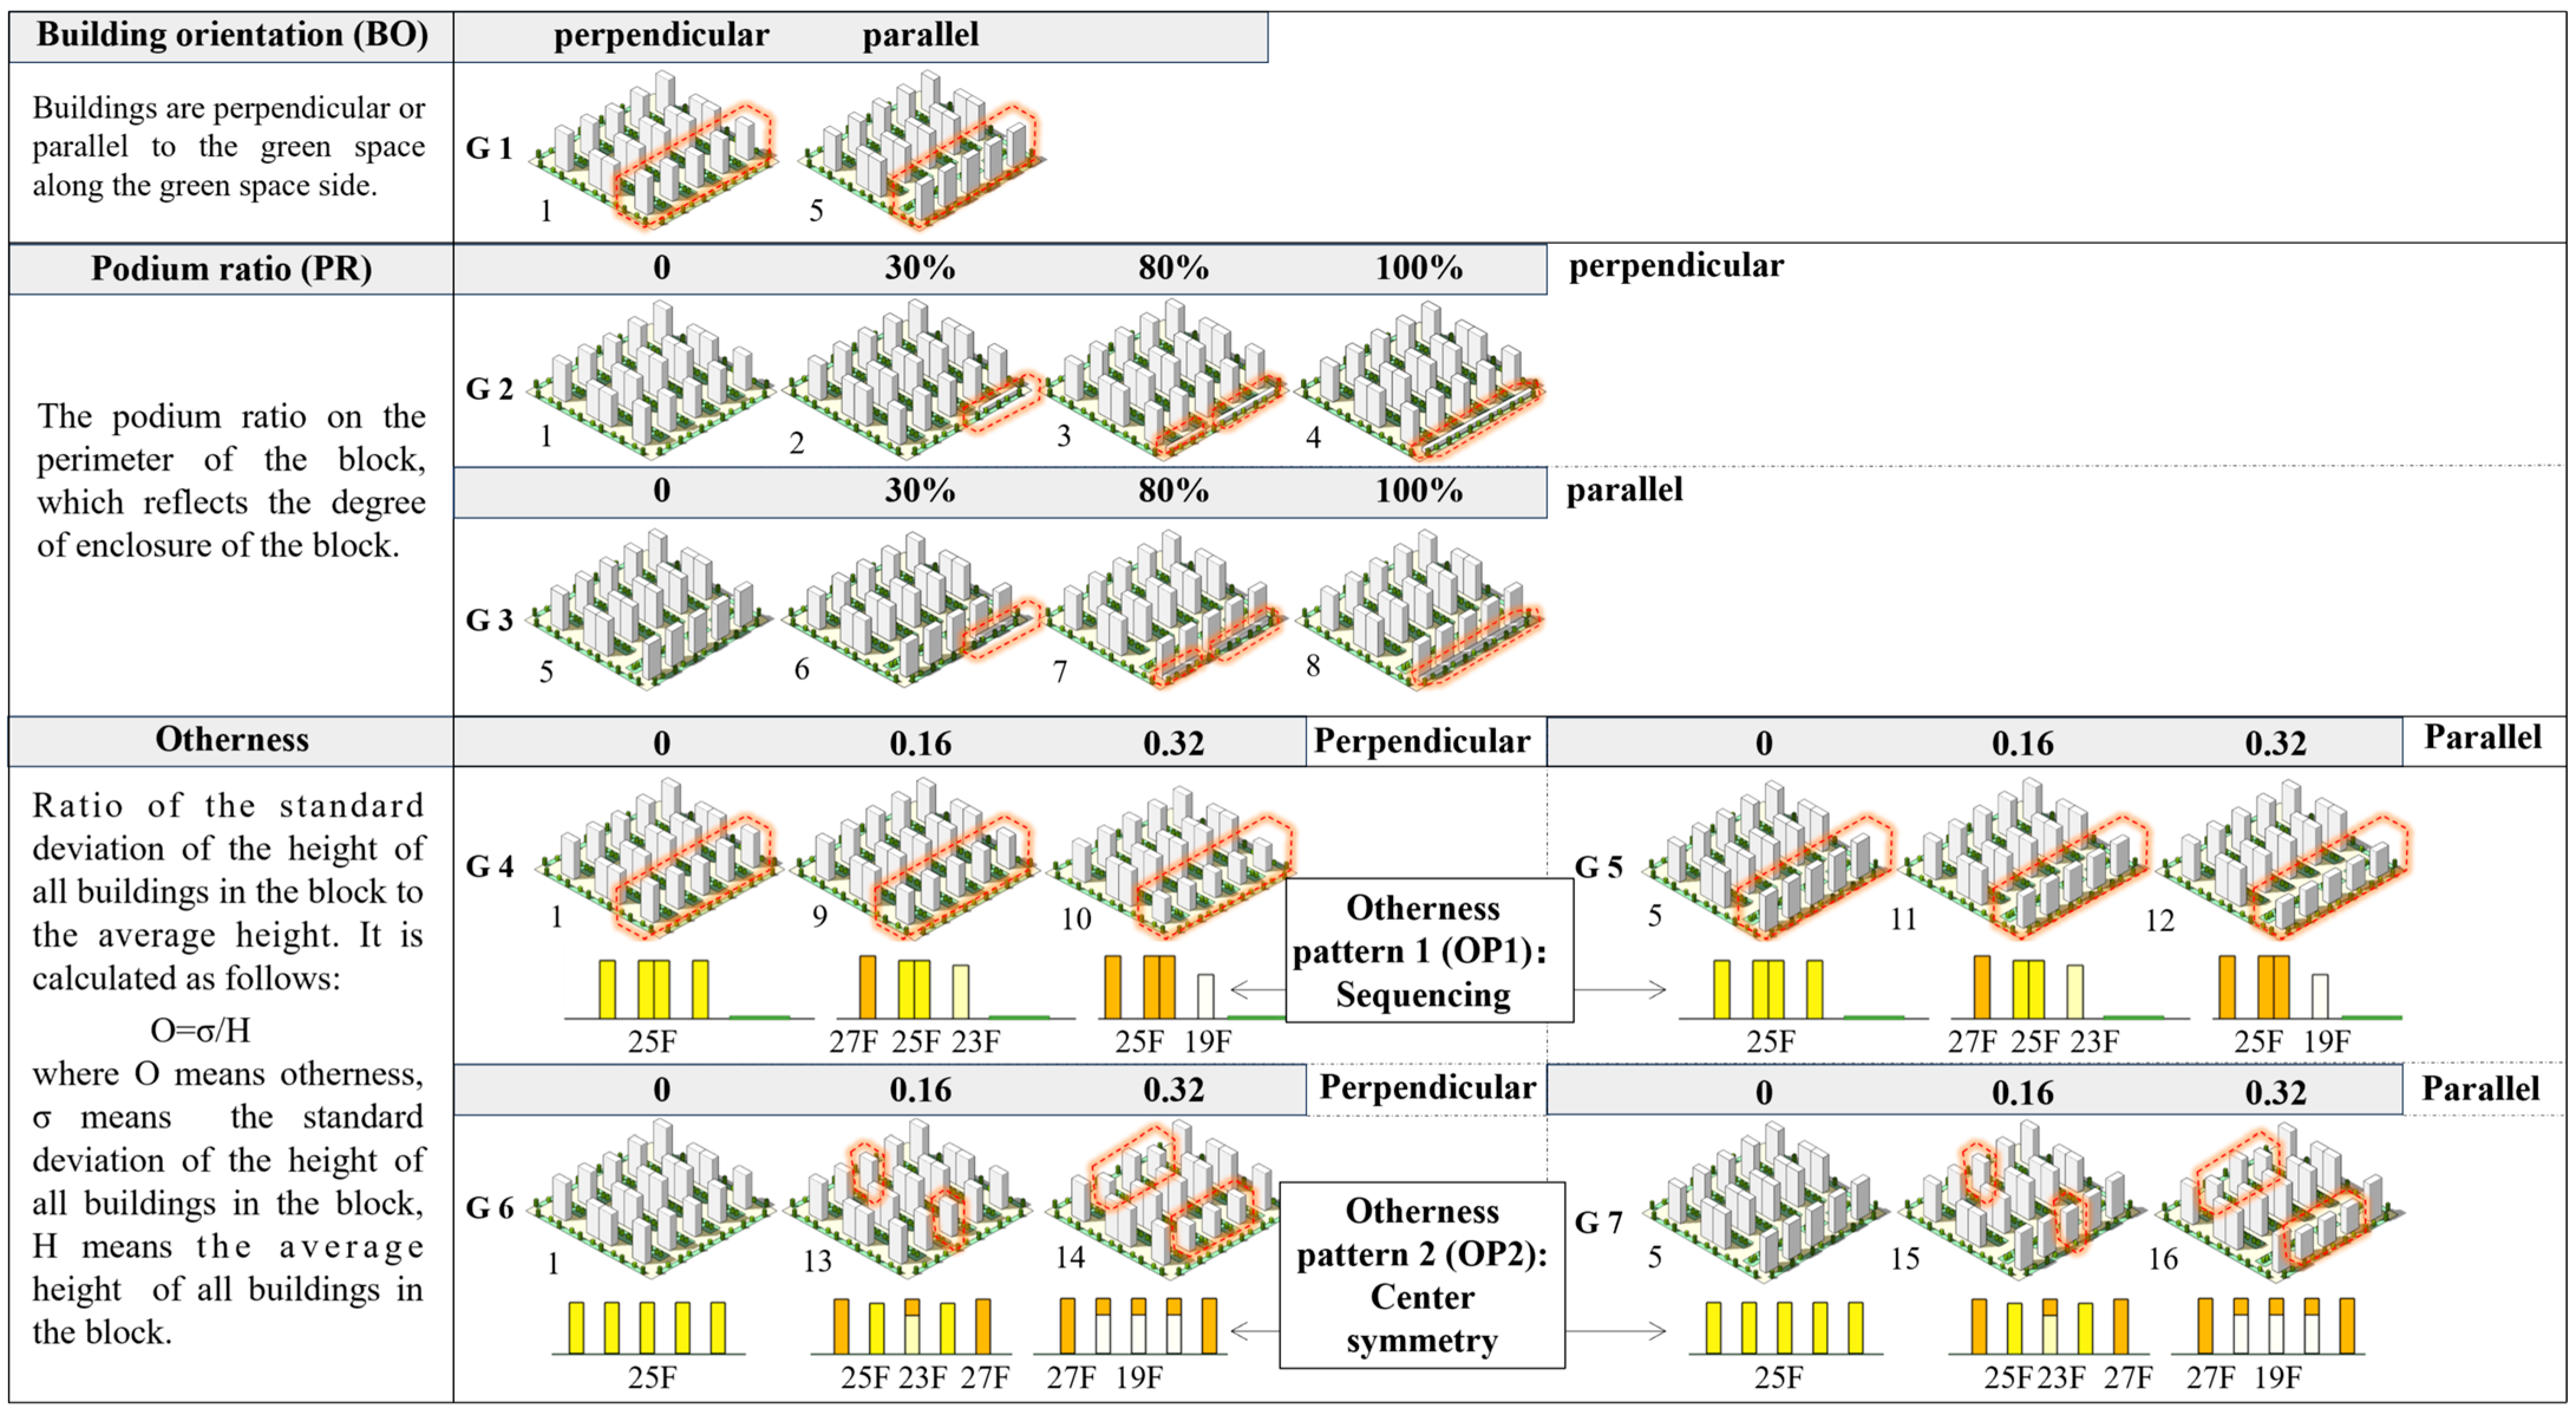
2.4.2. Construction of Three Ideal Model Groups
- For BO, two models were set up, one perpendicular and one parallel to the green space.
- For PR, four different PR values were set to represent different degrees of openness.
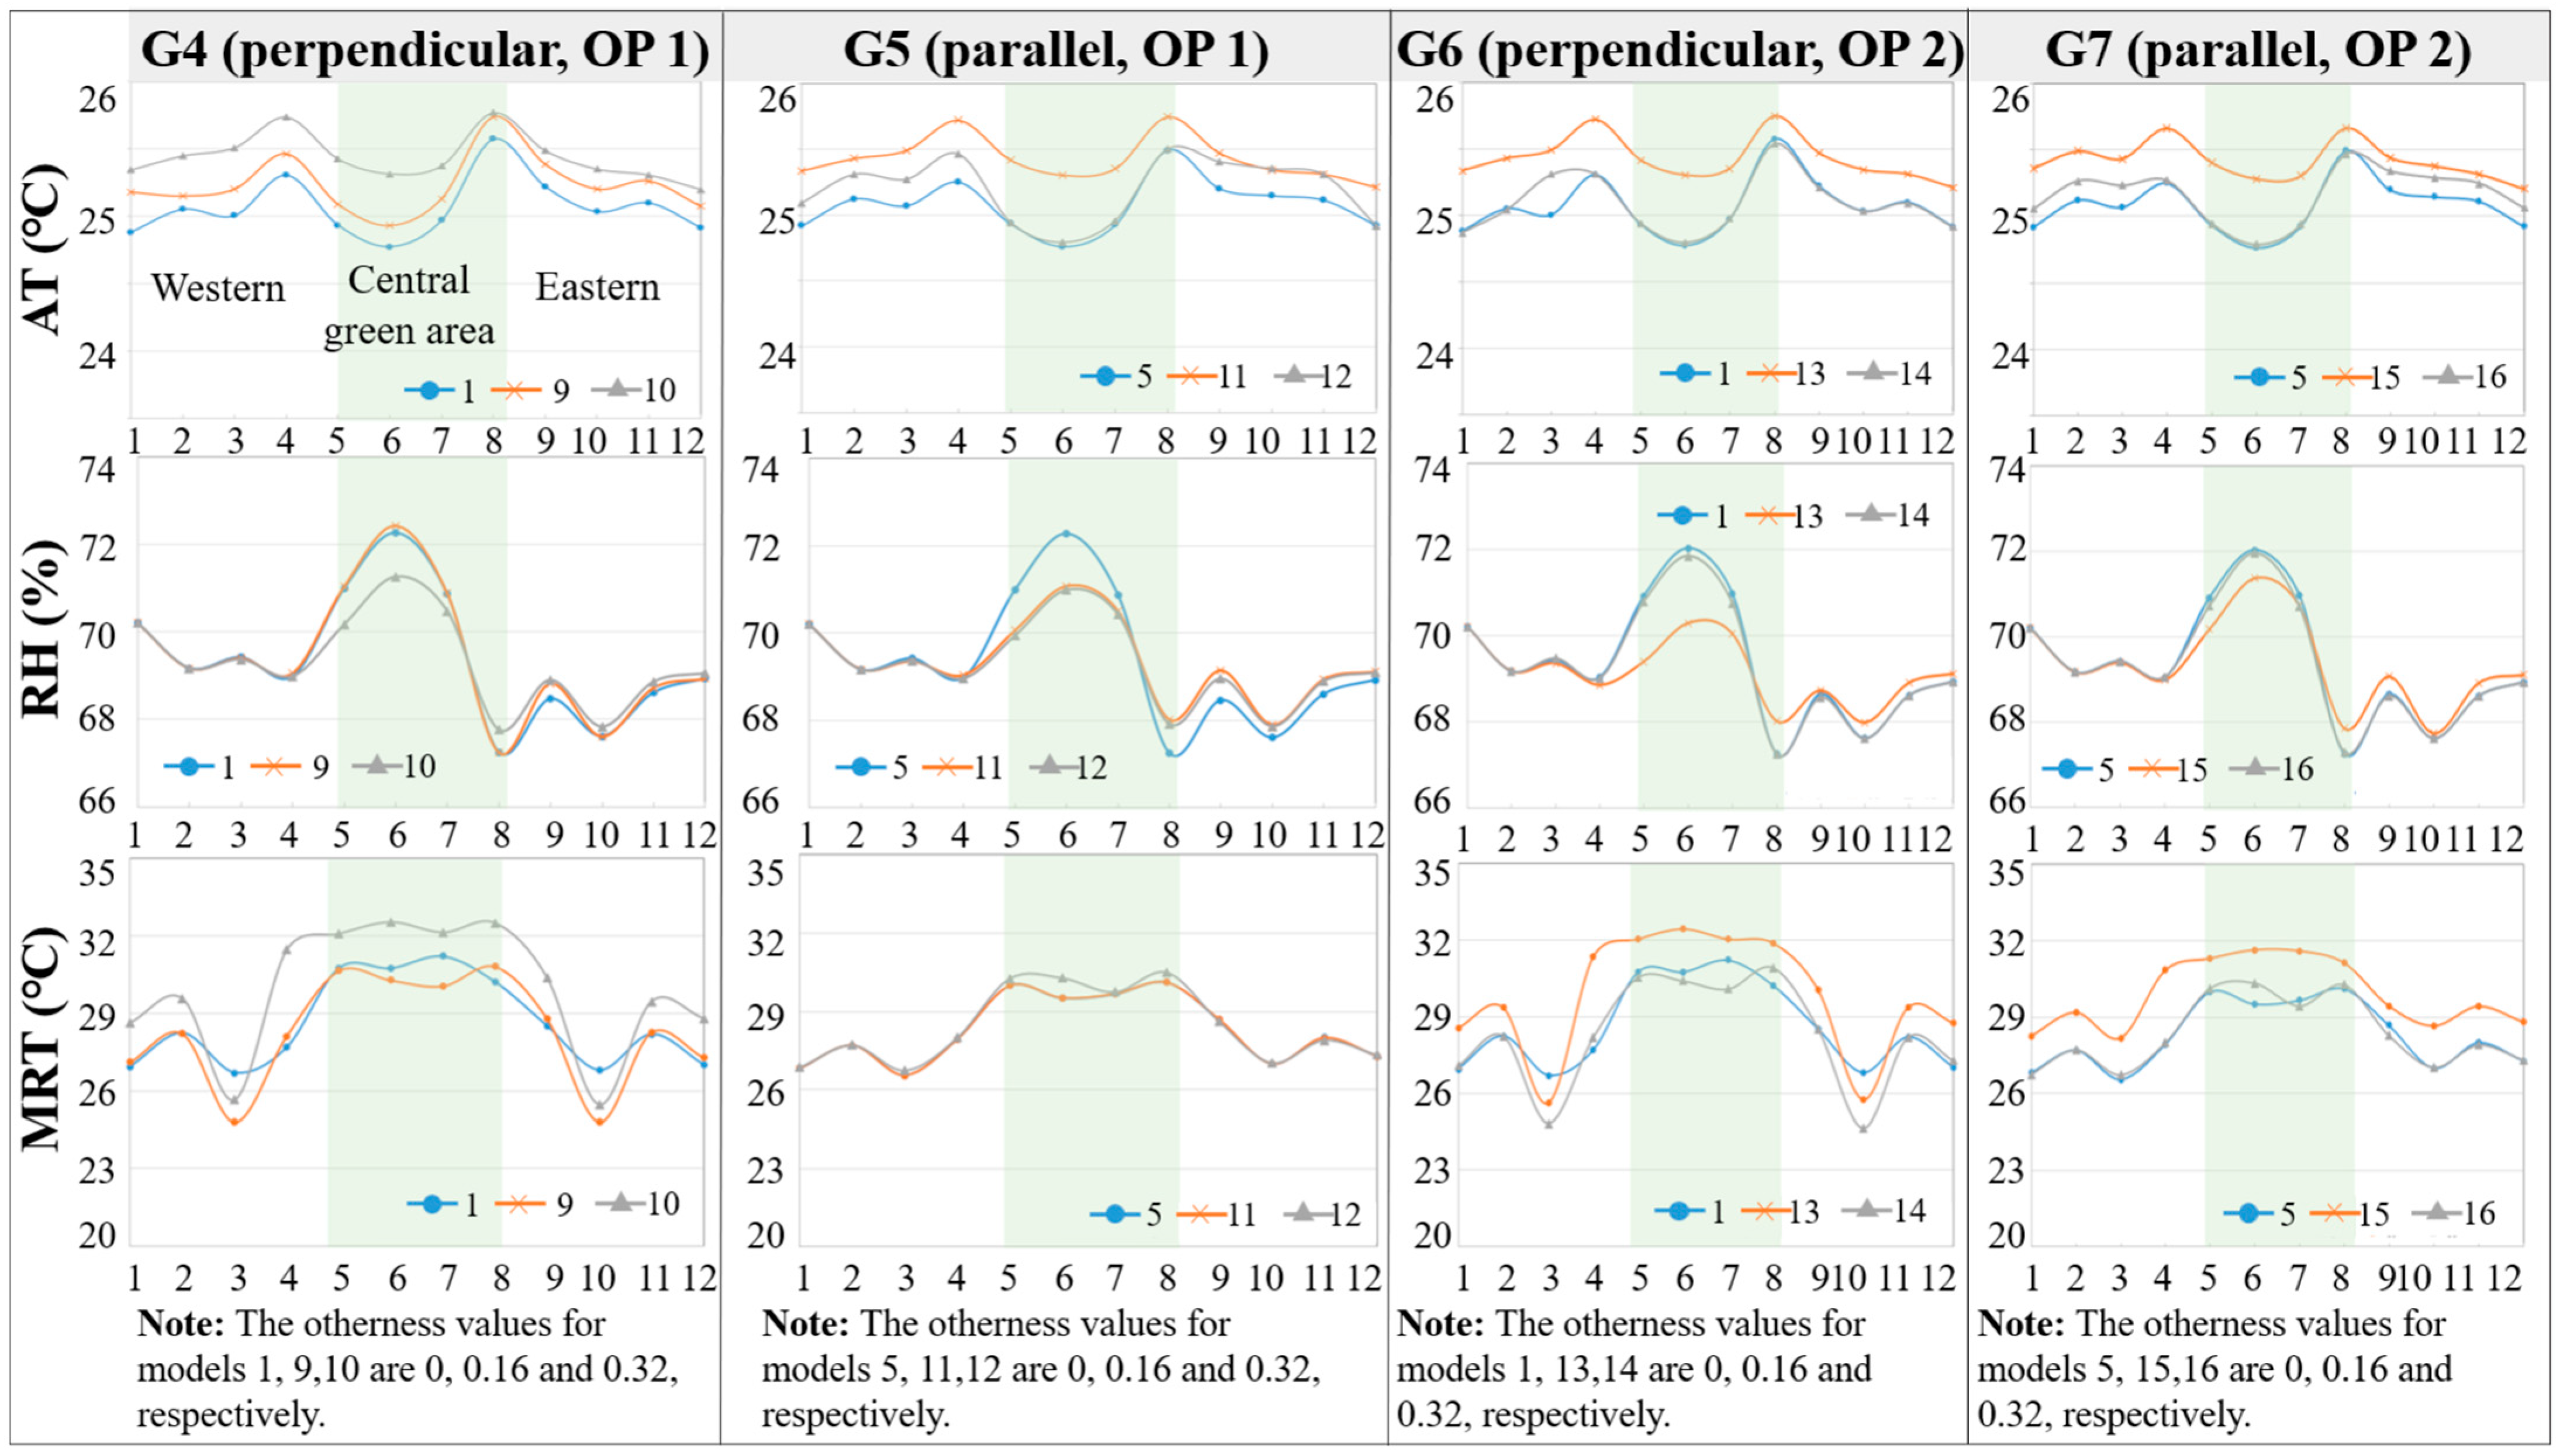
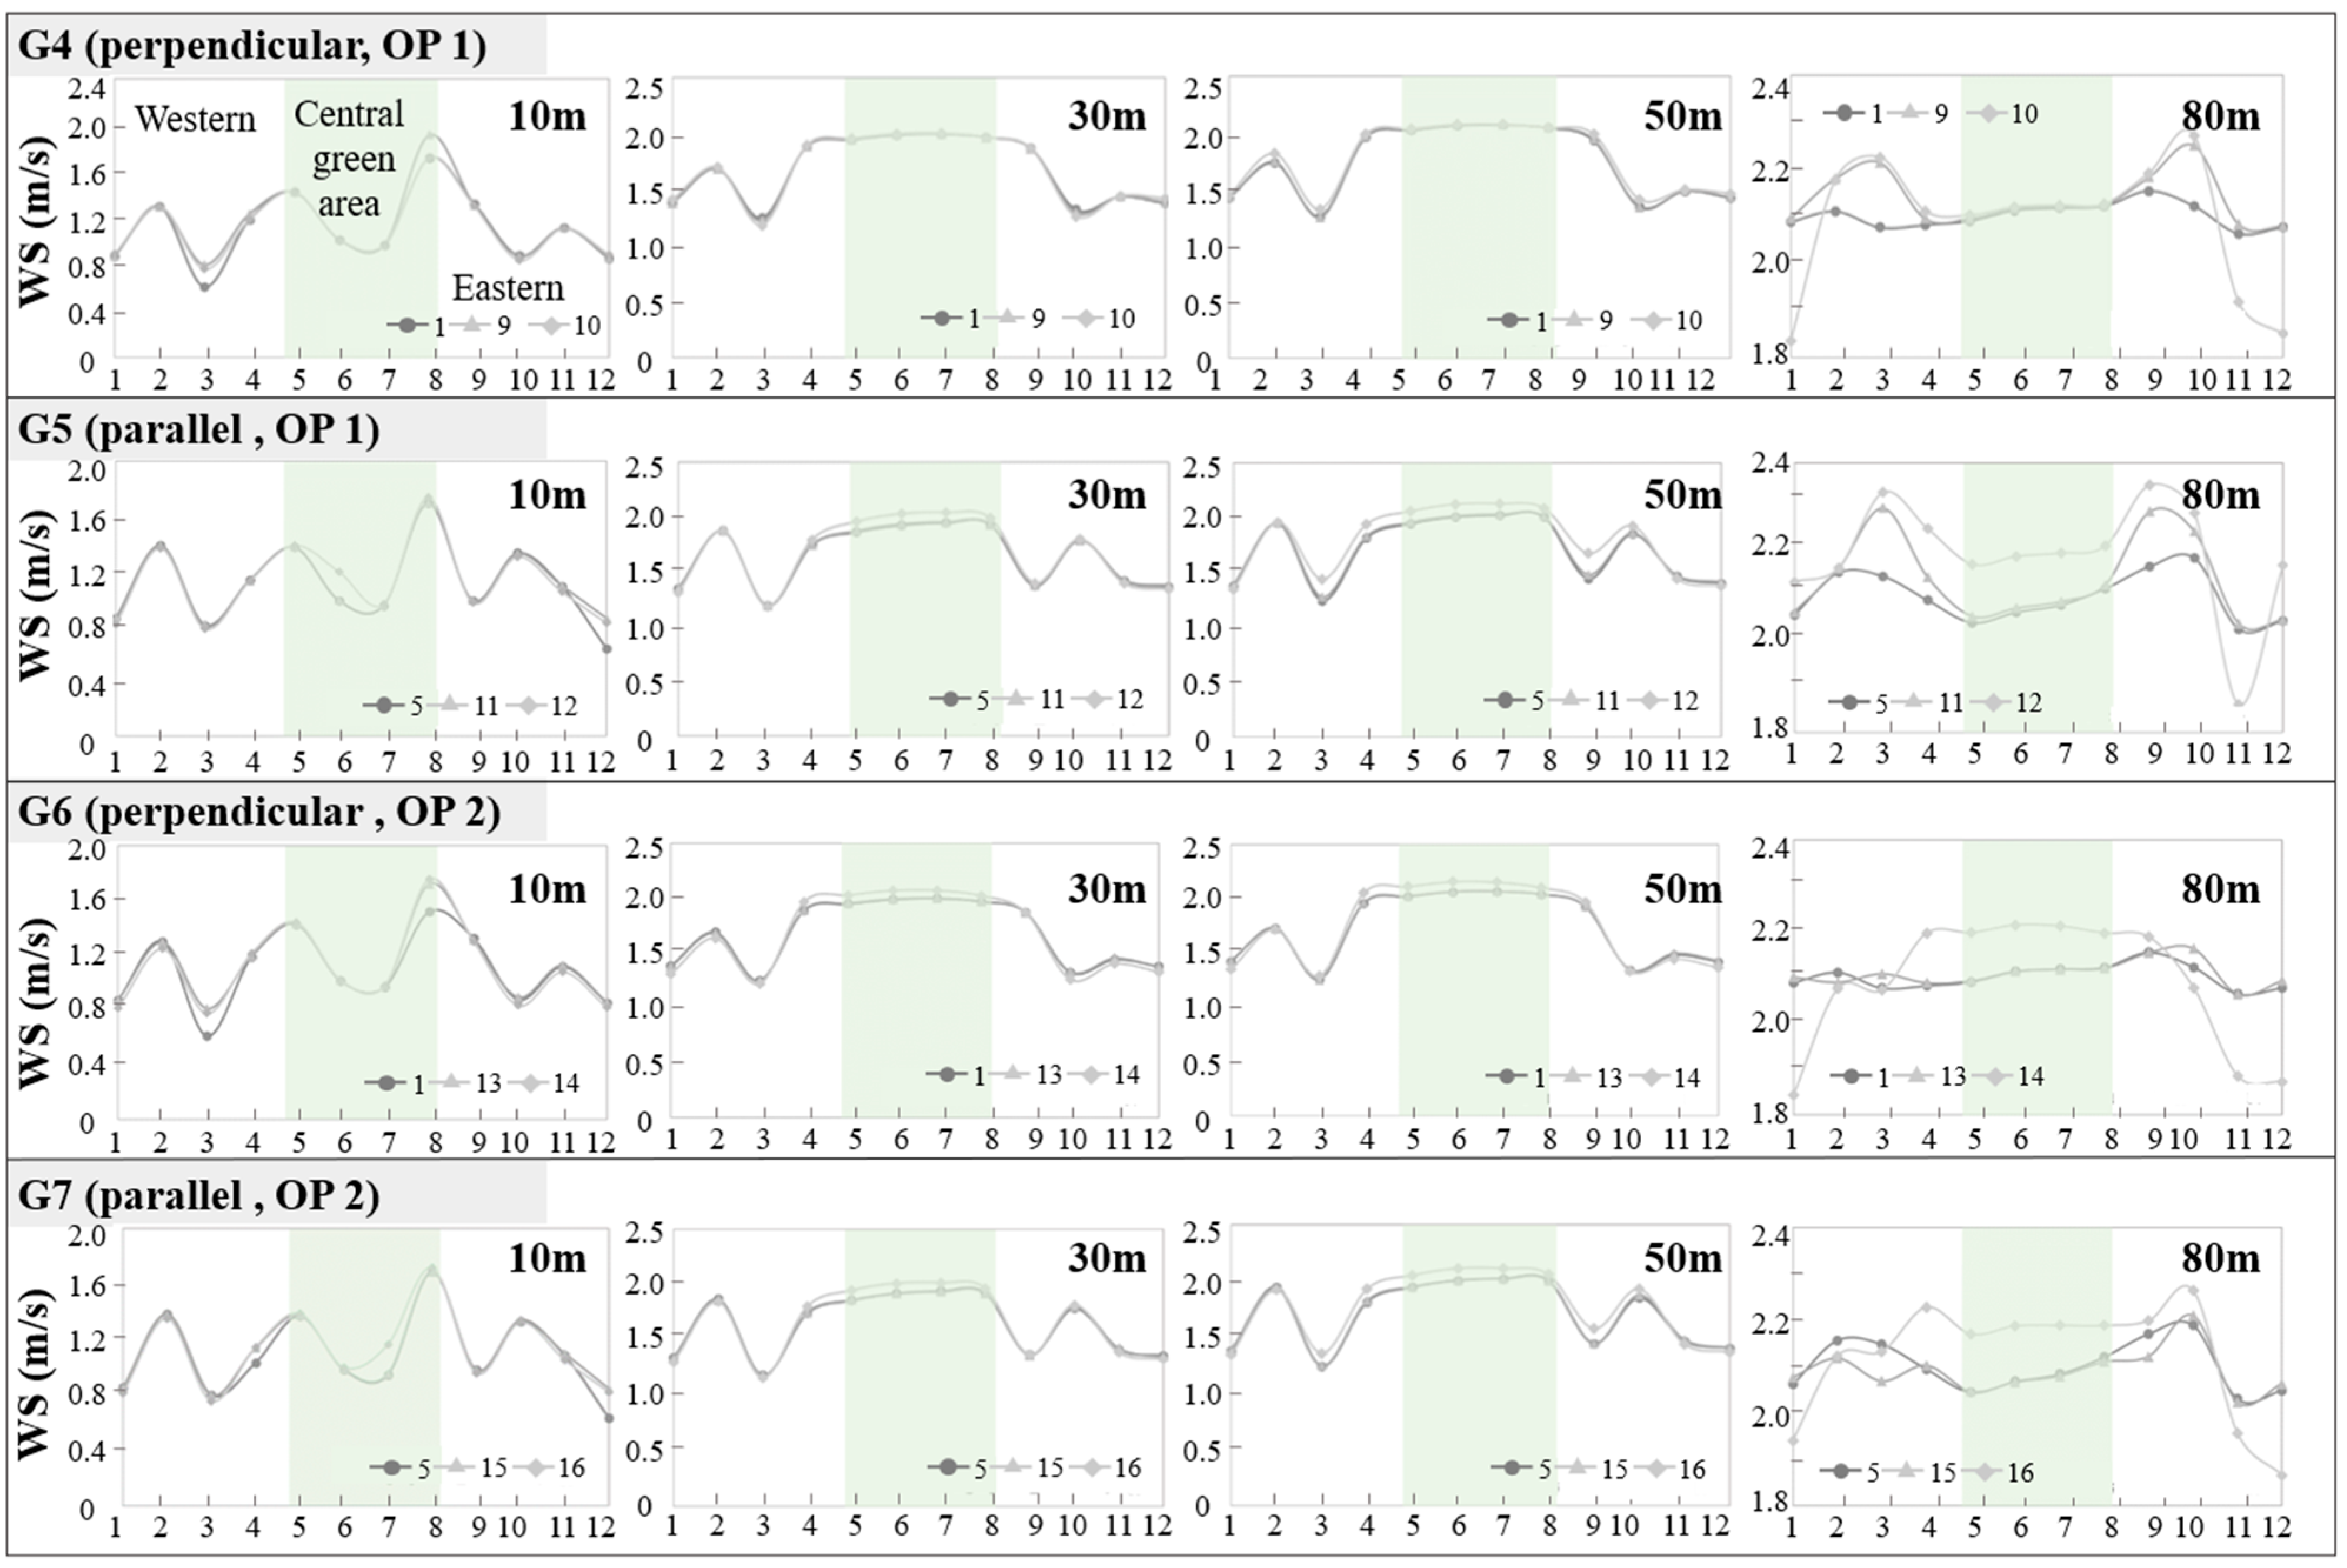
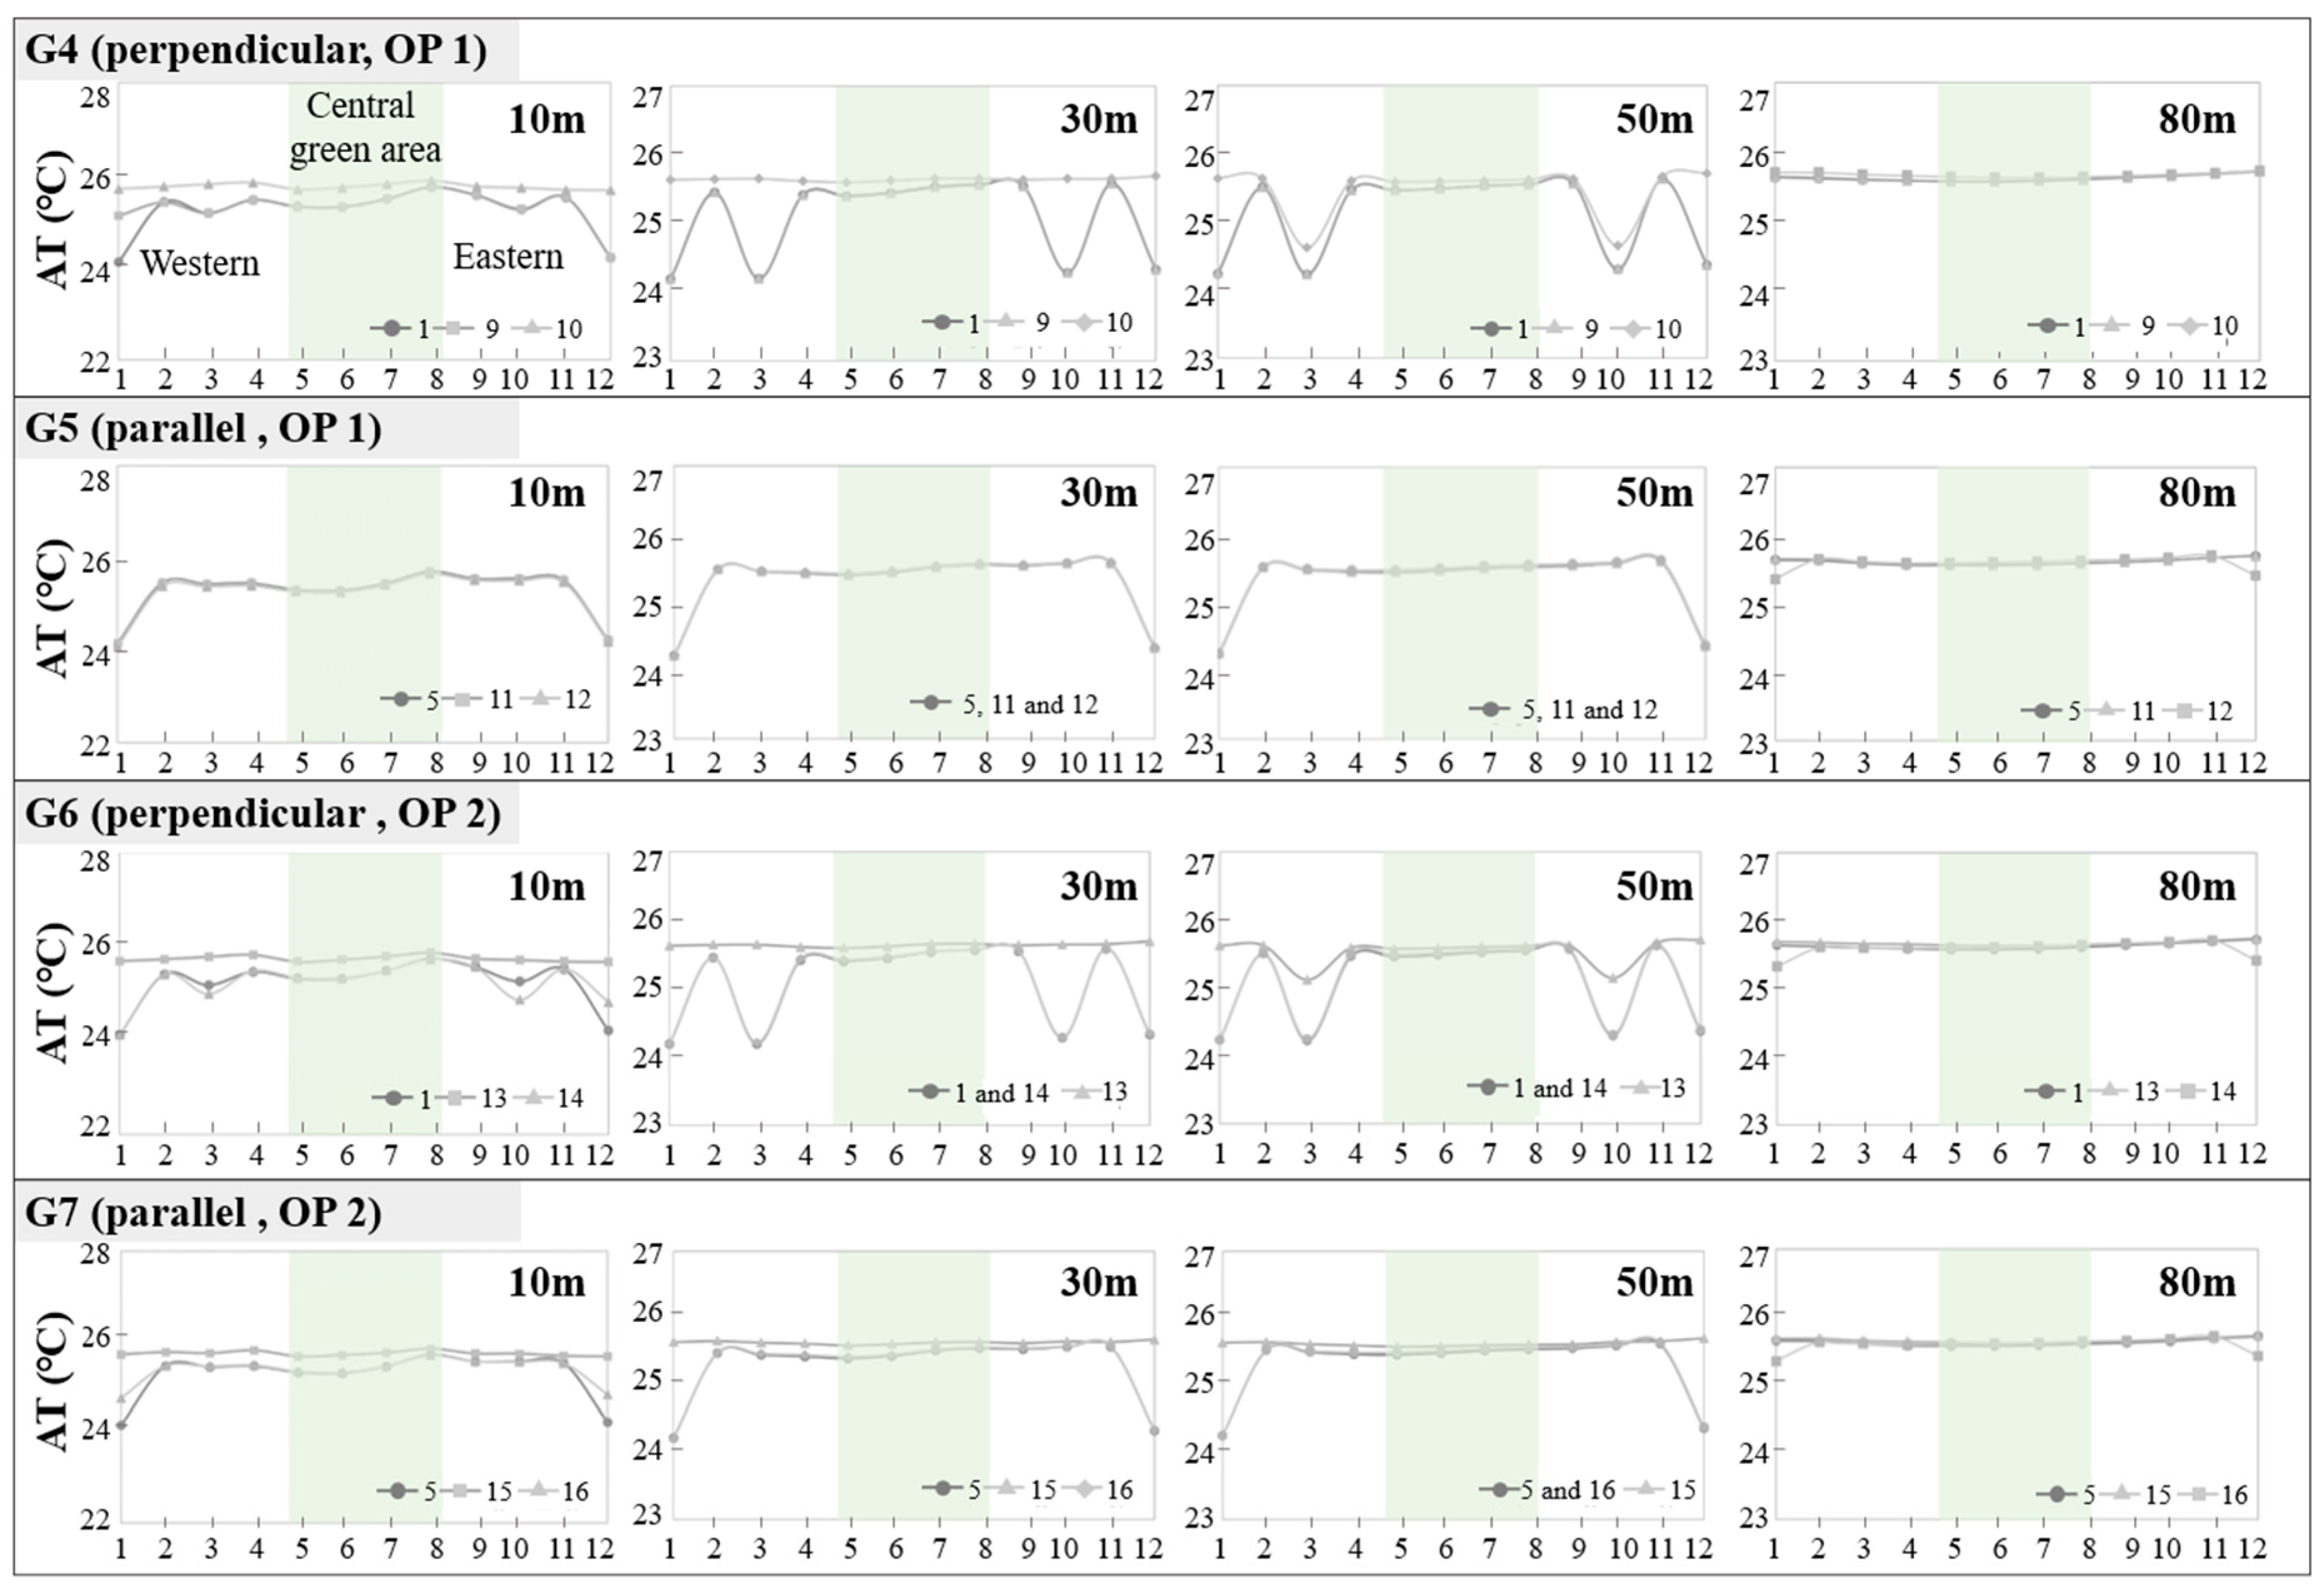
- For otherness, two otherness patterns were set up; otherness pattern 1 (OP1) is the sequential increase in building height starting with the building along the green side, which is the lowest building. Otherness pattern 2 (OP2) is the symmetrical change in building height from the center building of the block in all directions from high to low, with the center building being the tallest.
2.5. Modeling Settings
3. Results
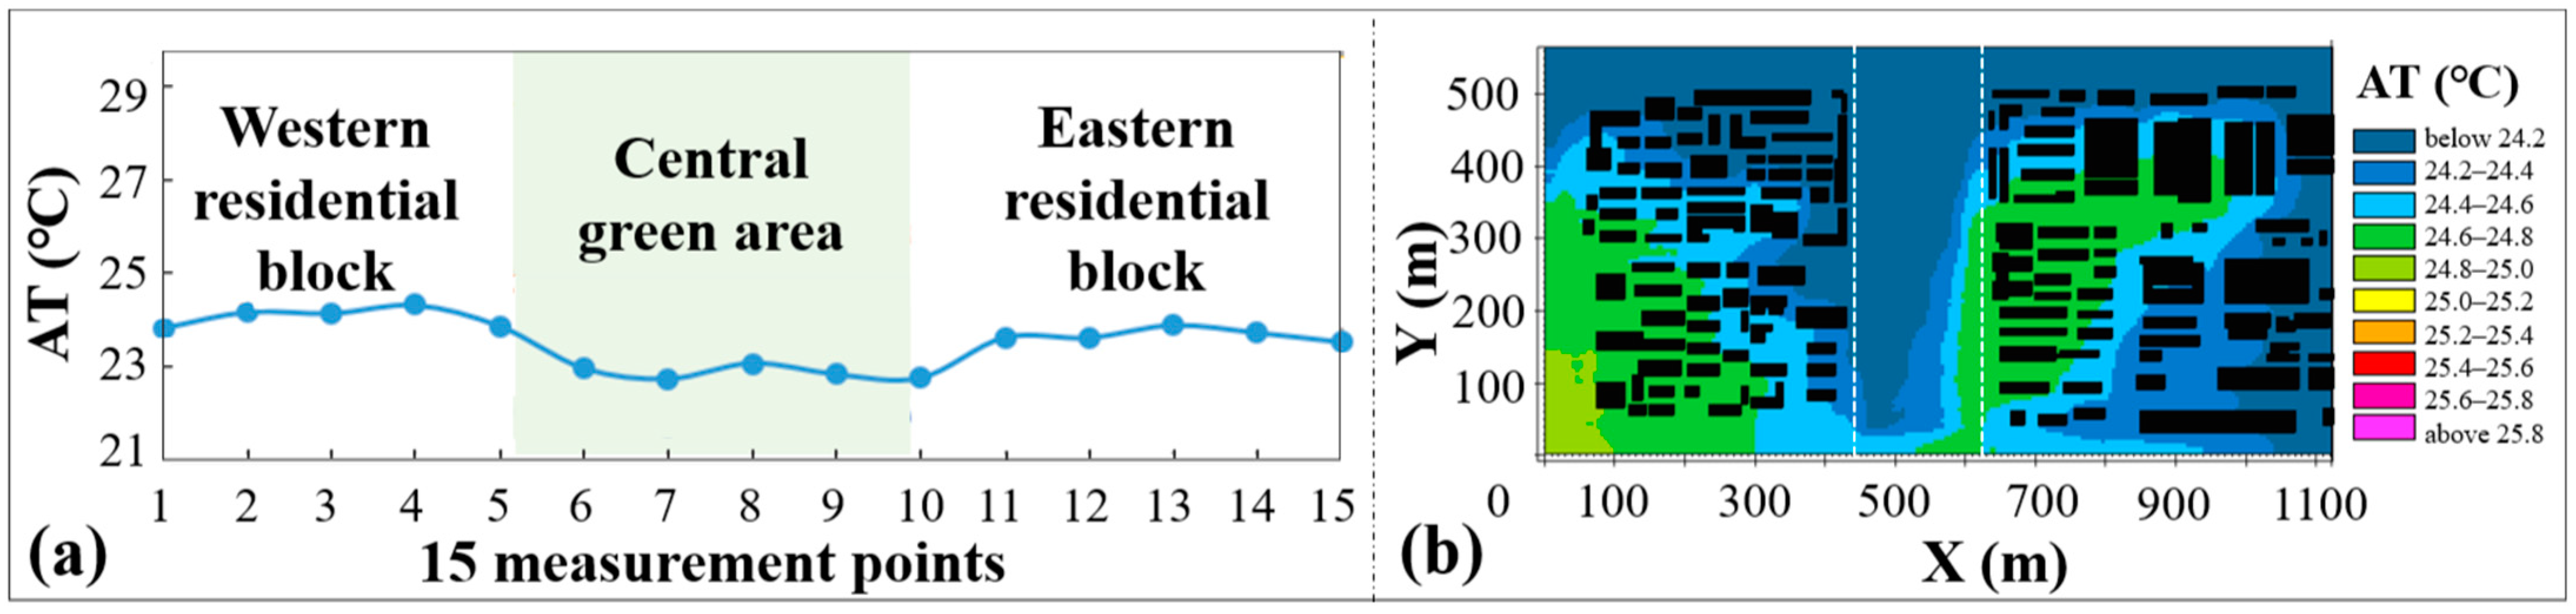
3.1. Characterization of the Cold Island Effect in Typical Green Spaces
3.2. Influence of High-Rise Residential Block Morphology on the Cooling Effect of Green Space
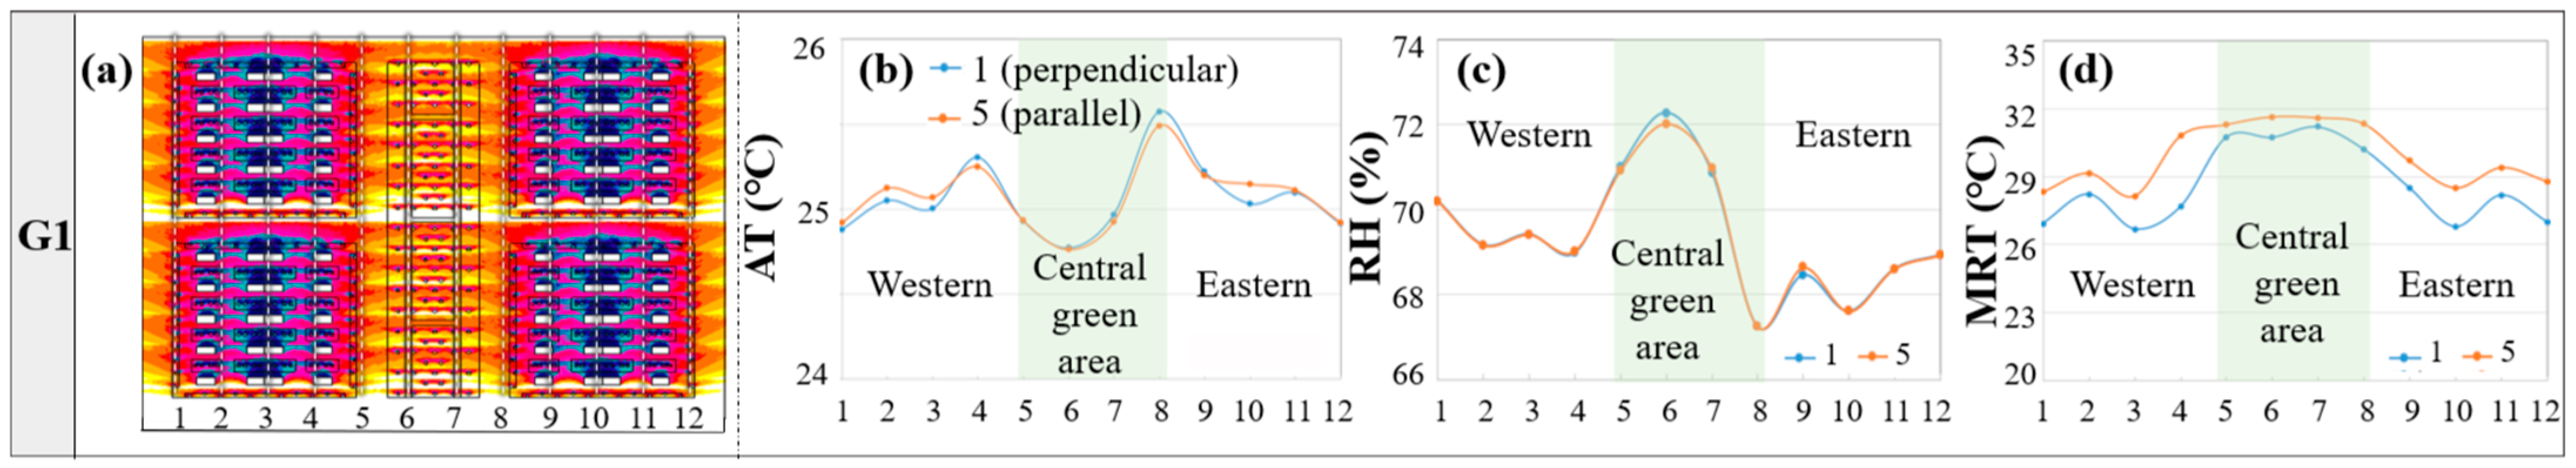
3.2.1. Influence of BO along the Green Side on Cooling Effects
- At the pedestrian level
- AT
- RH
- MRT
- 2.
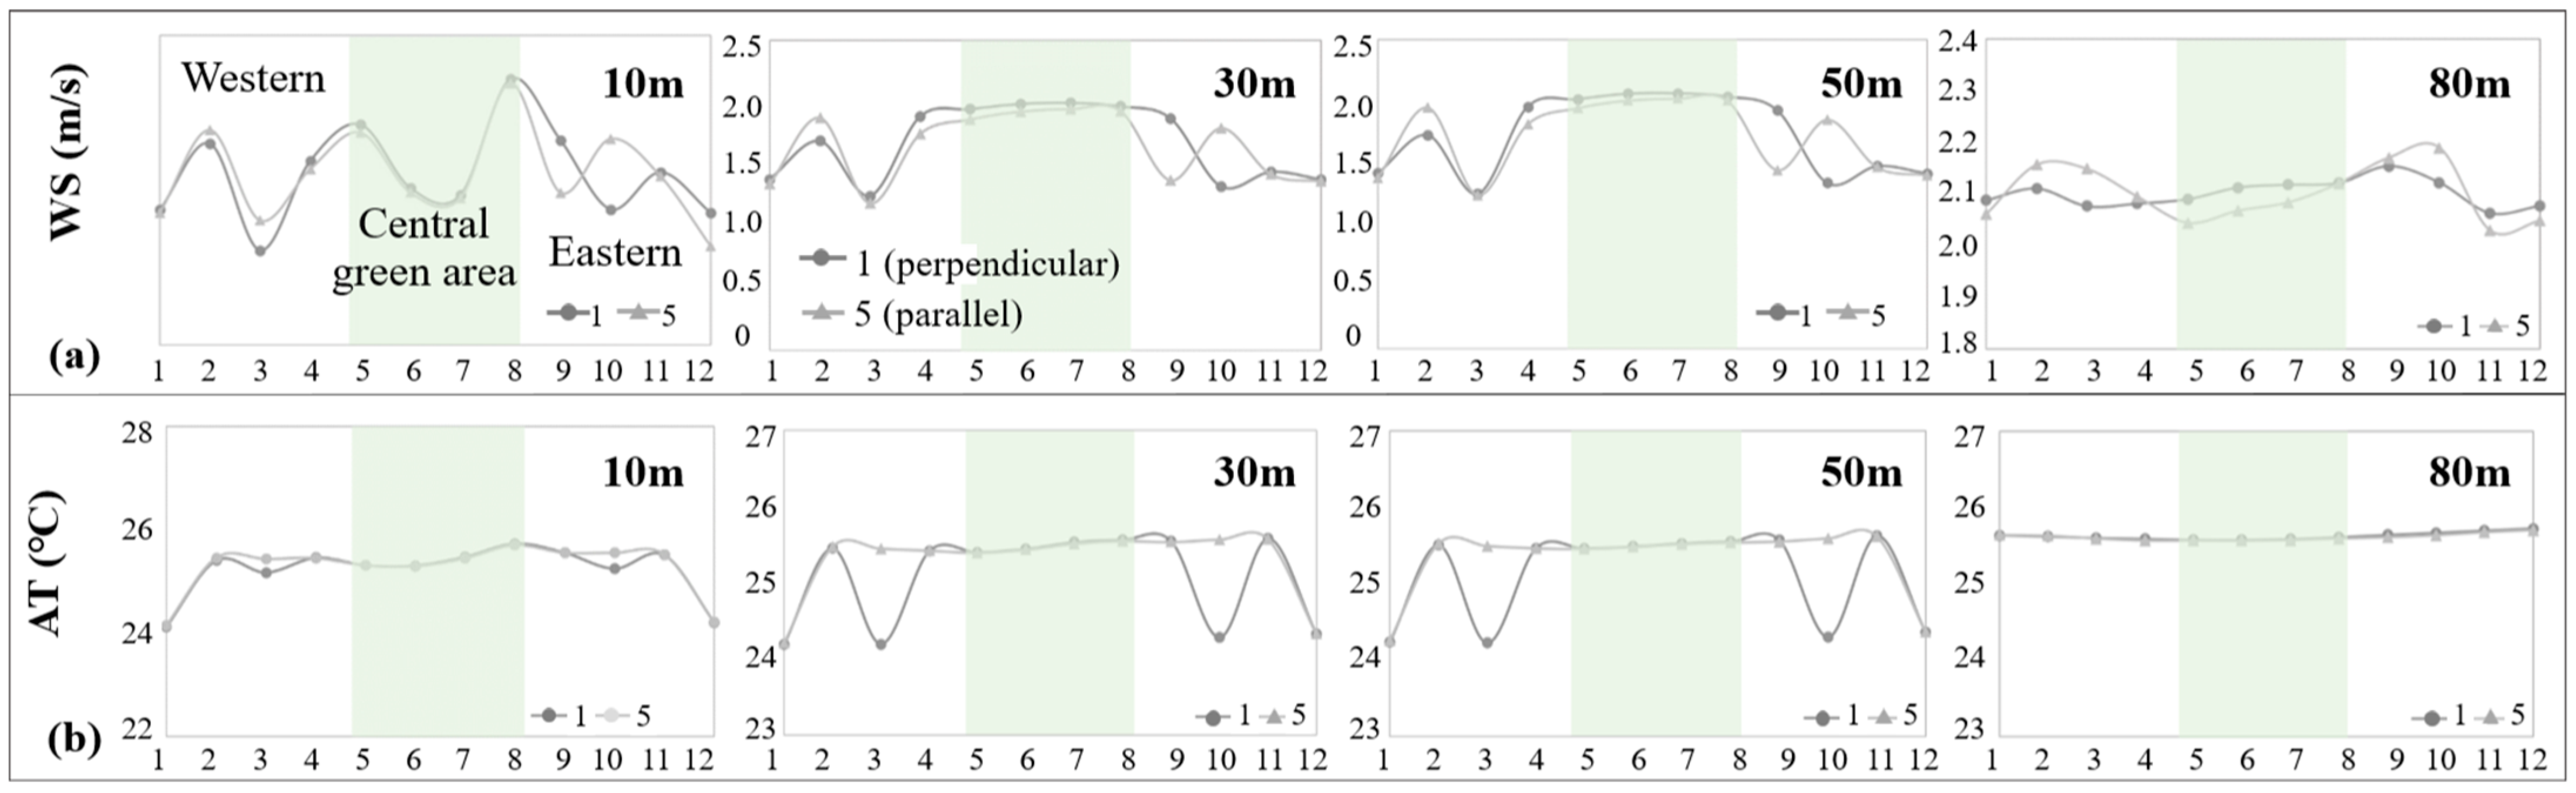
- At different heights in the vertical direction
- WS
- AT
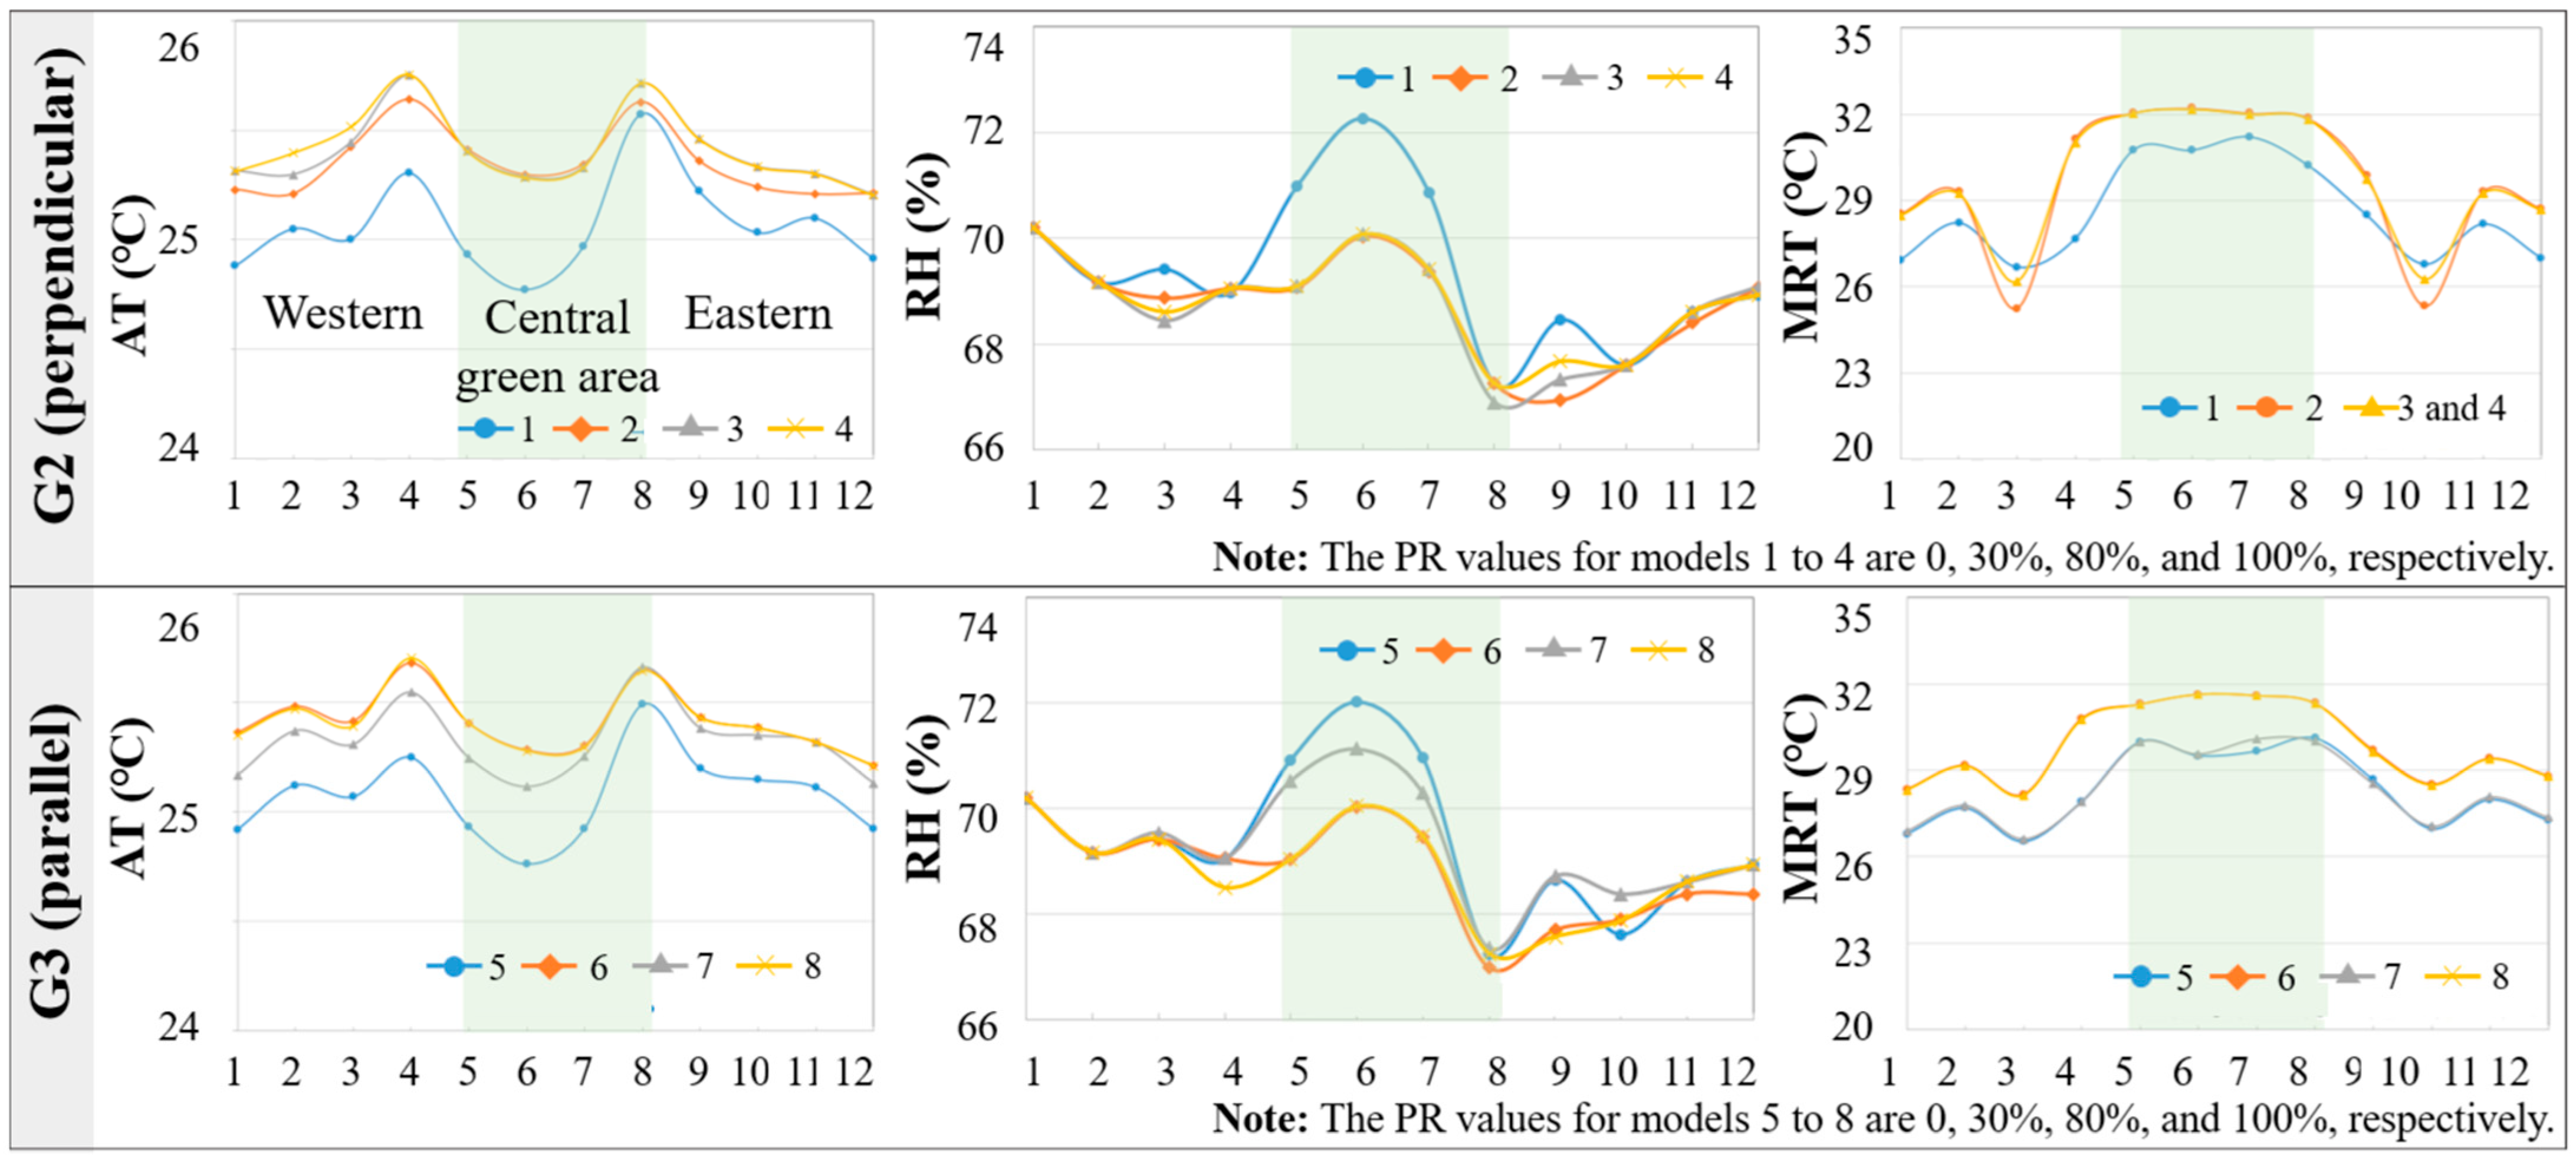
3.2.2. Influence of PR along the Green Side on Cooling Effects
- At the pedestrian level
- Perpendicular
- Parallel
- 2.
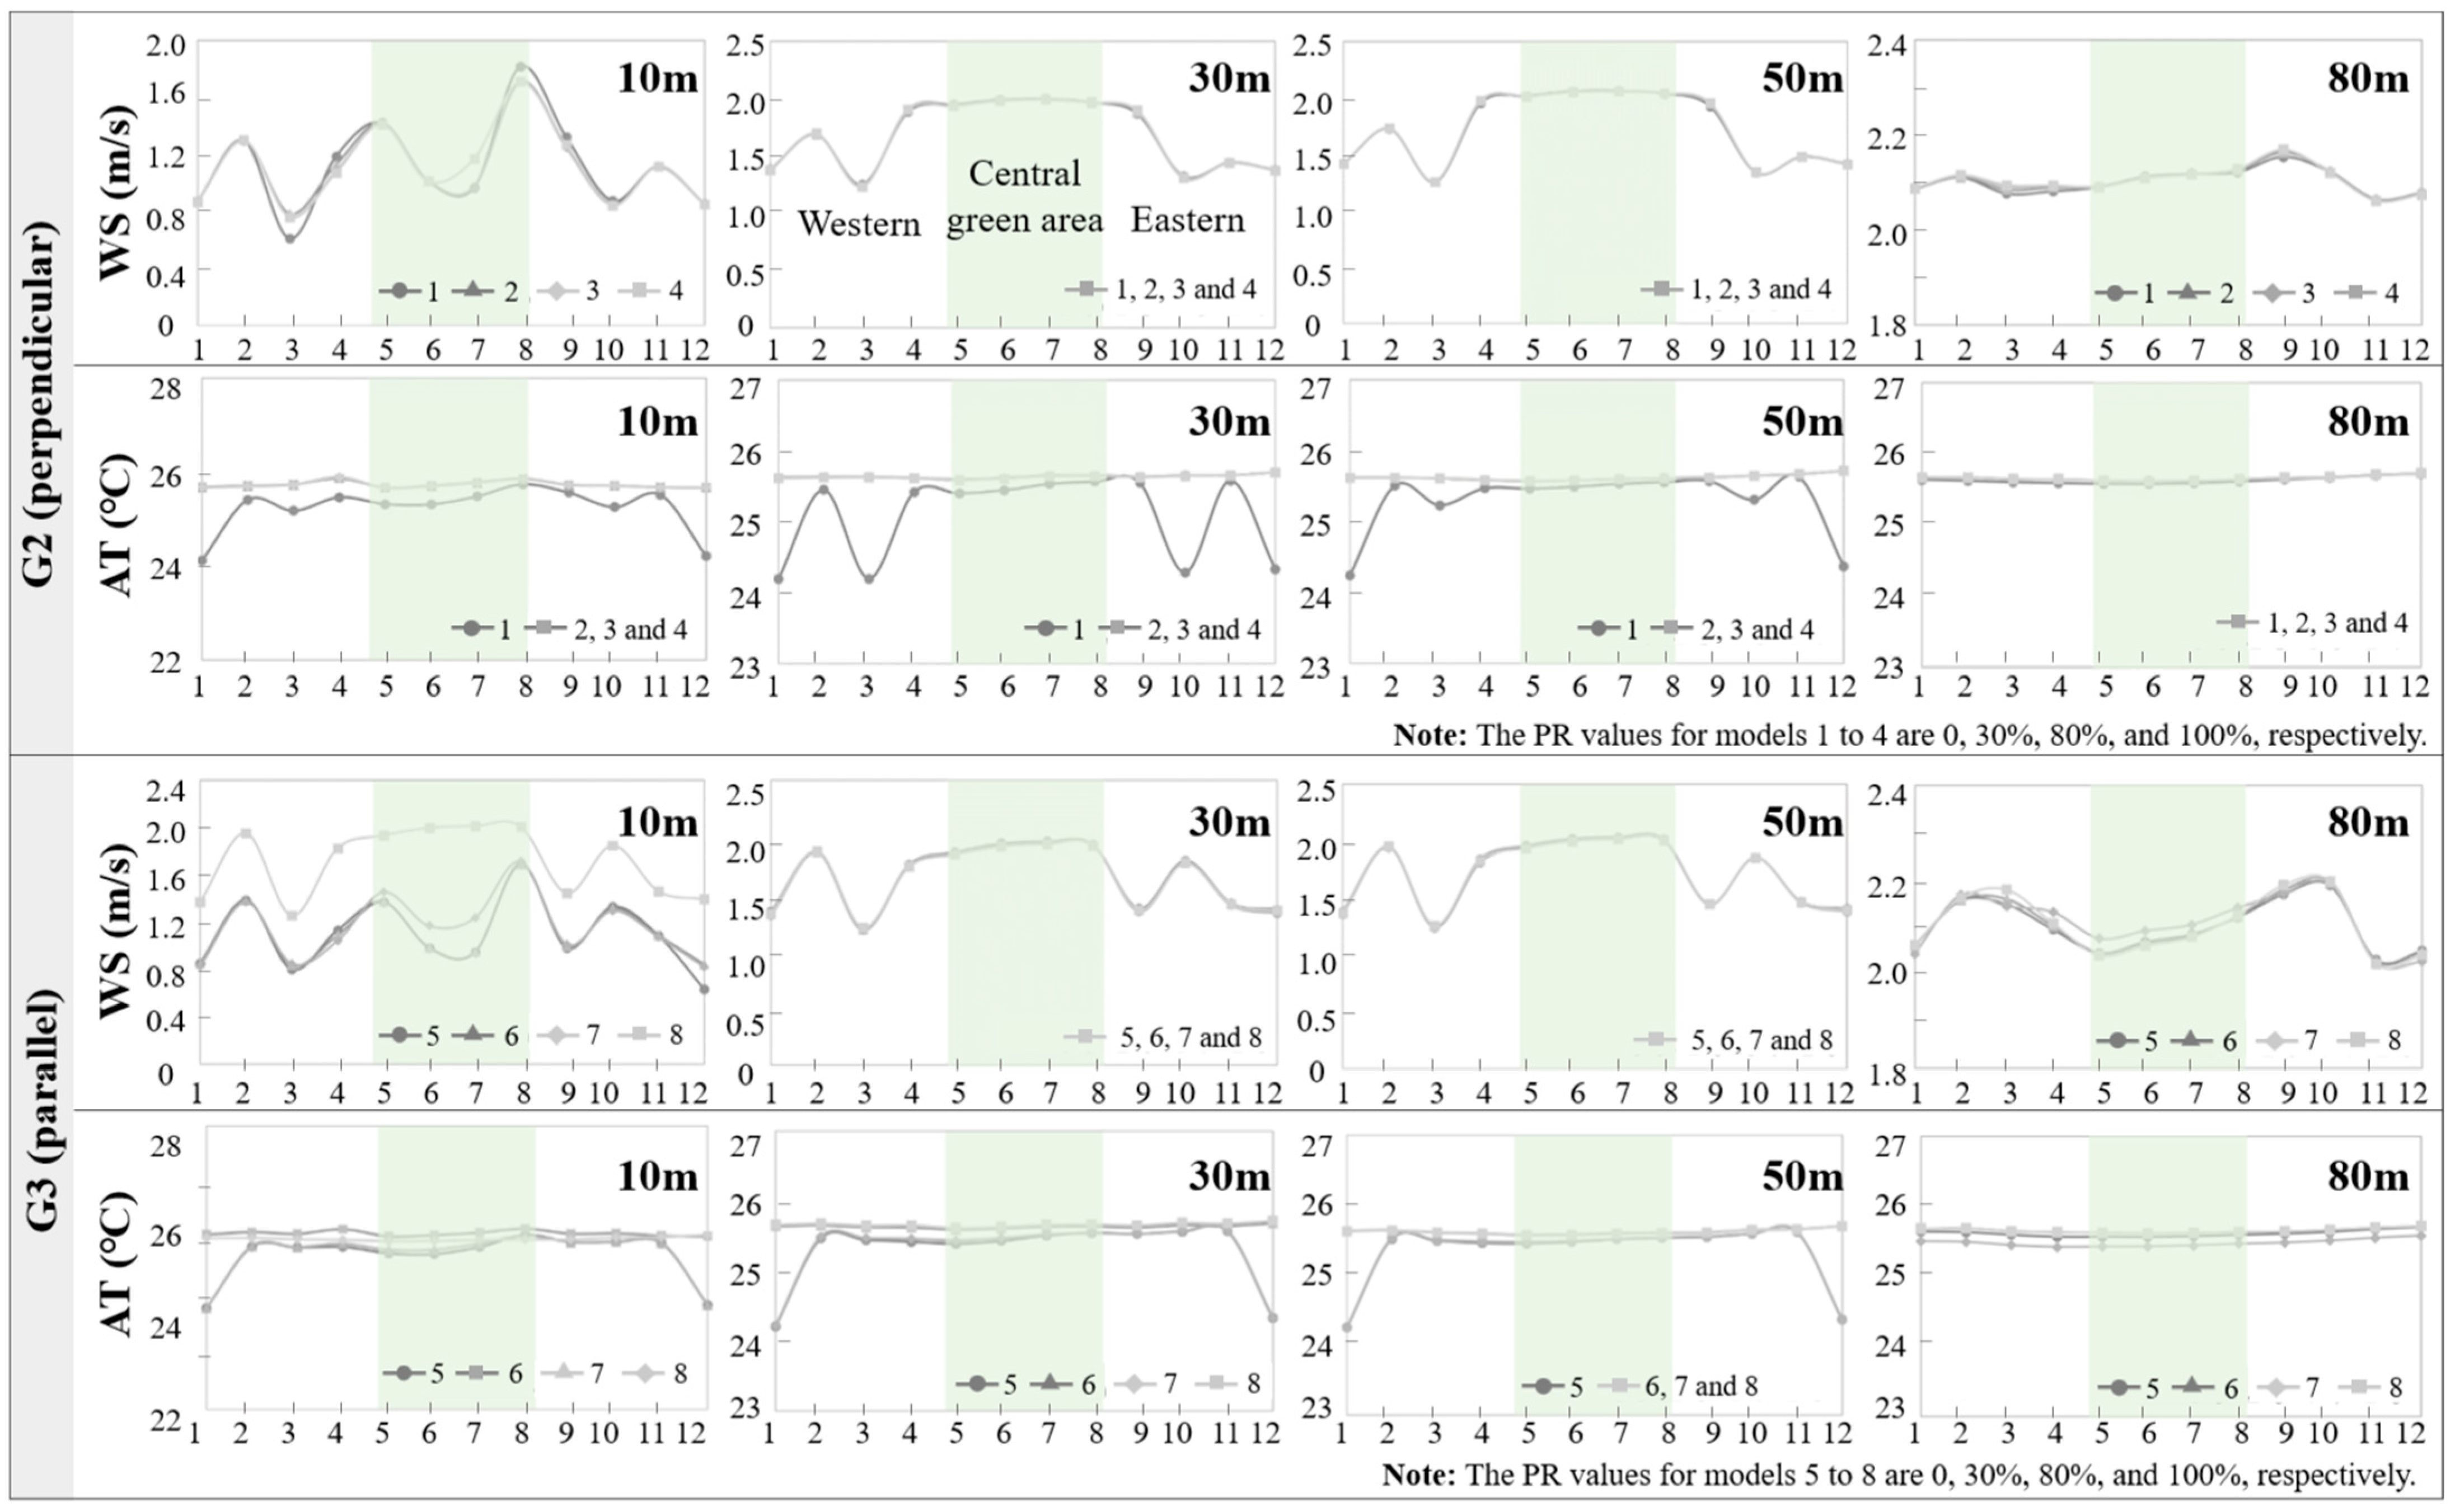
- At different heights in the vertical
- Perpendicular
- Parallel
3.2.3. Influence of Otherness on Cooling Effect
- At the pedestrian level
- OP1
- OP2
- 2.
- At different heights in the vertical direction
- OP1
- OP2
4. Discussion
5. Conclusions
Author Contributions
Funding
Data Availability Statement
Conflicts of Interest
References
- DAES. World Urbanization Prospects 2018: Highlights; United Nations: New York, NY, USA, 2019. [Google Scholar]
- Wu, F.; Geng, Y.; Tian, X.; Zhong, S.; Wu, W.; Yu, S.; Xiao, S. Responding climate change: A bibliometric review on urban environmental governance. J. Clean. Prod. 2018, 204, 344–354. [Google Scholar] [CrossRef]
- Soon, W.W.-H.; Connolly, R.; Connolly, M.; O’Neill, P.; Zheng, J.; Ge, Q.; Hao, Z.; Yan, H. Comparing the current and early 20th century warm periods in China. Earth-Sci. Rev. 2018, 185, 80–101. [Google Scholar] [CrossRef]
- Puvvula, J.; Abadi, A.M.; Conlon, K.C.; Rennie, J.J.; Herring, S.C.; Thie, L.; Rudolph, M.J.; Owen, R.; Bell, J.E. Estimating the Burden of Heat-Related Illness Morbidity Attributable to Anthropogenic Climate Change in North Carolina. Geohealth 2022, 6, e2022GH000636. [Google Scholar] [CrossRef]
- Santamouris, M.; Cartalis, C.; Synnefa, A.; Kolokotsa, D. On the impact of urban heat island and global warming on the power demand and electricity consumption of buildings—A review. Energy Build. 2015, 98, 119–124. [Google Scholar] [CrossRef]
- Chen, Y.; Wang, Y.P.; Zhou, D. Knowledge Map of Urban Morphology and Thermal Comfort: A Bibliometric Analysis Based on CiteSpace. Buildings 2021, 11, 427. [Google Scholar] [CrossRef]
- Jamei, E.; Rajagopalan, P.; Seyedmahmoudian, M.; Jamei, Y. Review on the impact of urban geometry and pedestrian level greening on outdoor thermal comfort. Renew. Sustain. Energy Rev. 2016, 54, 1002–1017. [Google Scholar] [CrossRef]
- Oliveira, S.; Andrade, H.; Vaz, T. The cooling effect of green spaces as a contribution to the mitigation of urban heat: A case study in Lisbon. Build. Environ. 2011, 46, 2186–2194. [Google Scholar] [CrossRef]
- Shi, M.; Wang, Y.; Lv, H.; Jia, W. Climate gentrification along with parks’ cooling performance in one of China’s tropical industrial cities. Sci. Total Environ. 2023, 892, 164603. [Google Scholar] [CrossRef]
- Xue, S.; Chao, X.; Wang, K.; Wang, J.; Xu, J.; Liu, M.; Ma, Y. Impact of Canopy Coverage and Morphological Characteristics of Trees in Urban Park on Summer Thermal Comfort Based on Orthogonal Experiment Design: A Case Study of Lvyin Park in Zhengzhou, China. Forests 2023, 14, 2098. [Google Scholar] [CrossRef]
- Shi, M.; Chen, M.; Jia, W.; Du, C.; Wang, Y. Cooling effect and cooling accessibility of urban parks during hot summers in China’s largest sustainability experiment. Sustain. Cities Soc. 2023, 93, 104519. [Google Scholar] [CrossRef]
- Gao, N.; Zhang, H.; Wang, P.; Ning, L.; Wong, N.H.; Yu, H.; Ke, Z. Research on Microclimate-Suitable Spatial Patterns of Waterfront Settlements in Summer: A Case Study of the Nan Lake Area in Wuhan, China. Sustainability 2023, 15, 15687. [Google Scholar] [CrossRef]
- Yu, Z.; Yang, G.; Zuo, S.; Jørgensen, G.; Koga, M.; Vejre, H. Critical review on the cooling effect of urban blue-green space: A threshold-size perspective. Urban For. Urban Green. 2020, 49, 126630. [Google Scholar] [CrossRef]
- Shah, A.; Garg, A.; Mishra, V. Quantifying the local cooling effects of urban green spaces: Evidence from Bengaluru, India. Landsc. Urban Plan. 2021, 209, 104043. [Google Scholar] [CrossRef]
- Toparlar, Y.; Blocken, B.; Maiheu, B.; van Heijst, G.J.F. The effect of an urban park on the microclimate in its vicinity: A case study for Antwerp, Belgium. Int. J. Climatol. 2017, 38, e303–e322. [Google Scholar] [CrossRef]
- Yan, H.; Wu, F.; Dong, L. Influence of a large urban park on the local urban thermal environment. Sci. Total Environ. 2018, 622–623, 882–891. [Google Scholar] [CrossRef]
- Ren, Z.B.; He, X.Y.; Zheng, H.F.; Zhang, D.; Yu, X.Y.; Shen, G.Q.; Guo, R.C. Estimation of the Relationship between Urban Park Characteristics and Park Cool Island Intensity by Remote Sensing Data and Field Measurement. Forests 2013, 4, 868–886. [Google Scholar] [CrossRef]
- Yu, C.; Hien, W.N. Thermal benefits of city parks. Energy Build. 2006, 38, 105–120. [Google Scholar] [CrossRef]
- Lee, S.-H.; Lee, K.-S.; Jin, W.-C.; Song, H.-K. Effect of an urban park on air temperature differences in a central business district area. Landsc. Ecol. Eng. 2009, 5, 183–191. [Google Scholar] [CrossRef]
- Zhang, Q.; Zhou, D.; Xu, D.; Rogora, A. Correlation between cooling effect of green space and surrounding urban spatial form: Evidence from 36 urban green spaces. Build. Environ. 2022, 222, 109375. [Google Scholar] [CrossRef]
- Wang, P.; Yang, Y.; Ji, C.; Huang, L. Positivity and difference of influence of built environment around urban park on building energy consumption. Sustain. Cities Soc. 2023, 89, 104321. [Google Scholar] [CrossRef]
- Han, Q.; Nan, X.; Wang, H.; Hu, Y.; Bao, Z.; Yan, H. Optimizing the Surrounding Building Configuration to Improve the Cooling Ability of Urban Parks on Surrounding Neighborhoods. Atmosphere 2023, 14, 914. [Google Scholar] [CrossRef]
- Zhu, Z.; Zhou, D.; Wang, Y.; Ma, D.; Meng, X. Assessment of urban surface and canopy cooling strategies in high-rise residential communities. J. Clean. Prod. 2021, 288, 125599. [Google Scholar] [CrossRef]
- Zhang, X.; Wang, Y.; Zhou, D.; Yang, C.; An, H.; Teng, T. Comparison of Summer Outdoor Thermal Environment Optimization Strategies in Different Residential Districts in Xi’an, China. Buildings 2022, 12, 1332. [Google Scholar]
- Zhang, P.F. Spatial fluctuation of urban architecture. J. Arid Resour. Environ. 2016, 30, 51–57. [Google Scholar] [CrossRef]
- Ministry of Housing and Urban-Rural Development, PRC. Design Standard for Thermal Environment of Urban Residential Areas (JGJ286—2013). 2013. Available online: https://www.mohurd.gov.cn/gongkai/zhengce/zhengcefilelib/201309/20130926_224855.html (accessed on 21 November 2023).
- Yearbook, Xi’an Bureau of Statistics. Xi’an Statistical Yearbook, 2018. 2018. Available online: http://tjj.xa.gov.cn/tjnj/2018/zk/indexch.htm (accessed on 21 November 2023).
- Liu, Z.N.; Yin, X.J. Urban Heat Island Effect and Meteorologic Factors in Xi’an. J. Arid Land Resour. Environ. 2008, 22, 87–90. [Google Scholar]
- Lyu, Y. Research on the Cool Island Effect and Influencing Mechanism of Urban Green Space Based on Remote Sensing Data: Taking Xi’an as an Example. Master’s Thesis, Xi’an Jiaotong University, Xi’an, China, 2022. [Google Scholar]
- Kolokotsa, D.; Lilli, K.; Gobakis, K.; Mavrigiannaki, A.; Haddad, S.; Garshasbi, S.; Mohajer, H.R.H.; Paolini, R.; Vasilakopoulou, K.; Bartesaghi, C.; et al. Analyzing the Impact of Urban Planning and Building Typologies in Urban Heat Island Mitigation. Buildings 2022, 12, 537. [Google Scholar] [CrossRef]
- Ge, J.; Wang, Y.; Zhou, D.; Gu, Z.; Meng, X. Building energy demand of urban blocks in Xi’an, China: Impacts of high-rises and vertical meteorological pattern. Build. Environ. 2023, 244, 110749. [Google Scholar] [CrossRef]
- Lu, J.; Li, Q.; Zeng, L.; Chen, J.; Liu, G.; Li, Y.; Li, W.; Huang, K. A micro-climatic study on cooling effect of an urban park in a hot and humid climate. Sustain. Cities Soc. 2017, 32, 513–522. [Google Scholar] [CrossRef]
- Spronken-Smith, R.A.; Oke, T.R. The thermal regime of urban parks in two cities with different summer climates. Int. J. Remote Sens. 2010, 19, 2085–2104. [Google Scholar] [CrossRef]
- Hamada, S.; Ohta, T. Seasonal variations in the cooling effect of urban green areas on surrounding urban areas. Urban For. Urban Green. 2010, 9, 15–24. [Google Scholar] [CrossRef]


| Indices | Group No. | Model No. | Value of BO | Value of PR | Otherness Pattern | Value of Otherness |
|---|---|---|---|---|---|---|
| Building orientation along the greenbelt side (BO) | G1 | 1 | perpendicular | null | null | null |
| 5 | parallel | null | null | null | ||
| Podium ratio along the greenbelt side (PR) | G2 | 1 | perpendicular | 0% | null | null |
| 2 | 30% | null | null | |||
| 3 | 80% | null | null | |||
| 4 | 100% | null | null | |||
| G3 | 5 | parallel | 0% | null | null | |
| 6 | 30% | null | null | |||
| 7 | 80% | null | null | |||
| 8 | 100% | null | null | |||
| Otherness | G4 | 1 | perpendicular | null | pattern 1 (OP1) * | 0 |
| 9 | null | 0.16 | ||||
| 10 | null | 0.32 | ||||
| G5 | 5 | parallel | null | pattern 1 (OP1) * | 0 | |
| 11 | null | 0.16 | ||||
| 12 | null | 0.32 | ||||
| G6 | 1 | perpendicular | null | pattern 2 (OP2) * | 0 | |
| 13 | null | 0.16 | ||||
| 14 | null | 0.32 | ||||
| G7 | 5 | parallel | null | pattern 2 (OP2) * | 0 | |
| 15 | null | 0.16 | ||||
| 16 | null | 0.32 |
Disclaimer/Publisher’s Note: The statements, opinions and data contained in all publications are solely those of the individual author(s) and contributor(s) and not of MDPI and/or the editor(s). MDPI and/or the editor(s) disclaim responsibility for any injury to people or property resulting from any ideas, methods, instructions or products referred to in the content. |
© 2024 by the authors. Licensee MDPI, Basel, Switzerland. This article is an open access article distributed under the terms and conditions of the Creative Commons Attribution (CC BY) license (https://creativecommons.org/licenses/by/4.0/).
Share and Cite
Shi, F.; Chen, Y.; Yue, W.; Wang, Y. High-Rise Residential District Morphology Optimization for Enhancing the Green Space Cooling Effect. Buildings 2024, 14, 183. https://doi.org/10.3390/buildings14010183
Shi F, Chen Y, Yue W, Wang Y. High-Rise Residential District Morphology Optimization for Enhancing the Green Space Cooling Effect. Buildings. 2024; 14(1):183. https://doi.org/10.3390/buildings14010183
Chicago/Turabian StyleShi, Feng, Yuan Chen, Wenru Yue, and Yupeng Wang. 2024. "High-Rise Residential District Morphology Optimization for Enhancing the Green Space Cooling Effect" Buildings 14, no. 1: 183. https://doi.org/10.3390/buildings14010183