Article

An Investigation of Outdoor Thermal Comfort Assessment for Elderly Individuals in a Field Study in Northeastern China

1
School of Architecture and Urban Planning, Jilin Jianzhu University, Changchun 130118, China
2
Urban Spatial Performance Assessment and Visualization and Decision-Making Lab, Changchun 130118, China
3
School of Architecture, Harbin Institute of Technology, Harbin 150006, China
4
Key Laboratory of Cold Region Urban and Rural Human Settlement Environment Science and Technology, Ministry of Industry and Information Technology, Harbin 150006, China
*
Author to whom correspondence should be addressed.
Buildings 2023, 13(10), 2458; https://doi.org/10.3390/buildings13102458
Submission received: 25 August 2023 / Revised: 15 September 2023 / Accepted: 16 September 2023 / Published: 27 September 2023
(This article belongs to the Special Issue Urban Climate, Comfort and Building Energy Performance)

Abstract

:
The harsh climate and the aging of urban populations have negatively impacted the quality of life of the elderly in severely cold regions. As a result, there is an urgent need to improve environment quality and accurately evaluate outdoor thermal comfort. However, existing studies have paid little attention to older adults living in severely cold climates. This paper aims to fill this gap by studying the elderly population in severely cold cities with high aging rates in China. By combining on-site testing, questionnaire surveys, CFD modeling, parametric computing, and statistical analysis, the study presents an adapted UTCI for elderly people, as well as multi-seasonal prediction models. The results (1) show that the neutral ranges of the UTCI are significantly affected by both climate zones and age groups. Older people are more tolerant to heat but more sensitive to cold. (2) The results also reveal the importance of factors such as air temperature, wind speed, solar radiation temperature, wind direction, relative humidity, and cloud cover in evaluating outdoor thermal comfort. (3) Multi-seasonal thermal comfort models based on neural networks were developed, and empirical studies verified that the model had the highest accuracy in the transitional season and the lowest accuracy in the winter season.

1. Introduction

The negative impact of urban climates on the thermal environment is significant in areas with harsh climatic conditions, which are harmful to outdoor activities and health. Accurately evaluating outdoor thermal comfort is crucial for addressing this issue. Originally developed from indoor environmental studies, the concept of thermal comfort reflects whether a person is satisfied with their thermal environment [1]. Personal factors such as gender, age, income, health status, clothing, activity pattern, duration, frequency, tolerance, and adaptability level, environmental factors, such as air temperature, wind speed, mean radiation temperature, and relative humidity, and environmental perception factors, such as thermal sensation and place attachment, all significantly impact thermal comfort [2,3,4,5,6]. Moreover, several indoor thermal comfort models have been developed [7,8]. Brager and de Dear believed that thermal adaptation and heat balance models could reflect thermal feedback [9]. After collating data from approximately 21,000 field studies, they analyzed the relationship between indoor neutral temperature and outdoor mean air temperature through weighted linear regression to develop a thermal adaptation model [10,11]. Based on data from field measurements, Humphreys and Nicol focused on the perception of thermal comfort and meteorological parameters and calculated thermal neutrality using Griffith’s method. An acceptable temperature range was proposed by analyzing the correlation between the indoor neutral temperature and outdoor air temperature [12]. However, outdoor thermal comfort involves greater challenges due to the complex and dynamic climatic conditions found there. Its theoretical basis, assessment methodology, and evaluation criteria are all disputed. As the population ages and urbanization develops, research on how to develop accurate outdoor thermal comfort models for the elderly in severely cold regions has become a central topic of research.
There are three aspects to this study, namely, air temperature, thermal sensation, and thermal comfort. For various age groups and air temperatures, researchers have found that the actual sensation vote (ASV; please refer to “Abbreviations” section for all abbreviations used in this paper) of female elderly people aged 65 and above was significantly higher than that of male elderly people when the air temperature exceeded 32.4 °C [13], whereas in the summer, in Nordic regions, the average thermal sensation vote (TSV) value of elderly people was lower than that of other age groups [14]. Throughout the year, the thermal sensation vote and average metabolic rate of elderly populations in cold regions were lower than those of other populations, while their average clothing thermal resistance (CTR) was higher [15]. In terms of different age groups and subjective thermal sensation, studies have found that the variation in thermal sensation was higher in females than in males in different age groups. The sensitivity of older men to environments with external heat was almost the same as that of other age groups in cold Iranian climates [16]. This was consistent with the results of a Brazilian study. Research has found little variation in thermal sensation among men of different ages in cold climates. However, male sensitivity to thermal sensations decreases with age in hot environments, and age differences in women also lead to higher values of differences than in men [17]. In addition, the neutral range of the universal thermal climate index (UTCI) for older adults (15.3–28.5 °C) is distinct from that for middle-aged (15.3–28 °C) and adolescent populations (14–28.3 °C). The reason may be the lower tolerance to cold environments in the elderly population [18]. By collecting thermal sensation data from participants from different countries in outdoor thermal environments, the results showed that the average CTR in cold environments was higher in older groups than in younger ones [19]. This finding has also been applied to cold seasons in the tropics, where elderly people’s UTCI values were 2–4 °C lower than those of young adults when they felt very hot [20]. However, some studies have come to varying conclusions. They found that the average CTR of older people was not significantly higher than that of other age groups in hotter environments [21]. As for various age groups and levels of thermal comfort, the perceptions of the thermal environment in different areas of the city varied by age. Thermal comfort tends to decrease as age increases in highly densely populated areas, whereas it gradually increases with age in open spaces [22]. Additionally, the average TSV value proportionally increases with age during the winter season in severely cold regions. In contrast, it gradually decreases with age during the summer season. In transitional seasons, the average TSV values for different age groups are similar. Furthermore, it is worth noting that this study found little to no significant correlation between age and CTR [23].
The above-mentioned studies highlight that the elderly population’s thermal experience in urban environments differs from that of other age groups and is due to age-related factors, such as changes in heat preference, thermal sensation, thermal comfort, CTR, and metabolic rate, particularly in harsh regions where natural thermal resources are insufficient [24,25,26]. Various factors, such as climate zones, race, cultural backgrounds, and habits, also play a considerable role in the thermal perception of the elderly. However, there is a lack of sufficient research on outdoor thermal comfort for the elderly in severely cold climates, particularly in the northeastern area of China. This region has cold and long winters, with mean temperatures of −15.0 to −5.0 °C, and the annual mean values are 6.7 to 7.1 °C. The local authorities’ statistical data indicate that the permanent resident population in these areas was around 19.077 million in 2021, with people aged 65 and above accounting for 18.1% or 3.453 million individuals [27]. Therefore, the research questions of this paper are as follows.
(1)
Which factors affect the outdoor thermal comfort of older adults in severely cold regions in various seasons, and how can they be accurately evaluated with an adapted UTCI? (Compared to the UTCI, it has a significantly different range corresponding to each stress category.)
(2)
What strategies can be used to develop models for different seasons to effectively and accurately evaluate the outdoor thermal comfort of older adults in northeastern China?
This study aims to explore outdoor thermal comfort for elderly populations residing in cold cities in northeastern China. In order to overcome the limitations of existing research methods, an integrated framework, including field measurements, numerical simulations, coupling programs, and parameterized calculations, is proposed. The characteristics of the thermal environment in a typical residential area during all seasons and the thermal sensations of elderly residents were collected. Individual factors were also included. On this basis, the calculated values of the outdoor thermal comfort index (UTCI) and the questionnaire’s subjective data were statistically analyzed. Thereby, the range of UTCI values corresponding to the different thermal sensations of elderly people in cold areas was revised. Finally, depending on the meteorological data and the UTCI values, multi-group models based on neural networks were constructed to evaluate the outdoor thermal comfort of the elderly in different seasons.

2. Materials and Methods

Typically, subjective thermal sensations obtained through questionnaire surveys are the most common approach to studying outdoor thermal comfort [28]. However, even with a large number of questionnaire respondents, this may not fully represent the true situation when evaluating the level of thermal comfort within a specific area. Thus, questionnaire surveys and on-site measurements are usually employed. Field surveys can collect meteorological data from various testing locations within an area. By using calculation methods for existing evaluation indicators, the values of thermal comfort can be obtained. Meanwhile, the results of the questionnaire are used as the target to be validated. The differences between subjective and objective data are analyzed to develop an exact evaluation of the thermal comfort situation in various locations within the study area [29].
However, this method has a significant limitation. Because of the insufficient number of test points, it is almost impossible to adequately cover an entire study area. This leads to potentially inaccurate results when relying on empirical formulas derived from limited meteorological data and survey results in the calculation of evaluation indicators. Researchers are increasingly turning to fluid dynamics simulation software to address this issue. A new approach to investigating outdoor thermal comfort involving the establishment of model boundaries and internal settings for various operating conditions by correcting a computational fluid dynamics (CFD) model with meteorological data measured on-site has been implemented [30]. Moreover, it should be revised to calculate the meteorological data for all discrete points in the research area, with the resulting air temperature, wind speed, and relative humidity replacing the respective values in an EPW file, using EditPad Lite. After coupling the calculations with other simulation plugins, such as EnergyPlus 23.1.0, Radiance, OpenStudio 2.5.0 SDK, Daysim, and Honeybee_0_0_65, it is possible to evaluate the thermal comfort values for the entire study area [31].
Nevertheless, this still has some flaws and shortcomings. For example, the CFD model may lack high computational efficiency, particularly in fine grid partitioning and with complex parameter settings, which can lead to longer calculation times. Therefore, this method is more suitable for studying outdoor thermal comfort conditions in small research areas or shorter durations. With the above shortcomings in mind, this paper focuses on how artificial intelligence techniques (neural networks) can be utilized to refine the research process and increase the computational efficiency of a model. The BP neural network model algorithm is simple and easy to understand as the back-propagation error. It is widely applicable and can converge quickly while having the advantage of high efficiency. In addition, a model trained with the BP algorithm can make predictions on unseen data and can have good generalization ability [32]. The input data comprised 6 meteorological data points, and the output data comprised outdoor thermal comfort.
For the network’s properties, feed-forward backpropagation was selected as the network type, and LEARNGDM was selected as the adaption learning function. The MSE was chosen for the performance function. Moreover, the optimal number was determined by comparing the mean square error for the different numbers of neurons in the implicit layer. The topology of the model and the setting details are illustrated in Figure 1, and the process of this research is shown in Figure 2.

3. Study Area

After conducting field research and previous studies, Tianjia was chosen as the representative area for on-site testing. It is located in the western area of Changchun and is surrounded by several city parks, which range from 220,000 to 250,000 square meters. The district has fitness spaces, small squares, green spaces, walkways, and playgrounds for children, as shown in Figure 3.
Overall, the layout of the area consisted of rows or enclosures of buildings, which were generally between seven and eleven stories in height. A small number of them were high-rise buildings, and these were located on the west side of the area. The plot ratio was 1.73, and the green coverage rate was over 40%. Furthermore, the elderly population exceeded 20% of the total inhabitants. Most older people have deep connections with their communities and a relatively strong sense of belonging. Although their self-perceived health was relatively poor compared to that of residents of the rest of the city, they generally felt safer and more comfortable. In summary, the area represented the typical building layouts, neighborhood environments, and characteristics of older populations in cold regions. Therefore, it was selected as the study area for this research paper. All of the details are shown in Table 1.
To establish the testing dates for the field research, this study utilized meteorological data for Changchun City sourced from the Chinese Standard Weather Data (CSWD). Based on a statistical analysis of the meteorological data from the coldest month (January) and the hottest month (July) of the year, the measurement dates were determined for each season. In addition, the daily mean minimum and maximum temperatures were used to identify on-site measurement dates for spring and autumn. Furthermore, the outdoor climate of urban areas can experience sudden and dramatic changes, and the daily variations in meteorological data may not be consistent before and after typical days in each season. Therefore, this study summarized the actual measurements from multiple dates with good weather conditions around the typical days of each season. Overlaying the data obtained on each date effectively prevented significant errors in the study results due to sudden drastic changes in meteorological data at certain dates and times.
Based on the above analysis, January 22–24, April 8–11, July 15–16 and 18–19, and October 17–19 and 21 were chosen in this study as the measurement days for winter, spring, summer, and autumn, respectively. All test days were sunny, with a mean air temperature, wind speed, and relative humidity within the range of the long-term mean meteorological data for the different seasons in Changchun, thus representing the typical climatic characteristics of the four seasons. The testing period was from 8:30 am to 4:30 pm and involved seven representative measurement locations that were selected based on the functions, environmental composition, frequency of activities, and travel behavior patterns of the elderly there. The locations and the equipment used were explained in detail in previous studies [31,33]. Additionally, 1250 questionnaires were distributed to elderly respondents, who were randomly selected from the testing location and its surroundings, resulting in 1138 usable responses that were collected throughout all seasons.

4. Results

4.1. The Seasonal Characteristics of the Thermal Environment

The temperature showed distinct differences among the seasons, which is a typical feature of climates in severely cold regions. The highest temperature throughout the year was observed at test point 2 of the pedestrian walkway during summer, while the lowest temperature occurred in fitness spaces during winter (as shown in Figure 4).
The lowest mean relative humidity occurred in spring at 23.6%, while the highest value of 43.9% among the four seasons was seen during summer. Specifically, throughout the year, the park area had the highest relative humidity of 72% during autumn, whereas the pedestrian walkway and children’s play area during spring had the lowest relative humidity of only 10% (as shown in Figure 5).
Differences in wind speed were apparent between the different seasons and testing locations. The highest mean wind speed recorded was 1.93 m/s in spring, while the lowest was 0.96 m/s in summer. Specifically, the children’s play area had the highest wind speed, while the green spaces had the lowest (as shown in Figure 6).
The overall tendency of the mean solar radiation temperature at various measurement locations in the different seasons was similar to that of the changes in air temperature, but there were marked differences between the various regions. The square area was highly significant, as it had both maximums and minimums. Previous studies suggested that the mean radiation temperature is an integrated meteorological indicator that takes the black-globe temperature, air temperature, wind speed, and architectural layout surrounding the measurement point into account. Thus, even though the square area did not present extreme temperature values, it was still the most dynamic region in terms of the mean radiant temperatures resulting from the combination of various factors (as shown in Figure 7).

4.2. The Questionnaire Survey Results from the Elderly Population

Because of the harsh climates in cold regions, fewer elderly people participate in outdoor activities during all seasons compared to those in other climatic regions. Although slightly more elderly women participated in outdoor activities during summer, elderly men were significantly more active in other seasons. Although there were some age differences among the elderly individuals who participated in the survey during the different seasons, their average age ranged between 63 and 66 years. This group of elderly individuals generally has low levels of education for historical reasons, with only 3% of them having completed tertiary education and 51.1% having attained junior high school education. Before retirement, the majority of this group worked in business and professional positions, followed by those who worked as government officials and cadres. Furthermore, fitness activities were the most popular type of outdoor activity among the elderly, accounting for 60%, followed by social activities at approximately 27.3%, whereas leisure activities were the least popular at 12.7%.
Although the number of people participating in fitness activities varied slightly during the different seasons, the overall trend was quite consistent. Except for square dancing and fitness exercises, which were the main forms of exercise in the autumn, walking was the main form of fitness activity in all other seasons. For leisure activities, regardless of the season, playing chess was a relatively popular activity among the elderly. As for social activities, gathering and communication mainly occurred in the spring and winter, while taking care of grandchildren mainly occurred in the summer and autumn (as shown in Figure 8).
It can be noticed in Figure 9a,b that with the gradual increase in temperature, despite the fact that most of the older adults (44.62%) preferred comfortable thermal conditions in summer, 66.67% of them still indicated that they wished to be cooler. This is in agreement with some studies that concluded that the elderly have weaker heat tolerance than that of other age groups [18,26]. In addition, Figure 9 demonstrates that older adults perceived air temperature as the primary factor influencing outdoor thermal comfort, followed by wind speed, with relative humidity accounting for the smallest percentage. This result was consistent regardless of the season. These findings suggest that elderly people who have been living in extremely cold cities for a long time tend to believe that air temperature and wind are the most prominent factors that impact human thermal comfort in their surroundings.
Moreover, the situation differed slightly across the various seasons. The key factors that significantly impacted outdoor thermal comfort for the elderly were air temperature, solar radiation, and clothing status during winter, whereas the important factors that affected outdoor thermal comfort were air temperature and wind speed in summer (as shown in Figure 9).

4.3. Analysis of Multiple Sets of Numerical Modeling Results and Outdoor Thermal Comfort

It was found that different angles of inlet air had obvious effects on the simulation results for thermal environments. To improve the accuracy of the numerical model, eight basic models with different wind directions were established in this paper. A comparative analysis of the eight modeling results with the measured wind direction at the same time, respectively, can prevent large mistakes due to the changes in the short-term distribution of instantaneous wind conditions as much as possible. The simulation results of the eight models in winter at 10:00–11:00 a.m. are shown in Figure 10.
The threshold correction of the outdoor thermal comfort index for winter was discussed in a previous paper, whereas this paper focuses predominantly on the summer and transitional seasons [33].
For the summer model, the method for constructing the Fluent model was similar to the method for constructing winter model. The radiation model was set to the DO (discrete ordinate) model, which defined the radiation direction and its angle in space. The model defined the direction and angle of radiation in space and formed multiple partial differential equations by equating the process of radiant heat energy transfer in multiple discrete angular directions. The results of the coupled calculation of the radiation intensity at different discrete angles were closer to the actual values. After several calculations and verifications, the DO model was found to be suitable for solar radiation simulation of the sites in the summer. Unlike in the winter model, the ice and snow subsurface conditions were no longer considered in the ground setup. The details of the model setup can be seen in Table 2.
In addition, the residual is an essential indicator of the convergence of an iterative solution, since it directly measures the error in the process of solving the system of equations. The residual quantifies the local imbalance of the conserved variables within each control volume in a CFD analysis. The smaller the residual value, the more accurate the numerical solution. The whole residual curve of the CFD calculation is presented in Figure 11, which indicates the iterations per time step.
The meteorological data for each measurement location and for other areas were obtained by simulating different working conditions with the modified CFD model. All data used to calculate the UTCI were derived from continuous observations of the same residential areas over a one-year period. In addition, it is impossible to measure thermal sensation in studies of the built environment. Only questionnaires can be used to understand the thermal sensation of an environment in terms of the TSV, which means that the participants were asked to describe their thermal sensation on some kind of hierarchical scale (mainly the Bedford scale and the ASHRAE scale). Therefore, ten different scales were used in this paper to describe the thermal sensation vote (TSV) of elderly people in severely cold climates based on the definition of the UTCI and relevant research [34,35] (as shown in Figure 12).
The data were transformed and entered into a parametric calculation program in GH (Grasshopper), which enabled the calculation of UTCI indicators for elderly people in residential areas in severely cold climates during the summer months. This paper followed an approach similar to that of Lin in order to explain the relationship between the UTCI and TSV [29]. The mean TSV could be calculated for each one-degree UTCI interval. For instance, if the value of the mean TSV of the elderly was close to 22 degrees to 23 degrees and the UTCI was 1.87, this meant that the mean TSV was equal to 1.87 for a UTCI of 22.5 degrees. Based on this method, the functional and formal relationships between the UTCI and the thermal sensation vote (TSV) during summer are illustrated in Equation (1).
y = 0.0818x − 0.4747,
where x is the UTCI (°C), y is the TSV, and R2 is 0.6707. The relations between the UTCI and the mean TSV in summer are shown in Figure 13.
Furthermore, this paper summarizes the findings of questionnaires from seven measured locations and neighborhoods in order to verify whether this threshold range was consistent with the real outdoor thermal sensations of the elderly. The percentages of the total numbers of people with different thermal sensations were calculated according to the range of values of the original UTCI and the adapted UTCI, respectively. These results were also compared with the TSV values. All the analyses of test points 1 to 7 are shown in Figure 14.
The different values of the UTCI and adapted UTCI at each test point are presented in Table 3. It can be seen that the revised UTCI threshold range could more exactly represent the outdoor thermal comfort of elderly people and was closer to the results of their subjective evaluations.
The mean air temperature on the measured days in spring was slightly higher than that in fall by 2.5 °C based on the results of the previous field measurements. The highest temperature was 4.8 °C higher than that in fall, and the lowest temperature was 1.7 °C lower than that in fall. As for the wind speed, the mean wind speed on the measured days in spring was slightly higher than that in fall by 0.8 m/s; the highest wind speed was higher than that in fall by 2.9 m/s, and the lowest one was lower than that in fall by 0.67 m/s. In terms of relative humidity, the mean relative humidity on the measured days in spring was slightly lower than that in fall by 17.1%, the highest relative humidity was higher than that in fall by 2.2%, and the lowest one was less than that in fall by 28.8%. For the mean solar radiation temperature, the data on the measured days in spring were 4.4 °C higher than those in fall, the highest mean solar radiation temperature was 9.4 °C higher than that in fall, and the lowest mean solar radiation temperature was 0.5 °C higher than that in fall.
From the above results, it is evident that there was less difference in the observed meteorological indicators (air temperature, wind speed, and relative humidity) in spring and fall as the transitional seasons between summer and winter, with only a slightly larger variation in the mean solar radiant temperature. In addition, it was found after counting the results of the questionnaire survey that elderly people’s subjective thermal comfort ratings in these two seasons were basically concentrated between −1 and 2. Therefore, this paper combined spring and fall into a transitional season model. The results for the thermal comfort indicator—the UTCI modified with different thermal sensation thresholds—in the two seasons were basically the same.
For the construction of the models for transitional seasons, the methods were similar to those described above. The radiation model was also set to the DO (discrete ordinate) model with the discrete coordinate method, which was more accurate. Additionally, the wind direction may have had a greater impact on the numerical model than during the summer and winter seasons due to the higher values of wind speeds and the corresponding results of the questionnaire survey during the transitional season. In accordance with the same calculation method [36], the functional equations of the UTCI and the thermal sensation vote (TSV) for the elderly during the transitional seasons are shown in Equation (2).
y = 0.0537x − 0.1834,
where x is the UTCI (°C), y is the TSV, and R2 is 0.7265. The relation between the UTCI and mean TSV in the transitional seasons is shown in Figure 15.
Following the same calculation method as that for the summer season, the differences among the subjective results, the modified indicators, and the pre-modified indicators are shown in Table 4.

5. Discussion

5.1. Adjustment of the Threshold of the Outdoor Thermal Comfort Index in Different Thermal Sensation Intervals

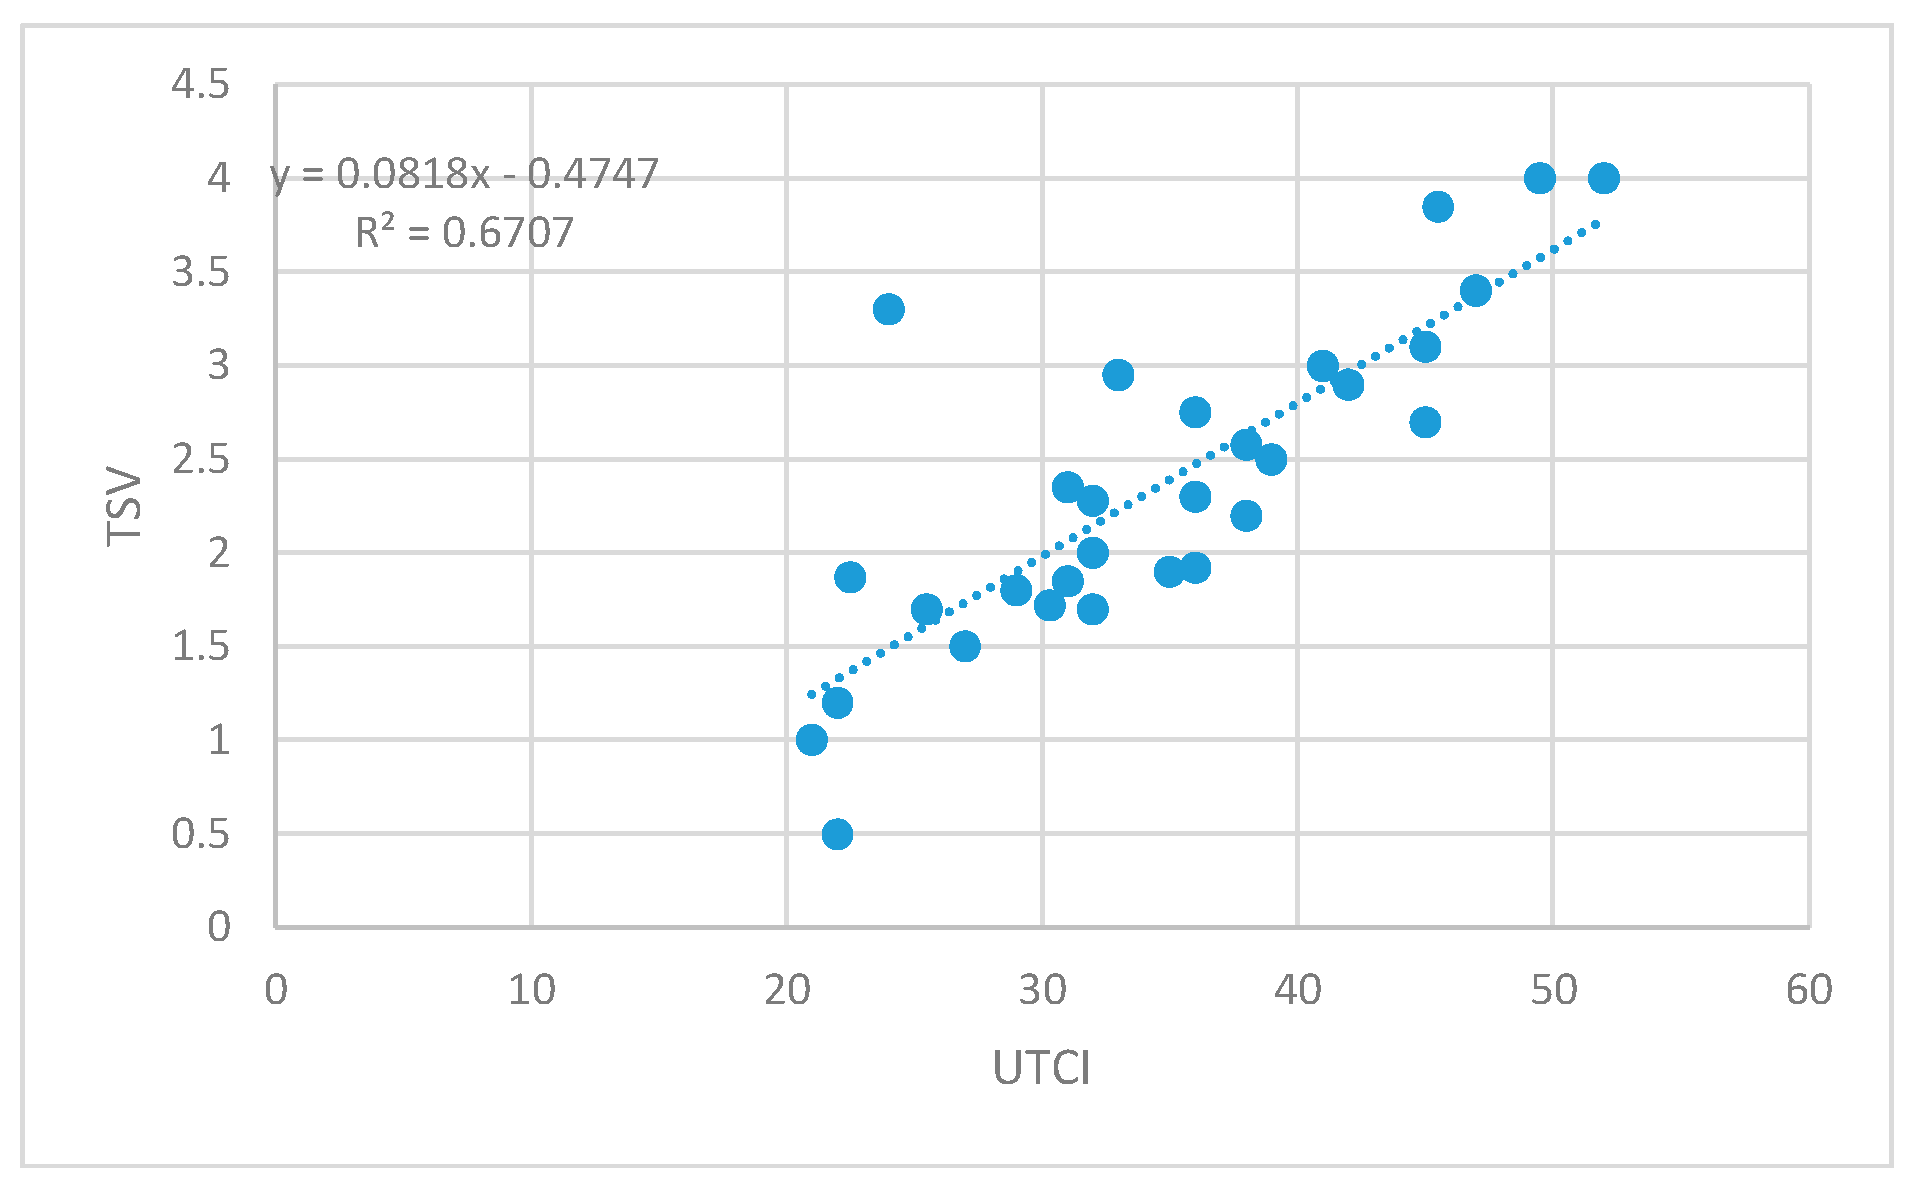
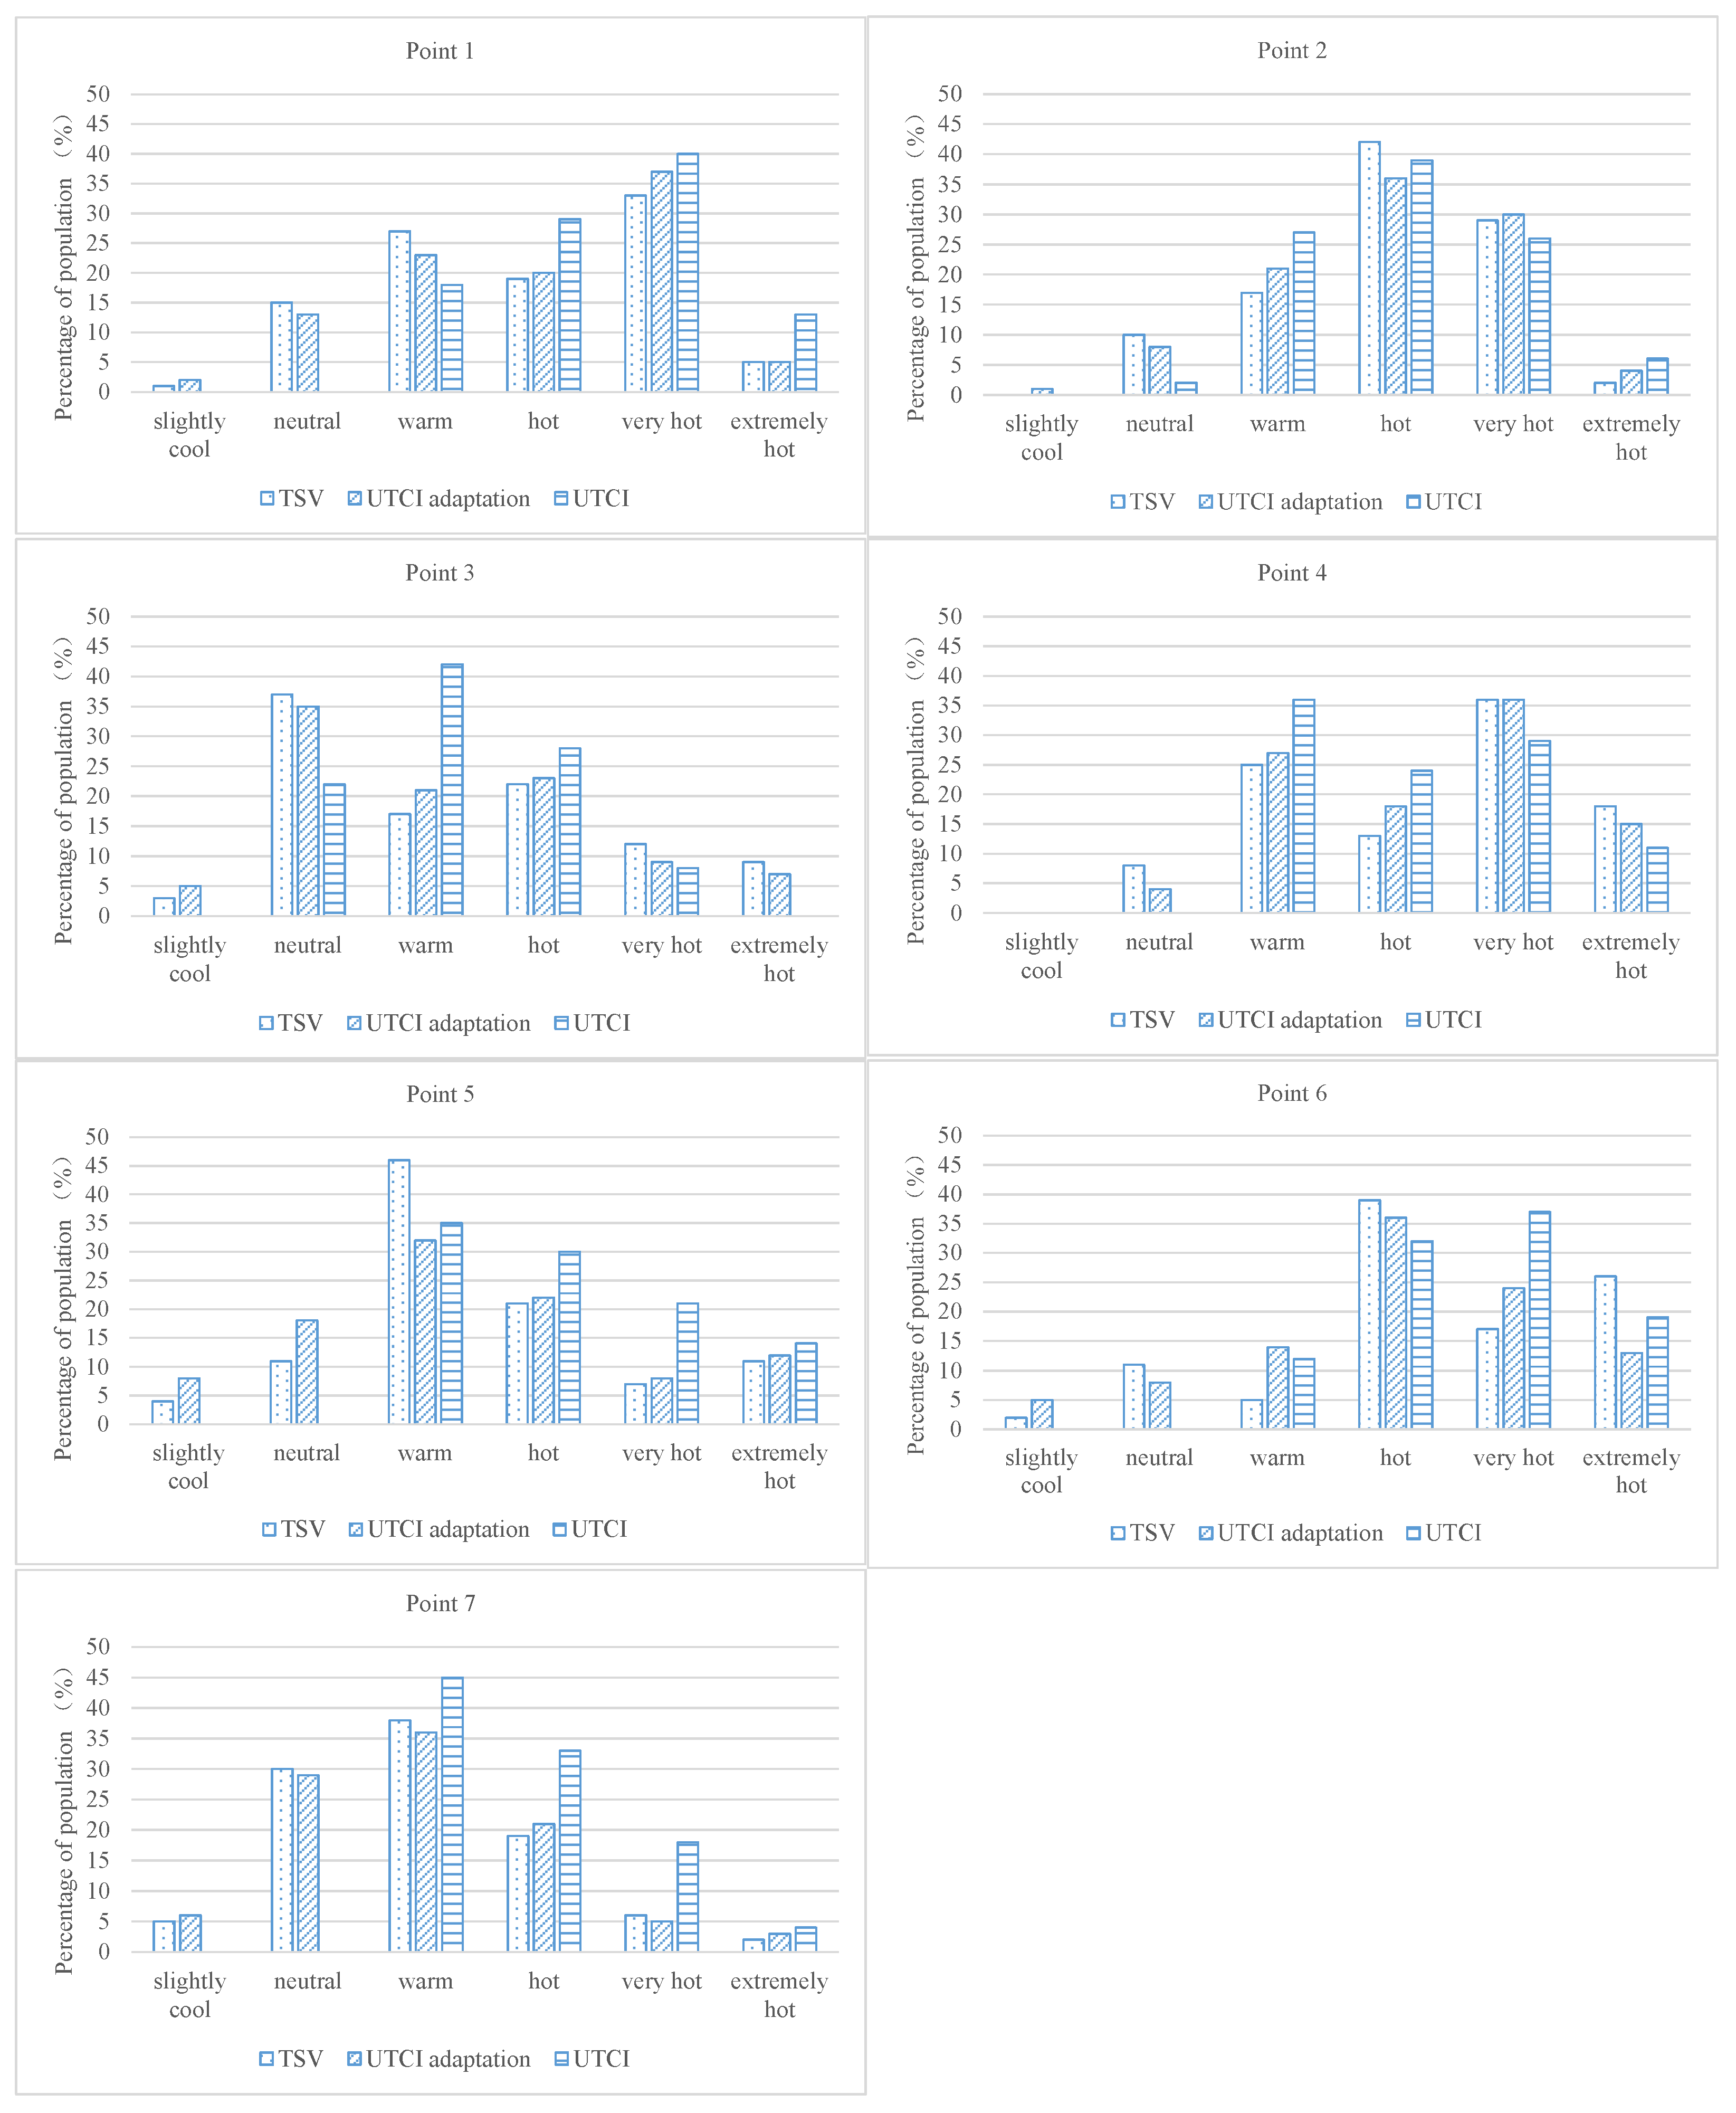
Before summarizing the critical values of the UTCI for older adults in severely cold cities in each season based on the aforementioned results, we prioritized separately verifying the accuracy of the modified UTCI using the TSV data from elderly people obtained with the questionnaire survey. The results demonstrate that the model of the transitional seasons had the highest precision, followed by that for summer, while that for winter had the lowest precision. Additionally, it was identified that the modified UTCI exhibited the highest degree of assessment accuracy for test sites 3 (green spaces), 6 (open public squares), and 7 (pedestrian walkways) by comparing the percentage differences among the various test sites (as presented in Table 5). Conversely, the accuracy was the lowest for test site 2 (fitness areas). This was probably because some older adults had greater variations in activity patterns, frequency, and CTR in the fitness area than others. These factors can cause significant variations in the metabolic rates of different older adults, which could easily affect the accuracy of the threshold ranges for outdoor thermal comfort evaluation indicators.
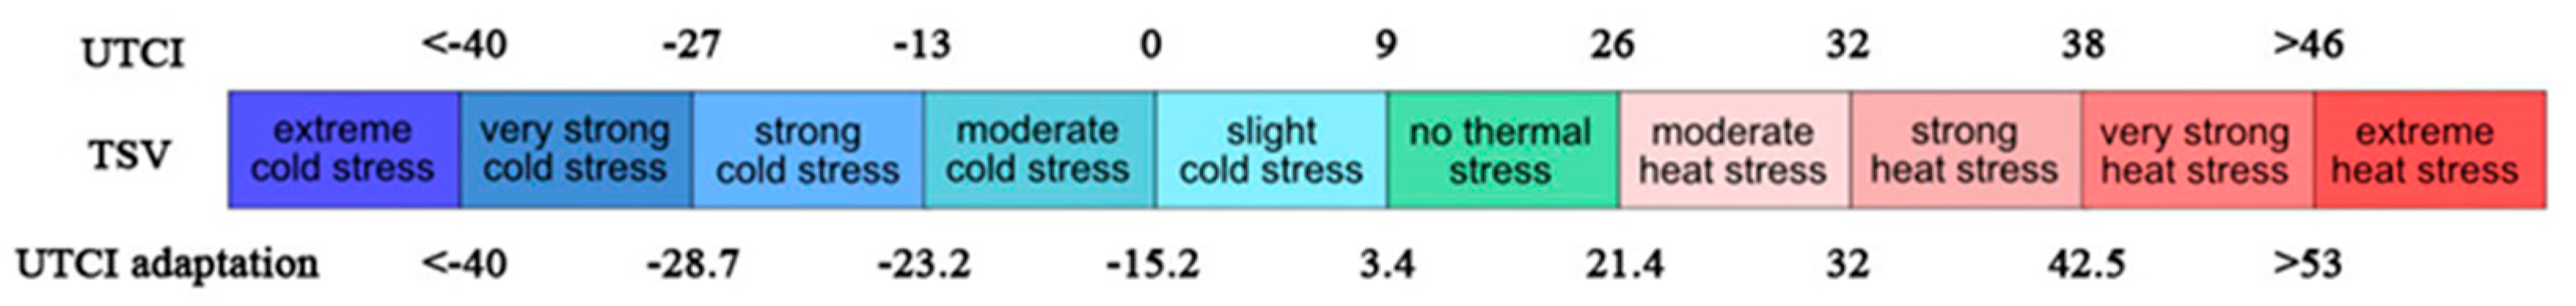
The threshold values of the modified UTCI corresponding to the different thermal sensation intervals after integrating the results from different seasons are shown in 
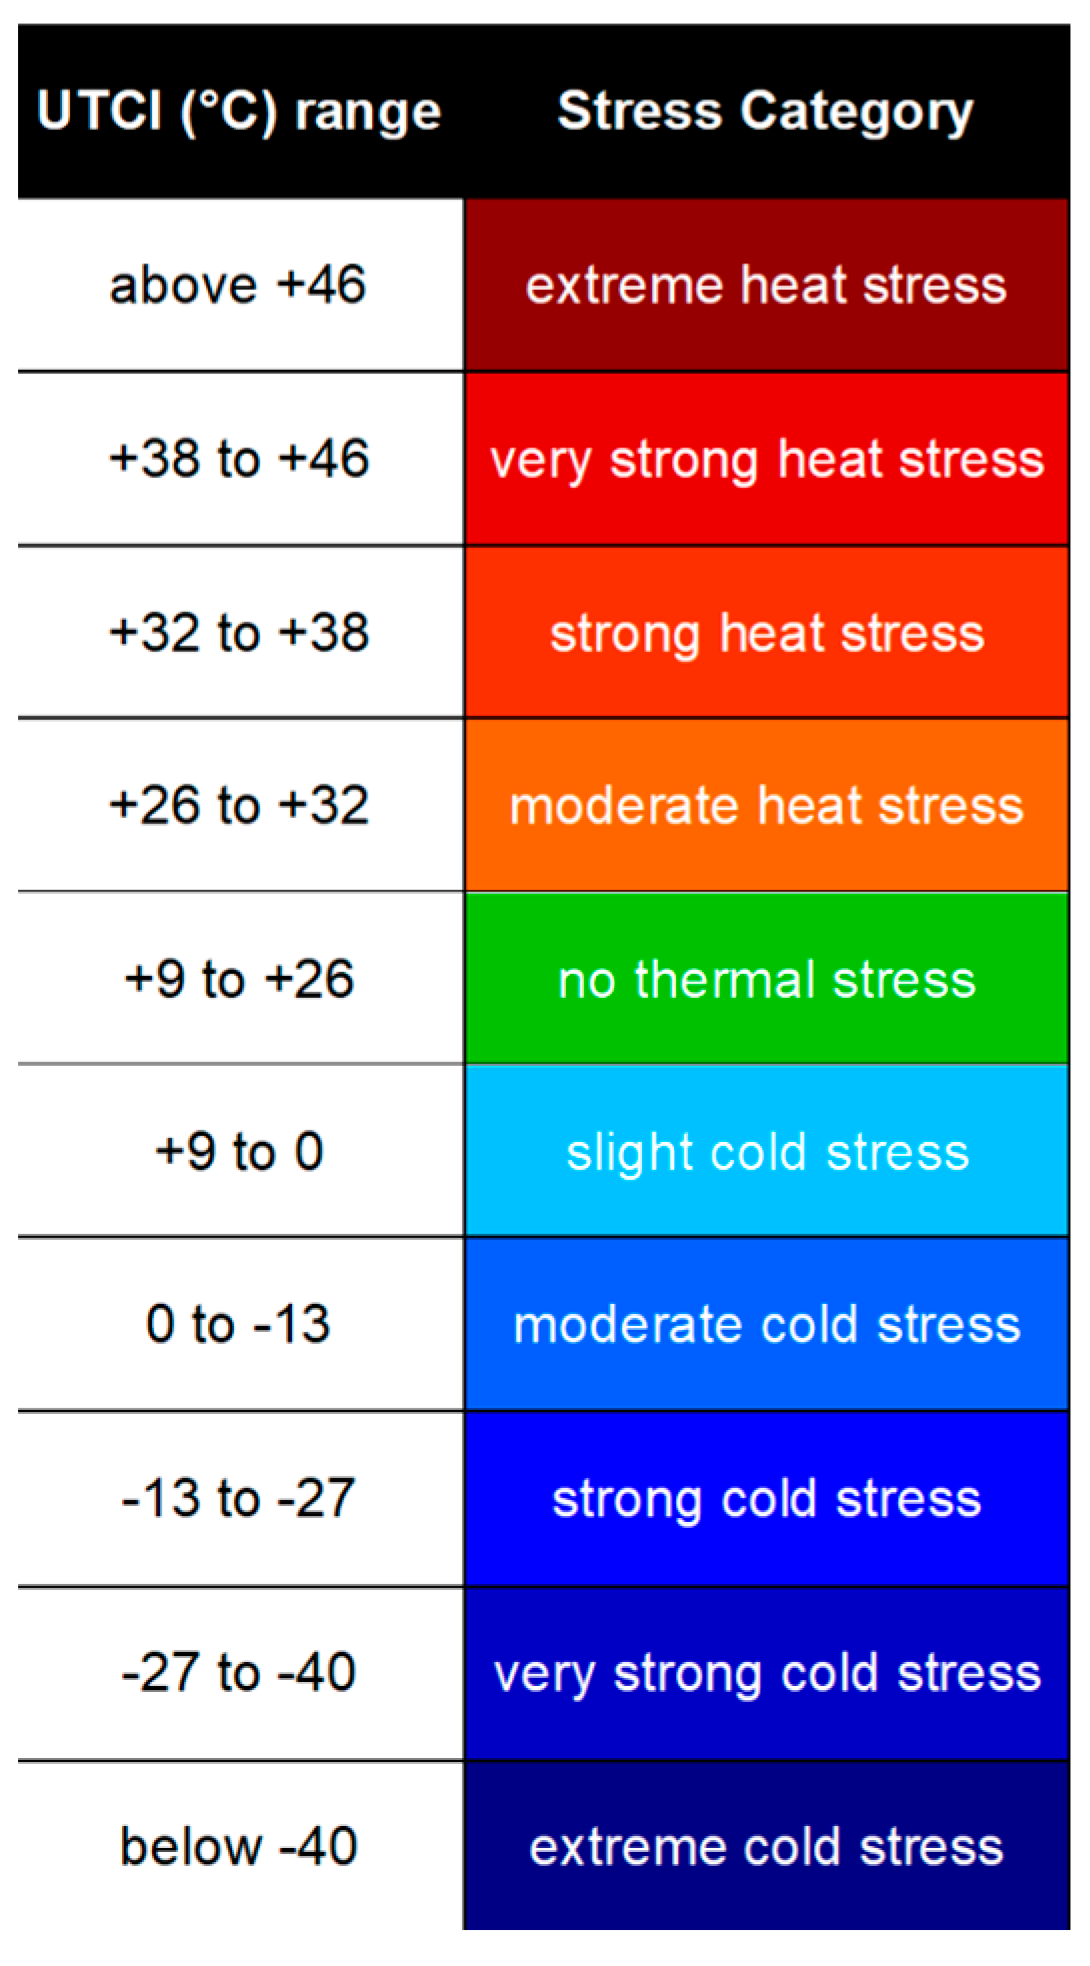
Figure 16. The range of UTCI adaptation included extremely cold (<−40 °C), very cold (−40~−28.7 °C), cold (−28.7~−23.2 °C), cool (−23.2~−15.2 °C), slightly cool (−15.2~3.4 °C), neutral (3.4~21.4 °C), warm (21.4~32 °C), hot (32~42.5 °C), very hot (42.5~53 °C), and extremely hot (>53 °C).
Except for the extremely cold range, it was evident that the threshold ranges for all other categories differed significantly from the standard UTCI thresholds. When it came to experiencing cold sensations, the ranges for cold and cool were smaller than the standard ranges by 8.5 °C and 5 °C, respectively, whereas the range for slightly cool was larger by 9.6 °C. The range for the neutral zone was close to the standard, but the average value was 5.1 °C lower. For the hot sensation, almost all interval values were larger than the standard by 4.6 °C, 4.5 °C, and 2.5 °C.
Furthermore, 
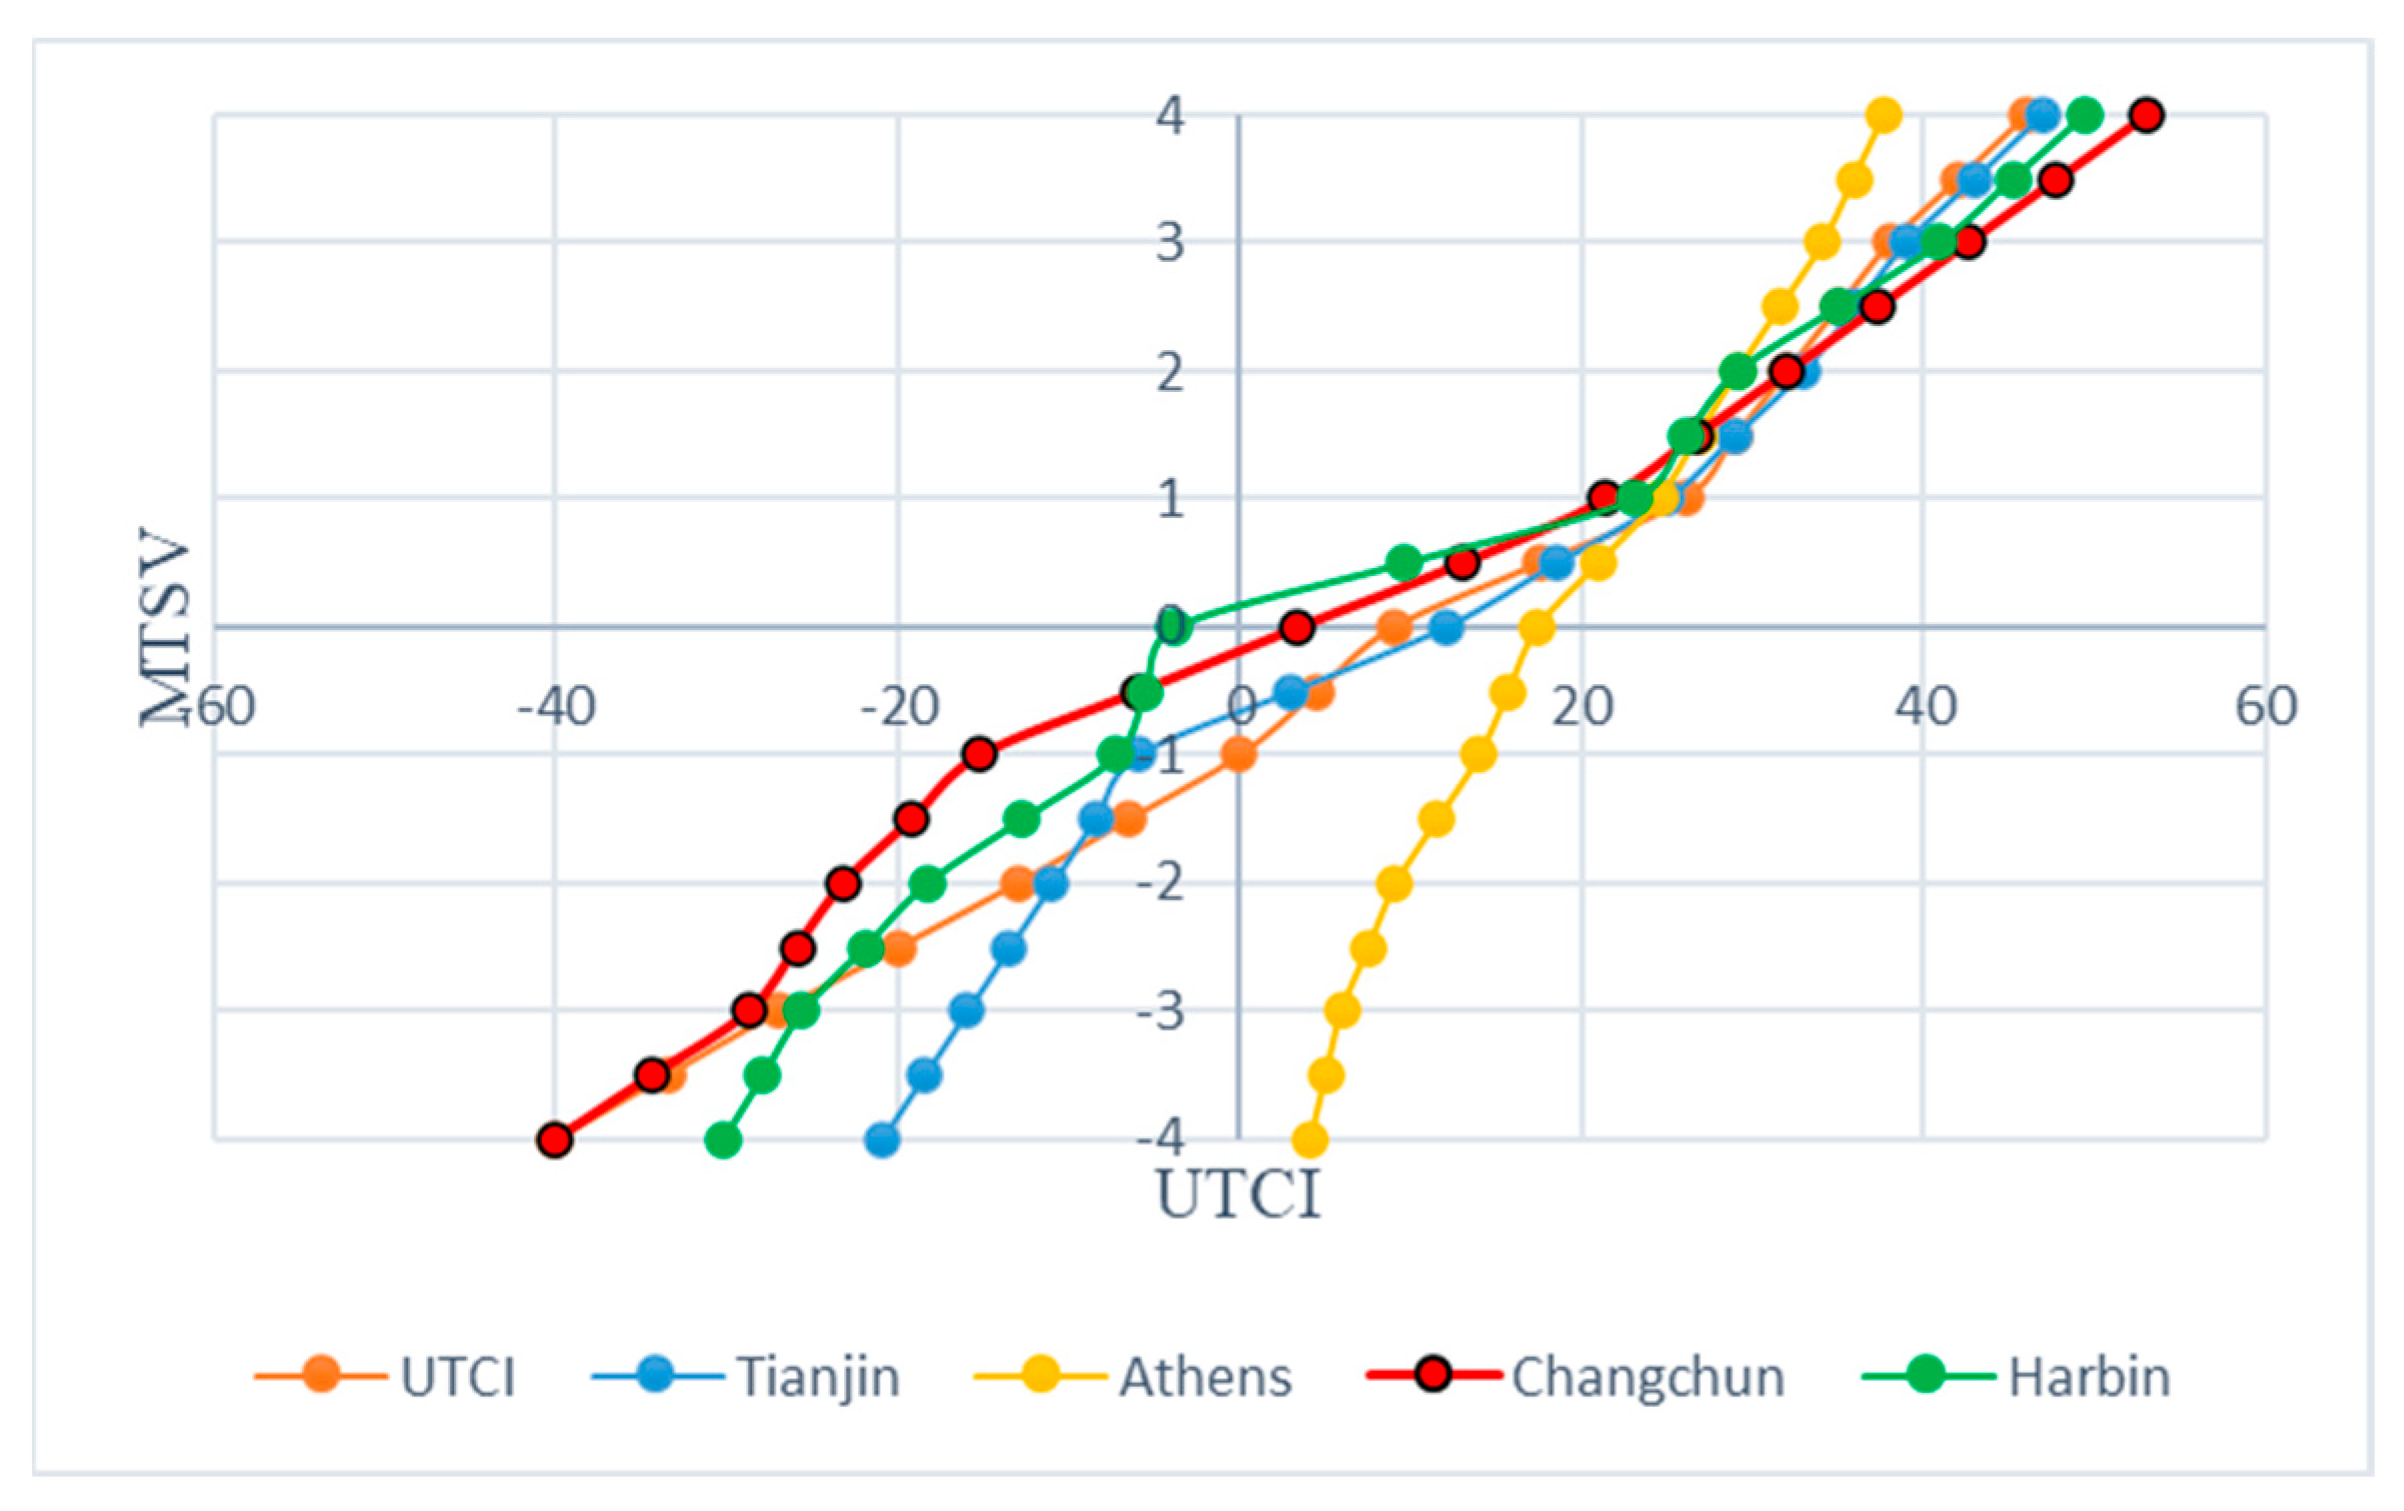
Figure 17 indicates a notable decrease in the values of the adapted UTCI from the cool range to the extremely cold range, especially during the cold stage. Additionally, elderly individuals seemed to have a relatively broader range of tolerance for the slightly cool and moderate temperature ranges. This may suggest that older adults in cold regions have better self-regulation awareness than other age groups do, which implies that their tolerance for outdoor thermal environments increases with age.
Compared to research results in other climatic zones, it was found that different geographical and climatic conditions had a significant influence on the threshold range of the UTCI (as shown in Table 6). For instance, the research results in the Mediterranean climate (subtropical dry summer climate) and in regions with cold climates were quite different from those in severely cold regions. The Mediterranean climate is characterized by a short and warm winter, a long and hot summer, and relatively high humidity throughout the year [37]. A study in Athens indicated significantly higher thresholds for cold sensations and smaller ranges between sensations, with thresholds ranging from 4.1 °C to 17.4 °C for very cold to slightly cold, respectively. Conversely, the threshold for feeling hot was significantly lower than the standard range, varying from hot to very hot between 24.5 °C and 37.7 °C. The moderate values were significantly higher than those in other climatic zones, but the range of values was smaller.
For cold regions (Tianjin), the “no thermal stress category” range of the UTCI was 12 °C to 25 °C, with a marginally lower range difference than that in severely cold regions [15]. Furthermore, the range of values for cold sensations was relatively small but highly variable. The range from slightly cool to very cold was between 12 °C and −21 °C. In terms of hot sensation, there was a relatively large range. Feeling hot occurred at a temperature 2.6 °C lower than the range value for severely cold regions, and the threshold for feeling very hot was also lower than that for severely cold regions.
As can be seen in Table 6, the results of this study differed from those of other studies in similar climatic conditions according to variations in the age of the participants in the survey. Jin Hong et al. analyzed outdoor thermal comfort on the pedestrian streets of Harbin (in a cold region) and gave a threshold for the modified UTCI [23].
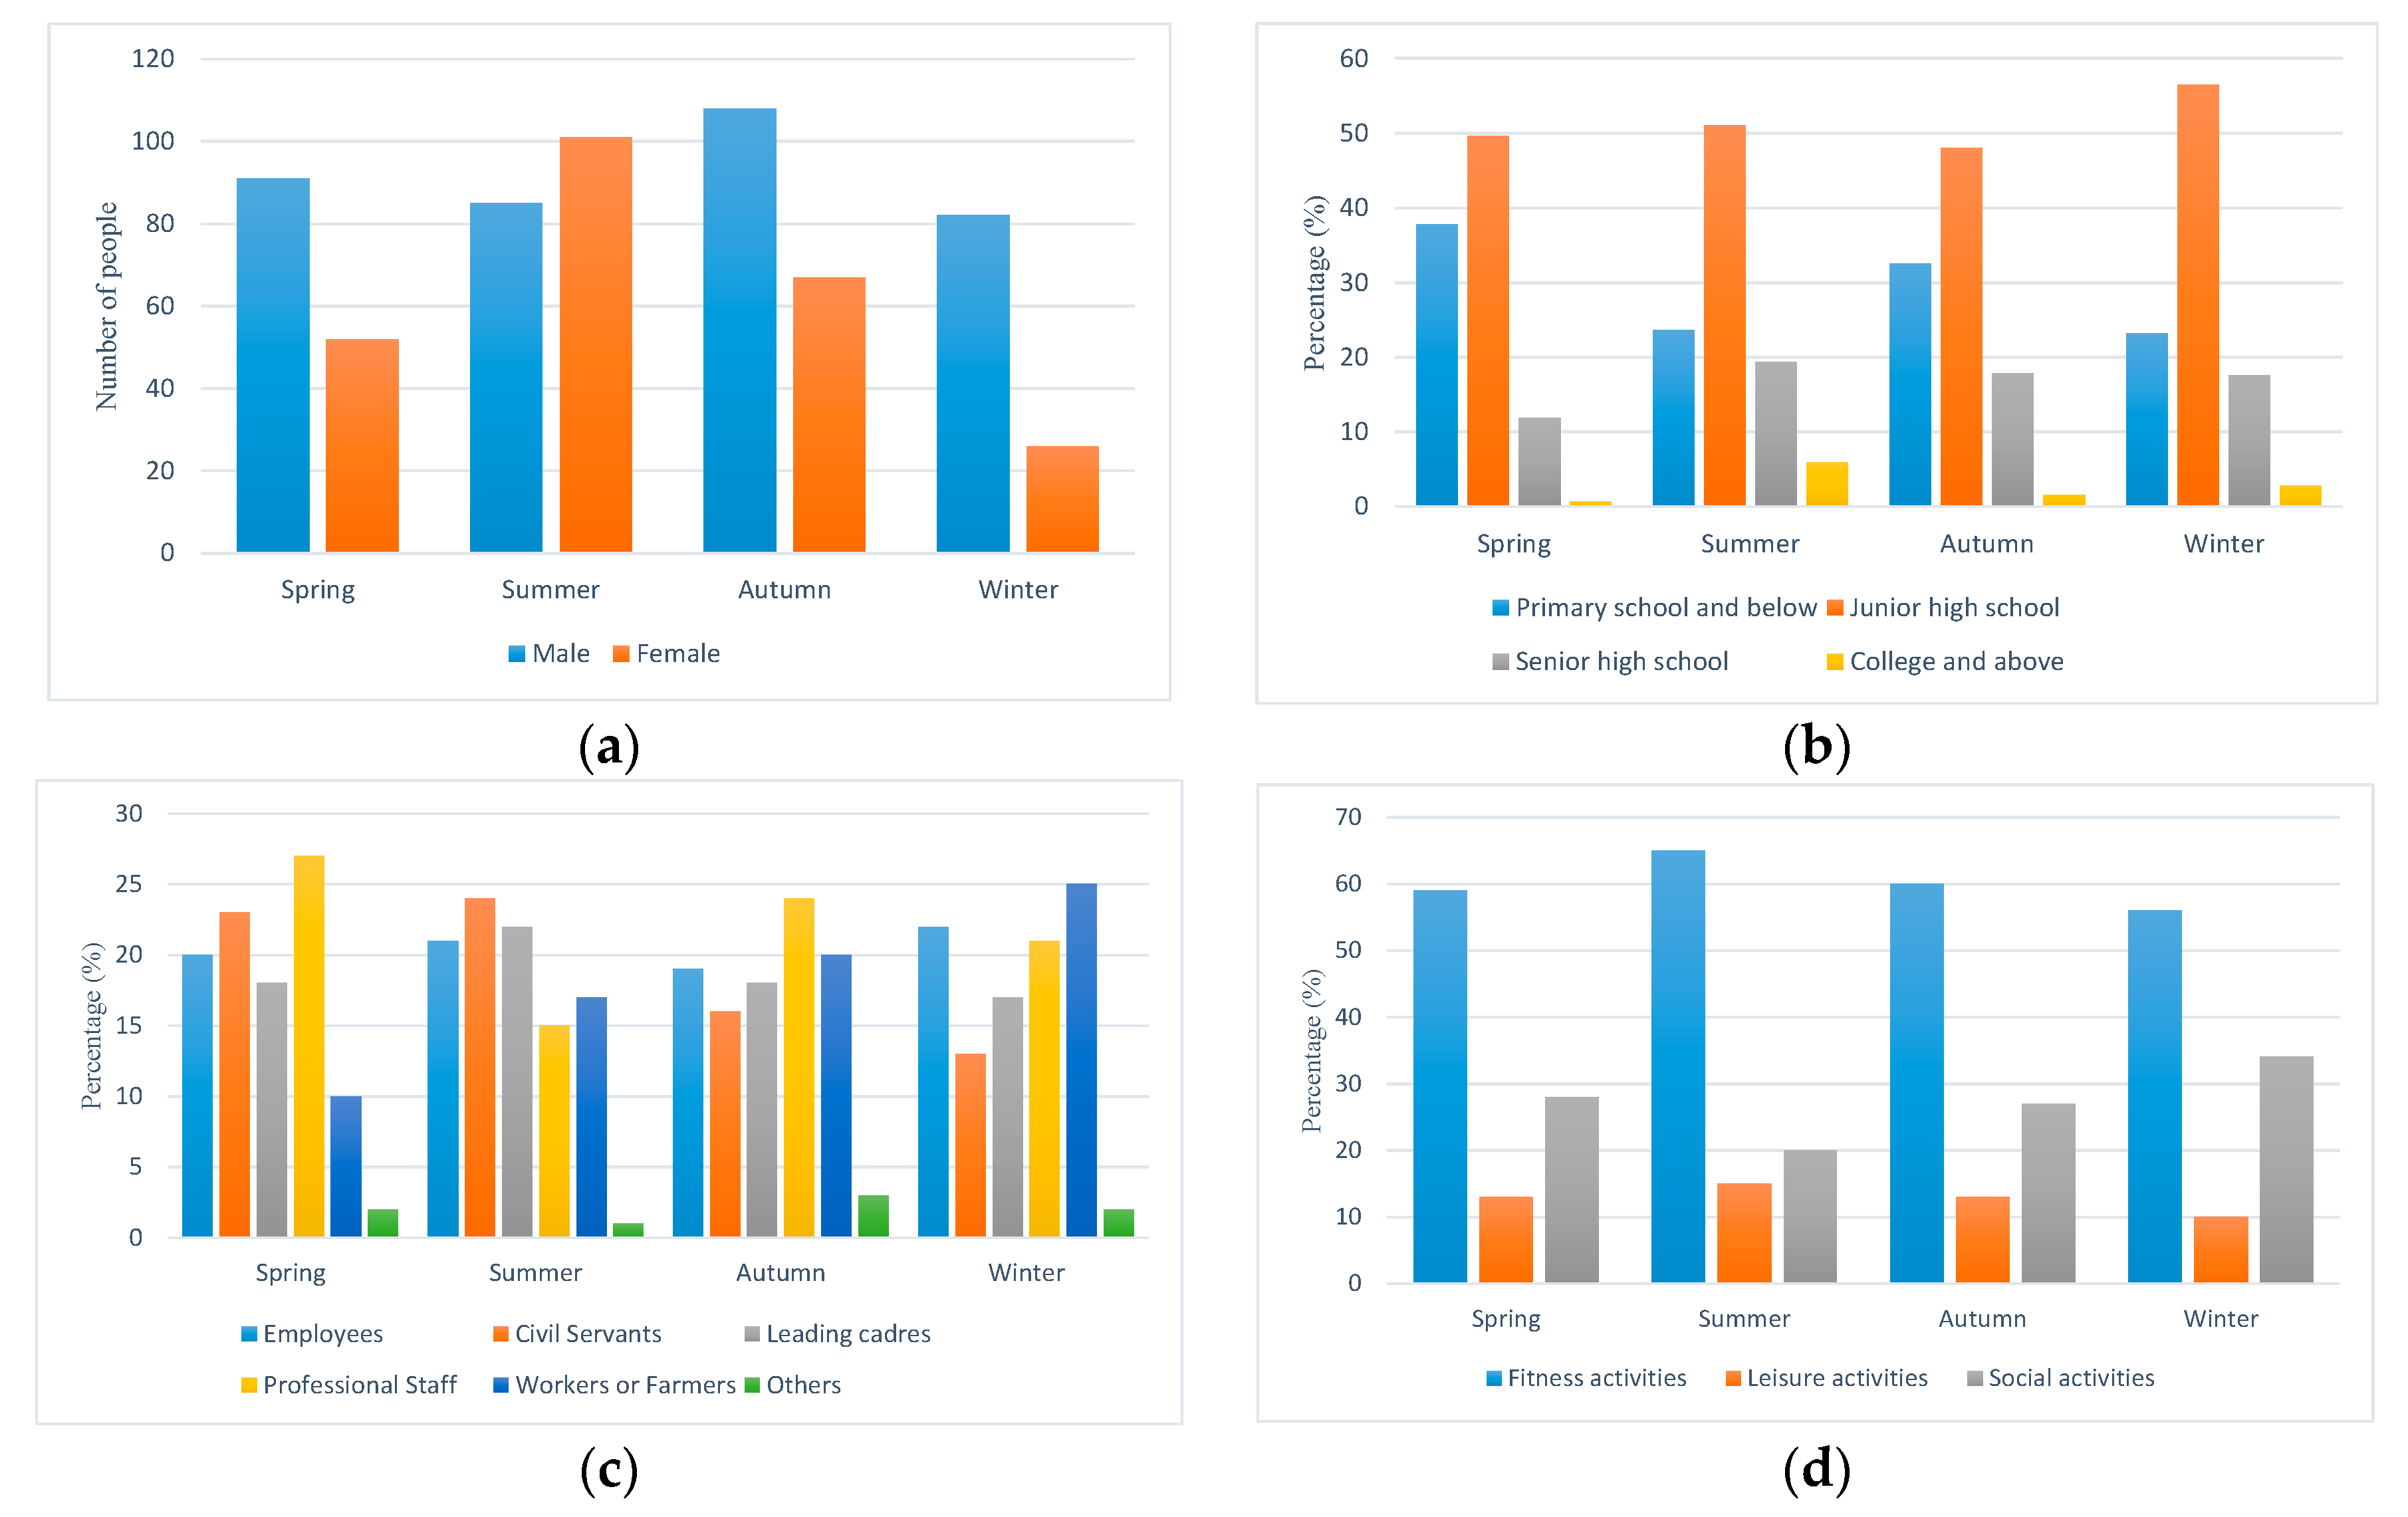
Their findings on the UTCI in the neutral to slightly cold range deviated somewhat from the results of this study while approaching this study’s results in the hotter range. The reason for these results is the factor of age. The age distribution of the population who participated in the questionnaire survey conducted in Harbin showed that 18–30 years was the largest range, accounting for 57%, 52%, 59%, and 50% during the four seasons. The proportions of participants aged 31–40 years were 10%, 18%, 17%, and 18%, respectively, while the proportions of those aged 41–50 years were 9%, 13%, 11%, and 14%. Moreover, the proportions of those aged 51–60 years were 10%, 8%, 4%, and 10%, and those of participants aged 60 years and above were 14%, 9%, 9%, and 8%. In general, the population was dominated by young and middle-aged people between the ages of 18 and 50, with older people over the age of 60 accounting for about 10 percent [23]. In contrast, the population in this paper was exclusively older than 60 years of age. A comparison of the different results of the two studies revealed a higher preference for heat in the older age group. Starting from warmer temperatures, the range of values taken for each stage of thermal sensation gradually increased. This reflects the difference between older age groups in cold regions and other age groups, namely, the preference for heat rather than cold. When the range of moderation was compared, it could be seen that the range of the UTCI when feeling moderate in the elderly (3.4 °C–21.4 °C) was smaller than that for the young and middle-aged groups (−3.8 °C–23 °C). For cold sensations, the thresholds of the elderly were lower than those of the young and middle-aged groups in all intervals, which may be related to their thermal experience and thermal adaptation from the habitual wearing of thick clothing and long-term living in a cold region.

5.2. Outdoor Thermal Comfort Models for Different Seasons

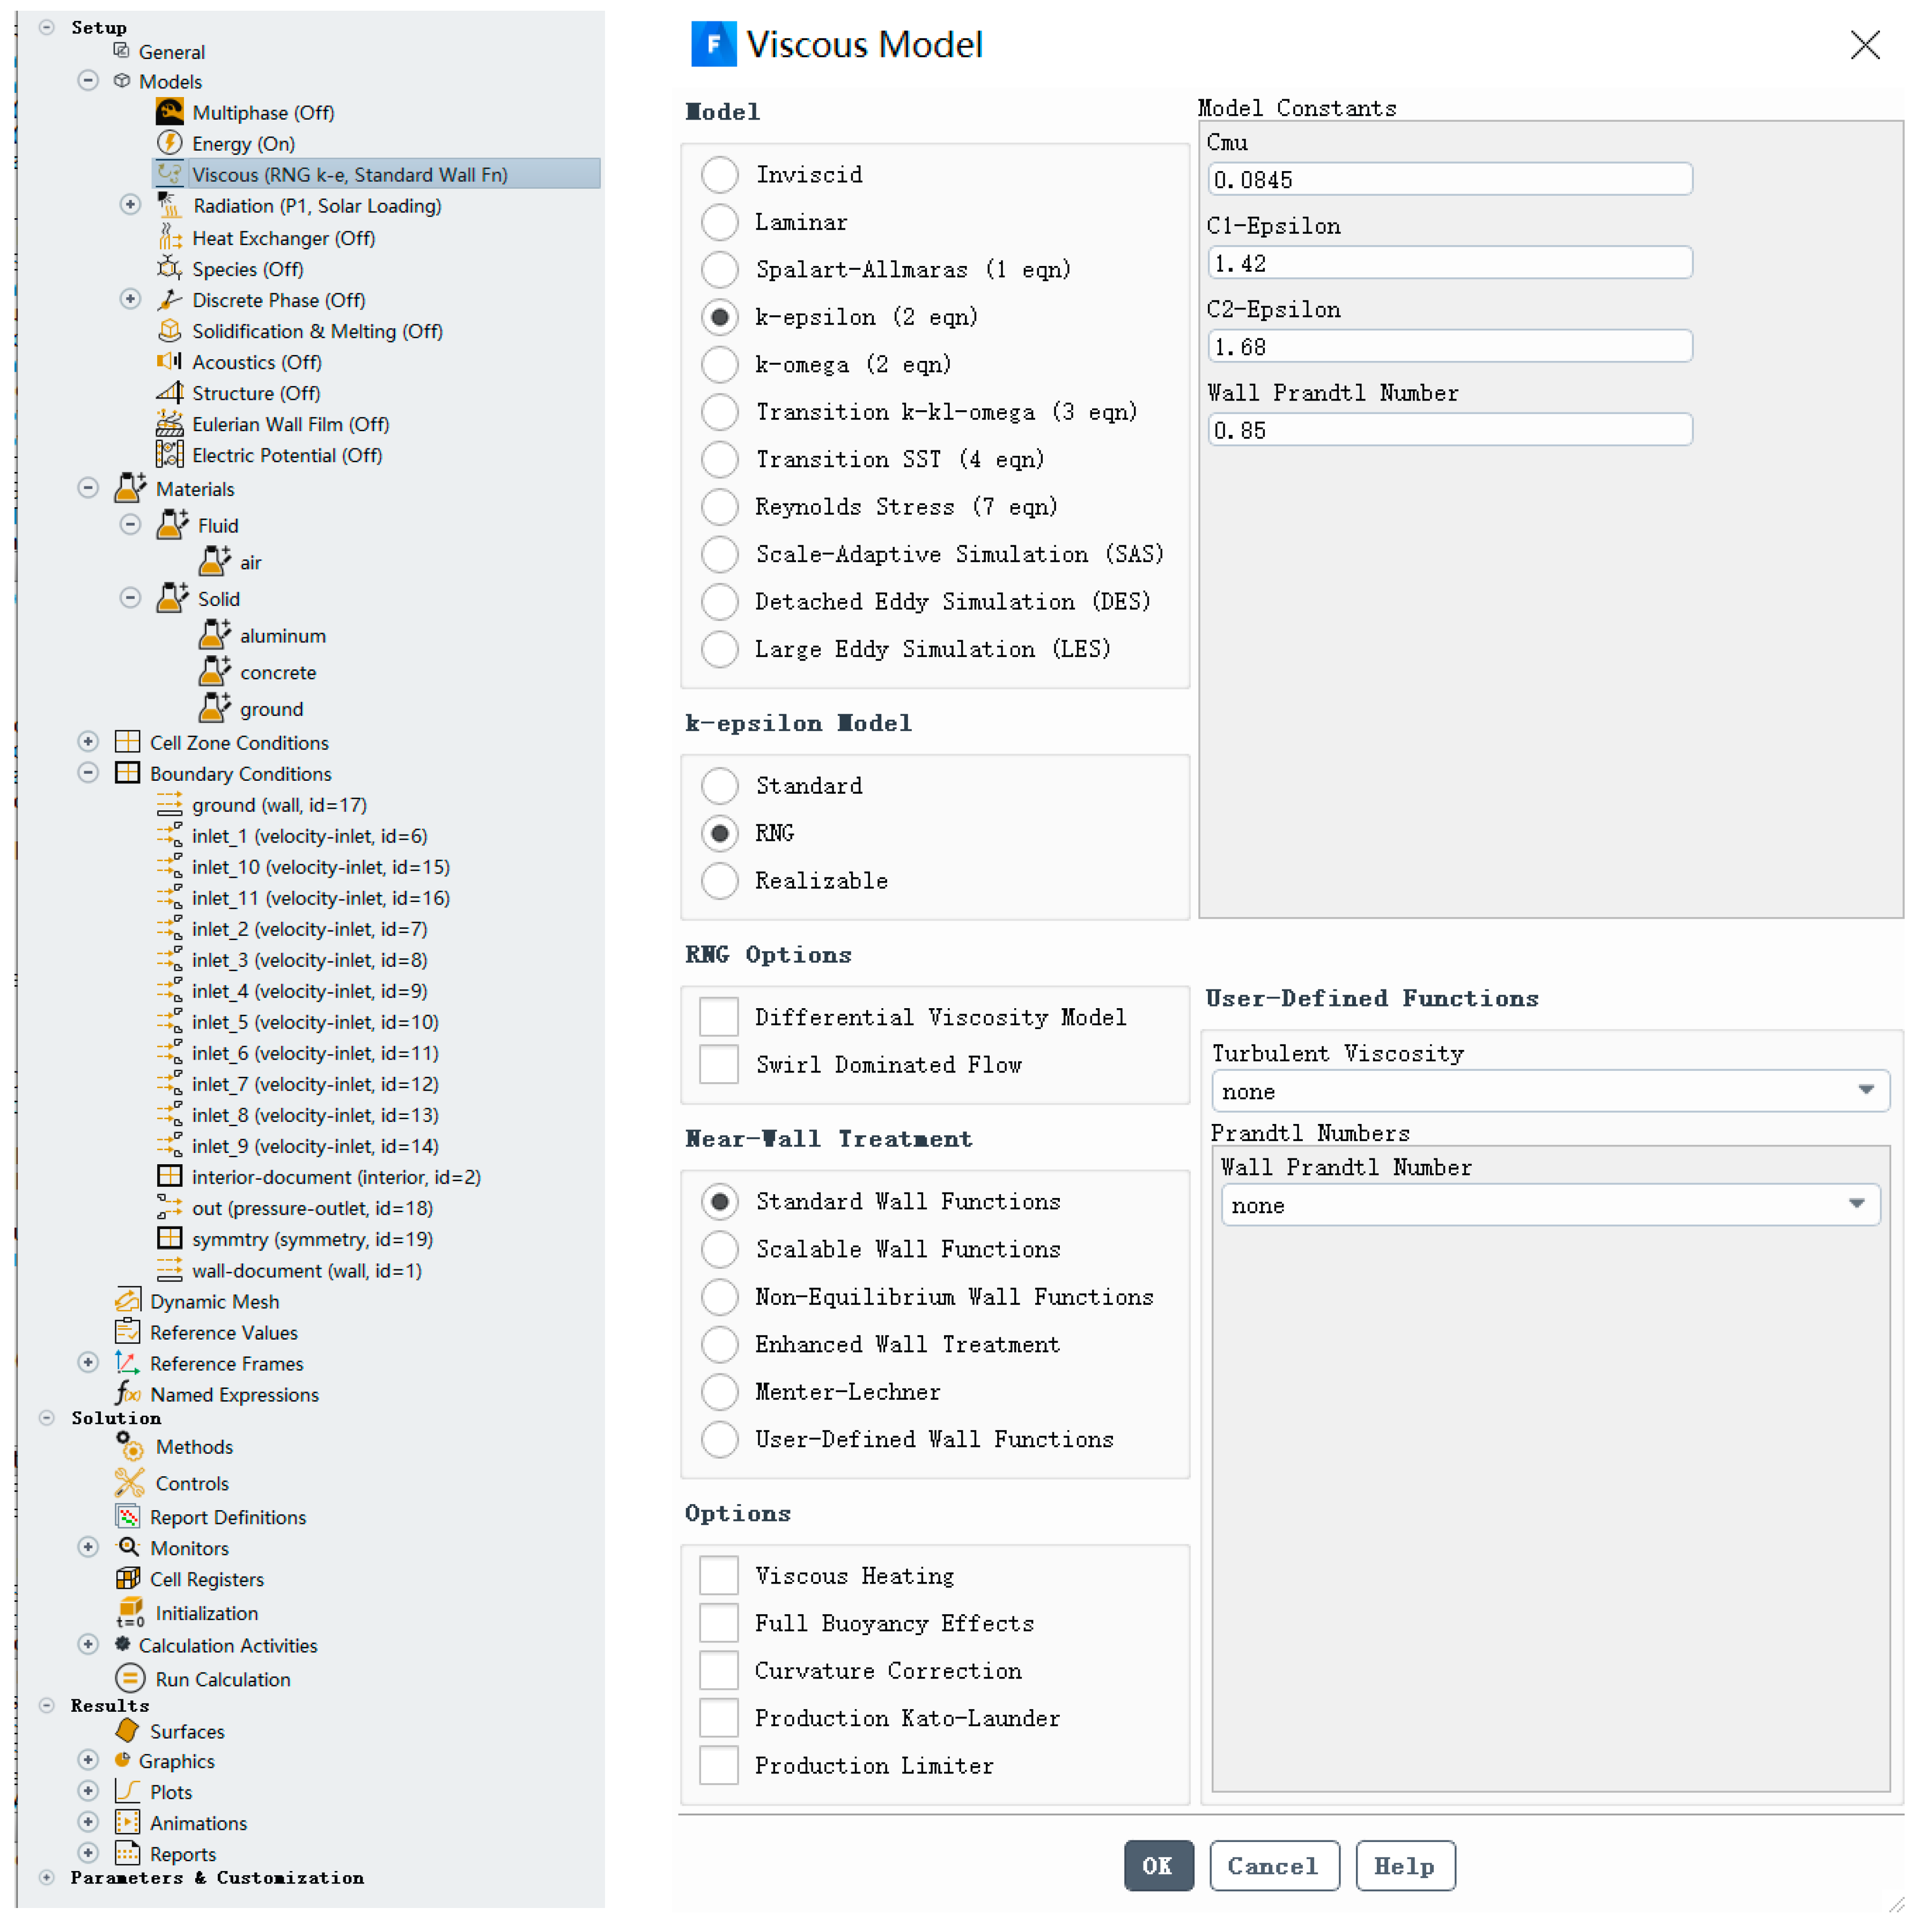
Before the outdoor thermal comfort model is built, critical issues need to be discussed, including whether the basic algorithm for calculating the UTCI should also be adapted to regional climatic characteristics and varying age groups, since UTCI values in severely cold regions represent different thermal sensations from those in other regions. The existing computational method mainly uses online calculations [
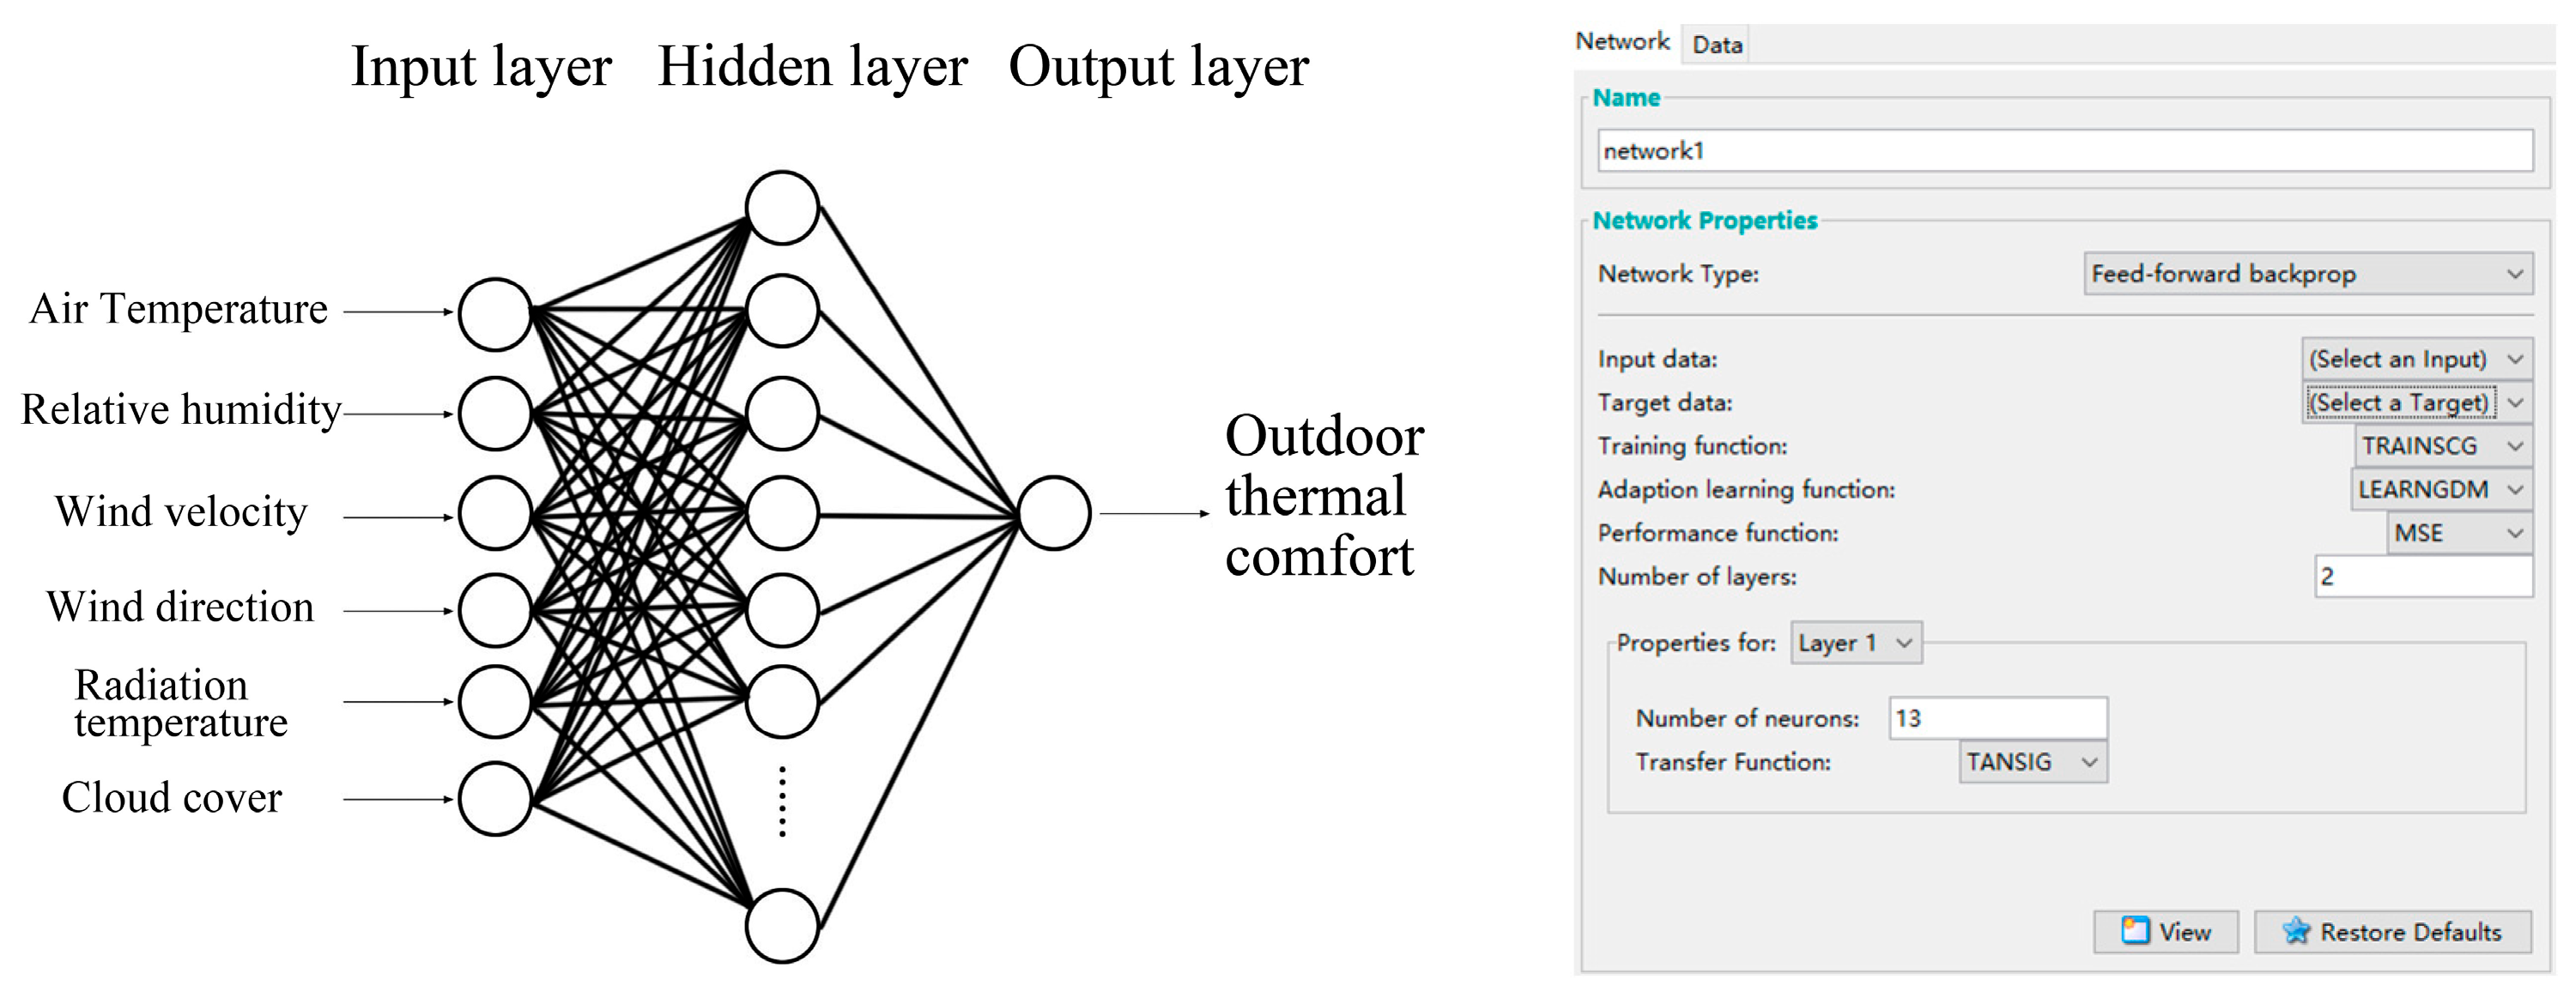
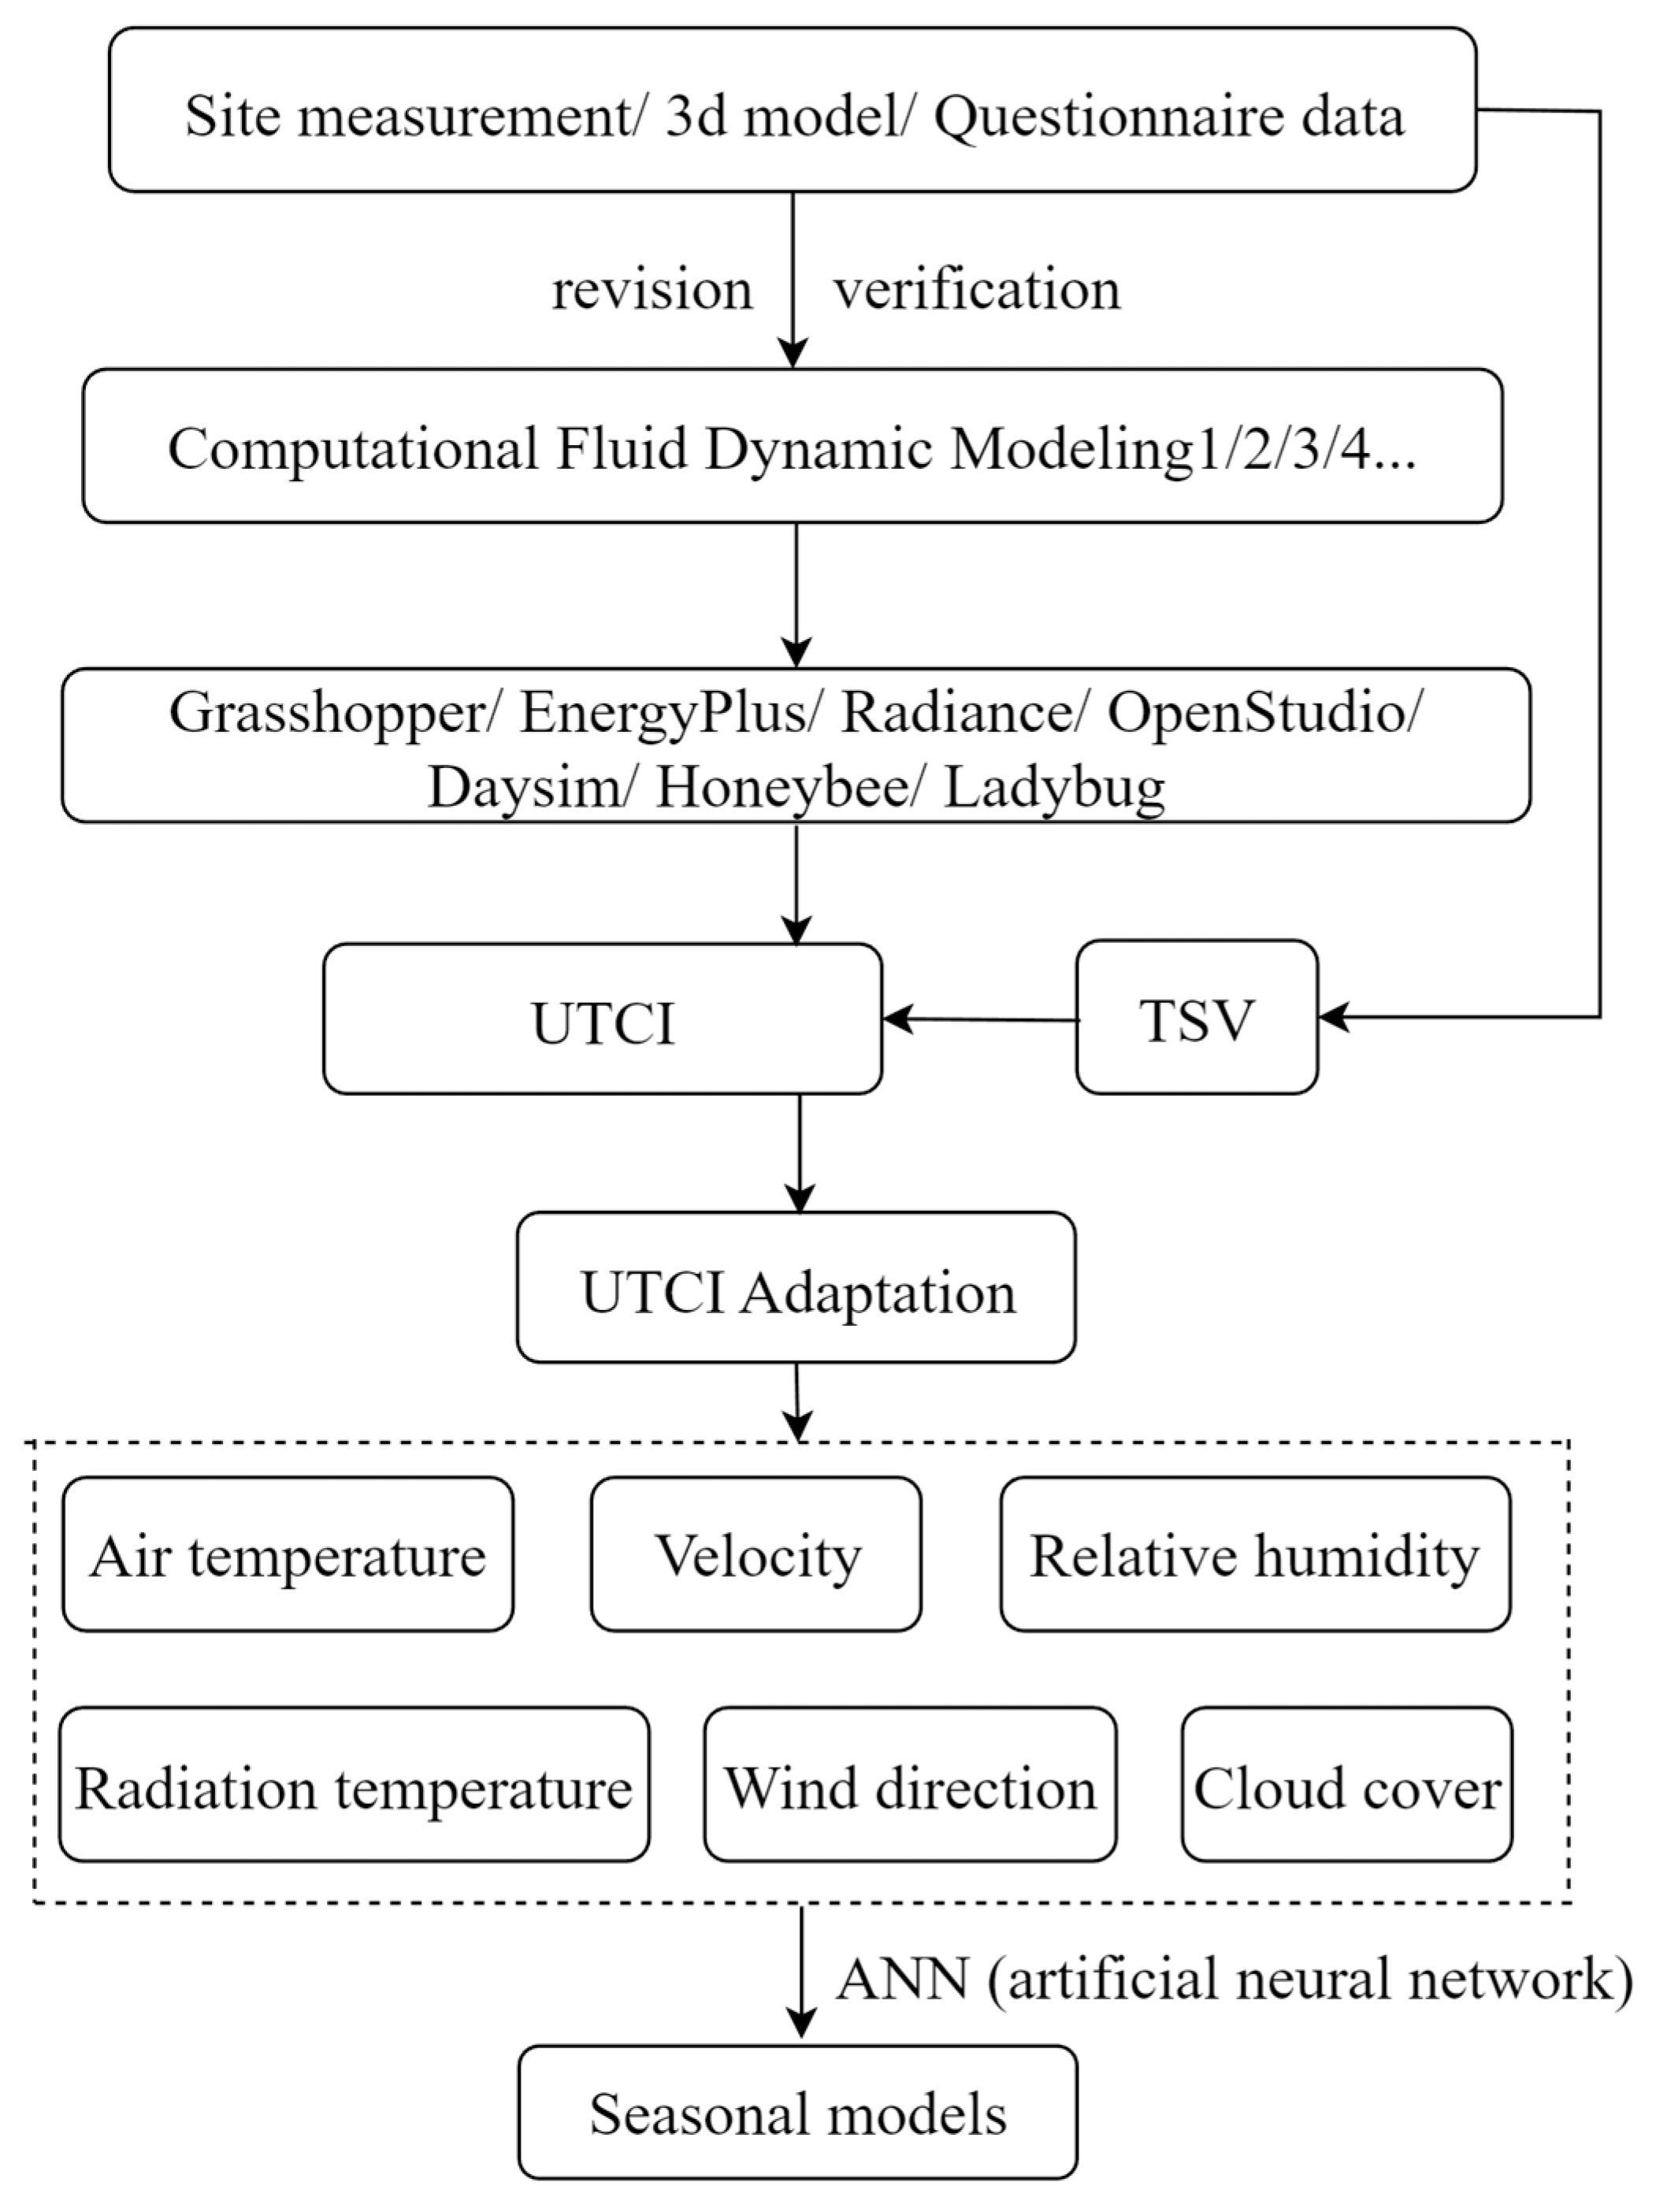
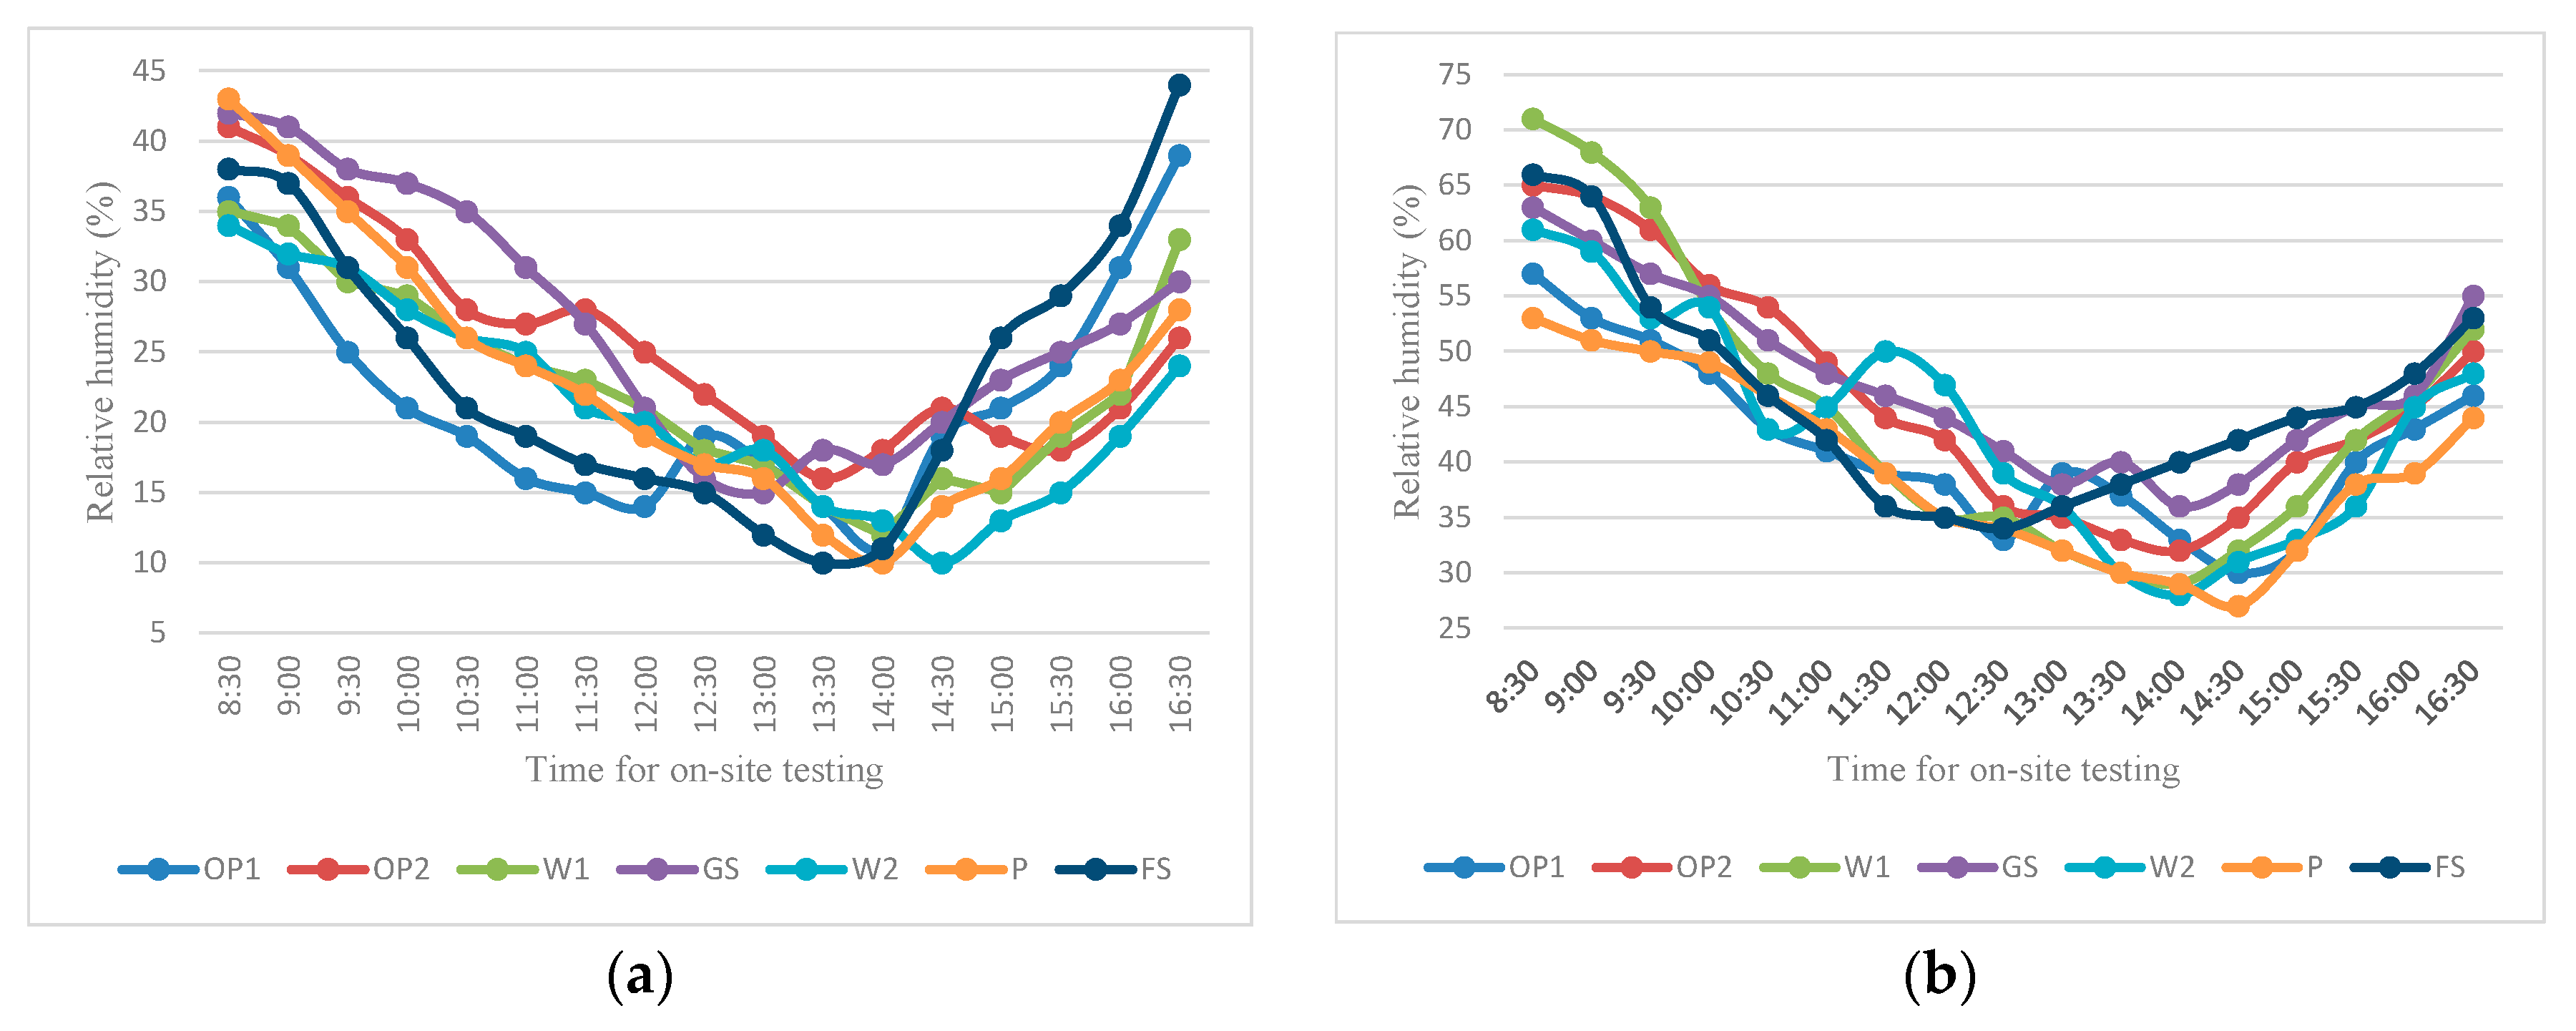
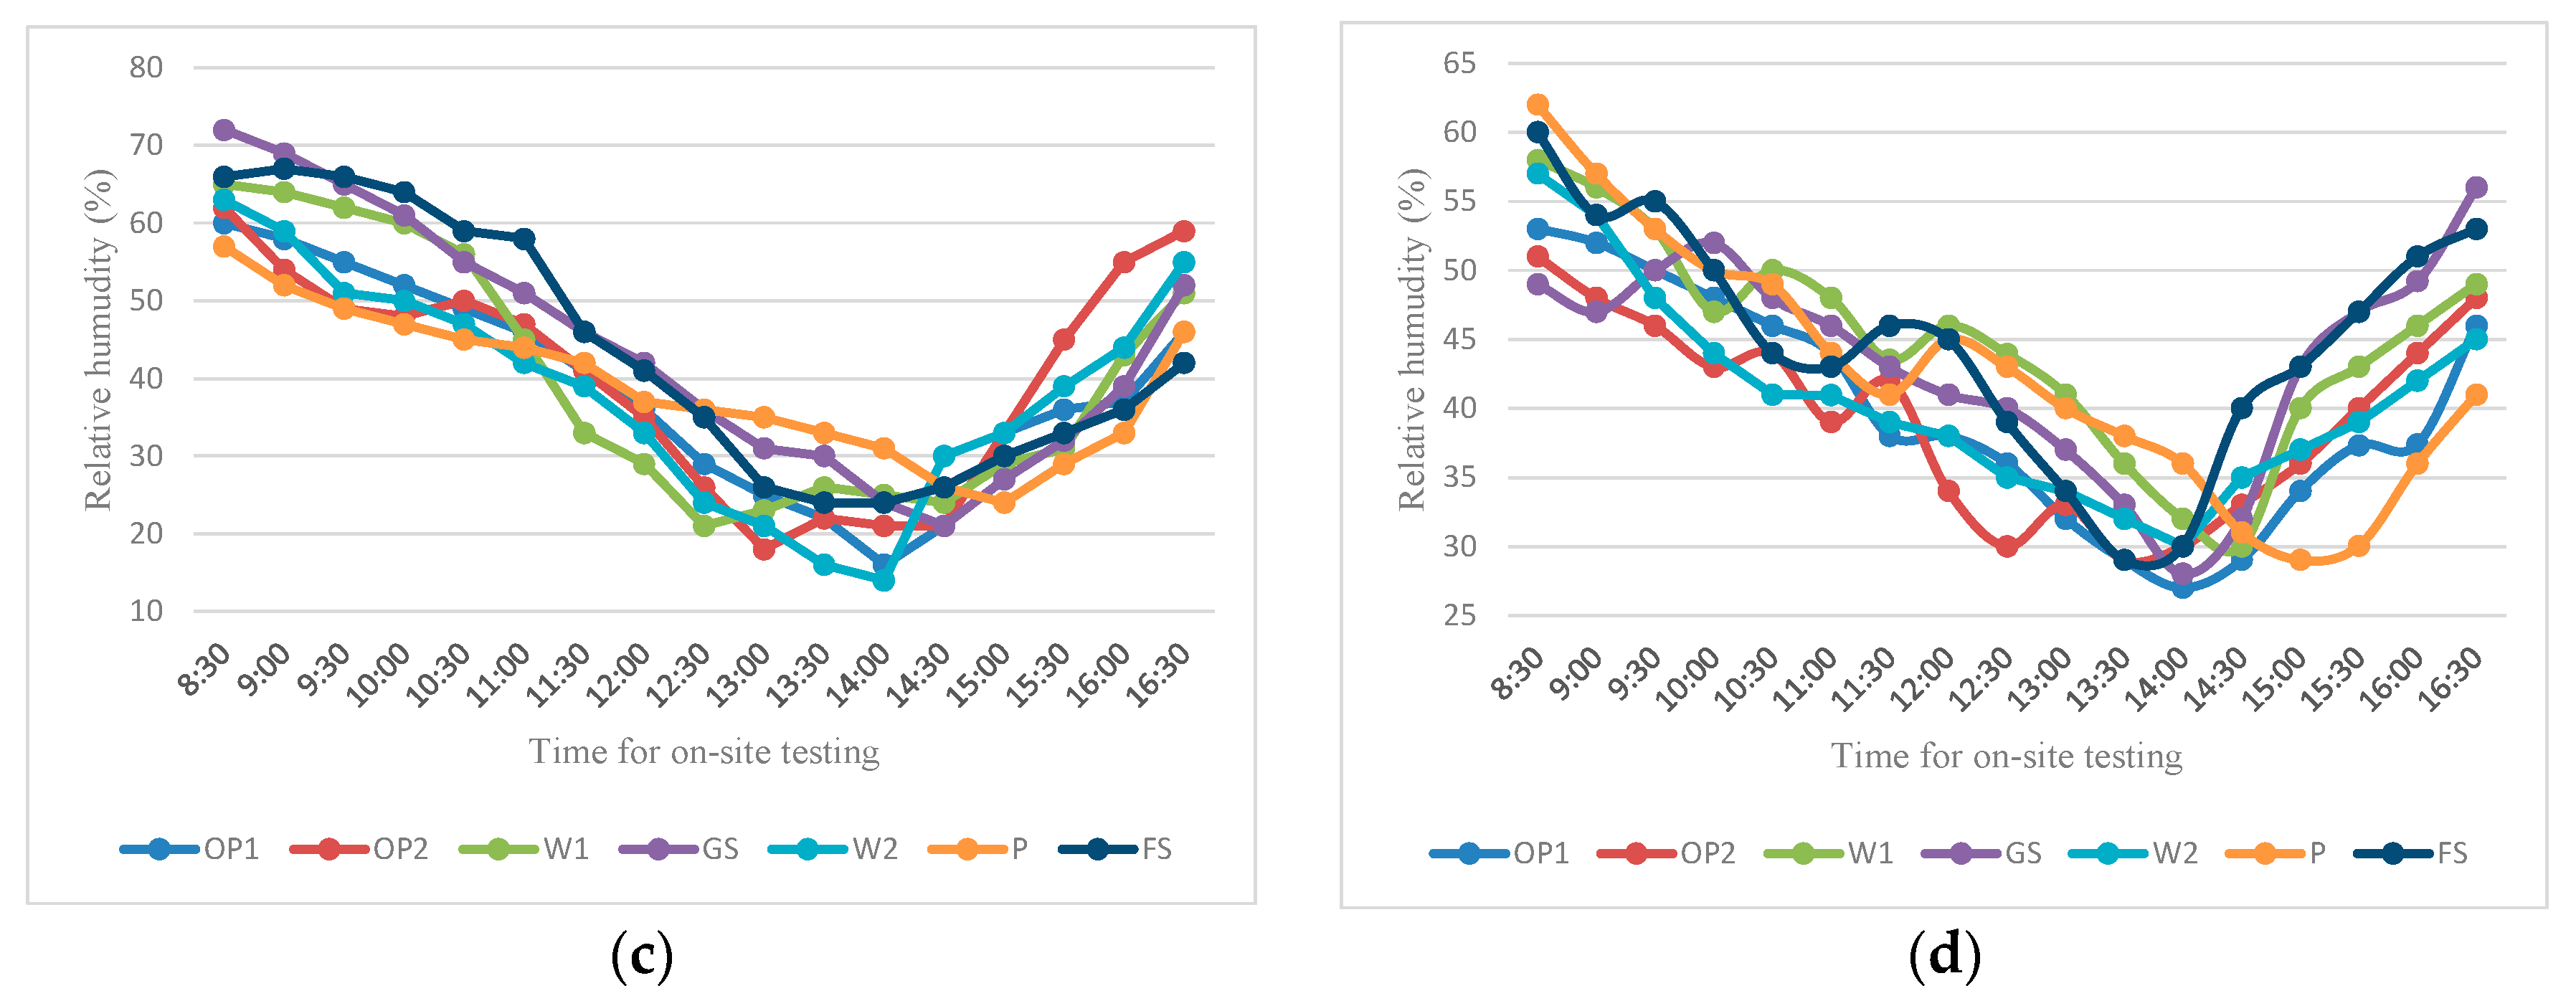
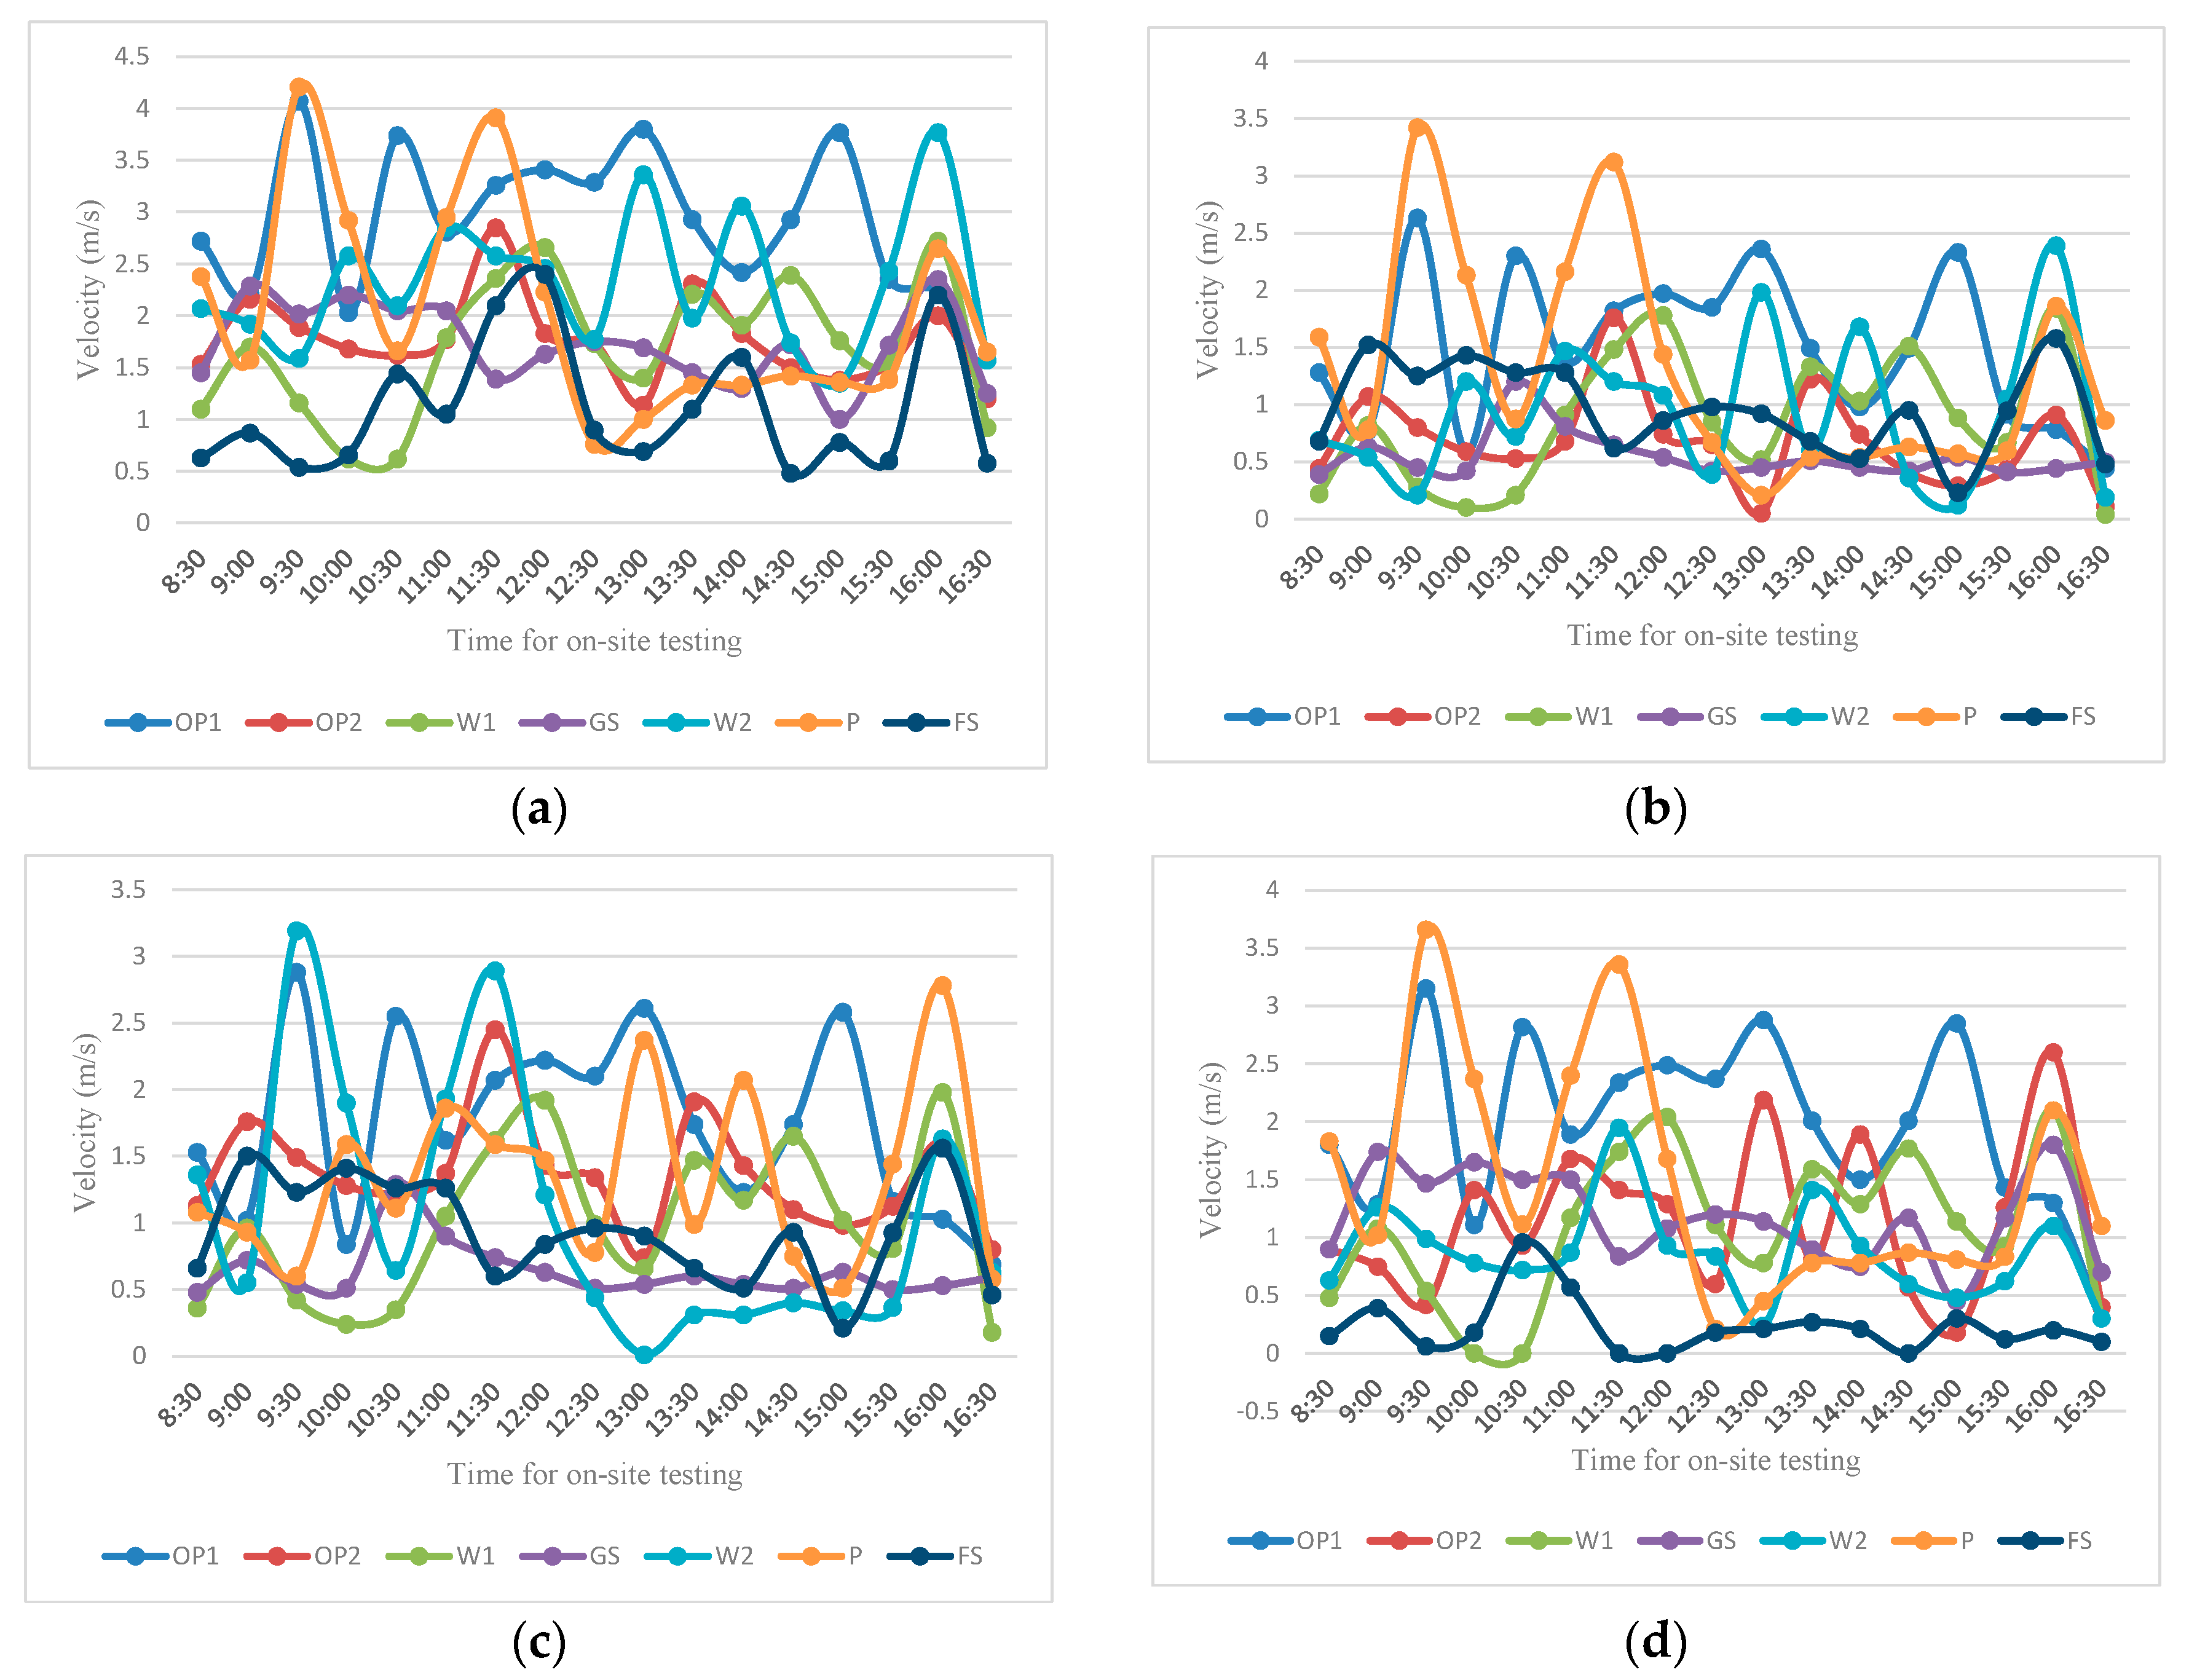
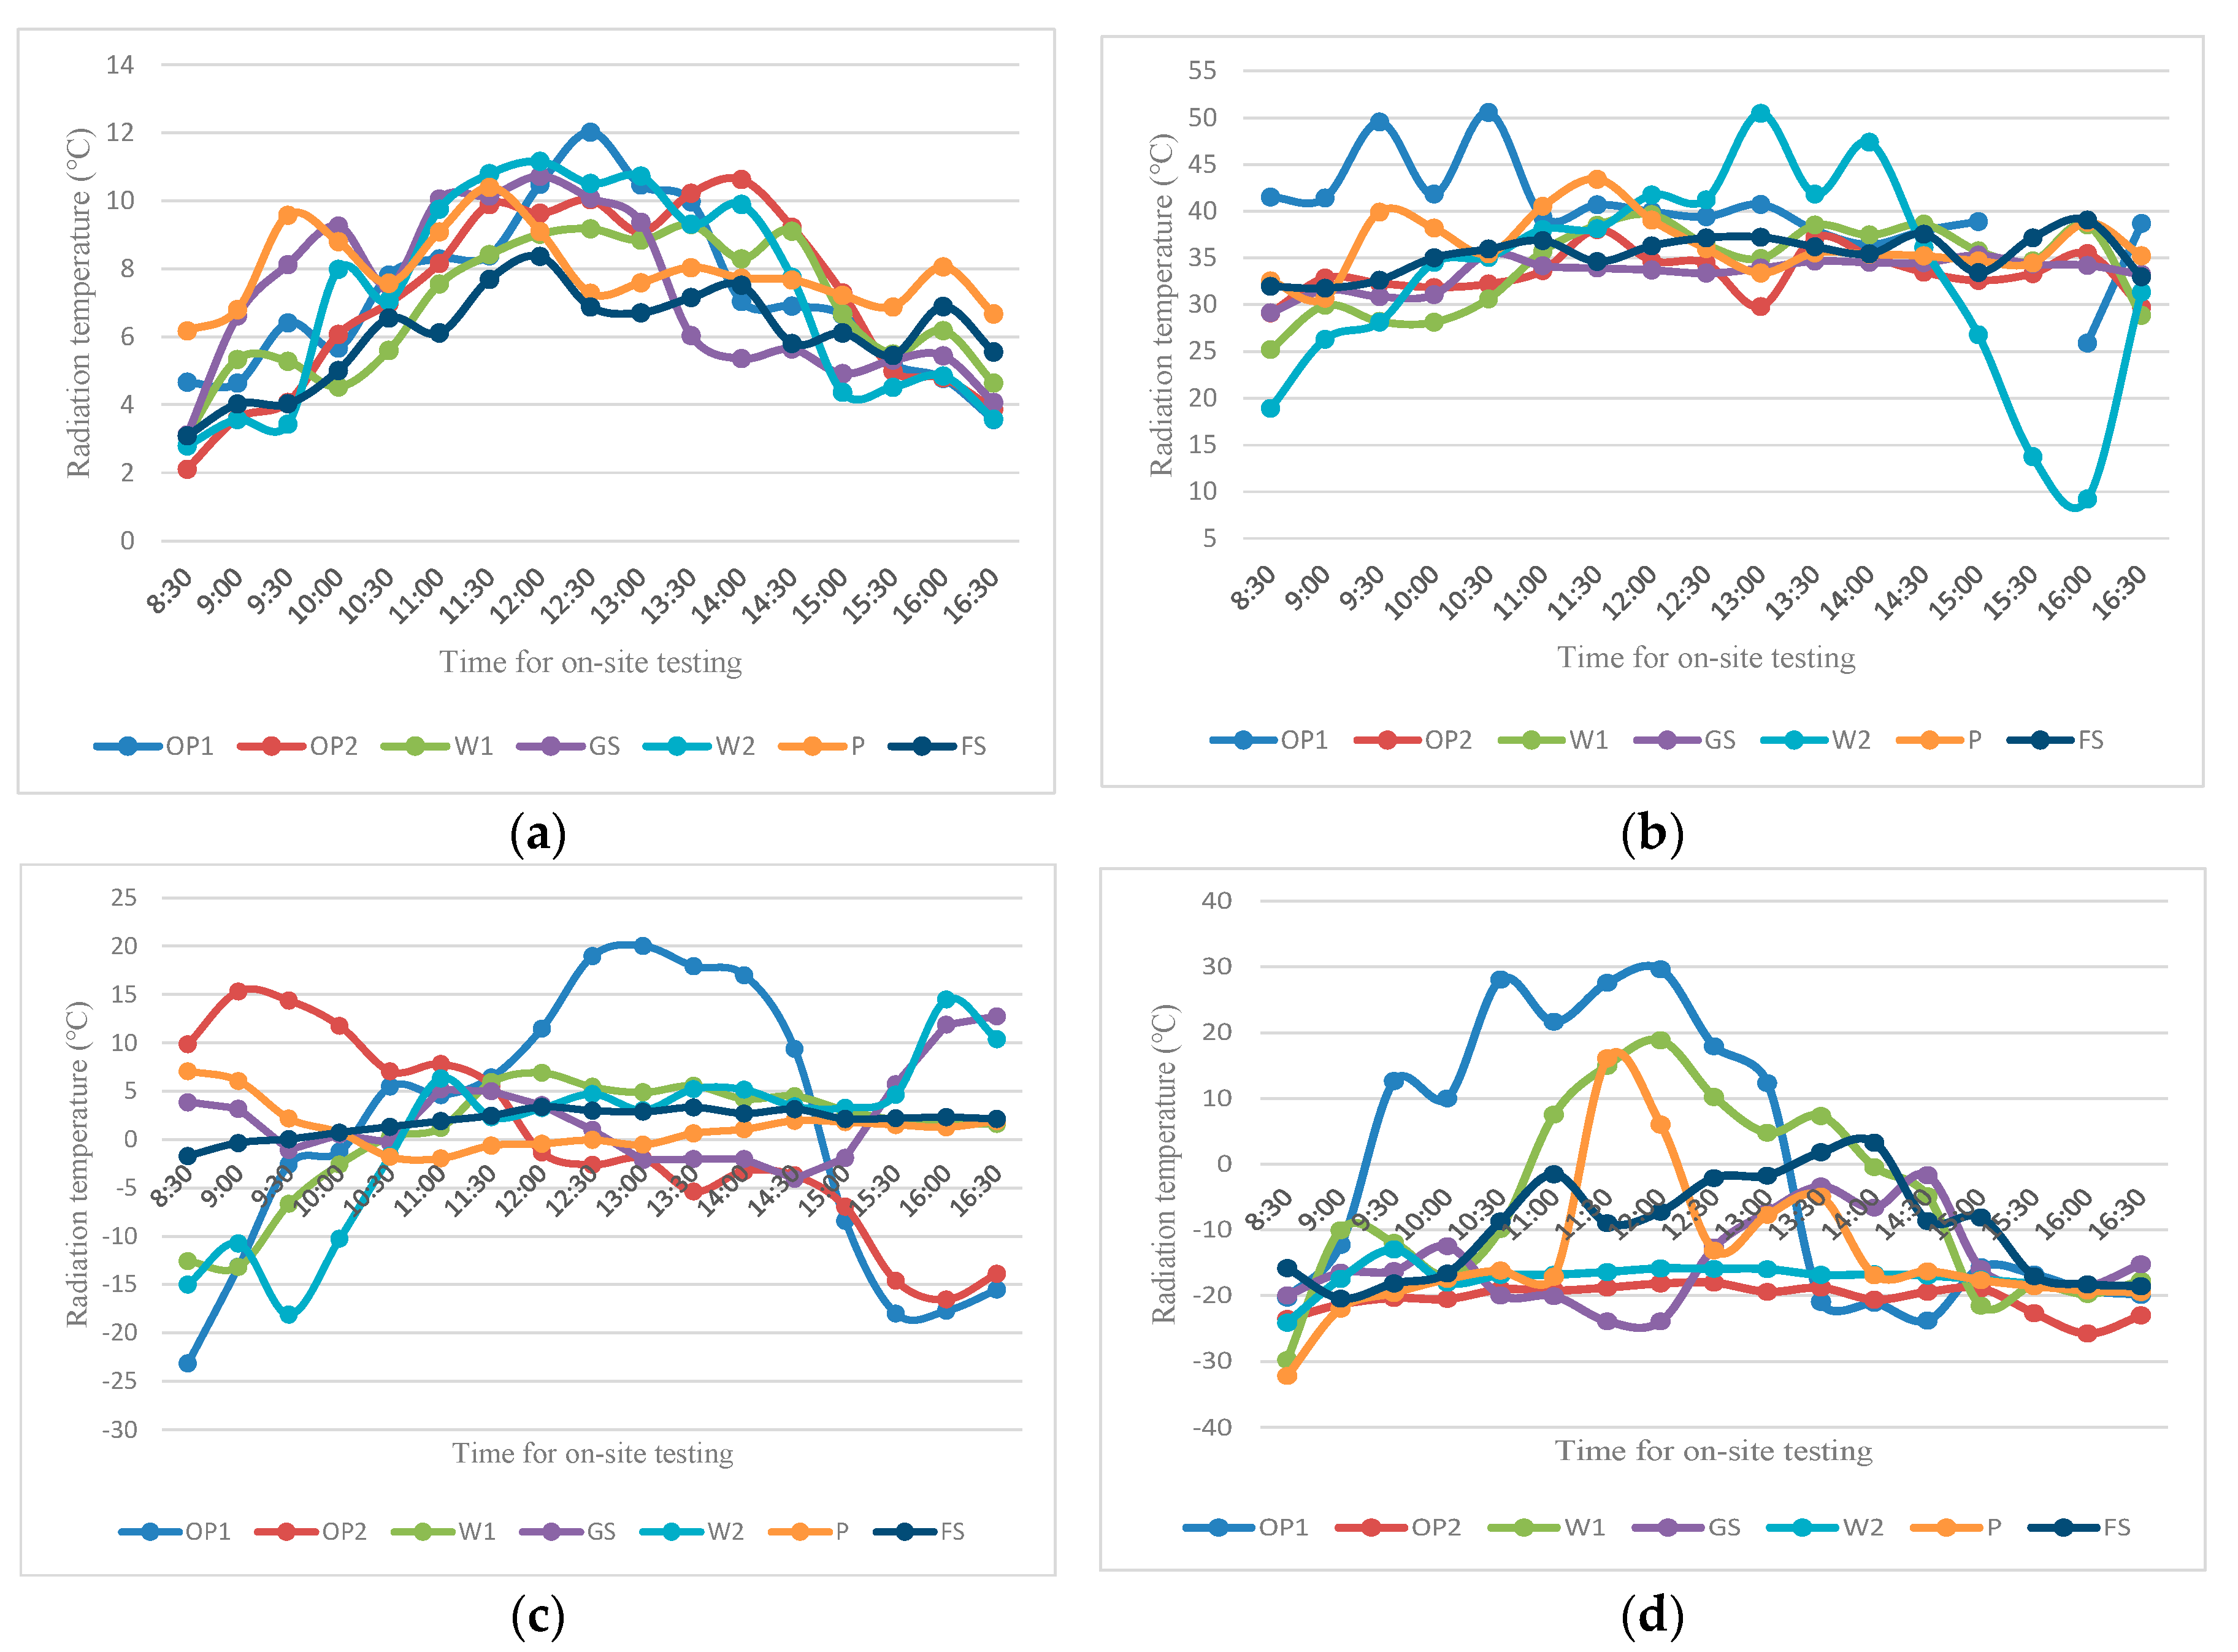
39] and parametric calculations (such as Rayman and Envi-Met). Nevertheless, the formulas are almost identical. The input data are air temperature, wind speed, relative humidity, and solar radiation temperature. Therefore, these four factors are still used as the foundation for the modeling of cold regions. The significant influencing factors (wind direction and cloud cover) in the results obtained in the different seasons were included simultaneously. In order to ensure the possible linear or nonlinear relationship between the input and output variables, this paper used an artificial neural network model (BP) as the basic method. Beyond this, the accuracy of the model was validated using data obtained from another typical region.
The summer neural network model ran from June 1 to September 30, while the winter model covered December 1 to March 31. The transitional season model included the time frames of April 1 to May 31 and October 1 to November 30. Prior to establishing the models, regression analysis was conducted on the meteorological data (including air temperature, wind speed, radiation temperature, relative humidity, wind direction, and cloud cover) and UTCI values for different seasons. The results showed that wind direction and cloud cover had no significant impact on the evaluation of outdoor thermal comfort in the summer model, and relative humidity had no significant impact on outdoor thermal comfort evaluation in the transitional season model. However, all six groups of meteorological data had an impact on the winter model. Detailed results are presented in Table 7.
Moreover, EditPad Lite was used to replace the eponymous data in the EPW file for Changchun with the data that were measured on-site, which were used to establish a meteorological model. For the summer model, 2928 sets of input data (including air temperature, wind speed, radiation temperature, and relative humidity) that met the conditions were selected, while the target UTCI data were computed using the Energyplus, Daysim, Openstudio, Radiance, Ladybug_0_0_68, and Honeybee plugins called by the Rhino-Grasshopper platform. All data were divided into training, calibration, and testing groups in a ratio of 7:1:2. The results showed that the correlation coefficient between the overall output and target values was 0.99734, and there was significant correlation at the 0.01 level.
The input data for the winter model consisted of 2904 sets of data (air temperature, wind speed, radiation temperature, wind direction, relative humidity, and cloud cover), and the results showed a significant correlation at the 0.05 level. The correlation coefficient between the overall output and target values was 0.95072. The transitional season model used 2928 sets of data (air temperature, wind speed, radiation temperature, wind direction, and cloud cover). The output value and target value of the overall data were found to be significantly correlated at the 0.001 level, with a high correlation coefficient of 0.99949.
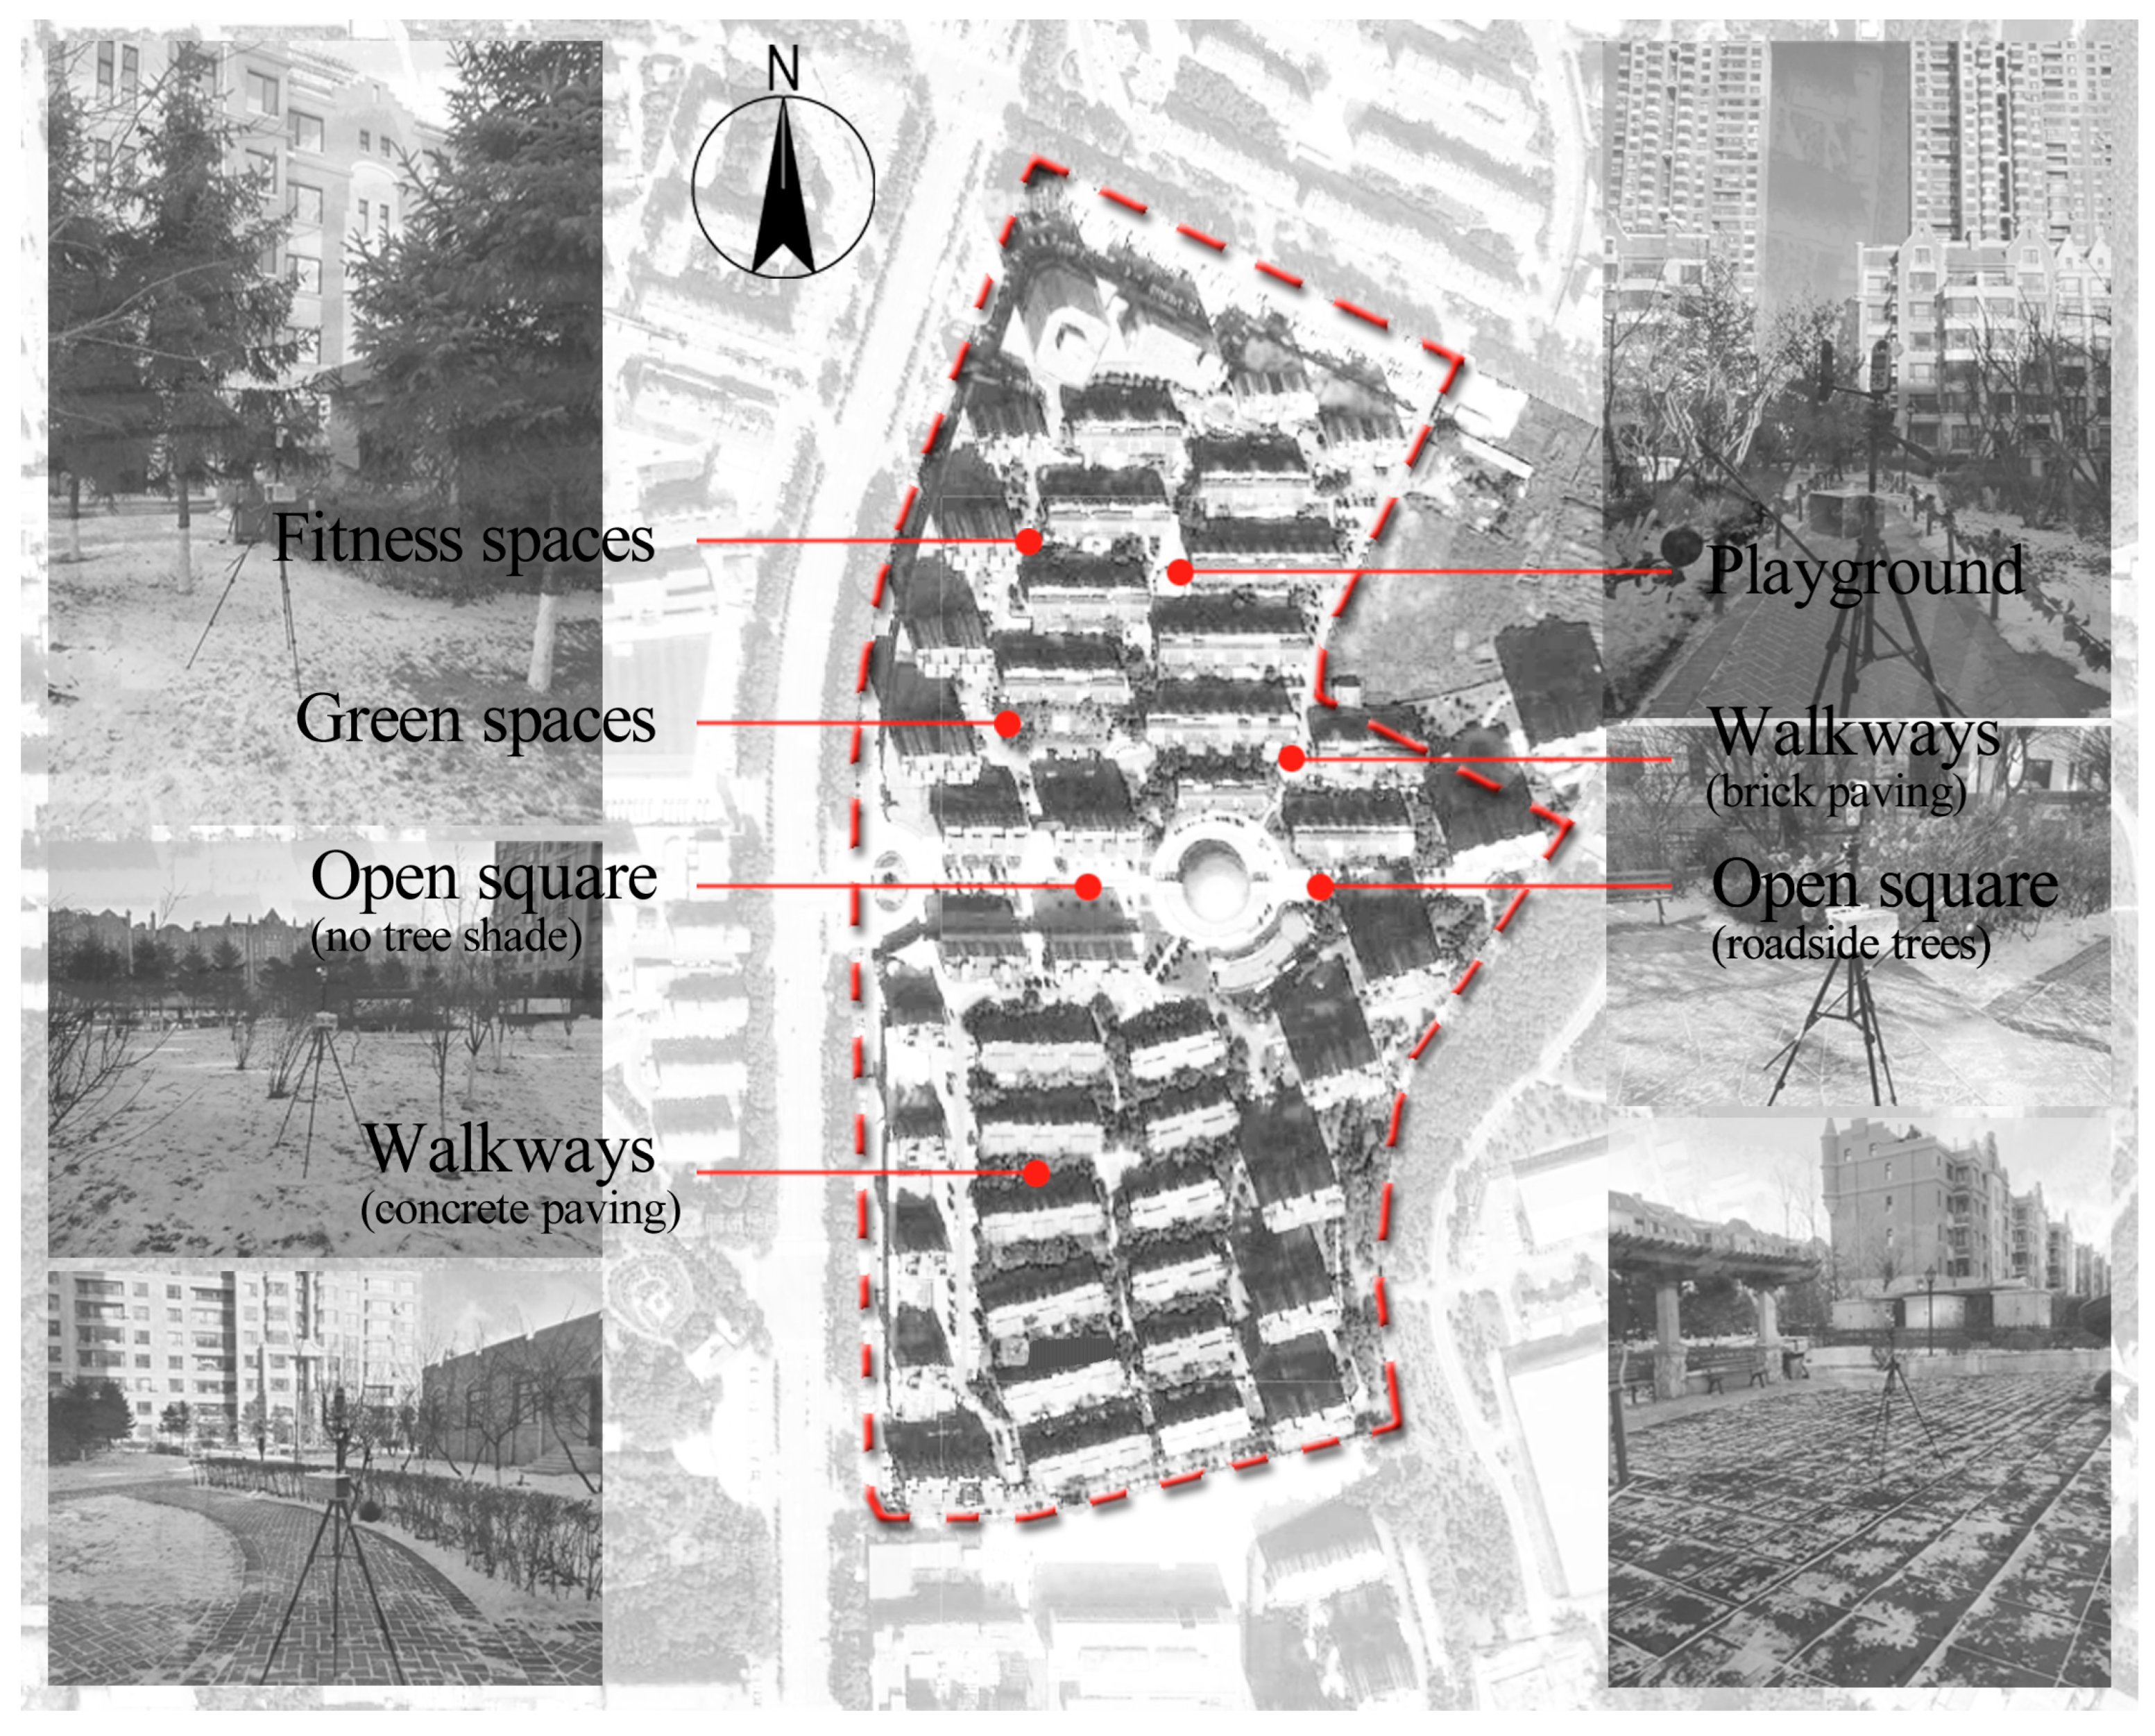
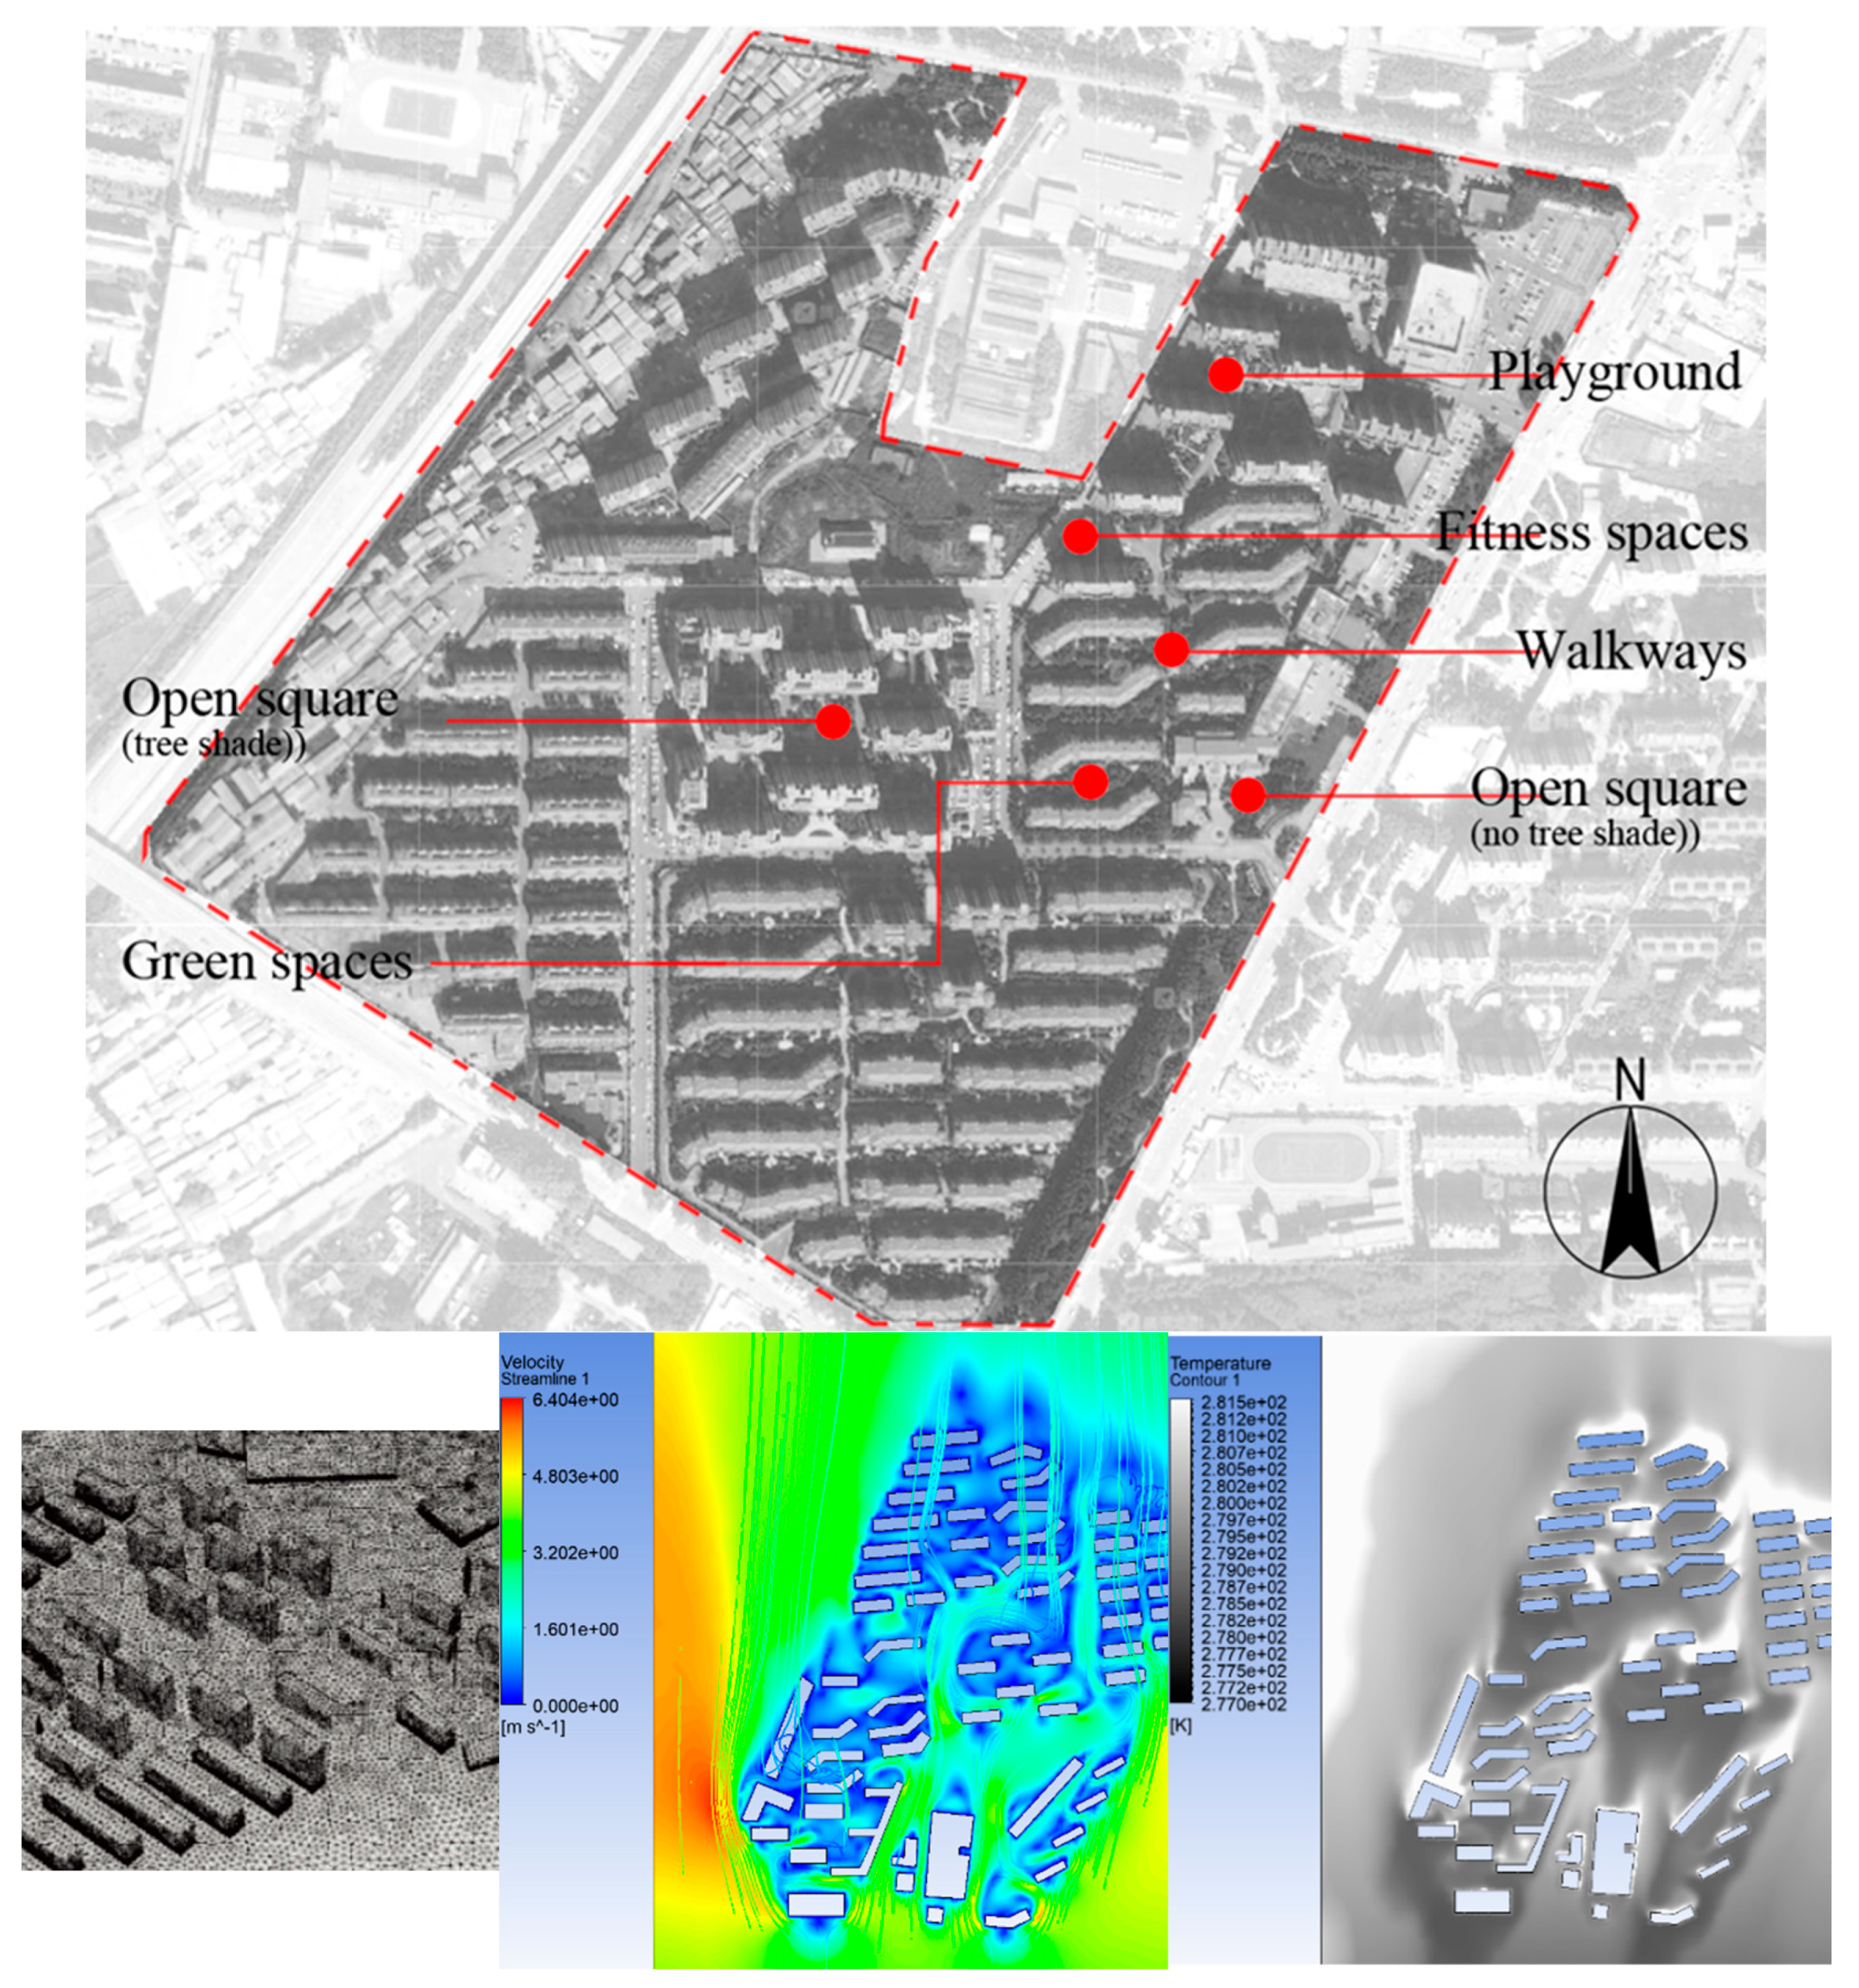
To verify the accuracy of the multi-seasonal model, on-site measurements were conducted in six selected locations that were representative of the outdoor activities and travel patterns of elderly people. These locations included fitness areas, children’s play areas, small parks (green spaces), leisure squares (tree shade), and walking trails, as shown in Figure 18. Additionally, most of the questionnaires were distributed near the selected measurement points, with some coming from other areas within this neighborhood. The testing was conducted in four seasons, namely, winter (December 16–18), spring (April 8–10), summer (August 22–24), and autumn (October 17–19). At the same time as the on-site testing, a total of 525 questionnaires were distributed, and 498 valid questionnaires were received.
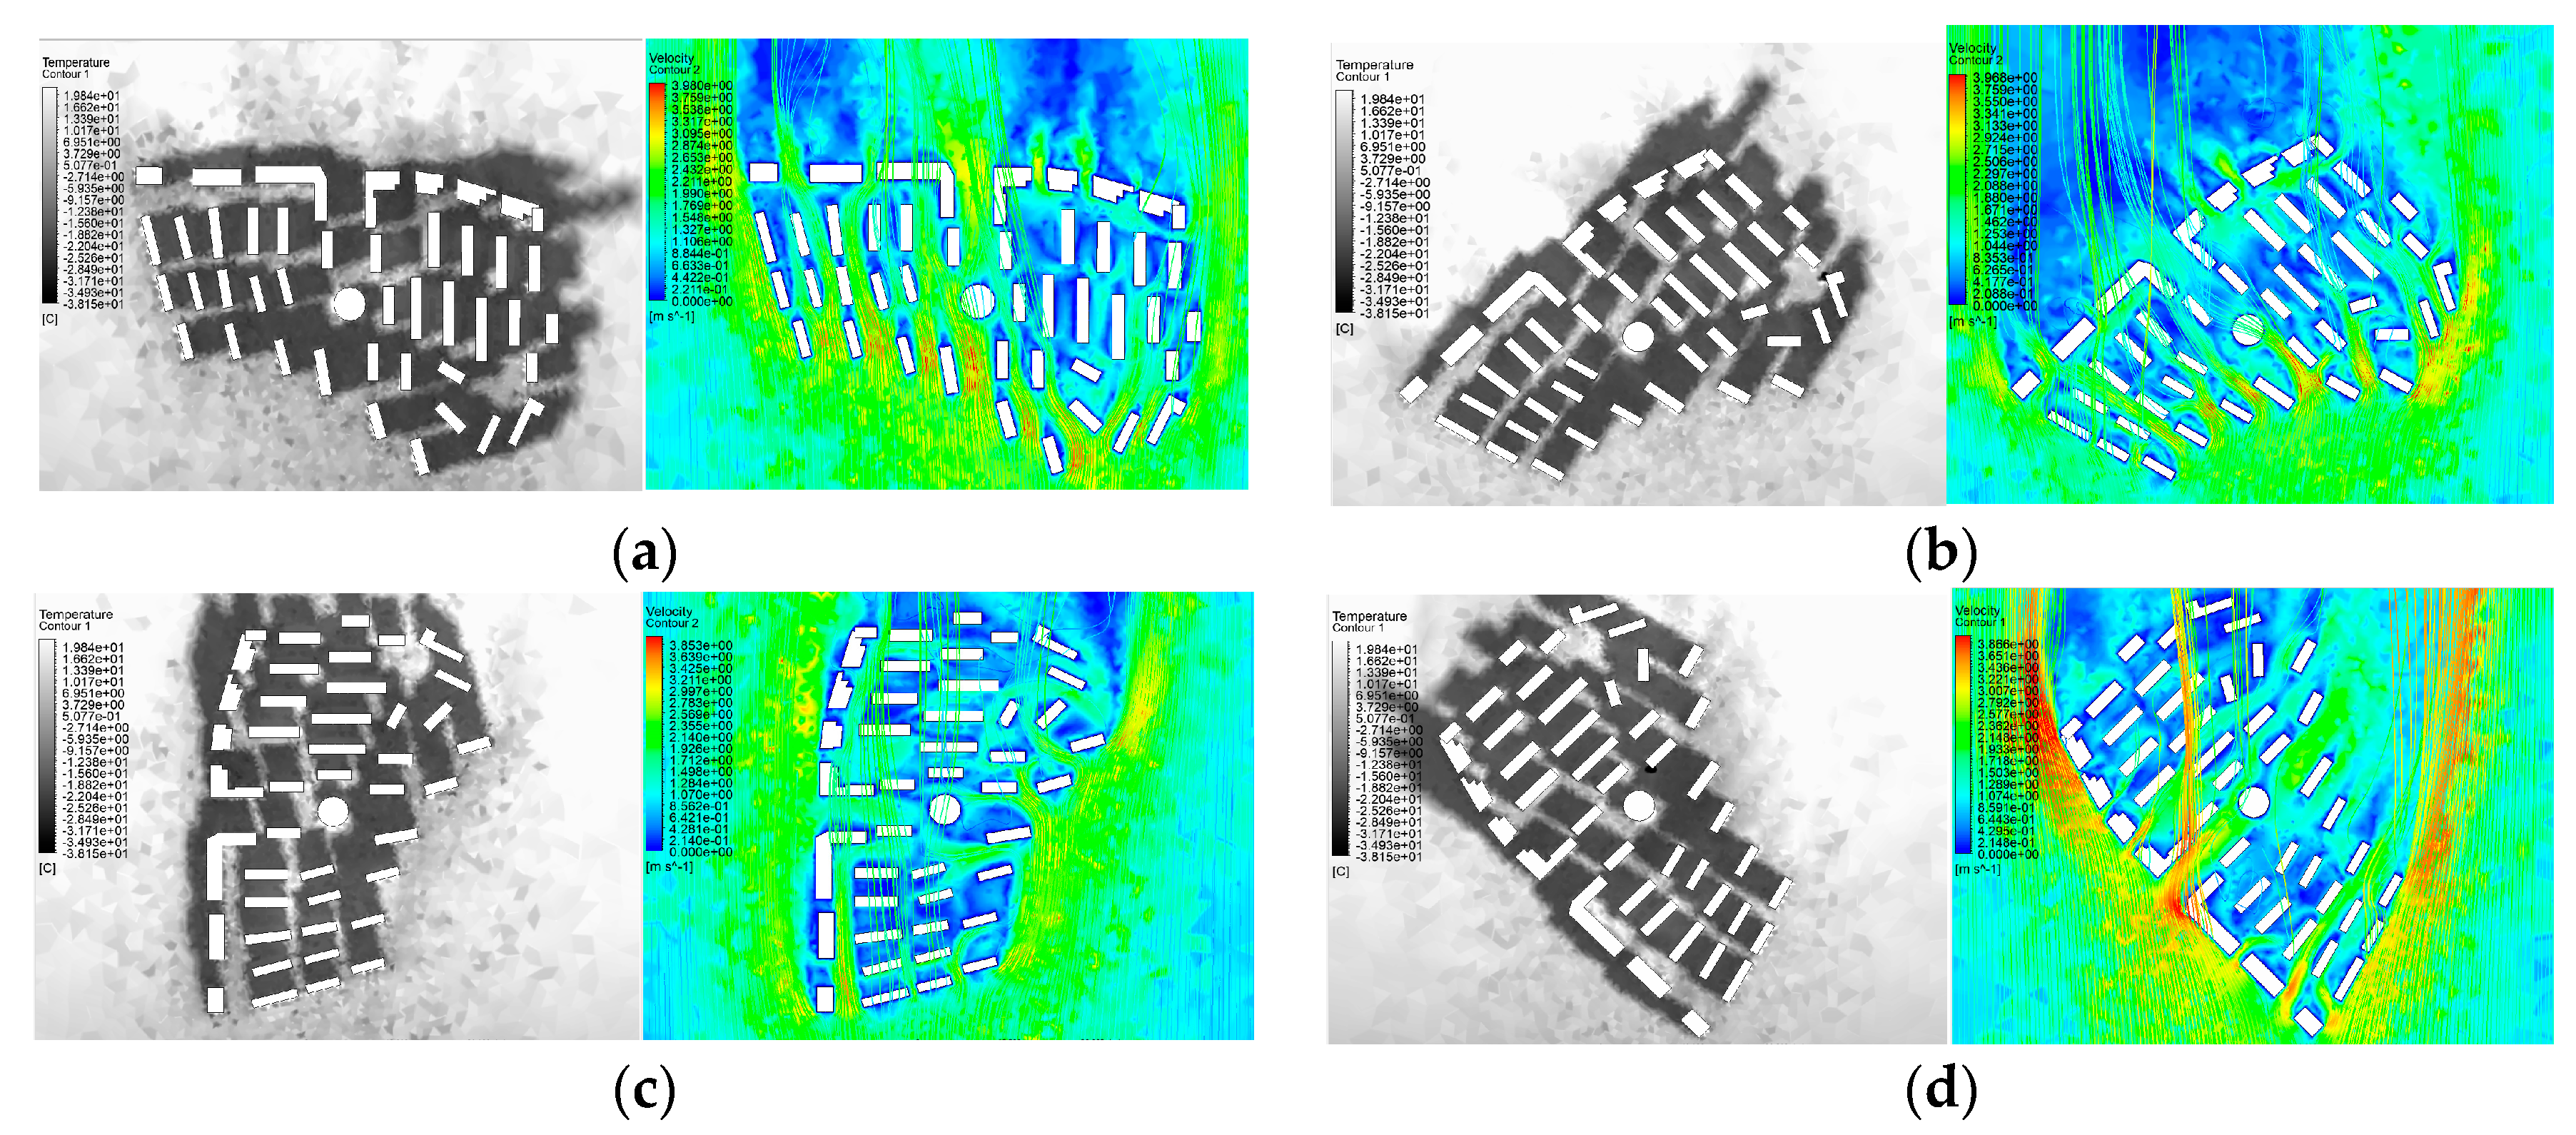
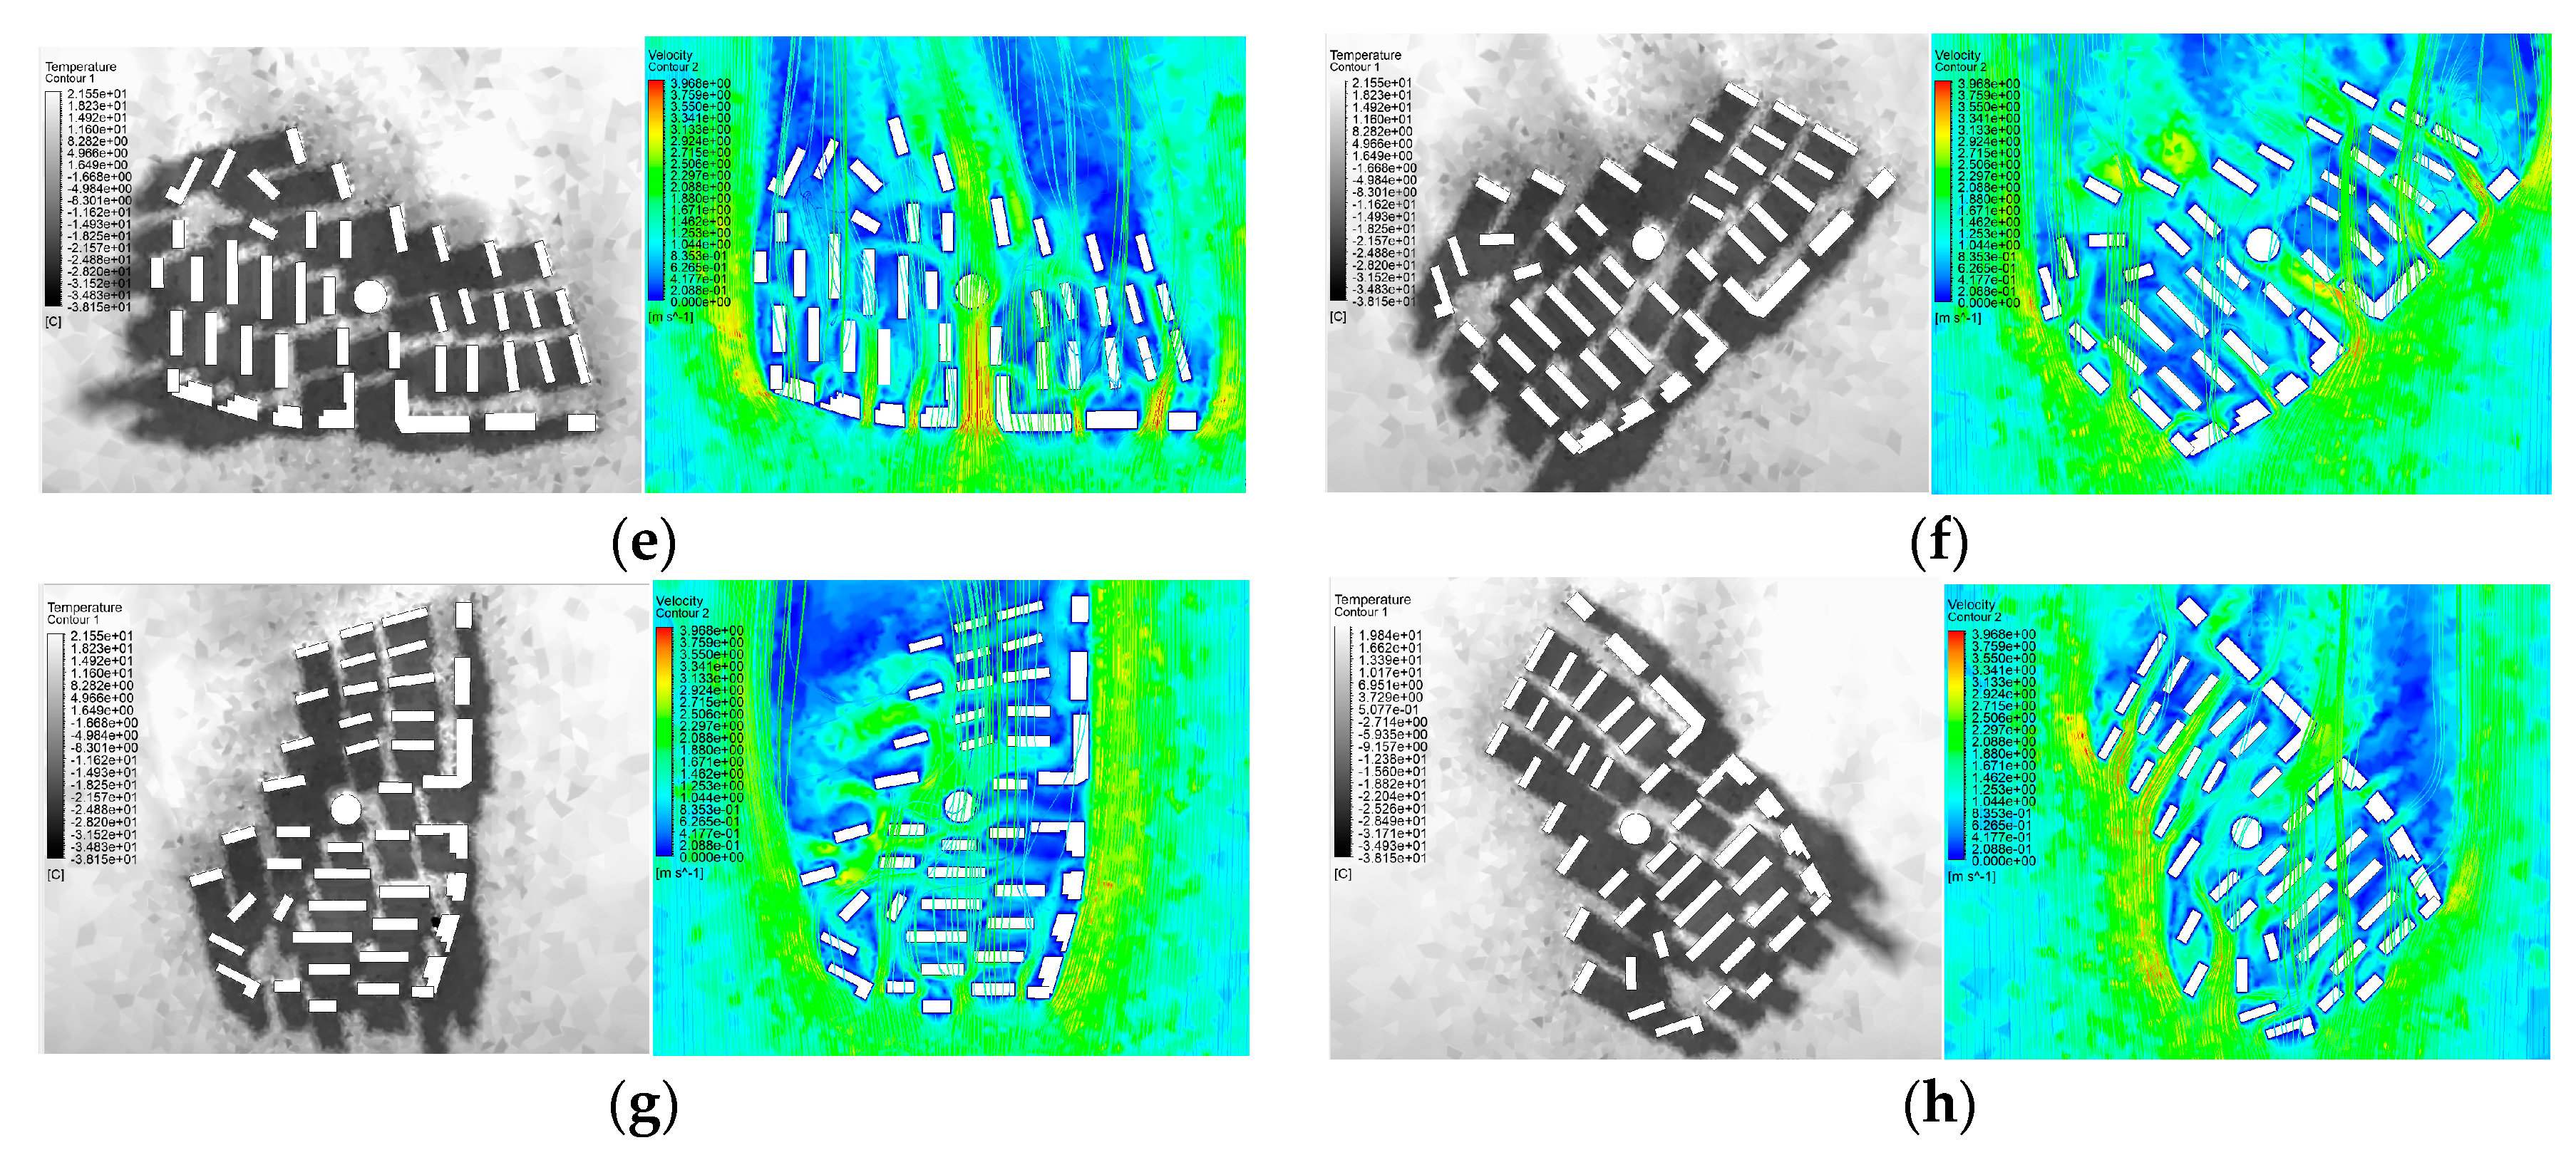
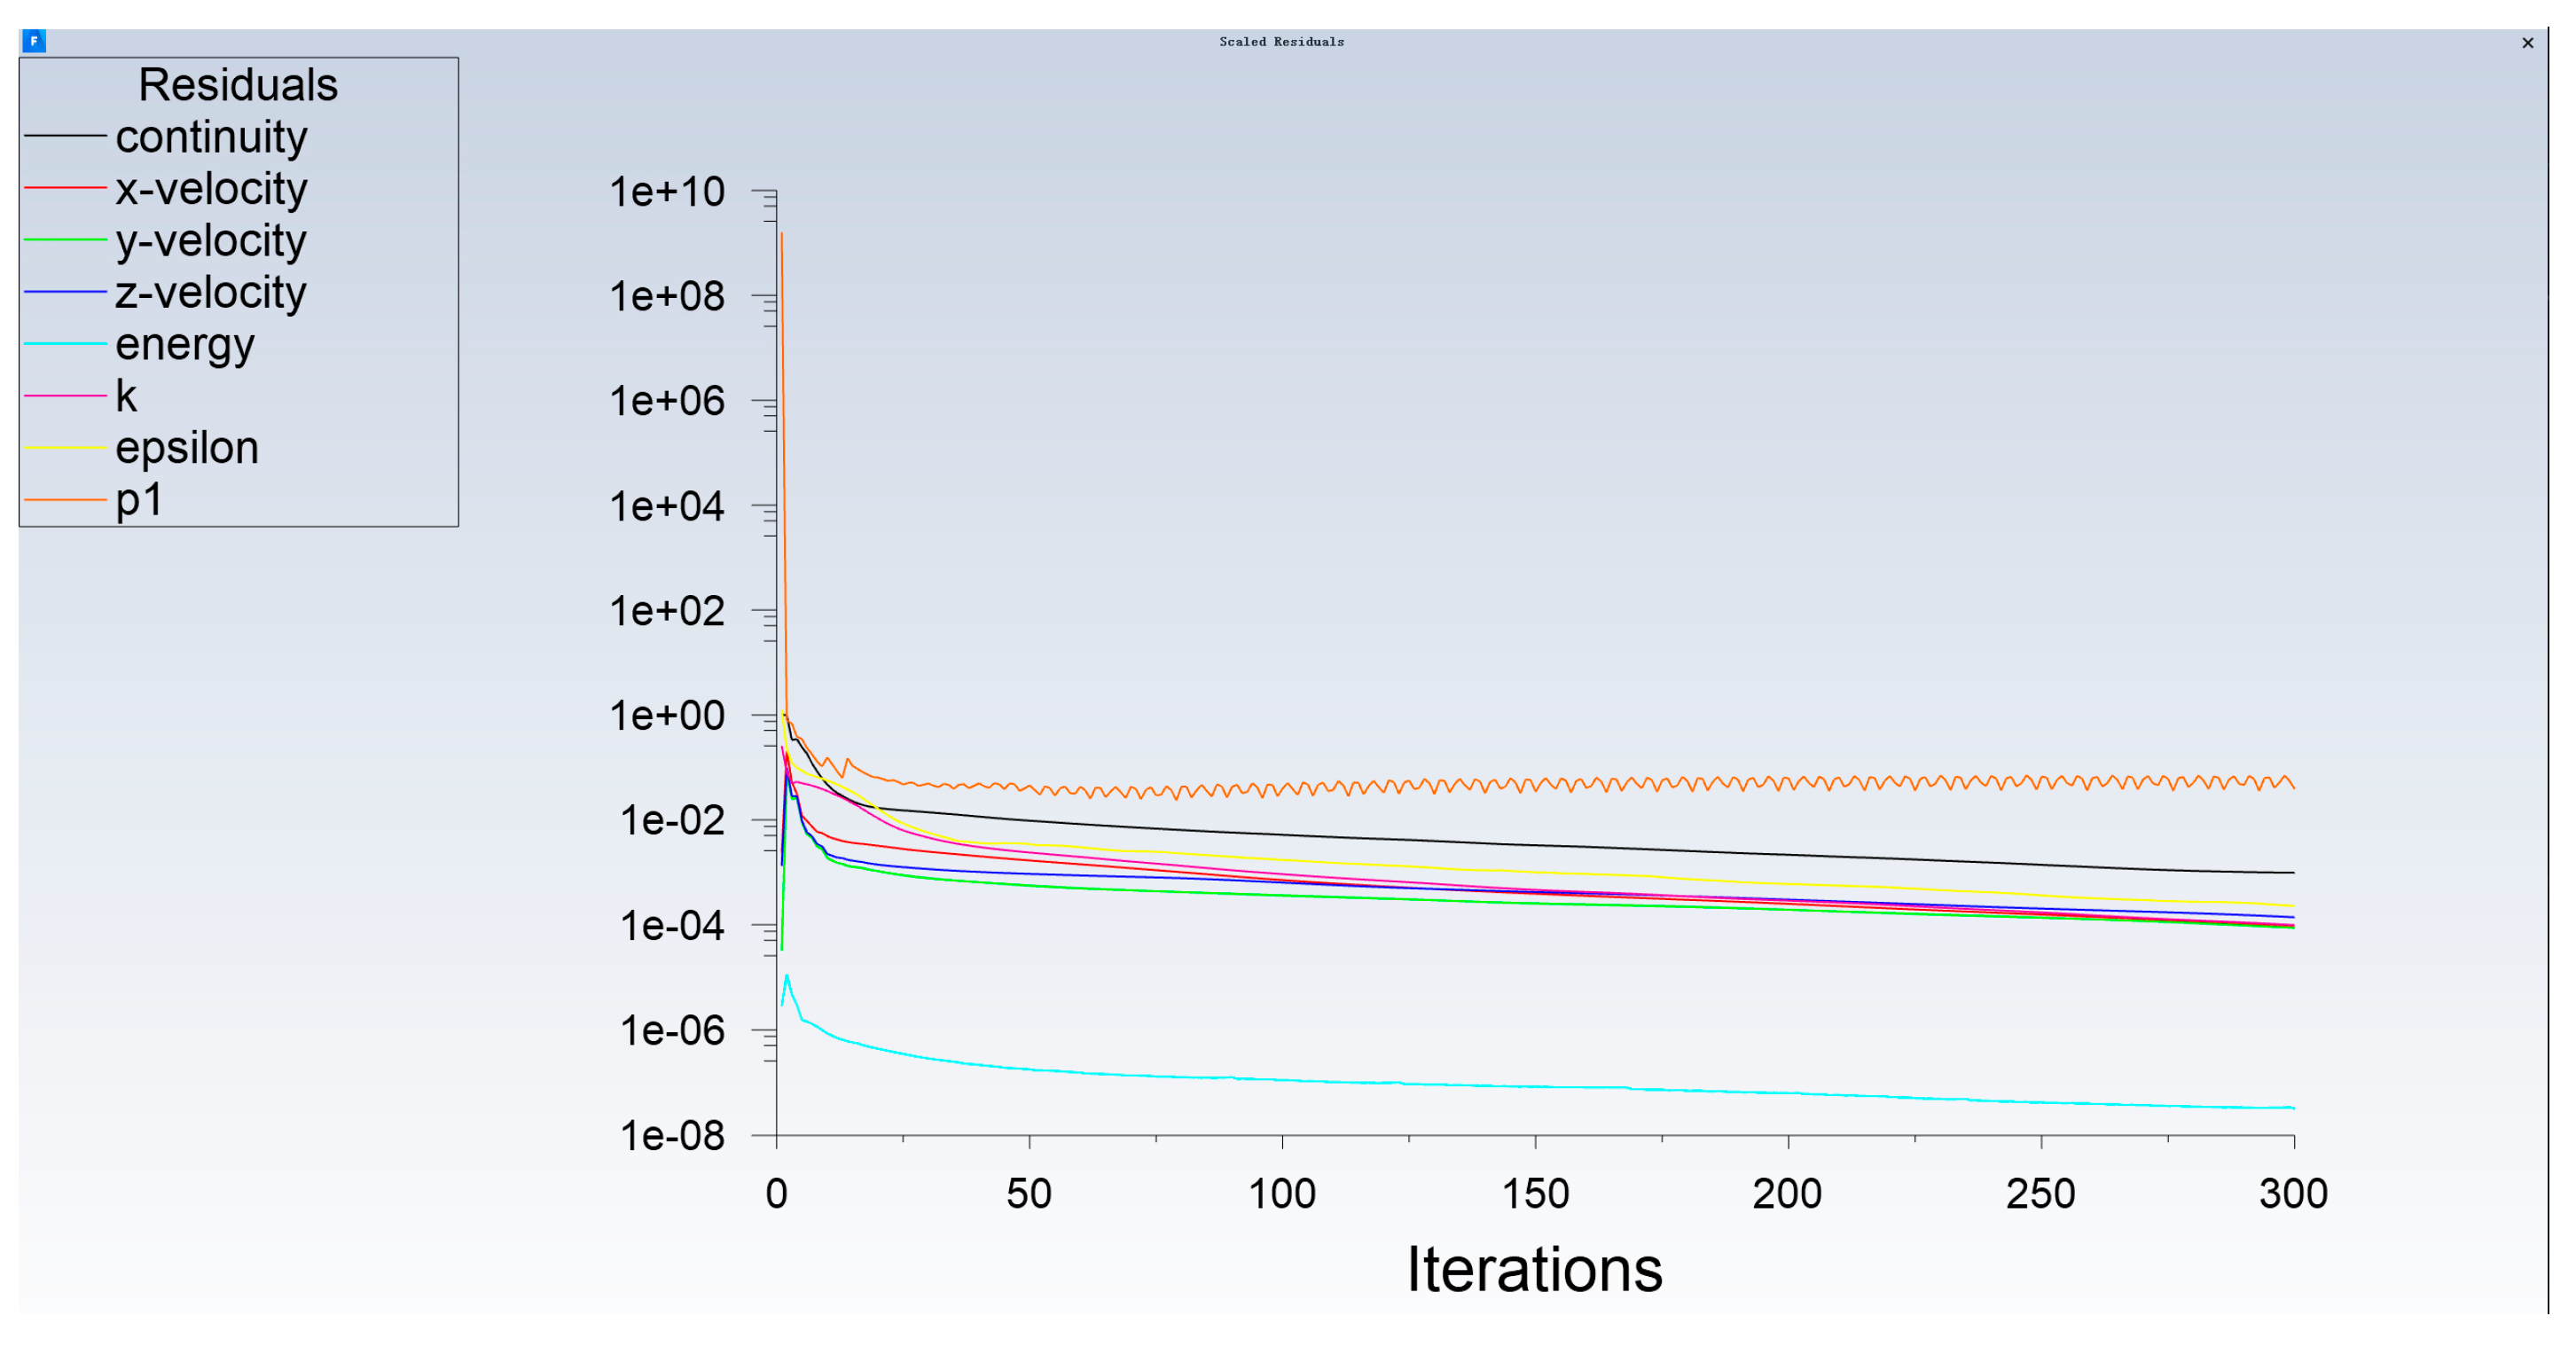
The basic parameter settings and grid divisions of multiple numerical models were consistent with those in previous research. Based on the measured data, the various settings of the model were continuously adjusted to reduce the error values until the purpose of validating the model was achieved. A revised numerical model was used to calculate the parameters of the physical environment for all questionnaire locations and interview times, as well as the input data for the seasonal thermal comfort model. At the same time, basic meteorological data were input into Grasshopper to calculate the original UTCI values, and their root mean square error (RMSE) and mean absolute error (MAE) were compared with the TSV. The results for the two groups are shown in Table 8. It can be found that compared with the existing UTCI calculation method, the seasonal models that were constructed in this study had higher accuracy. However, the results of the transitional season model were different in the spring and fall. This method generally provided a more accurate reflection of the actual situation of older adults in severely cold regions than the previous one. In particular, the accuracy in the autumn was the highest, followed by that in the summer and then that in the spring and winter.
It is important to note that the average metabolic rate and CTR of the elderly participants were prerequisites for this study. The data recorded from on-site observations showed that the duration of fitness activity (2.4 Met) was highest for the elderly in the summer, comprising 4.8% of their total outdoor time. Conversely, it comprised only 0.5% of the outdoor time in winter months. Similarly, older adults who participated in walking activities (1.9 Met) had the highest hourly percentage of 36.9% during the transitional season, while those involved in moderate activity (2 Met) recorded the highest percentage of 69.5% during the summer months. Although the composition of metabolic rates for older adults during outdoor activities varied in different seasons, the overall mean values were almost the same at 1.99, 1.97, and 1.97, respectively. Therefore, we did not categorize the elderly population according to their metabolic rates in this study.
For the CTR, this paper established a linear model based on the CTR and air temperature values obtained from on-site surveys. The average CTR values for each season could be calculated from the mean air temperature values obtained from the site tests. In addition, the CTR values of the respondents were composed of clothing types for the head, upper body, and lower body. All of the CTR values for each type were assessed according to the ISO 9920-2007 standard [40]. The results show that the average CTR for elderly people during winter testing was 2.18 Clo, while it was 1.16 Clo for the transitional seasons and 0.26 Clo for summer. The average metabolic rate of elderly people in cold cities during all seasons was 1.97–1.99, which was another important prerequisite for the results of this paper.

6. Conclusions

In order to achieve the climate-conscious and sustainable design of cities in cold climates while facing the trend of global aging, the comprehensive and accurate assessment of outdoor thermal comfort for the elderly is needed. To fulfill this requirement, this paper presents an adapted UTCI for elderly people in four seasons in severely cold regions, and the key elements affecting outdoor thermal comfort are quantified and modeled for several sets of seasons. The main findings of this paper are as follows.
(1)
The neutral adapted UTCI and comfort ranges for older adults in severely cold regions (3.4–21.4 °C) have a quite low and wide range of intervals compared to those of the UTCI (9–26 °C) and findings from a study of a cold area (12–25 °C). Specifically, the ranges corresponding to cool and cold sensations for the adapted UTCI were smaller than those for the UTCI by 8.5 °C and 5 °C, respectively. In contrast, the range representing slightly cool was 9.6 °C higher than the range for the UTCI. For the sensation of heat, the ranges of the adapted UTCI in each category were greater than those of the UTCI. The range of the neutral UTCI for the elderly (3.4 °C–21.4 °C) was lower than that for young and middle-aged groups (−3.8 °C–23 °C) when comparing different groups in similar climatic zones. For cold sensations, older adults had lower thresholds than young and middle-aged groups in all categories, which may have been related to the thermal resistance of the clothing to which they were accustomed, as well as their thermal experience and thermal adaptation. The reverse was almost true for the sensation of heat. Overall, older people were more tolerant of heat but more sensitive to cold than other people.
(2)
This study aimed to identify meteorological factors with significant effects on outdoor thermal comfort for senior citizens in severely cold cities during different seasons and to build several outdoor thermal comfort models. Wind direction and cloud cover were found to be important participating variables in the calculations, except for the low significance of their effect on the UTCI in the summer months. In addition, relative humidity had low significance regarding the effect of the UTCI in the transitional seasons in severely cold regions. It was found that the transitional season model had the highest accuracy when the various seasonal models were compared. Next was the summer model, while the winter model had the lowest accuracy. This was generally consistent with the results of the empirical study, which showed that the winter model had the lowest accuracy, and the transitional season model had higher accuracy when evaluating outdoor thermal comfort in the fall than in the spring.
The limitations and future prospects of this study are as follows.
(1)
For computational efficiency, the numerical model settings that were selected were RANS (RNG k-epsilon model) with a relatively lower calculation accuracy. This may have resulted in some discrepancies between the results of the modified numerical model simulation and the actual values. Therefore, future research should consider using higher-precision models, such as a large eddy simulation (LES) or detached eddy simulation (DES), to improve the accuracy of the model’s results.
(2)
The threshold modification data for the UTCI in different thermal sensory ranges were all derived from the results of a questionnaire distributed in the study area. However, the number of older adults participating in outdoor activities throughout the year was limited due to the harsh climatic characteristics of the cold region. More data need to be collected in the future to further improve the accuracy of the UTCI in evaluating outdoor thermal comfort.
(3)
The accurate outdoor thermal comfort model developed in this paper was based on the prerequisite of obtaining an accurate average CTR and the metabolic rate of people outdoors in different seasons. However, when they change, it is important to understand how the thermal comfort model should be revised in future research.

Author Contributions

Conceptualization, B.W.; methodology, B.W. and B.H.; software, B.H.; validation, B.W. and H.Z.; investigation, B.H.; data curation, B.W. and B.H.; writing—original draft preparation, B.W.; writing—review and editing, H.Z.; visualization, B.H.; supervision, H.Z.; funding acquisition, H.Z. and X.J. All authors have read and agreed to the published version of the manuscript.

Funding

This research was funded by the National Natural Science Foundation of China (grant number 52178042), the Key Projects of Jilin Provincial Department of Science and Technology (grant number 20210203213SF), the Technology Research Project of Jilin Provincial Department of Education in China (grant number JJKH20220299KJ), and the Key Projects for Higher Education Reform in Jilin Province (grant number JLJY202299934544).

Acknowledgments

The authors are thankful to Yun Kyu Yi at the University of Illinois Urbana–Champaign and Hong Jin at the Harbin Institute of Technology for their assistance with the computational simulations and field surveys.

Conflicts of Interest

The authors declare no conflict of interest.

Abbreviations

Symbols Full Name
UTCIUniversal thermal climate index
CFDComputational fluid dynamics
ASHRAEAmerican Society of Heating, Refrigerating, and Air-Conditioning Engineers
CSWDChinese Standard Weather Data
TSVThermal sensation vote
ASVActual sensation vote
RMSERoot mean square error
MAEMean absolute error
CTRClothing thermal resistance
1 Clo0.155 m2K/W

References

  1. ANSI/ASHRAE Standard 55-2013; Thermal Environmental Conditions for Human Occupancy. ASHRAE: Atlanta, GA, USA, 2004.
  2. Rupp, R.F.; Vásquez, N.G.; Lamberts, R. A review of human thermal comfort in the built environment. Energy Build. 2015, 105, 178–205. [Google Scholar] [CrossRef]
  3. Taleghani, M.; Kleerekoper, L.; Tenpierik, M.; Van Den Dobbelsteen, A. Outdoor thermal comfort within five different urban forms in the Netherlands. Build. Environ. 2015, 83, 65–78. [Google Scholar] [CrossRef]
  4. Zhang, S.; Zhang, X.; Niu, D.; Fang, Z.; Chang, H.; Lin, Z. Physiological equivalent temperature-based and Universal Thermal Climate index-based adaptive-rational outdoor thermal comfort models. Build. Environ. 2023, 228, 109900. [Google Scholar] [CrossRef]
  5. Wei, D.; Yang, L.; Bao, Z.; Lu, Y.; Yang, H. Variations in outdoor thermal comfort in an urban park in the hot-Summer and cold-winter region of China. Sustain. Cities Soc. 2022, 77, 103535. [Google Scholar] [CrossRef]
  6. Kim, J.; Schiavon, S.; Brager, G. Personal comfort models—A new paradigm in thermal comfort for occupant-centric environmental control. Build. Environ. 2018, 132, 114–124. [Google Scholar] [CrossRef]
  7. Auliciems, A. Towards a psycho-physiological model of thermal perception. Int. J. Biometeorol. 1981, 25, 109–122. [Google Scholar] [CrossRef]
  8. Vischer, J.C. The adaptation and control model of user needs: A new direction for housing research. J. Environ. Psychol. 1985, 5, 287–298. [Google Scholar] [CrossRef]
  9. Brager, G.S.; De Dear, R.J. Thermal adaptation in the built environment: A literature review. Energy Build. 1998, 27, 83–96. [Google Scholar] [CrossRef]
  10. De Dear, R.J. A global database of thermal comfort field experiments. In Proceedings of the Paper presented at the ASHRAE Winter Conference, San Francisco, CA, USA, 18–21 January 1998. [Google Scholar]
  11. De Dear, R.J.; Brager, G. Developing an Adaptive Model of Thermal Comfort and Preference. ASHRAE Trans. 1998, 104, 145. [Google Scholar]
  12. Humphreys, M.A.; Nicol, J.F. Understanding the adaptive approach to thermal comfort. ASHRAE Trans. B 1998, 104, 991–1004. [Google Scholar]
  13. Lam CK, C.; Loughnan, M.; Tapper, N. Visitors’ perception of thermal comfort during extreme heat events at the Royal Botanic Garden Melbourne. Int. J. Biometeorol. 2018, 62, 97–112. [Google Scholar] [CrossRef] [PubMed]
  14. Yang, B.; Olofsson, T.; Nair, G.; Kabanshi, A. Outdoor thermal comfort under subarctic climate of north Sweden—A pilot study in Umea. Sustain. Cities Soc. 2017, 28, 387–397. [Google Scholar] [CrossRef]
  15. Lai, D.; Guo, D.; Hou, Y.; Lin, C.; Chen, Q. Studies of outdoor thermal comfort in northern China. Build. Environ. 2014, 77, 110–118. [Google Scholar] [CrossRef]
  16. Amindeldar, S.; Heidari, S.; Khalili, M. The effect of personal and microclimatic variables on outdoor thermal comfort: A field study in Tehran in cold season. Sustain. Cities Soc. 2017, 32, 153–159. [Google Scholar] [CrossRef]
  17. Krüger, E.L.; Rossi, F.A. Effect of personal and microclimatic variables on observed thermal sensation from a field study in southern Brazil. Build. Environ. 2011, 46, 690–697. [Google Scholar] [CrossRef]
  18. Huang, J.; Zhou, C.; Zhuo, Y.; Xu, L.; Jiang, Y. Outdoor thermal environments and activities in open space: An experiment study in humid subtropical climates. Build. Environ. 2016, 103, 238–249. [Google Scholar] [CrossRef]
  19. Lai, D.Y.; Zhou, X.J.; Chen, Q.Y. Modelling dynamic thermal sensation of human subjects in outdoor environments. Energy Build. 2017, 149, 16–25. [Google Scholar] [CrossRef]
  20. Rutty, M.; Scott, D. Bioclimatic comfort and the thermal perceptions and preferences of beach tourists. Int. J. Biometeorol. 2015, 59, 37–45. [Google Scholar] [CrossRef]
  21. Andrade, H.; Alcoforado, M.J.; Oliveira, S. Perception of temperature and wind by users of public outdoor spaces: Relationships with weather parameters and personal characteristics. Int. J. Biometeorol. 2011, 55, 665–680. [Google Scholar] [CrossRef]
  22. Knez, I.; Thorsson, S.; Eliasson, I.; Lindberg, F. Psychological mechanisms in outdoor place and weather assessment: Towards a conceptual model. Int. J. Biometeorol. 2009, 53, 101–111. [Google Scholar] [CrossRef]
  23. Jin, H.; Liu, S.Q.; Kang, J. Thermal comfort range and influence factor of urban pedestrian streets in severe cold regions. Energy Build. 2019, 198, 197–206. [Google Scholar] [CrossRef]
  24. Shapoval, S.; Zhelykh, V.; Venhryn, I.; Kozak, K. Simulation of Thermal Processes in the Solar Collector Which Is Combined with External Fence of an Energy Efficient House. Lect. Notes Civ. Eng. 2020, 47, 510–517. [Google Scholar]
  25. Adamski, M.; Kiszkiel, P. Condensation phenomena and frost problems in the air heat recuperators. MATEC Web Conf. 2014, 18, 01001. [Google Scholar] [CrossRef]
  26. Zhelykh, V.; Kozak, C.; Savchenko, O. Using of thermosiphon solar collector in an air heating system of passive house. Pollack Period. 2016; 11, 125–133. [Google Scholar]
  27. National Bureau of Statistics. The Demographic Composition of the Population. Available online: http://www.stats.gov.cn/english (accessed on 12 May 2023).
  28. Yang, W.; Wong, N.H.; Jusuf, S.K. Thermal comfort in outdoor urban spaces in Singapore. Build. Environ. 2013, 59, 426–435. [Google Scholar] [CrossRef]
  29. Lin, T.-P.; Matzarakis, A. Tourism climate and Thermal comfort in Sun Moon Lake, Taiwan. Int. J. Biometeorol. 2007, 52, 281–290. [Google Scholar] [CrossRef]
  30. Lee, H.; Mayer, H.; Chen, L. Contribution of trees and grasslands to the mitigation of human heat stress in a residential district of Freiburg, Southwest Germany. Landsc. Urban Plan. 2016, 148, 37–50. [Google Scholar] [CrossRef]
  31. Jin, H.; Wang, B.; Han, B. Study on Environment Regulation of Residential in Severe Cold Area of China in Winter: Base on Outdoor Thermal Comfort of the Elderly. Sustainability 2019, 11, 6509. [Google Scholar] [CrossRef]
  32. Rumelhart, D.; Hinton, G.; Williams, R. Learning representations by back-propagating errors. Nature 1986, 323, 533–536. [Google Scholar] [CrossRef]
  33. Wang, B.; Yi, Y.K. Developing an adapted UTCI (Universal Thermal Climate Index) for the elderly population in China’s severe cold climate region. Sustain. Cities Soc. 2021, 69, 102813. [Google Scholar] [CrossRef]
  34. Blazejczyk, K.; Blazejczyk, A. Assessment of bioclimatic variability on regional and local scales in central europe using ucti. Analele Stiintifice Ale Univ. Alexandru Ioan Cuza Din Iasi-Ser. Geogr. 2014, 60, 67–82. [Google Scholar]
  35. Chen, Y.C.; Matzarakis, A. Modified physiologically equivalent temperature—Basics and applications for western European climate. Theor. Appl. Climatol. 2018, 132, 1275–1289. [Google Scholar] [CrossRef]
  36. Potchter, O.; Cohen, P.; Lin, T.P.; Matzarakis, A. Outdoor human thermal perception in various climates: A comprehensive review of approaches, methods and quantification. Sci. Total Environ. 2018, 631–632, 390–406. [Google Scholar] [CrossRef] [PubMed]
  37. Pantavou, K.; Lykoudis, S.; Nikolopoulou, M. Milder form of heat-related symptoms and thermal sensation: A study in a Mediterranean climate. Int. J. Biometeorol. 2016, 60, 917–929. [Google Scholar] [CrossRef] [PubMed]
  38. Błażejczyk, K.; Jendritzky, G.; Bröde, P.; Fiala, D.; Havenith, G.; Epstein, Y.; Psikuta, A.; Kampmann, B. An introduction to the Universal Thermal Climate Index (UTCI). Geogr. Pol. 2013, 86, 5–10. [Google Scholar] [CrossRef]
  39. UTCI Calculation. Available online: http://www.utci.org (accessed on 15 April 2023).
  40. ISO 9920:2007; Ergonomics of the Thermal Environment—Estimation of Thermal Insulation and Water Vapour Resistance of a Clothing Ensemble. Technical Committee. ISO: Geneva, Switzerland, 2007.
Figure 1. Topology of the BP neural network model and network properties.
Buildings 13 02458 g001
Figure 2. The research process of this paper.
Buildings 13 02458 g002
Figure 3. Field testing location of the research site.
Buildings 13 02458 g003
Figure 4. Trends of variation in air temperature on typical days in four seasons: (a) spring season; (b) summer season; (c) autumn season; (d) winter season. OP1 indicates open squares (no tree shade); OP2 indicates open squares (roadside trees); W1 indicates walkways (brick paving); GS indicates green spaces; W2 indicates walkways (concrete paving); P indicates playgrounds; FS indicates fitness spaces.
Buildings 13 02458 g004
Figure 5. Trends of the variation in relative humidity on typical days in the four seasons: (a) spring season; (b) summer season; (c) autumn season; (d) winter season.
Buildings 13 02458 g005aBuildings 13 02458 g005b
Figure 6. Trends of the variation in wind speed on typical days in the four seasons: (a) spring season; (b) summer season; (c) autumn season; (d) winter season.
Buildings 13 02458 g006
Figure 7. Trends of the variation in mean radiation temperature on typical days in the four seasons: (a) spring season; (b) summer season; (c) autumn season; (d) winter season.
Buildings 13 02458 g007
Figure 8. Basic characteristics of elderly individuals surveyed with questionnaires across different seasons: (a) gender; (b) education level; (c) pre-retirement occupation; (d) types of outdoor activities.
Buildings 13 02458 g008
Figure 9. The findings on outdoor thermal comfort from questionnaire surveys that were conducted in the four seasons: (a) thermal comfort vote; (b) thermal preference; (c) degree of importance.
Buildings 13 02458 g009
Figure 10. Simulation results for air temperature and wind speed with eight groups of models with various inlet orientations from 10 a.m. to 11 a.m. in the winter: (a) east wind; (b) southeast wind; (c) south wind; (d) southwest wind; (e) west wind; (f) northwest wind; (g) north wind; (h) northeast wind.
Buildings 13 02458 g010aBuildings 13 02458 g010b
Figure 11. The model settings and residual curve of the CFD calculation.
Buildings 13 02458 g011aBuildings 13 02458 g011b
Figure 12. UTCI Assessment Scale: Categorization of the UTCI in terms of thermal stress.
Buildings 13 02458 g012
Figure 13. The regression analysis between the UTCI and mean TSV in summer.
Buildings 13 02458 g013
Figure 14. Comparison of the TSV with the UTCI and adapted UTCI at the seven measurement points.
Buildings 13 02458 g014
Figure 15. The regression analysis between the UTCI and mean TSV in the transitional seasons.
Buildings 13 02458 g015
Figure 16. Comparison of the ranges for the UTCI, TSV, and adapted UTCI.
Buildings 13 02458 g016
Figure 17. Comparison of UTCI ranges in different climatic regions.
Buildings 13 02458 g017
Figure 18. Locations of on-site measurements and results of the CFD models.
Buildings 13 02458 g018
Table 1. Basic conditions of the study area.
CategoryContents
Size of the study area (m2)32,000
Building footprint (m2)185,500
Plot ratio1.73
Green coverage ratio (%)40
Total number of households2600
Proportion of elderly people20.5%
Table 2. The settings of the CFD model.
ParametersDetails
Element size2.0 m
Export formatStandard
TransitionSlow
Span angle centerFine/coarse
Initial size seedAssembly
SmoothingMedium
BehaviorHard
Face sizing typeElement size
Element size0.5 m
Inflation optionSmooth transition
Transition ratio0.272
Maximum layers10
Growth rate1.2
Inflation algorithmPre
Nodes617,374
Elements2,499,395
Turbulent modelRNG k-ε model
Radiation modelP1
Solution methodsSIMPLE
InletVelocity-inlet 1–11
OutletPressure outlet
Spatial discretizationLeast Squares Cell-Based
First Order Upwind
Number of iterations300
Table 3. The percentage difference between the UTCI and adapted UTCI in the summer season.
UTCIUTCI Adaptation
location 18.3%2%
location 25.6%2.6%
location 310.3%2.3%
location 48.8%2.8%
location 58.6%4.6%
location 69%6.3%
location 711.6%1.3%
Table 4. The percentage difference between the UTCI and adapted UTCI in the transitional seasons.
UTCIUTCI Adaptation
Location 19.2%4.8%
Location 210%3.2%
Location 39%2.3%
Location 413%4%
Location 510.8%3.2%
Location 69.3%1.6%
Location 79%2%
Table 5. The ratio of the difference between the UTCI threshold and the TSV for seven test sites in various seasons.
SummerWinterTransitional Seasons
Location 12%7%4.8%
Location 22.6%10.2%3.2%
Location 32.3%6.4%2.3%
Location 42.8%5.6%4%
Location 54.6%6.4%3.2%
Location 66.3%2.5%1.6%
Location 71.3%4%2%
Table 6. Assessment scale of the UTCI for each region based on the Köppen–Geiger climate classification maps.
UTCI (°C) Range [38]Athens [37]TianJin [15]Harbin [23]Changchun
CsaDwaDwbDwb
Extremely hot>46>37.7>47>49.4>53
Very hot38 to 4634.1 to 37.739 to 4740.9 to 49.442.5 to 53
Hot32 to 3829.1 to 34.133 to 3929.1 to 40.932 to 42.5
Warm26 to 3224.5 to 29.125 to 3323 to 29.121.4 to 32
Neutral9 to 2617.4 to 24.512 to 25−3.8 to 233.4 to 21.4
Slight cool9 to 017.4 to 1412 to −6−3.8 to −7.23.4 to −15.2
Cool0 to −1314 to 9.1−6 to −11−7.2 to −18.3−15.2 to −23.2
Cold−13 to −279.1 to 5.9−11 to −16−18.3 to −25.6−23.2 to −28.7
Very cold−27 to −405.9 to 4.1−16 to −21−25.6 to −30.2−28.7 to −40
Extremely cold<−40<4.1<−21<−30.2<−40
Table 7. Analysis of the factors influencing outdoor thermal comfort in different seasons.
Air Temperature (°C)Wind Velocity (m/s)Radiation Temperature (°C)Relative Humidity (%)Wind Direction (°)Cloud Cover (%)
Summer××
Transitional seasons×
Winter
Table 8. Comparison of the RMSE and MAE values of the UTCI and TSV calculated with different algorithms.
UTCI (Existing Methods) and TSVUTCI’ (Calculated from Models) and TSV
RMSEMAERMSEMAE
Spring2.6242.2831.681.35
Summer2.4142.181.5161.159
Autumn2.2991.9361.4011.12
Winter2.9652.781.681.417
Disclaimer/Publisher’s Note: The statements, opinions and data contained in all publications are solely those of the individual author(s) and contributor(s) and not of MDPI and/or the editor(s). MDPI and/or the editor(s) disclaim responsibility for any injury to people or property resulting from any ideas, methods, instructions or products referred to in the content.

