Article

Synergistic Effects of Roadside Trees and Spatial Geometry on Thermal Environment in Urban Streets: A Case Study in Tropical, Medium-Sized City, Taiwan

Department of Landscape Architecture, National Chiayi University, Chiayi 60004, Taiwan
*
Author to whom correspondence should be addressed.
Buildings 2023, 13(8), 2092; https://doi.org/10.3390/buildings13082092
Submission received: 12 July 2023 / Revised: 8 August 2023 / Accepted: 15 August 2023 / Published: 17 August 2023
(This article belongs to the Special Issue Urban Climate, Comfort and Building Energy Performance)

Abstract

:
With the global warming effect and the rapid growth of global urbanization, the concept of urban heat islands (UHIs) has become one of the most important environmental issues in the world. Early studies on UHIs mostly focused on highly developed, large cities and found that urban heat island intensity (UHII) can be as high as 4~7 °C. In recent years, it has also been found that the UHI of medium-sized cities can also reach 4–6 °C. Previous studies have also found that planting, street orientation, and aspect ratio individually have a great impact on the thermal environment of streets, but there are not many studies that comprehensively discuss the synergistic effects of these factors. Therefore, this study takes a tropical, medium-sized city, Chiayi City, as a case study to use the ENVI-met numerical simulation tool to comprehensively compare and analyze the influence of the trees and geometric characteristics of streets on the microclimate and comfort in the streets. As a result, in a tropical, with sea winds (west winds), medium-sized city, by comparison of 12 street schemes with different roadside tree situations (planting or not), orientations (E–W, N–S), and aspect ratios (0.3, 0.7, 1.0), the improvement benefits and possible mechanisms of air temperature, wind speed, MRT, PET, SET, absolute humidity, etc. at the pedestrian street level (H = 1.4 m) were obtained and show that the cooling effect of trees was deeply affected by the street orientation and geometry. An analysis of changes at different heights was also obtained. Finally, design strategy suggestions, such as the street orientation, should be prioritized to be parallel to the prevailing wind; modifying tree shapes or building forms on streets perpendicular to the prevailing wind for creating cool and comfortable streets in future tropical, medium-sized cities were proposed.

1. Introduction

In recent years, with the effects of global warming, environmental disasters brought about by climate change have become increasingly serious [1]. Supplemented by the rapid growth of global urbanization [2], the concept of urban heat islands (UHIs) has become one of the most important environmental issues in the world. UHI is a phenomenon in which the air temperatures of urban areas are higher than those of surrounding or rural areas [3]. Urban heat island intensity (UHII), the maximum temperature difference between urban and rural areas, is usually used to measure the severity of UHI [4]. The high temperature and hotness in cities not only affect people’s physiological perception [5], but also affect the livability of cities [6]. Therefore, the thought of environmental design with climatic consideration began to increase and be valued by the fields of architecture and urban design [6,7,8,9], and in recent years, it has been extended to topics such as building energy-saving materials or payment willingness for mitigating high-temperature facilities [10,11]. Early studies on UHIs focused on large cities and found that their UHII can be as high as 4~7 °C [12,13,14,15,16,17]. However, in recent years, there has appeared to be a renewed interest in the development of medium-sized cities. Researchers have begun to conduct UHI surveys in medium-sized cities, where the populations are approximately 150,000–300,000 persons, and found that UHII can reach 4–6 °C [18,19,20]. Medium-sized cities are mostly in the early stages of the development of large cities. Through the study of medium-sized cities, we can more clearly understand the important stages and main impact mechanisms in the process of urban densification, high rise, and complexity.
Regarding the thermal environment of streets, according to the concept of urban atmospheric stratification proposed by Oke, it belongs to the urban canyon climate of the urban canopy level (UCL) from the roof of a building to the ground floor [4]. According to Oke, UCL is a micro-scale concept whose local characteristics at any point are strongly influenced by the properties of the surrounding environment, such as building height, geometry, street width orientation, green area, etc. [4]. Previous studies mainly explored three aspects: (1) the impact of urban design on solar radiation intensity [3,21,22], (2) the impact of urban design on wind flow [23,24,25], and (3) the impact of urban design factors on pedestrian comfort [26,27], and these factors are all related to the formation of UHIs. In recent years, street planting has been used more as an object to explore its effect on alleviating the thermal environment of streets, and it has been found to have a significant effect [28,29,30,31,32].
On the other hand, the main factors influencing street geometry and street microclimate include aspect ratio and street orientation [23,27,33,34,35,36]. In terms of aspect ratio, Oke (1988) once aimed at the impact of urban streets with different aspect ratios on air flow and found that the street wind field can be roughly divided into three forms according to the range of aspect ratio values to which it belongs, i.e., independent rough flow, wake flow, and sliding flow. Independent rough flow has an aspect ratio lower than 0.3, wake flow has an aspect ratio between 0.3 and 0.7, and sliding flow has an aspect ratio higher than 0.7 [23]. In recent years, in order to integrate the results of UHI surveys in various regions of the world and analyze the characteristics of the built environment, Stewart and Oke proposed the LCZ (local climate zone) classification system in 2012, which also classifies aspect ratios of cities [37].
In addition, the SVF (sky view factor) is also a factor that has been commonly used to describe the 3D geometric characteristics of streets in recent years [33]. Many scholars have also used this as an indicator to explore the relationship between the SVF of urban streets as well as their thermal environment [38,39,40]. The main influences on the difference in street orientation are the amount of solar radiation received by the street canyon and the wind speed [41,42]. Many studies have pointed out that streets with an E–W orientation are exposed to solar radiation for a long time in summer, so they have a poorer thermal environment than streets with an N–S orientation [43,44,45]. At the same time, some studies have pointed out that the main reason for the lower air temperature in the morning and afternoon in N–S orientation streets during the day is the mutual shading of the east and west walls [46].
However, although previous studies have combined aspect ratio and orientation to explore the influence of street geometry or combined roadside trees with a factor of street geometry such as aspect ratio or orientation, few papers comprehensively study planting, aspect ratio, and orientation [36,47]. Even if there are [48,49,50,51,52], the regions are primarily subtropical, temperate, and Mediterranean [48,49,50,51], and there are few studies in tropical regions. Most of their objects are almost metropolitan areas [49,50,51,52], and most of them only discussed the coverage of trees [48,49,50,52].
Therefore, this study takes a tropical, medium-sized city, Chiayi City, as an example to use the ENVI-met numerical analysis tool to comprehensively compare and analyze the influence of trees and geometric characteristics in streets on their regional street microclimate and comfort. Additionally, since the study scale is street or block level, the results can inform decision-making not only in medium-sized cities but also in large or small cities.

2. Materials and Methods

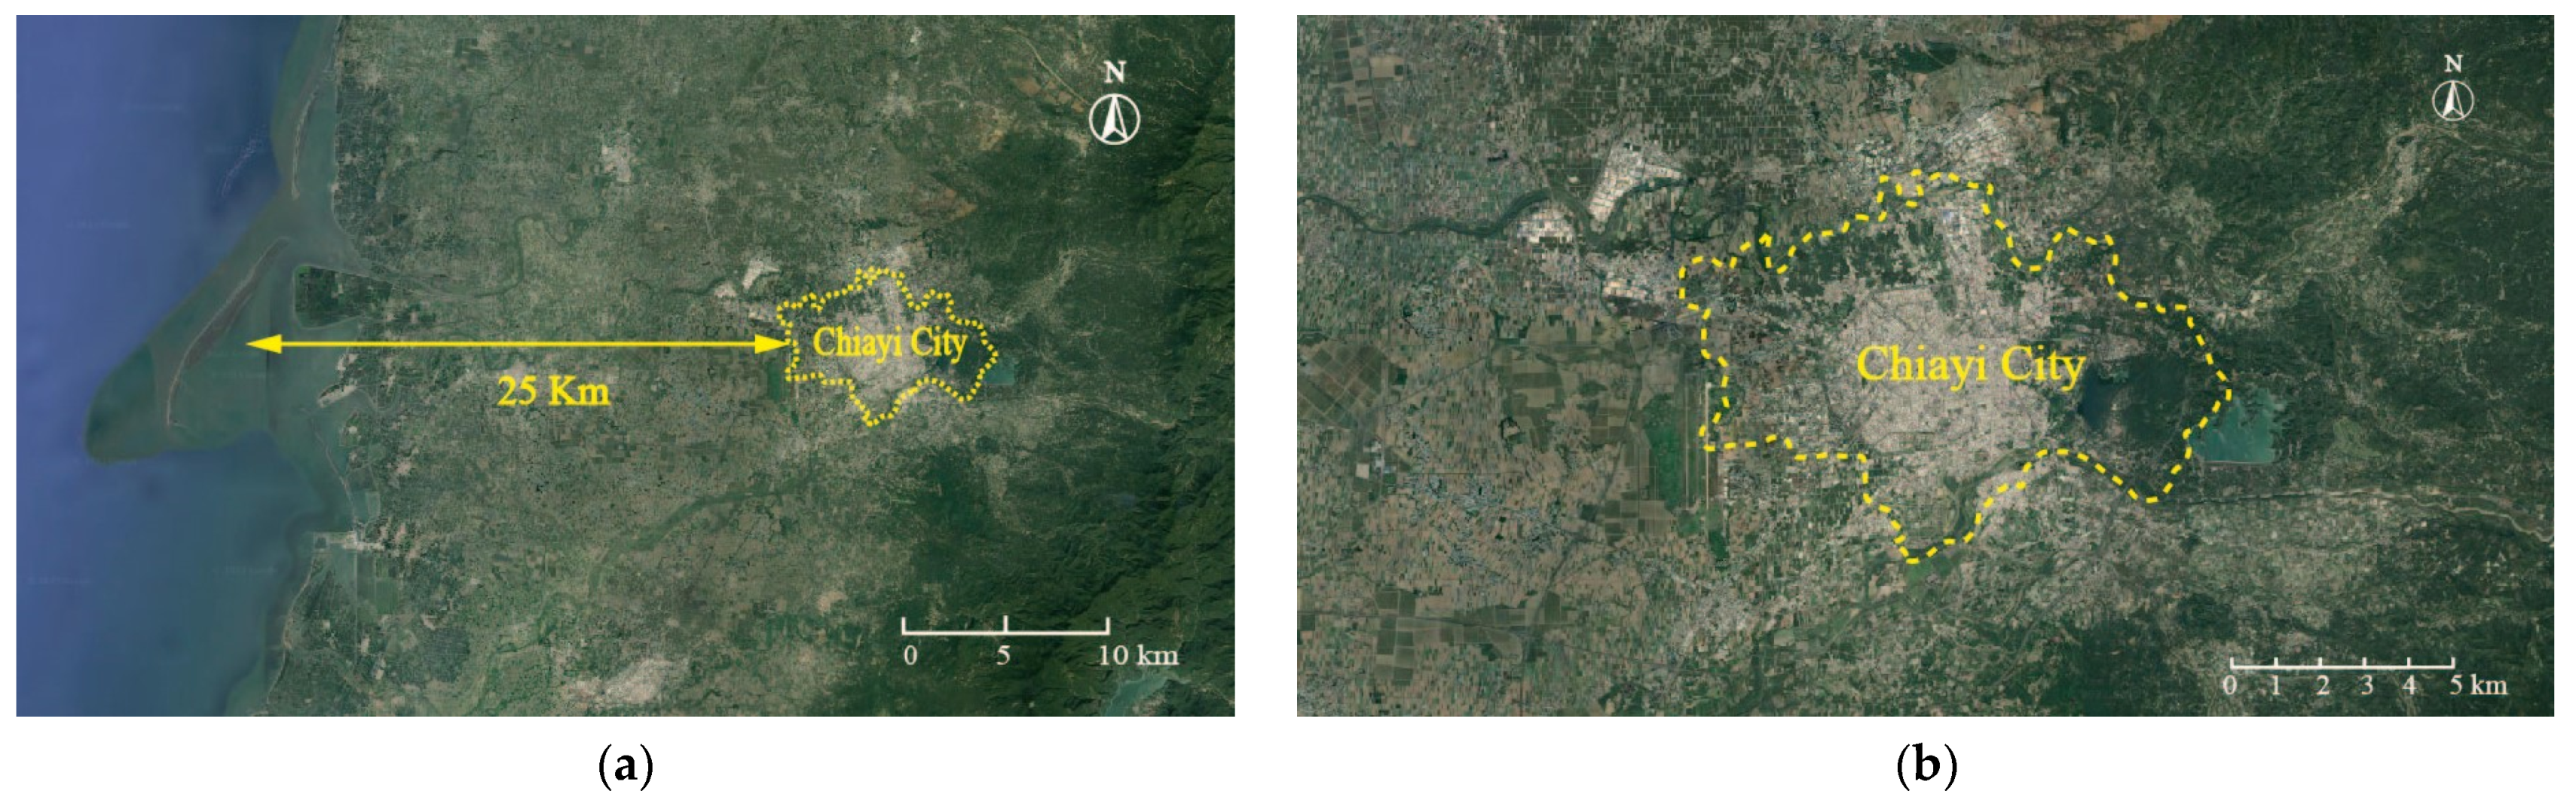
2.1. Study Areas and Characteristics

The research site takes a tropical, medium-sized city, Chiayi City, with a population of approximately 270,000 people as the research object. Chiayi City is located in the southwest of Taiwan (23°29′ N, 120°27′ E), with a tropical monsoon climate. It is near the coast, approximately 25 km from the city fringe to the coastline (Figure 1). Therefore, in the summer (June–August) afternoon, there is a prevailing sea breeze, a west wind, and the wind speed can reach about 3~4 m/s [53]. Except for the hilly area in the east (max height = 181 m), the rest is plain with an altitude of about 50 m, and the terrain descends from east to west. Buildings with 2–4 stories account for about 50% of the city’s total, and buildings with more than five stories account for about 11% [54]. The street width of the main roads in the city is 20 m (34%) [55] (Table 1).

2.2. Tree Species and Representative Street Settings

In the setting of tree species, according to the common species of roadside trees in Chiayi City [56], Bauhinia (Bauhinia × blakeana), with an elliptical shape, was selected as the representative planting species.
In terms of the street width setting, according to the data in Table 1, a road width of 20 m, with the highest proportion in Chiayi City, was selected as the road width setting. This is also the type of street width for major arterial roads in medium-sized cities in Taiwan. At the same time, streets can accommodate two-way, two-lane traffic lanes, sidewalks with a width of 2 m on both sides, and a 2 m-wide roadside tree planting space (roadside tree planting distance was 6 m) at least.
In terms of the street aspect ratio (H/W) setting, according to Oke’s (1988) classification value of street types based on wind field changes [23], and Stewart and Oke (2012) for the heat island research that proposed the LCZ (local climate zone) aspect ratio value [37], street aspect ratios of 0.3, 0.7, and 1.0 were selected as the setting (Table 1). The orientation was divided into east–west (E–W) and north–south (N–S) orientations.

2.3. CFD (Computer Fluid Dynamics) Simulation

2.3.1. ENVI-Met

The CFD simulation software used in this study was a CFD simulation tool developed by a German research group and suitable for outdoor environments, i.e., ENVI-met version 4.45 (www.envi-met.com accessed on 6 March 2022). The simulation tool is a prognostic non-hydrostatic model composed of a three-dimensional main model and a one-dimensional atmospheric boundary layer model. Based on the fundamental laws of fluid dynamics and thermodynamics, it can reproduce the outdoor microclimatic and physical situation of urban or rural spaces by accounting for the interaction between surface, plant, and air to evaluate the thermal conditions [57,58]. Several studies have shown that ENVI-met can simulate both spatial and temporal temperature and wind speed for the evaluation of a microclimate in both simple and complex urban areas [48,49,50,51,59,60,61,62]. A recent review by Tsoka et al. [62] also provided evidence of its suitability for urban climate analysis and examined mitigation strategies.

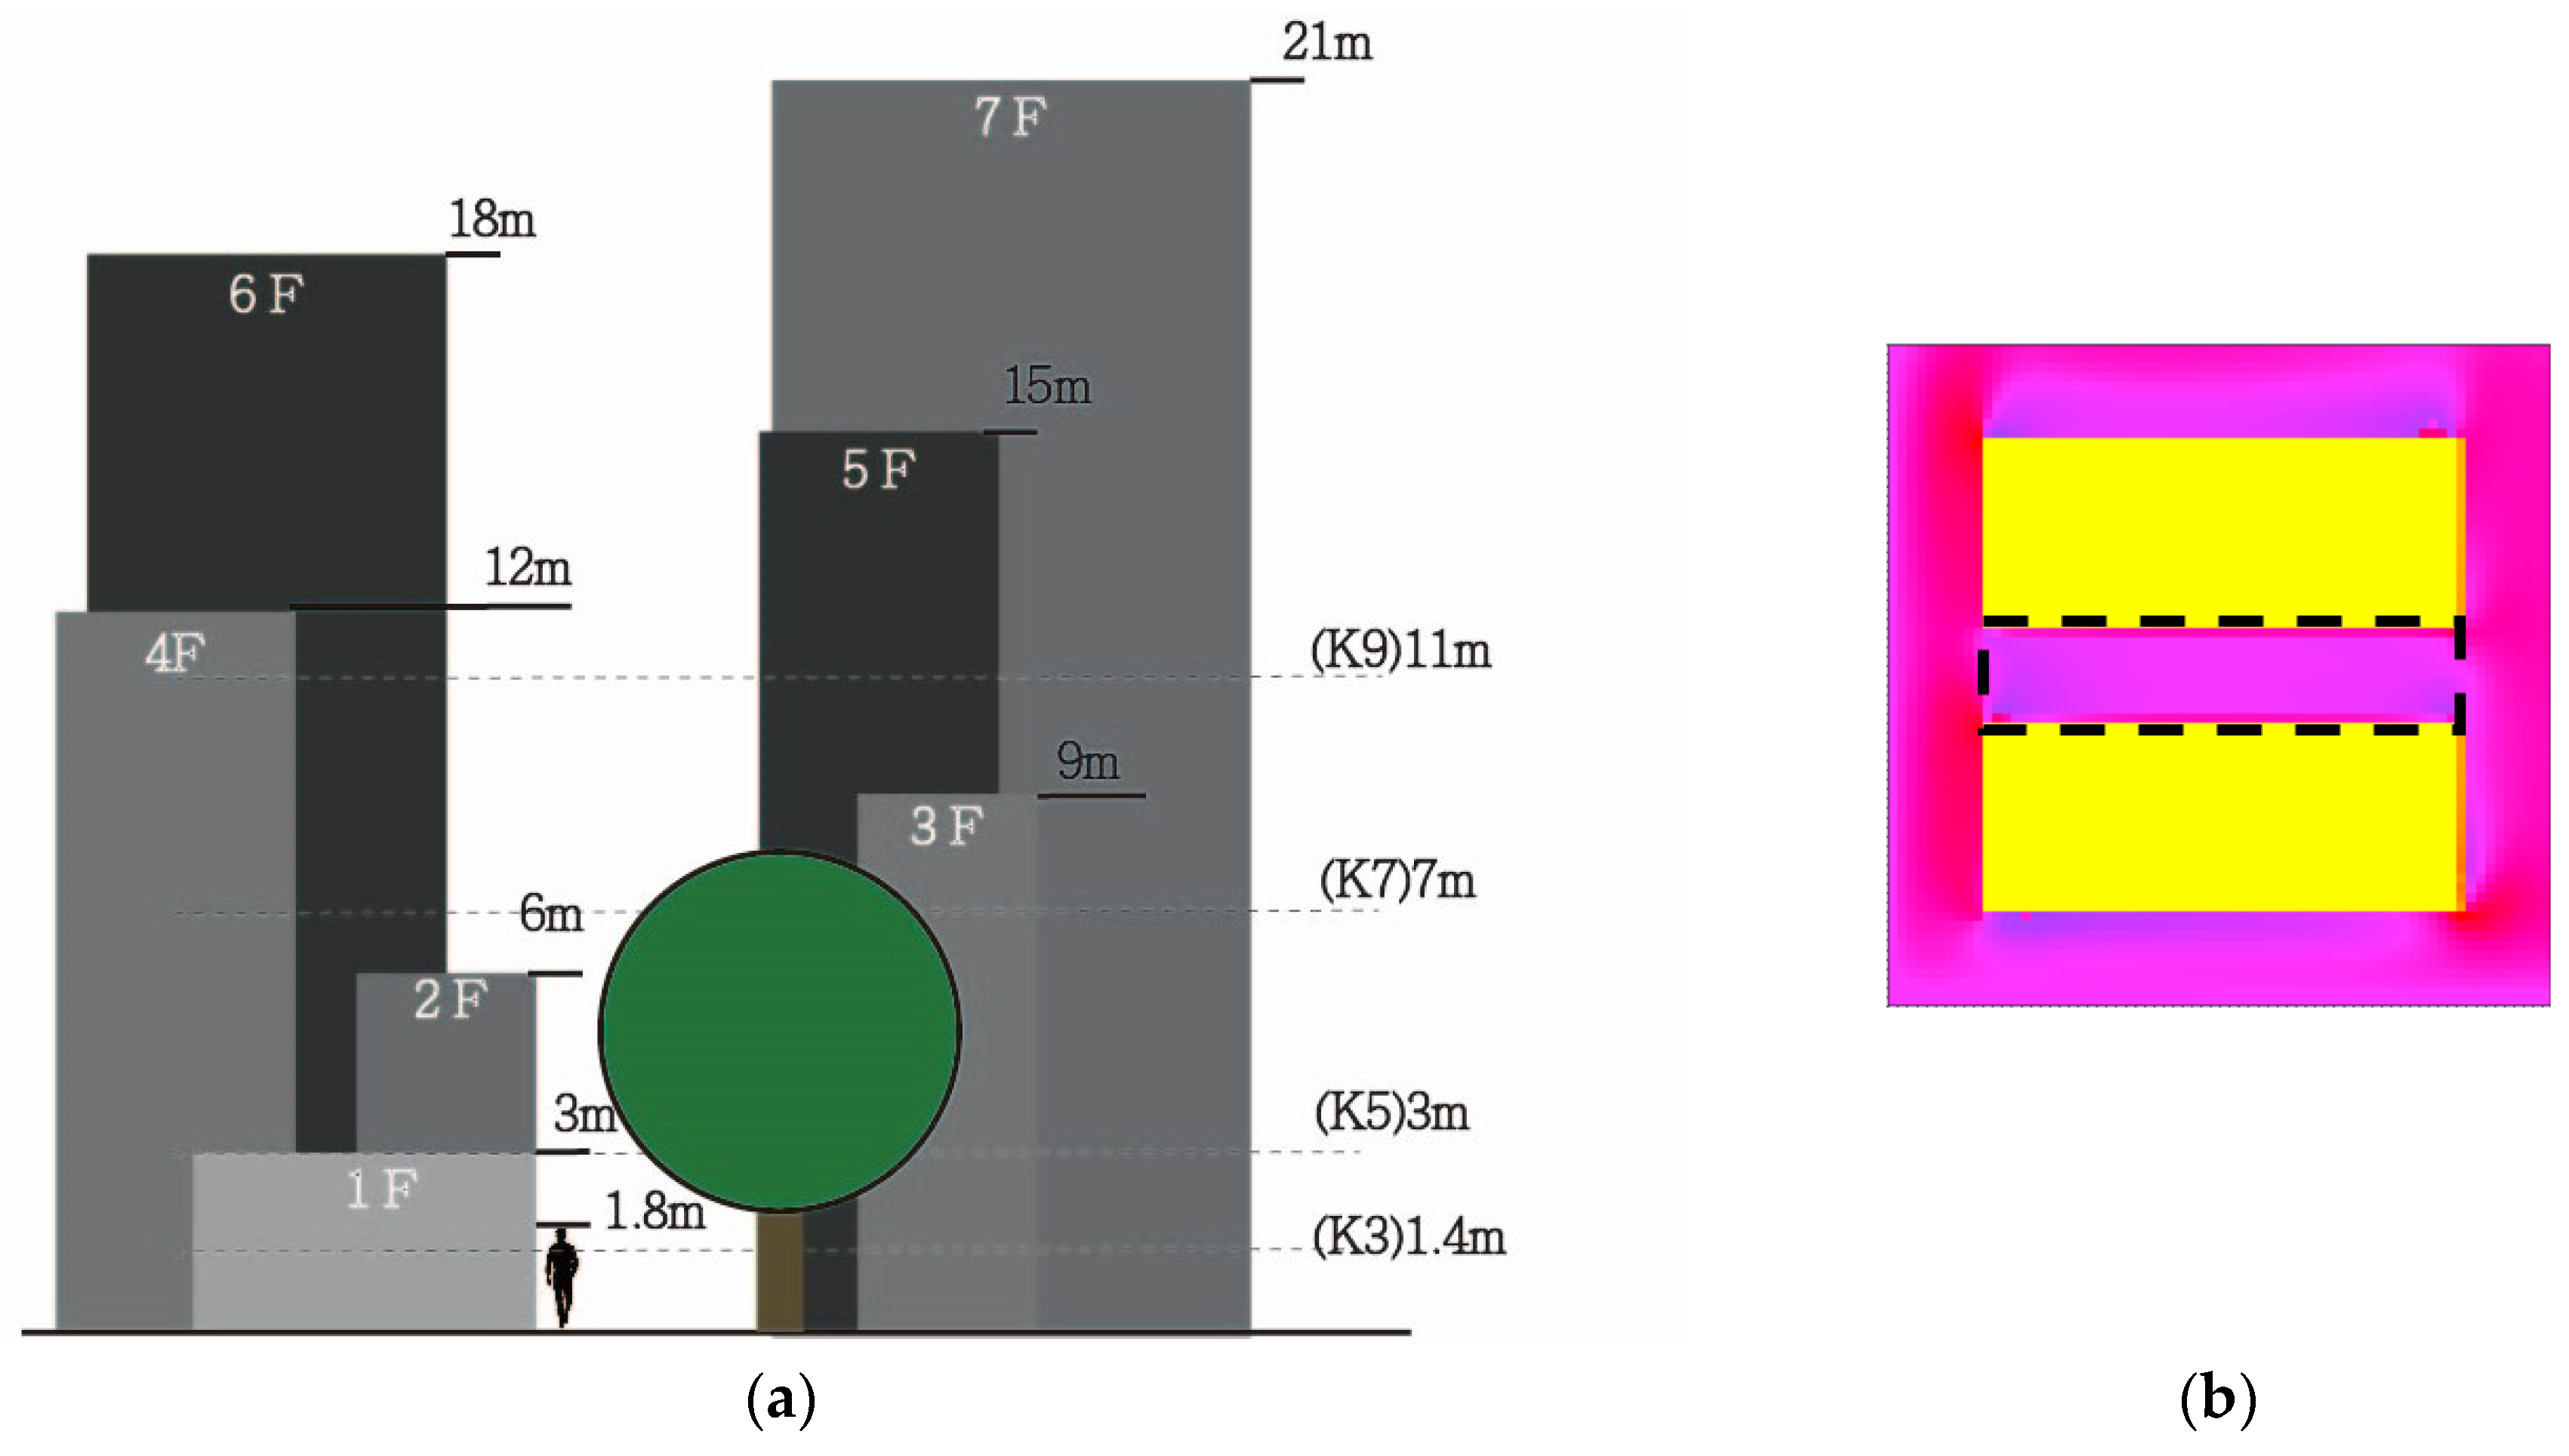
2.3.2. Geographic Location and Spatial Model Setting

The geographic location was set based on the actual latitude, longitude, and time zone of Chiayi City, as shown in Table 2. Regarding the block space setting, considering the size of common streets in Chiayi City, two homogeneous buildings with a length and width of 100 × 40 m were set, as well as a 20 m-wide street in the center. The simulation grid resolution was 2 m in both horizontal and vertical orientations, and the total grid size was 70 × 70 × 100. Detailed CFD simulation space setting information is shown in Table 2. Among them, the setting of aspect ratios was performed by fixing the width of the street and adjusting the setting of the building height to meet the aspect ratio value.

2.3.3. Parameter Setting

In order to understand the synergistic effect of trees and street geometry in a typical summer UHI climate, the sunny, rainless, and highest air temperature days were selected from records in Chiayi Station of the Central Meteorological Administration from 2015 to 2020 (June–September) [53]. Finally, the day of 13 July 2020, was selected, and the initial meteorological conditions were set based on the data from the day. The initial simulation time was set at 0:00, and in order to explore the effect of the most severe UHI period, 2 p.m. to 5 p.m., the initial wind speed and orientation were set at 3.6 m/s and west wind, constituting the average value from 2 p.m. to 5 p.m. on 13 July 2020. The total simulation time was 48 h, and detailed setting information is shown in Table 3.
The planting setting is shown in Table 4. The tree shape was set according to the shape of the Bauhinia species (ellipse). The tree height, crown width, and height of the bottom of the crown were set at 8, 6, and 2 m, respectively. The LAD (leaf area density) value was set at 0.6 based on the average of LAD values obtained from previous experimental studies [63,64]. According to this setting, the trees were arranged in the street space, and the street coverage rate of the trees was about 43%.
The human body condition settings for comfort simulation are shown in Table 5. A 35-year-old man with a height of 175 cm and a weight of 75 kg was set as the human body condition. The amount of clothing was set at 0.3 clo with short-sleeved upper and lower underwear [65]. The activity state was walking, so the total metabolic rate (MET) was 3. Other settings related to paving and building materials are shown in Table 6.

2.3.4. Simulation Schemes

A detailed description of the simulation scheme is shown in Table 7. There were 6 schemes without roadside tree planting, each of which was divided into 2 kinds of orientations and 3 kinds of aspect ratios (A01~A03, B01~B03), and 6 schemes with roadside tree planting, which also included 2 orientations and 3 aspect ratios (C01C~C03C, D01C~D03C), amounting to 12 schemes. Among them, the schemes without roadside tree planting were used as a control group to compare the difference with the planting schemes. The 3D models of each scheme in ENVI-met are shown in Figure 2.

2.4. Analysis at Different Levels

In order to discuss the simulation results of different height layers, four height layers, i.e., 1.4 m (K = 3), 3 m (K = 5), 7 m (K = 7), and 11 m (K = 9), were selected for analysis (Figure 3a). 1.4 m was mainly used to discuss the pedestrian space; 3 m was used to discuss the space of the lower canopy; 7 m was used to discuss the impact of the upper canopy space; and 11 m was used to discuss the space above the canopy without planting.

2.5. Simulation Results Analysis Items, Comfort Index, and Statistical Method

The thermal environment items of the simulation analysis include air temperature, surface temperature, wind speed, humidity, MRT (mean radiant temperature), etc. Finally, the simulated results were evaluated for thermal comfort.
In the past, there were many different indicators for evaluating thermal comfort. In this study, comfort indicators that are commonly used in outdoor environments and could be post-processed using ENVI-met software were analyzed, including SET (standard effective temperature) and PET (physiological equivalent temperature). SET is a general comfort index in the field of architecture proposed by Gagge et al. in 1986 [66]. It is a comprehensive index with the same thermal sensation obtained by the subjective responses of subjects to different air temperatures, relative humidity, the wind speed environment, and solar radiation intensity, and is applicable for outdoor thermal comfort evaluation [66]. PET was proposed by German scholar Höppe in 1999 and is a comfort index suitable for outdoor spaces. It considers all of the physiological functions of the human body, including vasoconstriction and expansion, physiological sweating, and physiological thermal balance. It is mostly used for outdoor thermal environment evaluation [67].
The research results were analyzed based on the simulation results at 14:00 (the hottest time of the day) on the second day, and the simulation results of each grid were exported to Excel for statistical calculations. Among them, the average value, maximum value, and minimum value of each scheme only calculate the values of the grids within the street area (Figure 3b).

2.6. Accuracy Verification

In the verification of the simulation results, because the correctness of the CFD radiation calculation affects the accuracy and reference of the final simulation results, the surface temperature generated by the CFD radiation calculation and the air temperature result obtained by the final fluid calculation were used as reference indicators to compare the results with similar land cover properties or urban spaces to examine the accuracy and reference of the simulation results [68,69,70].

3. Results and Analysis of the Mechanism

3.1. Verification of Simulation Results (2:00 p.m.)

The surface temperature simulation results of each scheme are shown in Figure 4. It can be found that the surface temperature of artificial pavements without shade is about 50~60 °C (A01~A03, B01~B03), with that of those shaded by buildings being about 38~40 °C (B01~B03); the ground surface temperature in shaded streets with trees and buildings was in the range of 29~38 °C (C01(C)~C03(C), D01(C)~D03(C)), consistent with the trend of the measured results of related land cover types and the range of values [71,72,73]. At the same time, the simulation results of air temperature can reflect the difference in the street area affected by building shading, tree canopy shading, and other effects (Figure 5), so the research results have a certain degree of accuracy.

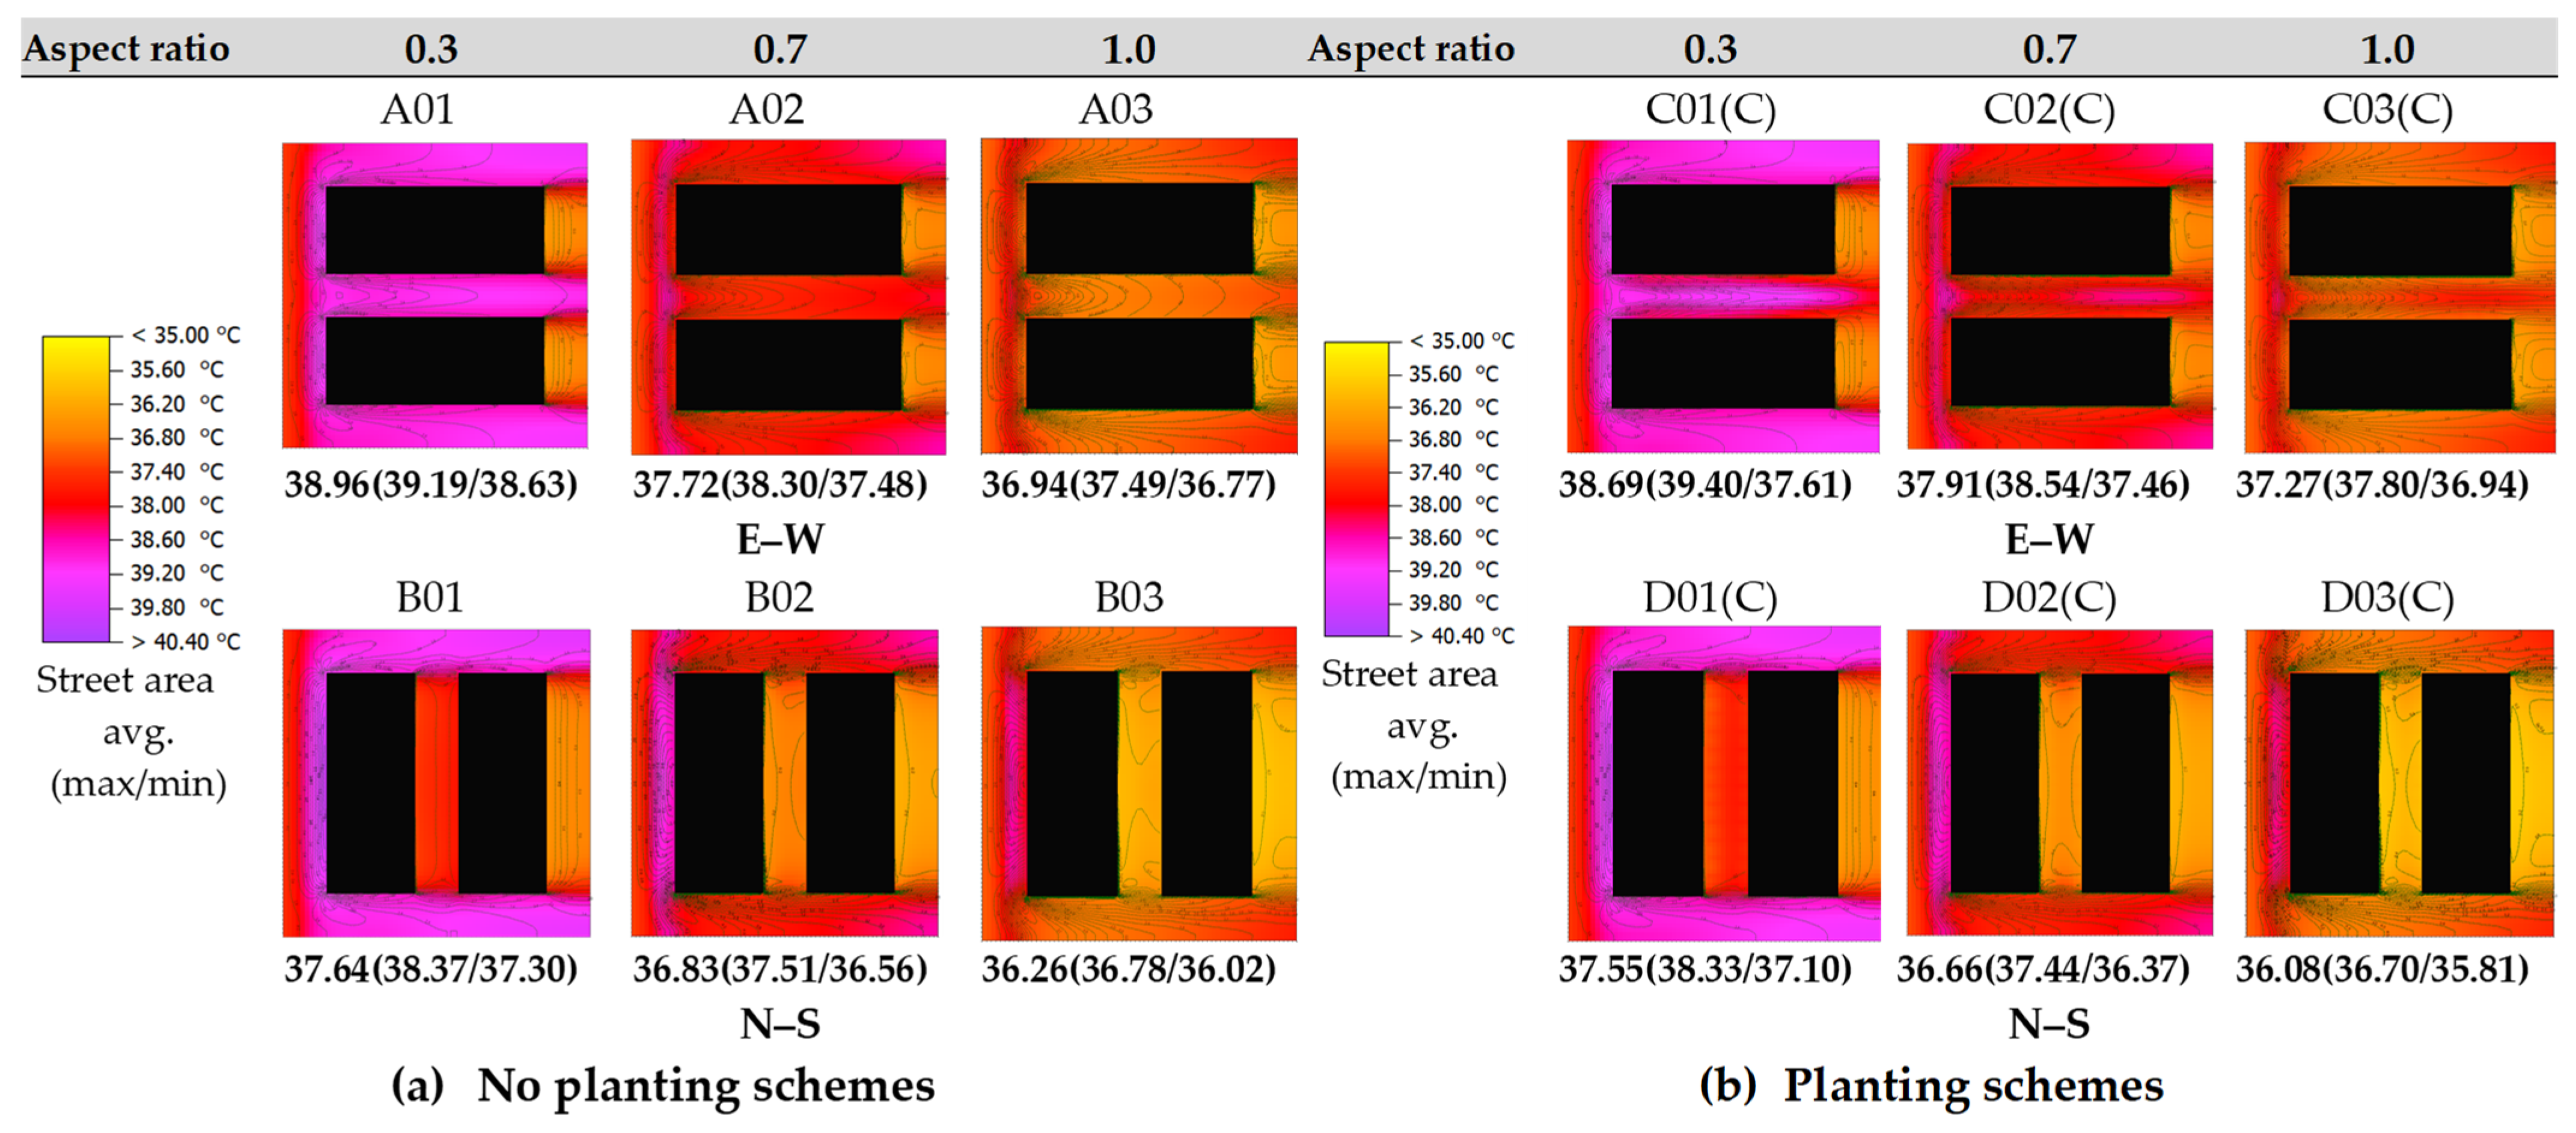
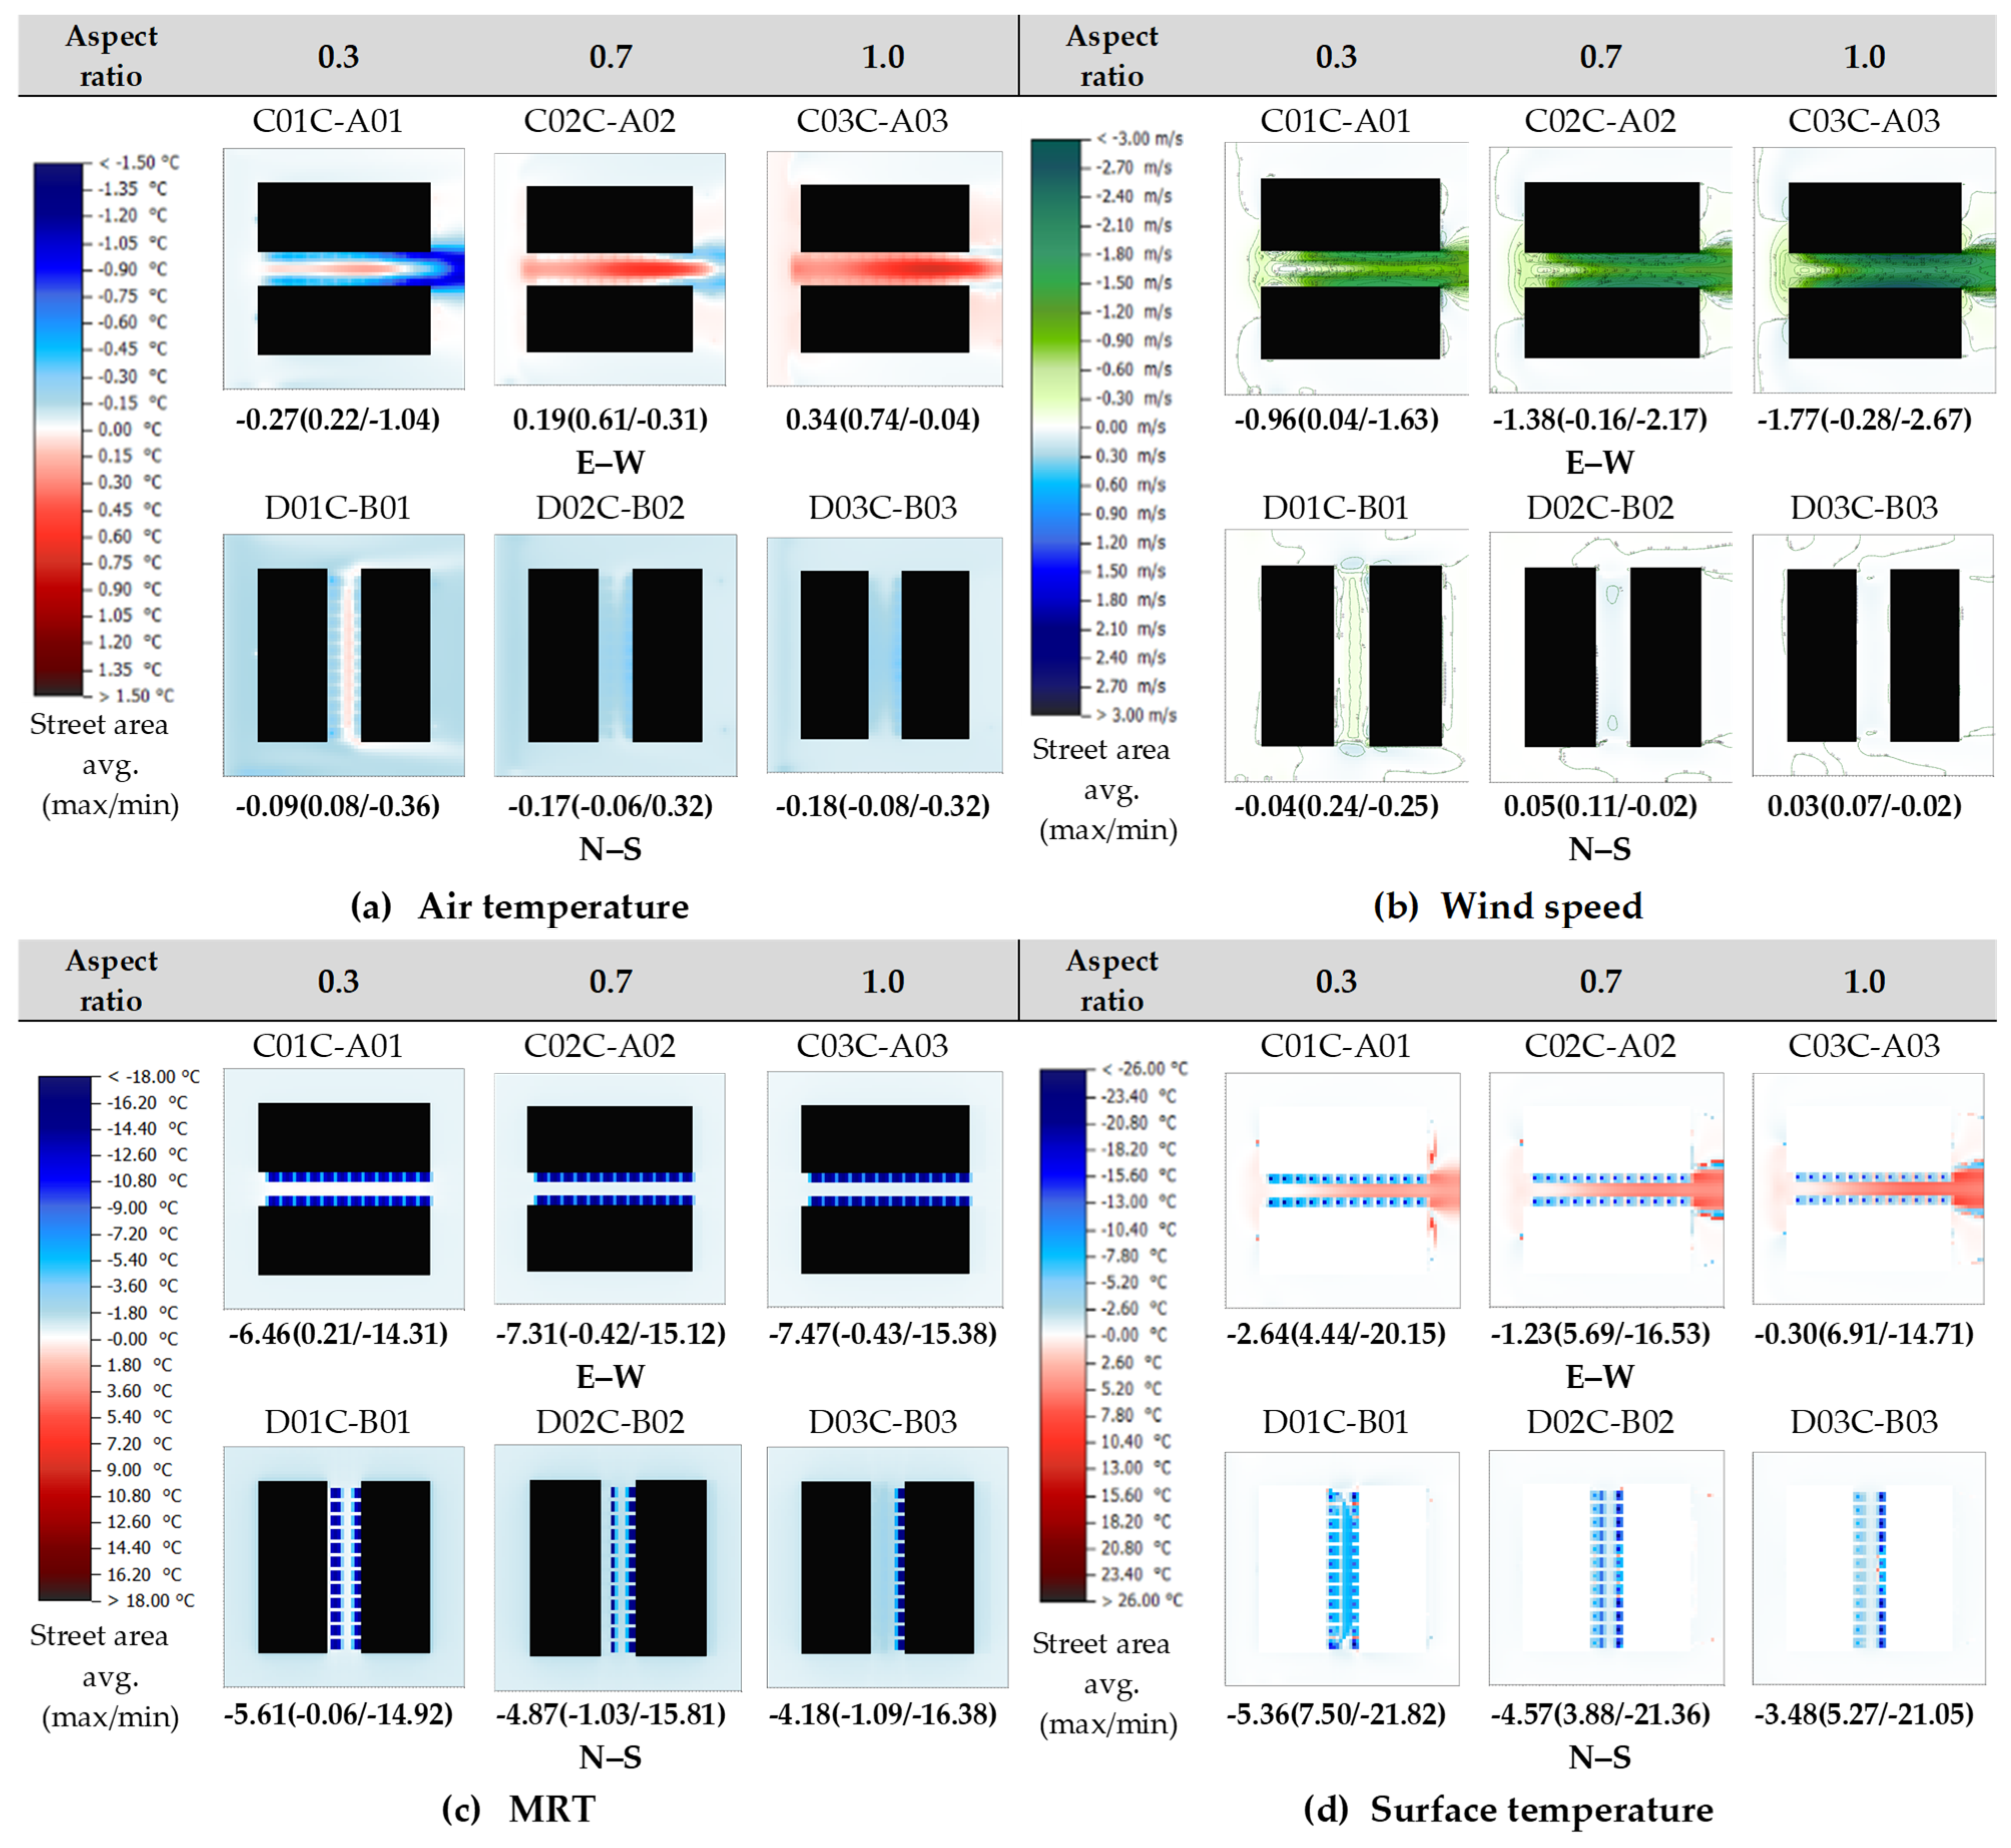
3.2. Pedestrian Layer of Results of each Scheme (H = 1.4 m)

3.2.1. Analysis of the Effect of Air Temperature Mitigation and Mechanism

The results of the air temperature difference are shown in Figure 6a. In the E–W schemes, the average air temperature in the street area with an aspect ratio of only 0.3 (C01C-A01) had a cooling effect, with a value of −0.27 °C; the other two schemes (C02C-A02, C03C-A03) were both warmings, with values of +0.19 and +0.34 °C, respectively. In the N–S schemes, the overall effect was that of cooling of −0.09, −0.17 and −0.18 °C, respectively. At the aspect ratio of 0.3, there is a partial heating phenomenon in the central street area, which weakens the overall cooling effect of the street; the other two schemes (D02C-B02, D03C-B03) also had cooling benefits of about −0.17~0.18 °C.
Overall, as for planting trees on sidewalks, the scheme with an aspect ratio of 0.3 and an E–W orientation had the greatest cooling effect, but it turned into a warming effect as the aspect ratio increased, and the warming effect increased as the aspect ratio further increased. The N–S orientation schemes will produce a cooling effect regardless of the aspect ratio (−0.09~0.18 °C), and the difference becomes small after the aspect ratio is higher than 0.7.
It is speculated that the possible reason for this phenomenon was that the street with an aspect ratio of 0.3 and an E–W orientation was originally an open, low-rise building with little shade space (A01), so the solar radiation shading effect caused by planting was obvious. The schemes with an aspect ratio higher than 0.7 already have the shading effect caused by buildings (A02, A03), so the shading effect caused by planting was not obvious. In addition, the canopy of trees would be resistant to winds and weaken the wind speed (Figure 6b). These combined effects make this type of street (E–W orientation, H/W > 0.7) have a negative effect of increasing the average air temperature in the street after planting roadside trees.

3.2.2. Analysis of the Effect of Wind Speed and Mechanism

The simulation results of the wind speed difference are shown in Figure 6b. In the E–W orientation schemes, the wind speed has a decreasing effect, with the order being C03C-A03 > C02C-A02 > C01C-A01, and the values being −1.77, −1.38, and −0.96 m/s, respectively. This means that the wind speed decreasing effect of the E–W orientation streets increased with the aspect ratio increasing. It is speculated that the possible reason was the windshield effect caused by the canopy of roadside trees, and the windshield effect becomes more obvious with the increase of the aspect ratio.
In the N–S orientation schemes, the average difference of the street was small, between ±0.05 m/s. When the aspect ratio was 0.3 (D01C-B01), the average wind speed was reduced by 0.04 m/s, and the other aspect ratio streets (D02C-B02, D03C-B03) increased slightly (0.03 and 0.05 m/s, respectively). However, it is worth noting that the street with an aspect ratio of 0.3 had the effect of reducing the wind speed, and the maximum reduction value can reach −0.25 m/s in the central area. But because there were also sudden wind speed increasing areas on both sides of the intersection, the values were averaged and then weakened.
On the whole, the average street wind speeds of the E–W orientation schemes were reduced by 1~2 m/s, while the N–S orientation schemes had no significant wind speed change in the street area, except that the street with an aspect ratio of 0.3 had the wind speed decreasing in the middle of the street.

3.2.3. Analysis of the Effect of MRT and Mechanism

The simulation results of the MRT difference are shown in Figure 6c. The average MRT of each aspect ratio scheme at the E–W orientation was decreasing, and the order was C03C-A03 ≈ C02C-A02 > C01C-A01, with −7.47, −7.31, and −6.46 °C, respectively, which means that the MRT decreasing effect at the E–W orientation increased with the aspect ratio increasing and weakened when the aspect ratio was 0.7.
At the N–S orientation, the MRT average reduction trend among all aspect ratio schemes was opposite to that at the E–W orientation, with the order being D01C-B01 > D02C-B02 > D03C-B03, with −5.61, −4.87, and −4.18 °C, respectively, which means that at the N–S orientation the MRT reduction effect decreases with the aspect ratio increasing.
Because the MRT is mainly affected by solar radiation, it is speculated that the reason for this phenomenon was that the E–W orientation street witnessed west radiation from the sun and was almost not shaded by buildings. Therefore, as the aspect ratio increased, the amount of solar radiation entering the street was not greatly affected, so the shading effect caused by the tree canopy was highlighted. On the N–S direction street, the shading effect of the tree canopy was weakened due to the shading effect of the buildings on the west side, and this effect was more obvious when the aspect ratio was higher.
Overall, all of the schemes had MRT reduction effects, and the MRT reduction effect of the E–W direction was greater than that of the N–S direction, and the average difference between the two directions was about 0.8~3.2 °C.

3.2.4. Analysis of the Effect of Surface Temperature and Mechanism (H = 0 m)

The results of the surface temperature difference are shown in Figure 6d. The average surface temperature of each aspect ratio scheme in the E–W direction was decreasing, in the order of C01C-A01 > C02C-A02 > C03C-A03, with −2.64, −1.23, and −0.3 °C, respectively. Namely, with the increase of the aspect ratio, in E–W direction schemes, the surface temperature decreased. It is worth noting that in the areas in which roadside trees were planted on the north and south sides, there was a significant decrease in surface temperature (about −15.0~−20.0 °C), while in the central area without roadside trees, there was a significant increase in surface temperature. And this increasing phenomenon became more obvious as the aspect ratio increased. Since the surface temperature was mainly heated by solar radiation and long-wave radiation, the accumulated heat can be taken away by airflow. Therefore, according to the MRT difference distribution diagram in the E–W direction in Figure 6c, no increase in radiation in the central street area was observed, but it can be seen from the wind speed difference distribution diagram in the E–W direction in Figure 6b that there was a significant decrease in wind speed and a significant trend with the increase of the aspect ratio. Therefore, it is speculated that the possible reason was the weakening of the wind speed in the E–W direction.
In the N–S direction, the average of the surface temperature difference among all aspect ratio schemes was decreased, and the trend was the same in E–W direction schemes: D01C-B01 > D02C-B02 > D03C-B03, with −5.36, −4.57, and −4.48 °C, respectively. Namely, with the increase of the aspect ratio, in N–S direction schemes, the effect of reducing the surface temperature decreased. It is worth noting that since there was no significant change in wind speed in the N–S direction (Figure 6b), the shading effect caused by planting can be completely present in the street area without being weakened by other factors.
On the whole, all of the schemes can reduce the surface temperature, and the cooling effect decreases with the increase of the aspect ratio (regardless of orientation). In addition, the cooling effect of the N–S orientation was greater than that of the E–W orientation schemes after planting roadside trees, and the difference can reach an average of about 2~3 °C.

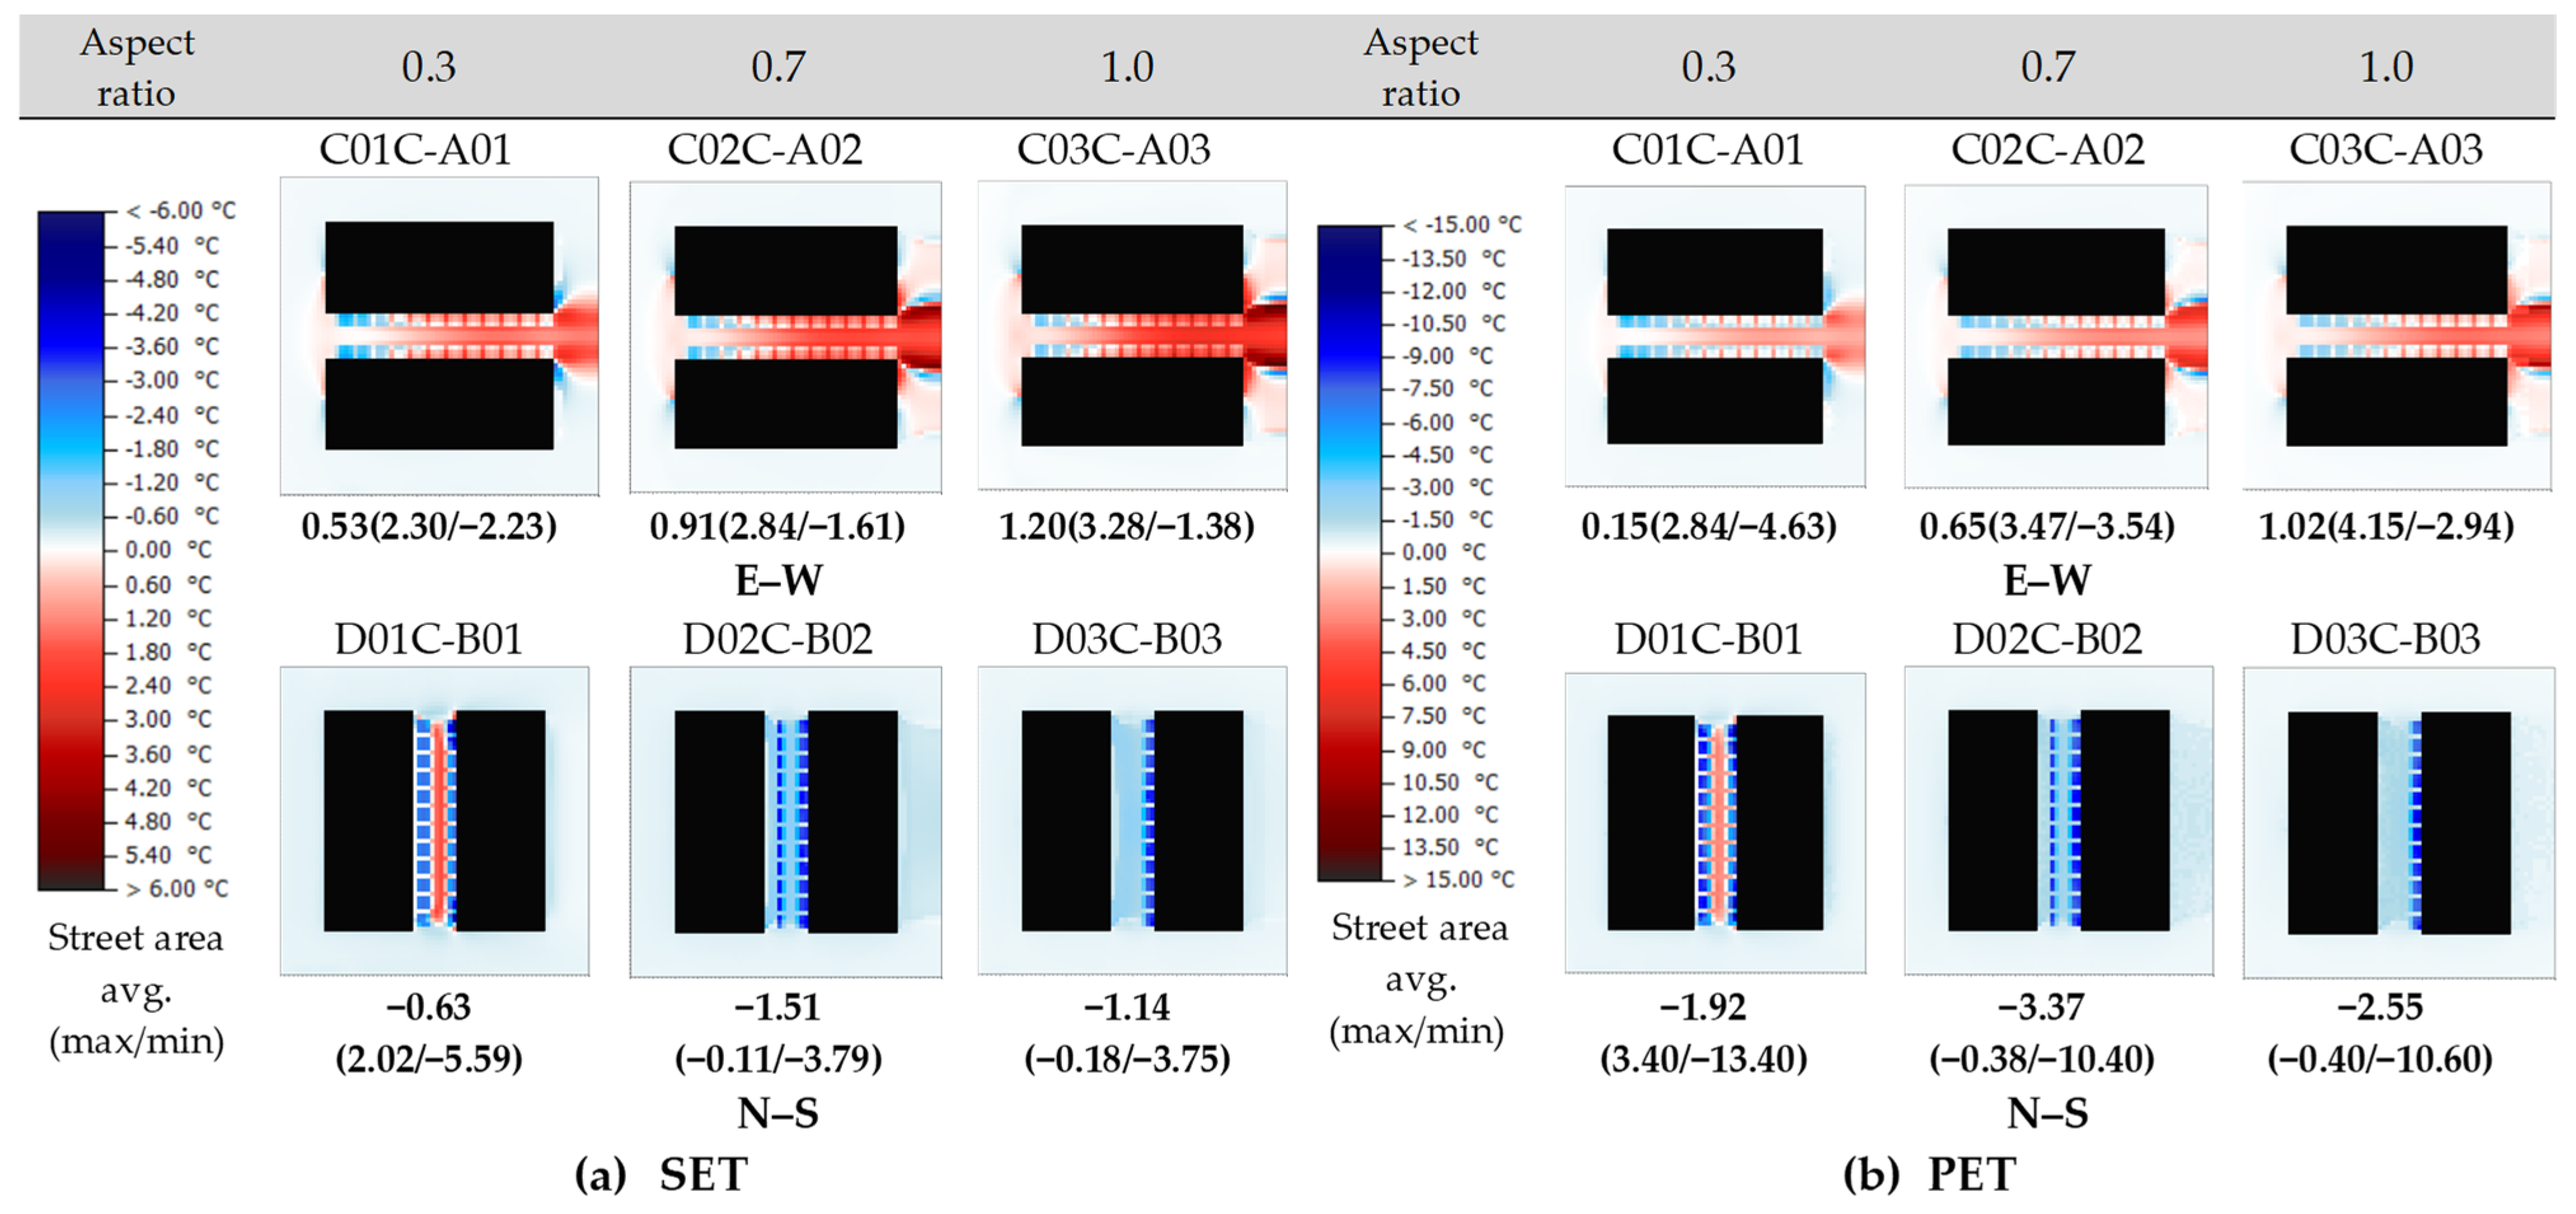
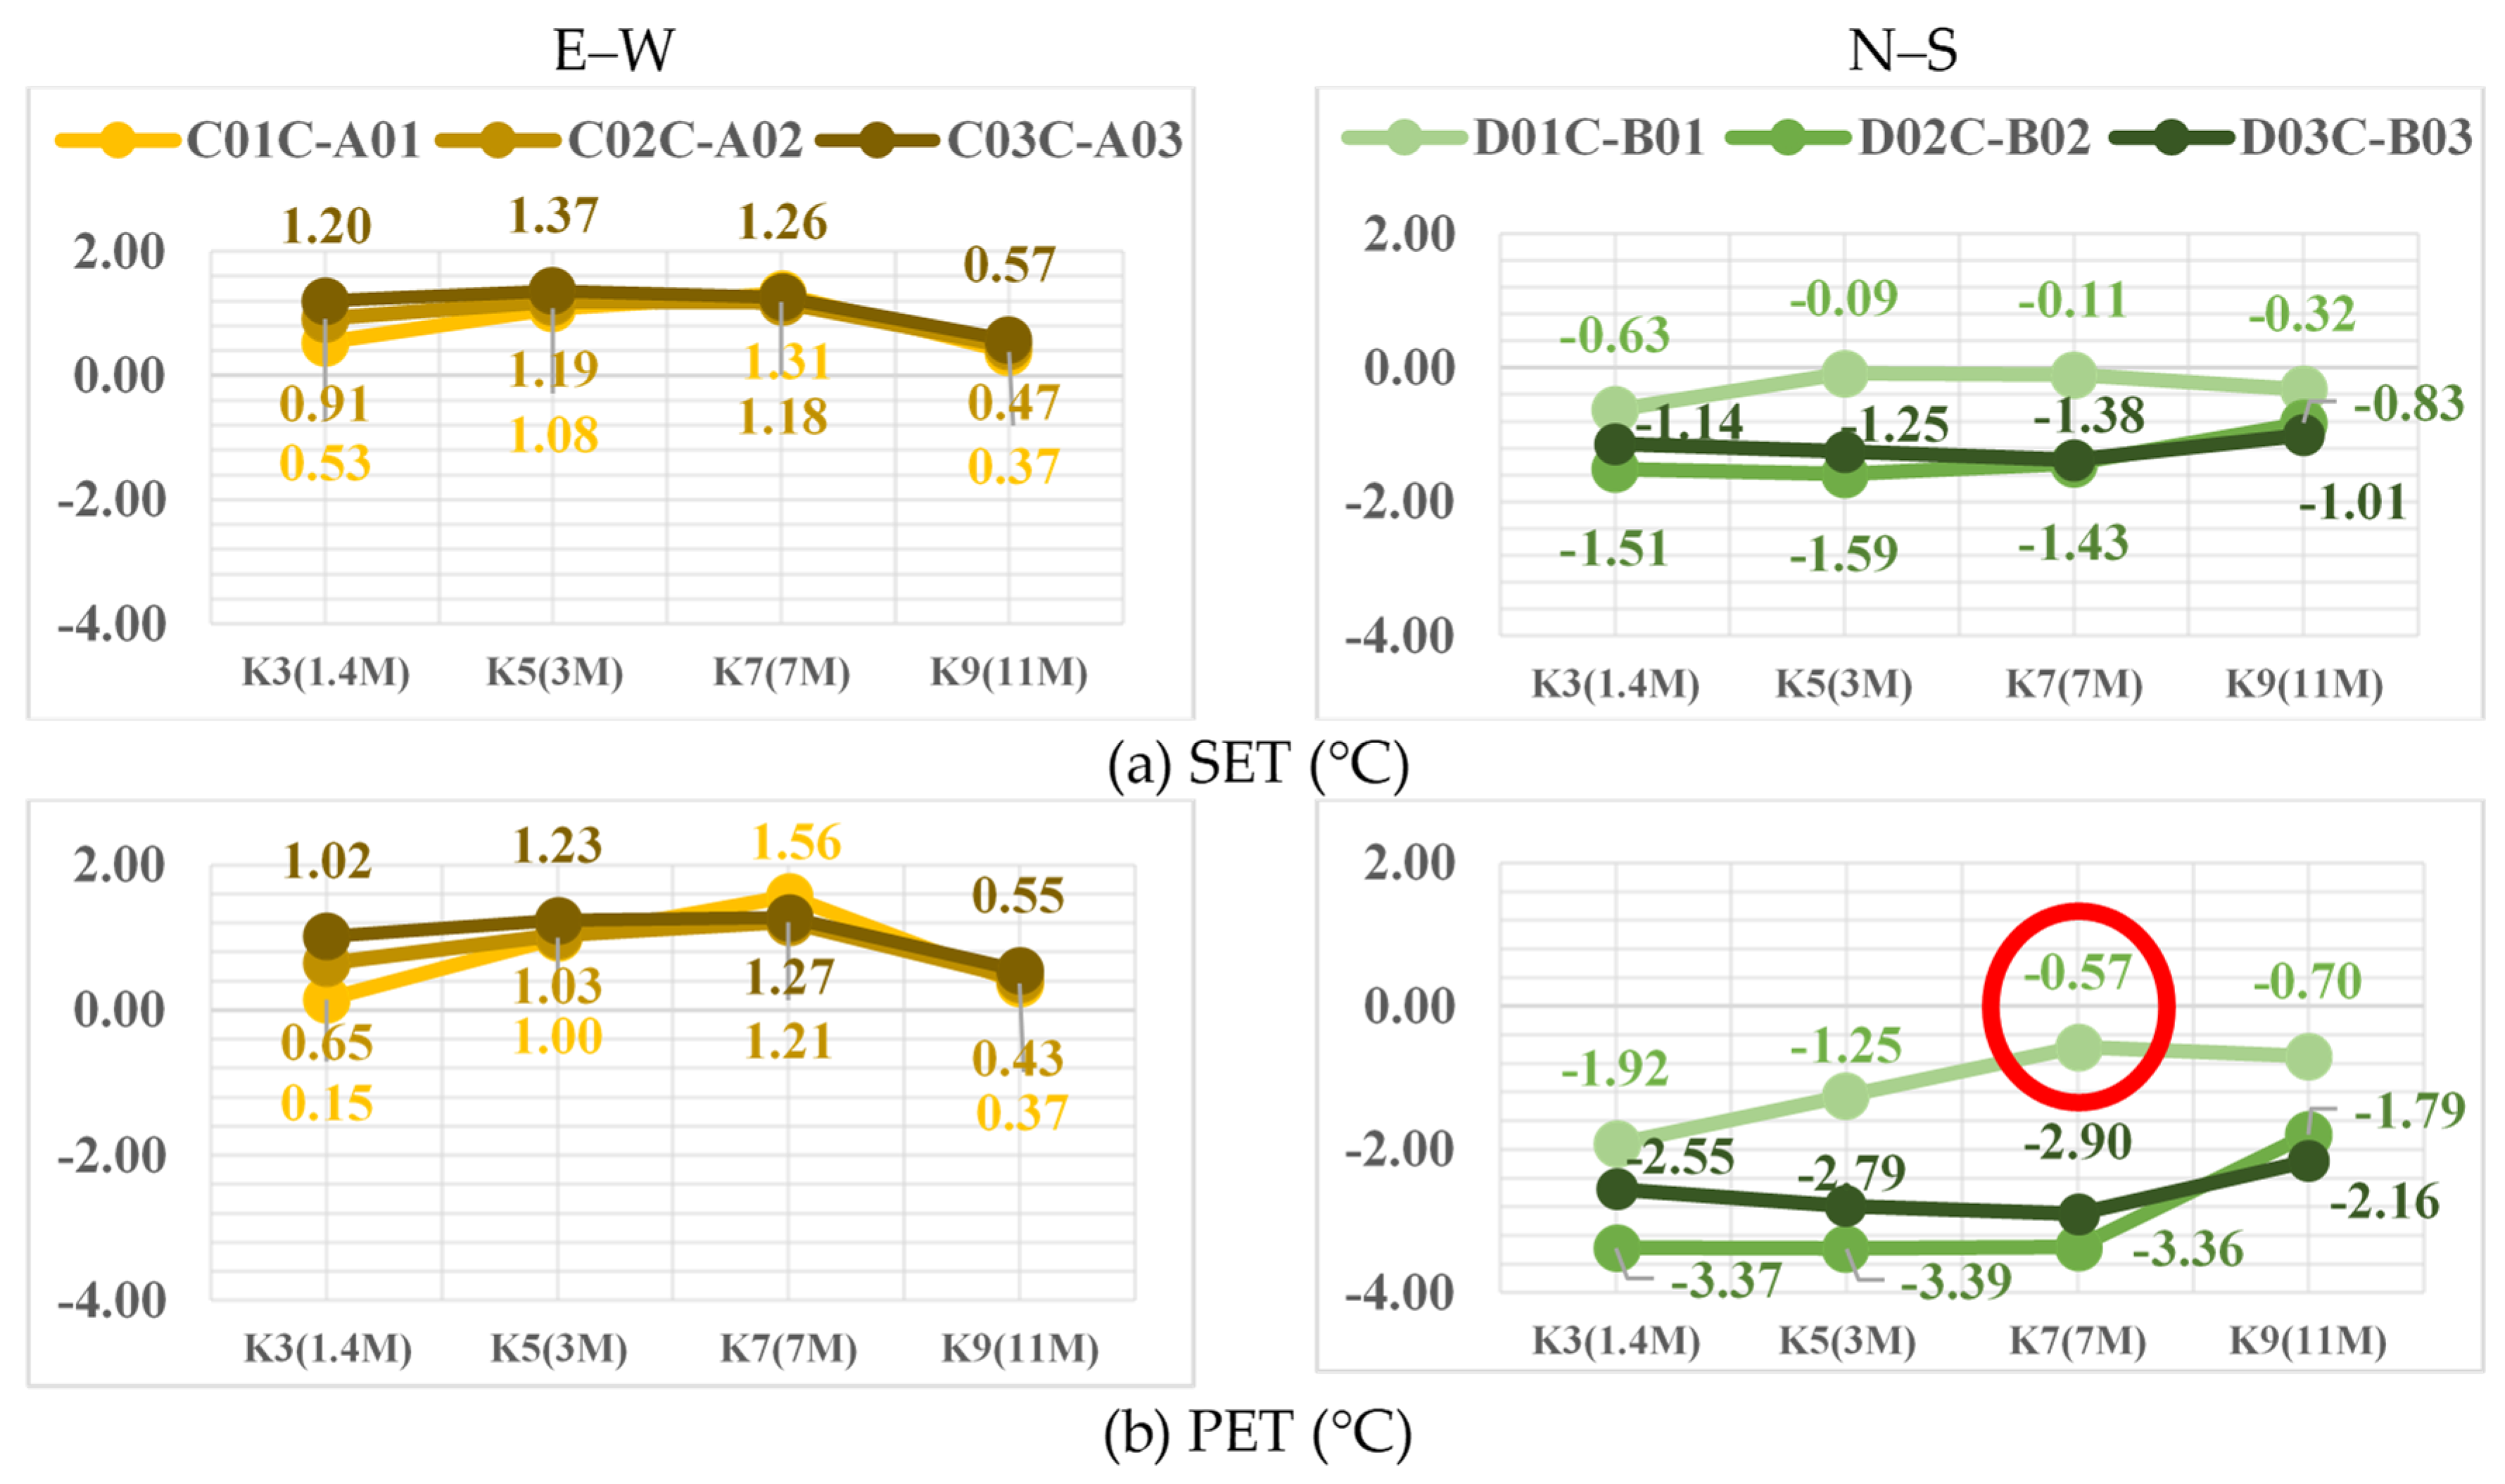
3.2.5. Analysis of the Effect of Comfort

(1)
SET
The simulation results of the SET difference are shown in Figure 7a. In the E–W orientation schemes, the average SET value of the street increased, and the order was C03C-A03 > C02C-A02 > C01C-A01, with 1.20, 0.91, and 0.53 °C, respectively. Namely, with the increase in the aspect ratio, the thermal effect on the E–W orientation increased. The possible reason was that the weakening of the wind speed made the heat from the human body difficult to dissipate, which increased the thermal sensation. This reason can also be explained by the similarity between the distribution of the wind speed difference in the E–W orientation in Figure 6b and the SET difference distribution in the E–W orientation.
However, in the N–S orientation schemes, the average value of the SET difference decreased, and the order was D02C-A02 > C03C-A03 > C01C-A01, with −1.51, −1.14, and −0.63 °C, respectively. Namely, the SET reduction value at an aspect ratio of 0.7 was the highest, followed by an aspect ratio of 1.0, and the lowest was at an aspect ratio of 0.3. It is worth noting that the street with an aspect ratio of 0.3 had a cooling effect where roadside trees were planted, and the maximum temperature can reach −5.59 °C, but there was a 4~5 m-wide area in the central area that had the largest increasing effect up to +2.02 °C. It was the reason why the overall SET reduction value at the aspect ratio of 0.3 became lower. The possible reason was the wind speed weakening effect on the N–S orientation streets, as shown in Section 3.2.2.
On the whole, at the E–W orientation, after planting roadside trees, the wind speed weakened significantly due to the tree canopies, causing an increase in SET; meanwhile, at the N–S orientation, it had the opposite effect, although at the aspect ratio of 0.3, the wind speed in the central street area witnessed a slightly weakening phenomenon, but it can still be reduced by 0.63 °C on average.
(2)
PET
The simulation results of the PET difference are shown in Figure 7b. In the E–W orientation schemes, the average SET value of the street was increased, and the order was C03C-A03 > C02C-A02 > C01C-A01, with 1.02, 0.65, and 0.15 °C, respectively. Namely, with the increase in the aspect ratio, the thermal effect at the E–W orientation increased.
In the N–S orientation schemes, the average value of the PET difference decreased, and the order was D02C-A02 > C03C-A03 > C01C-A01, with −3.37, −2.55 and −1.92, °C, respectively. Namely, the SET reduction value at the aspect ratio of 0.7 was the highest, followed by the aspect ratio of 1.0, and the lowest was at the aspect ratio of 0.3.
Overall, the results of the PET difference were similar to those of the SET, and the reasons and mechanisms were also similar. At the E–W orientation, PET had an increasing effect, which was 0~0.34 °C lower than for SET; meanwhile, at the N–S orientation, it had a decreasing effect, which was about 1.3~1.8 °C higher than for SET.

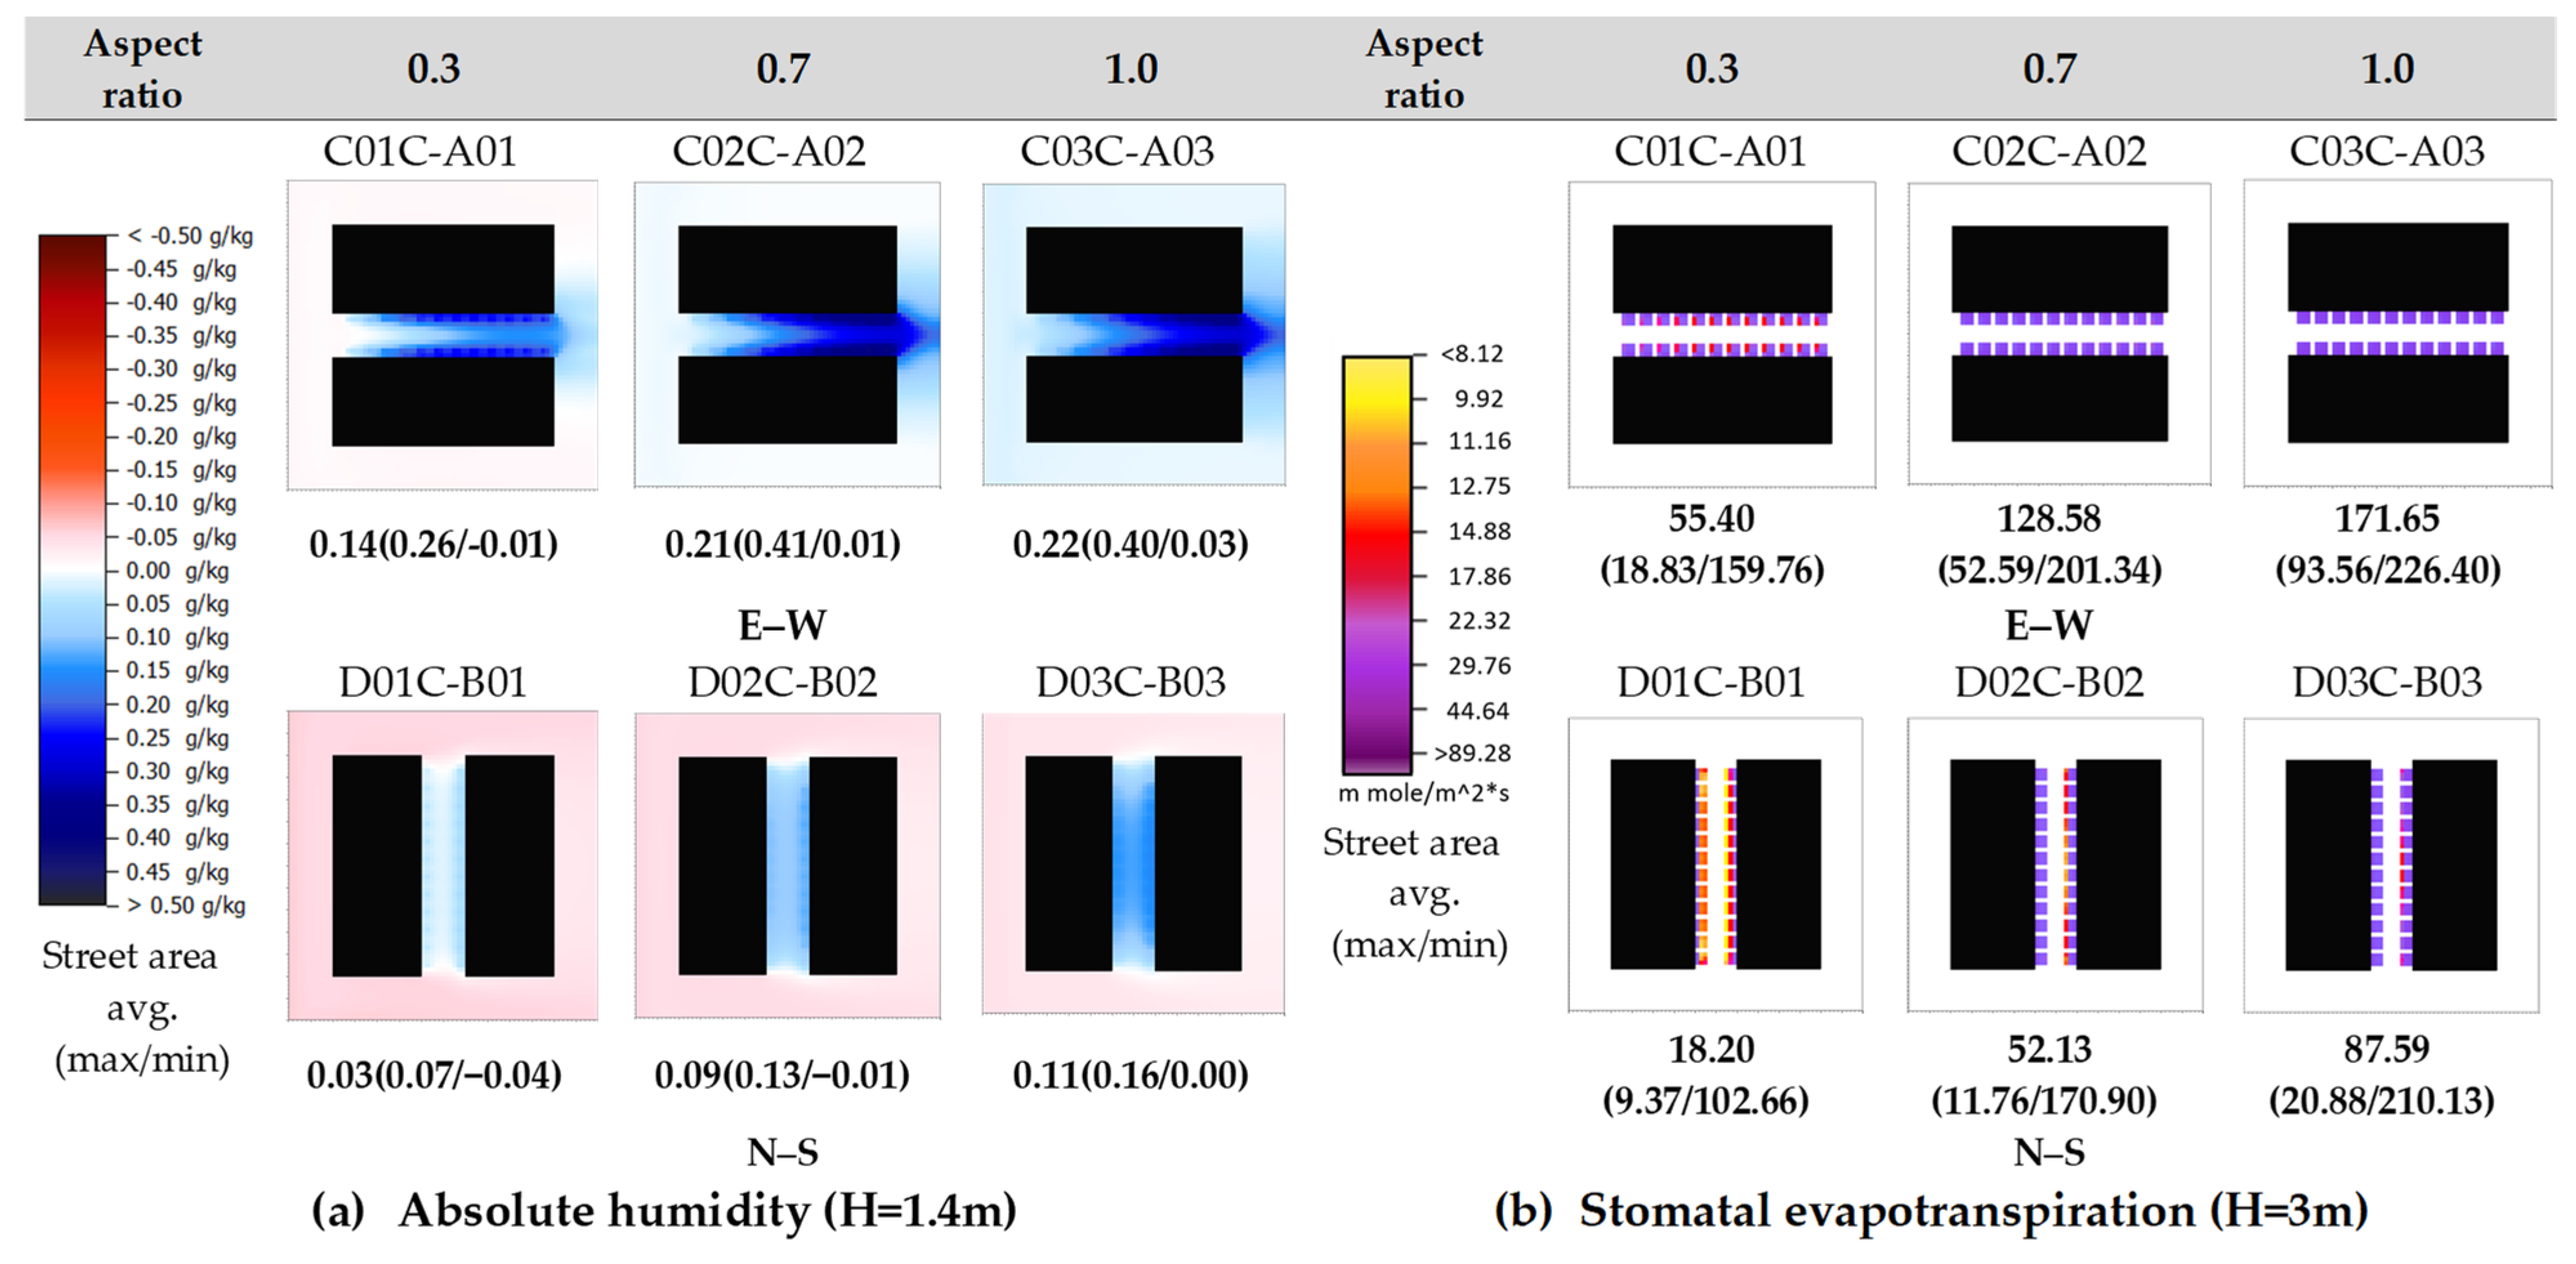
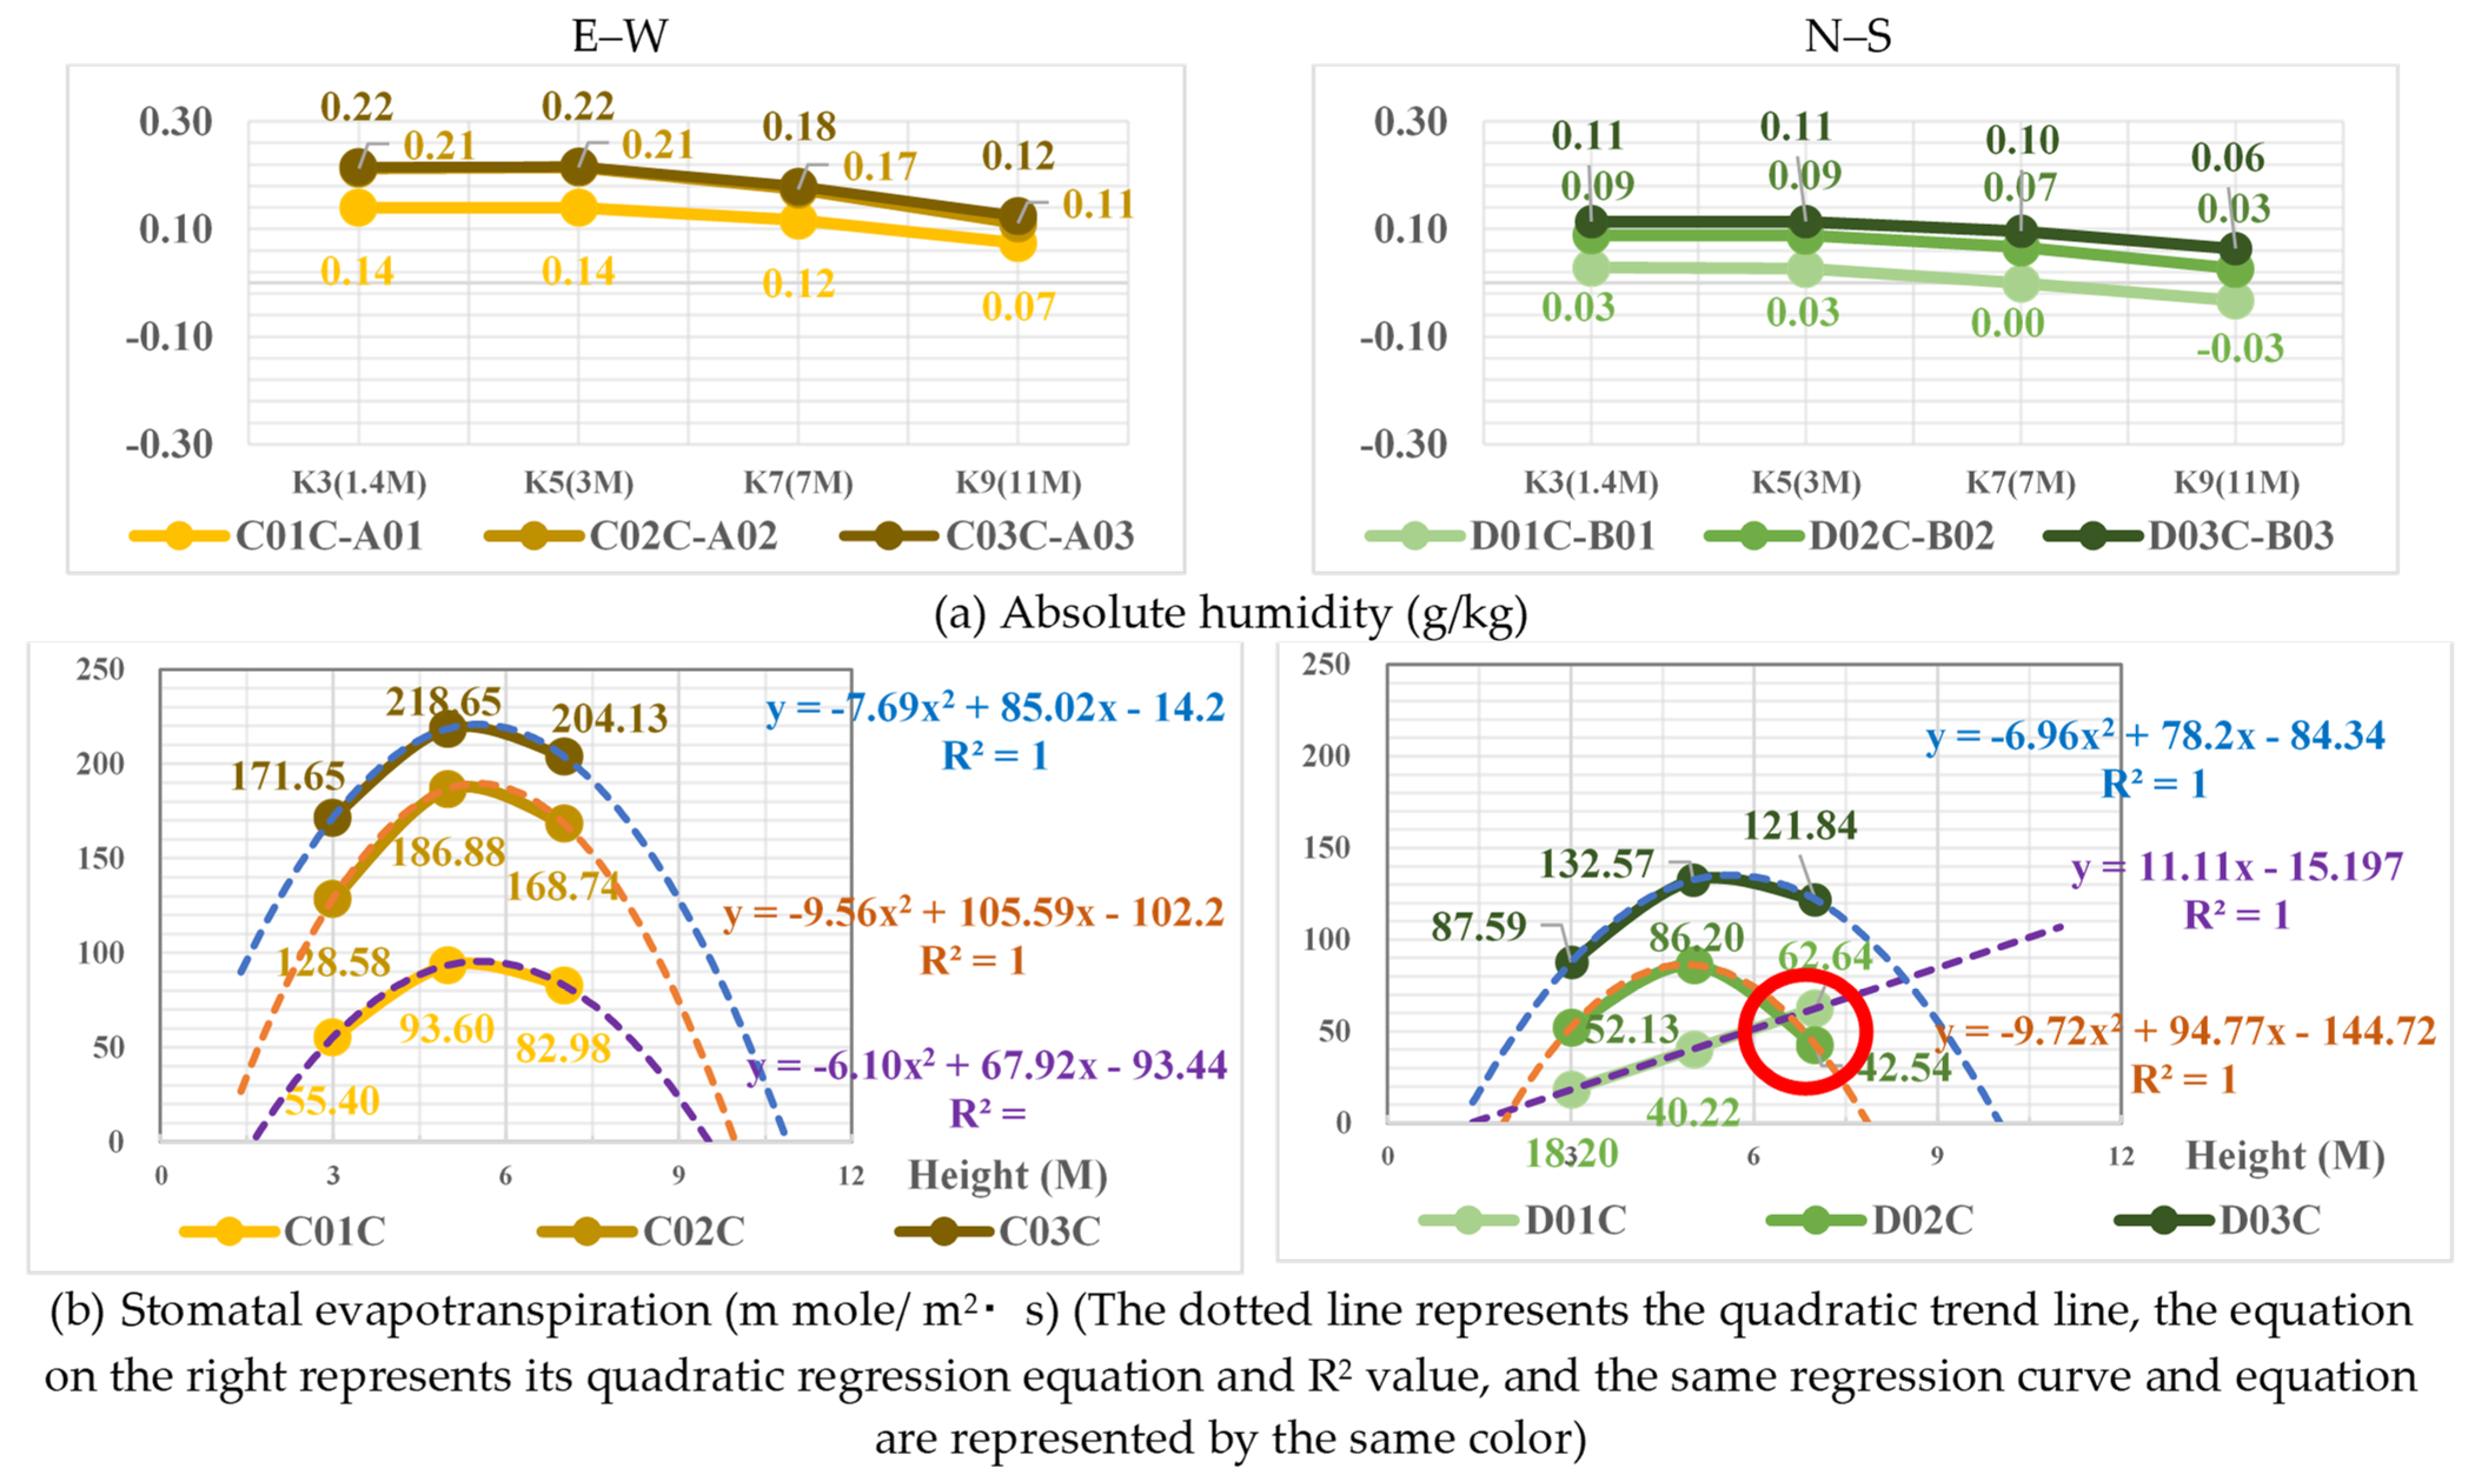
3.2.6. The Results of Absolute Humidity and the Influence of Stomatal Transpiration

The results of the absolute humidity difference are shown in Figure 8a. The average absolute humidity difference in the E–W orientation schemes was increased, and the order was C03C-A03 ≈ C02C-A02 > C01C-A01, with 0.22, 0.21, and 0.14 g/kg, respectively. Namely, with an increase in the aspect ratio, the absolute humidity difference increased. It is worth noting that the difference distribution map at an aspect ratio of 0.3 shows that the source of moisture mainly came from the transpiration of roadside trees on both sides. But there was also a phenomenon of a V-shaped gradual increase from west to east, and with the aspect ratio, the increase was more obvious.
The average absolute humidity difference at the N–S orientation also increased, and the order was C03C-A03 > C02C-A02 > C01C-A01, with 0.11, 0.09, and 0.03 g/kg, respectively. Namely, with an increase in the aspect ratio, the absolute humidity difference increased similarly to that at the E–W orientation. It is worth noting that the distribution of absolute humidity difference values at the N–S orientation was relatively average, and the maximum increase was between 0.07 and 0.16 g/kg, which was not better than at the E–W orientation (0.26–0.40 g/kg), and only about 1/3 or so of those.
Overall, in all of the schemes, the humidity increased, and the E–W orientation increased by 0.11 g/kg more than in the N–S schemes; moreover, the spatial distributions presented a V-shaped accumulation phenomenon toward the east.
Because the humidity increase in the street area was mainly due to the transpiration of roadside trees, in order to understand the possible reasons for the change in absolute humidity, this study further analyzes the simulation results of stomatal transpiration near the pedestrian layer (H = 3 m), as shown in Figure 9b. It was found that the overall average stomatal transpiration at the E–W orientation was about two to three times higher than that at the N–S orientation, which explained why the average absolute humidity difference at the E–W orientation was higher than that at the N–S orientation.
In addition, if we individually analyze the trend of stomatal transpiration at each orientation and the aspect ratios, it can be found that no matter what the orientation was, there was a trend that the stomatal transpiration increased with the increase of the aspect ratio, which also shows the reason as to why the absolute humidity increased with the aspect ratio. However, in the results of stomatal transpiration, a non-similar trend was found: the absolute humidity at the E–W orientation increased gradually in a V shape from west to east. Therefore, it is speculated that other factors may have caused this change, and the most possible factor was the effect of weakening wind speed.

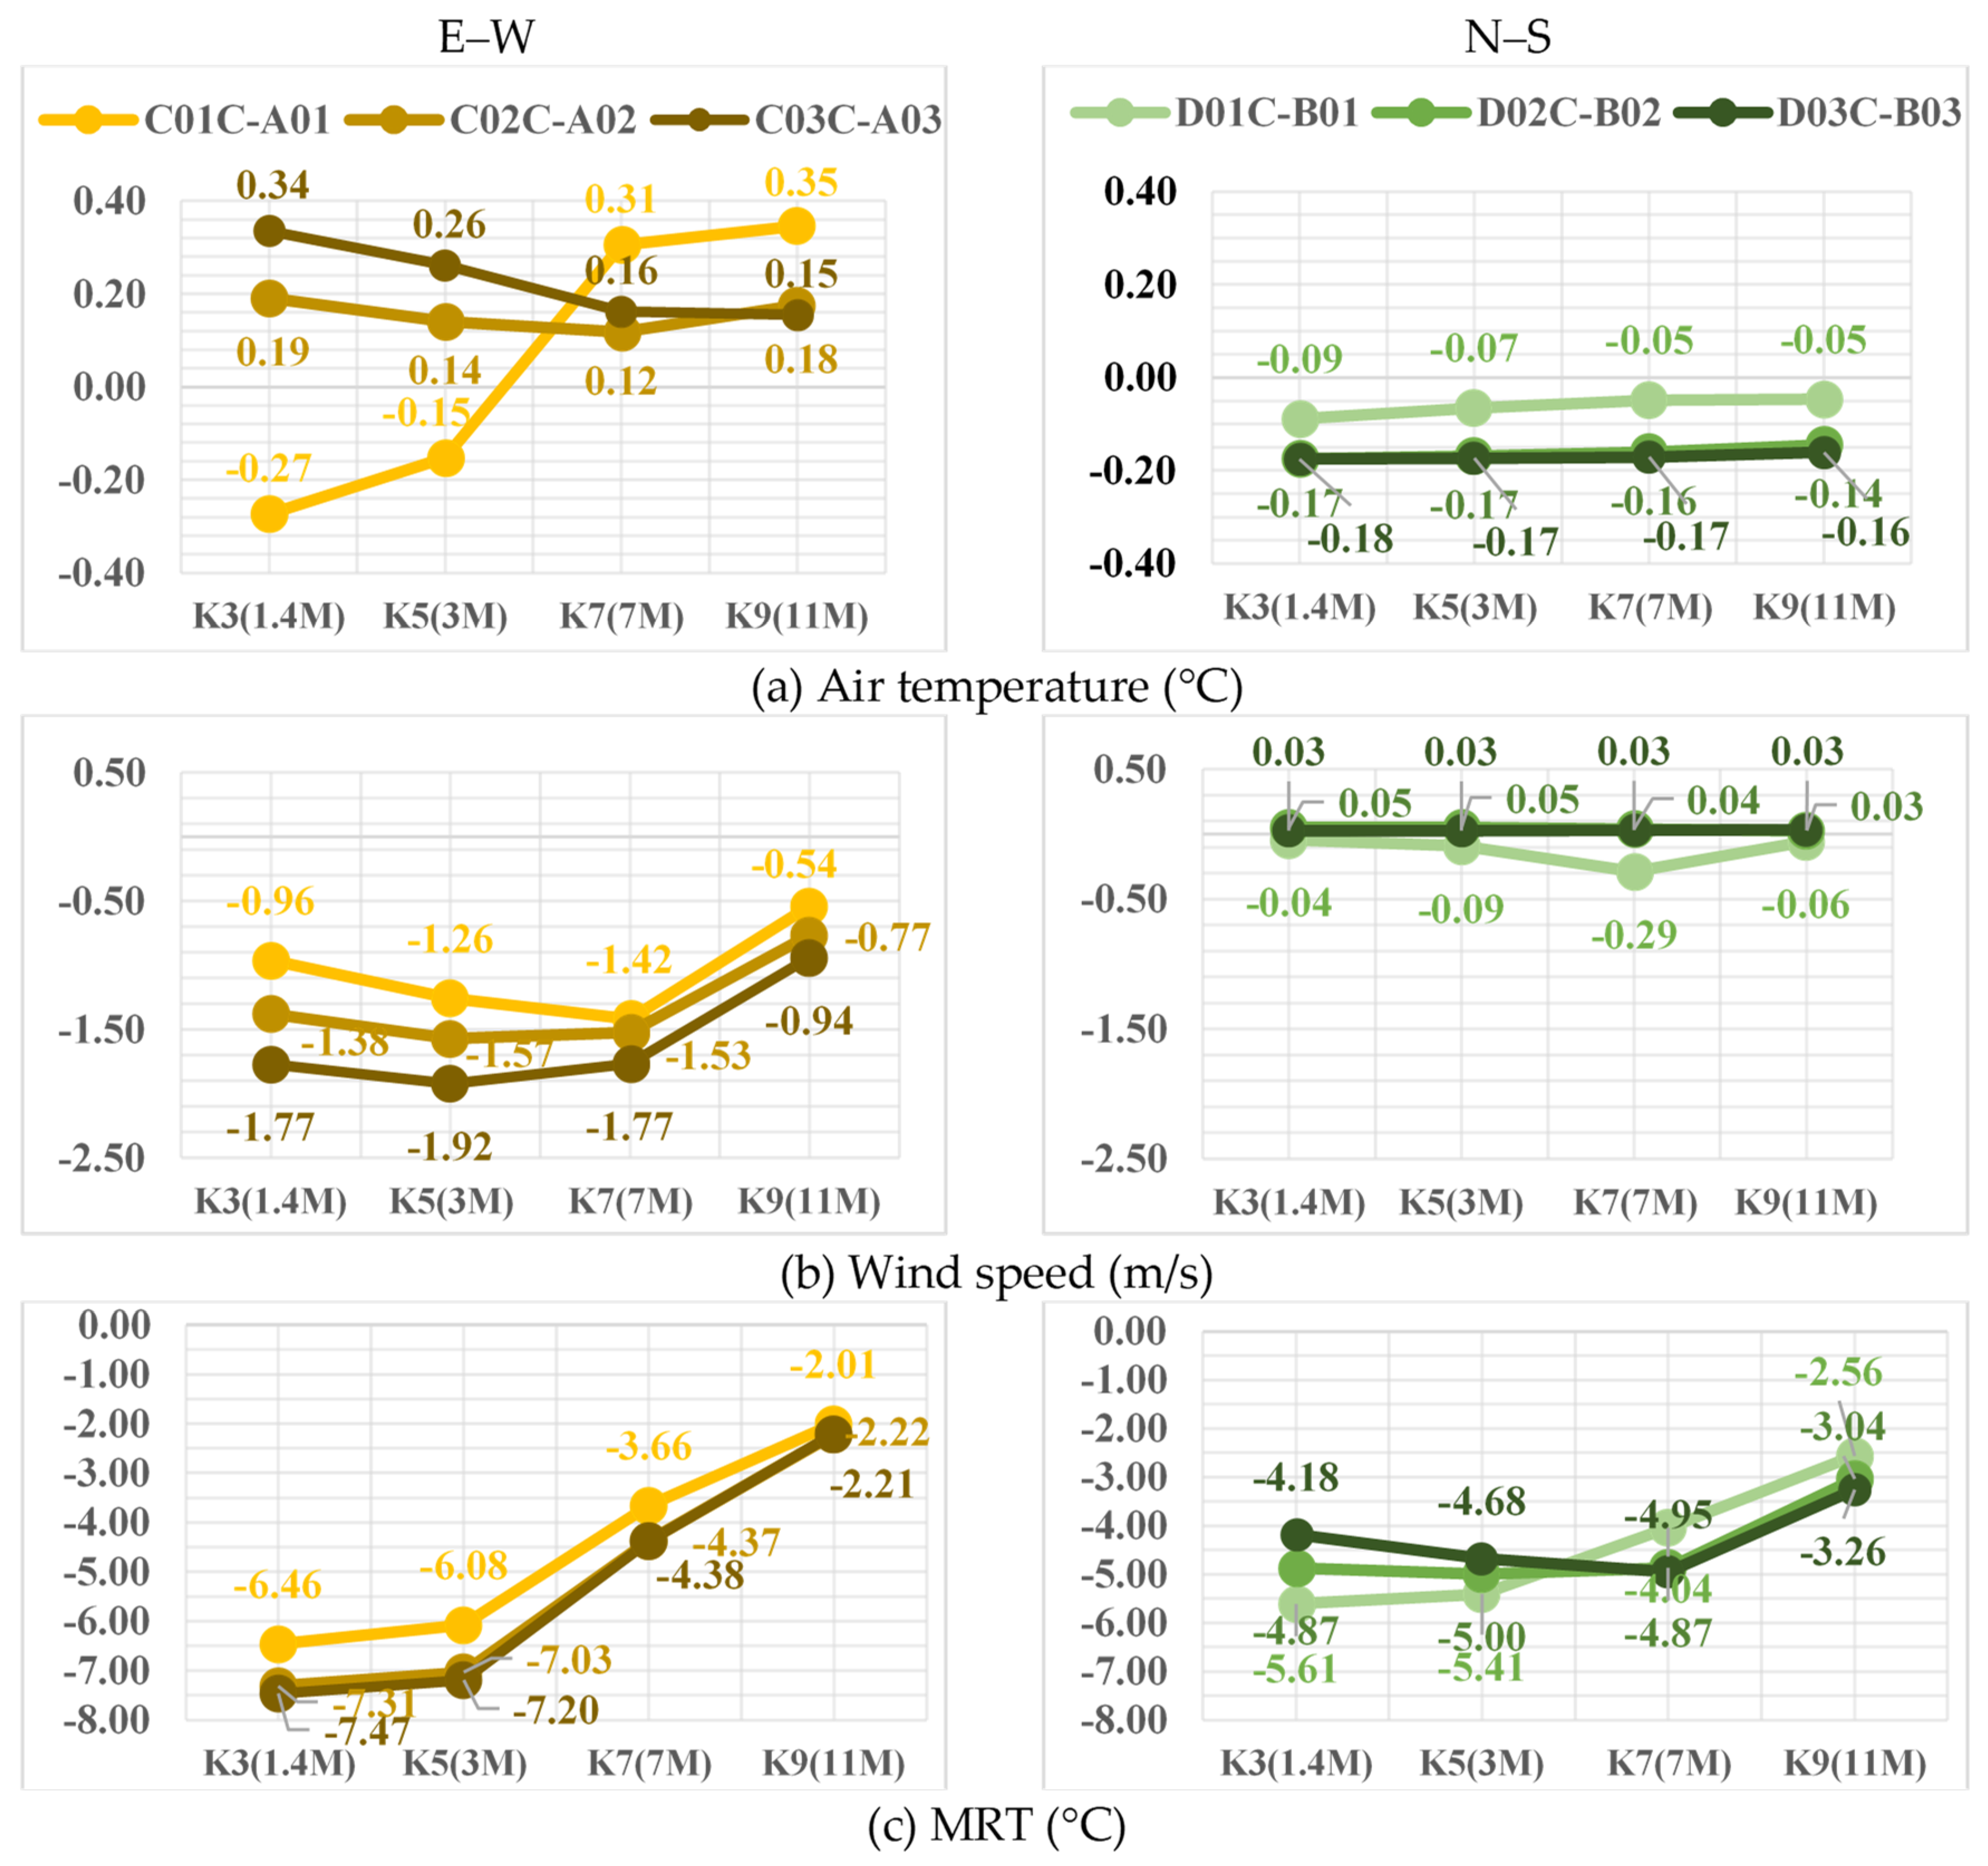
3.3. Analysis of the Effects of Schemes at Different Height Layers

3.3.1. Air Temperature Mitigation Effects and Wind Speed Changes

(1)
Air Temperature
The comparison results of the air temperature difference at different height layers are shown in Figure 9a. At the E–W orientation, the aspect ratios of 0.7 and 1.0 (C02C-A02, C03C-A03) witnessed similar trends, all of which were increases, and that air temperature increase effect was retarded with the increase of the height layer. However, the aspect ratio of 0.3 (C01C-A01) witnessed cooling near the surface layer, and the cooling effect retarded as the height increased, with the air temperature beginning to increase at the 7 m height layer.
At the N–S orientation, after planting roadside trees, there was a cooling effect at all levels, and the cooling effect changed little with the level. In addition, the difference between the aspect ratios of 0.7 and 1.0 (D02C-B02, D03C-B03) was very small, but the difference at an aspect ratio of 0.3 (D01C-B01) was relatively large, which can be lowered by about 0.1 °C on average. It is speculated that the possible reason was that when the aspect ratio was higher than 0.7, the increase in the height of the building resulted in additional shading effects.
(2)
Wind Speed
The comparison results of the wind speed difference at different height layers are shown in Figure 9b. The wind speed weakening effect of the E–W orientation schemes increased with the increase in height layers. When the aspect ratio was higher than 0.7 (C02C-A02, C01C-A01), the effect began to retard at the 7 m height layer, and for all schemes, the wind speed weakening effect at the 11 m height layer retarded and reached the minimum.
At the N–S orientation, the difference values of the three aspect ratio schemes were close and did not change much with height. Only the scheme with an aspect ratio of 0.3 (D01C-B01) had a slightly obvious wind speed weakening phenomenon at the 7 m height layer (−0.29 m/s).
It is speculated that the reason for this phenomenon was the different wind-shade environments at each level caused by the height of the tree canopies. At the E–W orientation, because the tree canopies were located at a height of 2~8 m, the wind speed at the levels was weakened. In addition, the wind speed gradually recovered at the height of 11 m (where there were no tree canopies). Among them, as for the street with an aspect ratio of 0.3, no matter what the orientation was, at the 7 m height level, because the tree canopies were higher than the buildings and had no building wall cover, the wind shade environment was different from those covered by the buildings at other height levels. This resulted in a particularly different wind speed change at this height level.

3.3.2. Analysis of the Effect of MRT

The comparison results of the MRT difference at different height layers are shown in Figure 9c. The reduction effect in the E–W orientation schemes decreased with the increase of the height layer, and the MRT reduction effect of the three aspect ratio schemes reached a minimum of about 2.0 °C at the 11 m height level.
The changing trends of the three aspect ratio schemes at the N–S orientation were not the same. The MRT reduction effect of the aspect ratio of 0.3 (D01C-B01) decreased as the height increased; meanwhile, the scheme at the aspect ratio of 0.7 (D02C-B02) had a slightly increased MRT reduction effect when the height increased to 3 m, compared to the near-surface (1.4 m). Furthermore, it was shown that the MRT reduction effect decreased as the height increased. The scheme at an aspect ratio of 1.0 (D03C-B03) increased the MRT reduction effect when the height increased to 7 m, but it also changed back to the MRT reduction effect when the height reached 11 m.

3.3.3. Analysis of the Effects of Comfort

(1)
SET
The comparison results of the SET difference at different height layers are shown in Figure 10a. In the E–W orientation schemes, the increasing effect of SET increased with the increase of the height layer, and at the 7 m height level, the increasing effect began to decrease when the aspect ratio was higher than 0.7 (C02C-A02, C03C-A03); meanwhile, as for the scheme with the aspect ratio of 0.3 at the 11 m height level, the decreasing effect appeared.
The trends in N–S orientation schemes were not the same. For the scheme with an aspect ratio of 0.3 (D01C-B01), when the height increased to 3 m, the SET reduction effect decreased and was close to zero, and the SET reduction effect increased as the height increased. Regarding the scheme with an aspect ratio of 0.7, (D02C-B02), when the height increased to 3 m, the MRT reduction effect increased slightly, while the SET reduction effect decreased with the height increase. For the scheme with an aspect ratio of 1.0 (D03C-B03), when the height increased to 7 m, the SET reduction effect increased, above which the SET reduction effect decreased as the height increased.
(2)
PET
Overall, the results of the two orientations of PET were similar to those of SET. The most different point was that the scheme with an aspect ratio of 0.3 at the N–S orientation (D01C-B01) and at the 7 m height layer (marked in a red circle in Figure 10b) decreased in comparison with the SET decreasing effect.

3.3.4. Analysis of the Effect of Absolute Humidity and Stomatal Transpiration

The comparison results of the absolute humidity difference at different height layers are shown in Figure 11a. Overall, there was almost no change between the 1.4 m and 3 m height layers for all of the schemes, regardless of the orientation, because the trees only had leaf transpiration above a height of 2 m, above which the absolute humidity decreased with the increase of the height layer.
Among them, the difference between the aspect ratios of 0.7 and 1.0 (C02C-A02, C03C-A03) of the E–W orientation scheme was very small and almost the same, but the difference at the aspect ratio of 0.3 (D01C-B01) was large, and the increase was about 0.5~0.8 g/kg. This should be caused by the effect of accumulating moisture on the ground layer due to the weakening of the wind speed (see Section 3.2.6) continuing at the height layers. The N–S orientation scheme had a tendency to increase the absolute humidity with the increase of the aspect ratio. The aspect ratio of 0.7 increased by about 0.6 g/kg in comparison with that of 0.3, and the aspect ratio of 1.0 increased by 0.2~0.3 g/kg in comparison with that of 0.7. This should also be caused by the effect of absolute humidity increasing continuously with the aspect ratio at the pedestrian height layer (see Section 3.2.6).
In addition, we conducted further analysis of the difference between stomatal transpiration at the three height layers (H = 3 m, 5 m, and 7 m) with tree crowns, as shown in Figure 11b. It can be found that except for the scheme of planting trees at the N–S orientation and the aspect ratio of 0.3 (D01C), the stomatal transpiration of the other schemes showed a quadratic trend line (R2 = 1) with the increase in height. Namely, the stomatal transpiration increased with height to a certain value. Thereafter, the stomatal transpiration would start to decrease even if the height increased. According to Huang’s (2009) research on the relationship between stomatal transpiration and meteorological factors, the stomatal transpiration of trees has a quadratic relationship with solar radiation. Namely, stomatal transpiration will reach its maximum at a certain radiation value [74], so it can be speculated that the difference in this height was mainly affected by the difference in solar radiation at different heights. For the tree planting scheme with an aspect ratio of 0.3 at the N–S orientation (D01C), the reason as to why stomatal transpiration can continue to increase at the 7 m height was also that the solar radiation at this height did not reach the radiation value of the maximum stomatal transpiration.

4. Discussion

4.1. Comparison with Previous Studies

4.1.1. Comparison with Similar Studies

In the past, some studies utilized ENVI-met simulation tools to discuss planting and street geometry [48,49,50,51]. However, due to the different sets of conditions, the results obtained are not the same, and the applicability is also different. For example, Ali-Toudert F. and Mayer H. (2007) used strip streets that had a street width of 8 m, aspect ratios of 1, 1.5, and 2.0, and E–W and N–S orientations and were located in Ghardaia (medium-sized city, 32.40° N) of the Algerian Sahara to conduct a simulation discussion. Although it was found that the cooling effect of the canopies was greatest at the N–W orientation with the greatest thermal discomfort [48], the results were different from those of this study. Chatzidimitrioua A. and Yannas S. (2017) also used actual streets, which had aspect ratios of 1.7, 3.2, and 3.0, E–W and N–S orientations, and the prevailing wind as a south–southwest wind (SSW), located in Thessaloniki (large city, latitude 40.5° N), to conduct a simulation. And found that the north side of the E–W orientation street, the east side, or both sides of the N–S orientation street, as well as both sides and the center of a very wide street, were effective tree locations for sunshade [49], similar to the results of this study. However, the results of PET in the summer that were better in the E–W orientation deep street (H/W = 3.2) than in the middle depth (H/W = 1.7) [49] were not the same as in this study.
In addition, Aboelata A. (2020) also used long streets that had a street aspect ratio of 1.0, two orientations (E–W, N–S), a planting size of 11 × 11 m (H × W), a prevailing wind orientation of N/WN, a wind speed of 1.8 m/s, and were located in Cairo (large city, 30.03° N) of Egypt to conduct a simulation [50]. The results obtained were compared with those of this study at H/W = 1, as shown in Table 8. The results found that there were similar trends in air temperature at the E–W orientation, as well as in wind and PET at the N–S orientation. But the trends in air temperature at the N–S orientation and in PET at the E–W orientation were different. Possible reasons include differences in the prevailing wind orientation, planting settings, latitude conditions of the case site (sun orientation), etc., so the results were not the same as in this study.
Korean scholar Wu J. et al. (2022) also used long streets located in Busan (a large city near the sea, 35°50′ N), which had settings on street widths of 24, 36, 48, and 60 m, aspect ratios of 0.5, 1.5, 2.5, and 3.5, four orientations (N–S, E–W, NE–SW, SW–NW), planting heights of 6, 9, 12, and 15 m, an SSW regional prevailing wind orientation, and a wind speed of 2.8 m/s, to discuss the simulation results of 32 schemes by statistical analysis of ANOVA [51]. It was found that street geometry had a greater impact on pedestrian microclimate and thermal comfort than tree configuration because shading from adjacent buildings prevented solar radiation from reaching artificial surfaces and provided better thermal comfort amongst pedestrians with deeper street canyons, reducing the importance of tree placement in the deep street canyons [51]. This was similar to the results in this study in the N–S orientation schemes. In addition, Wu J. et al.’s study also proposed that the order of importance of street factors in improving the thermal comfort of pedestrians in downtown Busan was HB/WS (aspect ratio) > WS (street width) > OS (orientation) > HT (tree height) > DT-T (distance between trees) > DB-T (distance between trees and buildings) > LAI. However, the results in this study tend to show that orientation was larger than the aspect ratio. The possible reason for the difference was that the research aspect ratio of Wu J. et al. (2022) only discussed a range higher than 0.5 without considering the low aspect ratio (0.3), and the prevailing wind orientation was SSW and the wind speed was 2.8 m/s, which were different from the west wind and 3.6 m/s in this study, so the results were not the same. In addition, the latitude of this region belongs to the mid-latitude region, and the solar radiation conditions in the tropical region of this study are different.

4.1.2. Comparison with Other Related Studies and Summary

From the above discussion, it can be found that the cooling benefits of roadside trees were highly regionalized, which was also consistent with the viewpoint proposed by Jamei E. et al.’s (2016) review of the benefits of roadside trees [47]. Moreover, because trees may have negative effects due to a reduction in wind speed or the relationship between the sun’s position and buildings or tree canopies, the relationship between orientation, the sun’s position, and the prevailing wind direction in an area is very important. Therefore, it is suggested that these basic conditions of the research area be clearly stated in future research so that the research results can be easily applied. Finally, this study also found that high humidity and reduced ventilation below the canopies may adversely affect the thermal conditions in deeper canyons, which is consistent with the results of the literature review by Jamei E. et al. (2016) [47]. Therefore, when arranging roadside trees, it is necessary to consider the height of the bottom and the shape of the canopies.
In summary, it is suggested that future research should present data including background meteorological conditions (latitude/solar radiation, prevailing wind orientation, and wind speed) of the study area and basic information about trees, such as tree shape, canopy width, thickness, and height of the bottom, as well as LAD, so that the research results of different regions can be compared more accurately. Moreover, regional background climate conditions, tree characteristics, and street geometry have a mutual effect on the thermal environment of roadside trees in streets. Therefore, it is suggested that future research could focus on comprehensive comparison studies on streets that have different background climate conditions (such as the tropical/subtropical seaside, tropical/subtropical inland/basin areas), tree characteristics (such as LAD, shapes, canopy-bottom-height), and widths to serve as a reference more broadly for street planning and design in similar areas.

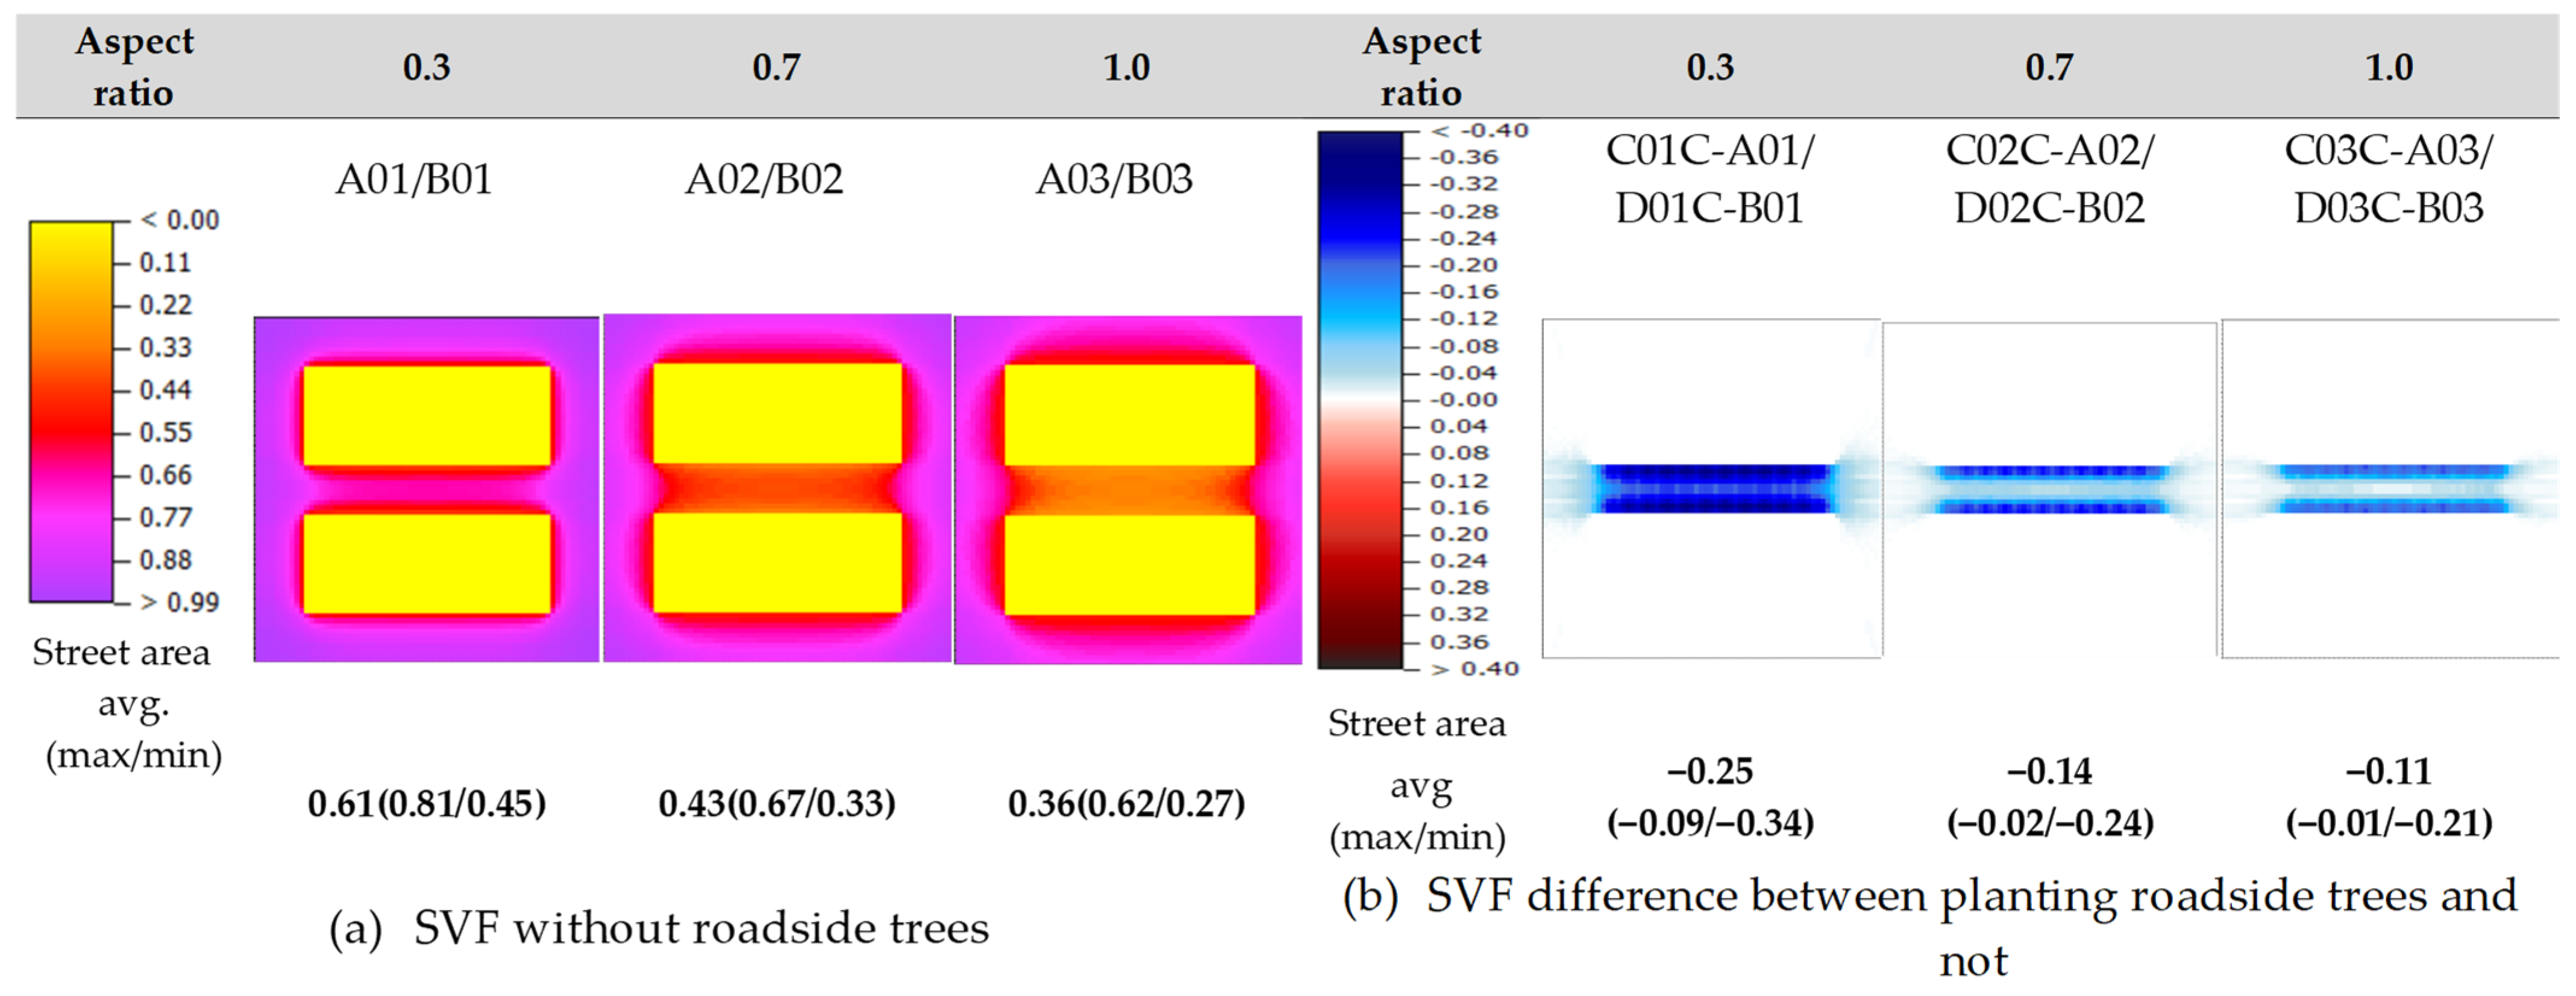
4.2. Extended Application of the Aspect Ratio—SVF

In order to compare the research results of this study in terms of aspect ratio with those of other studies on the street thermal environment, using SVF as an indicator, this study further used ENVI-met to analyze its SVF, and the results are shown in Figure 12. It can be seen that the SVF of street canyons without roadside trees planted in the street with aspect ratios of 0.3, 0.7, and 1.0 at the ground layer (H = 0 m) produced average values of 0.61, 0.43, and 0.36, respectively. However, the SVF values of the street with roadside trees were reduced by 0.25, 0.14, and 0.11 on average at an aspect ratio of 0.3, 0.7, and 1.0, respectively, compared with the original streets. This means that after roadside trees were planted, the SVF would decrease no matter what the aspect ratio was, and the higher the aspect ratio of the street, the smaller the reduction effect of the SVF value caused by planting.

4.3. Suggestions for Street Design in Tropical, Medium-Sized Cities with Climatic Significance

When street design considers the microclimate environment, the main key factors are the influence of solar radiation and the prevailing wind, and the main purpose is to ensure the minimum amount of solar radiation and airflow in the summer. In this research case, because the west sea wind prevails in summer afternoons in the area, the E–W orientation streets had the advantage of being able to introduce the prevailing wind, but the effect of shading solar radiation was not good. The advantage of the N–S orientation was the opposite. It can shade solar radiation well, but it cannot introduce the prevailing west sea wind in summer afternoons.
To improve these problems, it is recommended that the following factors and design strategies be considered in the design of urban streets:
(1)
As for the geographical location, if the case object is a coastal city, there will be strong prevailing sea winds during the day in the summer. Therefore, the orientation of the street should first be parallel to the prevailing wind orientation of the sea wind so as to introduce a cool sea wind and reduce the daytime UHI in the summer.
(2)
For streets whose orientation is parallel to the prevailing wind in the area (this research was at an E–W orientation), when planting roadside trees, it is necessary to avoid the wind speed slowing effect produced by canopies, which would cause heat to be difficult to remove, resulting in the negative effect of an increase in air temperature and thermal comfort. In addition, this phenomenon became more obvious as the aspect ratio increased. The methods that can be considered are for the selection of the tree shape, the height of the bottom of canopies, etc. to improve, especially for streets with an aspect ratio higher than 0.7.
(3)
For streets facing perpendicular to the prevailing wind orientation in the area (N–S orientation in this study), the wind shading effect of buildings became very important. Even if it were easier for the prevailing wind to enter the street and the aspect ratio were small (0.3), there was still a weak wind area in the upwind street. Therefore, no matter what the aspect ratio of the street is, the ladder type that lowers the height of the building to the street could improve this phenomenon, avoid the wind speed lowering at the upwind, and enter the street area along the building form, but care must be taken to avoid reducing excessive building shade. In addition, if consideration is not given to changing the shading environment of buildings, it is suggested that the length of the street be shortened so that it can have E–W openings and increase the introduction of parallel prevailing winds.

4.4. Limitations of the Results

This study used the ENVI-met simulate tool to explore the synergistic effects of tree species and spatial geometry on the thermal environment in urban streets. Some limitations should be addressed to help understand the results. There are two major limitations in this study that could be addressed in future research. First, because this study focused on the road width of 20 m under the synergistic influence of the same street geometry and tree species, whether the results will be different when the width of the street becomes wider or narrower remains to be clarified by future studies. Second, Although Bauhinia (Bauhinia × blakeana) (ellipse, LAD = 0.6) was selected as a representative tree species for analysis in this study, due to the planting of different tree species, there will be differences in tree shape and LAD, so the synergistic effect may also be different. Therefore, it is suggested that future research can discuss and analyze several representative tree species with different tree shapes and LADs.

5. Conclusions

This study utilized Chiayi City, a tropical, medium-sized city in Taiwan, as the research object, used Chiayi City’s common roadside tree species Bauhinia as an example, and used CFD simulation software ENVI-met to set the representative street types and background climate conditions of Chiayi City to discuss the street thermal environment of six different geometric types with or without planting roadside trees and to comprehensively compare and analyze the influence of planting and street geometric characteristics on the street microclimate, comfort, etc. The important conclusions obtained are as follows:
Influence at the pedestrian level (H = 1.4 m):
(1)
After planting roadside trees, the N–S orientation produced a slight cooling effect (−0.09~−0.18 °C) regardless of the aspect ratio; meanwhile, the E–W orientation had the largest cooling effect at the aspect ratio of 0.3, but as the aspect ratio increased, it became a warming effect, and as the aspect ratio further increased, this warming effect also increased.
(2)
The overall average wind speed in the E–W orientation decreased by 1~2 m/s. For the N–S orientation schemes, except that the street with an aspect ratio of 0.3 had wind speed weakening in the central area of the street, there was no obvious change in wind speed in the street area of the other schemes.
(3)
On the whole, regarding MRT, all of the schemes had an MRT reduction effect, and the MRT reduction effect of the E–W orientation was greater than that of the N–S orientation, and the average difference between the two orientations was about 0.8~3.2 °C.
(4)
As for the SET results of comfort, after planting roadside trees at the E–W orientation, the effect of weakening the wind speed due to the tree canopy was obvious, resulting in an increase in SET, but the N–S orientation had the effect of decreasing. Meanwhile, the results of comfort PET were similar to those of SET, and the causes and mechanisms were also similar.
(5)
Regarding the absolute humidity results, all schemes increased humidity, and the E–W orientation increased humidity by 0.11 g/kg in comparison with the N–S orientation schemes, and no matter what the orientation was, there was a tendency to increase with the increase of the aspect ratio.
In terms of the vertical-level changes:
(1)
In terms of temperature, it was found that at the E–W orientation, the schemes with aspect ratios of 0.7 and 1.0 increased, and the warming effect was retarded as the height level increased. The scheme with an aspect ratio of 0.3 decreased near the ground and retarded the cooling effect as the height level increased. The N–S orientation schemes had a cooling effect for each height layer, and the cooling effect varied little with the height layer.
(2)
In terms of wind speed, it was found that the wind speed weakening effect of the E–W orientation schemes increased with the increase of the height layer, but the schemes with an aspect ratio higher than 0.7 began to retard at the 7 m height level. At the N–S orientation, the difference values of the three aspect ratio schemes were close and did not change much with height. Only the scheme with an aspect ratio of 0.3 had a slightly obvious wind speed weakening phenomenon at the 7 m height layer (−0.29 m/s).
(3)
In terms of MRT, it was found that the reduction effect of the E–W orientation decreased with the increase of the height layer, and the MRT reduction effect of the three aspect ratio schemes reached a minimum of about 2.0 °C at the 11 m height layer. The changing trends of the three aspect ratio schemes from N–S were not the same.
(4)
In terms of the SET of comfort, in the E–W orientation schemes, the increasing effect of SET increased with the increase of the height layer, and at the 7 m height level, the increasing effect began to decrease when the aspect ratio was higher than 0.7; meanwhile, as for the scheme with the aspect ratio of 0.3 at the 11 m height level, the decreasing effect appeared. The trends in N–S orientation schemes were not the same. Overall, the results of the two orientations of PET were similar to those of SET.
(5)
In terms of absolute humidity, overall, there was almost no change between the 1.4 m and 3 m height layers for all of the schemes, regardless of the orientation. Moreover, regardless of the orientation, the changes in height between the aspect ratios continued the differences in the ground layer. However, the variation of plant stomatal transpiration in height was significantly affected by the solar radiation of its location.
The street design strategies in tropical, medium-sized cities in the future should consider that street orientation should be prioritized to be parallel to the prevailing wind orientation of the cool source. When planting roadside trees in a street orientation parallel to the prevailing wind direction of the area, it is necessary to avoid the wind speed slowing effect produced by tree canopies. The improvement methods are for the selection of tree shapes, the height of the bottom of the canopy, etc., to improve, especially for streets with an aspect ratio higher than 0.7. On streets whose orientation is perpendicular to the prevailing wind orientation of the area, the windshield effect of buildings is obvious. Therefore, the building form can be improved so as to prevent the wind speed from being blocked in the upwind area and not entering the streets, but attention must be paid to avoiding reducing excessive building shading.

Author Contributions

Conceptualization, J.-M.H.; methodology, J.-M.H.; software, J.-M.H. and L.-C.C.; validation, J.-M.H. and L.-C.C.; data analysis, J.-M.H. and L.-C.C.; writing—original draft preparation, J.-M.H. and L.-C.C.; writing—review and editing, J.-M.H.; visualization, J.-M.H. and L.-C.C.; supervision, J.-M.H.; project administration, J.-M.H.; funding acquisition, J.-M.H. All authors have read and agreed to the published version of the manuscript.

Funding

This research was funded by the National Science and Technology Council, Taiwan, grant No. MOST 111-2221-E-415-002.

Data Availability Statement

Data is contained within the article.

Conflicts of Interest

The authors declare no conflict of interest.

References

  1. United Nations. AR6 Synthesis Report: Climate Change 2023. The Intergovernmental Panel on Climate Change. Available online: https://www.ipcc.ch/report/sixth-assessment-report-cycle/ (accessed on 2 May 2023).
  2. United Nations. World Urbanization Prospects 2018. UN Population Division. Available online: https://www.un.org/en/development/desa/population/index.asp (accessed on 2 May 2023).
  3. Oke, T.R. The energetic basis of urban heat island. Q. J. R. Meteorol. Soc. 1982, 108, 1–24. [Google Scholar] [CrossRef]
  4. Oke, T.R. Boundary Layer Climates, 2nd ed.; Routledge: London, UK, 1987. [Google Scholar]
  5. Bridgman, H.; Warner, R.; Dodson, J. Urban Biophysical Environments; Oxford University Press: Oxford, UK, 1995. [Google Scholar]
  6. Brown, R.D.; Terry, J.G. Microclimatic Landscape Design: Creating Thermal Comfort and Energy Efficiency; John Wiley & Sons, Inc.: New York, NY, USA, 1995. [Google Scholar]
  7. Givoni, B. Climate Consideration in Building and Urban Design; Van Nostrand Reinhold: New York, NY, USA, 1997. [Google Scholar]
  8. Akbari, H.; Davis, S.; Dorsano, S.; Huang, J.; Winnett, S. (Eds.) Cooling Our Communities: A Guidebook on Tree Planting and Light-Colored Surfacing; U.S. Environmental Protection Agency, Office of Policy Analysis, Climate Change Division: Berkeley, CA, USA, 1992; p. 221. [Google Scholar]
  9. Lowry, W.P. Atmosphere Ecology for Designers and Planners; Peavine Publications: McMinnville, OR, USA, 1988; p. 435. [Google Scholar]
  10. Liu, X.; He, J.; Xiong, K.; Liu, S.; He, B.-J. Identification of factors affecting public willingness to pay for heat mitigation and adaptation: Evidence from Guangzhou, China. Urban Clim. 2023, 48, 101405. [Google Scholar] [CrossRef]
  11. Liu, S.; Wang, Y.; Liu, X.; Yang, L.; Zhang, Y.; He, J. How does future climatic uncertainty affect multi-objective building energy retrofit decisions? Evidence from residential buildings in subtropical Hong Kong. Sustain. Cities Soc. 2023, 92, 104482. [Google Scholar]
  12. Kotharkar, R.; Ramesh, A.; Bagade, A. Urban heat island studies in South Asia: A critical review. Urban Clim. 2018, 24, 1011–1026. [Google Scholar] [CrossRef]
  13. Santamouris, M. Analyzing the heat island magnitude and characteristics in one hundred. Sci. Total Environ. 2015, 512–513, 582–598. [Google Scholar] [CrossRef]
  14. Lin, H.T.; Lee, K.P.; Chen, K.T.; Lin, L.J.; Kuo, H.C.; Chen, T.C. Experimental analyses of urban heat island effects of the four metropolitan cities in Taiwan (Ⅰ)—The comparison of the heat island intensities between Taiwan and the world cities. J. Archit. 1999, 31, 51–73. (In Chinese) [Google Scholar]
  15. Sun, C.Y.; Jian, Z.X. Heat island effect of Taipei metropolitan area. City Plan. 2016, 43, 437–462. (In Chinese) [Google Scholar]
  16. Arifwidodoa, S.D.; Tanakab, T. The characteristics of urban heat island in Bangkok, Thailand. Procedia Soc. Behav. Sci. 2015, 195, 423–428. [Google Scholar]
  17. Henderson, V. Medium size cities. Reg. Sci. Urban Eco. 1997, 27, 583–612. [Google Scholar]
  18. Busato, F.; Lazzarin, R.M.; Noro, M. Three years of study of the urban heat island in Padua: Experimental results. Sustain. Cities Soc. 2014, 10, 251–258. [Google Scholar] [CrossRef]
  19. Rajagopalan, P.; Lim, K.C.; Jamei, E. Urban heat island and wind flow characteristics of a tropical city. Sol. Energy 2014, 107, 159–170. [Google Scholar] [CrossRef]
  20. Huang, J.-M.; Chang, H.-Y.; Wang, Y.-S. Spatiotemporal changes in the built environment characteristics and urban heat island effect in a medium-sized city, Chiayi city, Taiwan. Sustainability 2020, 12, 365. [Google Scholar] [CrossRef]
  21. Sakakibara, Y. A numerical study of the effect of urban geometry upon the surface energy budget. Atmos. Environ. 1996, 30, 487–496. [Google Scholar] [CrossRef]
  22. Santamouris, M. Energy and Climate in the Urban Built Environment; Routledge: London, UK; New York, NY, USA, 2013. [Google Scholar]
  23. Oke, T.R. Street design and urban canopy layer climate. Energy Build. 1988, 11, 103–113. [Google Scholar] [CrossRef]
  24. Boldes, U.; Colman, J. About some aspects of the wake flow of a small cypress tree, in a free stream with a power law mean velocity distribution. J. Wind Eng. Ind. Aerodyn. 1996, 61, 25–50. [Google Scholar] [CrossRef]
  25. Blocken, B.; Stathopoulos, T. CFD simulation of pedestrian-level wind conditions around buildings: Past achievements and prospects. J. Wind Eng. Ind. Aerodyn. 2013, 121, 138–145. [Google Scholar]
  26. Sanaieian, H.; Tenpierik, M.; Van Den Linden, K.; Seraj, F.M.; Shemrani, S.M.M. Review of the impact of urban block form on thermal performance, solar access and ventilation. Renew. Sustain. Energy Rev. 2014, 38, 551–560. [Google Scholar]
  27. Golany, G.S. Urban design morphology and thermal performance. Atmos. Environ. 1996, 30, 455–465. [Google Scholar] [CrossRef]
  28. Gago, E.J.; Roldan, J.; Pacheco-Torres, R.; Ordóñez, J. The city and urban heat islands: A review of strategies to mitigate adverse effects. Renew. Sustain. Energy Rev. 2013, 25, 749–758. [Google Scholar] [CrossRef]
  29. Vailshery, L.S.; Jaganmohan, M.; Nagendra, H. Effect of street trees on micro-climate and air pollution in a tropical city. Urban For. Urban Green. 2013, 12, 408–415. [Google Scholar] [CrossRef]
  30. Ng, E.; Chen, L.; Wang, Y.; Yuan, C. A study on the cooling effects of greening in a high-density city: An experience from Hong Kong. Build. Environ. 2012, 47, 256–271. [Google Scholar] [CrossRef]
  31. Saito, I.; Ishihara, O.; Katayama, T. Study of the effect of green areas on the thermal environment in an urban area. Energy Build. 1991, 15, 493–498. [Google Scholar] [CrossRef]
  32. Spangenberg, J.; Shinzato, P.; Johansson, E.; Duarte, D. Simulation of the influence of vegetation on microclimate and thermal comfort in the city of São Paulo. Rev. Soc. Bras. Arborização Urbana 2008, 3, 1–19. [Google Scholar] [CrossRef]
  33. Ali-Toudert, F.; Mayer, H. Numerical study on the effects of aspect ratio and orientation of an urban street canyon on outdoor thermal comfort in hot and dry climate. Build Environ. 2006, 41, 94–108. [Google Scholar] [CrossRef]
  34. Nasrollahi, N.; Namazi, Y.; Taleghani, M. The effect of urban shading and canyon geometry on outdoor thermal comfort in hot climates: A case study of Ahvaz, Iran. Sustain. Cities Soc. 2021, 65, 102638. [Google Scholar] [CrossRef]
  35. Erell, E.; Pearlmutter, D.; Williamson, T. Urban Microclimate: Designing the Spaces between Buildings; Routledge: London, UK, 2011; p. 266. [Google Scholar]
  36. Lin, P.; Gou, Z.; Lau, S.S.-Y.; Qin, H. The impact of urban design descriptors on outdoor thermal environment: A literature review. Energies 2017, 10, 2151. [Google Scholar] [CrossRef]
  37. Stewart, I.D.; Oke, T.R. Local climate zones for urban temperature studies. Bull. Am. Meteorol. Soc. 2012, 93, 1879–1900. [Google Scholar] [CrossRef]
  38. Yuan, C.; Chen, L. Mitigating urban heat island effects in high-density cities based on sky view factor and urban morphological understanding: A study of Hong Kong. Arch. Sci. Rev. 2011, 54, 305–315. [Google Scholar] [CrossRef]
  39. Lin, T.-P.; Matzarakis, A.; Hwang, R.-L. Shading effect on long-term outdoor thermal comfort. Build Environ. 2010, 45, 213–221. [Google Scholar] [CrossRef]
  40. Yang, F.; Qian, F.; Lau, S.S. Urban form and density as indicators for summer time outdoor ventilation potential: A case study on high-rise housing in Shanghai. Build Environ. 2013, 70, 122–137. [Google Scholar] [CrossRef]
  41. Nunez, M.; Oke, T.R. The Energy Balance of an Urban Canyon. J. Appl. Meteorol. 1977, 16, 11–19. [Google Scholar] [CrossRef]
  42. Givoni, B. Urban Design in Different Climates; WMO/TD-No. 346; World Meteorological Organlzation: Geneva, Switzerland, 1989. [Google Scholar]
  43. Johansson, E. Influence of urban geometry on outdoor thermal comfort in a hot dry climate: A study in Fez, Morocco. Build Environ. 2006, 41, 1326–1338. [Google Scholar] [CrossRef]
  44. Ali-Toudert, F. Dependence of Outdoor Thermal Comfort on Street Design in Hot and Dry Climate; Freiburg University: Freiburg, Germany, 2005; p. 224. [Google Scholar]
  45. Taleghani, M.; Kleerekoper, L.; Tenpierik, M.; Van Den Dobbelsteen, A. Outdoor thermal comfort within five different urban forms in the Netherlands. Build. Environ. 2015, 83, 65–78. [Google Scholar] [CrossRef]
  46. Krüger, E.; Pearlmutter, D.; Rasia, F. Evaluating the impact of canyon geometry and orientation on cooling loads in a high-mass building in a hot dry environment. Appl. Energy 2010, 87, 2068–2078. [Google Scholar] [CrossRef]
  47. Jamei, E.; Rajagopalan, P.; Seyedmahmoudian, M.; Jamei, Y. Review on the impact of urban geometry and pedestrian level greening on outdoor thermal comfort. Renew. Sustain. Energy Rev. 2016, 54, 1002–1017. [Google Scholar] [CrossRef]
  48. Ali-Toudert, F.; Mayer, H. Effects of asymmetry, galleries, overhanging facades and vegetation on thermal comfort in urban street canyons. Sol. Energy 2007, 81, 742–754. [Google Scholar] [CrossRef]
  49. Chatzidimitriou, A.; Yannas, S. Street canyon design and improvement potential for urban open spaces; the influence of canyon aspect ratio and orientation on microclimate and outdoor comfort. Sustain. Cities Soc. 2017, 33, 85–101. [Google Scholar] [CrossRef]
  50. Aboelata, A. Vegetation in different street orientations of aspect ratio (H/W 1:1) to mitigate UHI and reduce buildings’ energy in arid climate. Build. Environ. 2020, 172, 106712. [Google Scholar] [CrossRef]
  51. Wu, J.; Chang, H.; Yoon, S. Numerical study on microclimate and outdoor thermal comfort of street canyon typology in extremely hot weather—A case study of busan, south korea. Atmosphere 2022, 13, 307. [Google Scholar] [CrossRef]
  52. Emmanuel, R.; Johansson, E. Influence of urban morphology and sea breeze on hot humid microclimate: The case of Colombo, Sri Lanka. Clim. Res. 2006, 30, 189–200. [Google Scholar] [CrossRef]
  53. Taiwan Central Weather Bureau. Available online: https://www.cwb.gov.tw/eng/ (accessed on 10 October 2022).
  54. Huang, J.-M. Final Report: Research on Urban Space Character for Improving the Urban Heat Island Effect; Special topic category project; National Science and Technology Council: Taipei, Taiwan, 2022. (In Chinese) [Google Scholar]
  55. Chen, P.-Y.; Huang, J.-M.; Chang, K.-W.; Yue, C.-D. Achievement Report of the Planting and Landscape Research Project in Chiayi City; Economic Affairs Department, Chiayi City Government: Chiayi City, Taiwan, 2018; p. 282. (In Chinese) [Google Scholar]
  56. Streets and Green Plants in Chiayi City. Economic Affairs Department, Chiayi City Government. Available online: https://economic.chiayi.gov.tw/cp.aspx?n=1039 (accessed on 14 August 2022). (In Chinese)
  57. Bruse, M.; Fleer, H. Simulating surface-plant-air interactions inside urban environments with a three dimensional numerical model. Environ. Model. Softw. 1998, 13, 373–384. [Google Scholar] [CrossRef]
  58. Huttner, S. Further Develop and Application of the 3D Microclimate Simulation ENVI-met. Ph.D. Thesis, Johannes Gutenberg-University, Mainz, Germany, 26 April 2012; p. 147. [Google Scholar]
  59. Hu, T.; Yoshie, R. Indices to evaluate ventilation efficiency in newly-built urban area at pedestrian level. J. Wind Eng. Ind. Aerodyn. 2013, 112, 39–51. [Google Scholar] [CrossRef]
  60. Lan, Y.; Zhan, Q. How do urban buildings impact summer air temperature? The effects of building configurations in space and time. Build. Environ. 2017, 125, 88–98. [Google Scholar] [CrossRef]
  61. Rui, L.; Buccolieri, R.; Gao, Z.; Ding, W.; Shen, J. The impact of green space layouts on microclimate and air quality in residential districts of Nanjing, China. Forests 2018, 9, 224. [Google Scholar] [CrossRef]
  62. Tsoka, S.; Tsikaloudaki, A.; Theodosiou, T. Analyzing the ENVI-met microclimate model’s performance and assessing cool materials and urban vegetation applications–A review. Sustain. Cities Soc. 2018, 43, 55–76. [Google Scholar] [CrossRef]
  63. Liu, Z.; Zheng, S.; Zhao, L. Evaluation of the ENVI-met vegetation model of four common tree species in a subtropical hot-humid area. Atmosphere 2018, 9, 198. [Google Scholar] [CrossRef]
  64. Liu, Z.; Brown, R.D.; Zheng, S.; Jiang, Y.; Zhao, L. An in-depth analysis of the effect of trees on human energy fluxes. Urban For. Urban Green. 2020, 50, 126646. [Google Scholar] [CrossRef]
  65. Rijal, H.B.; Humphreys, M.A.; Nicol, J.F. Adaptive model and the adaptive mechanisms for thermal comfort in Japanese dwellings. Energy Build. 2019, 202, 109371. [Google Scholar] [CrossRef]
  66. Gagge, A.P.; Fobelets, A.P.; Berglund, P.E. A standard predictive index of human response to the thermal environment. ASHRAE Trans. 1986, 92, 709–731. [Google Scholar]
  67. Höppe, P. The physiological equivalent temperature—A universal index for the biometeorological assessment of the thermal environment. Int. J. Biometeorol. 1999, 43, 71–75. [Google Scholar] [CrossRef]
  68. Ooka, R. Recent development of assessment tools for urban climate and heat-island investigation especially based on experiences in Japan. Int. J. Climatol. 2007, 27, 1919–1930. [Google Scholar] [CrossRef]
  69. Huang, J.-M.; Ooka, R.; Okada, A.; Omori, T.; Huang, H. The effect of the urban heat island mitigation strategies on outdoor thermal environment in Tokyo central city-numerical simulation. In Proceedings of the 7th Asia-Pacific Conference on Wind Engineering, Taipei, Taiwan, 8–12 November 2009. [Google Scholar]
  70. Huang, J.-M.; Chen, L.-C. A Numerical Study on Mitigation Strategies of Urban Heat Islands in a Tropic Megacity: A Case Study in Kaohsiung City, Taiwan. Sustainability 2020, 12, 3952. [Google Scholar] [CrossRef]
  71. Lin, T.P.; Ho, Y.F.; Huang, Y.S. Seasonal effect of pavement on outdoor thermal environments in subtropical Taiwan. Build. Environ. 2007, 42, 4124–4131. [Google Scholar] [CrossRef]
  72. Klok, L.; Zwart, S.; Verhagen, H.; Mauric, E. The surface heat island of Rotterdam and its relationship with urban surface characteristics. Resour. Conserv. Recycl. 2012, 64, 23–29. [Google Scholar] [CrossRef]
  73. Mathew, A.; Khandelwal, S.; Kaul, N. Analysis of diurnal surface temperature variations for the assessment of surface urban heat island effect over Indian cities. Energy Build. 2018, 159, 271–295. [Google Scholar] [CrossRef]
  74. Huang, J.-M.; Ooka, R. The study on the vegetation transpiration models of a roadside tree by a field experiment. J. Environ. Eng. (Trans. AIJ) 2011, 76, 177–183. (In Japanese) [Google Scholar] [CrossRef]
Figure 1. Aerial photo of Chiayi City (data source: Google Earth). (a) Terrain and distance from the sea. (b) Aerial photo of Chiayi City.
Buildings 13 02092 g001
Figure 2. Schematic diagram of 3D models of each simulation scheme.
Buildings 13 02092 g002
Figure 3. Schematic diagram of the vertical layer of the street space and street range for statistics. (a) Vertical layer of the street space. (b) Street range for statistics (The black dotted line area).
Buildings 13 02092 g003
Figure 4. Surface temperature results of various schemes with or without roadside trees planted on the street.
Buildings 13 02092 g004
Figure 5. Air temperature simulation results of various schemes with or without roadside trees planted on the street.
Buildings 13 02092 g005
Figure 6. The difference between each thermal item with or without roadside trees planted on the street.
Buildings 13 02092 g006
Figure 7. The difference result chart between (a) SET and (b) PET for the comfort level of whether there were roadside trees planted on the street.
Buildings 13 02092 g007
Figure 8. The difference result chart between absolute humidity and stomatal evapotranspiration of whether there were trees planted on the streets.
Buildings 13 02092 g008
Figure 9. Changes of (a) air temperature, (b) wind speed, and (c) MRT difference at different heights with or without roadside trees planted on the street.
Buildings 13 02092 g009
Figure 10. Changes of (a) SET and (b) PET differences at different height layers with or without roadside trees planted on the street.
Buildings 13 02092 g010
Figure 11. Differences of (a) absolute humidity and (b) stomatal evapotranspiration at different height layers with or without roadside trees planted on the street.
Buildings 13 02092 g011
Figure 12. Difference result graph on (a) SVF without roadside trees and (b) SVF difference with or without planting roadside trees.
Buildings 13 02092 g012
Table 1. Main road width and building height ratio in Chiayi City (Data from [54,55]).
Floor1 F2~4 F5 F6~14 F>15 FRoad Width (m)15202530>40
Ratio (%)40.5748.635.065.430.31Ratio (%)1734171417
Table 2. Geolocation and space setting of ENVI-met.
Geolocation Setting
Place nameChiayi CityLongitude (−W, +E)120.45°
Time zone nameTaipei Standard TimeLatitude (−S, +N)23.48°
Time zone120.00 (CET/UTC+8)
Space setting
Simulation area size (m)140 × 140 × 200Road width (m)20
Grid number70 × 70 × 100Sidewalk width (m)2
Building size (m)40 × 100Planting distance (m)6
Grid size (m)2 × 2 × 2Planting coverage (%)43
Table 3. Setting of the initial meteorological environment.
Date2020.07.13Barometric Pressure (hPa)1005.2Roughness0.1
Air temperature
(°C)
(Min: 26.5 (6:00)
(Max: 36.4 (14:00)
Wind speed
(m/s)
3.6Start time0:00
Relative humidity (%)Min: 46 (16:00)
Max: 84 (6:00)
Wind orientation (360°)270Simulation time (h)48
Table 4. Setting of the basic value of the roadside tree (The tree shape shown in the table is the actual shape in the CFD simulation).
Name
(Scientific Name)
Tree Shape (Ellipse)SizeLAD
HeightWidthCanopy Base Height
Bauhinia
(Bauhinia × blakeana)
Buildings 13 02092 i0018 m6 m2 m0.6
Table 5. Settings of the basic values of BIOMET.
Age35Clothing0.3 clo
GenderMaleTotal metabolic rate (MET)3
Height (cm)1.75
Weight (kg)75
Table 6. Settings of the basic values of surface materials.
Thermal PropertiesPavementBuilding Materials
AsphaltImpermeable PavementSoilBuilding Exterior
(Rebar Type Brick Wall + Cement)
Building Roof
(Gypsum + Cement)
Albedo0.1250.2250.1750.60.5
Radiation rate0.950.8000.9250.850.9
PermeabilityFFTFF
Table 7. List of simulation scheme descriptions.
SchemeH/WOrientationPlanting or Not
Code NameDescriptionE–WN–SNotPlanting
A01No planting, east–west orientation0.3V V
A020.7V V
A031.0V V
B01No planting, north–south orientation0.3 VV
B020.7 VV
B031.0 VV
C01CPlanting, east–west orientation0.3V V
C02C0.7V V
C03C1.0V V
D01CPlanting, north–south orientation0.3 V V
D02C0.7 V V
D03C1.0 V V
Table 8. Comparison table between the results of this study and Aboelata A. (2020).
This Study (H/W = 1.0)Aboelata A. (2020) [50]
Air temperature (°C)E–W+0.34+0.5(H/W = 1, planting 50%, H × W = 11 m, 2:00 p.m.)
N–S−0.18+0.3
Wind (m/s)E–W−1.77−0.2
N–S−0.3−0.3
PET (°C)E–W+1.02−1~−1.5
N–S−2.55−1~−2
Disclaimer/Publisher’s Note: The statements, opinions and data contained in all publications are solely those of the individual author(s) and contributor(s) and not of MDPI and/or the editor(s). MDPI and/or the editor(s) disclaim responsibility for any injury to people or property resulting from any ideas, methods, instructions or products referred to in the content.

