1. Introduction
The mechanical properties of soft clay, such as deformation and strength, are related to stress paths [
1,
2] and corresponding rate effects [
3,
4,
5] owing to the characteristics of high clay grain content, high moisture content, and large pore ratio, among others. The excavation of a foundation pit is a typical unloading project in geotechnical engineering. The deformation characteristics, mechanical parameters, and failure mechanisms of soils significantly differ when they undergo different unloading stress paths and unloading rates to reach the same stress state [
6].
Numerous studies on the mechanical properties of soils under unloading stress paths have been conducted, and remarkable achievements have been made. Liu et al. [
7] demonstrated that the stress–strain relationship for soft soils is affected by unloading stress paths. Yan et al. [
8] found that excess pore pressure in saturated soft clay under unloading conditions effects the excavation of foundation pit and heave of pit bottom through a comparative study between triaxial unloading experiments and theoretical research. Lim et al. [
9] demonstrated that the unloading mechanical parameters of soft soils can be used to accurately calculate the excavation deformations of foundation pits under undrained conditions. Huang et al. [
1] conducted
K0 consolidation undrained shear tests on Shenzhen soft soil under the influence of unloading stress paths; the results showed variation in the unloading strength and initial shear modulus of soils under unloading stress paths, and the deformation properties of soils were greatly influenced by the unloading stress paths. Jia et al. [
10] performed axial loading and lateral unloading shear tests on Wenzhou soft clay using a stress-path triaxial apparatus and proposed a four-parameter stress–strain curve model based on the deformation mechanism of structured soils and incremental linear elasticity theory. Huang et al. [
11] reported that the unloading strength parameters and unloading modulus of marine sedimentary soft soils were significantly influenced by the unloading stress paths, and an increase in excess pore water pressure weakened the unloading strengths, particularly when the cohesion was stronger. The above studies indicate that mechanical properties including the stress–strain relationship, pore pressure characteristics, deformation and strength characteristics at failure, and the initial unloading modulus of soils are significantly related to the unloading stress paths.
In the 1930s, Buisman [
12] reported that the stress, strain, and strength of soils exhibited a non-negligible rate-dependent relationship via indoor experiments. Some researchers have conducted rate-dependent tests on different clays [
13,
14,
15] and concluded that the undrained shear strength increases with increasing strain rates, thus considering the shear strength rate parameters for quantitative description. For example, Whitman et al. [
14] obtained the strength rate parameter of 3.5% for Mississippi alluvial soils, but the magnitude of the effects of the increasing strain rate on the undrained shear strength varied greatly. Zhu et al. [
15] performed shear tests on saturated marine clay under compression and tension path conditions at three different strain rates and found that the effect of the shear rate on the undrained shear strength of the tension path was greater than that of the compression path. Wu et al. [
16] conducted
K0-consolidation undrained triaxial tests on marine clay considering the effects of stress states and strain rates and concluded that the higher the strain rate, the higher the undrained shear strength, and the lower the pore pressure of soils with different over-consolidation ratios. Cai’s [
17] research results demonstrated that strong structured clay presents a unique shear rate mechanical effect, and its consolidation undrained shear strength does not change monotonically with shear rate but is characterized by first decreasing and then increasing with increasing shear strain rate, and there is a critical rate phenomenon. These previous research outcomes indicate that the strength characteristics of soils are strongly related to the shear rate. However, these tests generally examined the strain rate effects under a specific stress history, which is not entirely applicable to actual excavation projects, such as those involving slopes and foundation pits, where stress rate problems exist. Meanwhile, Li et al. [
18] analyzed the mechanical properties of undisturbed expansive clay under the influence of different unloading rates and unloading stress paths using a GDS stress-path triaxial apparatus. The results showed that the pore pressure of soils under reduced compression and reduced extension stress paths remained negative, the undrained shear strength increased with an increase in unloading rate, and the failure pattern of expansive clay was related to the shear rate and microcracks. Yang et al. [
19] performed undrained unloading tests of isotropic consolidation on a soft dredger fill and developed formulas for the initial tangent modulus and unloading failure strength considering the influence of the unloading rates and unloading stress paths. Song et al. [
20] conducted triaxial tests on remolded deep clay under the effect of stress paths and stress rates. As a result, the strength of soils exhibited a strong rate dependence under different stress paths, and the damage caused by unloading conditions on soil was more abrupt than that caused by loading conditions.
The aforementioned studies comprehensively considered the influence of unloading stress paths and unloading rates on the mechanical properties of soils; however, most focused on soft soils with weak structural properties. Zhanjiang clay is known for its strong structural properties, with an open flocculation structure and strong cementation of free oxides at the microscopic level, as well as an abnormal combination of poor physical properties and good mechanical property indices at the macroscopic level. To date, a certain understanding of the static and dynamic properties as well as microscopic mechanisms of Zhanjiang clay has been achieved [
21,
22,
23,
24], whereas the mechanical properties of strong structured clay under the influence of different unloading stress paths and unloading rates are less researched. Therefore, in this study, a series of undrained unloading tests was conducted under isotropic consolidation conditions regarding various unloading stress paths and unloading rates to simulate different unloading methods and speeds in foundation pit excavation projects as well as to investigate the influence law of different unloading stress paths and unloading rates on the strain, pore pressure, and strength characteristics of strong structured clay, with the aim of providing a reference and theoretical basis for the selection of geotechnical engineering parameters in structured clay areas.
3. Results and Discussion
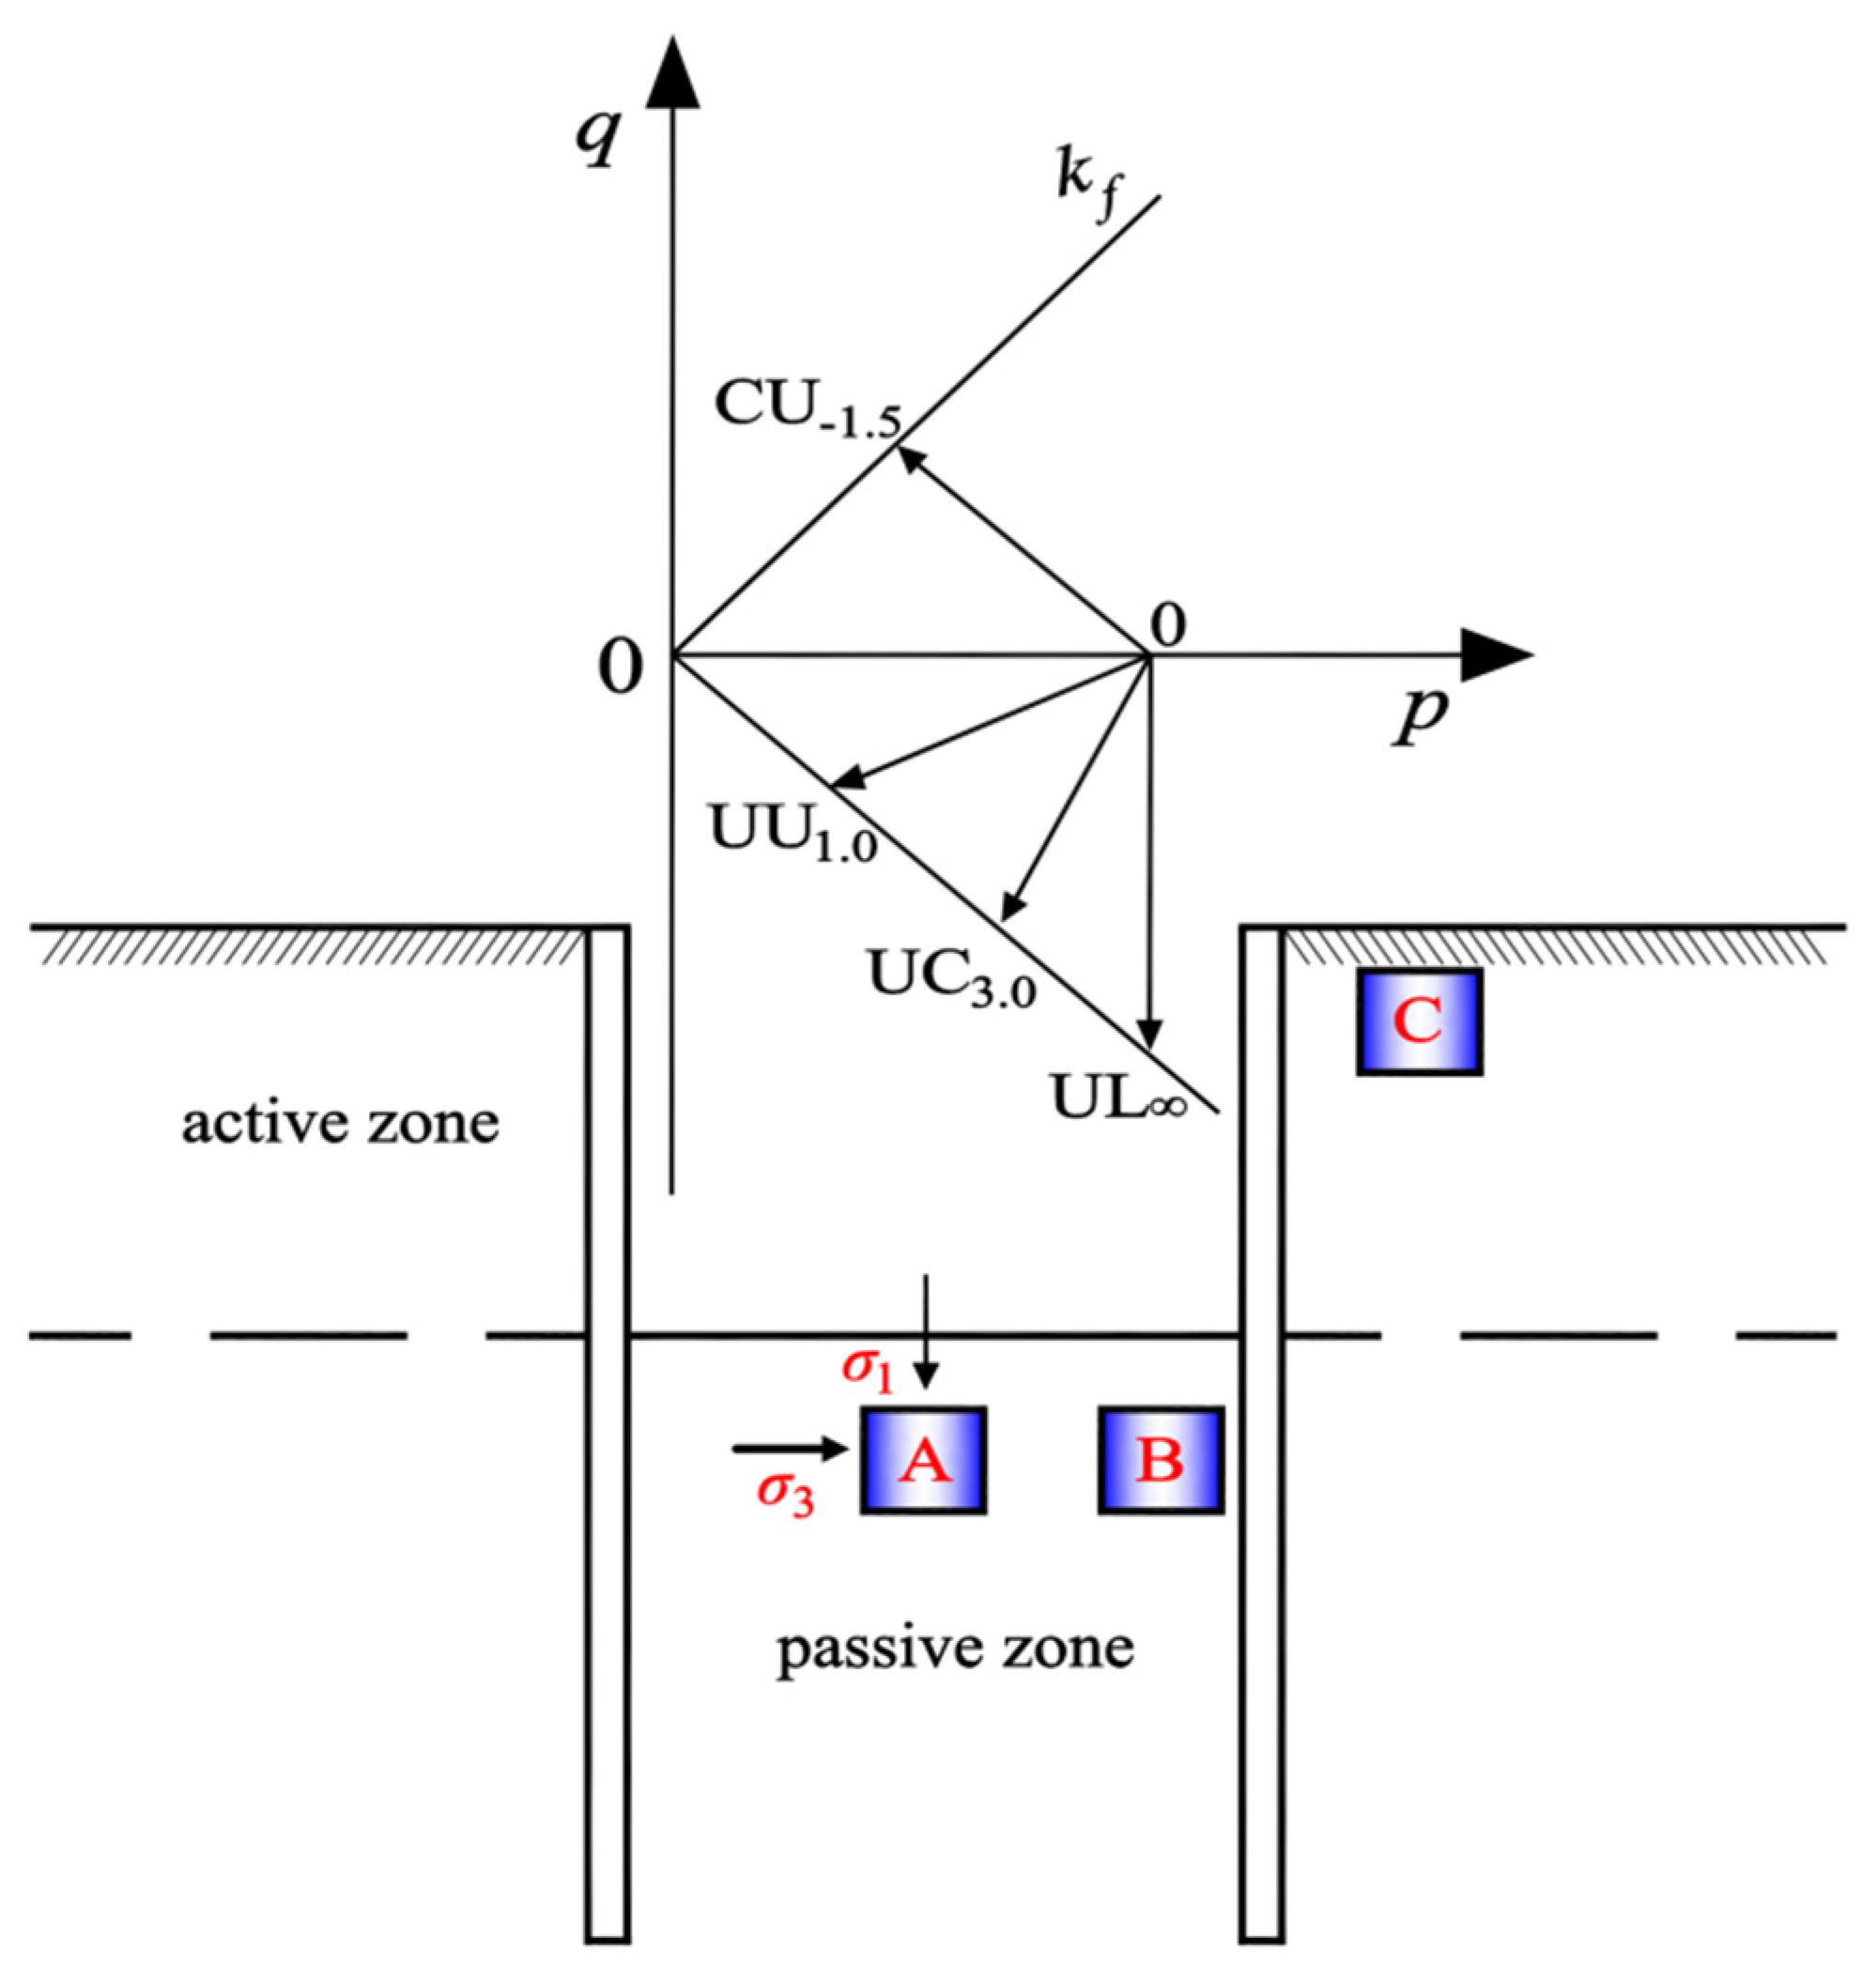
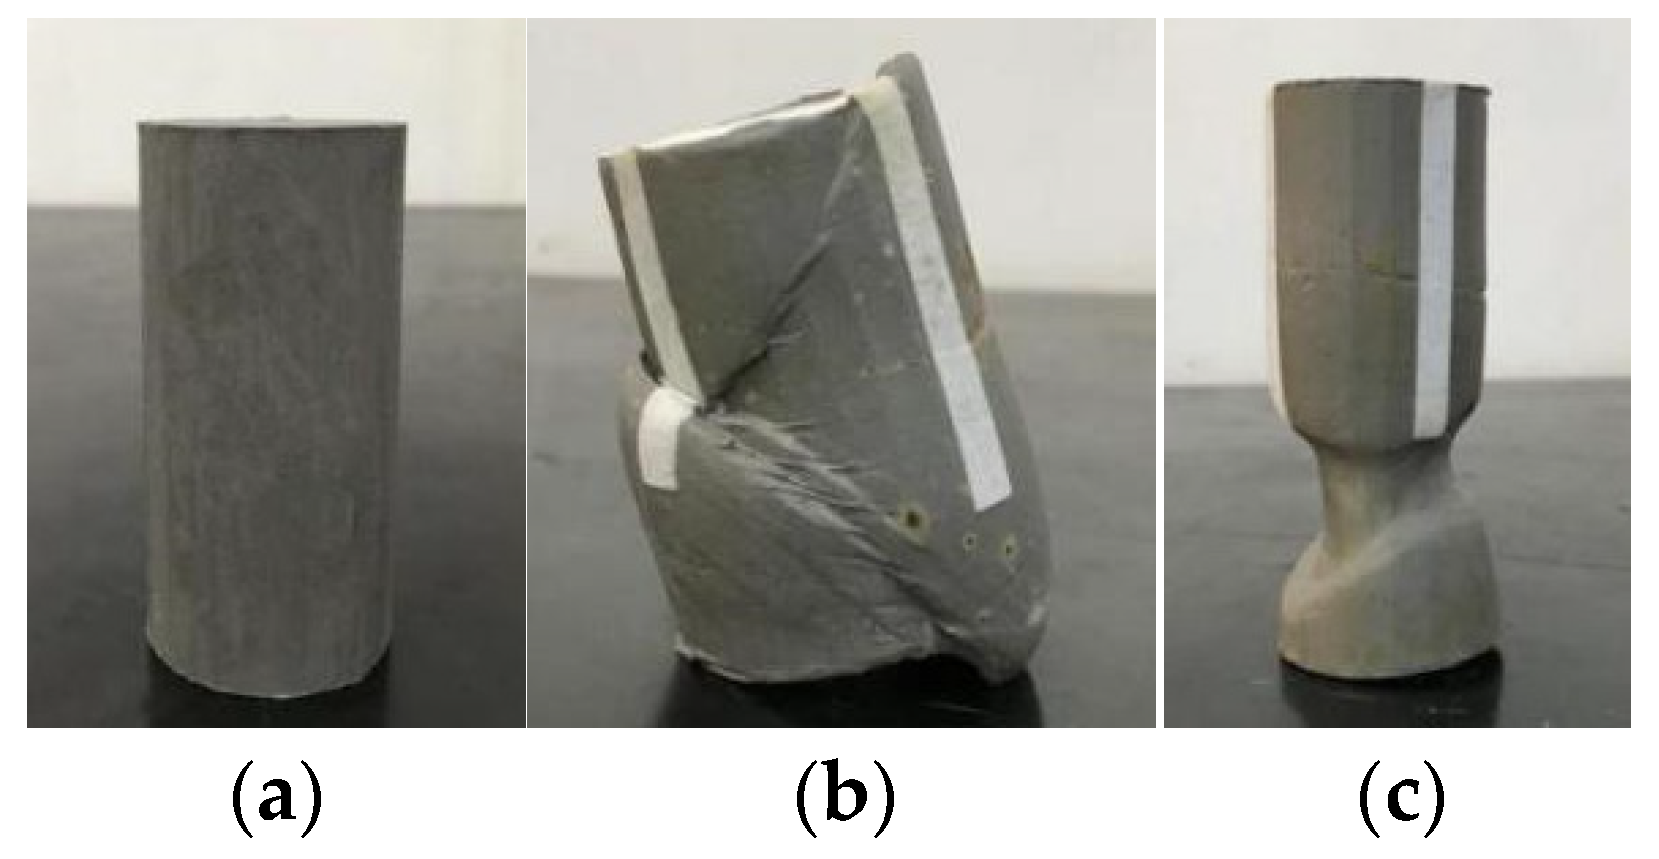
There are two types of specimen failures under unloading conditions: compression and elongation failures. The analysis shows that among the four stress paths in
Table 4, the failure mode of the specimen under CU
−1.5 path is axial compression failure, while that of the specimen under the other three stress paths is axial elongation failure, or “tensile failure”. The failure modes of specimens are provided in
Figure 6.
3.1. Effect of Unloading Rate on Stress-Strain Relationship
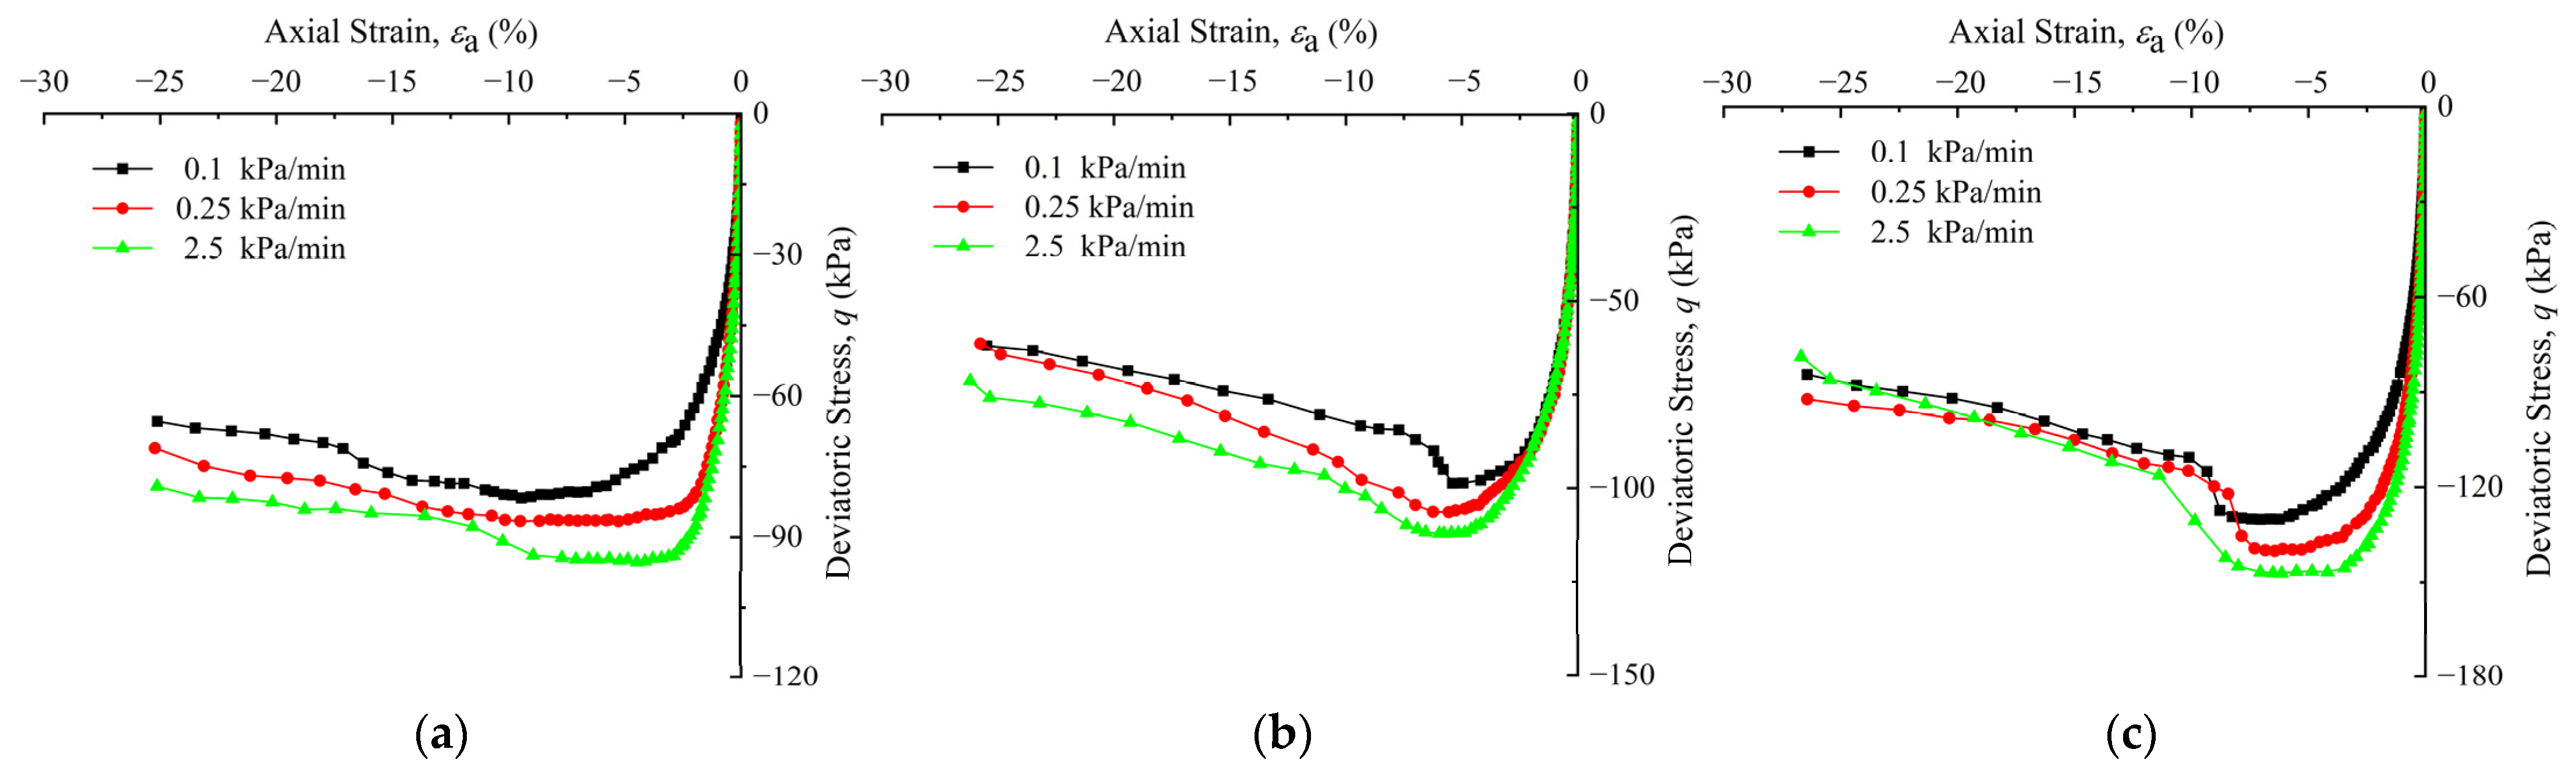
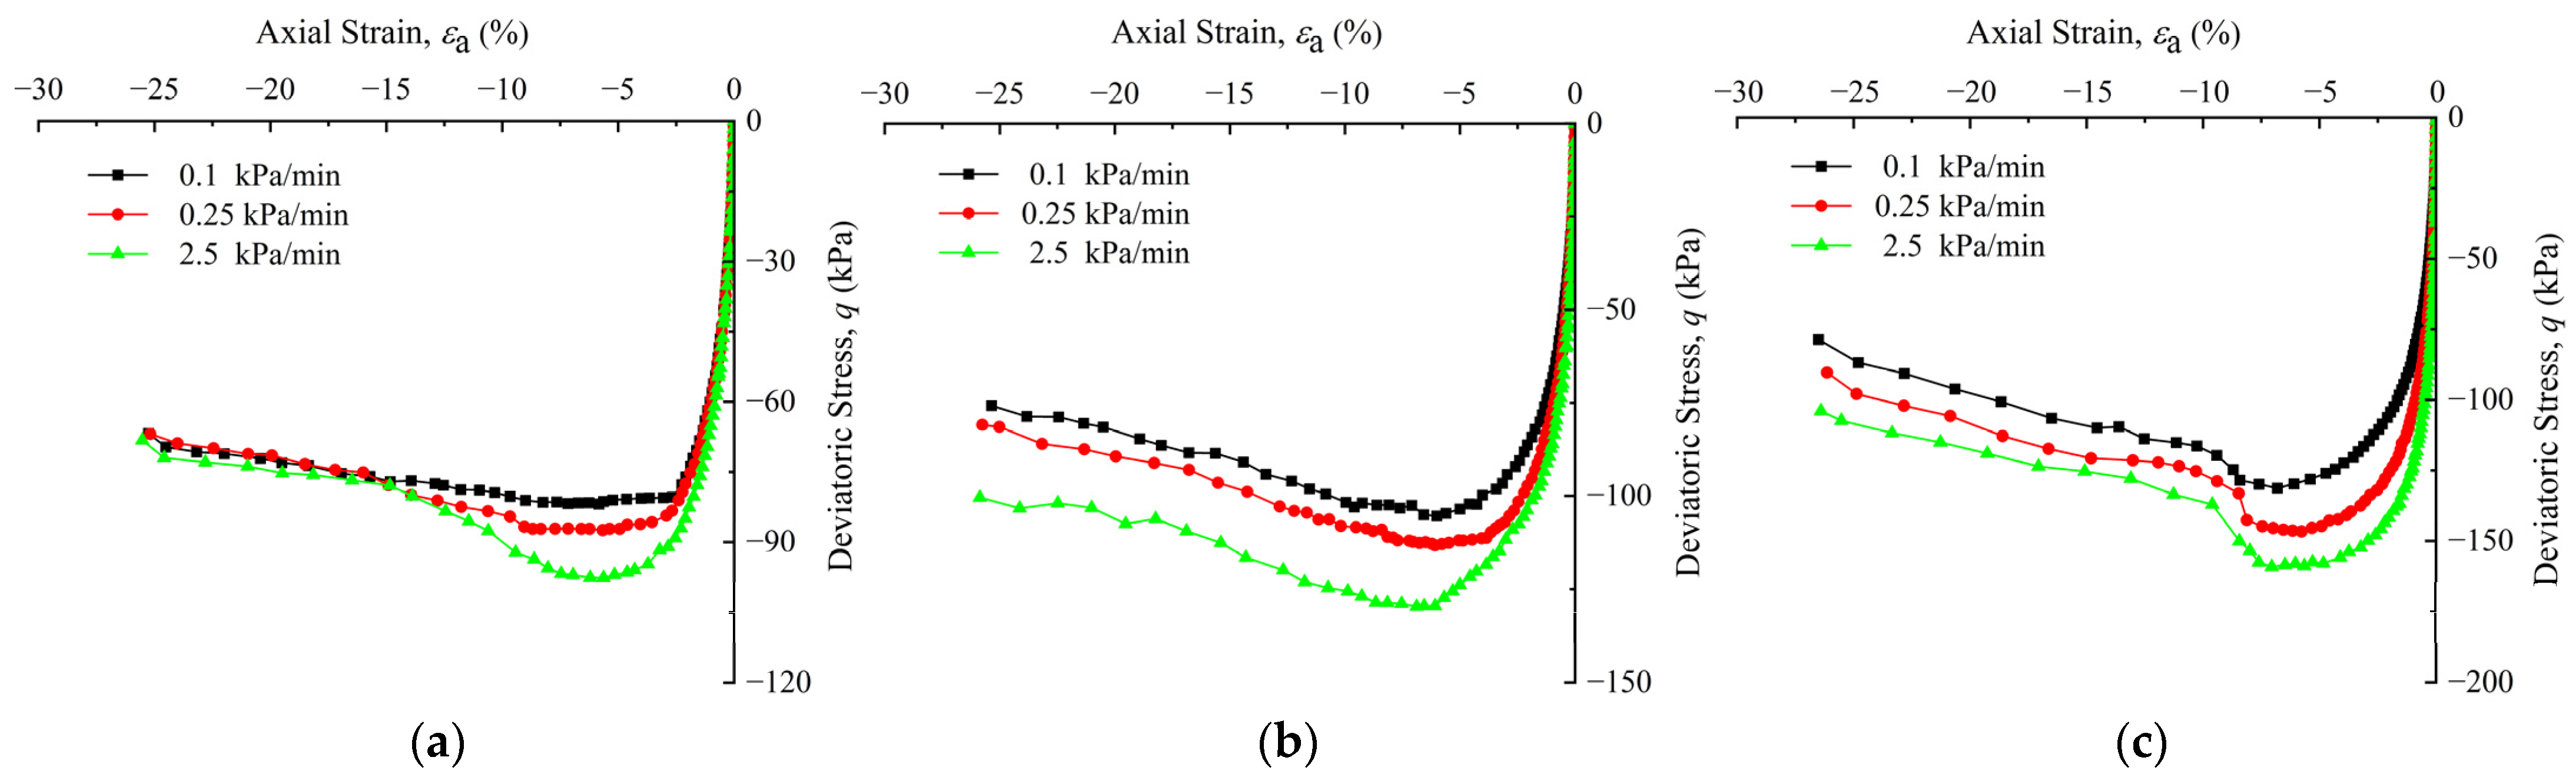
The deviatoric stress–axial strain curves for the Zhanjiang structured clay under different unloading stress paths are shown in
Figure 7,
Figure 8,
Figure 9 and
Figure 10. Deviatoric stress
q =
σ1−
σ3: in the passive compression path,
q is positive (CU
−1.5); in the passive tensile paths,
q is negative (UC
3.0, UL
∞, UU
1.0), while the axial strain is positive in the compression path and negative in the tensile path.
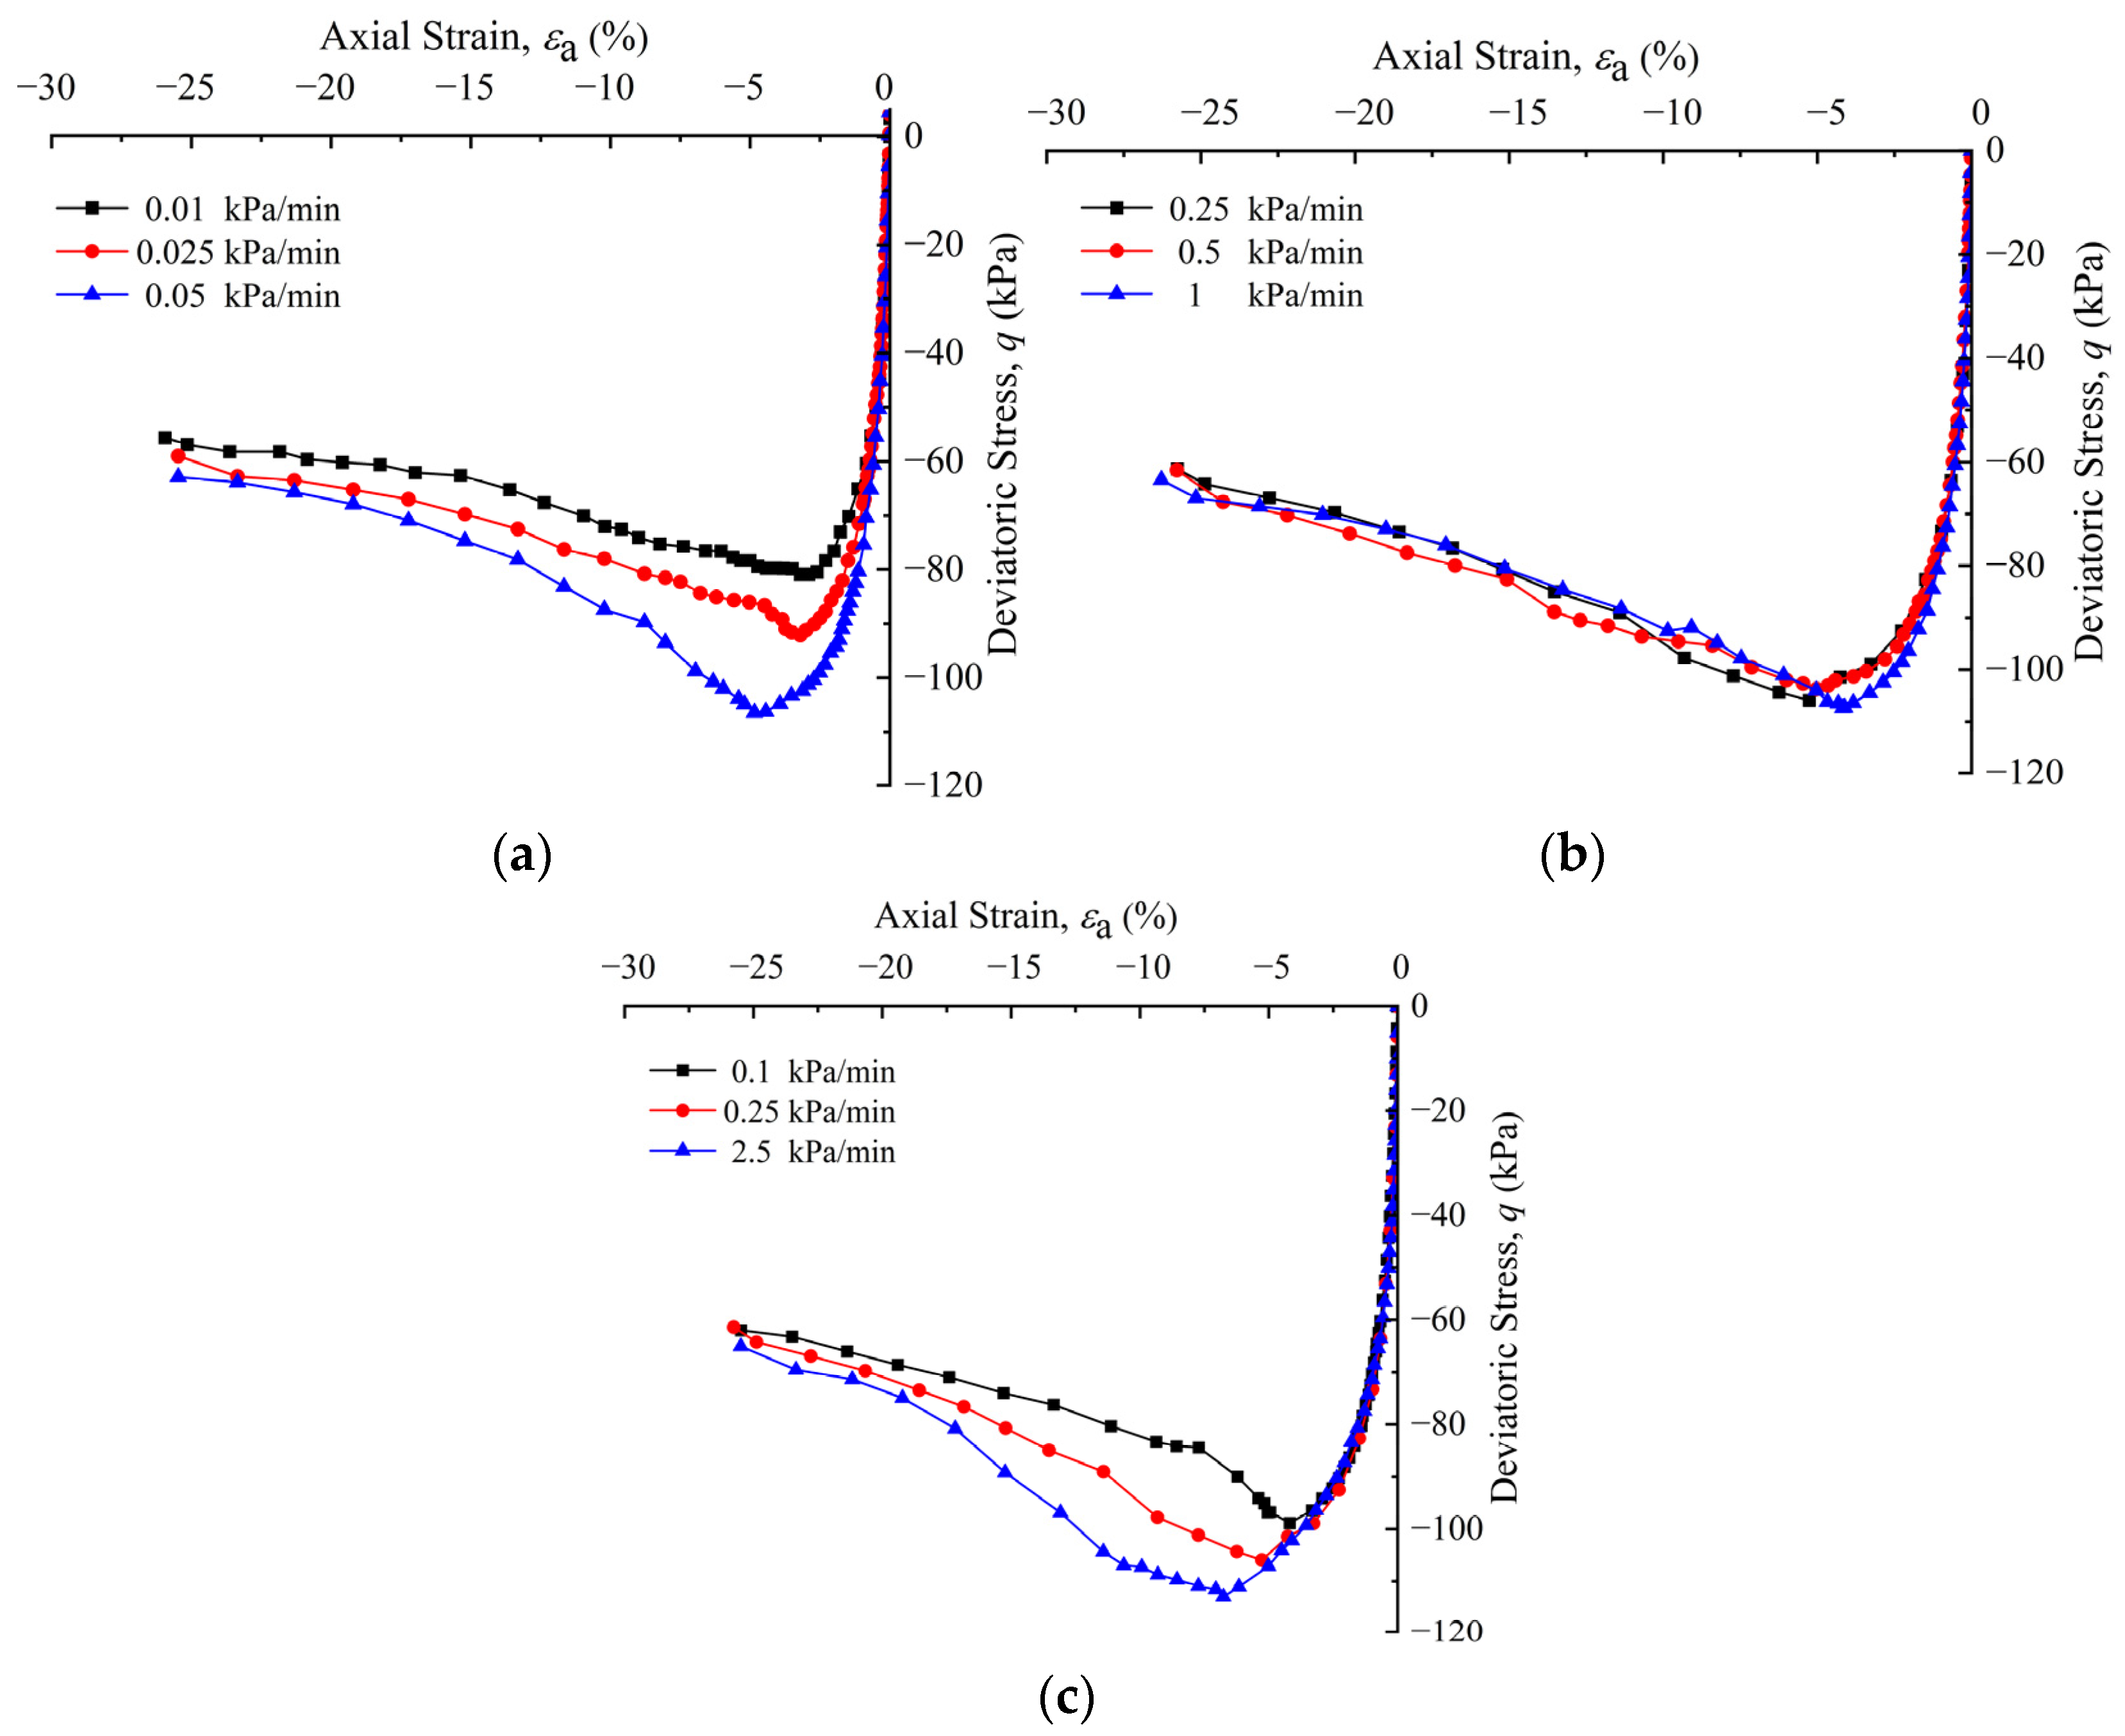
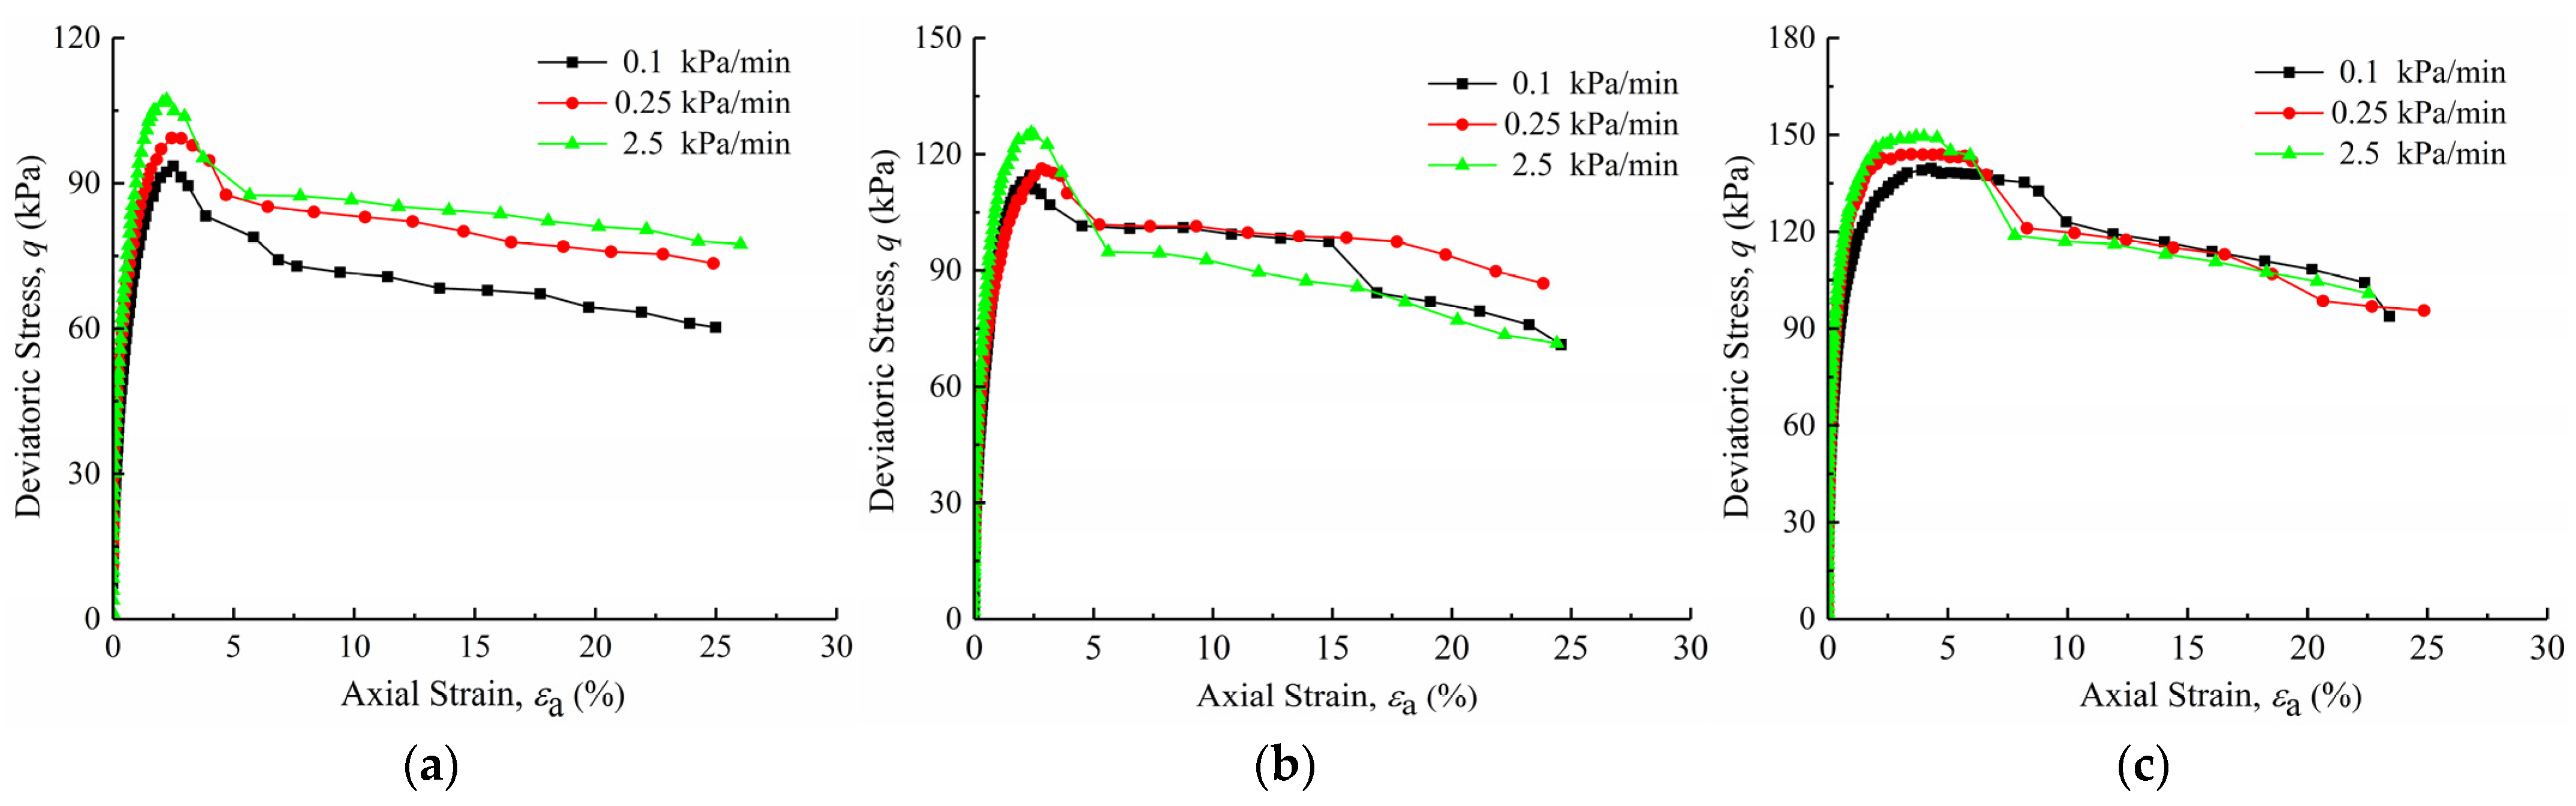
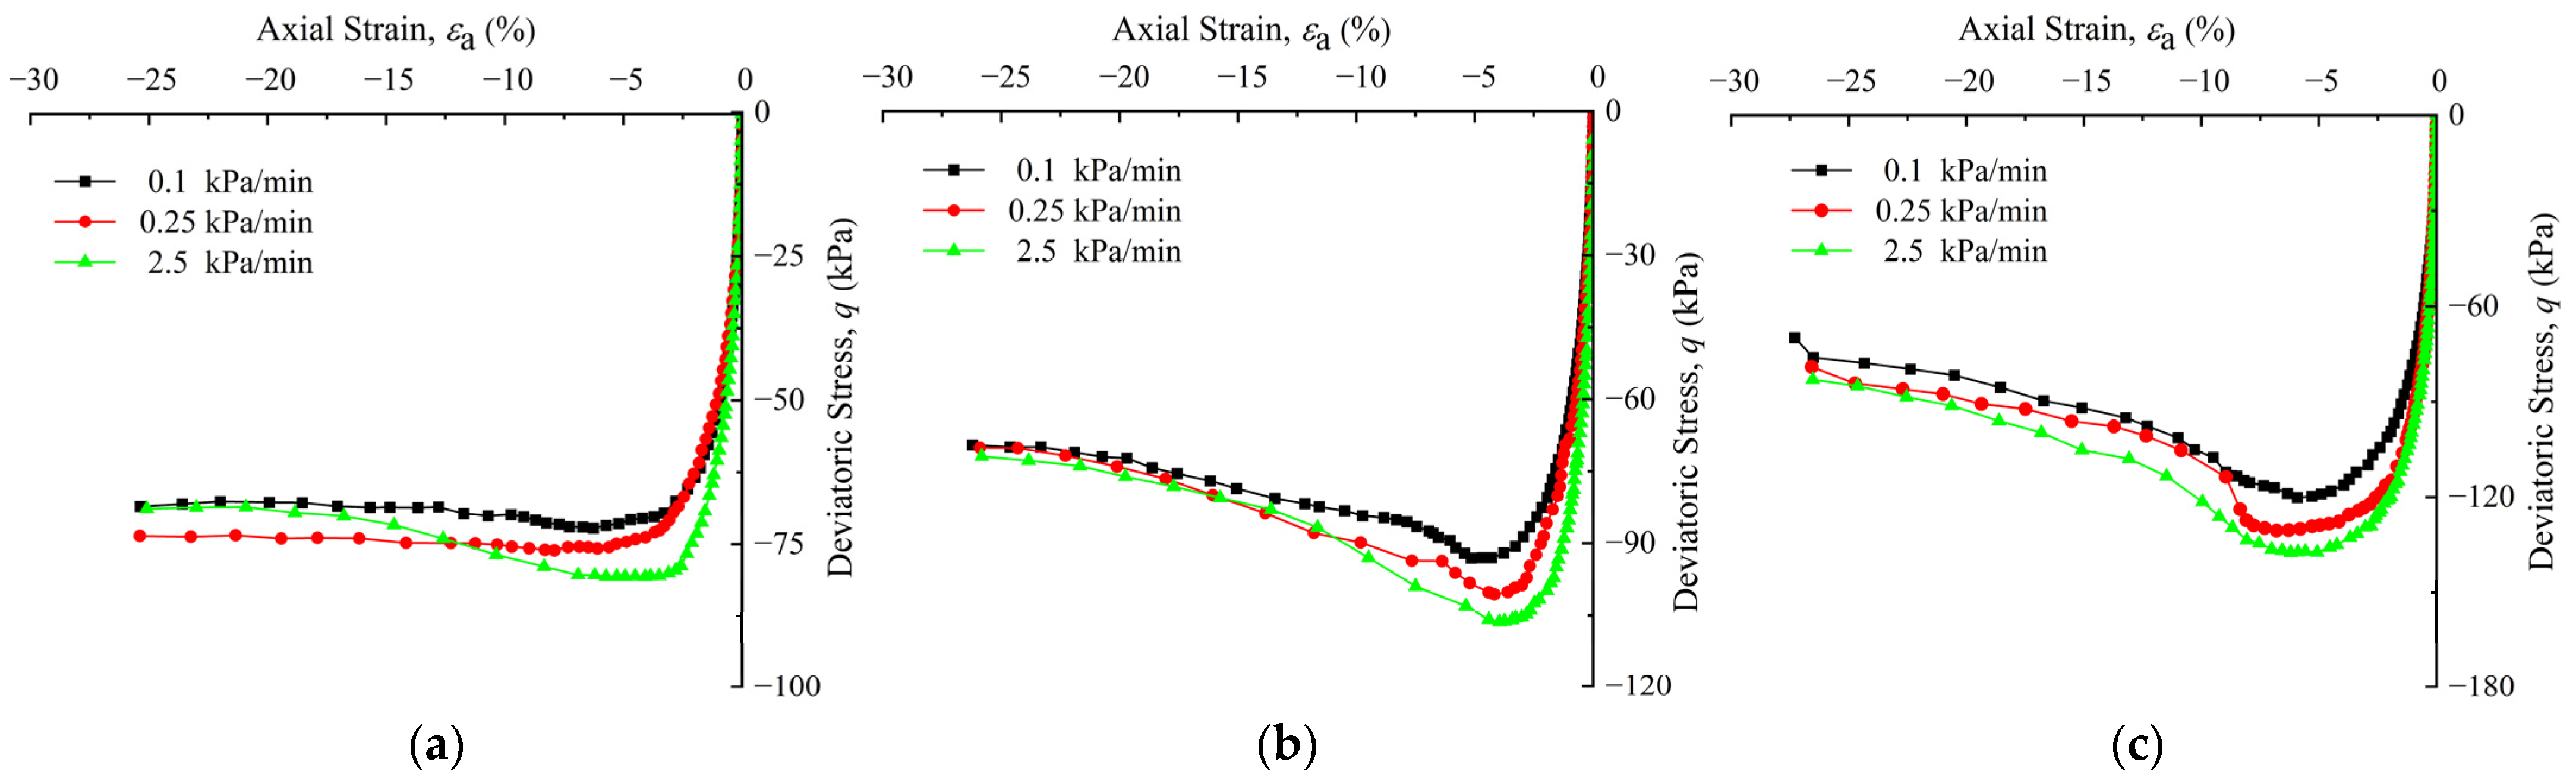
From
Figure 7,
Figure 8,
Figure 9 and
Figure 10, it can be seen that the stress–strain curves for Zhanjiang structured clay exhibit strain softening at different unloading rates under both passive compression and passive tensile paths; more specifically, with an increase in axial strain, the deviatoric stress first increases rapidly and then gradually decreases after reaching the peak stress. Under the passive compression path, the smaller the confining pressure, the more significant the strain softening; whereas, under the passive tensile path, the larger the confining pressure, the more evident the strain softening. For the same axial strain, the larger the unloading rate, the greater the deviatoric stress of the soil under the same unloading stress path; further, with increased unloading rate, the soil obtained a higher secant modulus, which decreased significantly with increase in unloading time. Therefore, quick excavation with instantly available support is advisable during corresponding construction.
Under the same stress path and confining pressure, the stress–strain curves for the specimen at different unloading rates are more concentrated in the initial stage of unloading, at low deviatoric stress and soil deformation, demonstrating that the stress–strain curves were not sensitive to the unloading rate at this stage. Moreover, with an increase in the unloading amount, when the deviatoric stress reaches the failure stress of the soil and the strain increases rapidly, the soil undergoes large deformation failure, and the strength of the soil decays rapidly. Furthermore, for the same consolidation pressure, the peak deviatoric stress of the stress–strain curves is related to the unloading rate; the larger the unloading rate, the larger the failure stress of the soil. This is because when the unloading rate is high, the soil particles do not have enough time to move during shearing, and it is difficult to overcome the slip, rotation, rolling, and transposition resistance between particles in a relatively short period. Only when the energy gathers to the effective stress then the resistance of the particles is overcome, forming a dislocation and producing deformation, which resulted in large macroscopic failure stress. When the unloading rate is low, the soil particles have more time for directional adjustment or displacement in the longer unloading period to achieve rolling and directional arrangement of the particles; thus, the failure stress was smaller.
The stress–strain curves under the CU−1.5 unloading path clearly differ from those for the other three groups of stress paths. The deformation of the specimen under the CU−1.5 path exhibited axial compression, and the axial strain when the specimens reached failure was between 2% and 4%. In foundation pit excavation projects, the soil outside the foundation pit support in the active earth pressure zone is damaged when a small strain is generated. This indicates that the soil outside the pit can reach the active limit equilibrium state under a small lateral deformation. Therefore, the horizontal displacement of the retaining wall should be effectively controlled in actual engineering to avoid sliding damage to the soil behind the retaining wall. Furthermore, the deformation of the specimens under the UC3.0, UL∞, and UU1.0 paths showed axial elongation, and the axial strains when the specimens reached failure under the passive tensile paths were mostly concentrated around 4~9%. In actual engineering, soil uplift deformation at the bottom of the pit should be monitored to avoid soil uplift damage in the foundation pit, i.e., the strain of the soil inside the foundation pit in the passive earth pressure area is larger when damage is produced.
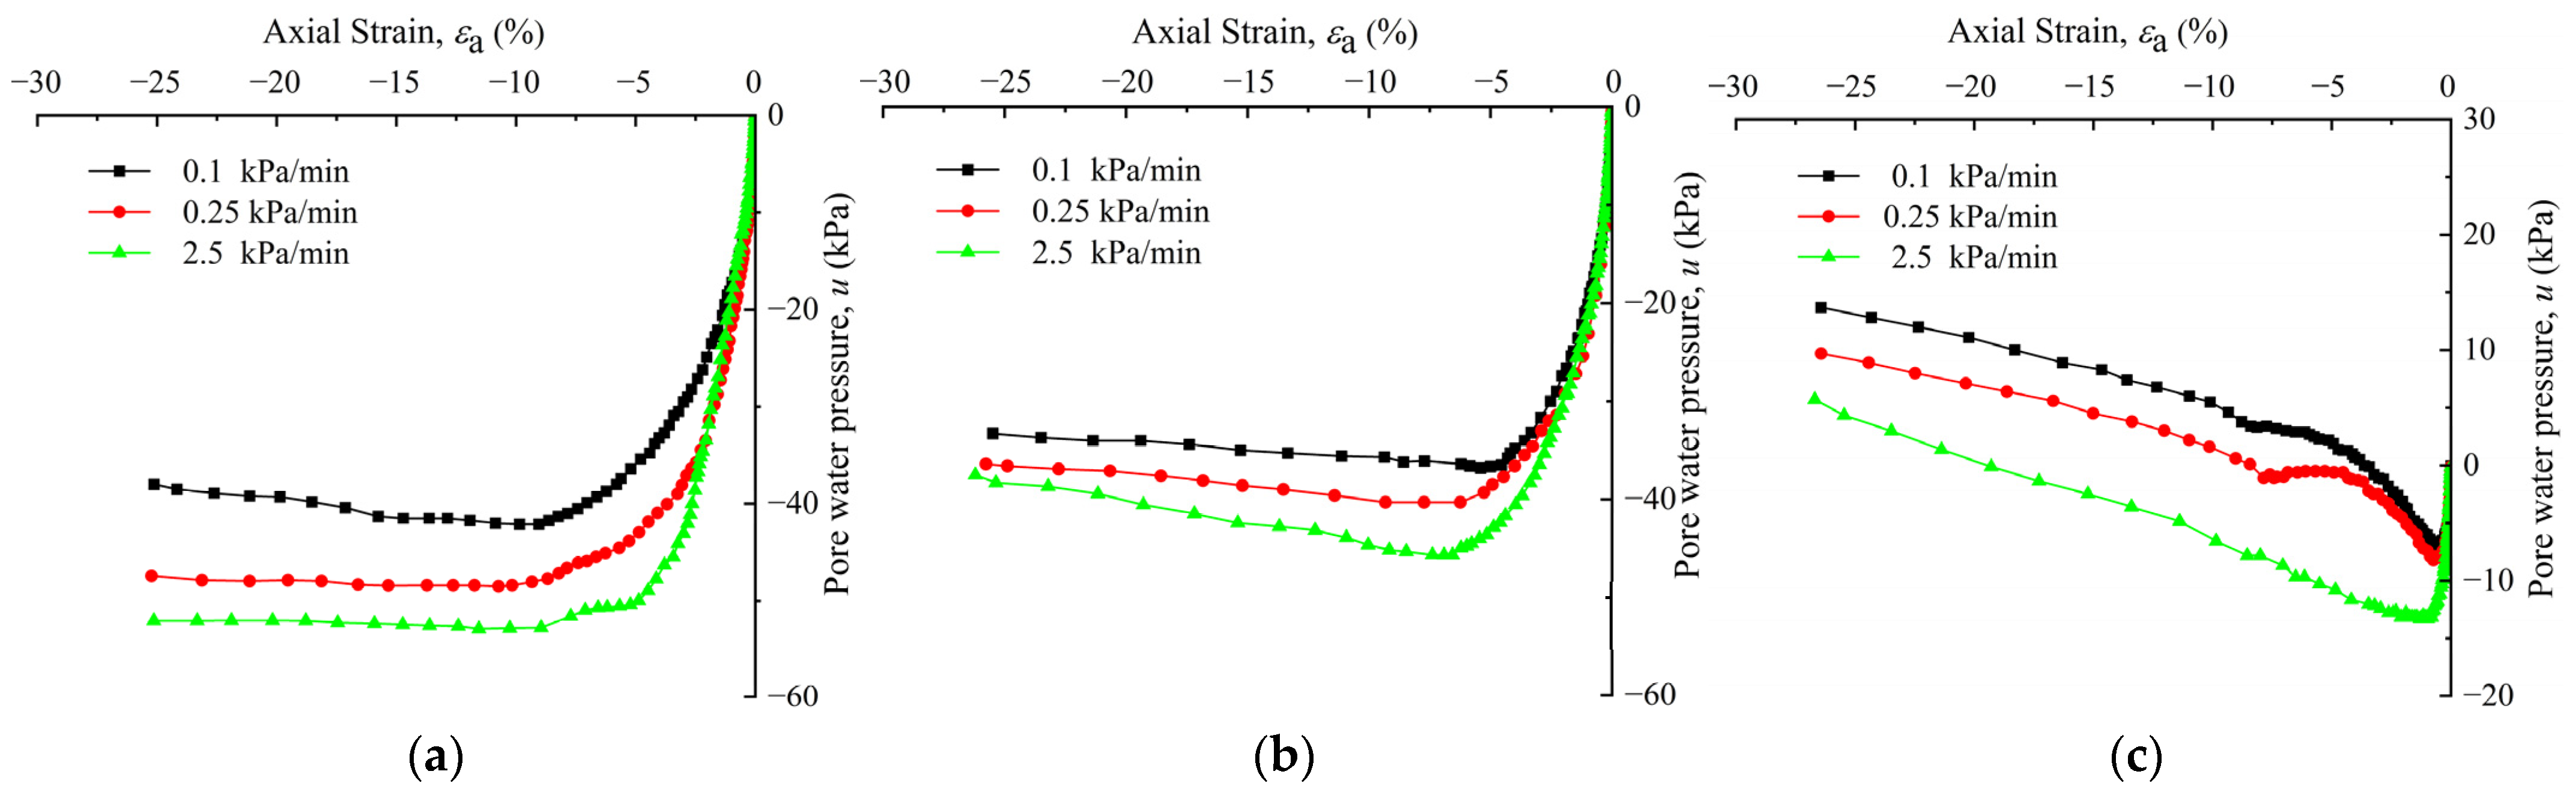
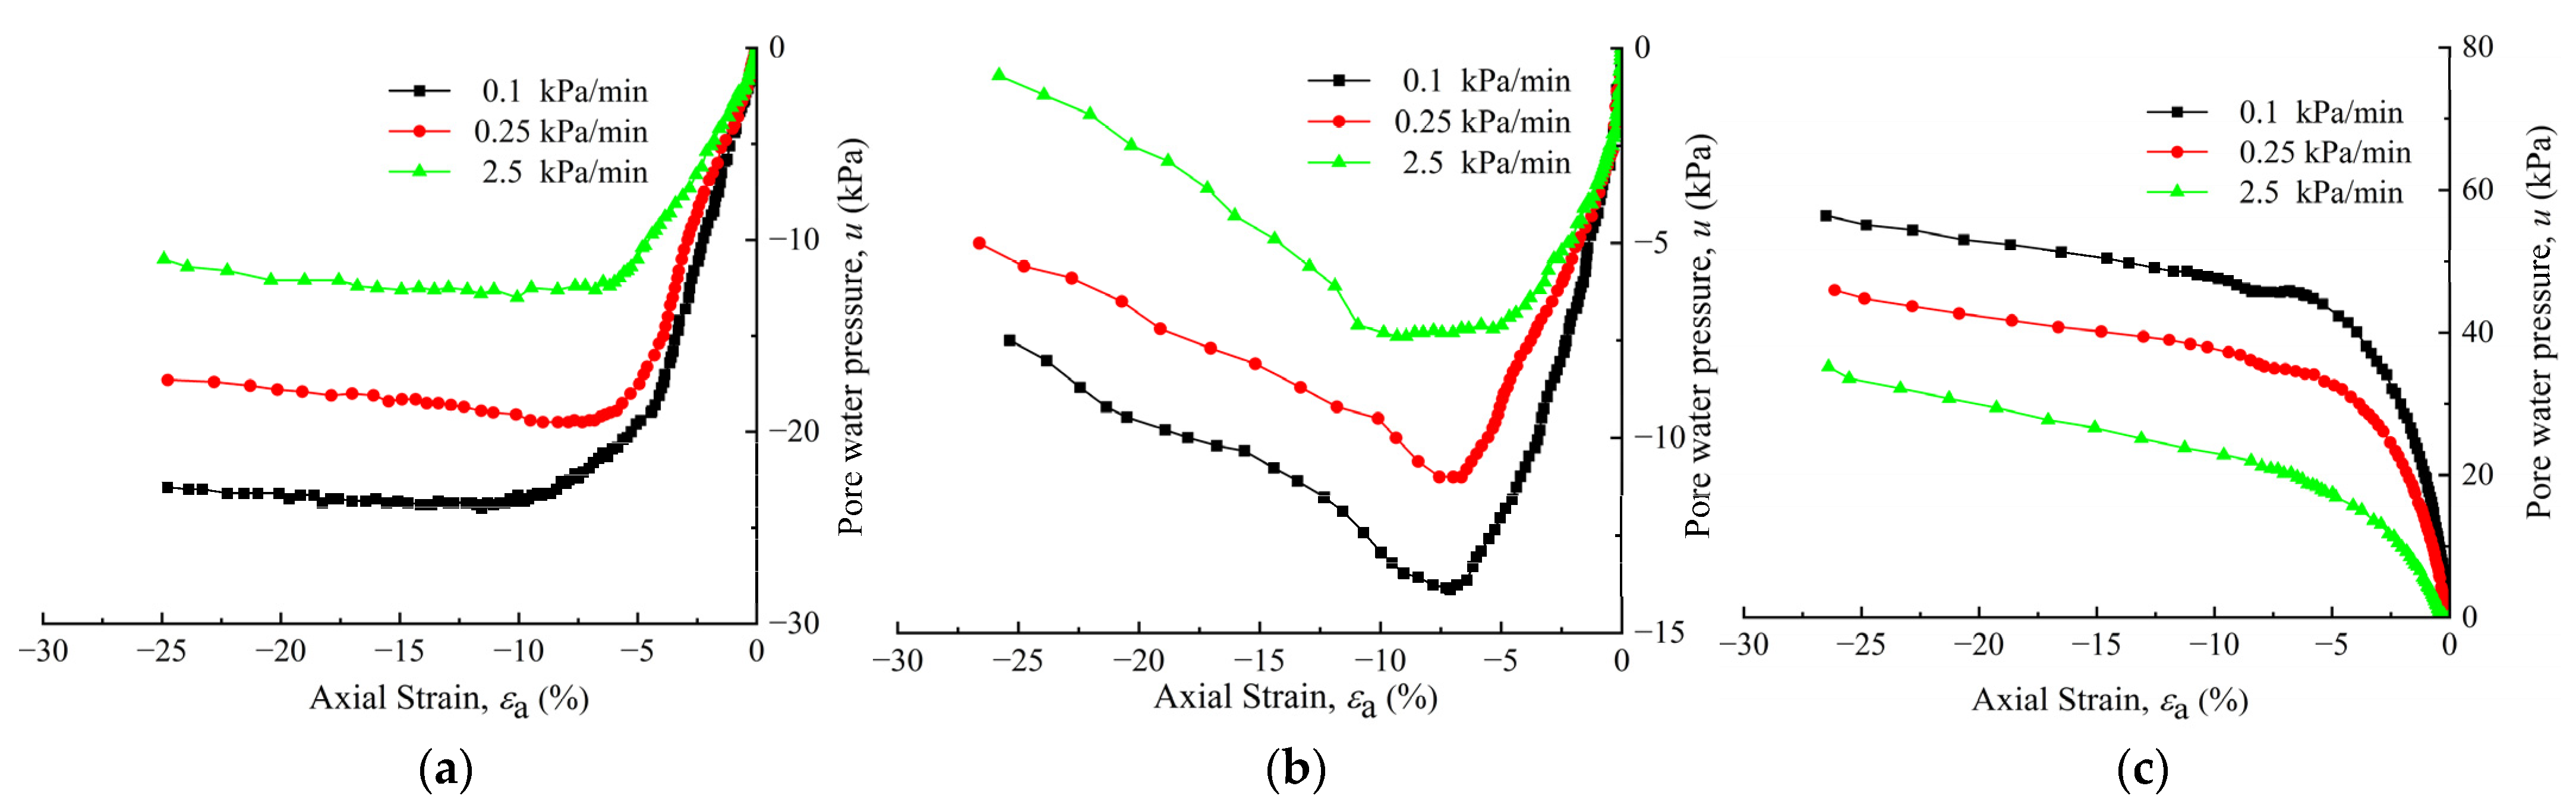
3.2. Effect of Unloading Rate on Pore Water Pressure
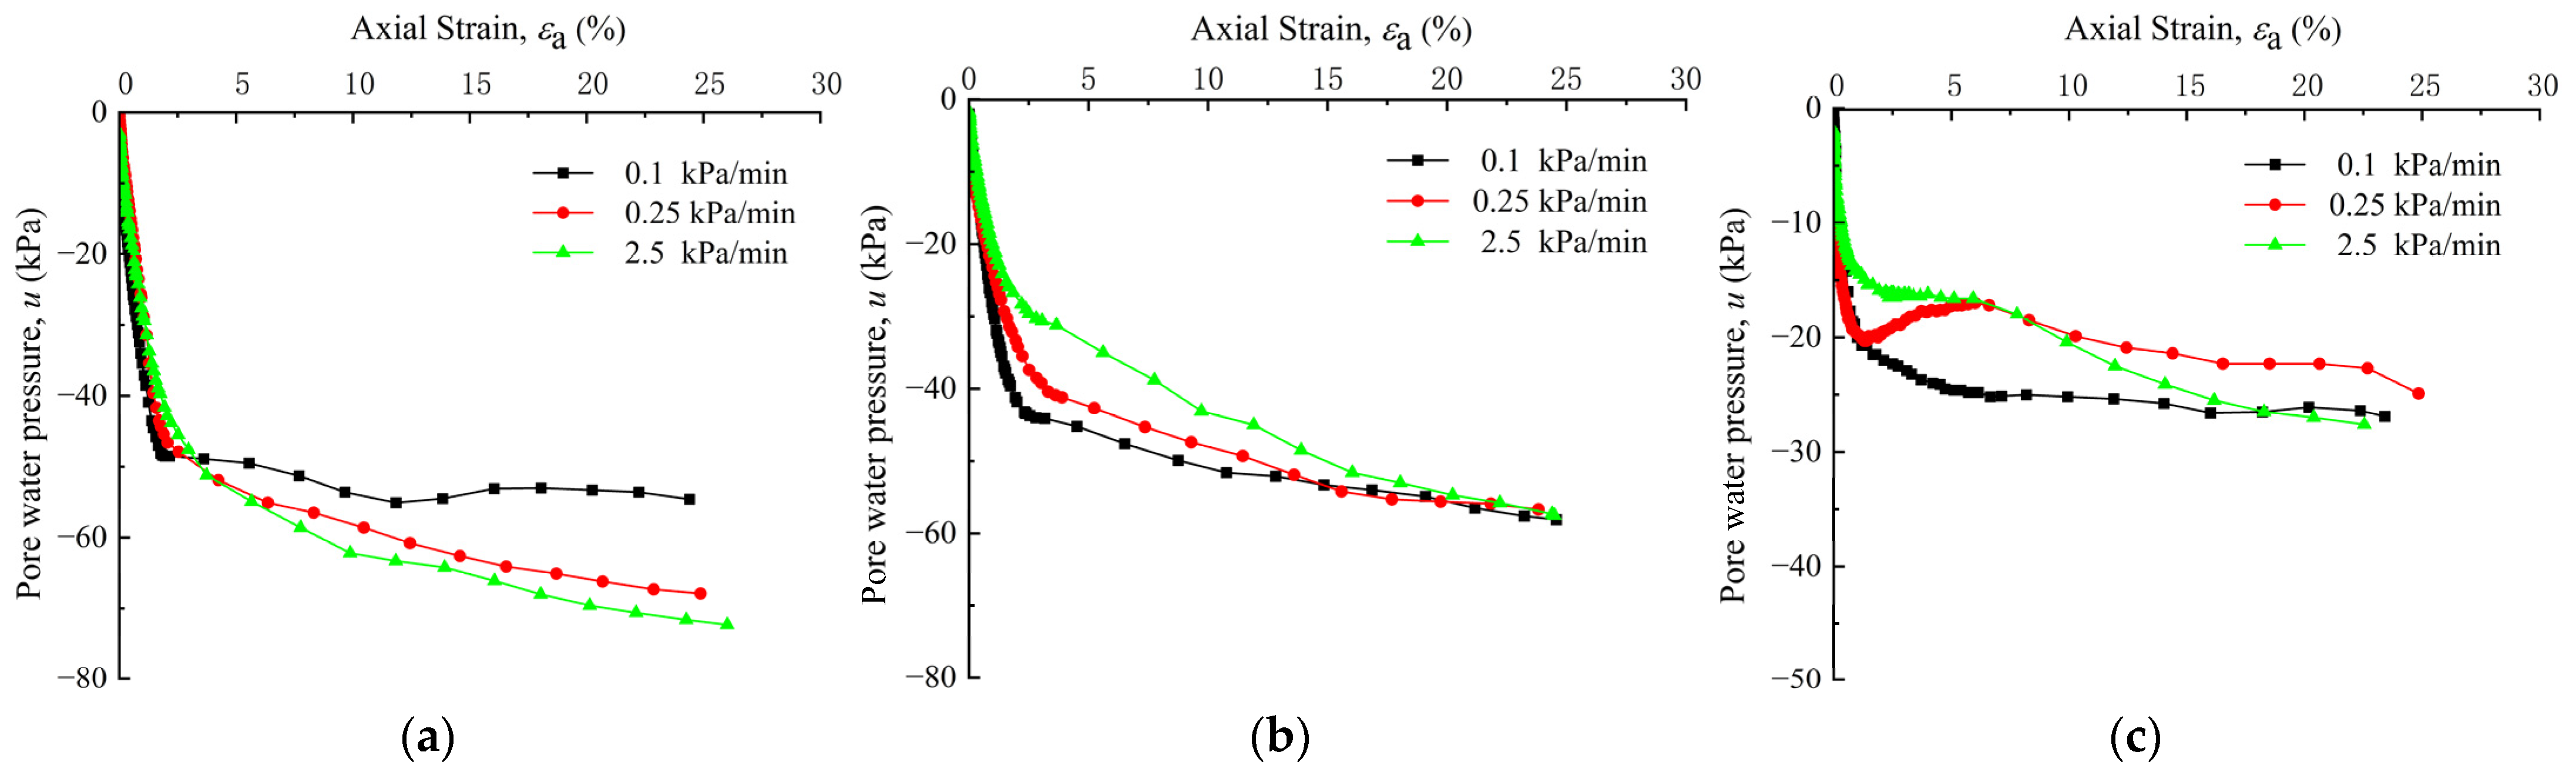
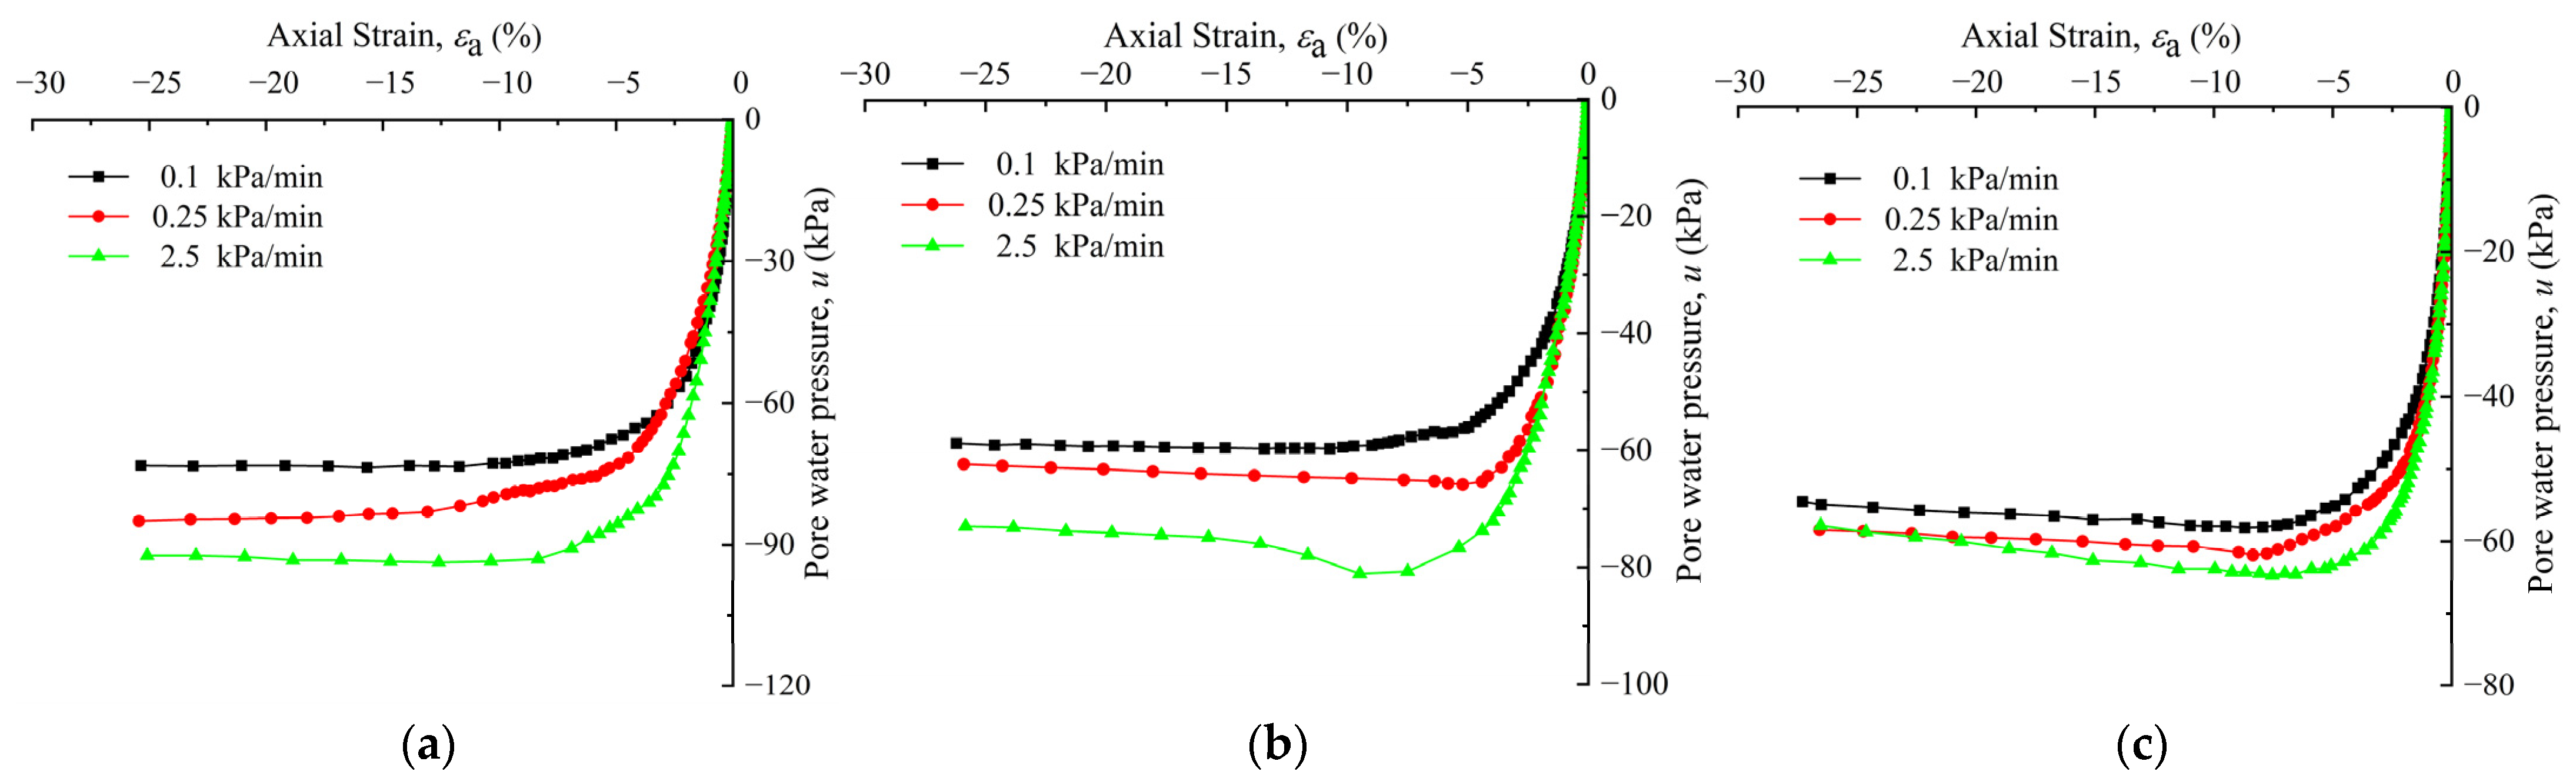
The pore pressure–strain relationship curves of the specimens under different unloading paths are displayed in
Figure 11,
Figure 12,
Figure 13 and
Figure 14. It can be seen from the figures that the confining pressure influences the development of pore pressure: under the same conditions, the larger the confining pressure, the larger the peak pore pressure or the final pore pressure value. The change law for the pore pressure with strain is the result of the combined effect of the pore pressures generated by elastic expansion and plastic deformation during shearing.
The pore water pressure change laws are quite different under various stress paths. Under the CU−1.5 passive compression path, the pore water pressure remained negative with the development of strain. At the beginning of unloading, the pore water pressure accumulated rapidly with an increase in tensile strain, and after the strain exceeded a certain value, the growth of the negative pore water pressure gradually slowed. This is because the negative pore water pressure generated by the elastic expansion at the beginning of unloading was greater than the positive pore water pressure generated by the unloading compression. Thus, the pore water pressure decreased rapidly, and with the increase in the deviatoric stress, the growth rate of the pore water pressure generated by the elastic expansion and plastic deformation of the soil slowed, and the pore water pressure tended to a stable state. Moreover, under the same conditions, the larger the unloading rate, the slower the pore water pressure development at the beginning of unloading. This is because, in the initial stage of unloading, the faster the unloading speed, the less time the pore water pressure generated by elastic expansion has to grow. As the unloading continued, the failure stress of the soil increased, and the final pore water pressure increased.
Under the UU1.0 passive tensile path, the development law for the pore water pressure with axial strain during shearing under different confining pressures is essentially the same. Moreover, the pore water pressure generated during the entire unloading process remained negative, and the pore water pressure decreased rapidly with the increase in axial strain, then slowed and gradually stabilized. This is due to the unloading of the lateral stress. The soil sample will have a certain degree of elastic expansion and the pore water pressure will decrease, which will be influenced by the axial stress. Specifically, when the unloading stress path is UU1.0, both the axial and lateral stresses decreased throughout the shearing process; thus, the pore water pressure decreased significantly and remained negative.
Under the UC3.0 and UL∞ passive tensile paths, when the confining pressure was small, i.e., 50 and 100 kPa, the negative pore water pressure first increased and then decreased with increasing axial strain during the shearing process. Before reaching the yield point of the soil, the negative pore water pressure generated by the elastic expansion was larger than the positive pore water pressure generated by the plastic deformation; therefore, the pore water pressure first decreased rapidly and then gradually increased, owing to the deviatoric stress. After reaching the yield point, the pore water pressure generated by the plastic deformation caused by the shearing failure gradually became larger than that generated by the elastic expansion. Thus, the pore water pressure increased rapidly, and the pore water pressure–strain curves exhibit a corresponding turning point. Moreover, when the confining pressure was larger (e.g., 200 kPa), the pore water pressure of the specimens changed from negative to positive. The negative pore water pressure generated by the elastic expansion was smaller than the positive pore water pressure generated by the plastic deformation during shearing, and the pore water pressure tended to increase monotonically with the axial strain. Furthermore, the smaller the unloading rate under the same conditions, the more fully the pore pressure develops, and the greater the pore pressure variation.
In summary, during the unloading process, the negative pore pressure gradually increased at the start of unloading, and the axial strain varies when the pore pressure reached its maximum value under different unloading paths. The unloading rate affected the growth path and dissipation rate of negative pore pressure. Owing to the high moisture content and low permeability coefficient of the soft clay, the unloading of the pit excavation will generate a negative excess pore pressure in the pit bottom and surrounding soil. With the dissipation of the negative pore pressure, the effective stress in the soil at the bottom of the pit gradually decreases, which then causes the expansion and uplift of the soil at the bottom of the pit. Therefore, during the unloading construction, attention should be paid to engineering disasters caused by negative pore water pressure dissipation.
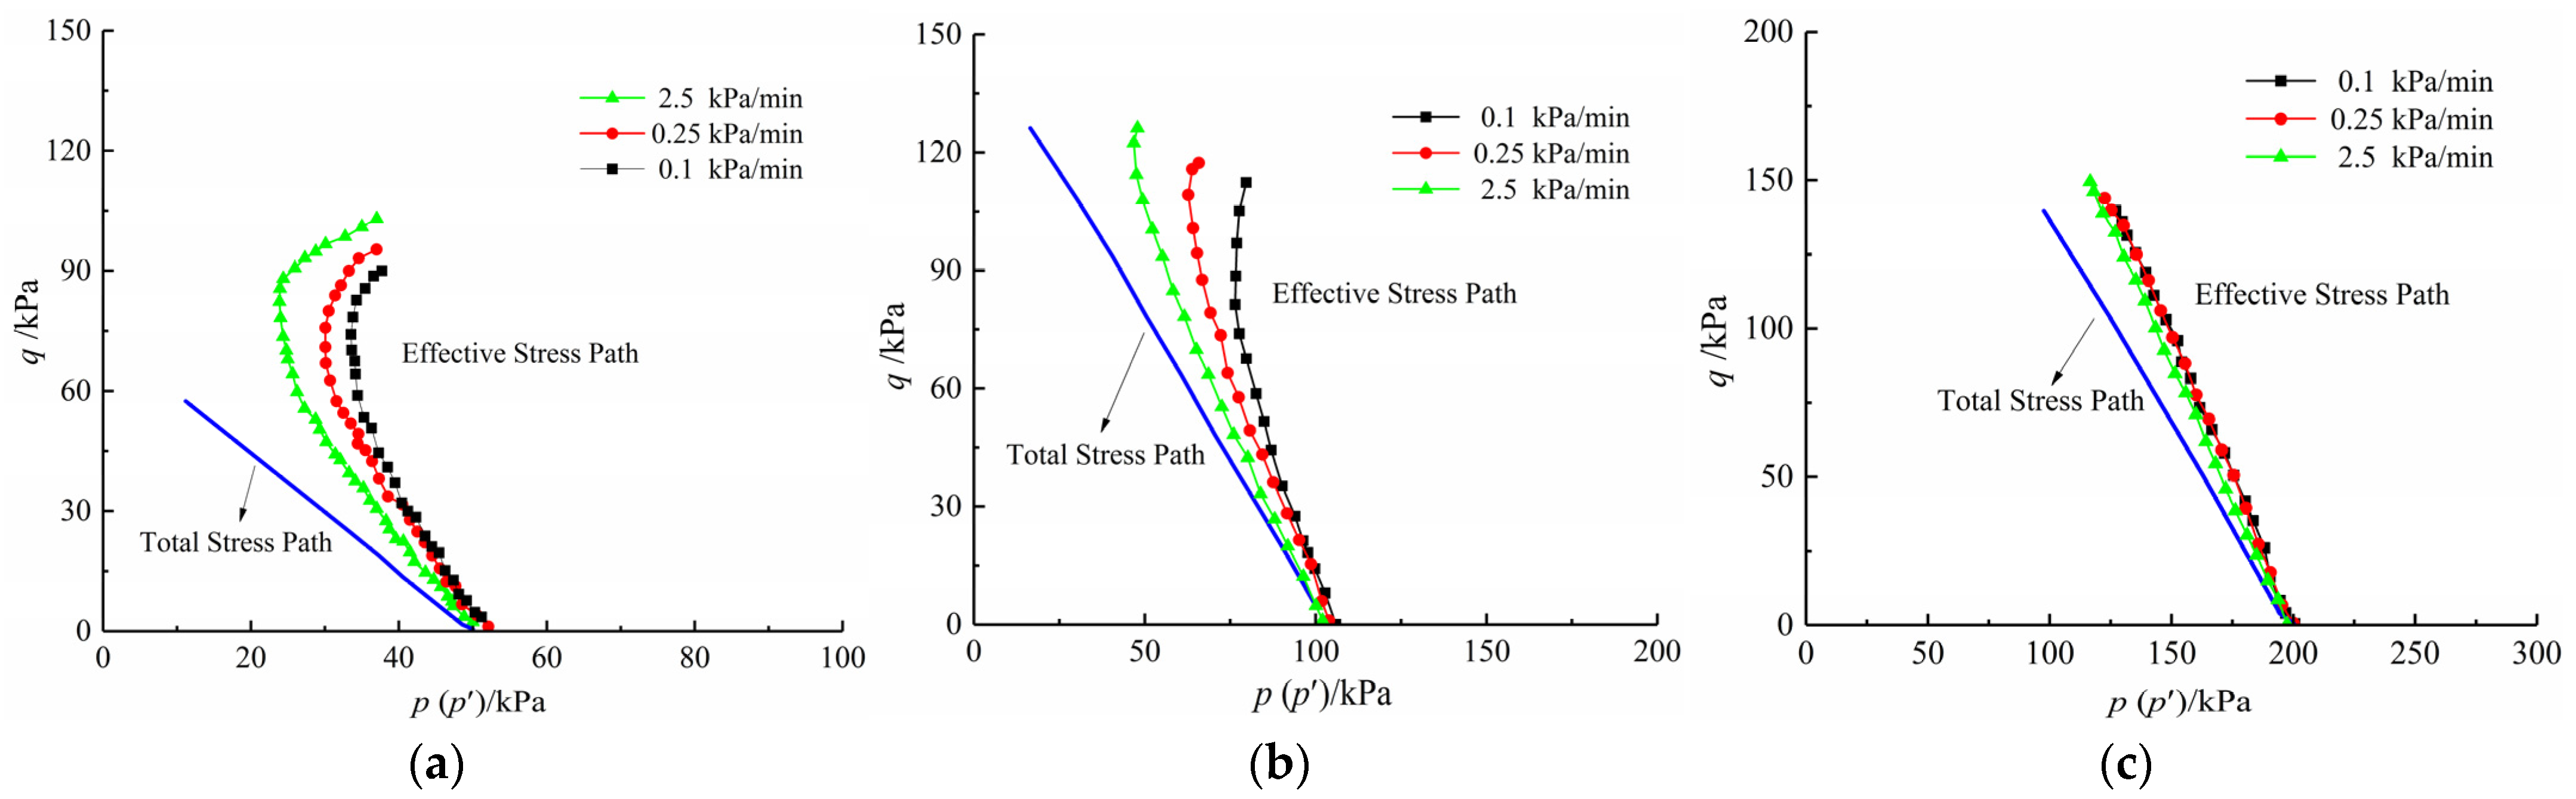
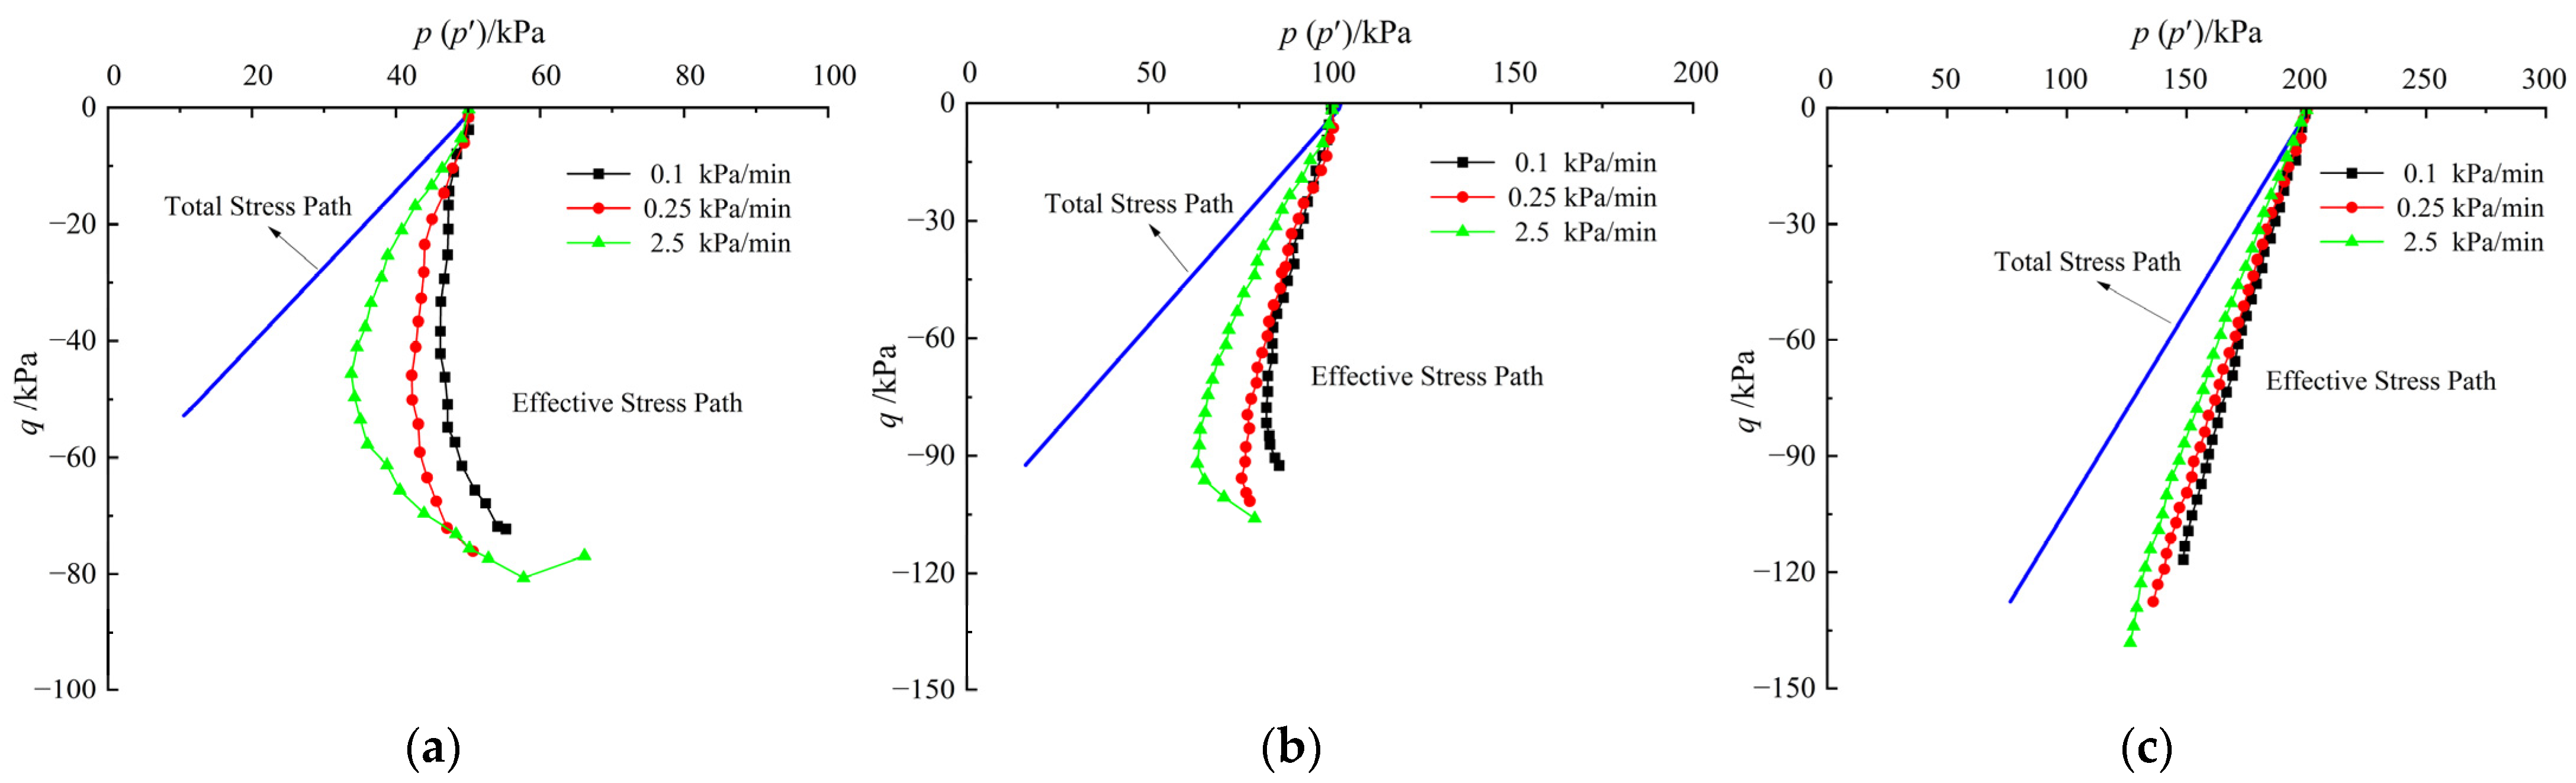
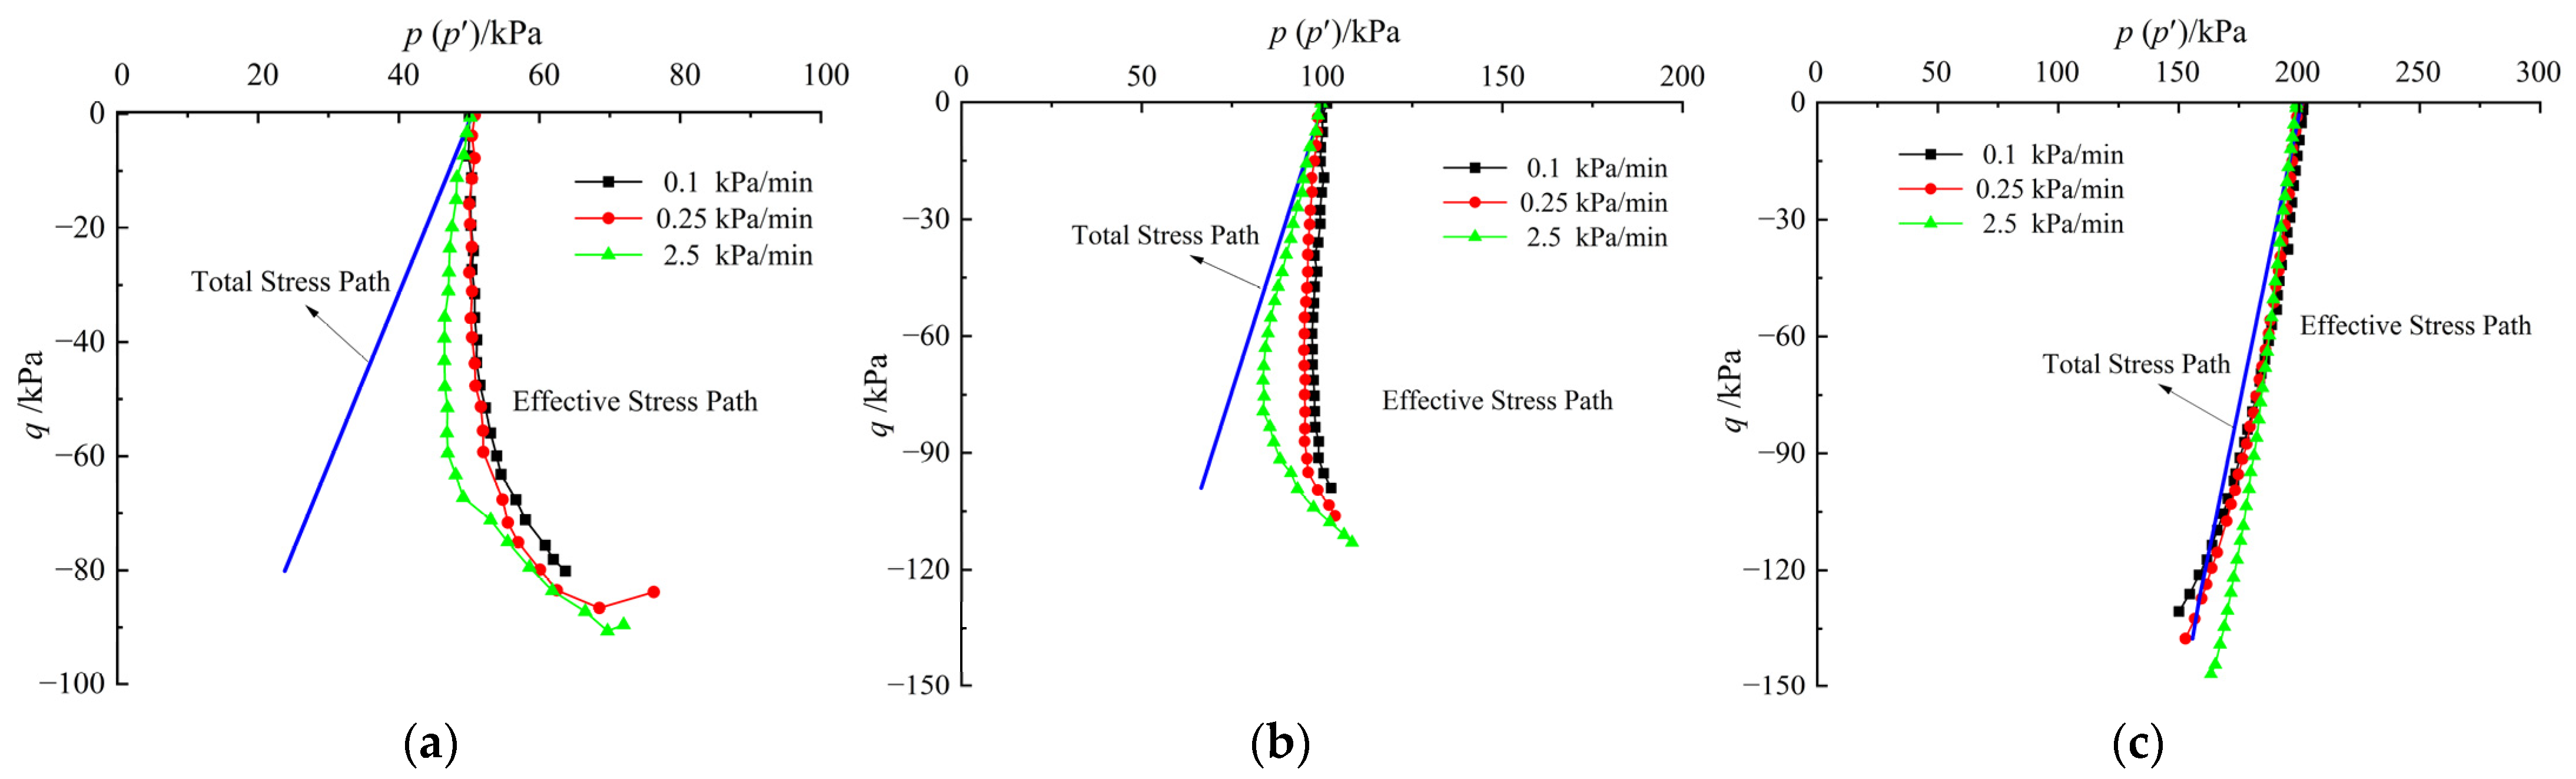
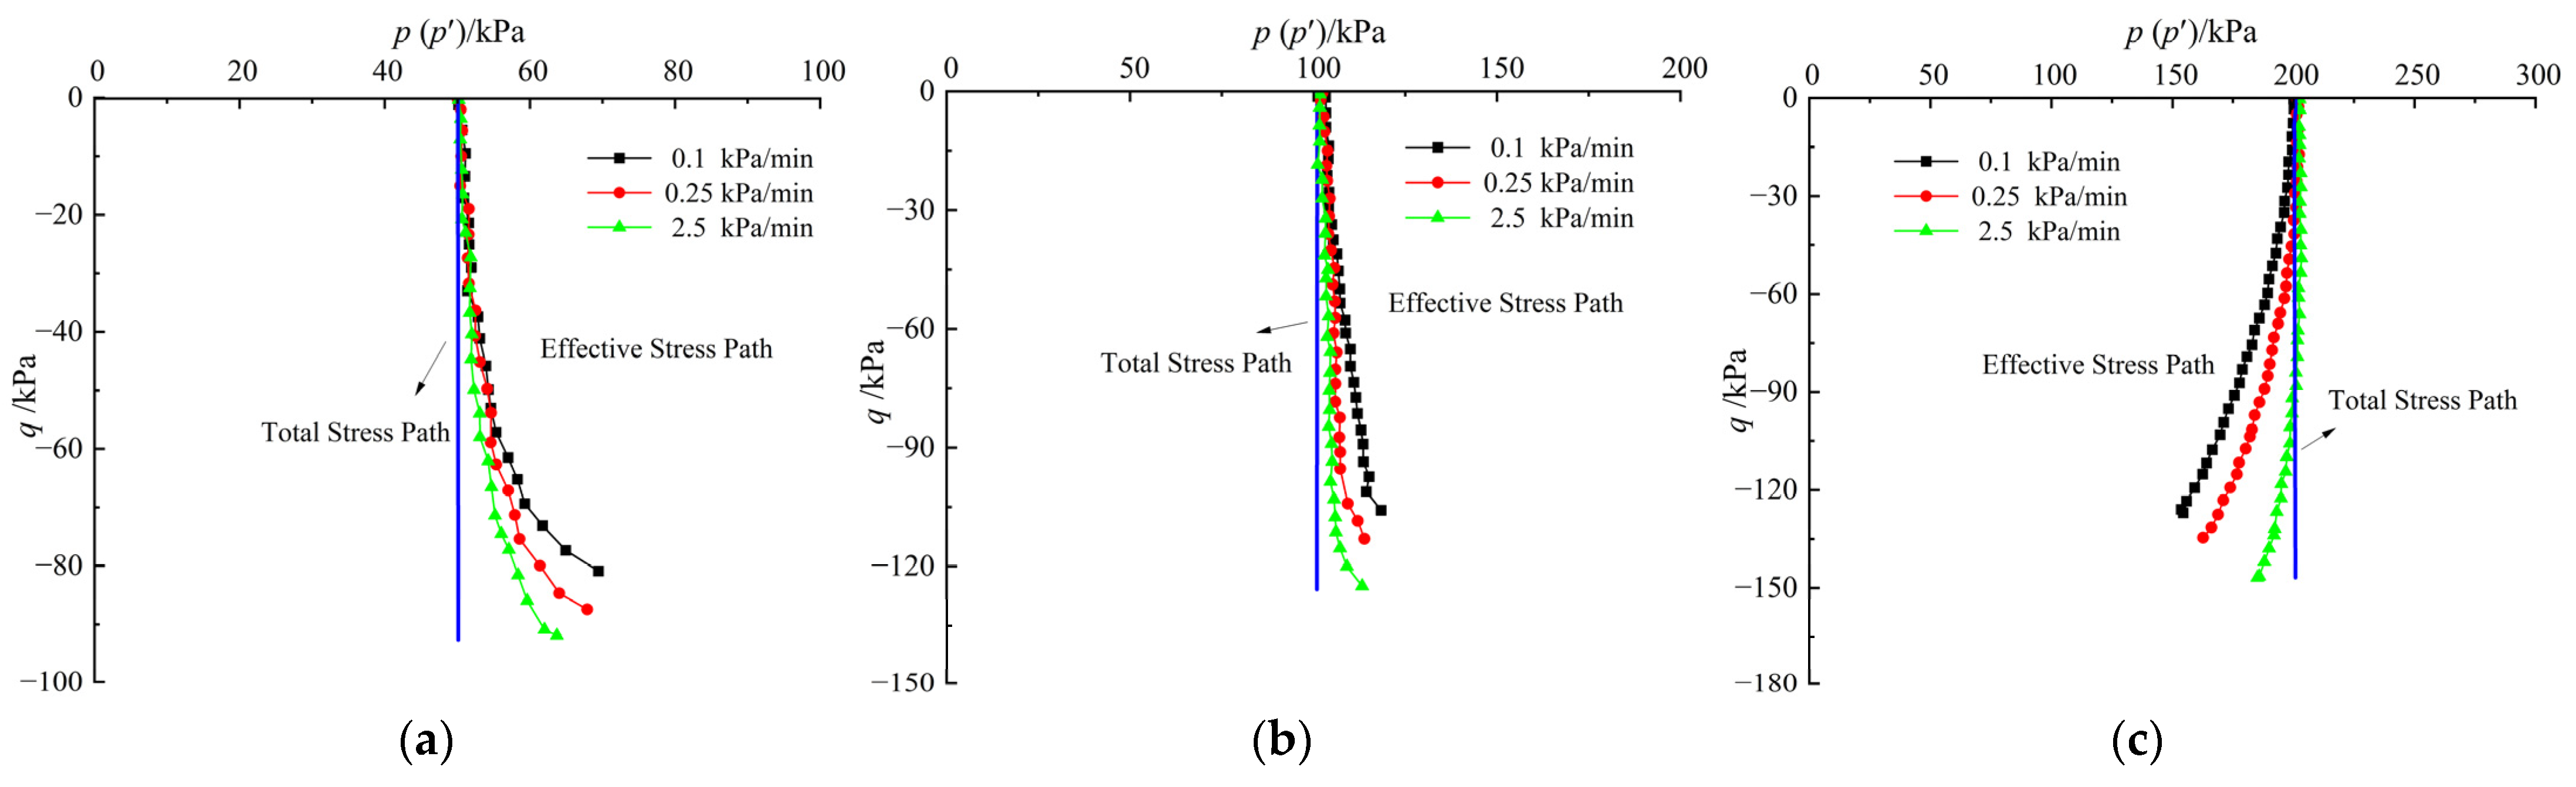
3.3. Effect of Unloading Rate on Stress Path
The total and effective stress paths of the Zhanjiang structured clay under different unloading paths are depicted in
Figure 15,
Figure 16,
Figure 17 and
Figure 18. It can be seen from the figures that when the unloading path is the same, the change trends of the total stress paths under different consolidation pressures are basically the same, and all of them develop according to the stress path in the set
p-
q plane. The test consistency was good, indicating that the results of this experiment were reliable. Additionally, the development laws for the effective stress paths of the Zhangjiang structured clay under different unloading rates are essentially the same. In the initial shearing, the effective stress path was linear, and the difference in the stress rate was manifested in the stress path by the different ratios of
dq/
dp′, which was at the stage of a large increase in the deviatoric stress in the smaller strain range of the stress–strain curves. Due to the low permeability of clay, there is hysteresis in the growth of the pore water pressure, resulting in small differences in the pore water pressure at different unloading rates; therefore, the effective stress paths overlap in the initial stage of shearing. As shearing continued, the pore water pressure in the specimen began to increase rapidly; therefore, the effective stress path and the total stress path at different stress paths began to separate. Moreover, with decreases in the unloading rate, the deflection range of the effective stress path became continually larger, which coincides with the largest variation range in the pore pressure at the unloading rate of 0.1 kPa/min in the pore water pressure and strain relationship graph.
The effective stress path of the specimen under the CU−1.5 and UU1.0 unloading stress paths remains on the right side of the total stress path, which is because the pore water pressure of the specimens under these paths is always negative. Additionally, under the UC3.0 and UL∞ unloading stress paths, the pore water pressure of the specimens is negative at small confining pressure, and the effective stress path is on the right side of the total stress path; however, when the confining pressure is large, the pore water pressure changes from negative to positive with development of the axial strain, and the effective stress path gradually inclines from the right side to the left side.
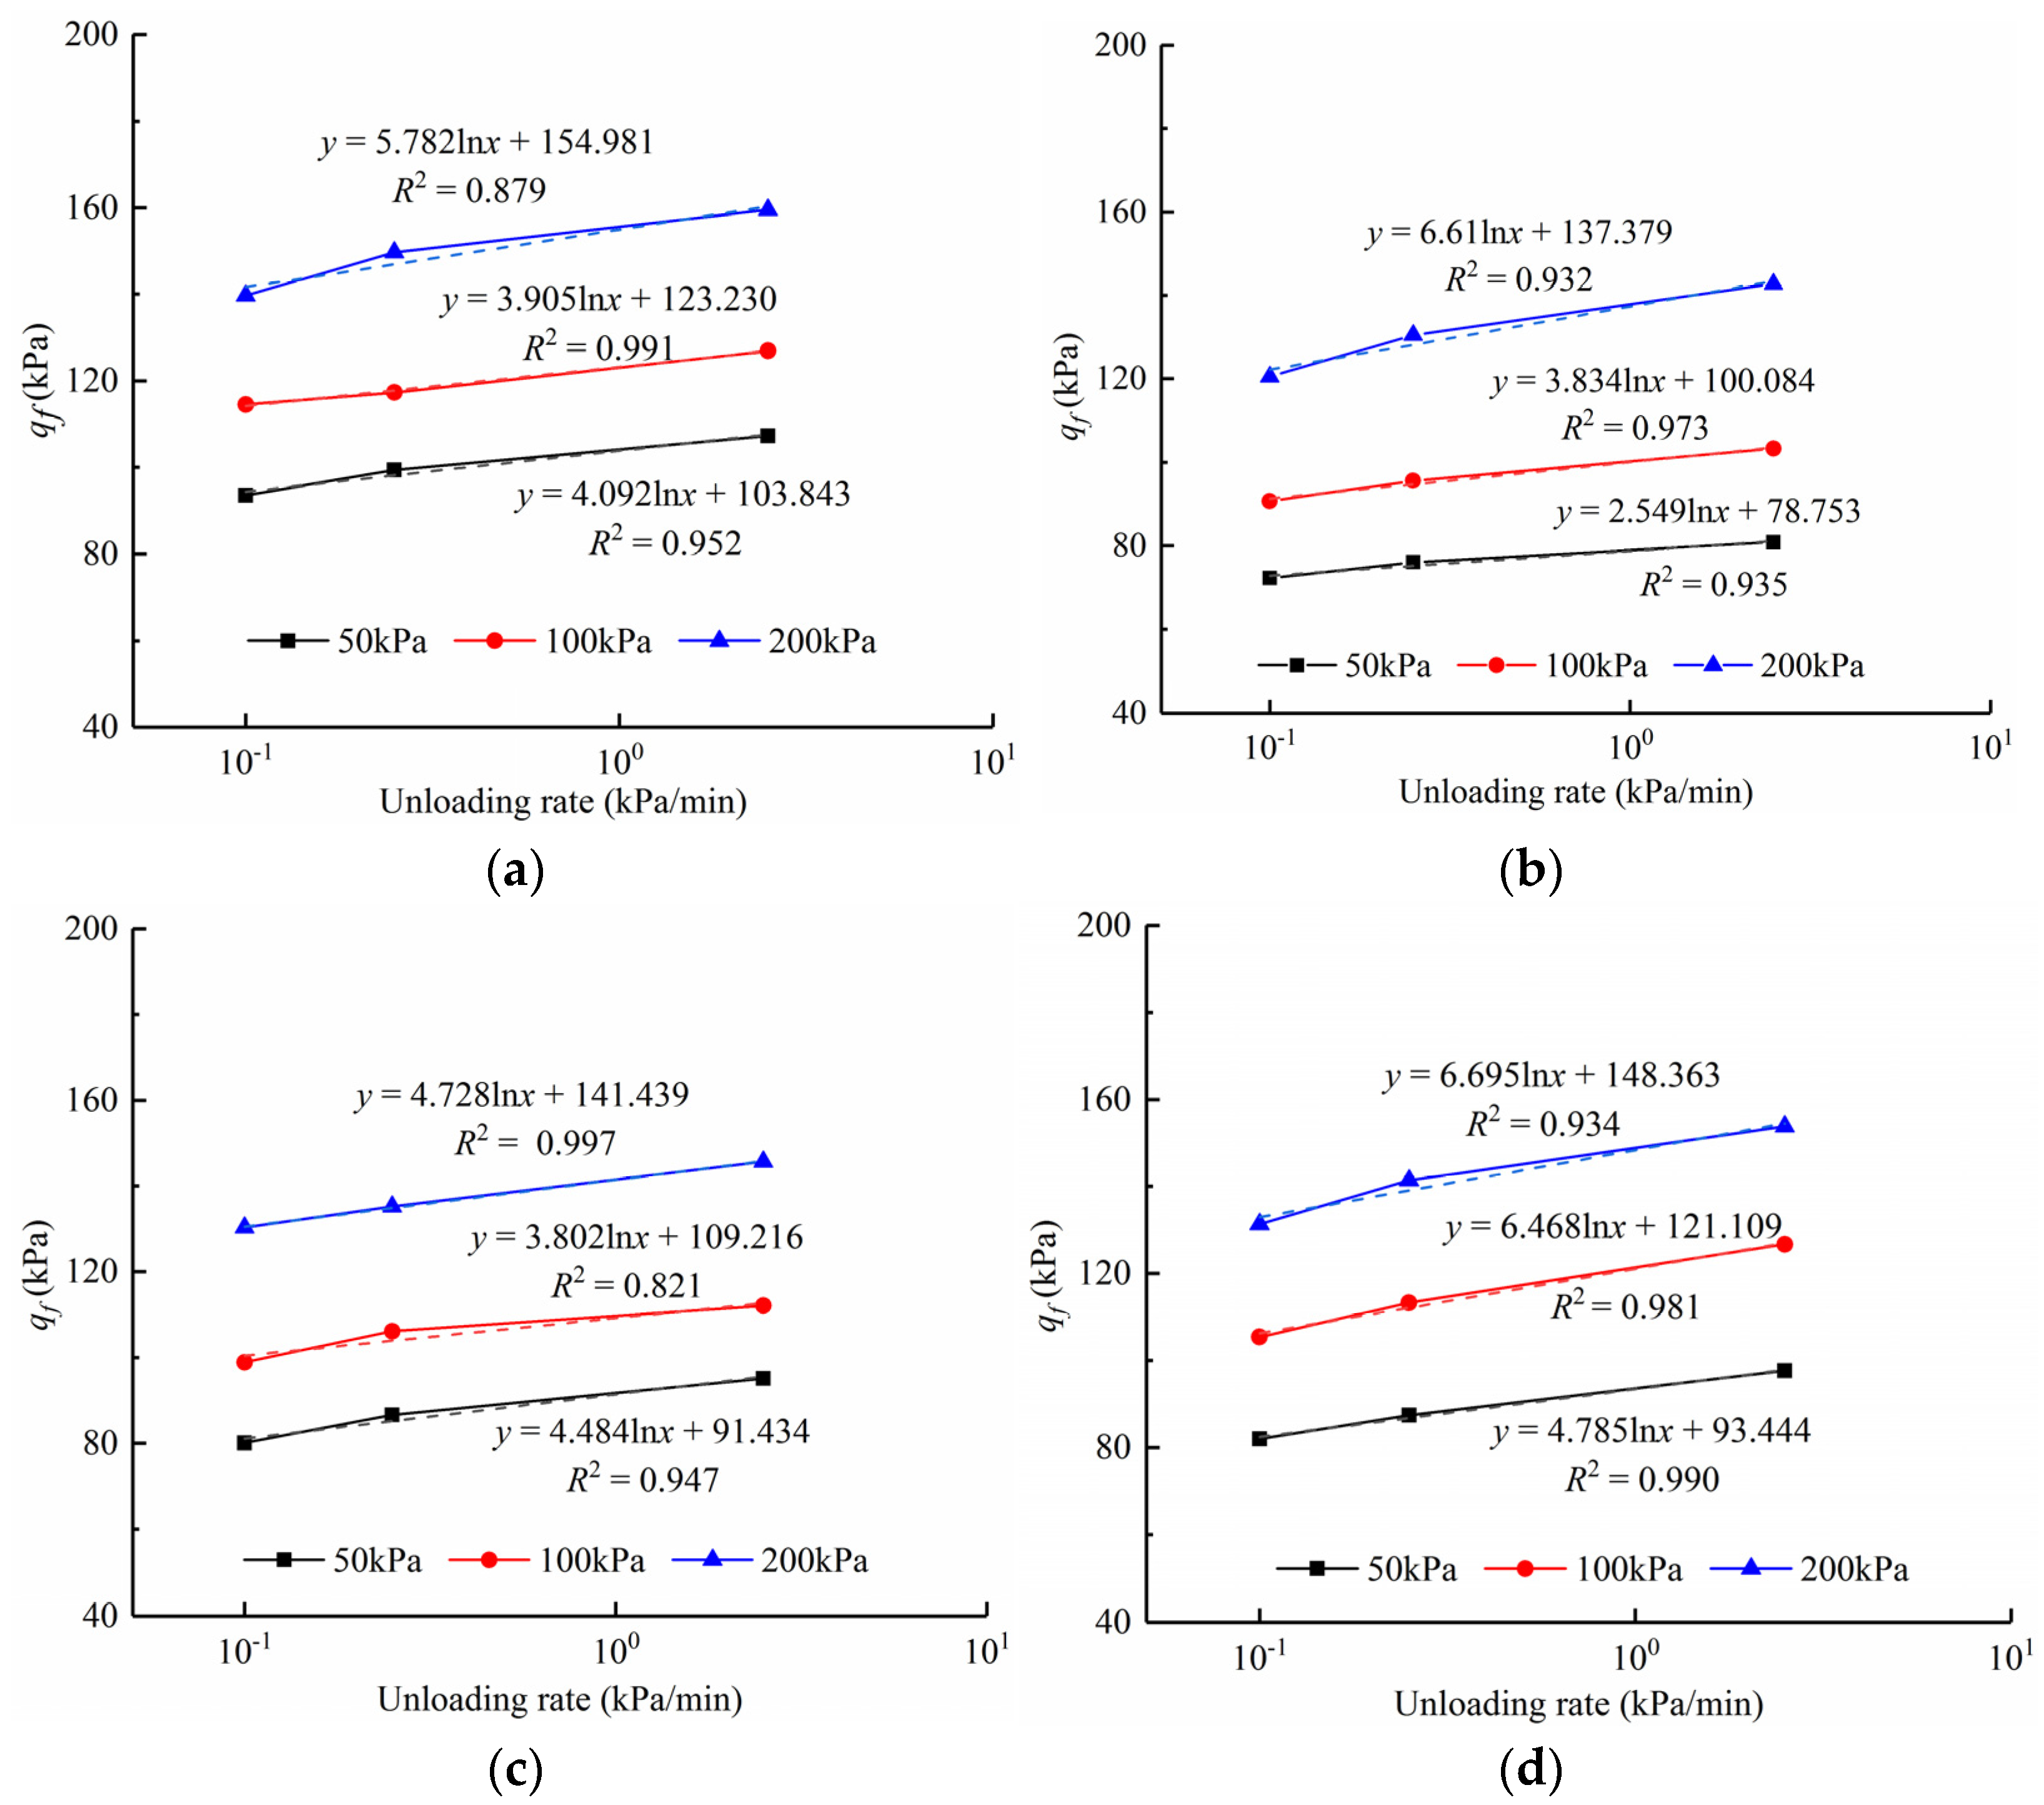
3.4. Expressions for Unloading Rate Parameters
The relationship curves for the failure strength and unloading rate of specimens under different unloading paths are presented in
Figure 19. It can be observed from the figures that the unloading strength of the specimens varies in magnitude at different consolidation pressures, and the larger the confining pressure, the greater the influence of the unloading rate on the unloading strength of the soil. The unloading strength of the soil under the UU
1.0 unloading path was the smallest, followed by that under UC
3.0, and the largest was under the UL
∞ path. Additionally, under the same unloading path, the failure strength of the soil increased with increasing unloading rate, and the failure strength of the soil increased more when the unloading rate increased from 0.1 to 0.25 kPa/min, while the failure strength of the soil increased relatively less when the unloading rate increased from 0.25 to 2.5 kPa/min.
A linear relationship was determined between the undrained shear strength and the unloading rate. Under the same unloading path, the soil unloading strength increased with the unloading rate, and the cohesion varied significantly with an increase in the unloading rate; however, the internal friction angle did not vary significantly. The cohesion and internal friction of clay do not work simultaneously. Cohesion is characterized by brittle properties and can reach its maximum value under a small strain, whereas internal friction can only be fully exerted after considerable deformation has occurred. Moreover, the cohesion and internal friction exerted different degrees under different strain conditions, which were controlled by the shear rate. In addition, there may be differences in the strain between the cohesion and internal friction that fully functioned under different shear rate conditions. When the unloading rate is small (e.g., 0.1 kPa/min), the cohesion and internal friction of the soil act synchronously in a smaller proportion, and the failure strength is lower. Moreover, when the unloading rate increases to a certain level (e.g., 0.25 kPa/min), the proportion of the cohesion and internal friction of the soil acting synchronously increases, and the soil in the shear process, must overcome the rotation, rolling, and displacement resistance of the particles in addition to overcoming the slippage between the particles, which leads to a greater increase in the failure strength. Moreover, with a further increase in the unloading rate (e.g., 2.5 kPa/min), although it is also necessary to overcome the particle rotation, rolling, and other resistances, the proportion of cohesion and internal friction acting synchronously decreases, and the degree of growth of the failure strength decreases.
To quantitatively describe the effect of the unloading rate on the undrained strength, we refer to the equation of the undrained shear strength unloading rate proposed by Li et al. [
18], expressed as:
where
is the reference unloading rate (here,
= 0.1 kPa/min);
is the unloading rate parameter under the reference unloading rate
;
is the undrained shear strength under the reference unloading rate
;
represents the increase in undrained strength corresponding to the increase in the unloading rate
in logarithmic coordinates.
The calculated results for unloading rate parameter
ρ0.1 under different unloading paths are shown in
Table 5. For the consolidation pressures of 50, 100, and 200 kPa,
ρ0.1 under the CU
−1.5 passive compression path is 6.09%, 4.22%, and 2.92%, respectively, and the average value is 4.41%. Meanwhile, the average values of
ρ0.1 under the UU
1.0, UC
3.0, and UL
∞ passive tensile paths and different consolidation pressures are 5.68%, 6.06%, and 9.06%, respectively. This indicates that the change in the unloading rate had a greater effect on the undrained strength under the passive tensile path than under the passive compression path.
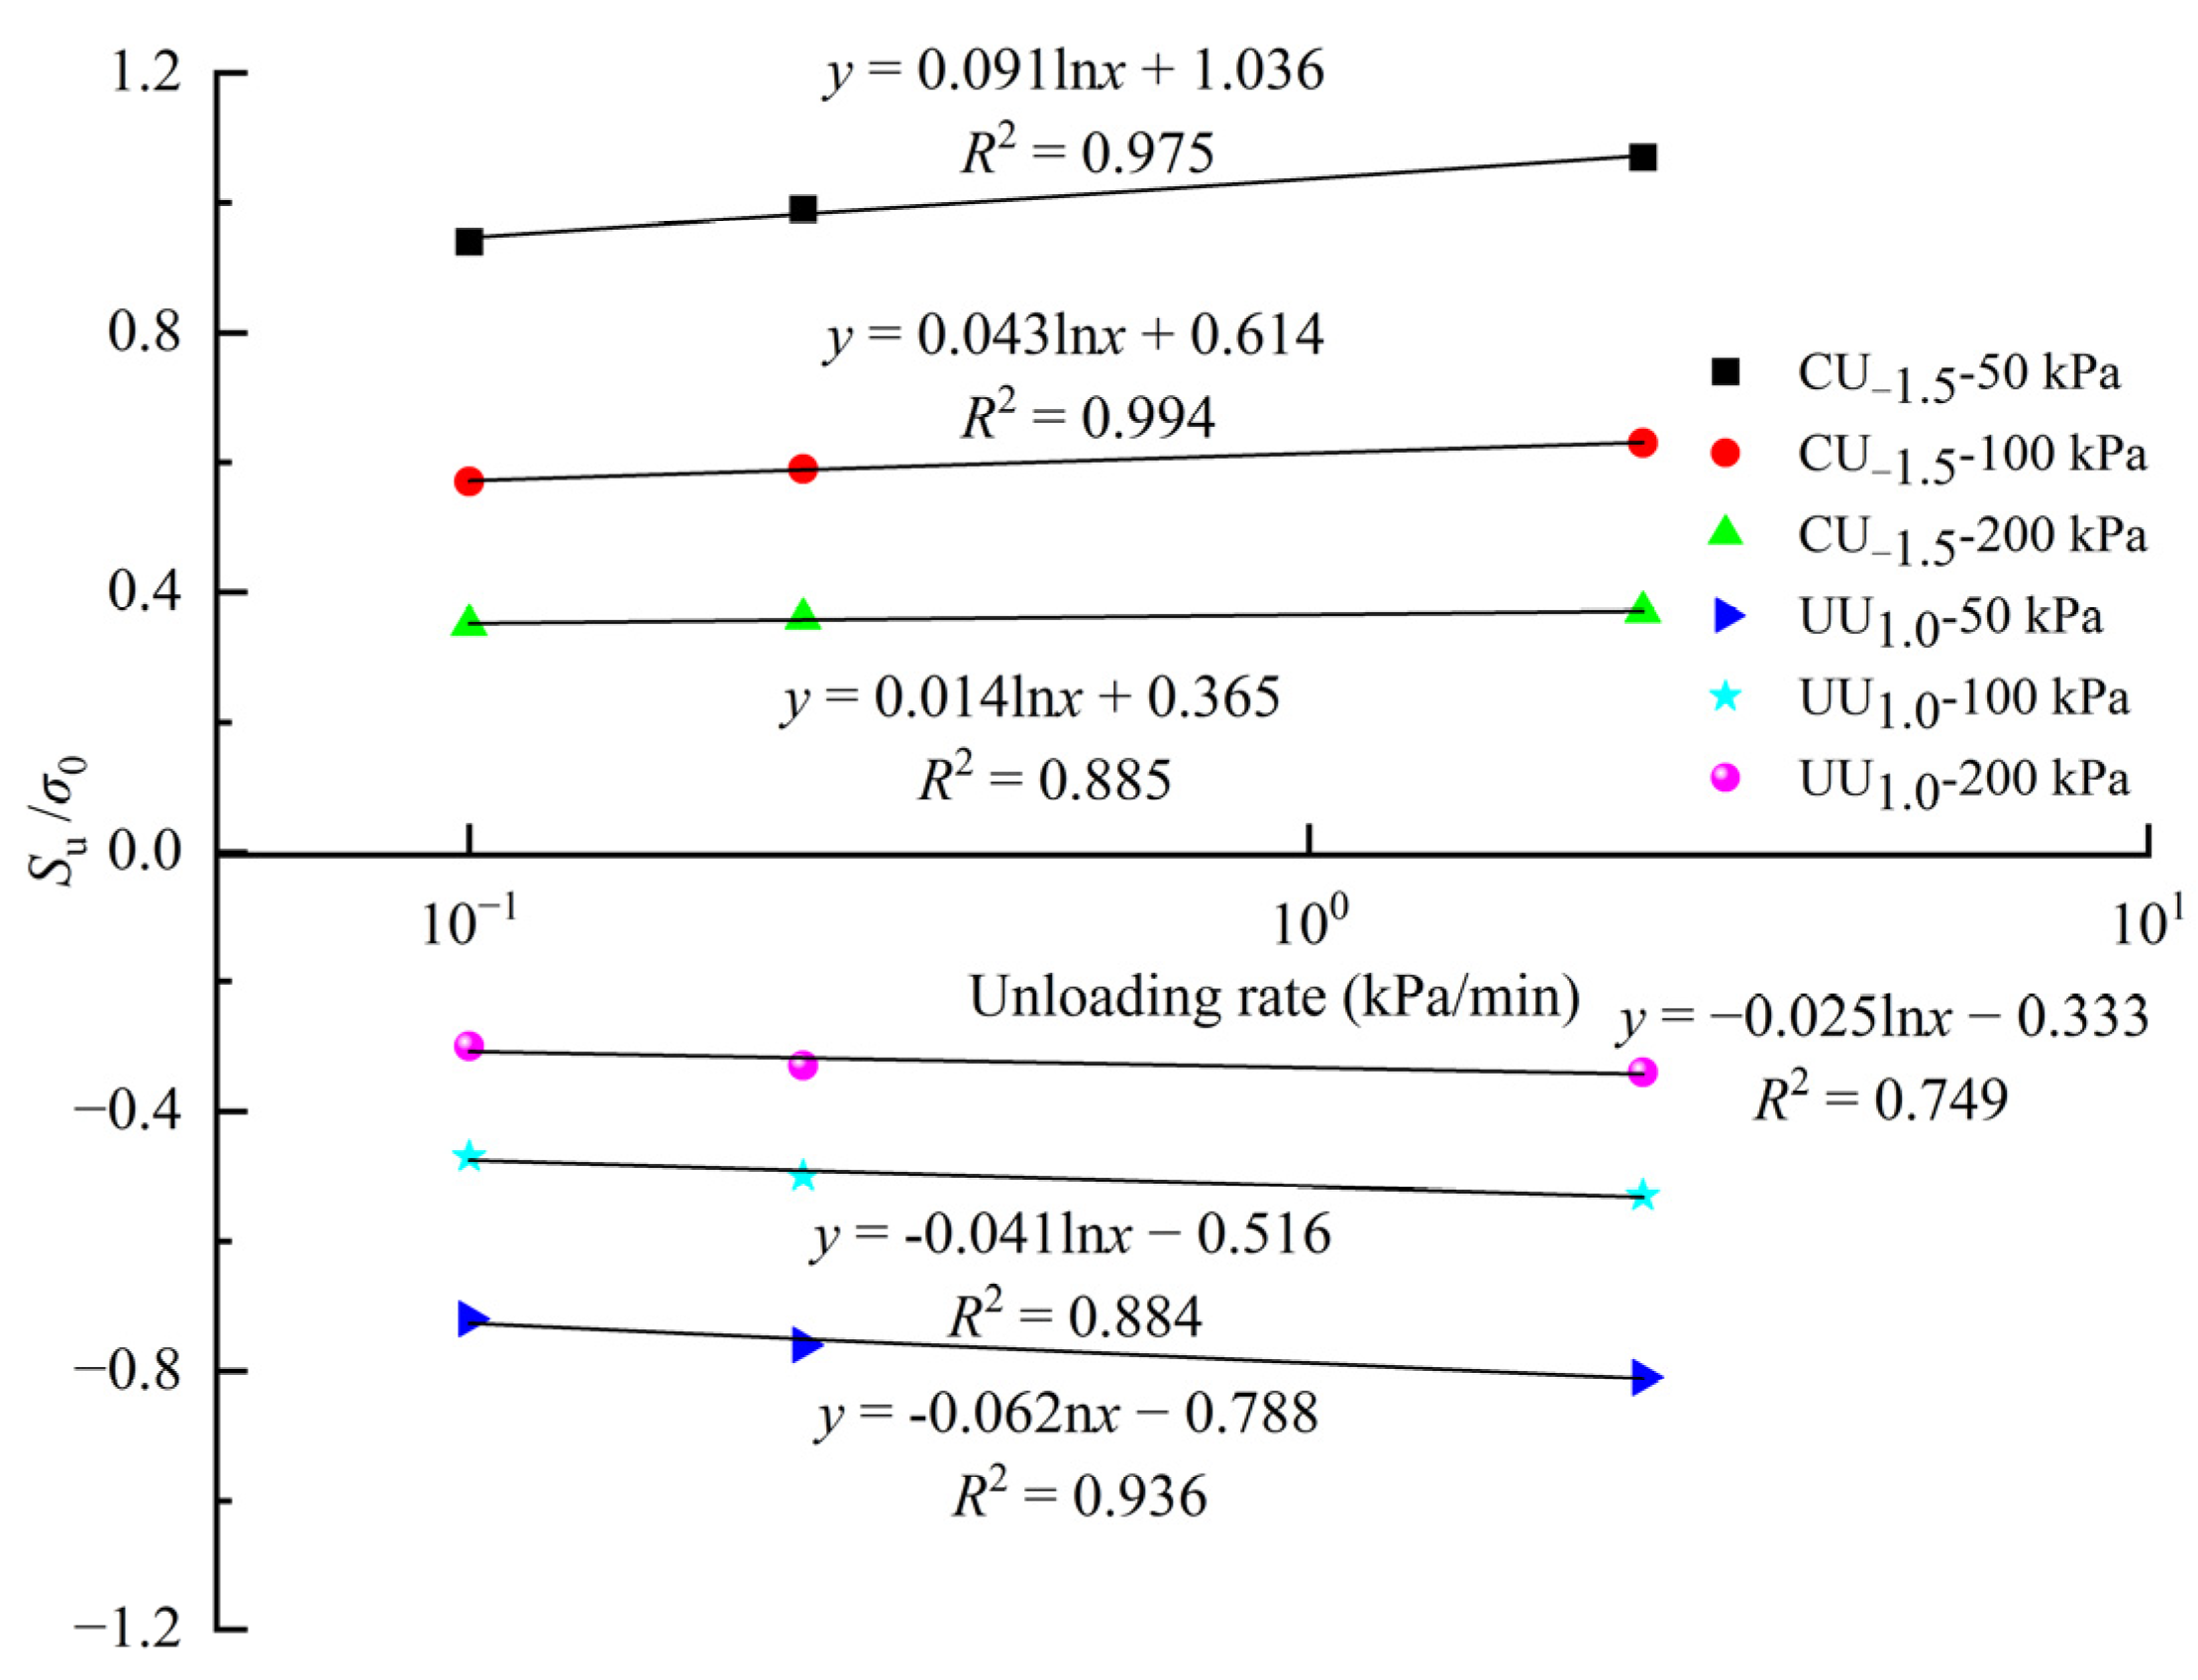
The relationship between the normalized undrained shear strength and the unloading rate was obtained by taking unloading paths CU
−1.5 and UU
1.0 as examples, as shown in
Figure 20. As shown in the figure, the normalized shear strength under the unloading conditions is influenced by the stress path and unloading rate; thus, the mechanical parameters should be selected appropriately in the engineering design.
4. Microstructure Analysis
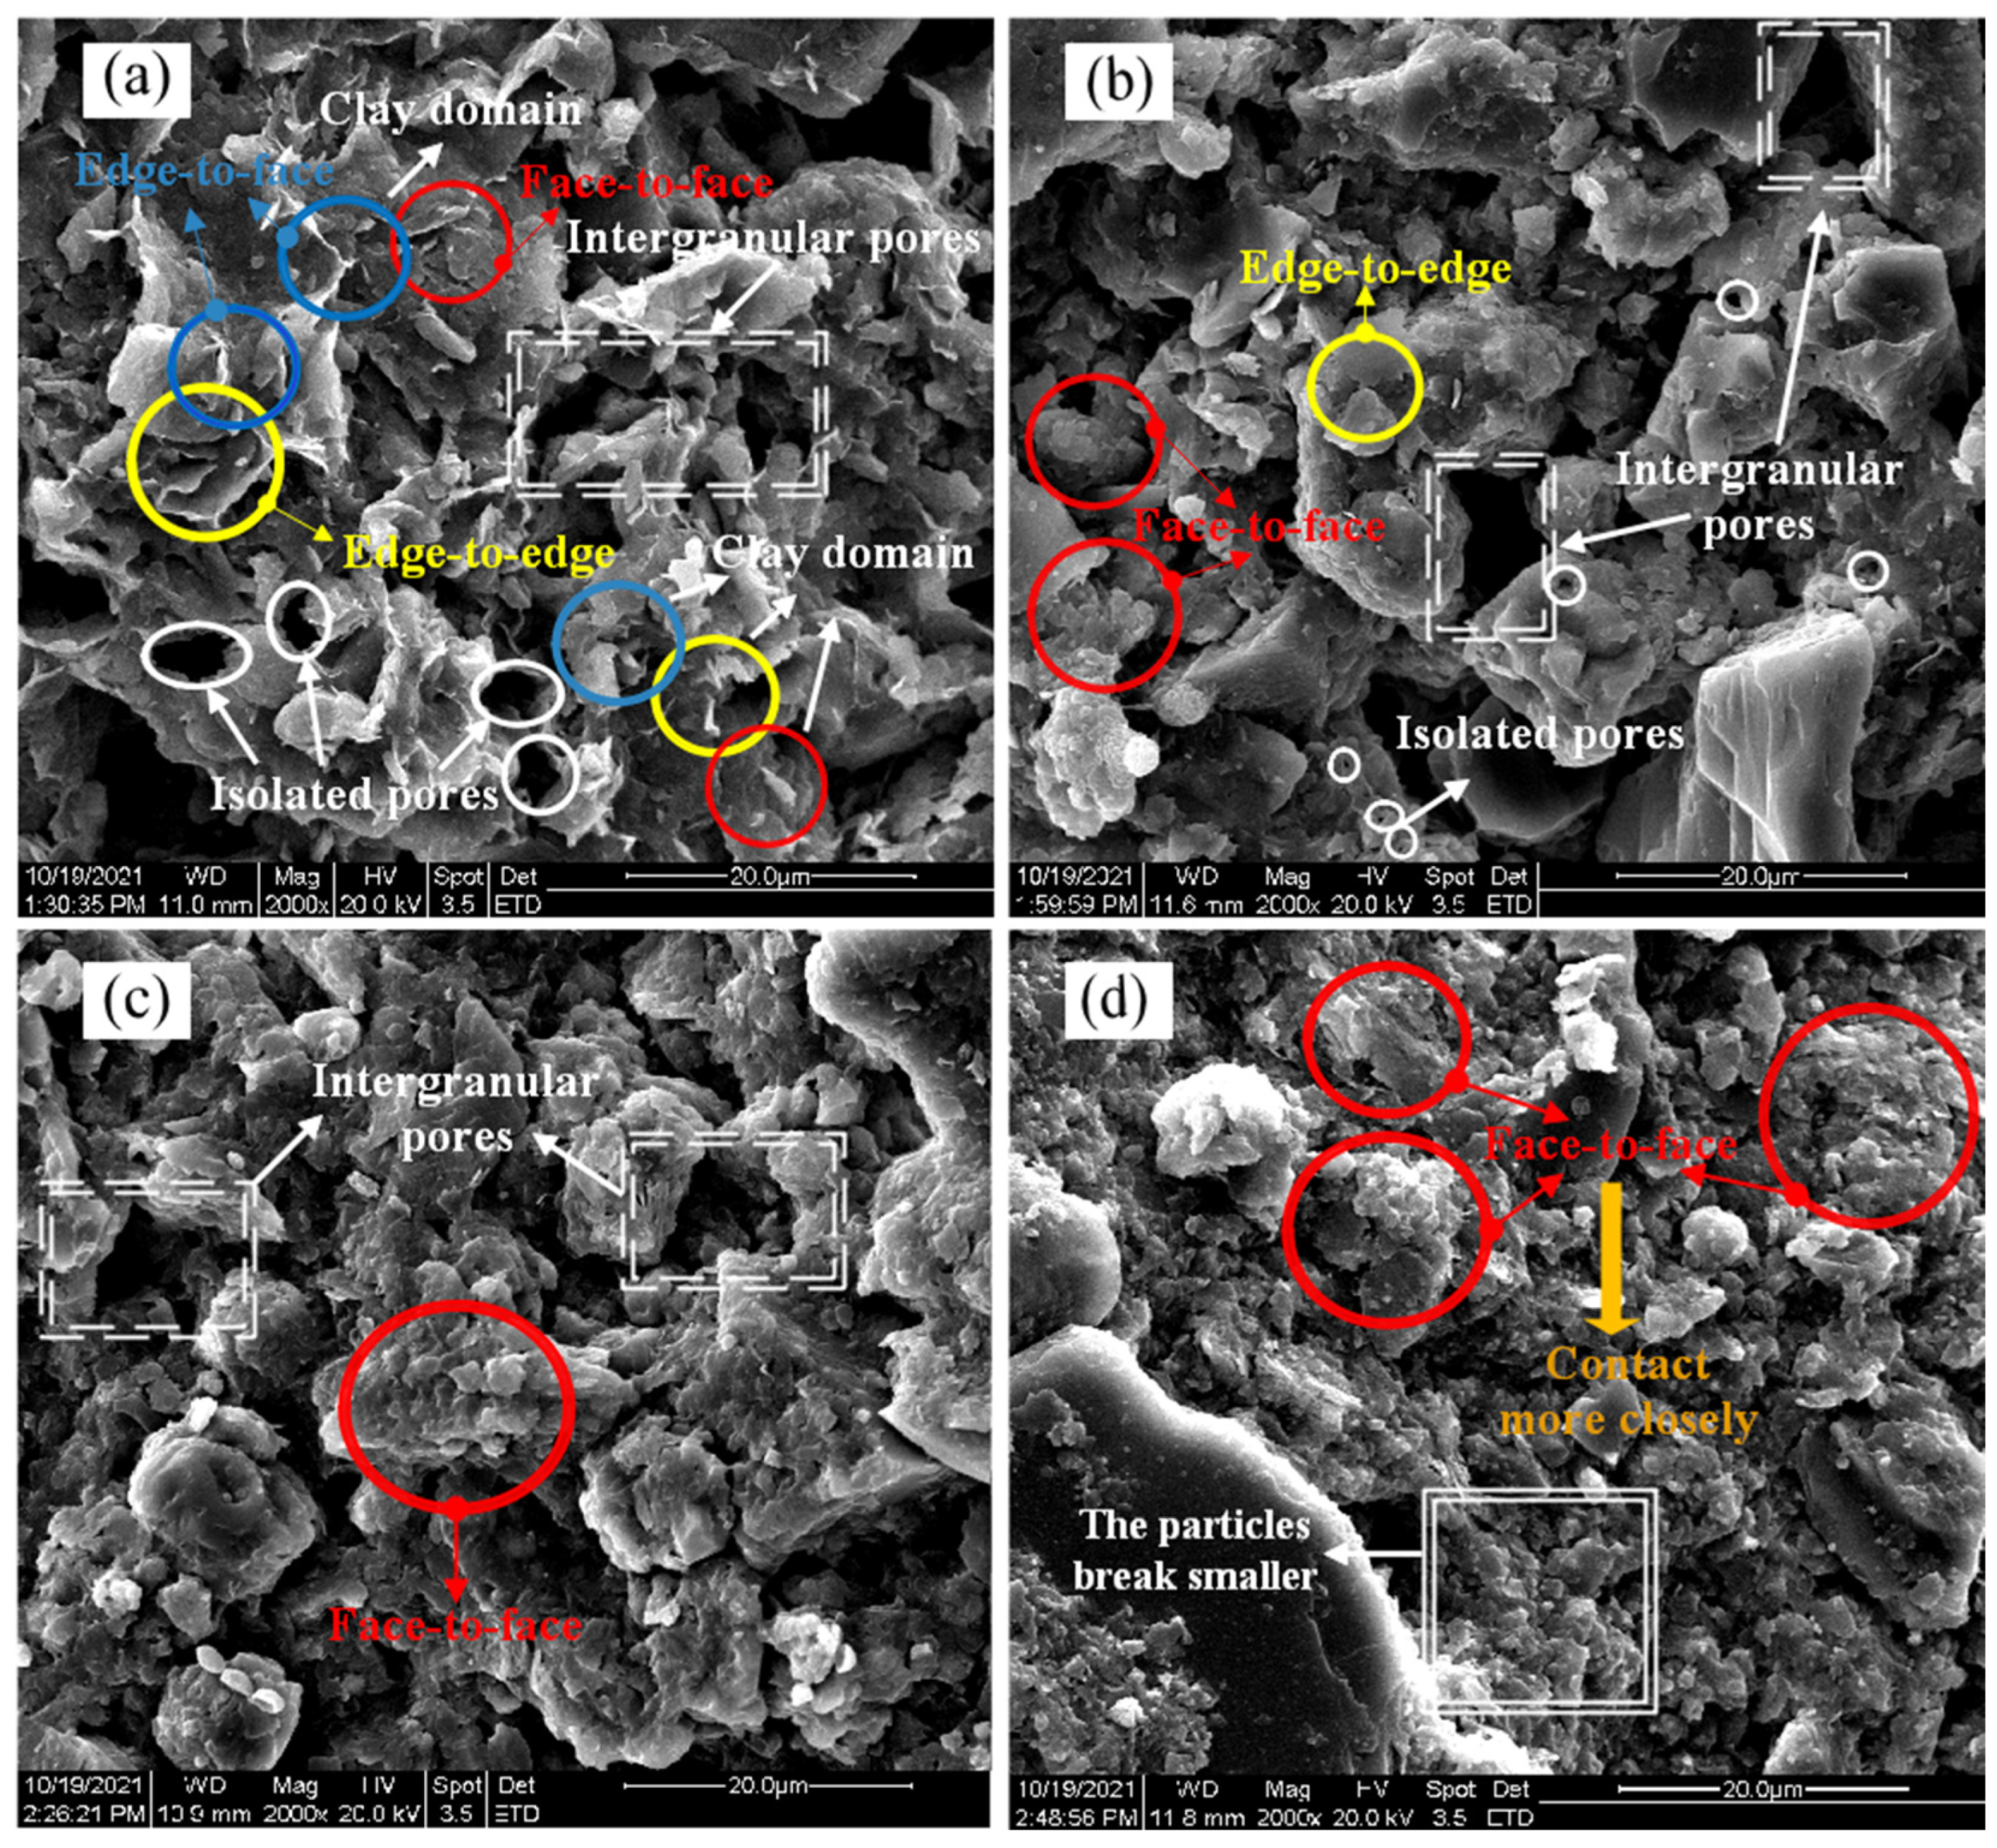
An FEI QUANTA 200 environmental scanning electron microscope was used to conduct scanning electron microscopy (SEM) tests near the shear bands of the undisturbed samples and samples after shear tests at different unloading rates. The specimen for the SEM tests was a cube of 10 mm × 10 mm × 10 mm. Before SEM was performed, a fresh section of the sample was sprayed with gold to increase the electrical conductivity. An image with a representative field-of-view was selected for each sample, as shown in
Figure 21.
The SEM image of the undisturbed soil in
Figure 21a shows curly lamellar mineral particles stacked in sheets. The structure of the Zhanjiang structured clay actually comprises a lamellar-stacked particle unit made of many single lamellae stacked together; specifically, a clay domain consisting of granular clastic minerals and a few monolithic clay mineral particles. The flattened lamellar pile and the single lamellar are dominated by edge–face contacts and edge–edge contacts, while a small amount of face–face contacts form a directional disorderly open flocculation structure. Additionally, the pores in the Zhanjiang structured clay existed mostly in the form of intergranular pores and a small number of isolated pores. The isolated pores were large and discontinuously distributed, mostly in the shape of circles or ellipticals, whereas the intergranular pores appeared as sub-stable polygons.
From
Figure 21b, it is clear that when specimens were shear damaged at the rate of 0.1 kPa/min, the arrangement between the basic units became closer due to the slow unloading rate. It is also apparent that the arrangement of soil particles maintained some lamellar single-sheet stacks, and some of the clay mineral aggregates broke into fine soil particles. Between the particles, there were mainly face–face contacts, a small number of edge–edge contacts, and the arrangement was not directional. Moreover, intragranular pores remained, and some of the pores gradually broke into smaller ones.
From
Figure 21c, it can be seen that when the specimens were shear damaged at the rate of 0.25 kPa/min, with an increase in the unloading rate, the breakage of soil particles became more significant than that at 0.1 kPa/min, and the soil particles comprised a small number of lamellar forms and broken fine particles.
As shown in
Figure 21d, when the specimens were shear-damaged at the rate of 2.5 kPa/min, owing to the fast unloading rate, the soil skeleton of the specimen was rapidly destroyed by shearing. The flocculation structure in the natural state disappeared, replaced by the face-to-face and point-to-face contacts of the large-volume unit body, and the soil particles of the specimen became finer.
The microstructures of the Zhanjiang structured clay changed after shearing tests under different unloading rates, and the clay had no obvious sheet-pile-structured units owing to the destruction of connections, and the amount of intragranular pores decreased.


