


Research on Dynamic Pile-Driving Formula Parameters and Driving Feasibility of Extra-Long PHC Pipe Piles

Abstract
:1. Introduction
2. Materials and Methods
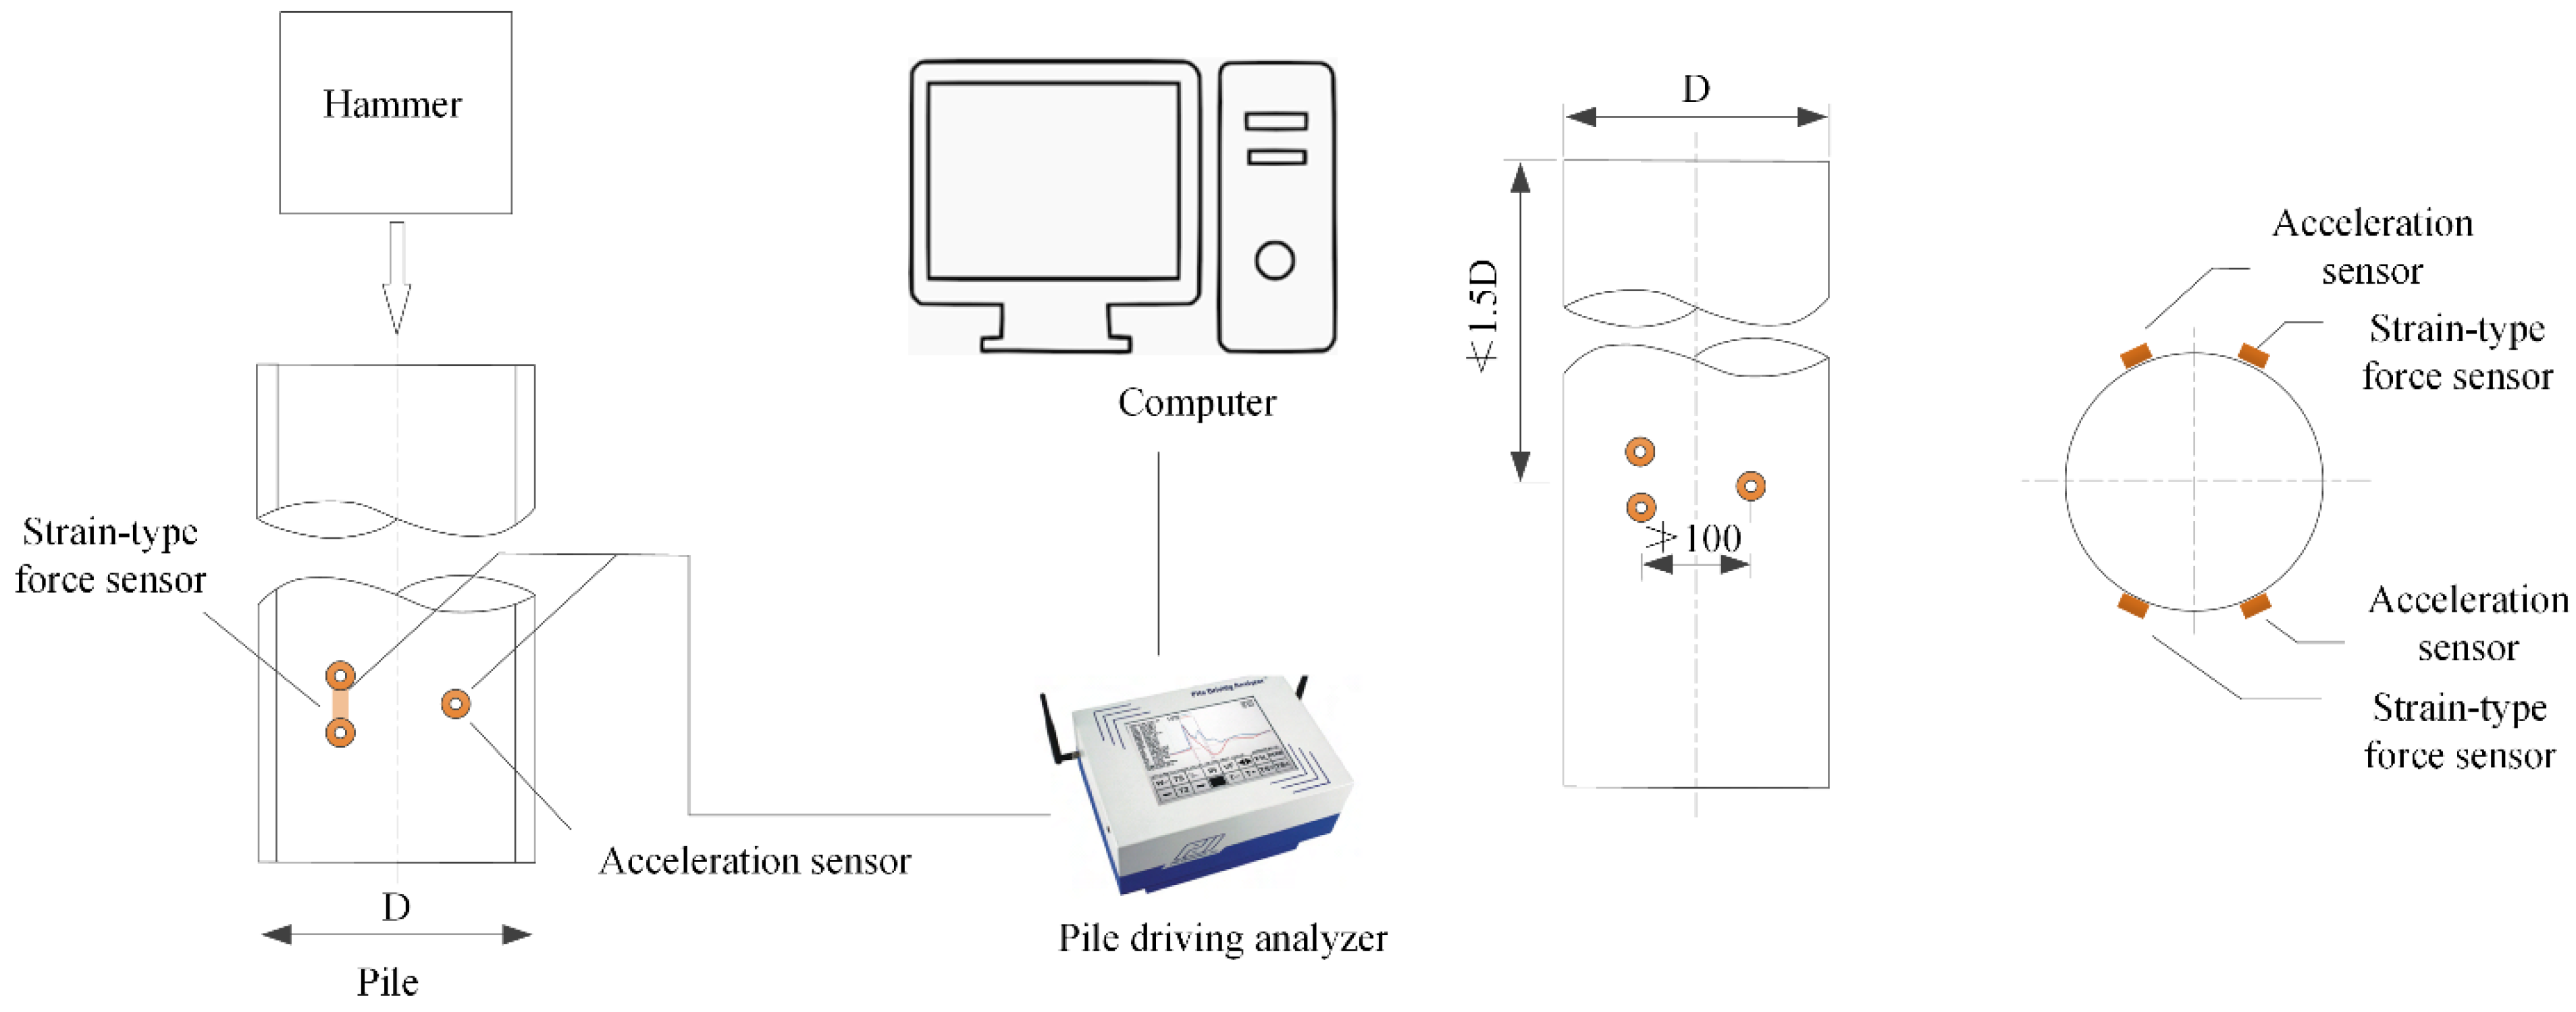
2.1. Piling Dynamic Load Tests [27]
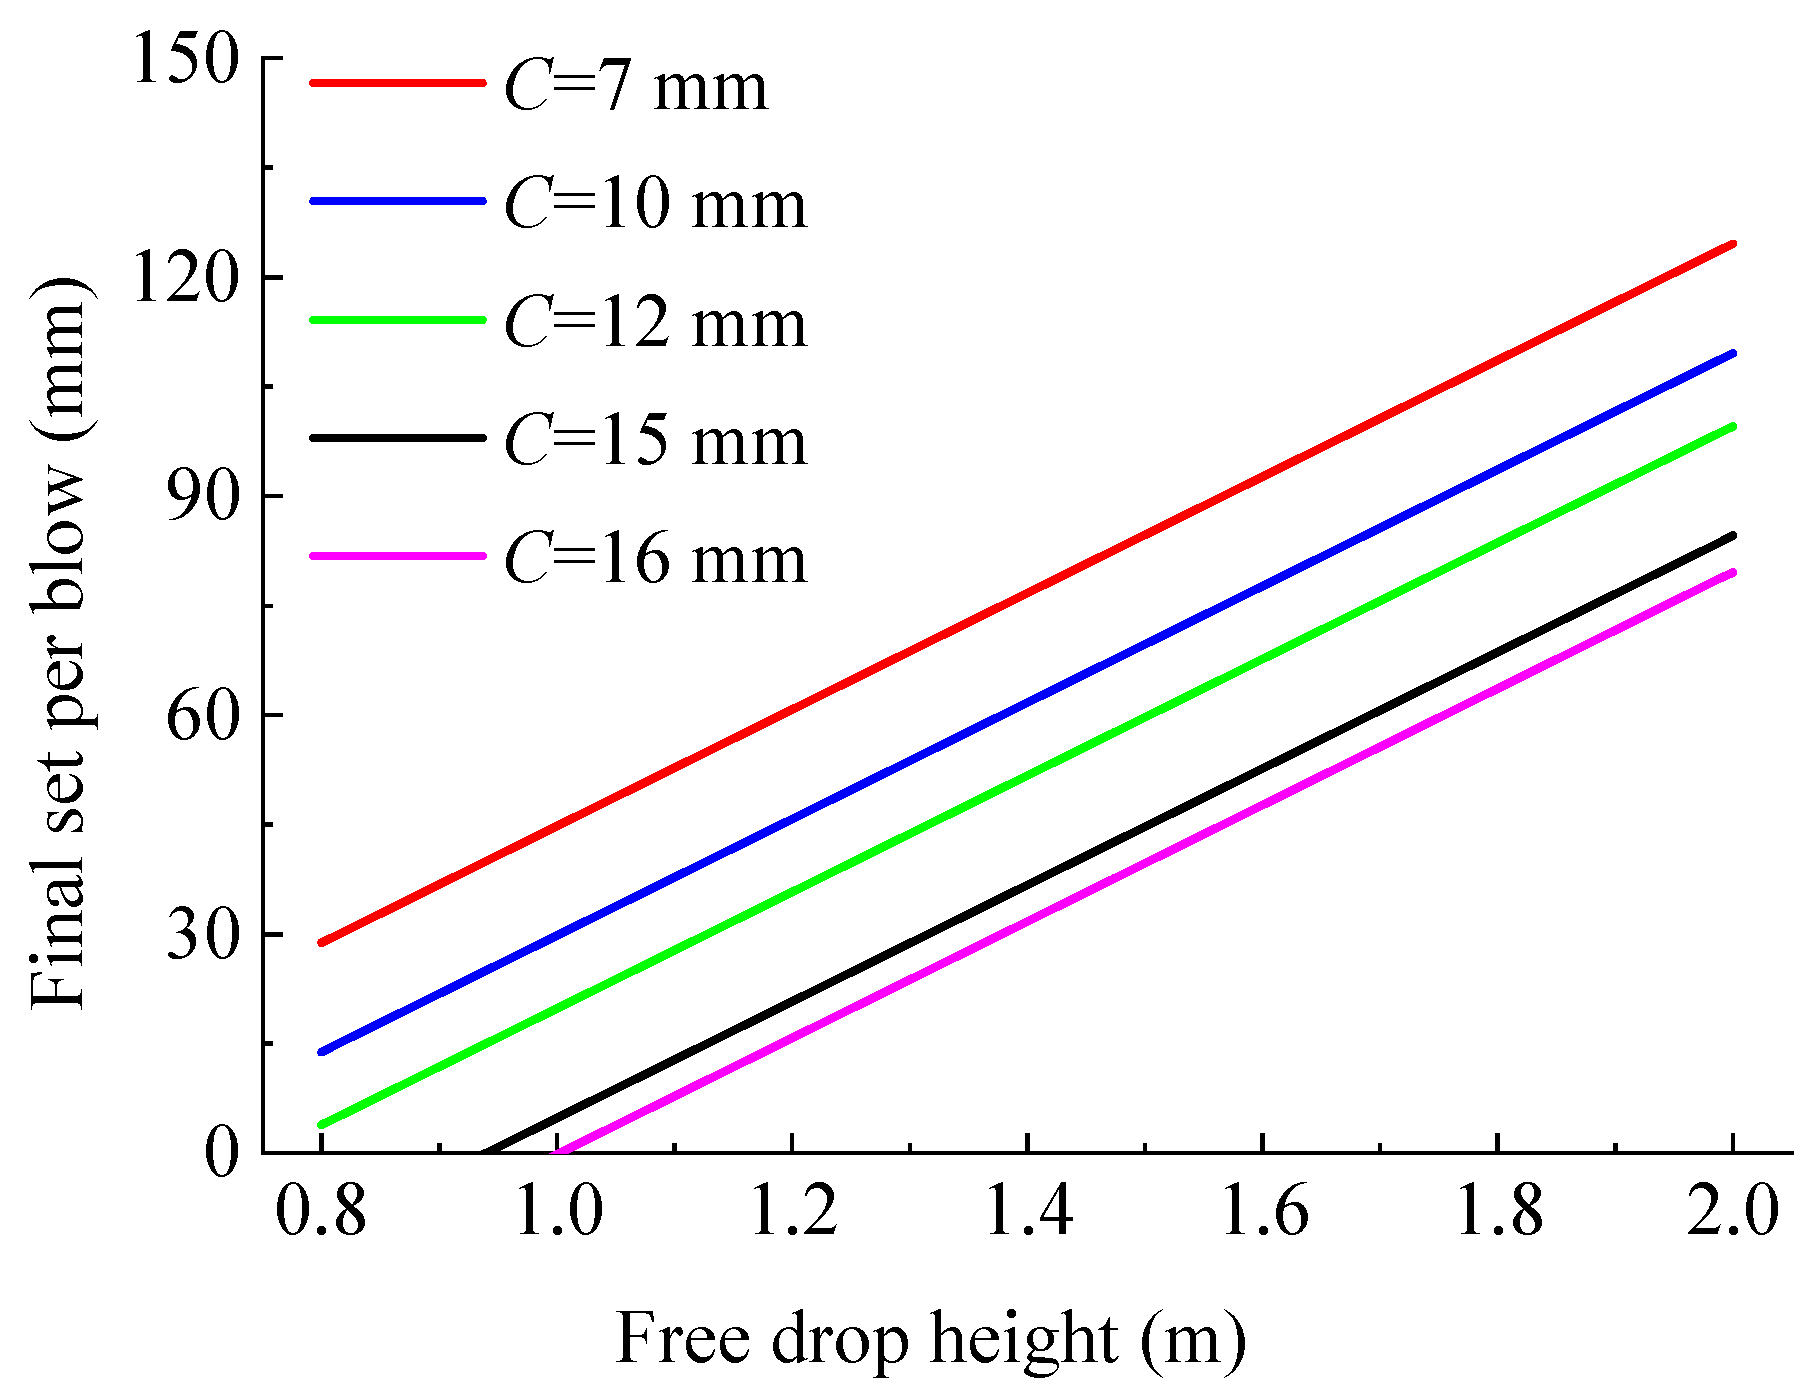
2.2. The Calculation of the Final Set (S)
3. Results and Discussion
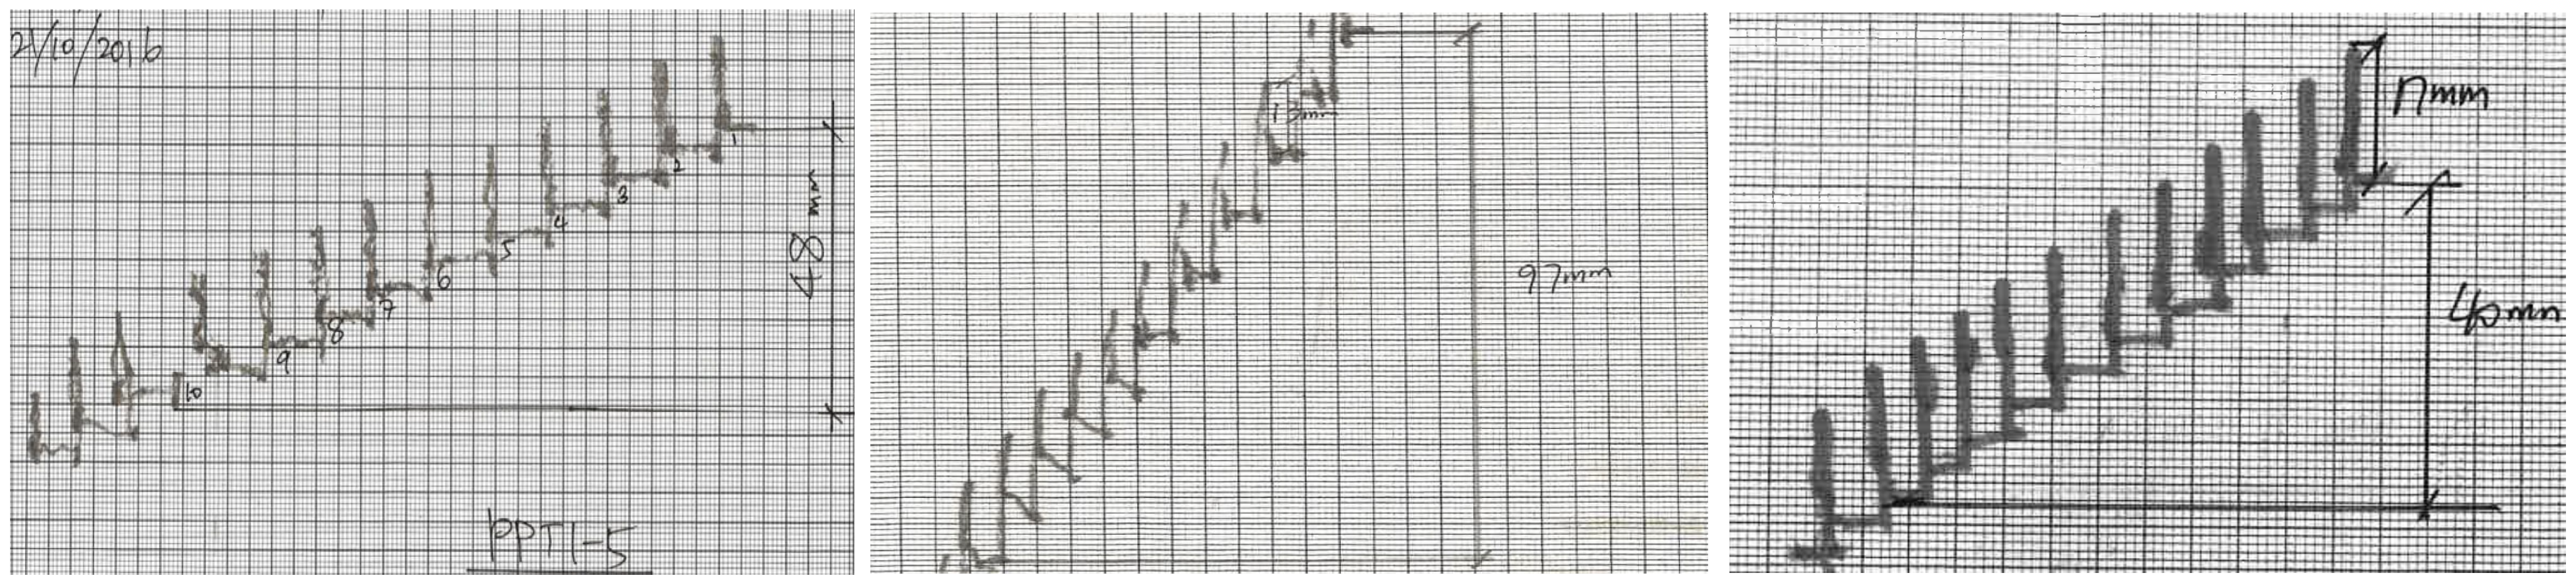
3.1. Results and Analysis of Dynamic Load Pile-Driving Tests
3.2. Analysis of Driving Feasibility
3.3. Parameter Analysis of the Hiley Formula
4. Conclusions
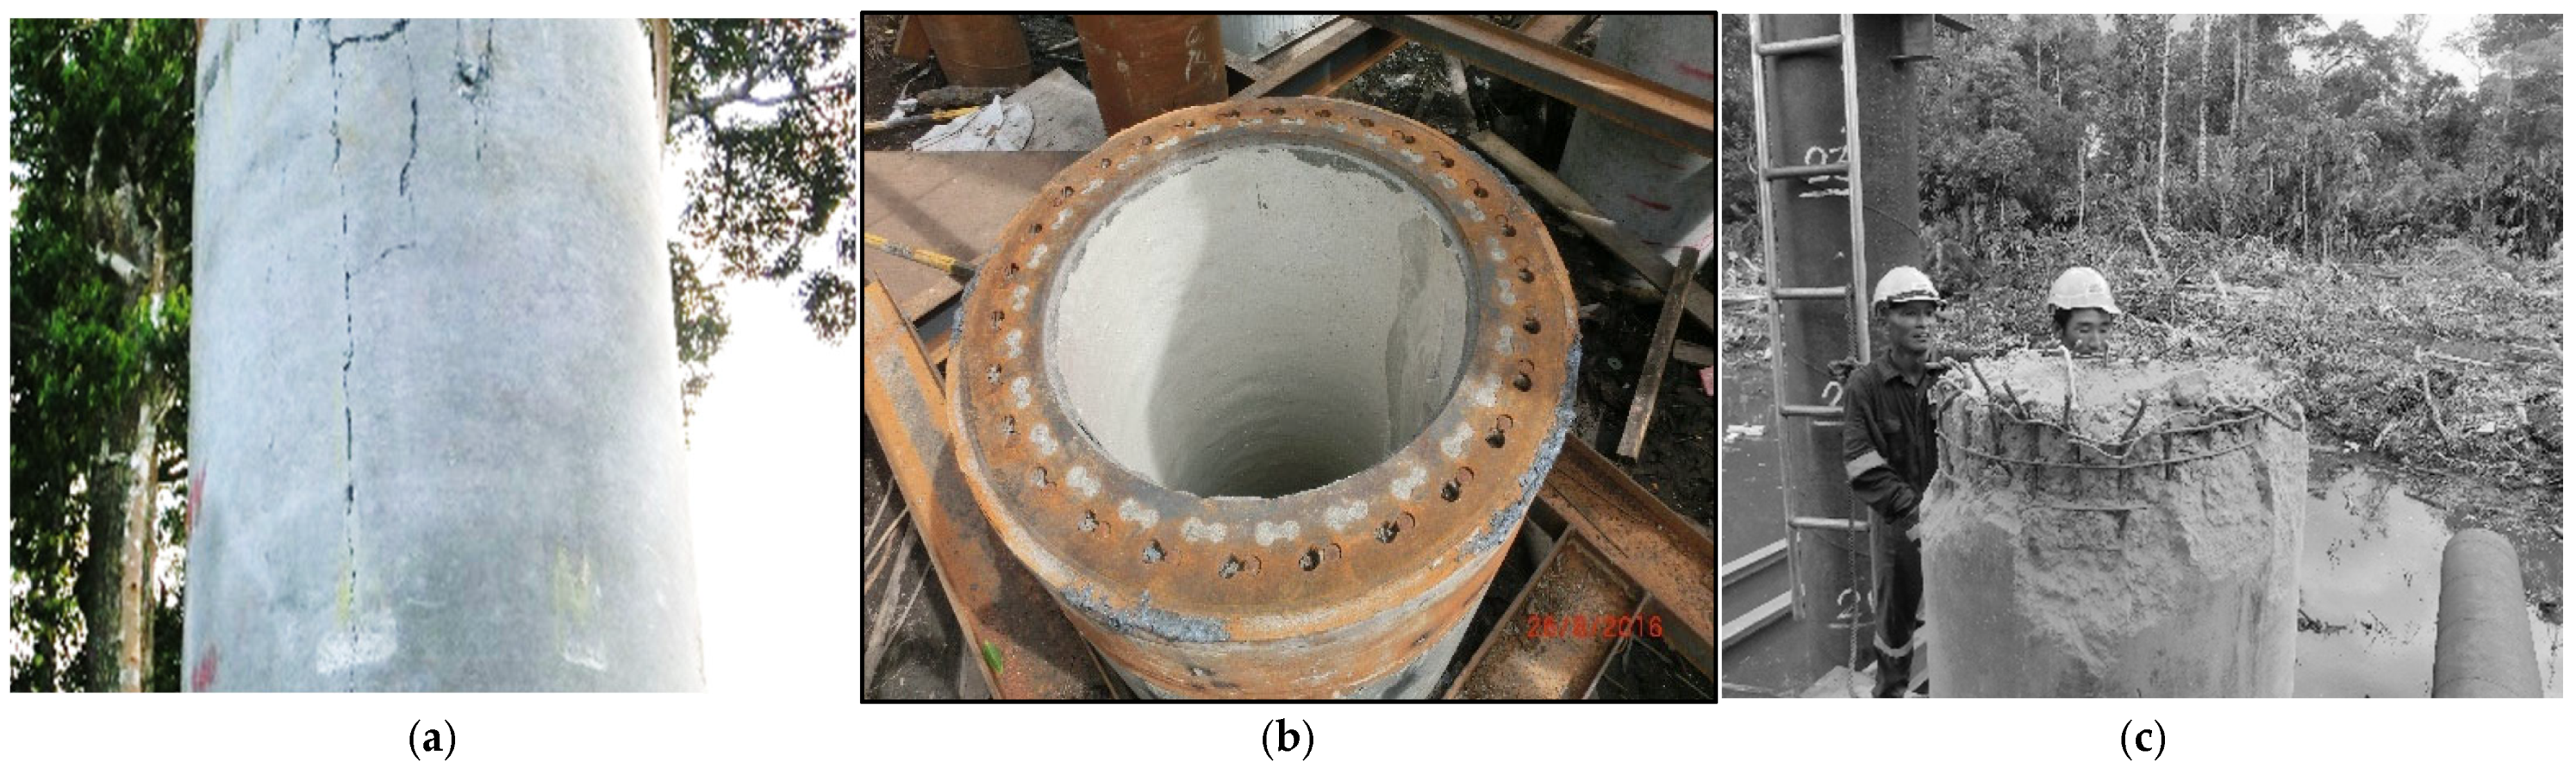
- The hammer stop control criteria calculated according to the Hiley formula would lead to excessive hammering, with some piles having maximum tensile stresses exceeding the ultimate tensile strength of the concrete. Three types of damage occurred during construction: pile shaft breakage, weld tearing, and pile head breakage;
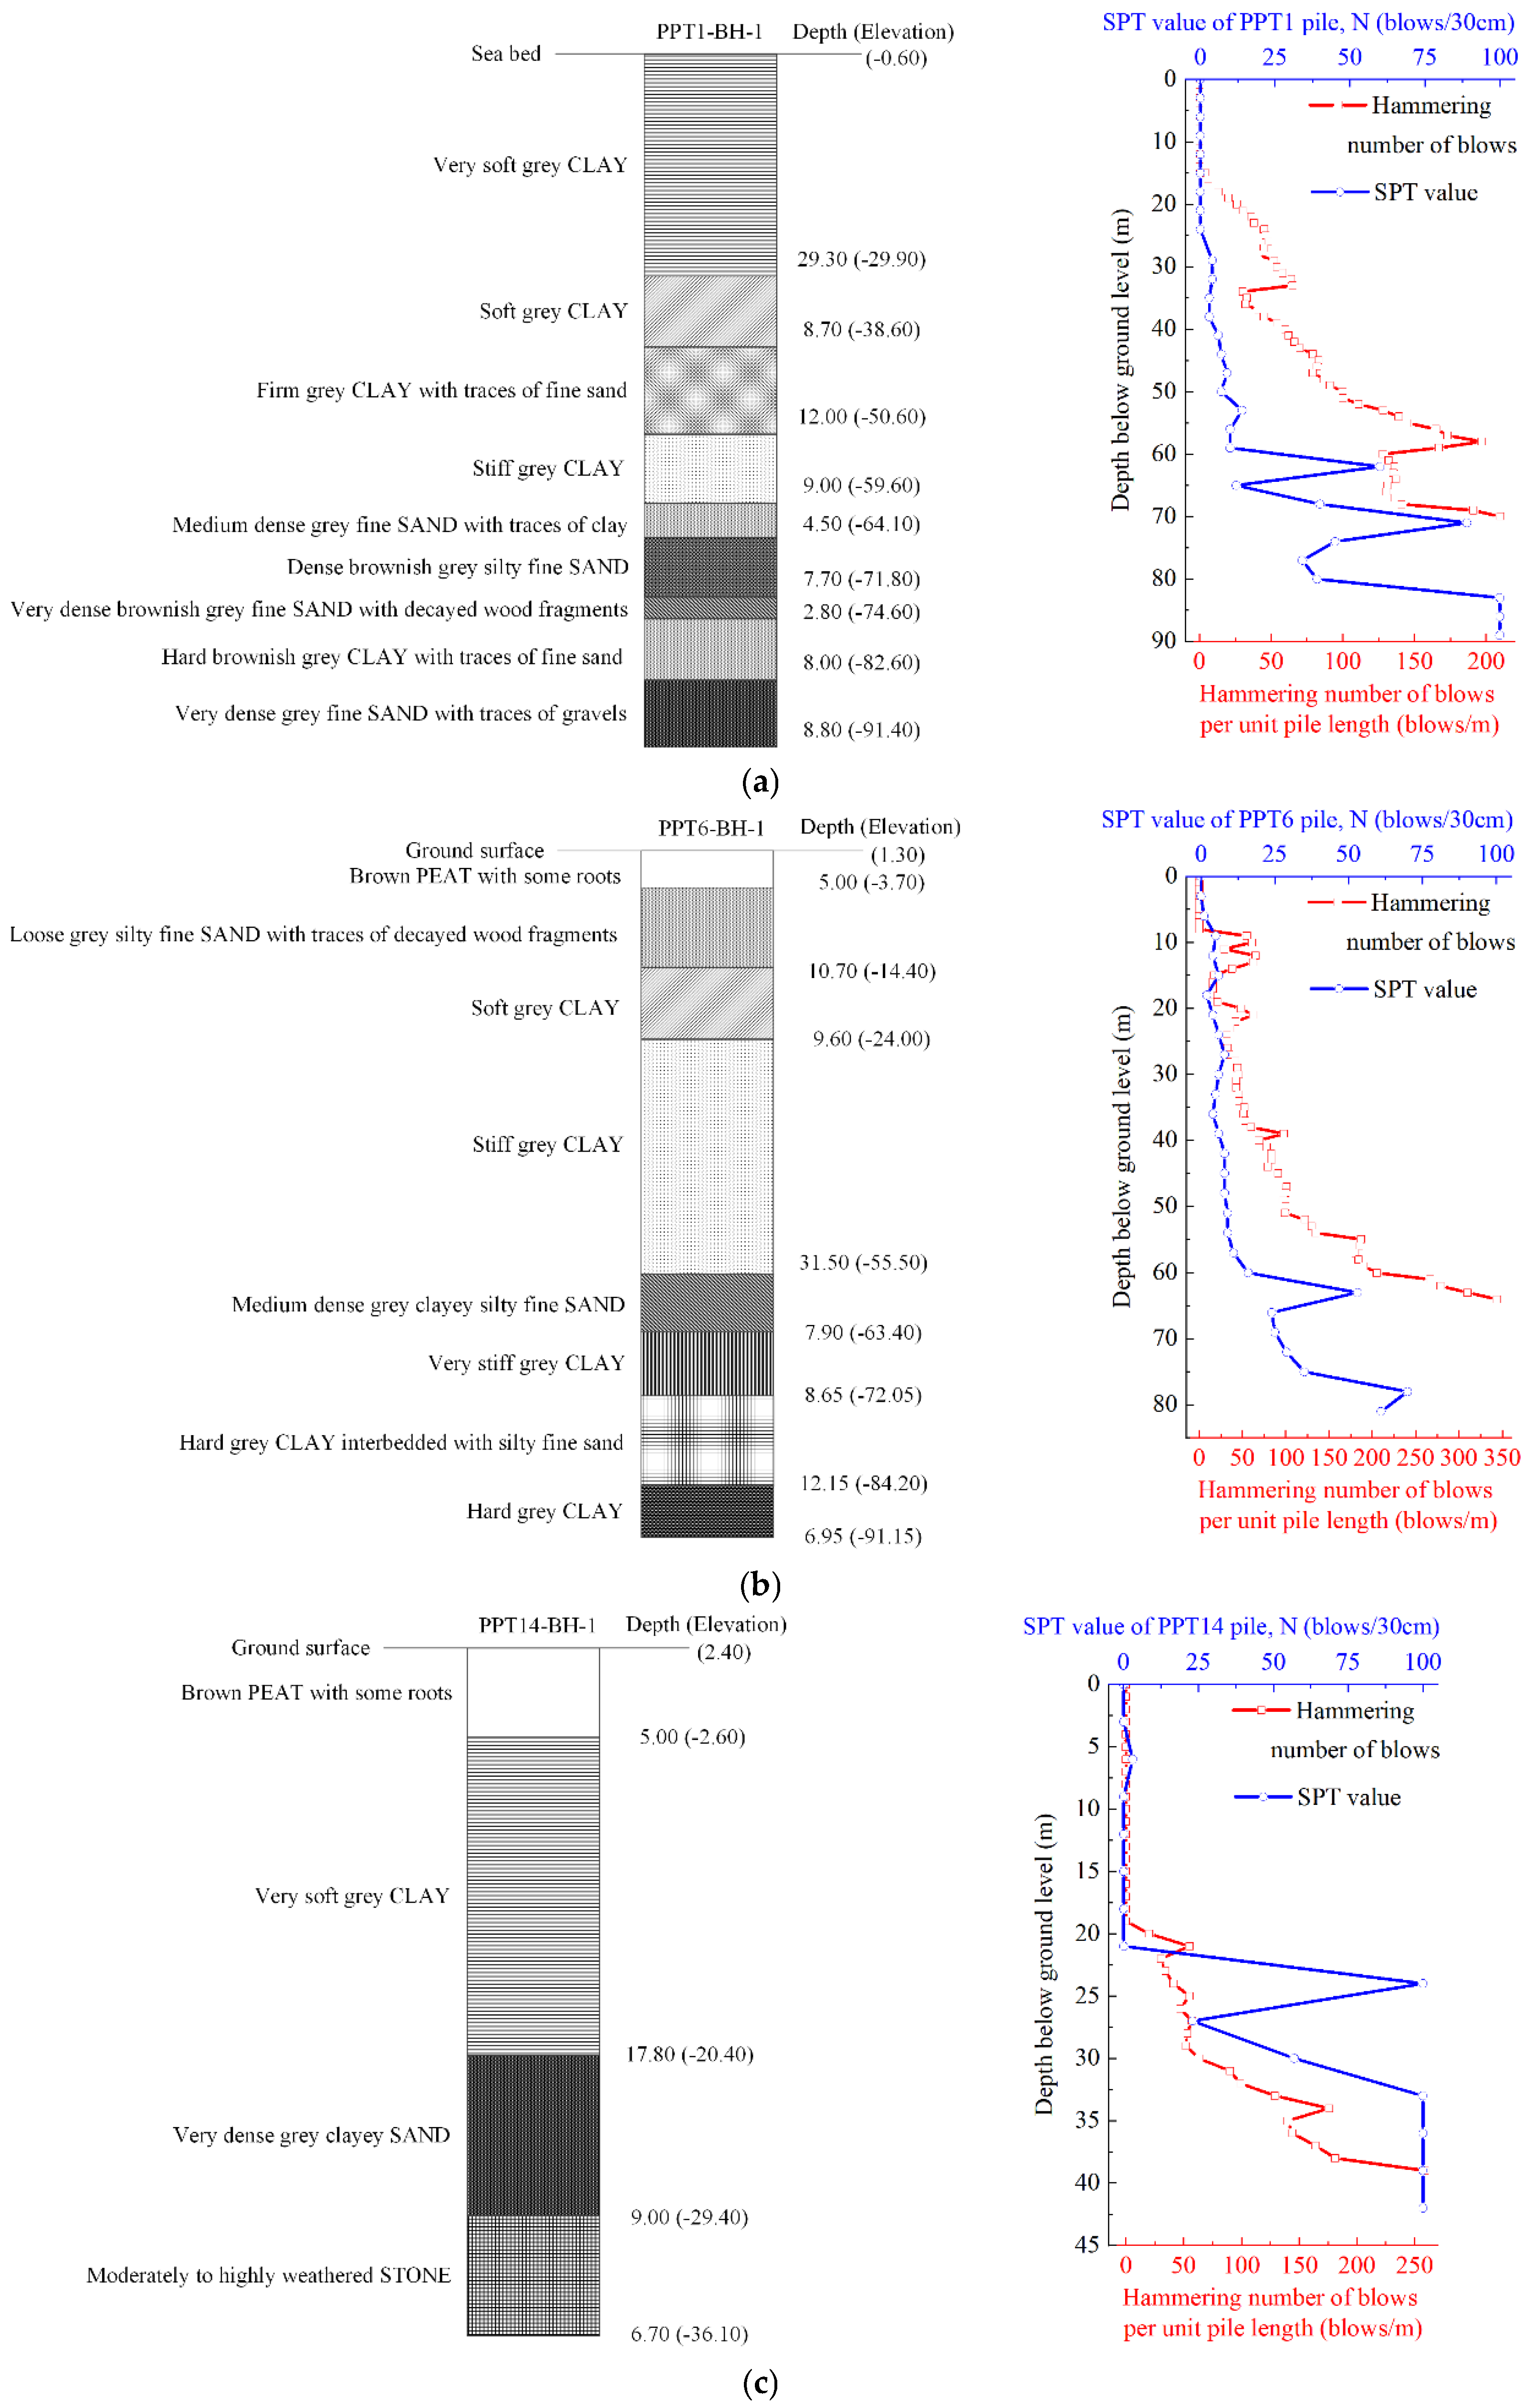
- The weight and drop height of the piling hammer selected for this project were appropriate, and the extra-long test piles can be hammered to the design depth. The number of blows per meter corresponding to different depths was closely related to the properties of corresponding soil layers. In hard clay, dense sand, and weathered rock strata, the number of blows per unit pile length increased significantly;
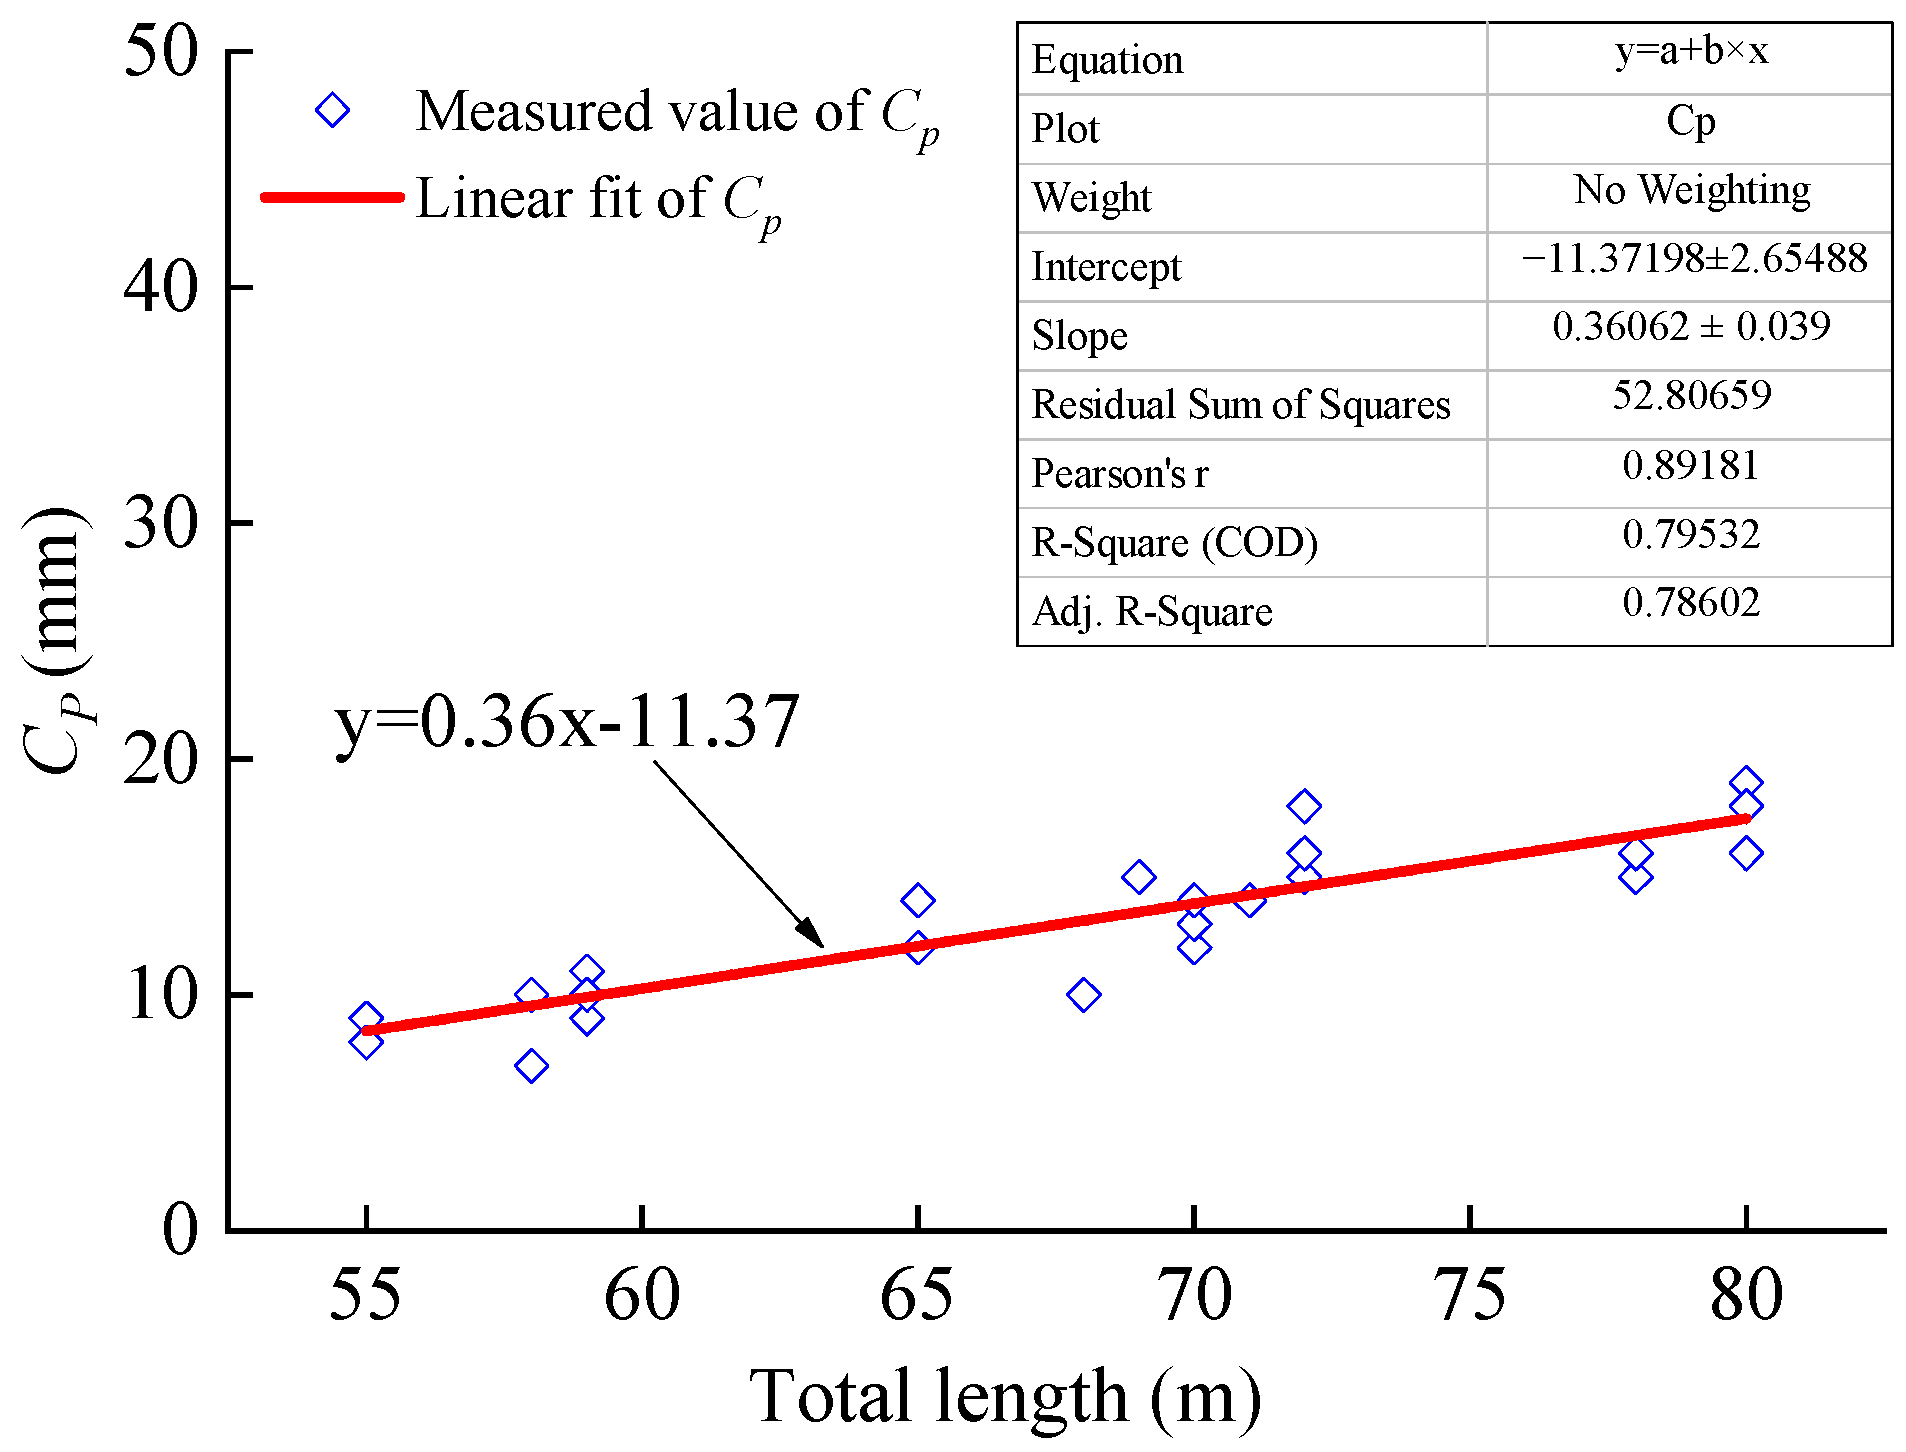
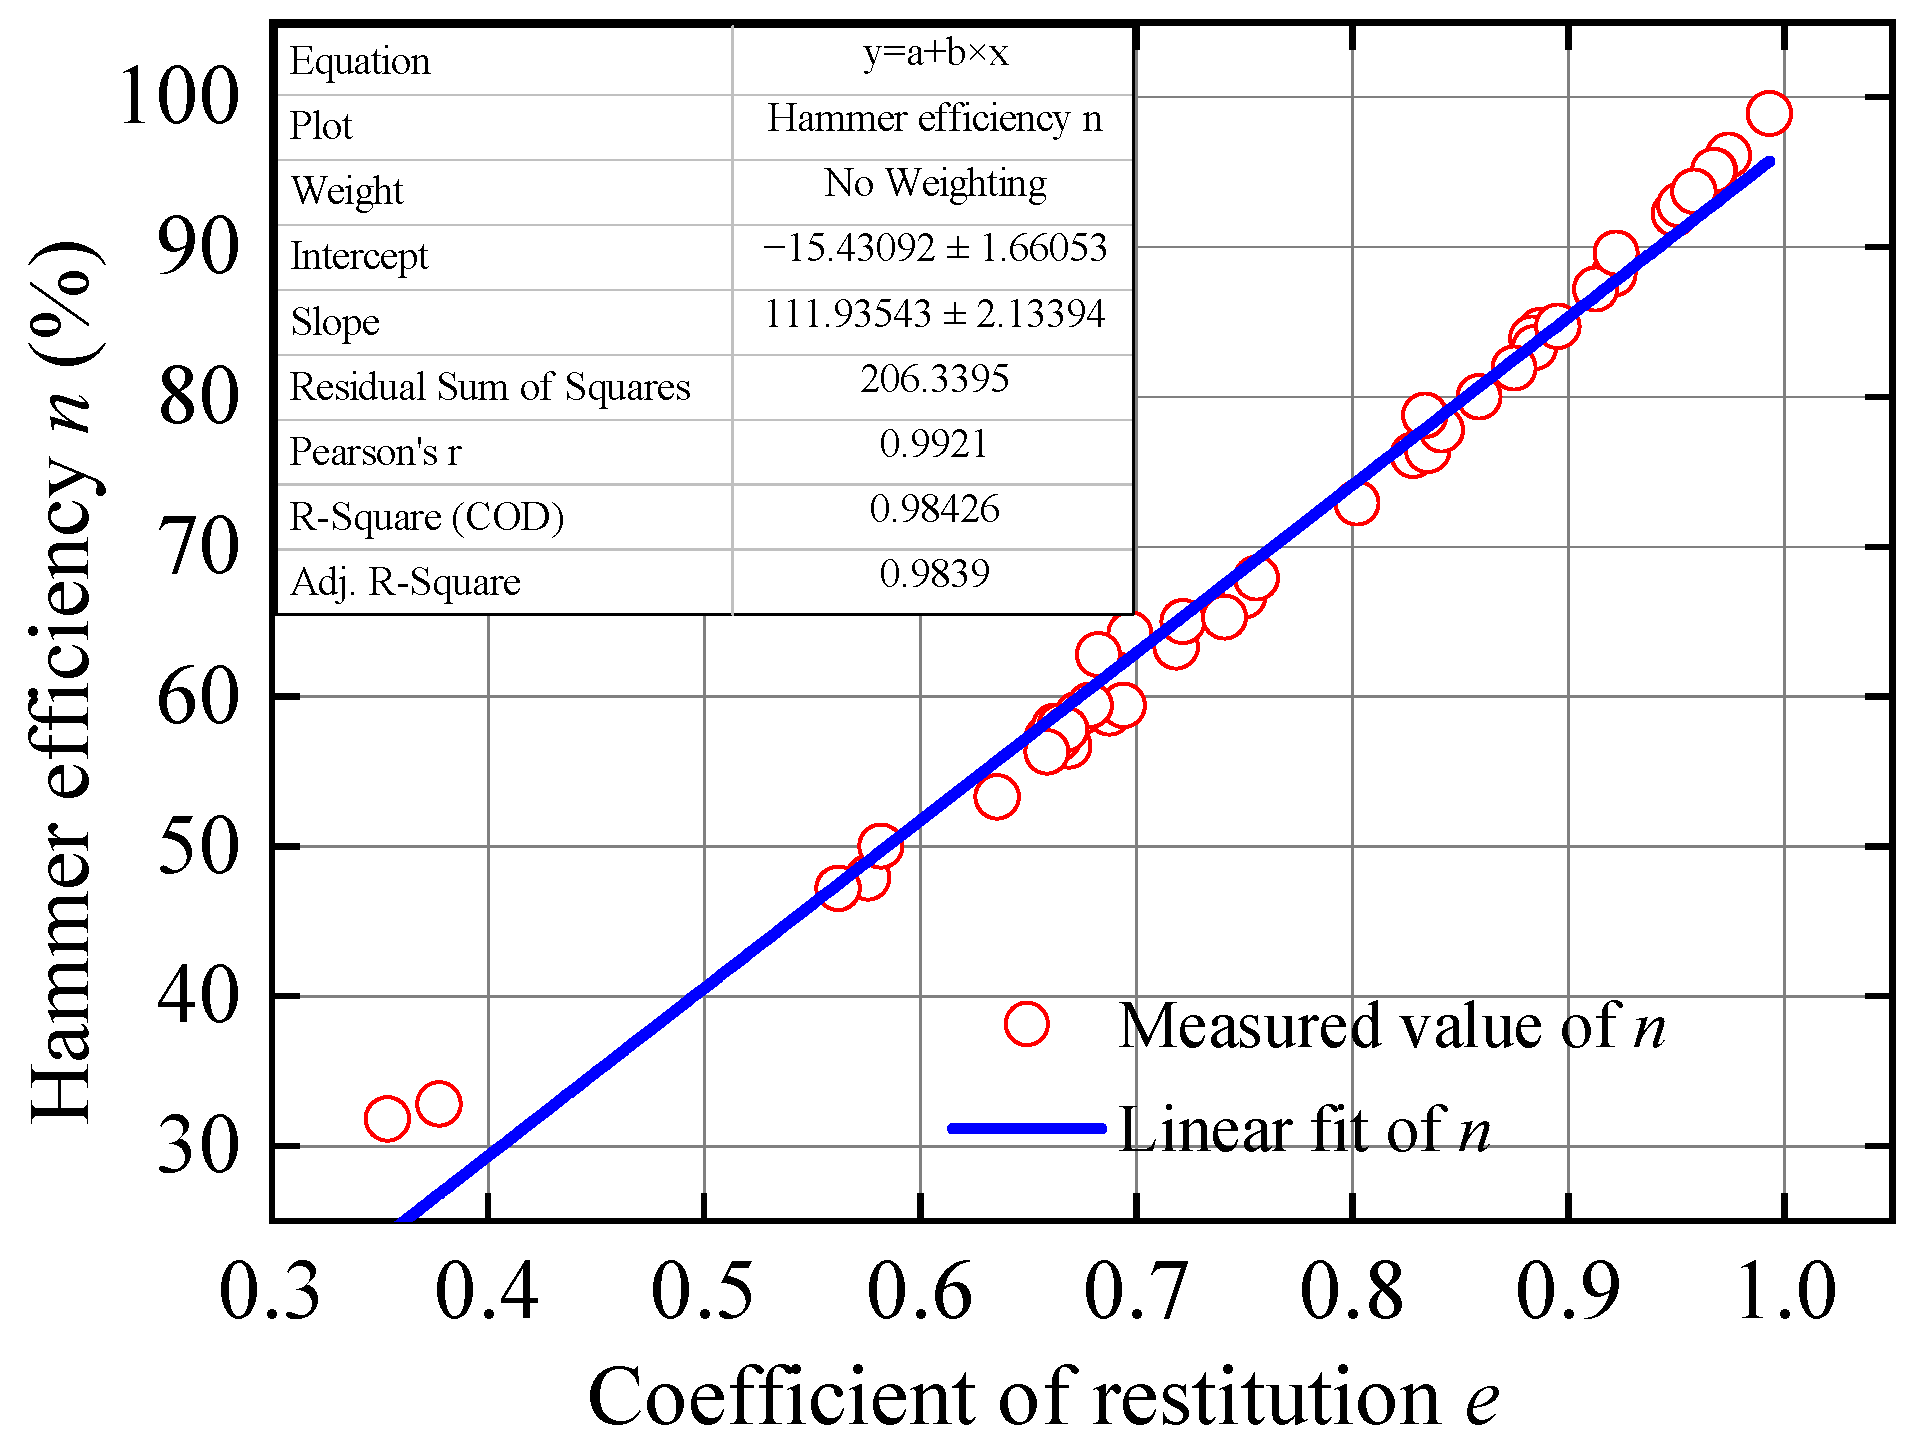
- In order to avoid pile damage caused by excessive hammering, the driving parameters of extra-long piles should be adjusted according to the high-strain dynamic test data. In this paper, the values of Cp and n were fitted based on the dynamic test data, which provided a more accurate reference for the selection of subsequent piling parameters of the project.
Author Contributions
Funding
Data Availability Statement
Conflicts of Interest
Nomenclature
| Pu | ultimate bearing capacity of pile |
| k | mechanical efficiency of hammer |
| W, Wp | weight of hammer and pile |
| H | free drop height |
| e | coefficient of restitution |
| e-C | e value used for calculating Sp |
| e-B | backcalculation value of e based on test |
| S | penetration of pile per hammer blow |
| Sm | measured value of penetration |
| Sp | proposed value of penetration |
| C | summation of the temporary compression |
| Cc | compression of pile cushion |
| Cc-C | assumed value of Cc used for calculating Sp |
| Cc-B | backcalculation value of Cc based on test |
| Cp | compression of pile |
| Cq | compression of quake |
| Cp+q | sum of Cp and Cq |
| Cp+q-C | Cp+q value used for calculating Sp |
| Cp+q-M | measured value of Cp+q based on test |
| n | efficiency of the blow |
References
- Abadie, C.N.; Byrne, B.W.; Houlsby, G.T. Rigid pile response to cyclic lateral loading: Laboratory tests. Geotechnique 2019, 69, 863–876. [Google Scholar]
- Flynn, K.N.; McCabe, B.A. Driven cast-in-situ pile capacity: Insights from dynamic and static load testing. Can. Geotech. J. 2021, 58, 1870–1883. [Google Scholar] [CrossRef]
- Han, F.; Ganju, E.; Salgado, R.; Prezzi, M. Comparison of the load response of closed-ended and open-ended pipe piles driven in gravelly sand. Acta Geotech. 2019, 14, 1785–1803. [Google Scholar] [CrossRef]
- Kou, H.L.; Chu, J.; Guo, W.; Zhang, M.Y. Pile load test of jacked open-ended prestressed high-strength concrete pipe pile in clay. Proc. Inst. Civ. Eng. -Geotech. Eng. 2018, 171, 243–251. [Google Scholar] [CrossRef]
- Lanyi-Bennett, S.A.; Deng, L.J. Axial load testing of helical pile groups in glaciolacustrine clay. Can. Geotech. J. 2019, 56, 187–197. [Google Scholar] [CrossRef]
- McAdam, R.A.; Byrne, B.W.; Houlsby, G.T.; Beuckelaers, W.; Burd, H.J.; Gavin, K.G.; Igoe, D.J.P.; Jardine, R.J.; Martin, C.M.; Wood, A.M.; et al. Monotonic laterally loaded pile testing in a dense marine sand at Dunkirk. Geotechnique 2020, 70, 986–998. [Google Scholar] [CrossRef]
- Santrac, P.; Susic, N.; Bajic, Z. Determination of the Pile Stiffness Matrix Based on the Pile Load Test Results and the Effect of Pile Interaction. Teh. Vjesn.-Tech. Gaz. 2020, 27, 2016–2023. [Google Scholar]
- Wang, S.; Lei, X.W.; Meng, Q.S.; Xu, J.L.; Wang, M.Z.; Guo, W. Model tests of single pile vertical cyclic loading in calcareous sand. Mar. Georesources Geotechnol. 2021, 39, 670–681. [Google Scholar] [CrossRef]
- Cao, X.L.; Dai, G.L.; Gong, W.M.; Zhu, M.X.; Tang, J.A. Experimental study on the seismic behavior of new PHC piles. Arab. J. Geosci. 2020, 13. [Google Scholar] [CrossRef]
- Huynh, V.H.; Nguyen, T.; Nguyen, D.P.; Nguyen, T.S.; Huynh, T.M.D.; Nguyen, T.C. A novel direct SPT method to accurately estimate ultimate axial bearing capacity of bored PHC nodular piles with 81 case studies in Vietnam. Soils Found. 2022, 62, 101163. [Google Scholar] [CrossRef]
- Kou, H.L.; Chu, J.; Guo, W.; Zhang, M.Y. Field study of residual forces developed in pre-stressed high-strength concrete (PHC) pipe piles. Can. Geotech. J. 2016, 53, 696–707. [Google Scholar] [CrossRef]
- Kou, H.L.; Guo, W.; Zhang, M.Y. Field study of set-up effect in open-ended PHC pipe piles. Mar. Georesources Geotechnol. 2017, 35, 208–215. [Google Scholar] [CrossRef]
- Li, X.S.; Zhang, J.Q.; Xu, H.; Shi, Z.W.; Gao, Q.F. Static Load Test and Numerical Analysis of Influencing Factors of the Ultimate Bearing Capacity of PHC Pipe Piles in Multilayer Soil. Sustainability 2021, 13, 13166. [Google Scholar] [CrossRef]
- Nguyen, T.; Ly, K.D.; Nguyen-Thoi, T.; Nguyen, B.P.; Doan, N.P. Prediction of axial load bearing capacity of PHC nodular pile using Bayesian regularization artificial neural network. Soils Found. 2022, 62, 101203. [Google Scholar] [CrossRef]
- Oktiovan, Y.P.; Otaki, T.; Obara, T.; Kono, S.; Asai, Y.; Kobayashi, K.; Watanabe, H.; Mukai, D. Shear performance evaluation of PHC piles under different levels of axial load ratio. Earthq. Eng. Struct. Dyn. 2022, 51, 2091–2112. [Google Scholar] [CrossRef]
- Meng, Q.J.; Shi, Z.F. Vibration Isolation of Plane Waves by Periodic Pipe Pile Barriers in Saturated Soil. J. Aerosp. Eng. 2019, 32, 11. [Google Scholar] [CrossRef]
- Salgado, R.; Zhang, Y.B.; Abou-Jaoude, G.; Loukidis, D.; Bisht, V. Pile driving formulas based on pile wave equation analyses. Comput. Geotech. 2017, 81, 307–321. [Google Scholar] [CrossRef]
- Wu, W.B.; El Naggar, M.H.; Abdlrahem, M.; Mei, G.X.; Wang, K.H. New interaction model for vertical dynamic response of pipe piles considering soil plug effect. Can. Geotech. J. 2017, 54, 987–1001. [Google Scholar] [CrossRef]
- Zheng, C.J.; Ding, X.M.; Sun, Y.F. Vertical Vibration of a Pipe Pile in Viscoelastic Soil Considering the Three-Dimensional Wave Effect of Soil. Int. J. Geomech. 2016, 16, 10. [Google Scholar] [CrossRef]
- Zheng, C.J.; Liu, H.L.; Ding, X.M.; Zhou, H. Vertical vibration of a large diameter pipe pile considering transverse inertia effect of pile. J. Cent. South Univ. 2016, 23, 891–897. [Google Scholar] [CrossRef]
- Sun, Y.; Gao, Y.; Zhang, J.; Hu, J.; Huang, W. Feasibility analysis and field test on driving phc pile through deep dense sand. J. Eng. Geol. 2015, 23, 1079–1084. [Google Scholar]
- Zhang, H.; He, R.; Chen, Q.; Xiao, J.; Chu, Y. Comparative evaluation of theoretical method and in situ tests method on vertical compressive bearing capacity of super-large-diameter monopiles for offshore wind turbines. Ocean Eng. 2022, 40, 104–115. [Google Scholar]
- Liu, C.; Tang, M.; Hu, H.; Chen, H.; Liu, C.; Hou, Z. Comparative study on vertical compressive bearing behavior of PHC pipe piles based on high strain method and static load method. Build. Struct. 2022, 52, 136–140. [Google Scholar]
- Zhang, L.; Chau, A.C.W.; Shek, M.P. Bearing capacity of long driven piles using dynamic methods. In Proceedings of the 12th Asian Regional Conference on Soil Mechanics and Geotechnical Engineering (12ARC), Singapore, 4–8 August 2003. [Google Scholar]
- Arsyad, A.; Suyadi; Samang, L. Statistical Analysis of Dynamic Bearing Capacity of Driven Pile. In Proceedings of the 2nd International Conference on Civil, Offshore and Environmental Engineering (ICCOEE), Kuala Lumpur, Malaysia, 3–5 June 2014. [Google Scholar]
- Tokhi, H.; Ren, G.; Xie, Y.M. Improving the Predictability of Hiley Pile Driving Formula in the Quality Control of the Pile Foundation. In Proceedings of the International Conference on Civil Engineering and Building Materials (CEBM), Kunming, China; 2011. [Google Scholar]
- Xiao, Y.; Liu, X.; Zhou, J.; Song, L. Field Test Study on the Bearing Capacity of Extra-Long PHC Pipe Piles under Dynamic and Static Loads. Sustainability 2023, 15, 5161. [Google Scholar] [CrossRef]
- Chellis, R.D. Pile Foundations; McGraw Hill: New York, NY, USA, 1961. [Google Scholar]
- Chan, W.T.; Chow, Y.K.; Liu, L.F. Neural network: An alternative to pile driving formulas. Comput. Geotech. 1995, 17, 135–156. [Google Scholar] [CrossRef]
- Goh, A.T.C. Back-propagation neural networks for modeling complex systems. Artif. Intell. Eng. 1995, 9, 143–151. [Google Scholar] [CrossRef]
- El-Mossallamy, Y.M.; Tawfik, M.M.; Zayed, M.A. Application of ultimate limit state design for axially loaded single piles in Egyptian geotechnical practice. HBRC J. 2015, 13, 181–189. [Google Scholar] [CrossRef]
- Sun, L.; Jia, T.; Yan, S.; Guo, W.; Ren, Y.; Lei, Z. Prediction of pile running during the driving process of large diameter pipe piles. Ocean Eng. 2016, 128, 48–57. [Google Scholar] [CrossRef]


| Pile Number | Pile Length (m) | AS-Build Toe Level (m) | Holding Layer | Hammer Weight (kN) | Drop Height (m) | DVL (kN) |
|---|---|---|---|---|---|---|
| PPT1 | 78 | −70.0 | Stiff clay | 200 | 0.9 | 3000 |
| PPT2 | 80 | −76.0 | Hard clay | 200 | 0.9 | 3000 |
| PPT3 | 80 | −75.5 | Dense sand | 200 | 0.9 | 3000 |
| PPT4 | 70 | −65.3 | Stiff clay | 200 | 0.9 | 2600 |
| PPT5 | 68 | −60.7 | Dense sand | 200 | 0.9 | 2600 |
| PPT6 | 78 | −69.3 | Dense sand | 200 | 1.2 | 2600 |
| PPT7 | 59 | −52.3 | Dense sand | 200 | 0.9 | 2600 |
| PPT8 | 72 | −64.7 | Stiff clay | 200 | 0.9 | 2600 |
| PPT9 | 70 | −59.2 | Medium dense sand | 200 | 0.9 | 2600 |
| PPT10 | 69 | −60.2 | Stiff clay | 200 | 0.9 | 2600 |
| PPT11 | 59 | −50.4 | Hard clay | 160 | 0.9 | 2400 |
| PPT12 | 55 | −45.0 | Hard clay | 160 | 0.9 | 2400 |
| PPT13 | 58 | −44.2 | Stiff clay | 160 | 0.9 | 2400 |
| PPT14 | 39 | −34.4 | Mudstone | 160 | 0.6 | 2400 |
| Length (m) | H (m) | E′ (kN.m) | C (mm) | S (mm) | Notes |
|---|---|---|---|---|---|
| 76 | 1.0 | 128.0 | 7 | 44.8 | Pu = 4620 kN W = 160 kN Wp = 689 kN k = 0.8 e = 0.35 |
| 76 | 1.1 | 140.8 | 10 | 37.7 | |
| 76 | 1.2 | 153.6 | 10 | 45.7 | |
| 76 | 1.3 | 166.4 | 12 | 43.7 | |
| 76 | 1.4 | 179.2 | 15 | 36.7 | |
| 76 | 1.5 | 192.0 | 16 | 39.6 |
| Pile Length (m) | n | Temporary Compression (Cp + Cq mm) | |||||||||
|---|---|---|---|---|---|---|---|---|---|---|---|
| 9 | 10 | 11 | 12 | 13 | 14 | 15 | 16 | 17 | 18 | ||
| 50 | 0.387 | 49 | 44 | 39 | 34 | 29 | |||||
| 51 | 0.384 | 47 | 42 | 37 | 32 | 27 | |||||
| 52 | 0.381 | 46 | 41 | 36 | 31 | 26 | |||||
| 53 | 0.377 | 50 | 45 | 40 | 35 | 30 | 25 | ||||
| 54 | 0.374 | 49 | 44 | 39 | 34 | 29 | |||||
| 55 | 0.371 | 48 | 43 | 38 | 33 | 28 | |||||
| 56 | 0.368 | 47 | 42 | 37 | 32 | 27 | |||||
| 57 | 0.365 | 46 | 41 | 36 | 31 | 26 | |||||
| 58 | 0.362 | 50 | 45 | 40 | 35 | 30 | 25 | ||||
| 59 | 0.359 | 49 | 44 | 39 | 34 | 29 | |||||
| 60 | 0.357 | 48 | 43 | 38 | 33 | 28 | |||||
| 61 | 0.354 | 47 | 42 | 37 | 32 | 27 | |||||
| 62 | 0.351 | 46 | 41 | 36 | 31 | 26 | |||||
| 63 | 0.349 | 50 | 45 | 40 | 35 | 30 | 25 | ||||
| 64 | 0.346 | 49 | 44 | 39 | 34 | 29 | |||||
| 65 | 0.344 | 49 | 44 | 39 | 34 | 29 | |||||
| 66 | 0.341 | 48 | 43 | 38 | 33 | 28 | |||||
| 67 | 0.339 | 47 | 42 | 37 | 32 | 27 | |||||
| 68 | 0.337 | 46 | 41 | 36 | 31 | 26 | |||||
| 69 | 0.334 | 50 | 45 | 40 | 35 | 30 | 25 | ||||
| 70 | 0.332 | 50 | 45 | 40 | 35 | 30 | 25 | ||||
| 71 | 0.330 | 49 | 44 | 39 | 34 | 29 | |||||
| 72 | 0.328 | 48 | 43 | 38 | 33 | 28 | |||||
| 73 | 0.326 | 47 | 42 | 37 | 32 | 27 | |||||
| 74 | 0.324 | 47 | 42 | 37 | 32 | 27 | |||||
| 75 | 0.322 | 46 | 41 | 36 | 31 | 26 | |||||
| 76 | 0.320 | 50 | 45 | 40 | 35 | 30 | 25 | ||||
| 77 | 0.318 | 50 | 45 | 40 | 35 | 30 | 25 | ||||
| 78 | 0.316 | 49 | 44 | 39 | 34 | 29 | |||||
| 79 | 0.314 | 48 | 43 | 38 | 33 | 28 | |||||
| 80 | 0.312 | 48 | 43 | 38 | 33 | 28 | |||||
| Pile Number | S (mm) | Cp + Cq (mm) | CSX (MPa) | TSX (MPa) | EMX (kN·m) | Pu (kN) | ETR (%) |
|---|---|---|---|---|---|---|---|
| PPT1 | 48 | 15 | 15.6 | 3.8 | 45 | 4726 | 31.8 |
| PPT2 | 177 | 18 | 28.2 | 4.8 | 96 | 3677 | 53.3 |
| PPT3 | 115 | 12 | 24.0 | 3.0 | 59 | 3966 | 32.8 |
| PPT4 | 57 | 10 | 31.1 | 1.4 | 120 | 5414 | 66.7 |
| PPT5 | 78 | 12 | 28.0 | 1.1 | 103 | 7337 | 57.2 |
| PPT6 | 81 | 16 | 41.8 | 2.8 | 184 | 6560 | 76.4 |
| PPT7 | 97 | 13 | 35.3 | 3.6 | 152 | 5368 | 84.4 |
| PPT8 | 40 | 17 | 36.7 | 5.1 | 150 | 5327 | 83.3 |
| PPT9 | 54 | 14 | 25.7 | 1.7 | 104 | 4658 | 57.8 |
| PPT10 | 39 | 15 | 30.0 | 3.1 | 114 | 6349 | 63.3 |
| PPT11 | 33 | 11 | 28.8 | 7.4 | 68 | 4764 | 47.2 |
| PPT12 | 42 | 9 | 35.9 | 4.3 | 137 | 5030 | 95.1 |
| PPT13 | 102 | 10 | 37.8 | 4.0 | 122 | 5445 | 84.7 |
| PPT14 | 35 | 10 | 14.4 | 1.3 | 86 | 4761 | 89.6 |
| Pile No. | L (m) | H (m) | Sm (mm) | Sp (mm) | Cp + Cq (mm) | Cc (mm) | Pum (kN) | Pud (kN) | Percent Difference (%) |
|---|---|---|---|---|---|---|---|---|---|
| PPT6-1 | 78 | 1.2 | 81 | 21 | 14 | 3 | 6720 | 5200 | 29.23 |
| PPT6-3 | 65 | 1.1 | 86 | 18 | 23 | 3 | 5980 | 5200 | 15.00 |
| PPT6-5 | 65 | 1.1 | 114 | 18 | 16 | 3 | 6580 | 5200 | 26.54 |
| PPT14-1 | 37 | 1.0 | 99 | 86 | 15 | 3 | 5190 | 4400 | 17.95 |
| PPT14-2 | 39 | 0.6 | 24 | 21 | 13 | 3 | 4950 | 4400 | 12.50 |
| PPT14-3 | 39 | 0.6 | 35 | 21 | 10 | 3 | 5230 | 4400 | 18.86 |
| Pile No. | Cc-C (mm) | Cc-B (mm) | Pd-Cc (%) | Cp+q-C (mm) | Cp+q-M (mm) | Pd-Cp+q (%) | e-C | e-B | Pd-e (%) |
|---|---|---|---|---|---|---|---|---|---|
| PPT6-1 | 3 | 5.23 | 74.33 | 20.80 | 14 | 48.57 | 0.5 | 0.759 | 51.80 |
| PPT6-3 | 3 | 6.41 | 113.67 | 17.55 | 23 | 23.70 | 0.5 | 0.857 | 71.40 |
| PPT6-5 | 3 | 0.84 | 72.00 | 17.55 | 16 | 9.69 | 0.5 | 0.796 | 59.20 |
| PPT14-1 | 3 | −3.15 | 205.00 | 10.55 | 15 | 29.67 | 0.5 | 0.628 | 25.60 |
| PPT14-2 | 3 | −10.67 | 455.67 | 11.05 | 13 | 15.00 | 0.5 | 0.668 | 33.60 |
| PPT14-3 | 3 | −7.15 | 338.33 | 11.05 | 10 | 10.50 | 0.5 | 0.861 | 72.20 |
Disclaimer/Publisher’s Note: The statements, opinions and data contained in all publications are solely those of the individual author(s) and contributor(s) and not of MDPI and/or the editor(s). MDPI and/or the editor(s) disclaim responsibility for any injury to people or property resulting from any ideas, methods, instructions or products referred to in the content. |
© 2023 by the authors. Licensee MDPI, Basel, Switzerland. This article is an open access article distributed under the terms and conditions of the Creative Commons Attribution (CC BY) license (https://creativecommons.org/licenses/by/4.0/).
Share and Cite
Liu, X.; Xiao, Y.; Zhou, J.; Ge, L.; Song, Z. Research on Dynamic Pile-Driving Formula Parameters and Driving Feasibility of Extra-Long PHC Pipe Piles. Buildings 2023, 13, 1302. https://doi.org/10.3390/buildings13051302
Liu X, Xiao Y, Zhou J, Ge L, Song Z. Research on Dynamic Pile-Driving Formula Parameters and Driving Feasibility of Extra-Long PHC Pipe Piles. Buildings. 2023; 13(5):1302. https://doi.org/10.3390/buildings13051302
Chicago/Turabian StyleLiu, Xiaomin, Yonggang Xiao, Junlong Zhou, Longbo Ge, and Ziwen Song. 2023. "Research on Dynamic Pile-Driving Formula Parameters and Driving Feasibility of Extra-Long PHC Pipe Piles" Buildings 13, no. 5: 1302. https://doi.org/10.3390/buildings13051302