1. Introduction
Due to the climate crisis that we have been enduring, the implementation of all kinds of sustainable measures that contribute to reducing negative environmental impacts are crucially needed. Furthermore, given the significant effects of pollution on the population of cities, interventions in the urban environment are of special importance. Sustainable development is understood as the development that meets present needs without compromising the needs of future generations [
1]. For this reason, the importance of determining the impact on the environment caused by the operation of urban buildings and the manufacturing of construction materials is growing steadily.
Several criteria are employed to determine the environmental impact through specific factors such as primary energy consumption, CO
2 emissions, drinking water consumption, etc. [
2]. Most direct implementations on urban buildings are aimed at decarbonization, putting an emphasis on energy consumption efficiency; savings in both material footprint and construction footprint; and thermal and functional maintenance from electricity consumption. However, no approach has been made to directly implement such criteria within the urban environment, one that could recover CO
2 from the immediate environment and, at the same time, produce energy, provide thermal insulation, and recycle rainwater—even the gray water produced by the building.
Among the impacts referred to above, one of the biggest environmental problems we face today is the continuous increase in carbon dioxide (CO
2) emissions. According to the “Emissions Gap Report 2022: The Closing Window” published by the United Nations, the average annual growth of emissions was 1.1% between 2010 and 2019 [
3]. In this continuous increase in emissions, cities play a leading role by being responsible for 70% of them and consuming over 60% of resources, including drinking water. A significant part of these emissions is produced inside the cities. They have a direct effect on the urban inhabitants and will also have a profound impact in the near future, as it is expected that more than 60% of the world population will be living in urban areas by 2030.
The accumulation of CO
2 in the atmosphere has severe consequences, air pollution and the rise in global average temperature being the most challenging. According to the UN, city occupants are exposed to air pollution 2.5 times higher than the established safe standards, and this is responsible for contributing to millions of deaths [
4]. The rise in global average temperature will also generate multiple problems such as extreme weather events leading to heat waves in urban areas and a reduction in food production due to droughts and loss in crop diversity. The consequences carry significant repercussions, as the number of people suffering from hunger has been continuously rising since 2015, increasing by almost 10 million people per year [
5].
Given the magnitude of the problem, methods to reduce annual emissions, boost crop diversity, and introduce nature into the city are being proposed, as in the “Action Plan of the 2030 Agenda” [
6]. However, it is essential not only to reduce future emissions but also to remove from the atmosphere nearly a billion tons of CO
2 produced during almost 200 years of industrial growth [
7]. Although the entire planet is an interconnected ecosystem, the places where CO
2 removal and air purification are most needed are inside the cities themselves, where most of the world’s population is gathered. Introducing nature to the urban areas is key to solving the majority of these challenges. Apart from global scale solutions such as plantations of large areas of forests, it is also necessary to provide remedies at a local scale within the urban environment. The inclusion of vegetation is a sensible alternative for carbon dioxide offsetting in the city. It is also true that there is not always enough space, especially in denser urban centers. What we propose is an innovative alternative that consists of using the surfaces of the architectural infrastructure as a place for the cultivation of microalgae.
Our research focuses on the development of architectural photobioreactors (PBRs). These are systems integrated into the architecture of the city that enhance the natural photosynthesis cycle from which atmospheric CO
2 is inherently fixed. They generate natural residues that can be used for a wide range of final products such as: biofuels (i.e., bioethanol, biomethane, and biohydrogen); bioenergy from algal biomass, biogas, and electricity generation; products for human and animal consumption such as food, cosmetics, and health supplements; as livestock and aquaculture feed [
8]; and as biofertilizers, as they have growth regulators (i.e., auxins, gibberellins, and cytokinins) and high levels of macro and micronutrients that enhance crop growth [
9]. Among the wide range of photosynthetic organisms, microalgae have demonstrated superior growth performance because they have the ability to fix nearly two to five times more CO
2 than other types of plants, as they are able to nearly double their volume in a week. Additionally, its biomass yield rises up to 100 tons of biomass per hectare per year, which represents a photosynthetic high efficiency of 2.5% compared to the low efficiency (between 0.25% to 1%) of a forest hectare [
10].
The cultivation system of the microalgae occurs mainly inside Photobioreactors (PBRs). All the necessary elements for optimal growth are provided inside these structures: an aqueous medium containing nutrients that constitute a “culture medium”; direct sunlight for a certain number of hours per day; movement of the culture to ensure gas exchange, i.e., the utilization of CO
2 (this can be either from the air or from a specific CO
2 source such as boiler chimney); and the release of oxygen (O
2). The result of this process is known as biomass, which is composed of an accumulation of microalgae that needs to be harvested periodically to ensure proper exposure to sunlight [
11]. There are different options that fulfill the needs of the microalgae of CO
2 and a fresh medium to grow.
Another advantage of implementing this system is its capacity for recycling, not only the gray water and sewage of a building but also the flue gasses from heating boilers. This allows the building to create a closed metabolic cycle of water consumption and the emissions produced.
One of the major advantages of microalgae cultivation is its ability to grow in vertical elements; thus, they are the perfect choice for places where it would be impossible to place vegetation on the ground. The growth of the microalgae is linked to the element that contains them, as long as it is exposed to a source of light. This condition makes it easy to convert the PBRs into elements that can be efficiently and attractively adapted to existing architecture.
To address these matters, the remaining sections of the paper are structured as follows:
Section 2 provides an overview of the different types of Photobioreactors (PBRs) and their fundamental operational principles;
Section 3 explores the feasibility and expected impacts of PBR projects, emphasizing the significant benefits of implementing PBRs in architecture;
Section 4 provides an overview of the current state of the art, focusing on the latest developed projects and the preceding investigations that support the content of this article;
Section 5 offers a detailed description of the design of the present study;
Section 5.1 lists its constituent elements and their characteristics;
Section 5.2 outlines the methodology employed for the analysis, particularly focusing on the Life Cycle Assessment (LCA) approach;
Section 5.3 conducts a technical evaluation of the proposed components of the photobioreactor, aiming to identify the optimal material for their construction;
Section 5.4 describes the operation of the PBR system and provides insights into its water consumption requirements;
Section 5.5 delves into the biomass production process and presents calculations related to the productivity of the PBR;
Section 5.6 highlights the environmental advantages of utilizing biomass as a natural fertilizer;
Section 5.7 explores the carbon footprint calculations, considering factors such as microalgae growth and the utilization of biomass as fertilizer;
Section 6 presents the results obtained from the study, summarizing the findings and observations; and, finally,
Section 7 comprises the discussion section, where the implications, limitations, and potential future research directions are analyzed and discussed.
2. Intensive Cultivation of Microalgae on Architectural Surfaces
There are different types of industrial photobioreactors: closed or semi-closed cycle and raceway or open pond. The first consists of a closed circuit filled with water with microalgae circulating either through tubes or between plates or panels, in both cases made of transparent or translucent materials that allow light to pass through. The second is similar to a very shallow pool, where the water with microalgae is permanently moving at low speed, taking carbon dioxide directly from the atmosphere. PBRs need both CO2 injection and oxygen evacuation to function. Due to the verticality of façades, only closed-circuit type photobioreactors are suitable, whereas ponds can occupy the rooftops of buildings, urban fountains, etc. For the cultivation and harvesting of algae, PBRs need piping for water with microorganisms plus nutrients and a CO2 supply, a nutrient tank, and a preparation tank. Harvesting is performed in a tank or reservoir. If the product obtained is a biofertilizer, no further processing is needed, and the water with microalgae can be used directly for irrigation. If biomass is to be used for energy production, a biodigester is needed to convert the material into biogas. If the harvested water is needed to be stored, it can be centrifuged to dry the biomass to prevent rotting. A centrifugal pump, an air blower, a control system, and a PLC are required as auxiliary equipment. As for the type of microalgae, it will depend on the local conditions, as their performance varies depending on climate, water, nutrients, etc.
3. Feasibility Analysis and Expected Impact
Given that the city is an evident hub of emissions, it seems appropriate to consider incorporating PBRs in their architecture so that the envelope of a building, the façades and roofs, can also assume iconic design projects that turn city edifices into a CO2 fixing system, a biomass producer, and a water treater through an attractive and functional aesthetic.
Likewise, implementing these parameters would help to reduce the heat island effect inside cities and improve the thermal comfort of its users. Some of the benefits this project can offer are the production of renewable energy; added environmental value by contributing to the prevention of climate change; positive economic outcome by benefitting from savings in environmental taxes; and urbanistic innovation by developing a rupturist biotechnology and a friendlier and greener city. Other advantages include the reduction in biomass cultivation footprint by using only the “hard” surfaces of buildings; not having to compete with other food crops; and complying with European agri-food regulations. In other words, we turn architecture into an energy bio-factory and an element of compensation for emissions.
One of the most contested issues in microalgae cultivation is its economic and energy balance. Although algae biomass is seen as a powerful option for the future, it is still at an early stage of development and cannot yet achieve a high energy and sustainable return on investment, due, in part, to the costs of nutrient addition, the energy needed to process the biomass, and the land required for cultivation. Apart from food and value-added products, where the industry has reached maturity, experiments with algae for energy, biofertilizers, agricultural stimulants, and biofuels are still in the development phase.
Aside from the fact that this technology is still on a small-scale experimental stage, and although there is no yet sufficient data to determine its effectiveness, its profitability is, nevertheless, guaranteed based on the following facts: the minimization of the impact on land occupation due to the area of cultivation; the improvement of the insulation of buildings where installed; the capture of CO2—the only renewable energy with such quality; and the low economic impact due to the benefits of adapting a façade of a building as a PBR.
On the other hand, profitability is also related to the final product and, therefore, to the level of production control. The higher the profitability of the crop, the higher the level of crop supervision required. In the case of integration of cultivation in buildings as part of the urban landscape, a rigorous maintenance system equivalent to that of a common garden is essential. Therefore, the end products that are considered viable for algae cultivation in architecture are as follows:
Biofertilizers: They do not require more supervision than a regular garden and can be used directly in the irrigation of parks and gardens, helping to avoid chemical fertilizers, therefore saving energy.
Agricultural biostimulants: They require a medium level of process and are used as 100% organic enrichers for agricultural crops.
Biomass for gas and electricity production: They require minimum monitoring but must have a Biodigester installed to obtain biogas and a cogeneration system to produce electricity.
According to our analysis, the impact of the installations that transform a façade into PBRs is competitive when a minimum threshold of m
2 is exceeded, with the scaling factor determining profitability: High impact up to 200 m
2, medium impact up to 500 m
2, low impact up to 1000 m
2, with no significant repercussions in areas larger than 2000 m
2 [
12].
The expected results are as follows:
Reduction on emissions and their effect on the Biosphere through the capture of CO2, helping to prevent climate change.
Creation of a sustainable and self-sufficient city with the production of renewable bio-energy and other subproducts from algal biomass.
Contribution to an environmental balance by introducing nature into the urban space through microalgae, i.e., by incorporating living organisms into the construction.
Recycling water by utilizing gray water as a substrate and taking advantage of its nutrients in the yielding process of microalgae.
Complying with European guidelines and Spanish regulations on urban regeneration by reducing the heat island effect through better insulation and radiation conduction.
Lightening the ecological footprint in the production of biomass, reducing pressure on crops, and helping sustainable agriculture in accordance with EU agricultural policy.
4. State of the Art
Among all the technologies currently being implemented to make buildings part of a sustainable design, with elements that can be annexed into either new or rehabilitated buildings, the following can be cited as examples that are comparable to the technology, we are analyzing in the present study (
Table 1).
As can be observed, only technologies that involve plant materials have benefits comparable to those of PBRs. Although mentioned above, microalgae have more than twice the photosynthetic efficiency than a common plant.
If we focus on the state-of-the-art PBRs at an industrial level, we will see there is a great deal of worldwide experience in microalgae photobioreactors with good operation and performance results. Its translation into architecture, once the first projects have been tested, will be a reliable solution. It is a question of incorporating into architecture what was hitherto industrial, i.e., moving it from the back stage to the front row.
In particular, the project presented in this article has its precedent in the “Cenit-Vida” research achieved by a competitive process and co-financed by the Ministry of Economy and Competitiveness of the Spanish Government. Led by the Spanish energy company Iberdrola, the project brought together the research by 15 multinationals and specialized companies and 24 Spanish public research organizations. It lasted 4 years (2010–2014) and had a public–private co-financing of 19 million euros. The overall objective was to generate the knowledge and technologies necessary to develop a new concept of a Bio, Self-Sufficient, and Sustainable City. Up to this day, it has resulted in conference papers, articles, and book chapters in prestigious international publishing houses. It has also provided informed data to substantiate proposals and helped to reach agreements for the development and construction of prototypes, such as Case Studies on the Architectural Integration of Photobioreactors in Building Façades (2016) [
12]; Architectural Bio-Photo Reactors: Harvesting Microalgae on the Surface of Architecture (2015) [
18]; and Architecture as an Energy Factory: Pushing the envelope (2014) [
19].
The project is in a mature state, with advanced core research in place, and is now entering the production phase with a small-scale pilot project that will eventually allow for scalability. However, the implementation of this technology in the urban environment is still in an experimental phase, and, as with any innovative technological proposal, the first steps must be taken through a pilot project that is allowed to evolve towards full effectiveness and maturity. The project will realize its true potential when it is scaled up and can be applied to larger areas.
Looking at this from a different point of view, of society at large, we could say that most people nowadays are receptive to accepting alternative solutions for a new sustainable city and a new green aesthetic. In addition, the intentions of the European Union to cut greenhouse gas emissions are clear in the 2030 Climate Target Plan [
20], as they are in the Climate Change and Compliance in the Spanish Integrated National Energy and Climate Plan (NECP) 2021–2030 [
21]. Additionally, new European regulations and targets will soon make it compulsory to offset CO
2 emissions through alternative projects, hence the timeliness of this pilot experience.
Reviewing the state of the art, the first pilot project to have implemented the growth of microalgae in a bio-reactive façade in a residential building is the Bio Intelligent Quotient house (B.I.Q.) (2016) [
22]. This pilot project is located in Hamburg, Germany and consists of a four-story apartment building with a total of 15 residences. It has 200 m
2 of PBR panels with an output of 900 kg of biomass production per year [
23]. The authors also point to other functionalities such as dynamic shading, thermal insulation, and noise abatement. There are more samples of such façades being developed in different countries. Similarly, approaches to this technology have been made in urban elements, mainly with ephemeral elements for one-off exhibitions. However, the project promoted by the Multidisciplinary Research Institute of the University of Belgrade stands out, with its urban furniture of microalgae called Liquid3. This element has been in operation ongoingly since the end of 2021. It is an element composed of a tank containing the microalgae culture medium and a structure that forms a bench. Each container holds 600 L of water and removes the same amount of carbon dioxide from the air as two 10-year-old trees or 200 square meters of lawn, according to its creators [
24].
The synergy between microalgae cultivation and architecture has a promising future. Buildings are brought to life by living organisms and increase their passive and active roles played in energy savings and energy production. Moreover, the main advantage of using algae biomass is energy storage and CO2 compensation. However, there is still not enough conclusive data, and most of the samples are made in laboratories at the present time. Thus, in terms of investment, the debate on its feasibility is still pending. Therefore, our research is predominantly aimed at ensuring the viability of the project from both energetic and economic standpoints.
5. Photobioreactors at the Municipal Facilities of “ESMASA”: An Innovative Proposal
The Photobioreactors project for the “Empresa de Servicios Municipales de Alcorcón” (ESMASA) (“Municipal Council of Alcorcón Services”) consists of the incorporation of microalgae cultivation in architecture, and it is a ground-breaking and experimental alternative with great potential for the future. This project is currently being implemented, and it will be the first in Spain and one of the first in the world to transform the architectural envelope into a PBR capable of generating biomass and biofertilizers and absorbing CO
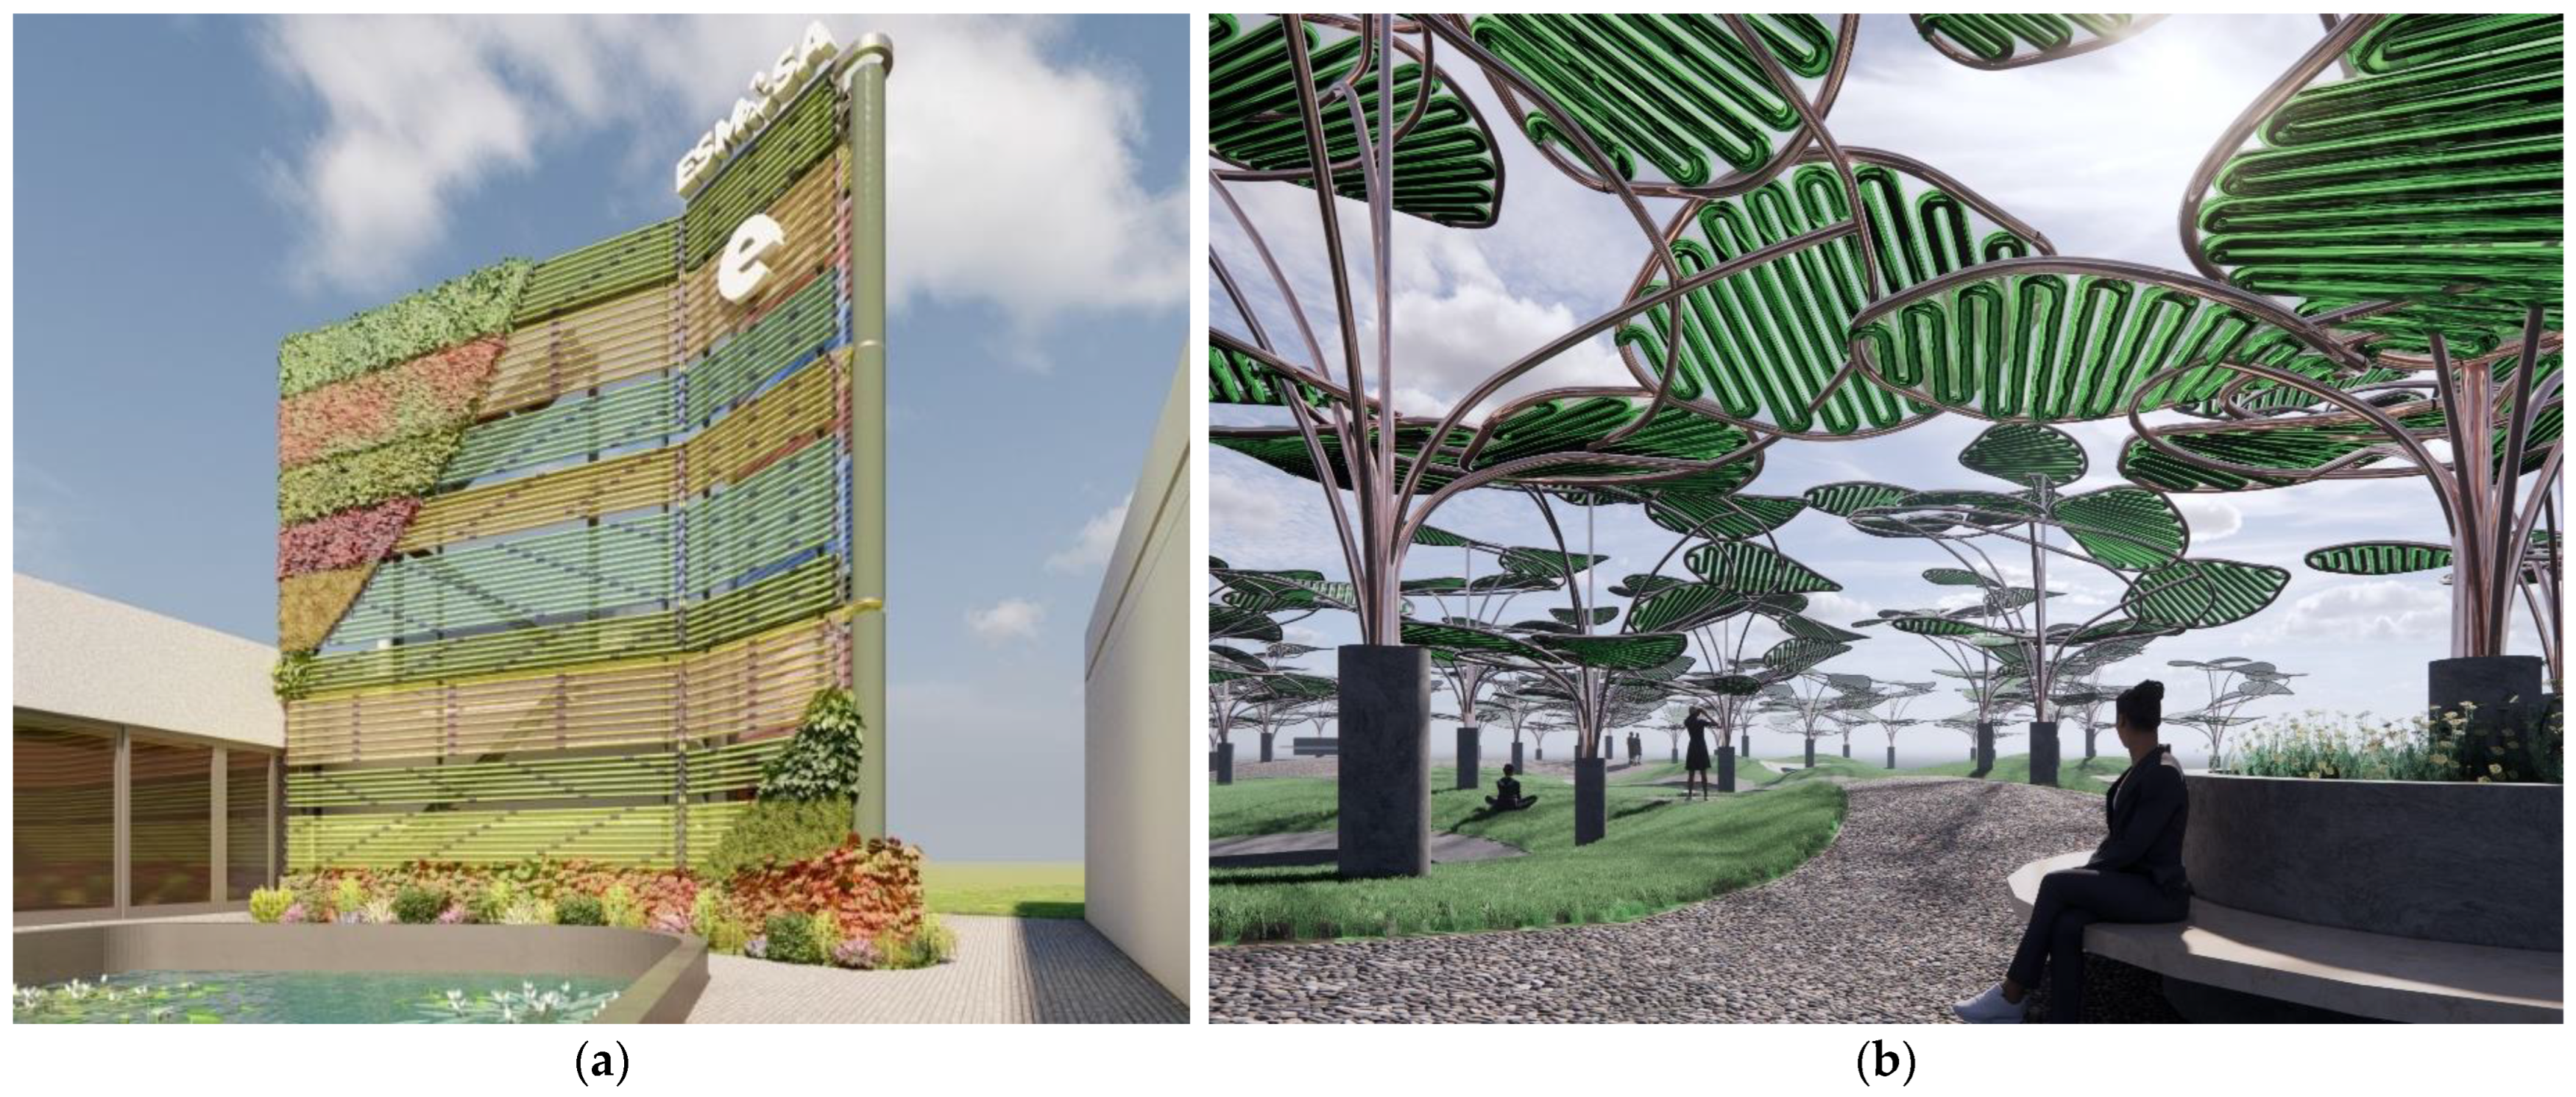
2, thus cleaning the environment. The elements are currently being developed in the municipality of Alcorcón, situated in the metropolitan area of Madrid, Spain and driven by the company “ESMASA” together with the Municipal Council of Alcorcón. It constitutes a pioneering plan for the implementation of sustainable systems as part of urban architecture. Two scenarios are proposed in its municipal facilities: a free-standing façade attached to a newly constructed building; and urban elements that resemble artificial trees. These experimental witnesses are part of a pilot project for future large-scale implementation (
Figure 1).
Given the scope of the project, the goal is to use the industrial elements available on the market to articulate a comprehensive system that integrates the world of design with the functionality necessary to create an attractive aesthetic that allows the construction of a comprehensive bio-city of the future.
Within the usual PBR typologies—closed, open, semi-closed—the closed tubular examples have been selected. This type of PBR permits a closed cultivation system that provides greater control and protection from external contaminants. Additionally, its components allow for innovative designs with a special kind of aesthetic that could turn this architectural project into an iconic element in its environment.
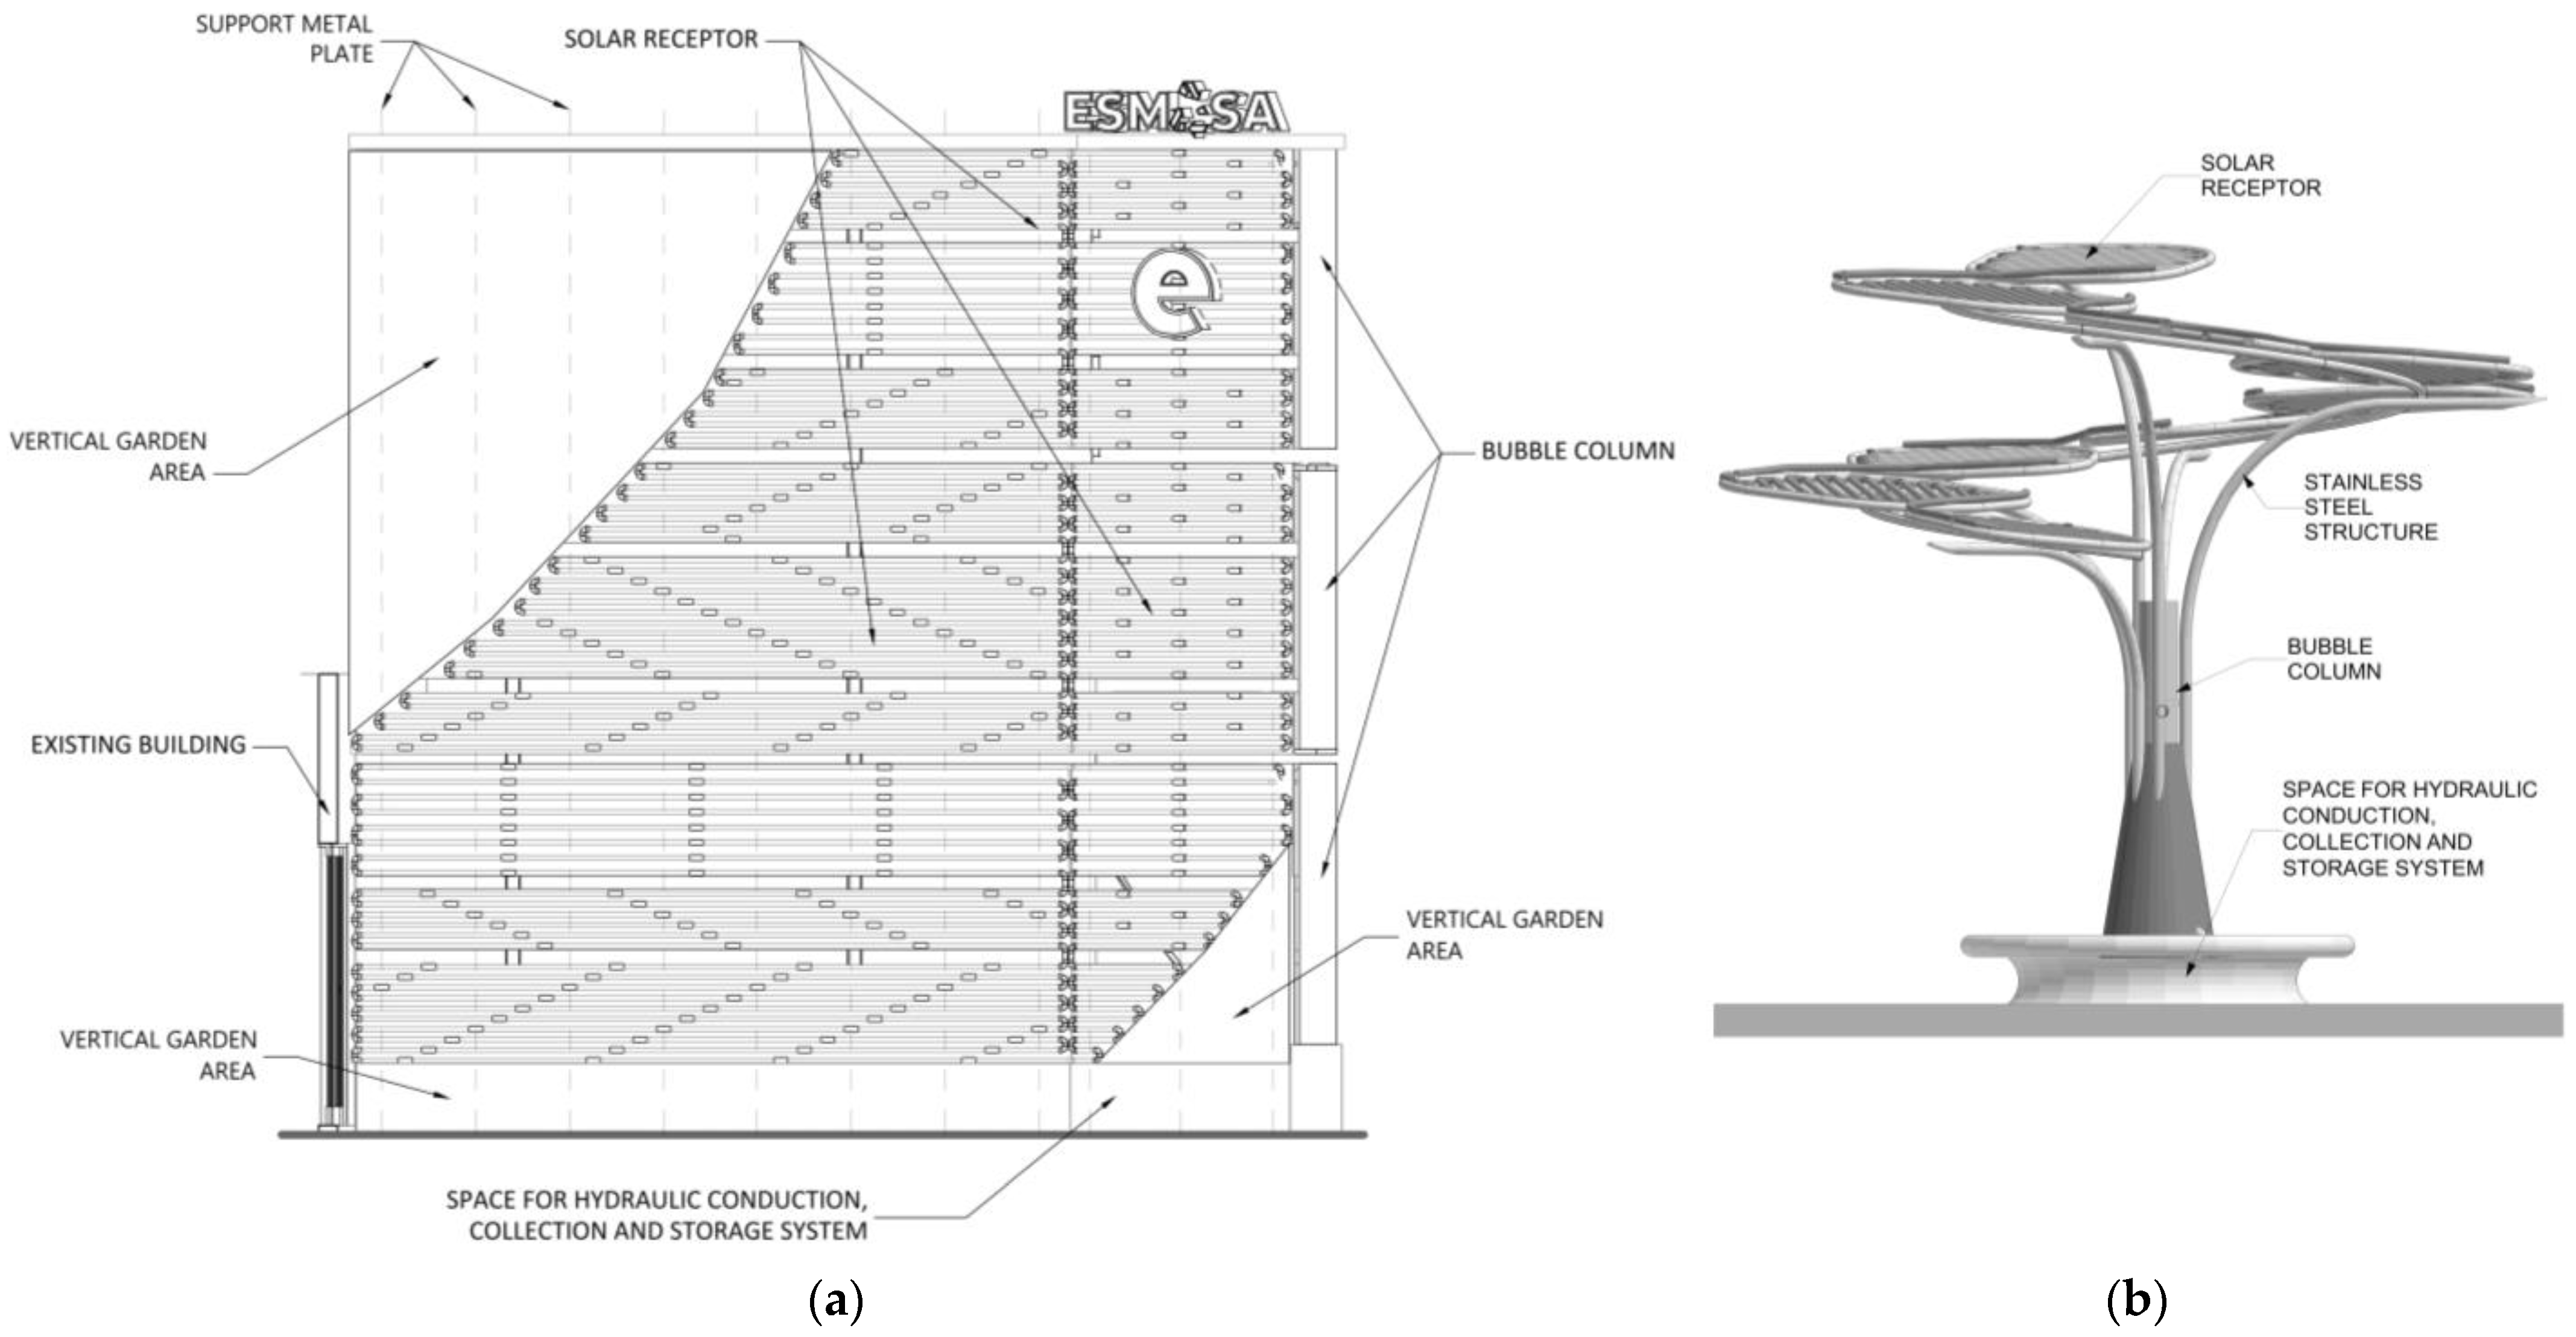
The façade is a free-standing vertical element located in the central courtyard of the building, in front of the south-facing volume (
Figure 2). It has a design that combines the necessary structure for the operation of the PBR with natural elements such as a vertical garden. The plan includes the recollection of rainwater from the rooftop of the building throughout the year in order to supply part of the façade’s aqueous medium needs. This collected water will serve a dual purpose, as it will provide a growth medium for the microalgae and afterwards, will be used as a biofertilizer for the vertical garden of the façade as well as for the green areas in the municipality of Alcorcón. The water harvested will be added to the current irrigation system carried out by the company Esmasa.
The bottom part of the façade includes a front garden plus a two meters high vertical garden that protects the PBRs from any possible vandalism. It should be noted that access to the façade is restricted to the public unless escorted.
The design of the “Artificial Tree” consists of a metal frame that resembles the structure of a “trunk” and “branches” that support the PBR with leaf-like shapes. The arrangement of the leaves ensures that they are all exposed to the sun and, at the same time, provide shade for users and a resting area underneath (
Figure 3).
In order to protect the structures from possible aggressions, the lowest “leaf” has been placed up high enough as to not be easily reached. Likewise, the sitting area is made from a hard type of fiber that protects the hydraulic system.
Due to the dynamic nature of microalgae growth, these elements can serve as lively sunshades that react to the amount of sunlight throughout the year. The concentration of biomass in the culture medium determines the degree of transparency of the element. The greater the amount of light, the greater the growth of the microalgae. For this reason, in the summer, the concentration of biomass in the system will be higher and will provide greater coverage, but the concentration will be lower for a longer period of time in the winter, which will make the element translucent [
25].
These components, in addition to serving as decorative elements and fixing CO2, offer extra protection from the sun and thermal insulation for the building in the case of the façade. They also act as shading elements within the overall urban environment.
The present design was conceived not only as a pilot project to be tested and studied but also as part of a community education system that is part of an environmental strategic plan promoted by ESMASA company.
5.1. Construction Elements of the PBR
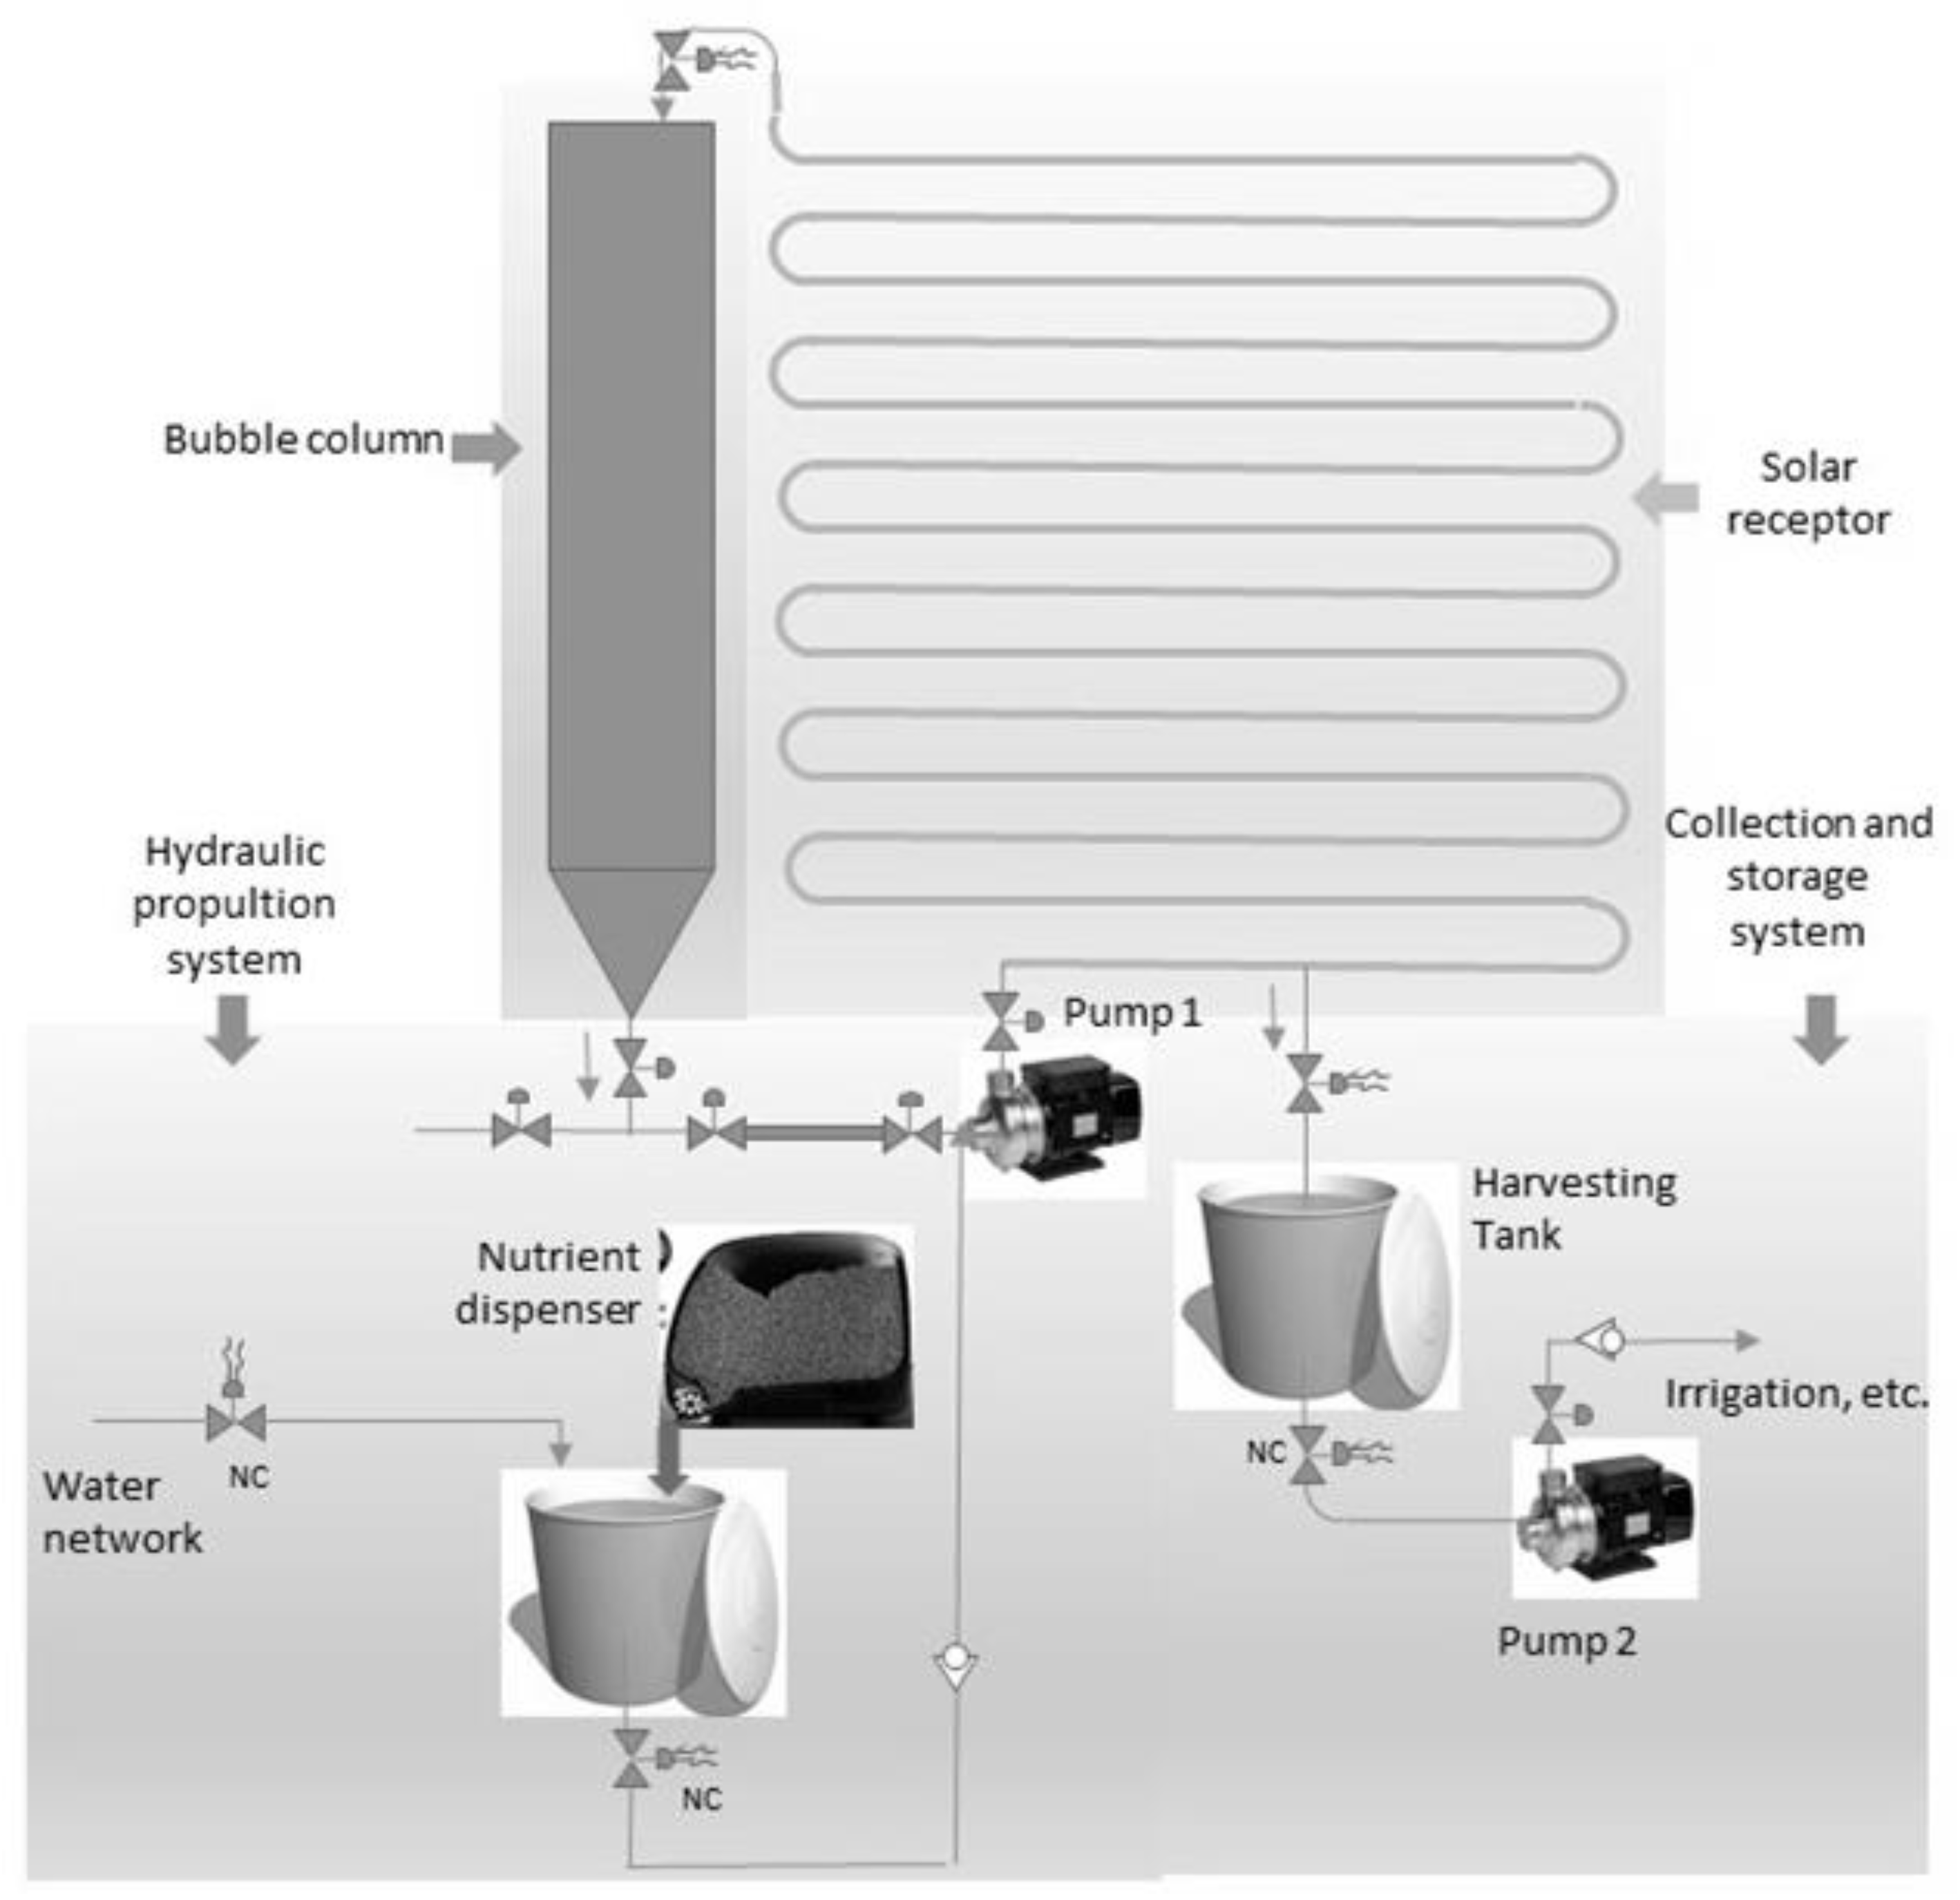
As mentioned earlier, microalgae require motion to have adequate exposure to sunlight and to perform the gas exchange necessary for their growth and biomass production. Here, the continuous flowing system uses a pressure pump to circulate the culture medium throughout the PBR. The system has different parts as listed in
Figure 4.
This element facilitates the necessary gas exchange to maintain an optimal atmosphere for the growth of microalgae, specifically the absorption of CO2 and the release of O2.
In this particular case, transparent tubes with a maximum diameter of 30 cm are used. As a continuous movement of the culture is necessary to avoid uneven concentration, a gravity-driven movement is proposed to expel O
2 through the upper part of the element [
26].
It consists of a “circuit” that allows the culture to be exposed to direct sunlight. The culture lives inside a transparent tubular PBR that has a diameter of less than 10 cm. This system creates an ongoing flow inside the closed circuit for the culture to be able to grow while avoiding the main disadvantages of open space cultivation such as low use of sunlight due to cell concentration; loss of aqueous medium due to evaporation; low CO
2 usage; and contamination-related issues from external elements [
27].
By using tubular shapes and pipes, interesting shapes can be generated that give individual character to the overall structure (
Figure 5). Playful dispositions can be elaborated using these common plumbing elements by isolating different types of algae by color and placed into assorted segments of the PBR to create unique colorful designs.
Weather condition impacts on the structure have also been examined. The resistance of the glue used has been tested against fluctuations due to wind conditions or variations by contractions due to temperature changes. The whole structure is designed with easy access in mind to reach only the pieces that might need replacement in case of damage without obstructing the rest of the structure.
This system connects the bubble column with a container element for the cultivation medium. It is necessary to empty the system periodically to add fresh cultivation medium once the microalgae have saturated the existing one [
27]. The container is specific to the type of PBR being used (either as a façade or an urban element) and the conditions of the site where it will be implemented. This system also depends on the intended use that will be given to the biomass.
Each of the proposed elements have a specific structure, though the main components to be used must be water resistant and able to withstand both the weight of the materials and the cultivation medium, as well as the continuous movement of the fluid (
Figure 6).
It incorporates all the necessary elements to connect the previous pieces to a self-priming pump that keeps the culture medium in motion throughout the system. This continuous movement ensures the exposure of microalgae to sunlight and the continuous exchange of gasses to avoid biomass accumulation and photooxidative damage [
28] while still staying connected to the collection and storage system (
Figure 7).
5.2. Methodology
The primary focus of the present study is on environmentally driven design and product development. The objective is to identify the most suitable material based on its physical, mechanical, hydraulic, and other relevant properties while considering the carbon footprint and the lifespan of each component. Due to the experimental nature of the project, commercially available elements were chosen to ensure feasibility and practicality.
The Life Cycle Assessment (LCA) proposed for this article was based exclusively on the study of the Life Cycle Inventory (LCI) since it was not intended to make an exhaustive analysis of the life cycle of the system but a previous study for the design and development of the product [
29].
A relative perspective around a functional unit could be given to the LCA by quantifying the performance of a product to be used as a reference unit.
The perspective used in the present study was design based on environmental aspects and product development. This analysis planned to obtain basic information on the balance of CO2 and the energy used to make decisions when choosing materials that had a lower environmental impact. These parameters were used to build a system that could generate significant changes in the sustainability (understood as a rational use of resources focused on the reuse of its own surplus) of urban environments in the future.
Given the experimental nature of the element as an application to architecture and urban life, a relative approach “from cradle to an intermediate point” was proposed. The initial operation of the system was established as the intermediate point of the life cycle. Thus, the focus of this study was the initial design, with the aim of bringing it to optimal operation by taking into account the environmental perspective in the initial choice of the materials that composed it. This information was indispensable when generating alternatives that could optimize the impact of negative CO2 in the future.
Based on the guidelines stipulated in UNE-EN ISO 14040:2006, [
29] the steps detailed in
Figure 8 were followed to carry out a study of the Life Cycle Inventory (LCI).
Data Factors
Only materials that were produced locally (in Spain) were used in order to obtain minimal impact on the calculation of CO2 from transport.
The data chosen for the stainless-steel structure were based on recycled material. Otherwise, the outcome would be impractical.
The data were entered into a calculation tool: The 2030 Calculator by Doconomy. According to its methodological approach, the data obtained were based on the next regulations:
- -
ISO 14067 on carbon footprint of products.
- -
IPCC 2021 GWP 100 impact model for modelling of resources and energy.
Additionally, its methodology was based on:
“…unique emissions factors for each material/ingredient used in each product and packaging part, distances between material suppliers, manufacturing facility and brand distribution centers, modes of transportation between these locations, production and assembly processes and the amount and type of energy used in manufacturing.”
The factors used in The 2030 Calculator [
30] were based on validated data obtained primarily from the following data sources:
- -
ICE—developed by the Sustainable Energy Research Team at the University of Bath;
- -
Defra—developed by the British Department for Environment, Food & Rural affairs EF;
- -
Database—Product Environmental Footprints (PEF) originating with the European Commission’s Single Market for Green Products initiative;
- -
Google Places API;
- -
Ecoinvent.
5.3. Technical Study of the Proposed Photobioreactor Components
The more abundant materials that could have had more of an impact on the operation and calculation of the carbon footprint were chosen to perform this technical analysis in order to choose the best material to be used:
To build the system where microalgae growth occurred, containers with high transparency properties were needed so that sunlight was fully absorbed. The available options of transparent materials on the market were glass, methacrylate, and polycarbonate tubes. Glass tubes were not suitable for this type of structure, as, when located as façade elements, they must include a protective layer to prevent breakages and to avoid possible accidents due to cuts. It is very difficult and expensive to add this layer to existing glass tubes since they are only manufactured commercially as a material for laboratory use. Furthermore, glass has 17 times less impact resistance than methacrylate and 250 times less than polycarbonate [
31]. For this reason, we ruled out the use of this material on the PBR elements.
With the remaining materials, an analysis of the technical characteristics was carried out in order to choose the one that met the necessary specifications, and, at the same time, had the lowest CO
2 emission per kilogram of material (
Table 2).
As a result of the analysis, methacrylate was chosen as the primary material due to its superior physical characteristics, including its higher tensile strength, inherent UV resistance that prevented yellowing, and transparency almost equal to that of glass, all of which benefited the exposure of microalgae to sunlight. Secondly, and for the purposes of this analysis, its most important characteristic was that it produced almost 57% less CO2 production per kg of material compared to polycarbonate. This guaranteed that the amount of time needed for the PBR to fix the amount of CO2 produced by its materials during manufacturing decreased considerably.
It should be noted that the methacrylate elements used did not contain heavy metal salts or halogens (such as chlorine) or plasticizers. This type of container would even meet the health and safety standards established for food containers. Thus, microalgae grown in them could be specifically processed up to the point of being suitable for the production of items fit for human consumption such as food, cosmetics, health supplements, as well as livestock feed, etc. [
36].
To create the hydraulic conduit system, fittings such as elbows, unions, and shut-off valves were needed to connect the transparent tubes to feed the pump and the bubble column. The most-common fittings of different materials available on the market were polyvinyl chloride (PVC), polyethylene (PE), and polypropylene (PP) [
36]. (
Table 3)
There are accessories made of each type of material listed above. However, PVC components were chosen, despite having the highest CO2 emissions since a lesser amount of material was needed compared to the polypropylene accessories.
In addition, they had a recycling rate of 100%, emitting 1/3 of CO
2 compared to virgin materials [
46] or even to Polyethylene—which is not recyclable due to a chemical change that occurs when it is burnt [
47]. PVC is also available in a wide range of sizes and shapes and offers an array of accessories, as they are the most commonly used fittings in water channeling. Another point in its favor was that PVC is compatible with methacrylate and there are adhesives that ensure its water tightness.
For the attachment and organization of these elements, a support structure is needed that matched the aesthetic design of the PBRs. Only the intrinsic structure of each element was taken into account, as the attachment to existing elements may change according to the anchoring site.
The material options available on the market for the construction of these segments were stainless steel and aluminum. As with the previous materials, an analysis of the technical characteristics was carried out (
Table 4).
Comparing aluminum with stainless steel, aluminum had the advantage of being 34% lighter than steel. However, steel had a 56% higher tensile strength, a three-times higher modulus of elasticity, and produced 43% less CO2 production per kg of material.
Interestingly, during the analysis of carbon footprint in the production of structural materials, the production of virgin aluminum was found to be one of the industrial processes that generated the most greenhouse gasses [
48].
Moreover, one of the advantages of using steel was that it had one of the highest recycling rates of any material. Around 50% of stainless-steel scrap is used to produce one ton of new stainless steel, according to the International Stainless Steel Forum [
50].
5.4. Operation of the PBR and Water Consumption
The operation of the PBR included periodic harvests that allowed for the incorporation of fresh culture medium for the microalgae to grow. The culture medium necessary for the growth of microalgae consisted of nutrients and water. The nutrients were provided by a company specialized in the cultivation of microalgae. Periodic harvesting of the culture medium must have been made as the microalgae grew since the cellular concentration impeded the sunrays to reach the medium, and the necessary nutrients for growth were depleted. These periodic harvests entailed a continuous use of drinking water to replenish the culture system. For this reason, the first course of action should be to store rainwater from the building’s roof throughout the year (
Table 5). The approximate area of the building was 1200 m
2. In addition, the water collected from the PBR was also intended as irrigation water for the green areas of the Municipality of Alcorcón.
Due to the fact that the Madrid area is not a high humidity zone, annual rainfall was low. However, the drinking water collected from the PBRs had a dual use, as it contributed to extracting CO
2 from the environment, and, at the same time, it contained biomass with high levels of macro- and micro-nutrients that enhanced the growth of green areas [
15].
5.5. Biomass Production Calculations
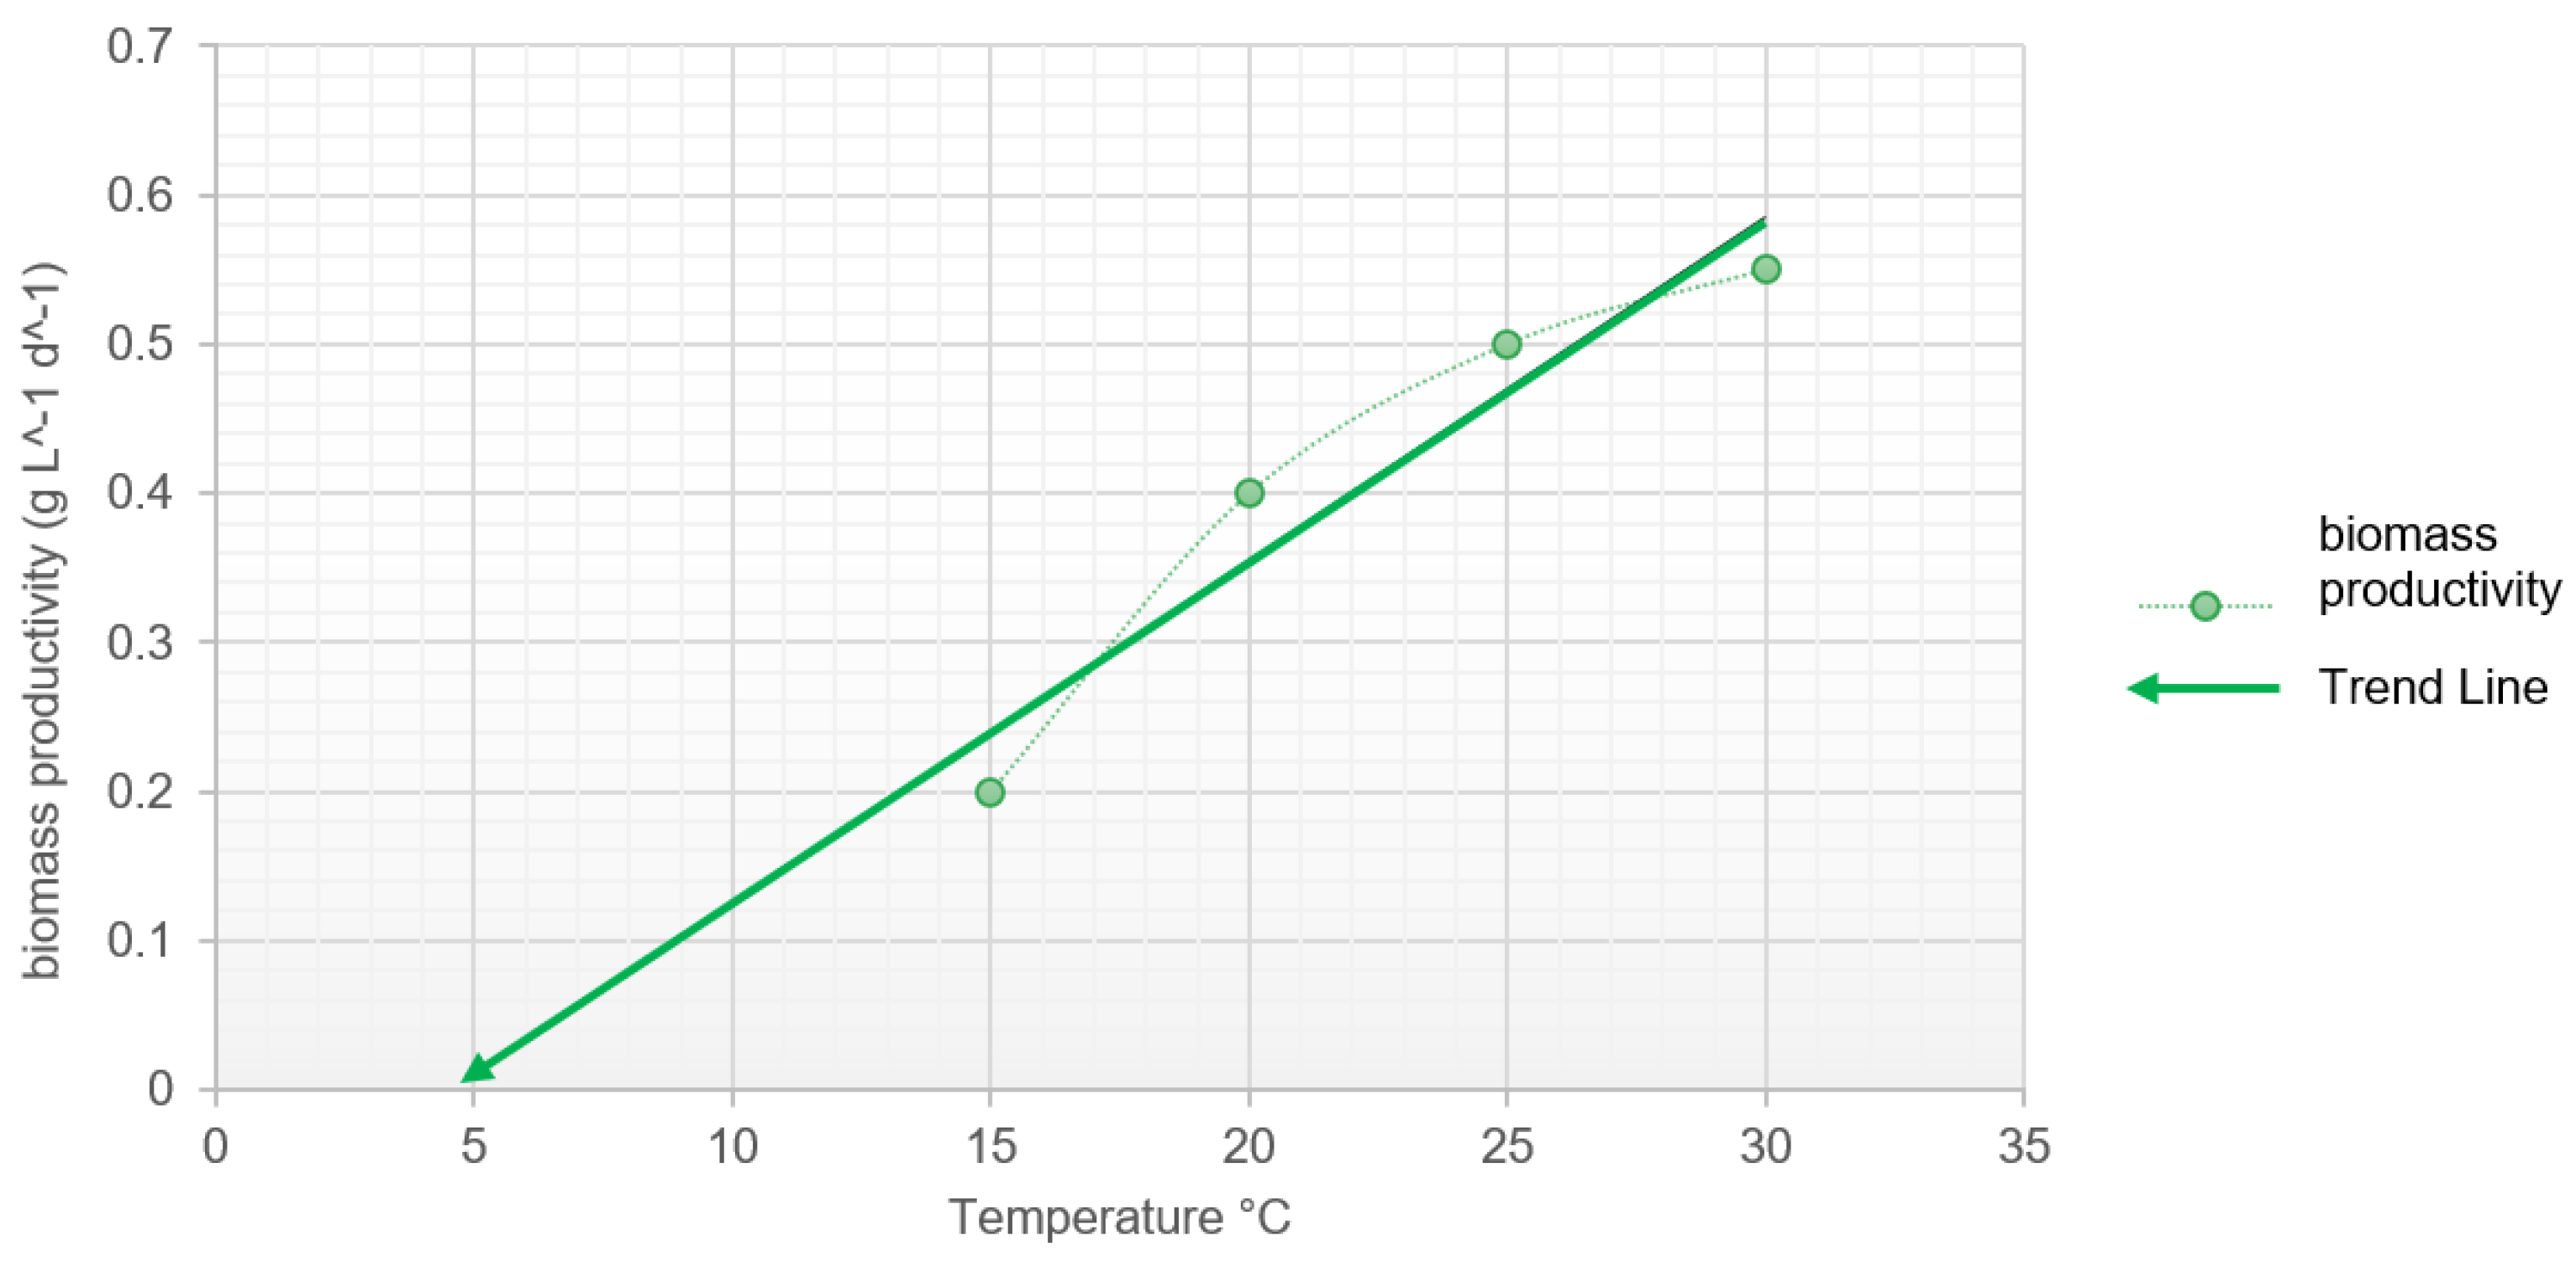
In order to generate an efficient change in environmental impact, the ambient temperature and sunlight were used to calculate the growth of microalgae since heating or cooling the water within the system would have resulted in additional energy loss and additional CO2 produced.
A local company that addressed microalgae growing had been consulted, and, among the varieties of microalgae that we had chosen, based on its yield, they suggested that we should start with the Scenedesmus Vacuolatus strain since they had already worked with it in Madrid. The average monthly temperature in Madrid ranged from 5 °C to 25 °C [
51]. Due to this high variation in temperature, it was necessary to find a strain of microalgae that could adapt to this variability. According to previous analyses, the Scenedesmus Vacuolatus strain had shown good adaptability results to extreme temperatures [
52].
The growth rate of the Scenedesmus were used to calculate CO2 fixation and biomass production of the architectural elements studied in this article to verify it once the PBR under construction was operational.
A linear regression analysis was performed using data from DIGITAL.CSIC by García Cubero (2017) [
53], which compared biomass productivity (g L
−1 d
−1) at certain temperatures with the CO
2 fixation rate (g L
−1 d
−1) of the Scenedesmus Vacuolatus strain, and a linear extrapolation was formulated from the trend line obtained to establish growth rates for the lowest average temperatures (
Figure 9).
Based on the previous graph, the growth rate could be determined based on the temperature. The time it took for the microalgae to reach the maximum concentration could be calculated based on this data, which for the Scenedesmus strain was 1.2 g L
−1 [
53]. In order to use the existing strain in the circuit to maintain the continuous growth, around 20–50% of the mixture needed to be harvested periodically. Growth rates and critical concentrations were used to arrive at a certain harvest percentage of the microalgae mixture per month (
Table 6).
Based on the assigned growth rate according to Scenedesmus productivity, the amount of biomass produced and CO
2 fixed were determined by calculating the monthly production of biomass from the daily growth rate and the total volume of the PBR. The Scenedesmus microalgae could fix 1.8 kg CO
2 for each kg of biomass produced [
54]. (
Table 7).
5.6. Advantages of Using Biomass as a Natural Fertilizer
As mentioned earlier, agronomic complications derived from climate change have led to a reduction in food production. This is the reason why there is a serious concern regarding the indiscriminate use of agrochemicals or synthetic fertilizers to obtain higher yields in crops [
8]. Eighty percent (80%) of the emissions generated by agricultural activity are associated with the manufacture of mineral fertilizers and by the emissions of gasses they produce once applied to the soil [
55].
There are many types of fertilizers, and, for the purpose of this analysis, data obtained from a study carried out by the “Spanish Inventory of Emissions System” on CO
2 emissions due to fertilization with urea were relied upon. Urea fertilizers release ammonia that is then absorbed in by soil generating a high level of pollution. According to this study, in 2016, 469,810 Tons of CO
2 were generated solely from the use of urea as a fertilizer. This meant that 1.57 kg of CO
2 was produced per kilogram of urea [
56].
5.7. Carbon Footprint Calculations
After the materials with the lowest environmental impact were determined, the Carbon footprint of the system was calculated by adding up the CO
2 produced by the materials themselves and the CO
2 emitted by the machinery used during construction, including transportation. The energy used for the operation of the hydraulic system was provided by a small photovoltaic installation (three panels), as it did not use a large amount of energy (
Table 8).
Once the carbon footprint of the system was established, the CO
2 generation data were compared to the amount of CO
2 captured by the PBRs to establish the period of time needed to balance the CO
2 required for its manufacturing. This table also includes the savings achieved by using microalgae compared to the data obtained for CO
2 produced by urea fertilizers (
Table 9).
It would take 11.11 years to fix the CO
2 produced by the façade. The lifespan of most of the materials was generally up to 50 years. However, a 30-year replacement fee will be considered. The calculation of the amount of CO
2 that could be fixed after the years needed to balance its own carbon footprint was determined as follow (
Table 10):
This system could eliminate 27,142.19 kg of CO2 from the atmosphere before it was necessary to replace the building materials and produce 230.70 kg of CO2 while still operative.
6. Results
Based on the analysis conducted in this study, the following results were obtained:
The Photobioreactor (PBR) façade is estimated to sequester approximately 720 kg of CO2 per year and produce 400 kg of biomass. Additionally, each unit of the artificial tree will sequester 50 kg of CO2 and produce 28 kg of biomass annually. Moreover, the system will reuse 16,064.52 L of rainwater over the course of a year.
Taking into account the balance achieved through the CO2 fixation of the biomass and the reduction in the use of chemical fertilizers, it is projected that it will take 11.11 years to offset the carbon footprint generated by the manufacturing materials, construction, and operation of the system. However, due to the extended lifespan of the materials, the façade can remove over 27 tons of CO2 from the atmosphere before requiring replacement. This significant contribution aids in the reduction in greenhouse gas emissions within the urban area, utilizing minimal space compared to other natural strategies.
Furthermore, it is worth noting that a synergistic effect is generated by a product that has three benefits directly linked to CO2 fixation within the carbon footprint of PBRs: firstly, it consumes CO2 during the growth of microalgae; secondly, it avoids the production of additional CO2 in the manufacturing of fertilizers; and, thirdly, as the biomass acts as a natural fertilizer, it promotes the growth of plant material that also fixes CO2 in turn.
While the amount of CO2 removed from the air may not be enormous, it holds substantial importance where it is most needed—urban areas with high population densities. Additionally, the CO2 emitted by the materials used in the PBR is not generated within the urban area where the system is intended to be implemented. Consequently, the implementation of the PBR will result in a significant improvement in the city residents’ quality of life, as it helps clean the breathable air within the city.
7. Discussion
There is still much research to be conducted regarding the applicability of these systems to enhance efficiency. There are two approaches to significantly enhance the efficiency of this specific element. Firstly, scaling up this technology to incorporate larger areas, such as large buildings, clusters of buildings, and even entire neighborhoods would enable more efficient CO
2 capture and heightened biomass production. This, as discussed in
Section 3, would result in optimal utilization of operational energy costs. Secondly, integrating the Photobioreactor (PBR) directly into the building’s façade would eliminate the need for separate construction of the PBR, thereby minimizing material usage and maximizing efficiency by seamlessly incorporating it as an integral part of the building structure.
Nevertheless, we believe that this serves as an excellent starting point for establishing a database that will facilitate future investigations and advancements. However, to ensure the readiness of this project for scalability and replicability, certain factors need to be taken into consideration. The following areas will be addressed in future research:
Extending the lifespan of architectural elements to reduce the CO2 impact throughout their useful life.
Testing different materials that have implemented environmental strategies to minimize their carbon footprint.
Exploring various designs or types of Photobioreactor (PBR) that can be applied to architecture, striking the right balance between the quantity of material used and the capacity of the culture medium.
Conducting tests in diverse locations to analyze strategies for adapting to varying environmental conditions, urban infrastructures, architectural styles, and cultural contexts.
Evaluating different types of microalgae to identify the species with the highest performance in terms of biomass growth and CO2 fixation, capable of adapting to Madrid’s changing weather conditions.
Furthermore, apart from the direct matters that could benefit this project, there are some overall aspects to take into consideration. It is important to focus the future research on the applicability of the PBR to use the wastewater and CO2 produced by a building. This will contribute to achieving a closed and metabolic cycle of water consumption and emissions produced by the building that will make the buildings able to process its own waste and cities to become a more sustainable area for people to live.
Finally, it is essential to generate projects to find or modify a strain of microalgae that has superior photosynthetic capacity, thus improving CO2 fixation. A surge in biomass production would mean an increase in the efficiency of the entire system, and thus this technology would become profitable and be used on a massive scale.
In conclusion, by incorporating recycled materials, scaling up the technology, utilizing wastewater and CO2, and optimizing microalgae strains, the proposed system has the potential to achieve a zero footprint. The result will be innovative green aesthetics and significant CO2 savings, increased biomass production, and a closed metabolic cycle within buildings, making cities more sustainable areas for their inhabitants. Continued research and development in these areas will lead the way for the extensive adoption and profitability of this technology on a massive scale.


