Article

Multi-Objective Analysis of Visual, Thermal, and Energy Performance in Coordination with the Outdoor Thermal Environment of Productive Façades of Residential Communities in Guangzhou, China

1
School of Architecture, The University of Sheffield, Sheffield S10 2TN, UK
2
School of Architecture, Design and Planning, The University of Sydney, Darlington, NSW 2008, Australia
3
Edinburgh College of Art, The University of Edinburgh, Edinburgh EH3 9DF, UK
4
Department of Architecture & Civil Engineering, University of Bath, Claverton Down, Bath BA2 7AY, UK
5
School of Natural and Built Environment, Queen’s University, Belfast University Road, Belfast BT7 1NN, UK
6
College of Architecture and Urban Planning, Qingdao University of Technology, Qingdao 266033, China
*
Authors to whom correspondence should be addressed.
Buildings 2023, 13(6), 1540; https://doi.org/10.3390/buildings13061540
Submission received: 9 May 2023 / Revised: 11 June 2023 / Accepted: 13 June 2023 / Published: 16 June 2023

Abstract

:
Population growth and urban expansion have led to increased demand for buildings. Optimizing the building façade design, using integrated photovoltaic (PV) shading and vertical farming (VF) can reduce building energy consumption while ensuring a partial food supply. However, the importance and prevalence of productive façades have not received significant attention. Furthermore, few studies have focused on the impact of productive façades on both indoor and outdoor environmental qualities. Therefore, this study aimed to explore the potential of integrating productive façades with residential façades in high-density cities. A typical community in Guangzhou, China was investigated. Thermal comfort, light comfort, electricity production, and crop yield were considered, and the optimal façade configuration was chosen from the established 146-model library. The integrated module can effectively improve the indoor lighting and thermal comfort of residential buildings. The module also mitigates the outdoor thermal environment to a certain extent, meeting 6.3–10.3% and 7.6–9.6% of the annual electricity and vegetable demands, respectively, in residential communities. This study can guide other densely populated cities with subtropical climates to advance the research and construction of productive façades, improving occupant comfort, reducing energy consumption, and mitigating food security and urban climate change issues.

1. Introduction

The building sector consumes more than one-third of the total energy used in most developed countries [1] and is a major source of global greenhouse gases [2]. In developing countries, especially China, which has the largest building market in the world [3], rapid urbanization and expansion [4] require more energy and carbon emissions [5]. Although the impact of new buildings is greater than that of the building stock [6], researchers should pay more attention to reducing carbon emissions through building retrofits, as almost three-quarters of the buildings to be used by 2050 have already been built [7]. Because the building envelope is the main factor affecting building energy consumption, many studies have focused on ensuring indoor environmental comfort while reducing the net energy consumption of buildings [8,9].
Tablada et al. [10] developed the idea of productive façades by integrating photovoltaic (PV) systems and vertical farming (VF) to façades to ensure the indoor thermal and visual conditions of residential buildings while maintaining energy and food production performance. This approach leverages the installation of photovoltaic shading devices (PVSDs) to convert excess solar energy into electricity, while concurrently improving indoor thermal comfort [11]. Furthermore, VF capitalizes on the building façade as a growth medium for vegetables, thus reducing the carbon footprint caused by transportation and benefitting the urban food supply, which may positively impact the outdoor microclimate as a living wall. Kulak et al. [12] demonstrated that VF could reduce the pressure on food supplies and improve environmental problems caused by greenhouse gases, providing suitable crops and appropriate cultivation methods are used. Furthermore, VF provides urban residents increased access to nature.
However, the existing PV and farming applications are mostly limited to roofs and buildings, respectively, and do not provide sufficient benefits. Although productive façades perform well, their importance and prevalence have not received much attention in other countries. For them to be applied to more buildings, proposing a design and optimization method to meet the needs of specific buildings is necessary.
Currently, approximately 13% of carbon dioxide emissions in China originate from residential building operations [13], and residential building retrofits will play an important role in the building industry to achieve carbon neutrality [14].
Hence, this study focused on residential buildings in Guangzhou, China as a research site, as it is located in a hot summer and warm winter (HSWW) zone. It has the highest average solar radiation among cities in the HSWW zone, reaching 4279.58 mJ/m2 annually, and is classified as a resourceful region by the Chinese National Energy Administration [15,16]. This results in a high horizontal PV potential of 44.06–72.12 billion kWh per year [17], which offers a huge opportunity for building-integrated photovoltaic (BIPV) systems and VF integration on façades of residential buildings in HSWW zones [18].
This study aimed to explore the potential of integrating productive façades into residential buildings in dense urban areas in subtropical regions. A multi-objective optimization of the configuration of the productive façade was used to generate the best combination of PV and VF systems according to the specific building context, which can have a positive effect on the thermal comfort around the building. In addition, this research can guide other dense cities with subtropical climates to advance the research and construction of productive façades to improve occupant comfort, reduce energy consumption, and mitigate food security and urban climate change issues faced by cities.
The paper is structured as follows: the literature review presented in Section 2, which analyzes the current situation of residential communities in Guangzhou, vertical farming, photovoltaic shading systems, and human comfort. In Section 3, the methodology and the entire experimental process are elaborated. The results and discussion are presented in Section 4 and Section 5, respectively. Finally, the conclusions are summarized in Section 6.

2. Literature Review

2.1. Existing Research

The various ways to improve the outdoor thermal environment can be summarized as follows: optimizing community layout and planning to enhance natural ventilation [19,20,21], changing building skin material and color to reduce absorption and storage of solar radiation [22,23,24], implanting various greenery combinations to adjust hot and humid microclimates through transpiration and shading [25,26,27], and integrating shading or green systems onto the original façade to regulate both the interior thermal parameters and exterior microclimate [28,29,30,31,32].
The integration of photovoltaics and vertical farming on façades is recently emerging as a novel approach because of the target of net-zero energy buildings (ZEB or nZEB) [33,34]. Therefore, they have the potential to achieve nZEBs [35]. The potential of PV on vertical elevations and vertical farming over horizontal roofs has been reported [36], and the integration of the two systems has been developed and implemented in residences that are either newly built or renovated in many developed countries [11,37].
For highly urbanized southern Chinese cities with adequate light conditioning, most studies have focused on separate applications of PV and vertical greenery systems on building envelopes [17,38,39]. Some studies on outdoor microenvironments in subtropical cities investigated the linkage and impact of greenery [40]; however, studies linking façades that integrate PV and VF with outdoor microenvironments in residential communities in large subtropical cities are lacking.

2.2. Vertical Farming on Facades

Vertical farming is widely used for rooftop gardens [41] and multilevel planting beds or planting systems in old and new buildings [42]; VF on façades is mostly found in the latter. VF has a considerable effect on alleviating the food shortage issue in cities [43] owing to decreasing arable land area and increasing food demand caused by rapid urban expansion and population growth. Façade resources are sufficient because of the ever-increasing building height and density. However, the use of building skin for production is not widespread. Tablada and Kosorić [43] proposed that using building skin as a medium for fruit and vegetable production is valuable, as it takes advantage of the sunlight available on the upper floors, saves space indoors, and helps moderate the outdoor climate. In addition to promoting food security at the household and community levels, vertical farming improves the quality of life of urban residents by enhancing human health and socialization [44], shortening the distance from farm to fork, and reducing carbon emissions.
In addition, the application of VF in multistory buildings has many benefits, such as mitigating the urban heat island effect and improving the thermal insulation performance of building façades [45], although this may affect natural ventilation in the building [46].

2.3. Photovoltaic Shading

Solar energy is one of the most popular renewable energy sources because of its abundance, cleanliness, and inexhaustibility. Moreover, photovoltaics can collect light energy and convert it into energy at acceptable costs [47]. Building-integrated photovoltaic (BIPV) refers to the replacement of traditional building envelopes (roofs, façades, or windows) with photovoltaic modules [48] so that the building has the ability to generate electricity [49]. Relevant studies have proven that installing photovoltaic installations can save 50–80% of artificial lighting [50], 11% of cooling energy consumption, and 13% of electricity consumption [51]. Moreover, photovoltaic materials lead to additional costs of 2% and 5%, respectively [52]. The benefits of energy savings outweigh the disadvantages of additional costs. Additionally, the development and use of photovoltaic technology on building skin are important for reducing building energy consumption and achieving zero building energy consumption.
PVSD effectively converts unnecessary solar energy into electricity [53]. A PVSD can prevent indoor thermal discomfort and glare by blocking unnecessary light and heat radiation while ensuring power output [54]. Zhang et al. [55] indicated that applying PVSD systems in modern and densely built metropolises, such as Guangzhou and Hong Kong, is an effective method for promoting low-energy buildings. The most effective control method for PVSD should vary based on factors such as climate characteristics, building type, and building orientation [47]. Therefore, the focus of PVSD research is on four aspects: the PV panel angle, arrangement, PV cell material, and panel size, all of which are closely related to PVSD energy efficiency and indoor comfort.
An appropriate tilt angle for photovoltaic panels can enhance their performance. Kim et al. [56] found that adjusting the tilt angle of photovoltaic panels to an appropriate degree could increase electricity production by 32% and reduce building energy consumption by 35%. Although dynamic solar tracking systems can maintain maximum solar energy conversion efficiency, their high costs may offset the benefits of PVSD. Thus, the relatively most effective tilt angle exists for the static PVSD in different regions. For example, in Hong Kong, the recommended installation angles of the PVSD are 30° and 20°, which are suitable for the two situations with the highest energy generation and comprehensive energy saving rate, respectively [55]. Paydar [57] also found that in Guangzhou, non-adjustable PVSD presents the most effective performance at a tilt angle of 30°.
The orientation of the axis of PV shading devices (PVSD) in the horizontal or vertical direction can also affect their shading effectiveness and energy performance. Shi et al. [58] showed that reducing the width of the PV panels or placing them vertically could effectively prevent the shading effect of the upper PV panel. In addition, the distance between the top edge of the window and the PV panel is an important parameter, typically 0.5 m.
At present, in terms of material types, the mainstream material selection trends include crystalline silicon photovoltaics and thin film photovoltaics. Monocrystalline Si and CIGS thin films were the most suitable photovoltaic panel materials for dynamic photovoltaic shading. First, the crystalline silicon photovoltaic power conversion rate is high but is greatly affected by temperature [59]. Crystalline silicon photovoltaics have an absolute advantage in the global photovoltaic cell market (90%) [60]. Compared with polycrystalline and amorphous silicon, monocrystalline silicon has a higher performance ratio and panel power generation efficiency [61]. The conversion rate of thin-film photovoltaics (CIGS) is low [62] and inert to temperature [63]. Defaix et al. [64] forecast a 17% increase in thin-film technology efficiency by 2030. Singh et al. [65] showed that CIGS solar cells have lower material and energy requirements and better processing costs. Based on both availability and constructability considerations, CIGS technology has been identified as a suitable photovoltaic material for future PVSD [66]; the first is from a usability perspective, thin-film photovoltaics are more resistant to shadow effects and high temperatures. The production of CdTe solar cells requires the use of toxic substances, such as cadmium and tellurium, which are potentially harmful [67]. Therefore, CdTe solar cells are not suitable for PVSD applications. From a constructability perspective, CdTe is exceptionally heavy, whereas CIGS is relatively light, enhancing its applicability in shading systems, whose structures are generally less load-bearing than a roof- and facade-integrated PV system.
In terms of the panel size, with modular building integration, the market is clearly geared towards opaque or translucent rectangular modules [68]. Thin-film technology is widely used because of its size flexibility. The CIGS film has no size limitations and is relatively flexible. As the film is attached to the surface of the photovoltaic panel, it can be set according to the size of the single-crystal silicon. For monocrystalline silicon, the current size of monocrystalline silicon on the market is mostly 156 mm, 161 mm, and 166 mm [69]. Thus, one must consider 0.2 m as the modulus unit.

2.4. Building Micro-Environment and Environmental Comfort

People in cities spend most of their time living in buildings; therefore, the environmental conditions inside buildings are essential for human health and comfort. The main building microenvironment indicators to be explored include indoor thermal, indoor light, and outdoor thermal environments. Previous studies assessing the comfort of indoor residents were based on the effect of a single environmental condition on a person and separately defined the criteria for comfort [70]. However, not everyone’s satisfaction with the environment is based on a single criterion, and evaluation of environmental comfort also contains many subjective factors. Thus, an environmental evaluation that combines multiple indicators would have more credible results.
Thermal comfort is a psychological state indicating satisfaction with the thermal environment. Standard ISO 7730 [71] presents the predicted mean vote (PMV), which indicates that predictions of the average thermal sensation and average satisfaction with the thermal situations of a group of individuals are available. PMV values provide an initial prediction of indoor personnel comfort and are more reliable than simply defining comfort zones based on indoor humidity and temperature [72]. The environment is defined by four variables: average radiation temperature, air humidity, air temperature, and relative air velocity, and two functions related to a person’s clothing indices and activity levels.
Visual comfort is defined as the subjective condition of visual well-being caused by the visual environment. The conventional notion of illumination uniformity is inadequate for reflecting realistic lighting conditions, given that actual daylight levels within buildings can exhibit substantial variations in both the temporal and spatial domains [73]. A relatively valid indicator for evaluating the indoor light environment is the useful daylight illuminance (UDI), which is usually 100–2000 lx and is often used to calculate the distribution of light inside buildings [73].
Regarding the outdoor environment of buildings, the heat island effect, wind speed, and wind pressure are the main elements considered in some Chinese building codes. Outdoor temperature and humidity should also be considered, which are crucial for outdoor thermal comfort. The universal thermal climate index (UTCI), which includes temperature, solar radiation, relative humidity, and wind speed, is a composite indicator of the comfort level of the external environment.

3. Materials and Methods

3.1. Workflow

Figure 1 illustrates the workflow of this study. The first step was to select a specific community for simulation. We reviewed the spatial layout of residential areas in the city (Guangzhou) and select a typical residential community with a representative spatial layout and typical data features as the research object. Then a three-dimensional digital model was established. This study aimed to explore the potential improvement in the microenvironment in residential spaces through the application of integrated VF and PV shading façade modules. Therefore, the evaluation criteria for façade modules must comprehensively consider the current status of the residential community in Guangzhou. Owing to the influence of a humid and hot climate in Guangzhou, and the heat island effect caused by rapid urban development, most densely built residential communities are prone to thermal discomfort. Additionally, there are problems with indoor glare and uneven lighting. Therefore, the evaluation criteria focused on indoor thermal and lighting environments. From the perspective of resource output, the crop yield of VF and electricity generation of PV modules are also considered assessment indicators.
The next step was to define the control parameters of the façade components. The design of the façade unit required controlling different variable parameters to determine the possible forms of PV shading and VF components. Regarding the PV shading design, the parameters to be considered included the PV type, tilt angle, size, and arrangement. Regarding the VF design, the parameters to be considered included the planting size, planting gap between crops, and planting rows.
Combining all these elements produced a prototype library, and all generated prototypes were then simulated using performance simulation tools. Based on various evaluation criteria, including indoor thermal and lighting environments and electricity production, suitable modules for different height zones and residential units were selected by synthesizing the simulation results.
The final simulation stage involved the integration of different façade modules in different regions to establish a comprehensive building model for simulating the outdoor microenvironment of the community and analyzing the status of the outdoor thermal environment. The multi-objective optimization process is based on the Rhinoceros7 and Grasshopper parametric modeling tools and Ladybug 0.0.67 [74], OpenStudio, Daysim [75], EnergyPlus [76], and Radiance [77] performance analysis tools. In the second phase, ENVI-met [78] was used to simulate the outdoor microenvironment.

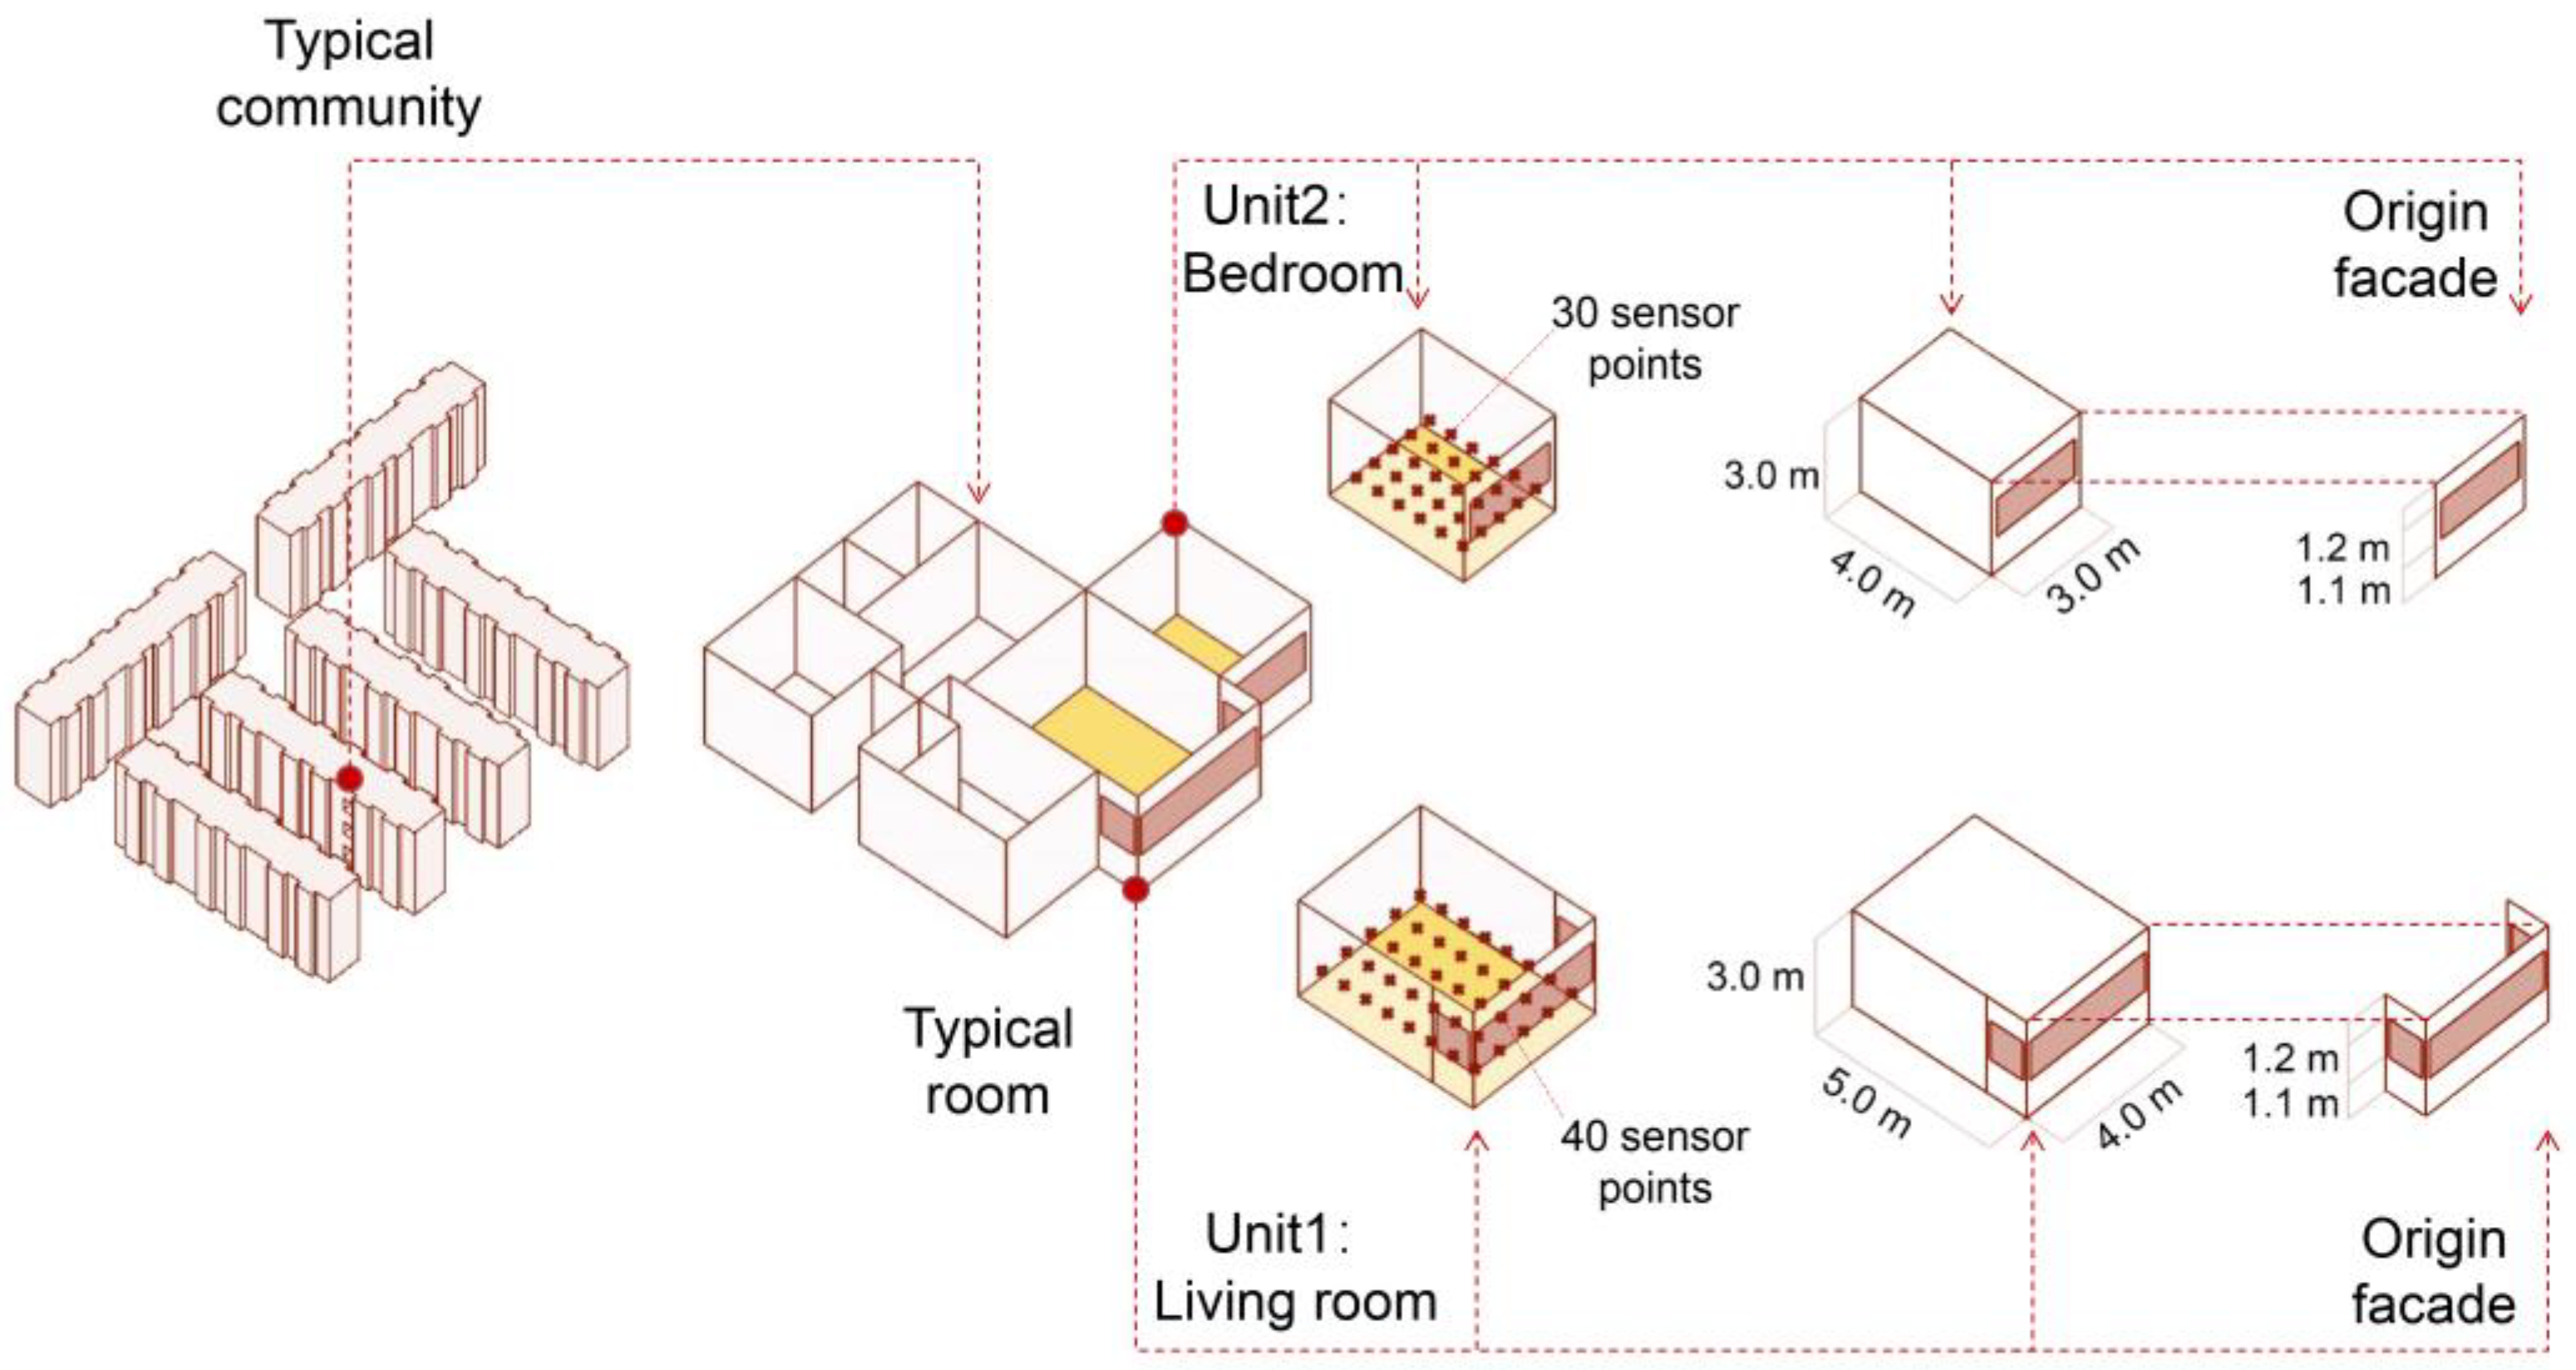
3.2. Selection of a Typical Community in Guangzhou

Guangzhou (112.8° E–114.2° E, 22.3° N–24.1° N) in the province of Guangdong is a typical subtropical city characterized by an HSWW climate, with an average annual temperature and relative humidity of 22 °C and 77%, respectively [79]. To select the representative residential community for research, big data research was conducted to collect information on residential communities built in Guangzhou based on the Python Scrapy framework. Information on community location, construction year, and the number of residents was collected from the Guangzhou local estate website, which provided evidence for establishing a profile of the target community. The total number of datasets acquired was 19,184, within which 9005 sets were in the Guangzhou central city region, whereas the rest of the data were abandoned because of incomplete details.
Figure 2 summarizes the population distribution in the communities in residential buildings of different-height types from 1958–2022 in Guangzhou, which shows that the multi-story (4F–11F) community was the leading building type during 1990–2005. However, its proportion has continuously decreased in recent years.
A total of 4685 multi-story (4F–11F) residential communities were built between 1990 and 2006, accounting for 52% of the total samples in Guangzhou. Further filtering locks between 2000 and 2006 with the highest number of residential buildings. During this period, residential communities were commonly arranged in a matrix pattern and shared certain features, including a greenspace ratio of over 30%, an inter-building distance of approximately 12–13 m, and 6–8 floors. Based on these criteria, more than 200 communities were screened and compared, and the “Tianhe Taoyuan” (Figure 3) community was selected as the reference community for the simulation because of its adherence to all desired features.
Figure 4 shows typical community and room settings, simulation unit sizes, and sensor points. A typical building located in the middle of the community was then selected, divided into three regions (low, middle, and high) with two floors per region, and modeled in Rhinoceros for later simulation. Two categories were defined as simulation units according to the differences in space function and façade window-opening size: bedroom space and living room space (with balcony). The typical space features filtered by big data were as follows: living room features of width 4 m and depth 5 m, bedroom space features of width 3 m and depth 4 m, floor heights of 3 m, bay window heights of 1.1 m, and window heights of 1.2 m.

3.3. Evaluation Indicators and Optimization

Regarding the setting of evaluation indicators, the resource output should be considered: power generation via PV shading panel and crop output of VF. Additionally, the impact of components on indoor and outdoor micro-environments should be considered; that is, the impact of PVSD as shading components on indoor lighting and indoor and outdoor thermal environments [53], as well as the interaction between crops and the environment [78]. We used a distributed optimization method, and the evaluation indicators considered for the indoor microenvironment and resource output were the indoor thermal environment, predicted mean vote (PMV) [72], indoor lighting environment, useful daylight illuminance (UDI) [73], and output power of PV power generation (P). The PMV evaluation indicator for the indoor thermal environment was used to assess suitable choices for static and air-conditioned spaces. The evaluation indicator for the indoor lighting environment was UDI, which was used to calculate the light distribution inside buildings; only illuminance within the range of 100–2000 lx is considered useful [73]. The first step was to screen and select the integrated components for optimization. The optimization process was designed using the selection method in Formula (1), and the algorithmic steps are presented in Appendix A; then, the Rhinoceros + Grasshopper tool were used for data processing.
The design prototype merit formula was calculated as follows:
O best = Min P i P max P max 2 + UDI i UDI max UDI max 2 + PMV i PMV max PMV max 2
  • UDI = average effective natural daylight illuminance (UDI 200–3000 lx).
  • PMV = predicted mean indoor polling value.
  • PMV0 = PMV value of 0 when the indoor thermal environment is moderate (note: for calculation feasibility, all PMV values were based on the original + 1).
  • P = output power of the adaptive façade dynamic PV shading system.
The second step involved applying the selected component prototypes from the first step to their corresponding height zones and building façades before using the ENVI-Met tool to calculate the universal thermal climate index (UTCI) of the outdoor microclimate of the entire community model [78]. This step simulated an overall improvement in the outdoor environment. Finally, the total energy output of the PV system and total crop yield in terms of crop dry weight were calculated for the entire system [80].

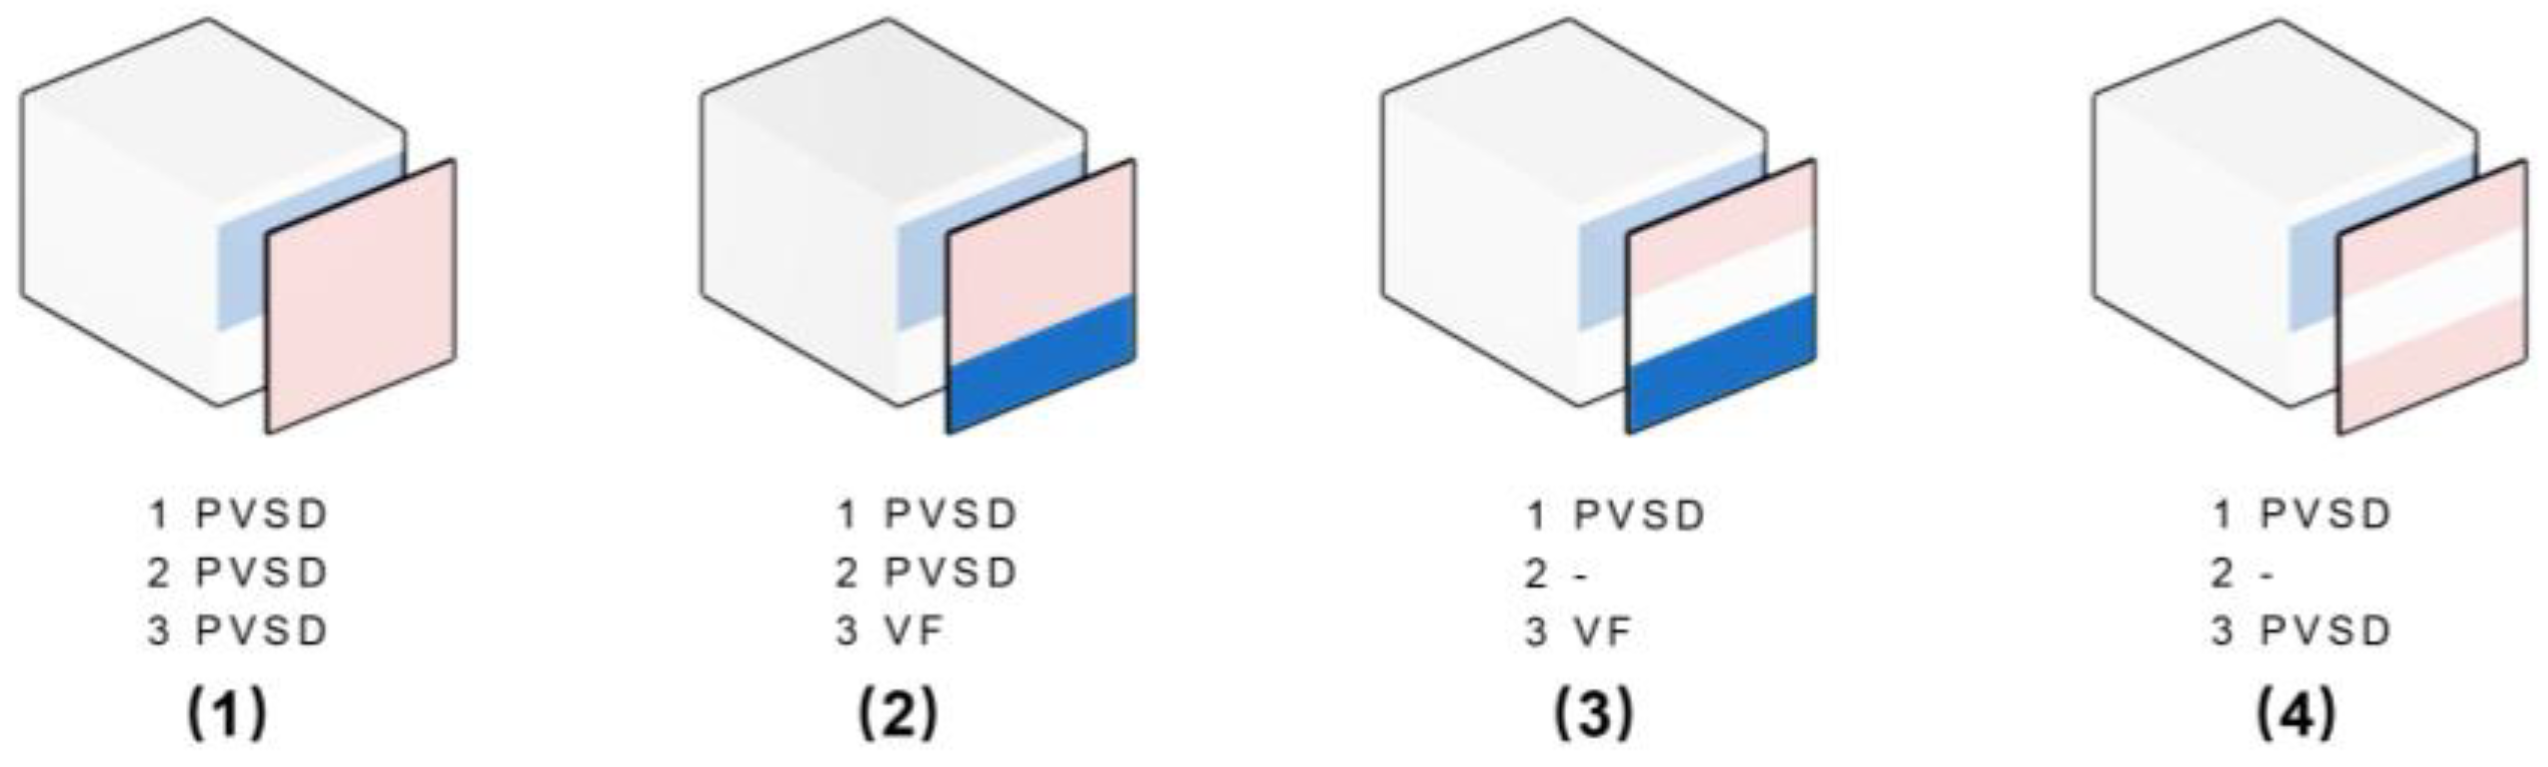
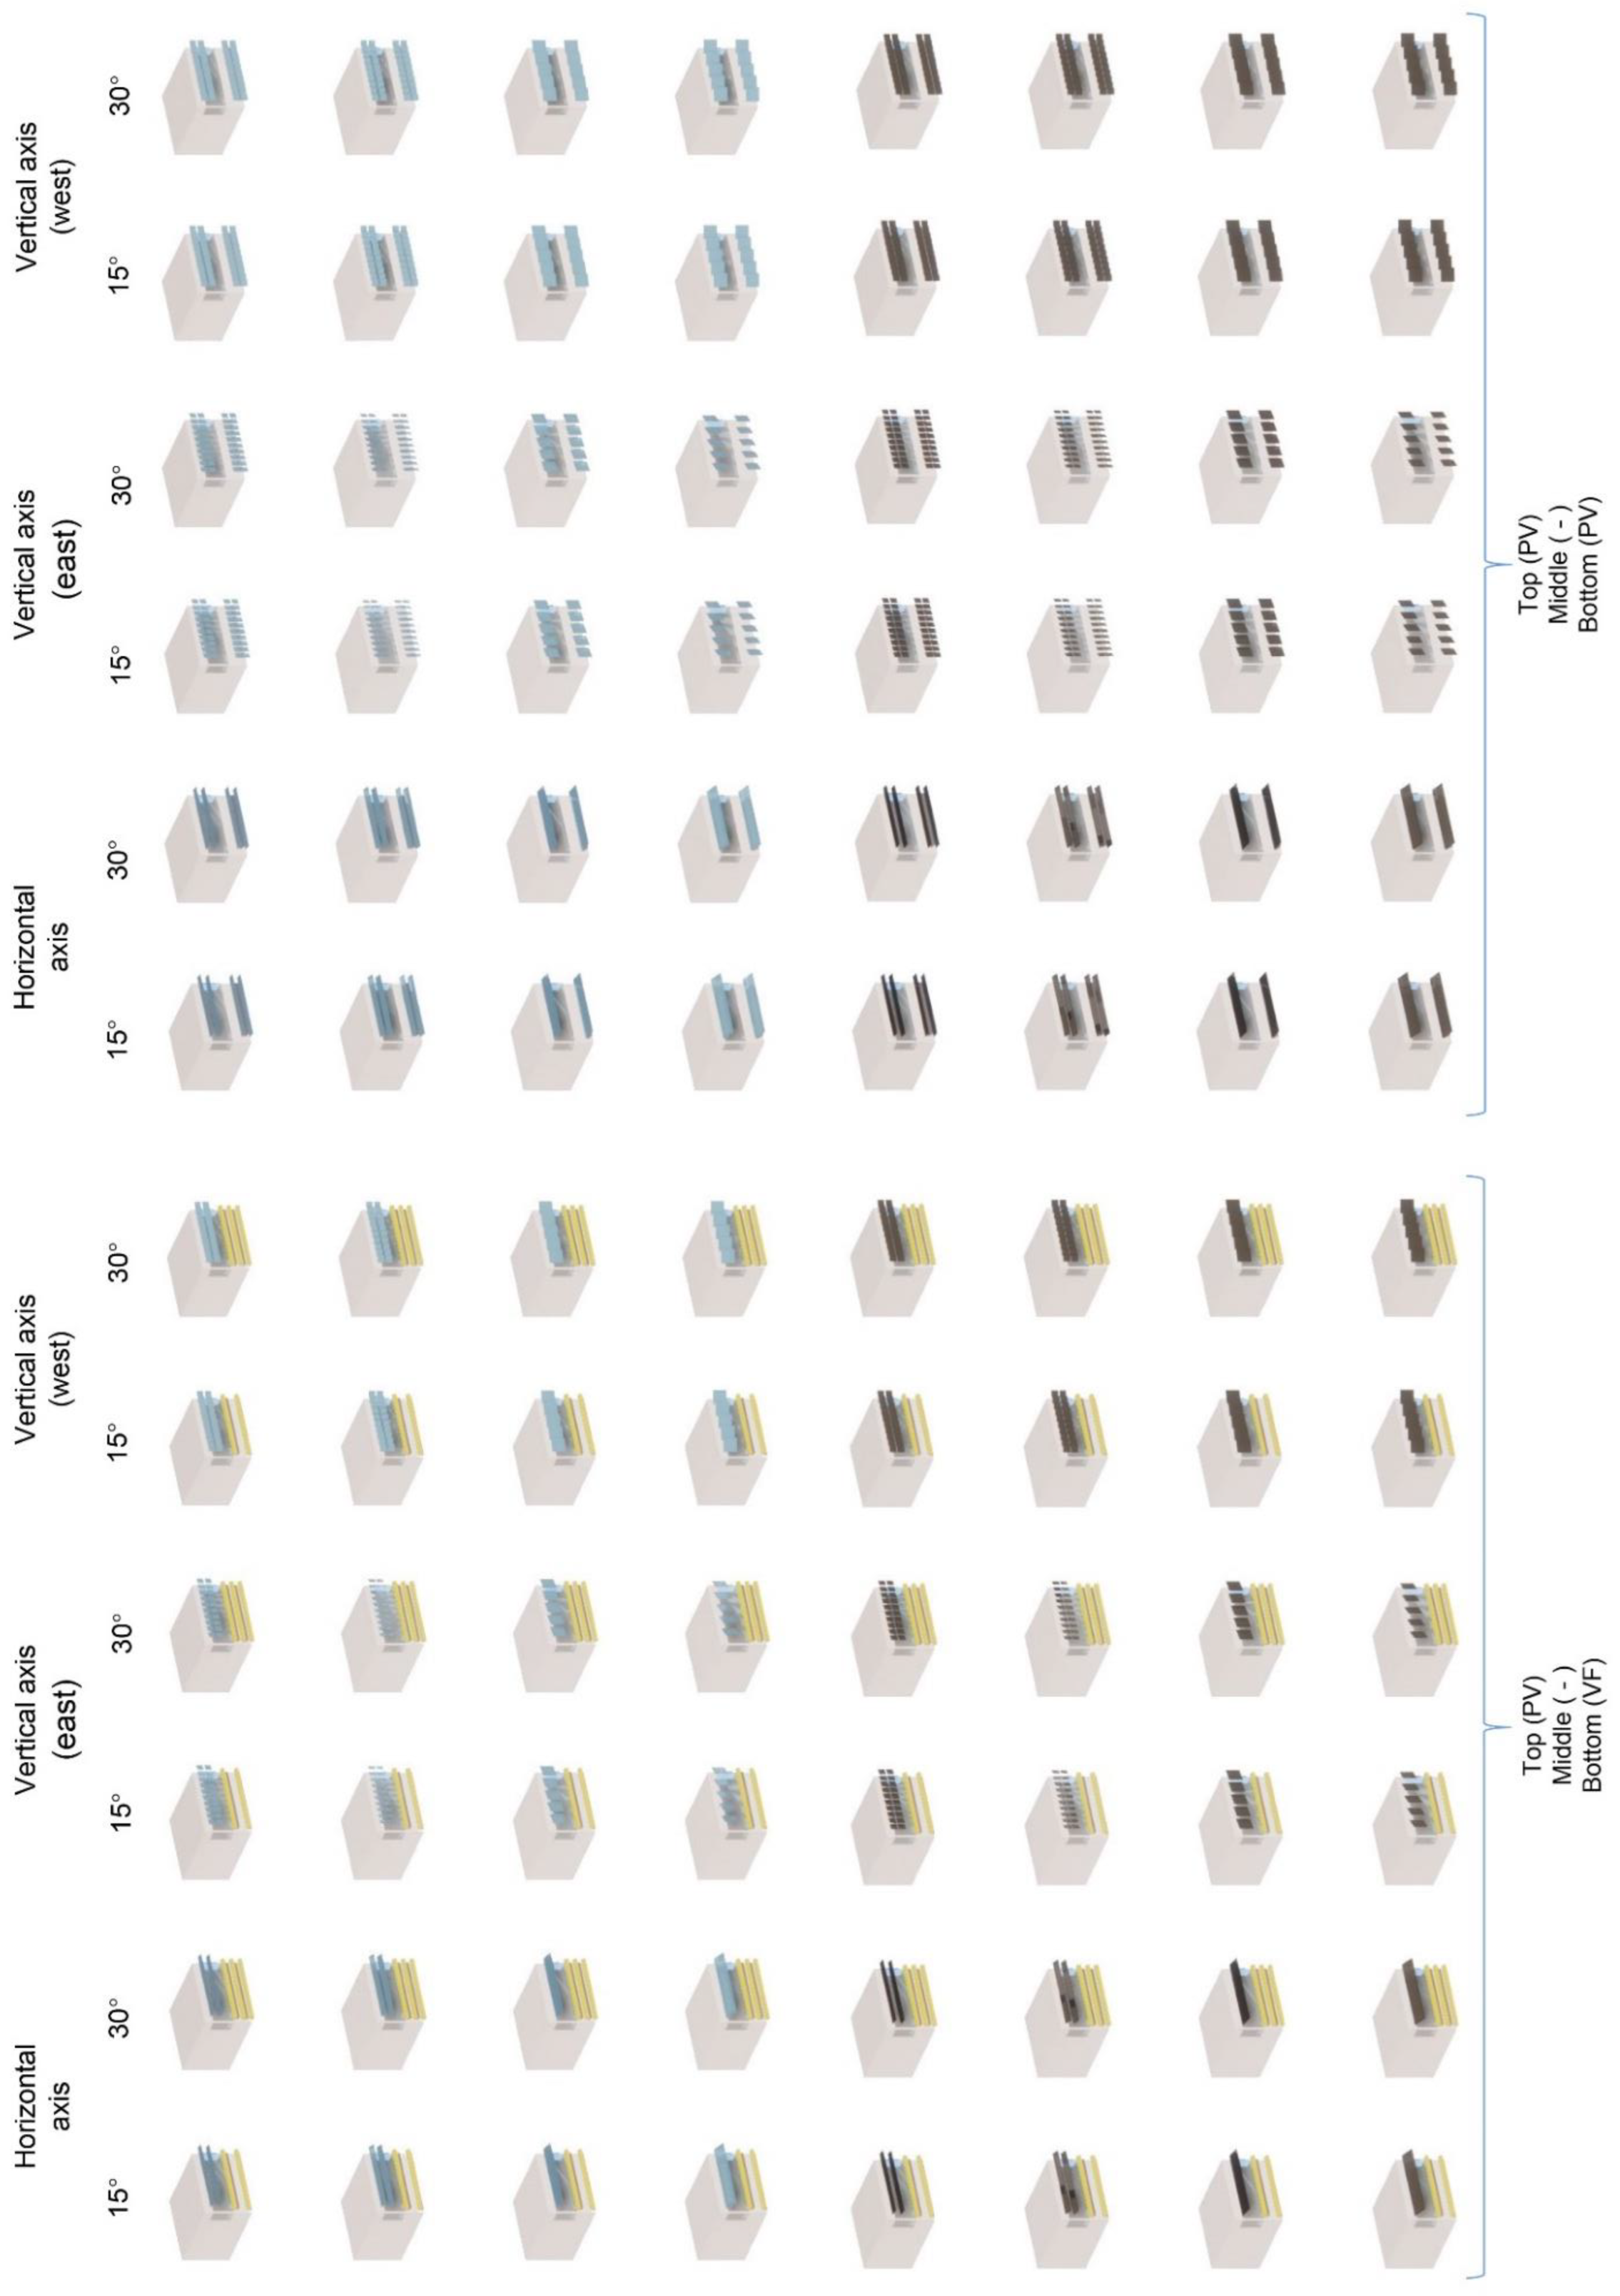
3.4. Design Prototype of the Façade Unit Integrating PVSD and VF

To integrate the advantages of PVSD and VF, the first step was to divide the vertical direction of a façade unit into three areas: upper, middle, and lower. Similar to the original building façade unit, the upper area was mainly for ventilation and daylighting, the middle area mainly provided indoor daylight and a good view, and the lower area was often ignored in the original building and was mostly used as a wall or bay window, which could be used for planting or PV. The PV shading system was suitable for the upper and middle areas, whereas the VF system was more suitable for the lower areas. As the planting system may involve drainage and irrigation facilities, it should be placed under the PV system to avoid adverse effects.
Overall, the initial partitioning possibilities for this prototype are shown in Figure 5 and are as follows: (1) upper, middle, lower (PVSD); (2) upper, middle (PVSD), lower (VF); (3) upper (PVSD), middle (none), lower (VF); and (4) upper (PVSD), middle (none), lower (PVSD).
The PVSD setting should maximize electricity generation while ensuring its shading function. The variable conditions of the PVSD components influence the balance between renewable energy collection and improved thermal performance. Appropriate variable settings can improve the energy performance of the components while enhancing visual comfort [67]. The PV shading system includes several design variables: the PV type, PV panel angle, PV panel size, PV panel layers, and PV panel arrangement. The commonly used PV types on the market are crystalline silicon PVs and thin film PVs, with the commonly used sizes of monocrystalline silicon being 156 mm, 166 mm, 182 mm, and 210 mm [69]. Therefore, a PV cell size of 0.2 m was selected as the module unit of the PV panel. Meanwhile, copper indium gallium diselenide (CIGS) thin-film cells have no size limitation and can be customized according to the size of monocrystalline silicon cells; therefore, the thin-film PV size was also set based on the size of crystalline silicon PVs.
Table 1 lists the various setting options for each PVSD parameter, encompassing all possible permutations of these settings as the prototype for this simulation. The size of the PV panel should be an even multiple of the PV cell size; thus the minimum PV panel size was set to 0.4 m × 0.4 m, and 0.8 m × 0.8 m was selected for comparison. Considering the operational space required for the two systems on the building façade, a distance of 0.5 m between the shading system and building envelope was reserved. Because tilted PV configurations generate 20–40% more electricity than flat vertical layouts [81], two tilt angles of 15° and 30° were selected for the PV panels. Depending on the size, the number of layers of the PV panel was selected as single or double, and only three arrangement methods (horizontal tilt, vertical eastward tilt, and vertical westward tilt) were selected. In summary, there were 24 variables for the PV shading system, including two cell types, two panel sizes (corresponding to specific numbers of PV panel layers), two tilt angles, and three arrangement methods.
The following variables must be considered in VF systems: planter size, plant rows, plant intervals, and plant type. The size of the planter must be determined based on the requirements of the crop and window size of the building. In this study, the planter section size was set at 0.2 m × 0.2 m to correspond to the module of the window size. The crop interval was 0.25 m, and the planter could be continuously set along the vertical surface and in multiple layers with a vertical distance of more than 400 mm to achieve maximum efficiency.
Leafy vegetables are often preferred for VF due to their shallow root systems and the fact that the entire plant is edible [10]. Factors such as water, temperature, light, and soil influence plant growth. Considering Guangzhou’s location in a subtropical region with a hot and humid climate, vegetable options are limited. Cabbage, lettuce, kale, and ipomoea aquatica are the most suitable vegetables for this climate zone [82].
Among all these factors, light plays the most critical role in the plant growth process. The growth of vegetables in the VF is also affected by the shading between buildings, resulting in a substantial reduction of the sunlight compared to conventional horizontal farming methods. Given these limitations, it is important to prioritize vegetables with relatively low-light demand for the façade module. Considering the high-light demand of cabbage and kale [10] and the spatial constraints of vertical farming, lettuce, a small shade-tolerant crop, was chosen as the most suitable option for this study.
Lettuce, a common leafy vegetable, is a shade-tolerant plant with low daily light integration (DLI) [11]. The minimum DLI requirement for lettuce growth was 8 mol m–2 d–1, corresponding to an illuminance level of 10,000 lx. The DLI is the total photosynthetic photon flux received by plants in a square meter of growing space per day [11], reflecting the combined effects of photoperiod duration and light intensity. Compared with other measurement methods, DLI is more accurate in determining the light conditions of plants. Lettuce production typically requires a DLI of 12–13 mol m–2 d–1 or higher for an optimal growth condition [83]; however it can still grow at a DLI as low as 4–10 [84]. Growth in the dry and fresh weights of lettuce was significantly correlated with changes in DLI, with a nearly linear change in weight growth when DLI varied between 6.9 and 15.6 mol m−2 d−1 [73].
VF systems are typically set up in the lower area of the vertical façade unit, with the windowsill height of residential buildings generally being 1.1 m. According to Tablada et al. [11], the minimum height difference between planting troughs should be 0.4 m, and multi-layered pots should have a trapezoidal cross-section, allowing lower crops to receive more sunlight and have more growing space. Two- and three-layer planting troughs were selected, and the three-layer planting troughs were required to sacrifice spacing. The spacing between two-layer planting troughs was set to 0.4 m, while that between three-layer planting troughs was set to 0.3 m for comparison. In summary, there are two variables in the VF system (planting trough size and crop type), and two levels of planting troughs were observed for each combination of these variables.
Based on a comprehensive analysis of the variable indicators of the PV shading and VF systems, the design prototype library of the unit components generated 146 design prototypes, including three categories of variables. A total of 24 types of PV shading systems were involved, including two types of batteries, two sizes of panels (corresponding to specific numbers of PV panel layers), two tilt angles, and three arrangements; and two types of VF systems (one type of planter size × one type of crop × two types of planter layers) and five types of vertical zoning methods. The specific combinations are shown in Figure 6.

3.5. Simulation Setup
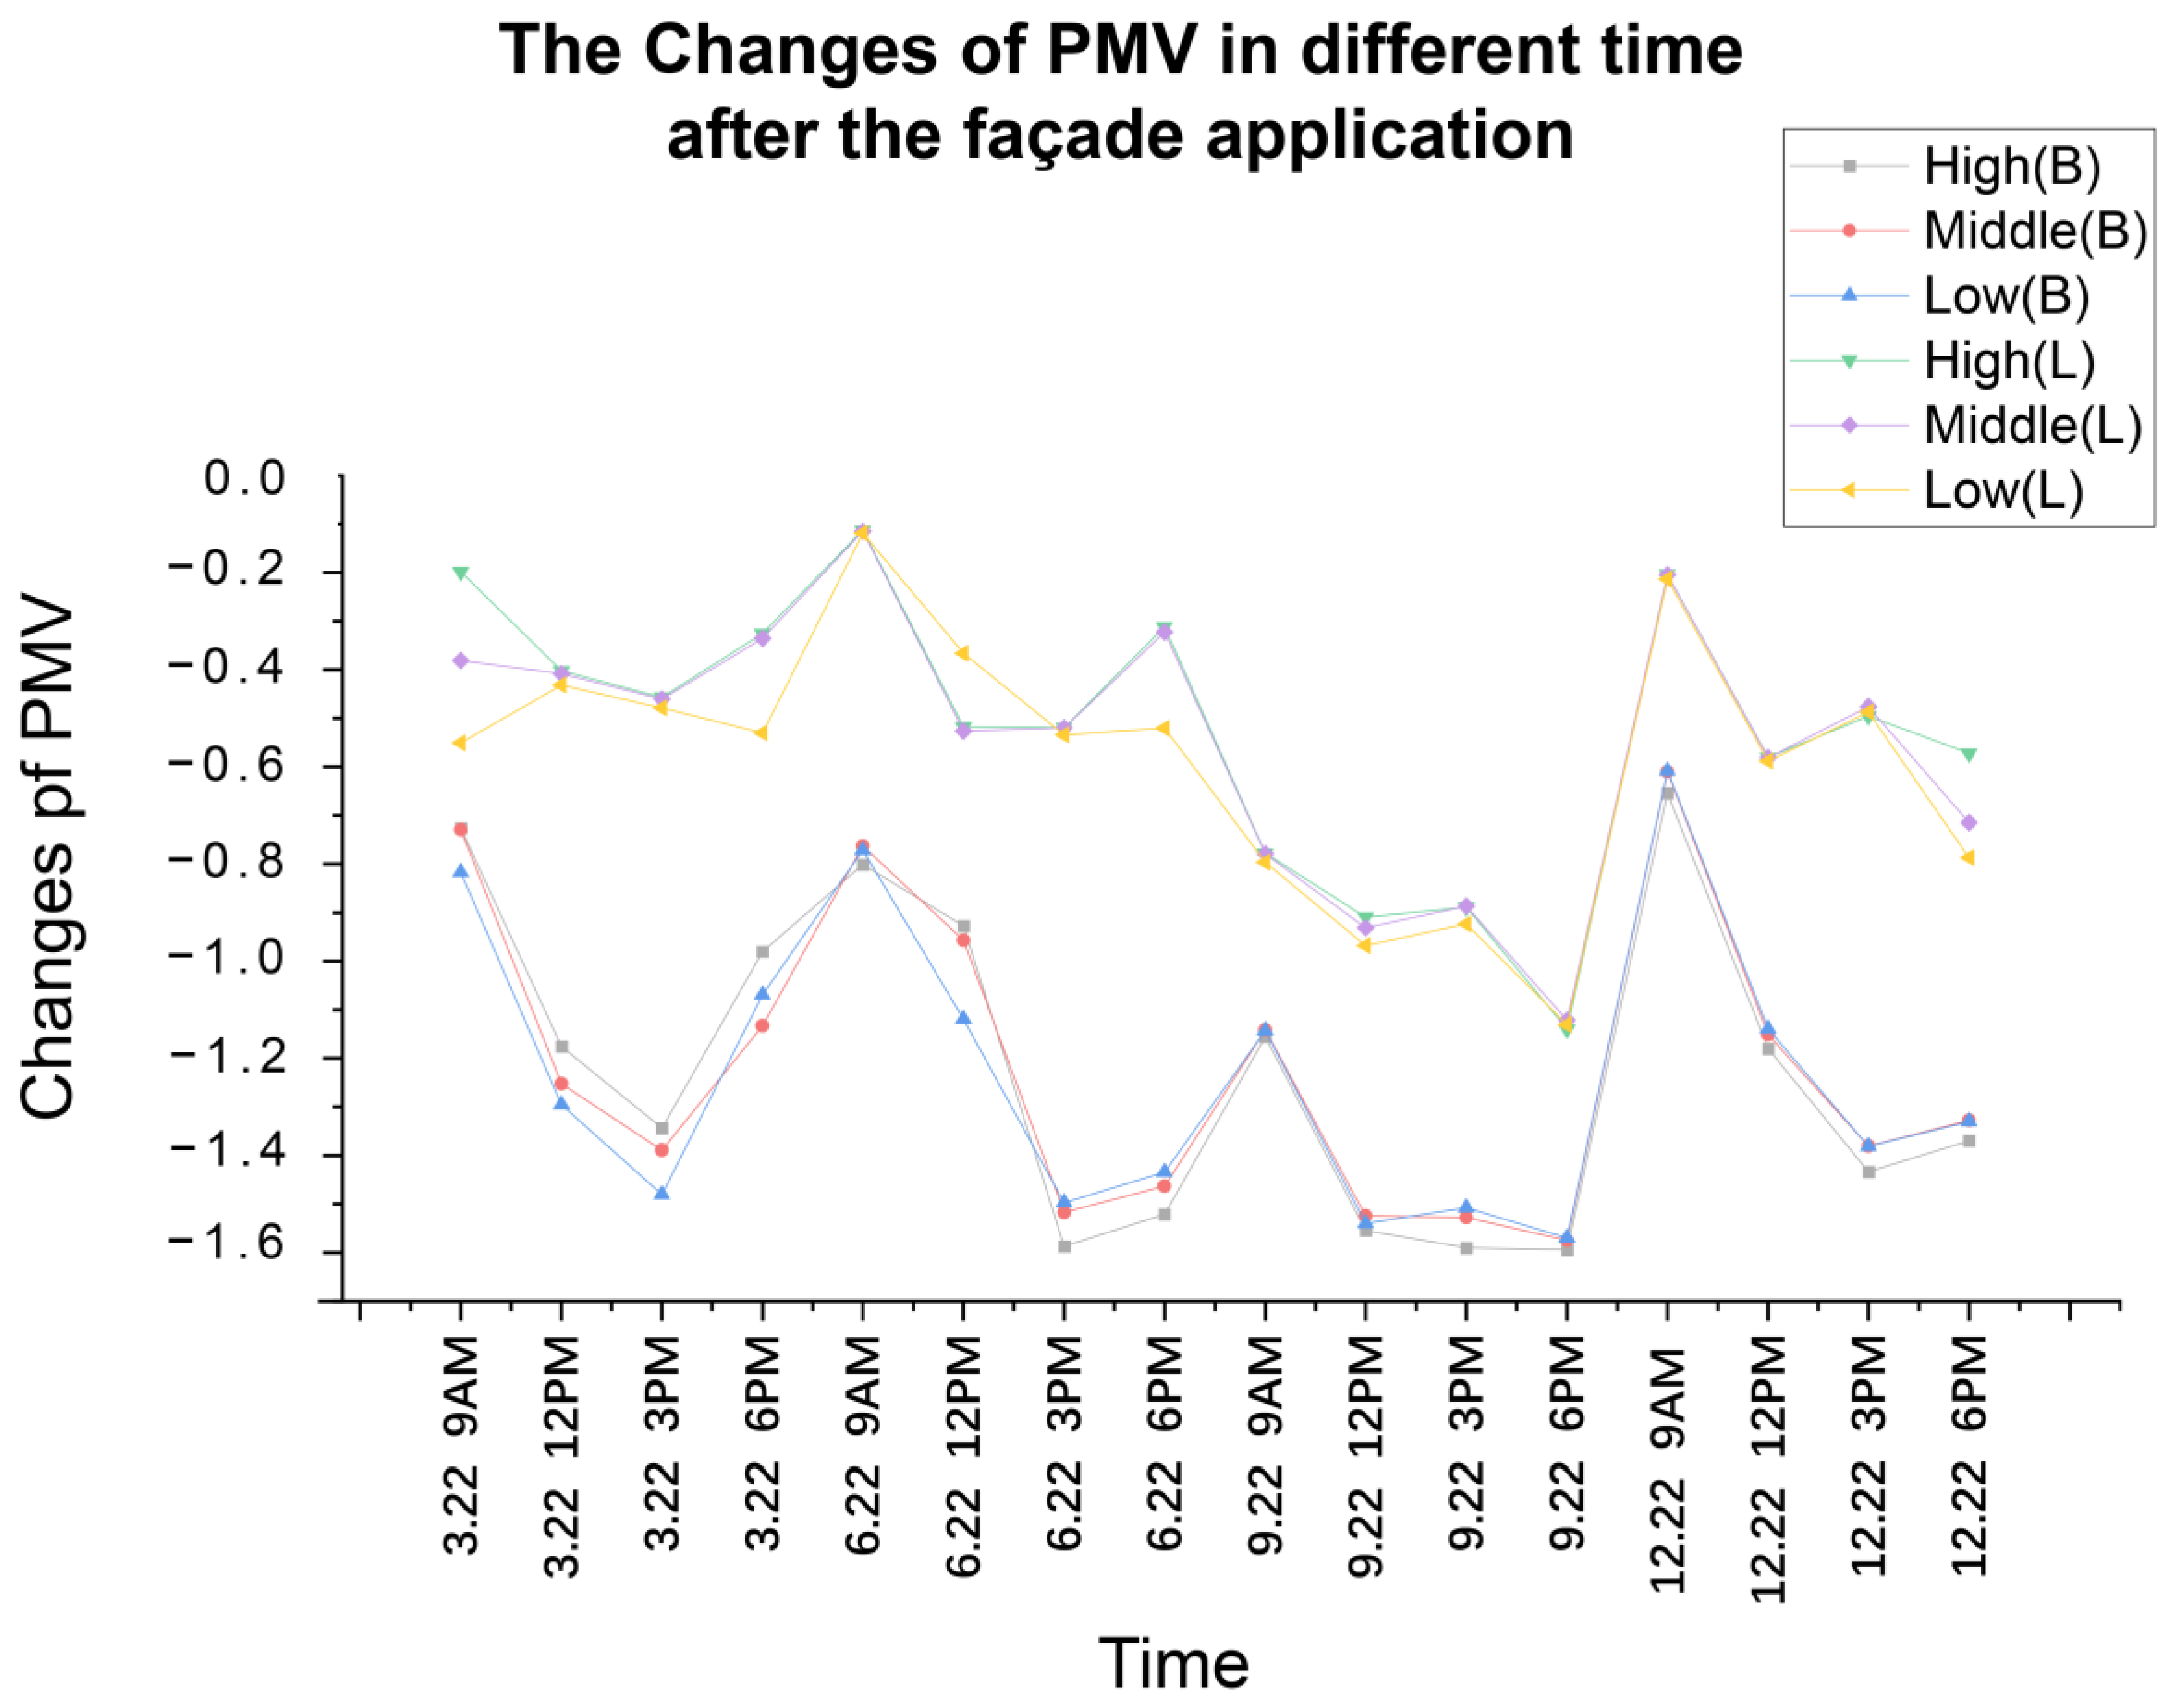
Combining the three-dimensional modeling software Rhinoceros with the parametric programming plug-in Grasshopper allows for the automatic combination and simulation of design variables for façade components. The Ladybug [74] and Honeybee can read weather data through Grasshopper and use building performance simulation software, such as Radiance, Daysim, Openstudio, and THERM, to process the data and obtain visualized information results. Table 2 summarizes the versions of all software and plug-ins used in the simulation. The Ladybug focuses on achieving a comprehensive environmental analysis on a parametric platform and establishing interactive graphics for weather data visualization, relying on EnergyPlus [76] (US Department of Energy), Radiance [77], and Daysim [75] for daylighting and energy modeling. The meteorological data used for the simulation were sourced from the website of epwmap.
A design mechanism was established by Rhinoceros and Grasshopper to integrate all possible prototypes comprising variables from the PVSD and VF with 146 generated design prototypes. The performance indicators were calculated for each component at 16 time points throughout the year. Four representative dates were selected for each season: 22 March, 22 June, 22 September, and 22 December, and four time points were selected for each date: 9:00 AM, 12:00 PM, 3:00 PM, and 6:00 PM. The simulations were conducted separately in the high, middle, and low zones, with 4608 simulations in each zone and two different functional spaces for 27,648 simulations.
After all the simulations in the first step were completed, the most effective prototypes selected by the multi-objective optimization method were applied to the overall façade of the community, and the entire community environment was simulated in the second step using ENVI-met to derive the changes in the distribution of the UTCI before and after the application of the façade components. For the second phase of the UTCI simulation, the choice to carry out the simulations in ENVI-met was mainly attributed to some minor differences in the mechanisms of action between the two; the Ladybug only estimates evapotranspiration based on plant albedo and green cover, whereas the ENVI-met simulation reproduces the mechanisms of plant interaction with the outdoor microclimate in detail [78]. Therefore, Morpho, a plug-in for Grasshopper that interfaces with ENVI-met, was used to design a simulation program to reduce errors arising from differences in software interoperability.
In the simulation, the glazing material used is single-layer transparent glass. The specific parameters for the properties of the different construction materials are listed in Table 3, while the parameters for the different transmissive and reflective materials are summarized in Table 4.

4. Results

After 27,648 simulations, a combined optimal prototype was selected for the high, medium, and low zones of each functional space group. Because the choice of whether to install PVs or grow crops in the lower area of each prototype needs to be set autonomously according to the needs of the households, indicating a 50/50 chance of choosing to install VFs and PVs in the lower area, the two best prototypes were selected for each area, and only the preliminary simulations were screened for each variable of PV.
The simulation results for the living room space showed that the prototypes with the best performance in the largest area were the (1) upper, middle, and lower (PVSD) and the (2) upper, middle (PVSD), and lower (VF). The best-performing prototypes in the medium-height region were the (4) upper (PVSD), middle (none), and lower (PVSD) and the (3) upper (PVSD), middle (none), and lower (VF). The best-performing prototypes in the lower region were (4) upper (PVSD), middle (none), and lower (PVSD), and (3) upper (PVSD), middle (none), and lower (VF). Referring to Table 5 for specific PV panel parameter settings, a crystalline silicon PV panel of size 0.8 m × 0.8 m performed best at an angle of 30° with the horizontal plane. The preferred PV yield was also lower in the lower zone than in the higher and middle zones because of poor lighting caused by inter-building shading.
The difference in PV power production in the high and medium zones came from the number of panels, the difference in the vertical position, and the possible shading effect from other buildings; the reason why the best prototype was the one consisting of three rows of PV panels in the high zone was probably that the significant impact of excess light on the indoor thermal environment needed to be balanced by shading while bringing about maximum power production.
The lowermost area of the low-zone façade was unsuitable for installing PV panels, as the shading of this area blocked the PV panels, resulting in a dramatic decrease in power compared with the middle zone. However, the lettuce yield in the low zone was higher than that in the middle zone, which was attributed to because the fact that the middle area of the vertical partition in the middle zone was not equipped with shading panels, resulting in excess light. In contrast, although the high zone had more light, the shading of the PV panels blocked excess light and ensured the expected yield of growth.
The simulation results for the bedroom space showed that the best-performing prototypes in the three zones were almost identical to those in the living room space, with the high-performance layout being (1) and (2). The best-performing prototypes in the medium-height zone were (4) and (3). The prototypes with the best performance in the low zones were (4) and (3). In Table 6, the best performing PV panels on the south-facing façade, regardless of height zone, were 0.8 m × 0.8 m crystalline PVs (with a 30° angle), and the factors influencing the combined best performance of PVSDs did not correlate well with spatial depth.
Table 7 lists the DLI for each region in the four seasons and their corresponding annual lettuce production (the relationship between lettuce calculations and DLI was described in the methodology section). Data from the National Bureau of Statistics of China [85] showed that the per capita vegetable consumption in China in 2021 was 109.8 kg; this can be used as a basis to derive the annual lettuce production in different height zones as a proportion of the yearly vegetable consumption of the Chinese people, varying from 7.61% to 9.6%.
Figure 7 shows the variation in PV production in the three zones throughout the seasons and at different times of the day. Figure 8 presents the annual electricity production of all the screened modules. Approximately 6–10.3% of the annual electricity demands were satisfied. Generally, 12 PM produced the best output, with little difference between the four seasons. The higher the height zone, the higher the PV output. The living room had a significantly higher output of modules on the façade than the bedroom, mainly because of the width of the façade opening, thus allowing for more panels to be installed.
For the indoor light environment, Figure 9 shows that the percentage of the indoor UDI 100–2000 lux area in rooms with façade components did not differ significantly from rooms without façade components. Although there was a slight decrease, the overall natural light quality remained high, and the values met the standards required by local regulations. The illuminance heat distribution diagram in Figure 10 shows that the glaring percentage in rooms with façade components was significantly lower. The light comfort zone was above 50% in all cases, and the glare percentage was below 5%, except for a few high-zone cases. From Figure 10, the sunlight is more abundant in summer and winter, with more than 50% and 100% visual discomfort separately in summer and winter. The light is most harsh at 3 PM in winter and summer, and this situation moderated as the height decreased. Conversely, light levels in spring and autumn remain lower overall.
Regarding the thermal environment, a significant improvement was observed in the thermal comfort of the interior with the best façade components, whose PMV values showed an overall decreasing trend, as shown in Figure 11. The difference in PMV variation between bedrooms and living rooms may stem from the difference in exposure to shading. Balconies have more heated surfaces, which tend to create a bitter environment, and shading improves their thermal environment to a greater extent.
Regarding the second stage of the simulation process, as the results of the first step showed a low light demand for lettuce, VF was applied to both the northern and southern sides of the building for the overall simulation to make an observable change in the results before and after the application. However, the results in Figure 12 showed that the UTCI values before and after the application of the façade component only produced a change of 0.6 °C at the hottest moment (22 September, 12 p.m.), which was presumed to be due to the choice of using lettuce as the crop, which is not very tall, and the possible transpiration effect on the outdoor thermal environment was insignificant.

5. Discussion

Regarding the results, the change in the PMV of the living room module was less significant than expected, presumably because of its inherently larger heating area. The community micro-environment showed relatively weak temperature changes of 0.6 °C, probably due to the small size of lettuce plants and small amount of façade planting, whose application to the façade produced relatively weak transpiration compared to the amount produced by the trees and entire green wall. The overall VF coverage of the community façade in the simulated setting was 13.3%, and a façade greenery coverage of 50% may have significantly affected the outdoor microenvironment of the community. The fact that Guangzhou is located in a subtropical region with hot climatic and environmental conditions throughout the year may have also led to insignificant thermal changes.
This paper attempted many research ideas and optimization strategies, as few people have integrated indoor and outdoor conditions in their research; the workload on data screening and processing is also a huge challenge, with a substantial computational volume. Our findings confirm the application value of this adaptive façade to a certain extent but is limited by the current research stage. From an energy consumption perspective, the peak hours of electricity generation from PV systems occur during the daytime, whereas residential dwellers typically experience peak electricity consumption in the evening. In future studies, it is important to consider the incorporation of energy storage systems and demand response procedures to address the staggered energy supply and demand peaks [86]. The integration of energy management and demand response in community buildings with PV systems and energy storage is crucial to reduce energy consumption and mitigate the effects of urban climate change.
Further studies on energy management, demand response, and practical application are required. In our subsequent research, we plan to investigate how to improve the residence acceptance and solve some address problems on structural safety and the mismatch between energy supply and demand.

6. Conclusions

This study developed an optimization method for productive façade units for integrated PV and agricultural systems, considering indoor and outdoor environments. First, a façade model library involving 146 samples was built by combining various design parameters of PVSD and VF. Based on the simulation program, the façade performance indicators (PMV, UDI, P, and crop yield) were calculated for each prototype. Design prototypes with the best performance for different heights and functional spaces (bedrooms and living rooms) were selected. Second, the outdoor microenvironment for the community was simulated based on previously selected prototypes, and improvement in the community microenvironment was evaluated by applying the façade, as demonstrated by the simulation results (UTCI). Then, a multi-factor collaborative design mechanism was constructed to provide indoor–outdoor residential comfort. Lastly, a distributed optimization method was used to complete the quantitative analysis, performance simulation, resource output calculation, and design selection process for the adaptive façade design.
Using productive façades that integrate PV shading and VF systems in the façade renovation of residential buildings can effectively improve the indoor lighting and thermal comfort of living spaces while providing daily vegetable and energy supplies, meeting 6.3–10.3% and 7.6–9.6% of the annual electricity and vegetable demands, respectively, in residential communities. Furthermore, the comfort of the outside thermal environment was improved. We demonstrated the feasibility of improving the quality of residence and the potential to reduce the carbon footprint by reducing food transportation. This study contributes to addressing the challenges of indoor comfort, urban heat islands, and energy shortages in residential buildings in dense cities with subtropical climates.

Author Contributions

Conceptualization, Y.W., X.S. and X.Z.; methodology, Y.W.; software, Y.W. and B.X.; validation, Y.Z. and X.Z.; formal analysis, Y.Z.; data curation, Y.W. and B.X.; writing—original draft preparation, Y.W., X.Z., H.Z. and B.X.; writing—review and editing, Y.W., X.Z., H.Z. and X.S.; visualization, Y.W. and H.Z.; project administration, X.S. All authors have read and agreed to the published version of the manuscript.

Funding

This research received no external funding.

Data Availability Statement

Not applicable.

Conflicts of Interest

The authors declare no conflict of interest.

Appendix A

The algorithm generation steps of Formula (1) are as follows:
1.
Defining an ideal point, f ° ∈Zk, is an ideal point of criteria functions, if f for each i = 1, 2, 3…, k, f i °   = min X f i x | x X .
In general, f ° is unattainable; however, it is possible to obtain close to an optimal solution [87] using the minimum Euclidean distance F x :
F x = f x f ° = 1 k f i x f i °   2 1 2
where F x represents the value closest to the Pareto optimum of the criteria function. However, this Formula (A1) cannot represent the closeness when each objective functions have different units.
2.
Each function will be transformed into non-dimensional functions through the following formula:
f i t r a n s x = f i x f i ° f i °
3.
Concerning the weights of the different objective functions, the relative values of the weights respond to differences in the importance of the different objectives and the preferences in the decision [88]. Selecting a particular solution strategy from the optimal set is allowed, and this approach incorporates a posteriori expression of preferences [87]. The three functions selected here are for the indoor thermal environment, indoor light environment, and PV power production, and the three indicators are considered to have equal weights in terms of the ultimate goal of the design strategy.
4.
The setting of the VF is located in the lowermost area of the module and has no obscuring effect on the indoor lighting. Its corresponding indicator is considered to have no verified correlation with the indoor environmental state in the first step and is not included in the design of the optimization function in the first step.
5.
From the derivation of the previous two Equations (A1) and (A2), the combined optimal solution resulting from the three indicators (P, UDI, PMV) in the first optimization step is calculated as follows:
O best = Min P i P max P max 2 + UDI i UDI max UDI max 2 + PMV i PMV max PMV max 2
  • UDI = average effective natural daylight illuminance (UDI 200–3000 lx).
  • PMV = predicted mean indoor polling value.
  • PMV0 = PMV value of 0 when the indoor thermal environment is moderate (note: for calculation feasibility, all PMV values were based on the original + 1).
  • P = output power of the adaptive façade dynamic PV shading system.

References

  1. IEA. World Energy Outlook 2013; International Energy Agency: Paris, France, 2013. [CrossRef]
  2. Zhang, X.; Wang, Y. How to reduce household carbon emissions: A review of experience and policy design considerations. Energy Policy 2017, 102, 116–124. [Google Scholar] [CrossRef]
  3. Global Buildings Performance Network. China: The World’s Largest Single Market in New Construction. Available online: https://www.gbpn.org/activities/china/ (accessed on 8 May 2023).
  4. Huo, T.; Cai, W.; Ren, H.; Feng, W.; Zhu, M.; Lang, N.; Gao, J. China’s building stock estimation and energy intensity analysis. J. Clean. Prod. 2019, 207, 801–813. [Google Scholar] [CrossRef]
  5. THUBERC Annual Report on China Building Energy Efficiency; China Architecture & Building Press: Beijing, China, 2018.
  6. Zhou, W.; Moncaster, A.; O’Neill, E.; Reiner, D.M.; Wang, X.; Guthrie, P. Modelling future trends of annual embodied energy of urban residential building stock in China. Energy Policy 2022, 165, 112932. [Google Scholar] [CrossRef]
  7. IEA. World Energy Outlook. 2022. Available online: https://www.iea.org/reports/world-energy-outlook-2022 (accessed on 8 May 2023).
  8. Coma, J.; Pérez, G.; Solé, C.; Castell, A.; Cabeza, L.F. New green facades as passive systems for energy savings on buildings. Energy Procedia 2014, 57, 1851–1859. [Google Scholar] [CrossRef] [Green Version]
  9. Wang, J.; Shi, D.; Song, Y. Advanced Materials in Smart Building Skins for Sustainability: From Nano to Macroscale; Springer Nature: Berlin, Germany, 2022. [Google Scholar]
  10. Tablada, A.; Kosorić, V.; Huang, H.; Chaplin, I.K.; Lau, S.-K.; Yuan, C.; Lau, S.S.-Y. Design optimization of productive façades: Integrating photovoltaic and farming systems at the tropical technologies laboratory. Sustainability 2018, 10, 3762. [Google Scholar] [CrossRef] [Green Version]
  11. Tablada, A.; Chaplin, I.; Huang, H.; Kosoric, V.; Lau, S.K.; Yuan, C.; Lau, S. Assessment of solar and farming systems integration on tropical building facades. In Proceedings of the SWC 2017, ISES Solar World Conference 2017 and the IEA SHC Solar Heating and Cooling Conference for Buildings and Industry, Abu Dhabi, United Arab Emirates, 29 October–2 November 2017; International Solar Energy Society: Abu Dhabi, United Arab Emirates, 2017; pp. 1–11. [Google Scholar] [CrossRef]
  12. Kulak, M.; Graves, A.; Chatterton, J. Reducing greenhouse gas emissions with urban agriculture: A Life Cycle Assessment perspective. Landsc. Urban Plan. 2013, 111, 68–78. [Google Scholar] [CrossRef]
  13. Liu, Z.; Deng, Z.; He, G.; Wang, H.; Zhang, X.; Lin, J.; Qi, Y.; Liang, X.; Liang, X. Challenges and opportunities for carbon neutrality in China. Nat. Rev. Earth Environ. 2022, 3, 141–155. [Google Scholar] [CrossRef]
  14. Zhao, X.; Ma, X.; Chen, B.; Shang, Y.; Song, M. Challenges toward carbon neutrality in China: Strategies and countermeasures. Resour. Conserv. Recycl. 2022, 176, 105959. [Google Scholar] [CrossRef]
  15. Long, Z.; Li, H.; Bu, X.; Ma, W.; Zhao, L. Solar radiation on vertical surfaces for building application in different climate zones across China. J. Renew. Sustain. Energy 2013, 5, 021418. [Google Scholar] [CrossRef]
  16. Liu, A.; Chen, W.; Qin, P. Analysis and evaluation of solar energy resources in Guangzhou. Guangdong Meteorol. 2014, 36, 59–61. [Google Scholar] [CrossRef]
  17. Pan, D.; Bai, Y.; Chang, M.; Wang, X.; Wang, W. The technical and economic potential of urban rooftop photovoltaic systems for power generation in Guangzhou, China. Energy Build. 2022, 277, 112591. [Google Scholar] [CrossRef]
  18. Liu, C.; Xu, W.; Li, A.; Sun, D.; Huo, H. Analysis and optimization of load matching in photovoltaic systems for zero energy buildings in different climate zones of China. J. Clean. Prod. 2019, 238, 117914. [Google Scholar] [CrossRef]
  19. Wu, J. The Study of Urban Residential Thermal Environment Multi-Objective Optimization Design Base on Parametric Method. Ph.D. Thesis, South China University of Technology, Guangzhou, China, 2017. [Google Scholar]
  20. Zhang, J.; Cui, P.; Song, H. Impact of urban morphology on outdoor air temperature and microclimate optimization strategy base on pareto optimality in northeast China. Build. Environ. 2020, 180, 107035. [Google Scholar] [CrossRef]
  21. Ying, X.; Qin, X.; Shen, L.; Yu, C.; Zhang, J. An intelligent planning method to optimize high-density residential layouts considering the influence of wind environments. Heliyon 2023, 9, e13051. [Google Scholar] [CrossRef] [PubMed]
  22. Guo, X.; Wei, H.; He, X.; He, M.; Yang, D. Integrating phase change material in building envelopes combined with the Earth-to-air heat exchanger for indoor thermal environment regulation. Build. Environ. 2022, 221, 109318. [Google Scholar] [CrossRef]
  23. Shaviv, E.; Yezioro, A.; Capeluto, I.G. Thermal mass and night ventilation as passive cooling design strategy. Renew. Energy 2001, 24, 445–452. [Google Scholar] [CrossRef]
  24. Chinnaiyan, V.K.; Patil, C.K.; Patil, M.M.; Baviskar, P.R.; Karthick, A.; Selvakumar, P.; Rajkumar, S. Review on application of phase change material for BIPV system. Mater. Today Proc. 2022, 59, 1243–1248. [Google Scholar] [CrossRef]
  25. Wang, Y.; Ni, Z.; Hu, M.; Chen, S.; Xia, B. A practical approach of urban green infrastructure planning to mitigate urban overheating: A case study of Guangzhou. J. Clean. Prod. 2021, 287, 124995. [Google Scholar] [CrossRef]
  26. Dardir, M.; Berardi, U. Development of microclimate modeling for enhancing neighborhood thermal performance through urban greenery cover. Energy Build. 2021, 252, 111428. [Google Scholar] [CrossRef]
  27. He, Y.; Lin, E.S.; Zhang, W.; Tan, C.L.; Tan, P.Y.; Wong, N.H. Local microclimate above shrub and grass in tropical city: A case study in Singapore. Urban Clim. 2022, 43, 101142. [Google Scholar] [CrossRef]
  28. Italos, C.; Patsias, M.; Yiangou, A.; Stavrinou, S.; Vassiliades, C. Use of double skin façade with building integrated solar systems for an energy renovation of an existing building in Limassol, Cyprus: Energy performance analysis. Energy Rep. 2022, 8, 15144–15161. [Google Scholar] [CrossRef]
  29. Shah, I.; Soh, B.; Lim, C.; Lau, S.-K.; Ghahramani, A. Thermal transfer and temperature reductions from shading systems on opaque facades: Quantifying the impacts of influential factors. Energy Build. 2023, 278, 112604. [Google Scholar] [CrossRef]
  30. Bakhshoodeh, R.; Ocampo, C.; Oldham, C. Exploring the evapotranspirative cooling effect of a green façade. Sustain. Cities Soc. 2022, 81, 103822. [Google Scholar] [CrossRef]
  31. Zhang, Y.; Yang, Y.; Zhang, L.; Zhao, C.; Yan, J.; Liu, M.; Zhao, L. Seasonal variation in leaf area index and its impact on the shading effects of vertical green facades in subtropical areas. Build. Environ. 2022, 225, 109629. [Google Scholar] [CrossRef]
  32. Hoelscher, M.T.; Nehls, T.; Jänicke, B.; Wessolek, G. Quantifying cooling effects of facade greening: Shading, transpiration and insulation. Energy Build. 2016, 114, 283–290. [Google Scholar] [CrossRef]
  33. Jacobson, M.Z.; Delucchi, M.A.; Bauer, Z.A.F.; Goodman, S.C.; Chapman, W.E.; Cameron, M.A.; Bozonnat, C.; Chobadi, L.; Clonts, H.A.; Enevoldsen, P.; et al. 100% clean and renewable wind, water, and sunlight all-sector energy roadmaps for 139 countries of the world. Joule 2017, 1, 108–121. [Google Scholar] [CrossRef] [Green Version]
  34. Taveres-Cachat, E.; Grynning, S.; Thomsen, J.; Selkowitz, S. Responsive building envelope concepts in zero emission neighborhoods and Smart Cities—A Roadmap to Implementation. Build. Environ. 2019, 149, 446–457. [Google Scholar] [CrossRef]
  35. Taşer, A.; Koyunbaba, B.K.; Kazanasmaz, T. Thermal, daylight, and energy potential of building-integrated photovoltaic (BIPV) systems: A comprehensive review of effects and developments. Sol. Energy 2023, 251, 171–196. [Google Scholar] [CrossRef]
  36. Xu, S.; Huang, Z.; Wang, J.; Mendis, T.; Huang, J. Evaluation of photovoltaic potential by urban block typology: A case study of wuhan, China. Renew. Energy Focus 2019, 29, 141–147. [Google Scholar] [CrossRef]
  37. Luther, J.; Reindl, T.; Wang, D.K.S.; Aberle, A.; Walsh, W.; Nobre, A.; Yao, G.G. Solar Photovoltaic (PV) Roadmap for Singapore (A Summary); Solar Energy Research Institute of Singapore (SERIS): Singapore, 2013. [Google Scholar]
  38. Ding, Y.; Wang, Y.; Su, H.; Wang, J.J. Analysis on the influence of building vertical greening to the outdoor thermal environment. Guangzhou Univ. (Nat. Sci. Ed.) 2015, 14, 53–57. [Google Scholar]
  39. Chen, Z. Research of Vegetation System’s Effects on Outdoor Thermal Environment of Residential Communities in Hot-Humid Climate. Ph.D. Thesis, South China University of Technology, Guangzhou, China, 2010. [Google Scholar]
  40. Wang, Y.; Ni, Z.; Peng, Y.; Xia, B. Local variation of outdoor thermal comfort in different urban green spaces in Guangzhou, a subtropical city in South China. Urban For. Urban Green. 2018, 32, 99–112. [Google Scholar] [CrossRef]
  41. Afrin, S. Green Skyscraper: Integration of Plants into Skyscrapers. Master’s Thesis, Kungliga Tekniska Högskolan (KTH), Stockholm, Sweden, 2009. Available online: https://www.diva-portal.org/smash/get/diva2:353678/fulltext01 (accessed on 15 January 2009).
  42. Despommier, D. Farming up the city: The rise of urban vertical farms. Trends Biotechnol. 2013, 31, 388–389. [Google Scholar] [CrossRef] [PubMed]
  43. Tablada, A.; Kosorić, V. Vertical Farming on Facades: Transforming Building Skins for Urban Food Security. In Rethinking Building Skins; Elsevier: Amsterdam, The Netherlands, 2022; pp. 285–311. ISBN 978-0-12-822477-9. [Google Scholar]
  44. Draper, C.; Freedman, D. Review and analysis of the benefits, purposes, and motivations associated with community gardening in the United States. J. Community Pract. 2010, 18, 458–492. [Google Scholar] [CrossRef]
  45. Perini, K.; Ottelé, M.; Fraaij, A.L.A.; Haas, E.M.; Raiteri, R. Vertical Greening Systems and the Effect on Air Flow and Temperature on the Building Envelope. Build. Environ. 2011, 46, 2287–2294. [Google Scholar] [CrossRef]
  46. Yuan, C.; Shan, R.; Adelia, A.S.; Tablada, A.; Lau, S.K.; Lau, S.S.-Y. Effects of vertical farming on natural ventilation of residential buildings. Energy Build. 2019, 185, 316–325. [Google Scholar] [CrossRef]
  47. Zhang, X.; Lau, S.; Lau, S.S.Y.; Zhao, Y. Photovoltaic integrated shading devices (PVSDs): A review. Sol. Energy 2018, 170, 947–968. [Google Scholar] [CrossRef]
  48. Aristizabal, A.; Paez, C.; Ospina, D. Building-Integrated Photovoltaic Systems (BIPVS). Performance and Modeling under Outdoor Conditions; Springer: Berlin, Germany, 2018. [Google Scholar]
  49. Assoa, Y.B.; Mongibello, L.; Carr, A.; Kubicek, B.; Machado, M.; Merten, J.; Misara, S.; Roca, F.; Sprenger, W.; Wagner, M.; et al. Thermal analysis of a BIPV system by various modelling approaches. Sol. Energy 2017, 155, 1289–1299. [Google Scholar] [CrossRef] [Green Version]
  50. Bodart, M.; De Herde, A. Global energy savings in offices buildings by the use of daylighting. Energy Build. 2002, 34, 421–429. [Google Scholar] [CrossRef]
  51. Lam, J.C.; Li, D.H.W. An analysis of daylighting and solar heat for cooling-dominated office buildings. Sol. Energy 1999, 65, 251–262. [Google Scholar] [CrossRef]
  52. Paul, D.; Mandal, S.N.; Mukherjee, D.; Bhadra Chaudhuri, S.R. Optimization of significant insolation distribution parameters—A new approach towards BIPV system design. Renew. Energy 2010, 35, 2182–2191. [Google Scholar] [CrossRef]
  53. Bahr, W. A comprehensive assessment methodology of the building integrated photovoltaic blind system. Energy Build. 2014, 82, 703–708. [Google Scholar] [CrossRef]
  54. Weller, B.; Hemmerle, C.; Jakubetz, S.; Unnewehr, S. Detail Practice: Photovoltaics; Birkhäuser: Basel, Switzerland, 2010. [Google Scholar] [CrossRef]
  55. Zhang, W.; Lu, L.; Peng, J. Evaluation of potential benefits of solar photovoltaic shadings in Hong Kong. Energy 2017, 137, 1152–1158. [Google Scholar] [CrossRef]
  56. Kim, S.-H.; Kim, I.; Choi, A.; Sung, M. Evaluation of optimized PV power generation and electrical lighting energy savings from the PV blind-integrated daylight responsive dimming system using LED lighting. Sol. Energy 2014, 107, 746–757. [Google Scholar] [CrossRef]
  57. Akbari Paydar, M.A. Optimum design of building integrated PV module as a movable shading device. Sustain. Cities Soc. 2020, 62, 102368. [Google Scholar] [CrossRef]
  58. Shi, S.; Sun, J.; Liu, M.; Chen, X.; Gao, W.; Song, Y. Energy-saving potential comparison of different photovoltaic integrated shading devices (PVSDs) for single-story and multi-story buildings. Energies 2022, 15, 9196. [Google Scholar] [CrossRef]
  59. Radziemska, E. The Effect of Temperature on the Power Drop in Crystalline Silicon Solar Cells. Renew. Energy 2003, 28, 1–12. [Google Scholar] [CrossRef]
  60. El Gindi, S.E.; Abdin, A.R.; Hassan, A. Building integrated Photovoltaic Retrofitting in office buildings. Energy Procedia 2017, 115, 239–252. [Google Scholar] [CrossRef]
  61. Elibol, E.; Özmen, Ö.T.; Tutkun, N.; Köysal, O. Outdoor performance analysis of different PV panel types. Renew. Sustain. Energy Rev. 2017, 67, 651–661. [Google Scholar] [CrossRef]
  62. Umehara, M.; Takeda, Y.; Motohiro, T.; Sakai, T.; Awano, H.; Maekawa, R. Cu2Sn1−xGexS3 (x = 0.17) Thin-Film Solar Cells with High Conversion Efficiency of 6.0%. Appl. Phys. Express 2013, 6, 045501. [Google Scholar] [CrossRef]
  63. Zaitsev, R.V.; Kirichenko, M.; Khrypunov, G.; Radoguz, S.; Khrypunov, M.; Prokopenko, D.; Zaitseva, L. Operating Temperature Effect on the Thin Film Solar Cell Efficiency. J. Nano Electron. Phys. 2019, 11, 04029. [Google Scholar] [CrossRef]
  64. Defaix, P.R.; van Sark, W.G.J.H.M.; Worrell, E.; de Visser, E. Technical potential for photovoltaics on buildings in the EU-27. Sol. Energy 2012, 86, 2644–2653. [Google Scholar] [CrossRef] [Green Version]
  65. Singh, D.; Chaudhary, R.; Karthick, A. Review on the progress of building-applied/integrated photovoltaic system. Environ. Sci. Pollut. Res. Int. 2021, 28, 47689–47724. [Google Scholar] [CrossRef] [PubMed]
  66. Hong, T.; Jeong, K.; Koo, C.; Kim, J.; Lee, M. A preliminary study for determining photovoltaic panel for a smart photovoltaic blind considering usability and constructability issues. Energy Procedia 2016, 88, 363–367. [Google Scholar] [CrossRef] [Green Version]
  67. Jeong, K.; Hong, T.; Koo, C.; Oh, J.; Lee, M.; Kim, J. A prototype design and development of the smart photovoltaic system blind considering the photovoltaic panel, tracking system, and monitoring system. Appl. Sci. 2017, 7, 1077. [Google Scholar] [CrossRef] [Green Version]
  68. Cerón, I.; Caamaño-Martín, E.; Neila, F.J. ‘State-of-the-art’ of building integrated photovoltaic products. Renew. Energy 2013, 58, 127–133. [Google Scholar] [CrossRef] [Green Version]
  69. Beinert, A.J.; Romer, P.; Heinrich, M.; Mittag, M.; Aktaa, J.; Neuhaus, D.H. The effect of cell and module dimensions on thermomechanical stress in PV modules. IEEE J. Photovolt. 2019, 10, 70–77. [Google Scholar] [CrossRef]
  70. Frontczak, M.; Wargocki, P. Literature survey on how different factors influence human comfort in indoor environments. Build. Environ. 2011, 46, 922–937. [Google Scholar] [CrossRef]
  71. Fanger, P.O. Moderate Thermal Environments Determination of the PMV and PPD Indices and Specification of the Conditions for Thermal Comfort; ISO 7730; International Organization for Standardization: Geneva, Switzerland, 1984. [Google Scholar]
  72. Wang, M.; Li, Q.; Wang, F.; Yuan, Z.; Wang, L.; Zhou, X. Residential indoor thermal environment investigation and analysis on energy saving of air conditioning in hot summer and warm winter zone in China. Urban Clim. 2023, 47, 101369. [Google Scholar] [CrossRef]
  73. Nabil, A.; Mardaljevic, J. Useful daylight illuminances: A replacement for daylight factors. Energy Build. 2006, 38, 905–913. [Google Scholar] [CrossRef]
  74. Roudsari, M.S.; Pak, M.; Smith, A. Ladybug: A Parametric Environmental Plugin for Grasshopper to Help Designers Create an Environmentally-Conscious Design. In Proceedings of the 13th International IBPSA Conference, Lyon, France, 25–28 August 2013; pp. 3128–3135. [Google Scholar]
  75. Reinhart, C.F.; Walkenhorst, O. Dynamic RADIANCE-based daylight simulations for a full-scale test office with outer Venetian blinds. Energy Build. 2001, 33, 683697. [Google Scholar] [CrossRef]
  76. Romero, R.; Simon, J.; Ryan, T.; Peterson, Z.; Torcellini, P.; Kandt, A.; Young, M.; Rothgeb, S.; Colgan, C. US Department of Energy Solar Decathlon Competition Guide: 2021 Design Challenge and 2023 Build Challenge; National Renewable Energy Lab. (NREL): Golden, CO, USA, 2021. [Google Scholar]
  77. Ward, G.J. The RADIANCE lighting simulation and rendering system. In Proceedings of the 21st Annual Conference on Computer Graphics and Interactive Techniques, Orlando, FL, USA, 24–29 July 1994; pp. 459–472. [Google Scholar] [CrossRef] [Green Version]
  78. Ibrahim, Y.I.; Kershaw, T.; Shepherd, P. A methodology for Modelling Microclimate. In Proceedings of the 35th Plea Conference Sustainable Architecture and Urban Design, A Coruña, Spain, 1–3 September 2020. [Google Scholar]
  79. Chen, G.; He, H.; Chen, Y.; Zhao, L.; Cai, Y.; Ma, Y. Applying a diagnostic equation for maximum urban heat island intensity based on local climate zones for Guangzhou, China. Build. Environ. 2023, 228, 109817. [Google Scholar] [CrossRef]
  80. Kelly, N.; Choe, D.; Meng, Q.; Runkle, E.S. Promotion of lettuce growth under an increasing daily light integral depends on the combination of the photosynthetic photon flux density and photoperiod. Sci. Hortic. 2020, 272, 109565. [Google Scholar] [CrossRef]
  81. Freitas, S.; Brito, M.C. Maximizing the Solar Photovoltaic Yield in Different Building Facade Layouts. In Proceedings of the European Photovoltaic Solar Energy Conference and Exhibition, Hamburg, Germany, 14–18 September 2015; pp. 14–18. [Google Scholar]
  82. Bay, J.H.P.; Owen, L.C.W.; Singh, S. Food production and density: The design of a high-rise housing development in Singapore. In Growing Compact: Urban Form, Density and Sustainability; Bay, J.H.P., Lehmann, S., Eds.; Routledge: Abingdon, UK, 2017. [Google Scholar]
  83. Dorais, M. The use of supplemental lighting for vegetable crop production: Light intensity, crop response, nutrition, crop management, cultural practices. In Proceedings of the Canadian Greenhouse Conference, Toronto, ON, Canada, 12 November 2003; pp. 1–8. [Google Scholar]
  84. Schiller, L. Is My Plant Getting Enough Light? Available online: http://www.ceresgs.com/is-my-plant-getting-enough-light/ (accessed on 7 September 2017).
  85. Fang Xiaodan, Residents’ Income Continues to Grow Steadily and Consumer Spending Continues to Recover—NBS. Available online: http://www.stats.gov.cn/sj/sjjd/202302/t20230202_1896589.html (accessed on 9 June 2023).
  86. Hosseini, S.M.; Carli, R.; Jantzen, J.; Dotoli, M. Multi-block ADMM Approach for Decentralized Demand Response of Energy Communities with Flexible Loads and Shared Energy Storage System. In Proceedings of the 2022 30th Mediterranean Conference on Control and Automation (MED), Vouliagmeni, Greece, 28 June–1 July 2022; pp. 67–72. [Google Scholar]
  87. Marler, R.T.; Arora, J.S. Survey of multi-objective optimization methods for engineering. Struct. Multidiscip. Optim. 2004, 26, 369–395. [Google Scholar] [CrossRef]
  88. Zhang, A.; Bokel, R.; van den Dobbelsteen, A.; Sun, Y.; Huang, Q.; Zhang, Q. Optimization of Thermal and Daylight Performance of School Buildings Based on a Multi-Objective Genetic Algorithm in the Cold Climate of China. Energy Build. 2017, 139, 371–384. [Google Scholar] [CrossRef]
Figure 1. Overview of research method.
Buildings 13 01540 g001
Figure 2. The population distribution in residential buildings of different height types.
Buildings 13 01540 g002
Figure 3. Community model for Tianhetaoyuan.
Buildings 13 01540 g003
Figure 4. Overview of the settings.
Buildings 13 01540 g004
Figure 5. Vertical layout for the prototype.
Buildings 13 01540 g005
Figure 6. Façade library.
Buildings 13 01540 g006aBuildings 13 01540 g006b
Figure 7. Changes in PV electricity production of living room and bedroom.
Buildings 13 01540 g007
Figure 8. Total annual electricity production for different units of PVSD.
Buildings 13 01540 g008
Figure 9. Percentage of thermal comfort, visual comfort, and glare.
Buildings 13 01540 g009
Figure 10. UDI distribution diagram of living room and bedroom.
Buildings 13 01540 g010
Figure 11. The changes of PMV at different times after the façade application.
Buildings 13 01540 g011
Figure 12. UTCI heatmap of community (Tianhetaoyuan).
Buildings 13 01540 g012
Table 1. Characteristics of the different shading devices.
Photovoltaic TypeDistance to WallPanel SizeTilt AngleNumber of RowsAxis Orientation
Crystalline silicon0.5 m0.4 m × 0.4 m30°6Horizontal
Thin film0.5 m0.8 m × 0.8 m15°3Vertical (west/east)
Table 2. Versions of software used in the simulation.
Name of SoftwareVersion
Ladybug0.0.67
Honeybee0.064
Daysim4
Radiance5.2.2
Openstudio2.9
THERM7.6
Rhinoceros7
ENVI-met5.1.1
Table 3. Characteristics of the different construction materials.
MaterialThickness (m)U-Value (W/m2 K)Solar Heat Gain CoefficientVisible Transmittance
Single 6 mm glass0.0065.50.650.88
MaterialThickness (m)ConductivityDensitySpecific Heat
150 mm wall0.150.238401200
Table 4. Characteristics of the different transmissive and reflective materials.
MaterialR TransmittanceG TransmittanceB TransmittanceRoughnessSpecularity
Glass0.70.70.70.050
MaterialR ReflectanceG ReflectanceB ReflectanceRoughnessSpecularity
Wall material0.70.70.70.050
Ceiling material0.80.80.80.050
Floor material0.40.40.40.050
Mono solar cell0.30.30.3
Thin film solar cell00.0390.1950.050.61
Surround building0.20.20.20.050
Table 5. Best optimization results of the living room.
TypeZonePanel SizeTilt AngleAxis
Direction
PV TypeVF
Rows
Plant YieldElectricity
Production
(Annual)
Buildings 13 01540 i001High0.8 M30°HorizontalMonocrystalline0none3368.81 kWh
Buildings 13 01540 i002High0.8 M30°HorizontalMonocrystalline29.73 kg2472.59 kWh
Buildings 13 01540 i003Middle0.8 M30°HorizontalMonocrystalline0none2575.72 kWh
Buildings 13 01540 i004Middle0.8 M15°Vertical
(eastward)
Monocrystalline38.73 kg1335.89 kWh
Buildings 13 01540 i005Low0.8 M30°HorizontalMonocrystalline0none2054.13 kWh
Buildings 13 01540 i006Low0.8 M30°HorizontalFilm29.81 kg1114.70 kWh
Table 6. Best optimization results of the bedroom.
TypeZonePanel SizeTilt AngleAxis
Direction
PV TypeVF RowsPlant
Yield
Electricity
Production
(Annual)
Buildings 13 01540 i007High0.8 M30°HorizontalMonocrystalline0none2442.76 kWh
Buildings 13 01540 i008High0.8 M30°HorizontalMonocrystalline29.90 kg1793.41 kWh
Buildings 13 01540 i009Middle0.8 M30°HorizontalMonocrystalline0none1886.66 kWh
Buildings 13 01540 i010Middle0.8 M30°HorizontalMonocrystalline37.85 kg969.25 kWh
Buildings 13 01540 i011Low0.8 M30°HorizontalMonocrystalline0none1608.47 kWh
Buildings 13 01540 i012Low0.8 M30°HorizontalMonocrystalline29.18 kg878.937 kWh
Table 7. Total annual lettuce production and DLI.
DLI (mol m−2 d−1)SpringSummerAutumnWinterAnnual Total Lettuce Production (kg)Percentage
High (Living room)11.2960.912.2516.149.72539.43%
Middle (Living room)15.361616.586.038.7340448.47%
Low (Living room)11.9862.3412.9125.659.81469.52%
High (Bedroom)9.9852.2110.9218.489.9020649.60%
Middle (Bedroom)12.4657.2413.5212.47.84687.61%
Low (Bedroom)8.6339.419.3122.59.18168.91%
Disclaimer/Publisher’s Note: The statements, opinions and data contained in all publications are solely those of the individual author(s) and contributor(s) and not of MDPI and/or the editor(s). MDPI and/or the editor(s) disclaim responsibility for any injury to people or property resulting from any ideas, methods, instructions or products referred to in the content.

