Article

A Multi-Layer Blowout Model for the Tunneling Face Stability Analysis

1
Department of Infrastructure Engineering, Hanoi University of Mining and Geology, Hanoi 100000, Vietnam
2
Institute of Research and Development, Duy Tan University, Danang 55000, Vietnam
3
Faculty of Civil Engineering, Duy Tan University, Danang 55000, Vietnam
4
Laboratory for Computational Mechanics, Institute for Computational Science and Artificial Intelligence, Van Lang University, Ho Chi Minh City 700000, Vietnam
5
Faculty of Mechanical—Electrical and Computer Engineering, School of Technology, Van Lang University, Ho Chi Minh City 700000, Vietnam
6
Department of Bridge and Road Engineering, Hanoi University of Civil Engineering, Hanoi 100000, Vietnam
7
Faculty of Civil Engineering, Thuyloi University, Hanoi 100000, Vietnam
*
Author to whom correspondence should be addressed.
Buildings 2023, 13(6), 1362; https://doi.org/10.3390/buildings13061362
Submission received: 18 April 2023 / Revised: 12 May 2023 / Accepted: 18 May 2023 / Published: 23 May 2023
(This article belongs to the Special Issue Machine Learning Applications in Sustainable Buildings)

Abstract

:
The stability of the tunnel face during tunneling is one of the major criteria for the design and construction of the tunnel. Collapse and blowout are two modes of tunnel face failure during the excavation. The cover-to-diameter ratio is one of the main parameters controlling these failure modes. Several analytical solutions have been proposed to estimate the range of support pressure applied on the tunnel face to avoid both the collapse and the blowout. However, most of those models deal with homogeneous soils. This paper aims at proposing an analytical model to predict the blowout of the tunneling face of a tunnel in multi-layered soils. The derivation is based on a limit equilibrium analysis, which considers the water tCiable. The proposed model is validated against the real blowout data reported from the tunneling in the Second Heinenoord Tunnel project in the Netherlands. Then, the maximum support pressure exerted on the tunneling face is predicted as a function of the cover-to-diameter ratio, the tunnel diameter, and the water table level for five representative soils. Finally, the model is applied to an underground segment of the Hanoi Metro Line 3 project (in Vietnam) to show the role of the multi-layer aspect.

1. Introduction

The urban rail transit system (subway) has become an unavoidable solution in big cities so far to reduce traffic congestion, noise, and air pollution. However, a subway is usually much more expensive than a streetcar or a tramway with the same distance. Thus, the design optimization is substantial, which helps to reduce the cost of subway construction. The cover-to-diameter ratio (C/D) is an important parameter for the optimization of economic-technical solutions. Indeed, reducing the overburden depth (C) could decrease the construction and maintenance costs, ensure safety, as well as lessen the travel time from the surface to the platform.
When building the tunnel using the earth pressure balance (EPB)—tunnel boring machine (TBM), the C/D ratio depends primarily on the support pressures applied on the tunneling face. The support pressure allows for avoiding the collapse (active failure) and the blowout (passive failure) of the tunnel face during tunneling. A support pressure lower than the initial horizontal stress of the ground at the tunnel face induces the collapse, whereas a support pressure higher than the initial horizontal stress may provoke the blowout. The passive failure has been less investigated than the active failure in the literature and deserves further investigation.
Several analytical blowout models have been proposed to estimate the maximum support pressure, which are based on either the limit equilibrium method [1,2,3,4,5] or the limit analysis method [6,7,8,9,10,11,12,13,14]. The limit analysis method is better than the limit equilibrium method in terms of theoretical background since the limit analysis accounts for the stress–strain behavior and ensures equilibrium everywhere [12,15]. Nevertheless, the limit equilibrium method has still been widely used in practical engineering due to its clear physical meaning and simplicity [16,17,18]. Moreover, Berthoz et al. [19] showed a large difference between the blowout pressures predicted by a limit analysis model and data.
Numerical modeling that is based on the finite element method [18,19], the finite difference method [20,21,22], and the discrete element method [23,24,25,26,27,28,29] have been performed to receive insights into the failure process during tunneling of a shallow tunnel. Numerical approaches also provide results to verify the analytical models. However, assumptions made by the numerical approach weaken the validation. Laboratory centrifugal tests at a reduced scale have also been performed to validate the analytical and numerical models. The most relevant data for the validation of the analytical and numerical models are the observation from the real work condition. Case studies on the passive failure during tunneling of a real tunnel have rarely been reported. To the best of the authors’ knowledge, only the blowout of the Second Heinenoord Tunnel project in the Netherlands is documented [30].
This study aims to derive a 2D multi-layer blowout model to estimate the maximum support pressure exerted on the tunneling face. This model was developed based on the principle of limit equilibrium, which considers the balance between the weight of the soil column above the tunnel and the support pressure applied to the tunnel. This simple but effective idea was first proposed by Broere [3]. For the sake of clarity, the novelty of the proposed model compared to Broere [3]’s model consists of considering the multi-layered soils, the support pressure gradient at the tunnel face, and the lower part equilibrium. The validation of this multi-layer model is shown by comparing it to the blowout data recorded in the Second Heinenoord Tunnel (SHT) project in the Netherlands. The presence of this model allows plotting the maximum support pressure curve as a function of the cover-to-diameter ratio for different tunnel diameters, different water table levels, and for five representative soils (sand, clayed sand, clay, soft clay, and peat). This result should be useful for the design of the tunnel excavated by a TBM. Finally, the proposed model is applied to estimate the maximum support pressure for the Hanoi Metro Line 3 project (in Vietnam) with real multi-layered soil data. The comparison between the results from equivalent homogeneous soils and multi-layer soil models highlights the role of the multi-layer model.

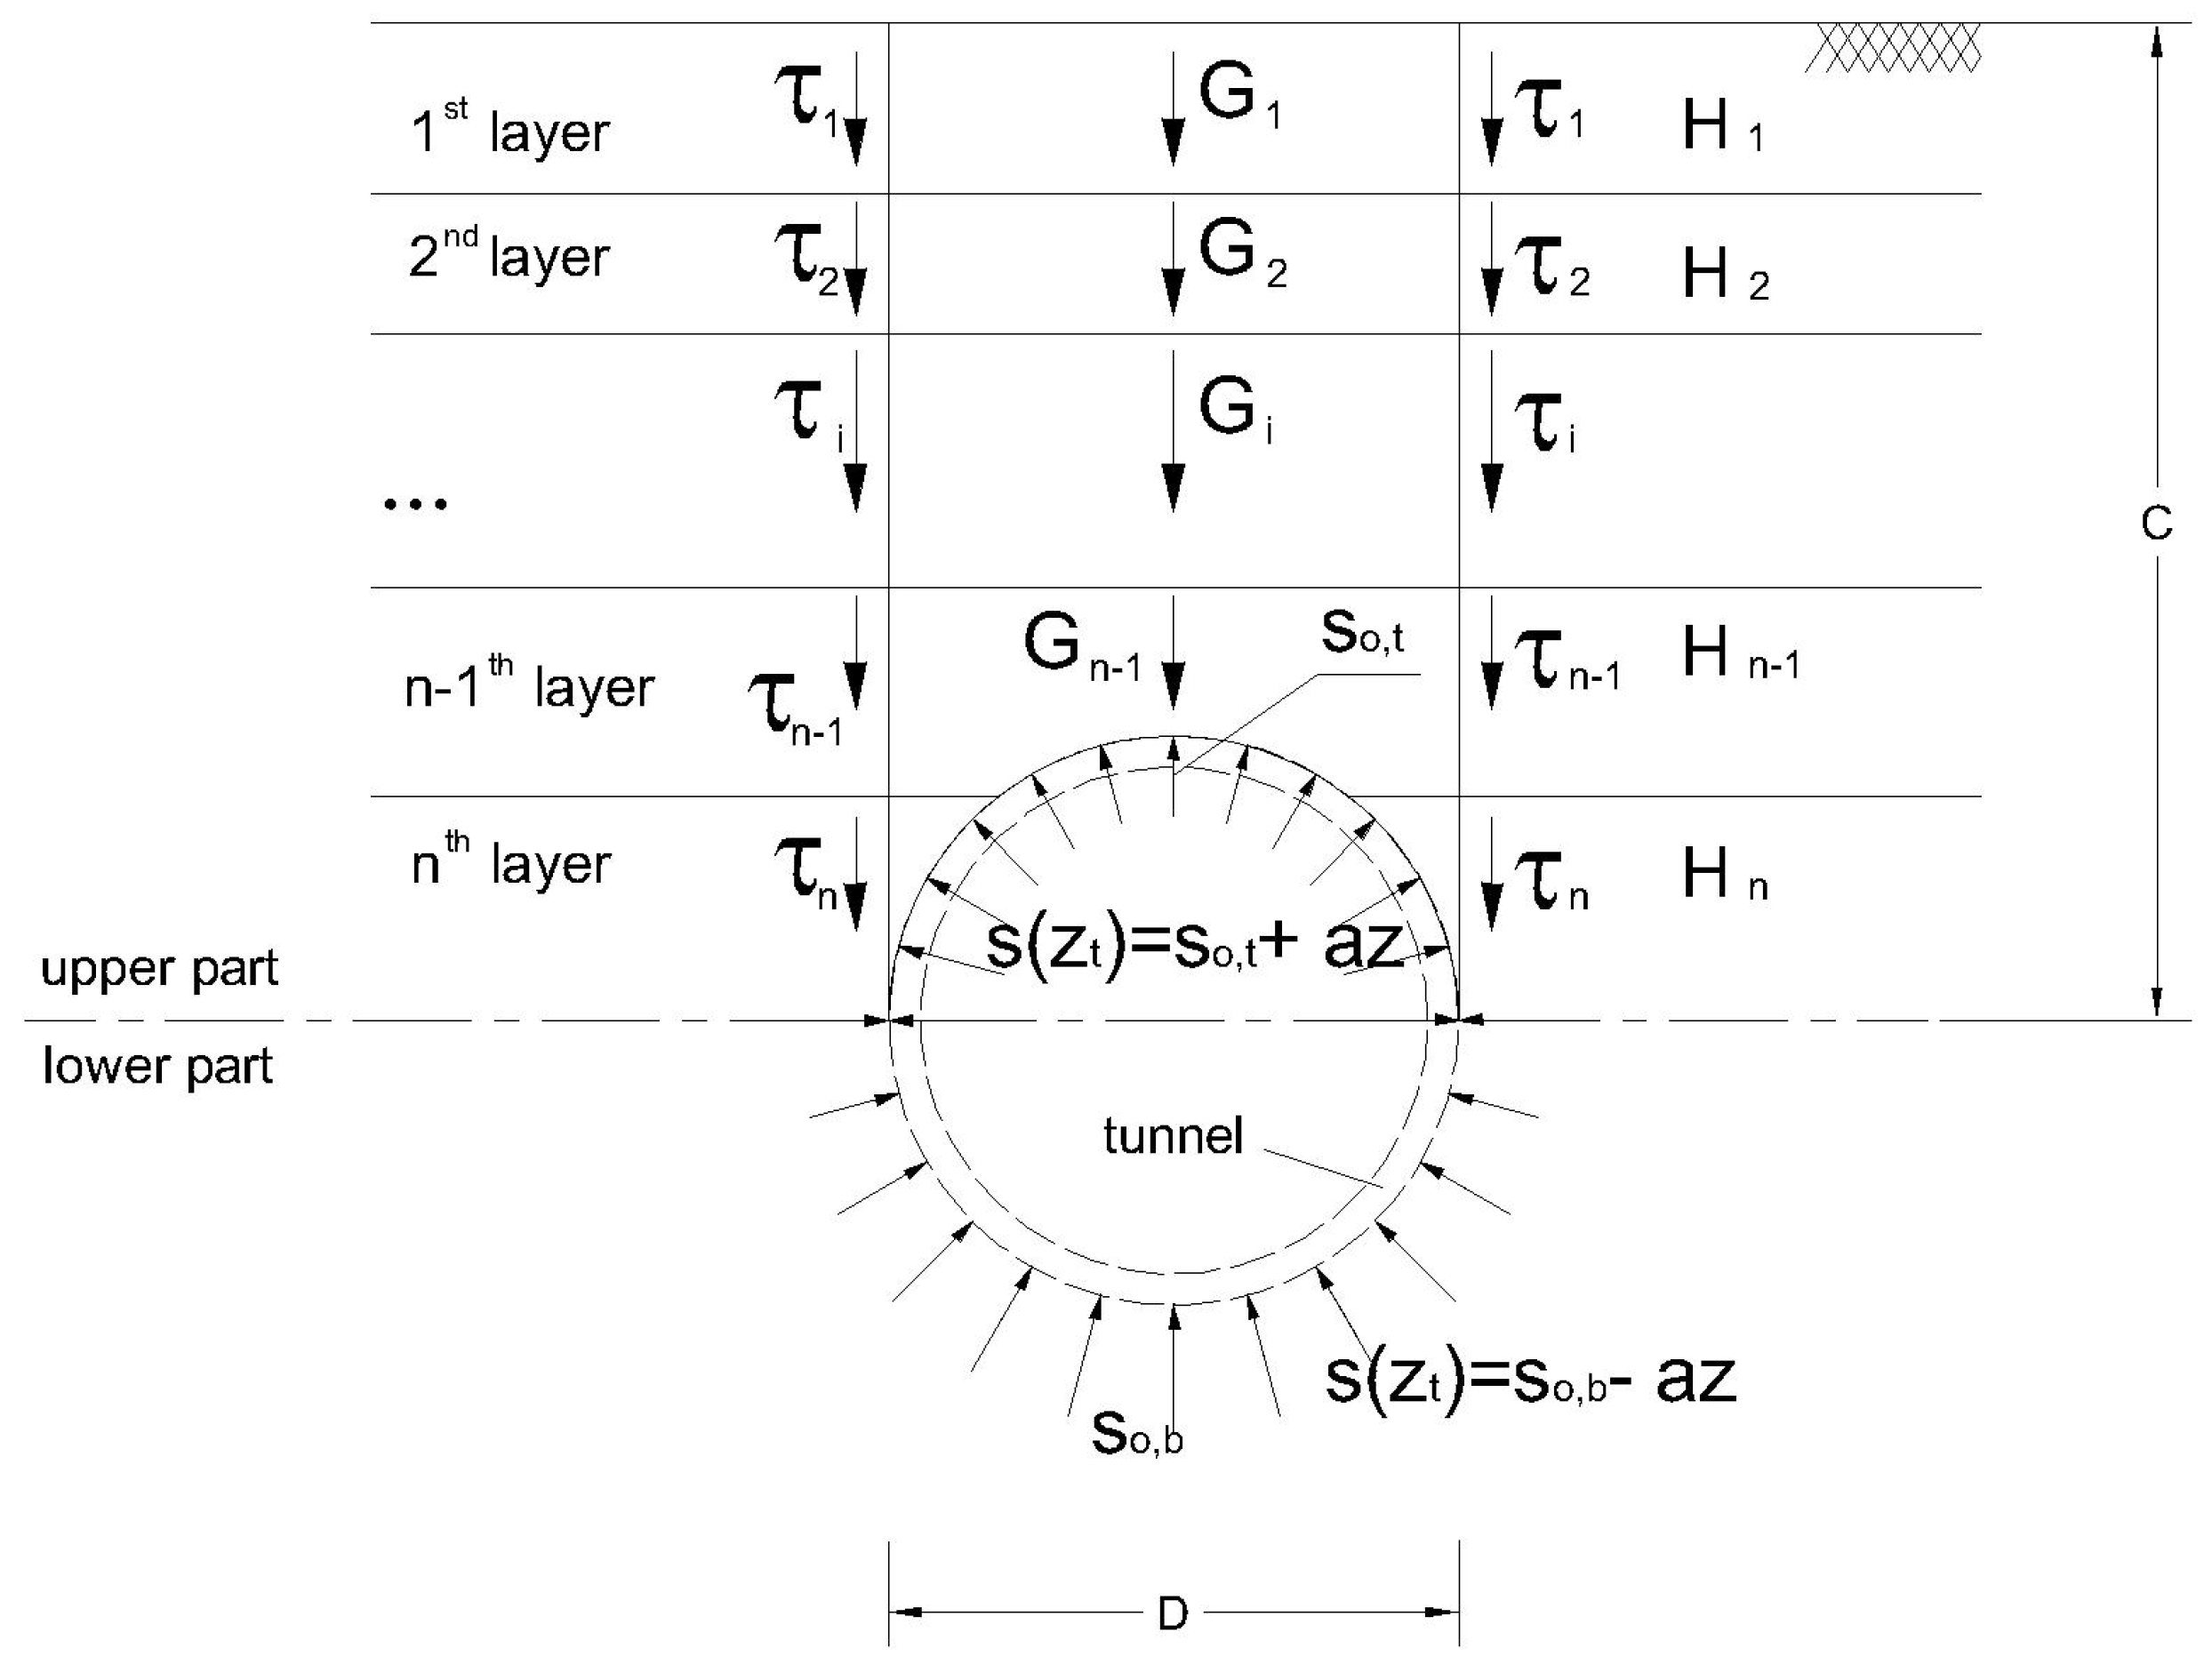
2. The Multi-Layer Blowout Model

To derive the multi-layer blowout model, we consider the equilibrium of the soil column above the tunnel in the 2D section passing the tunneling face with the following main assumptions:
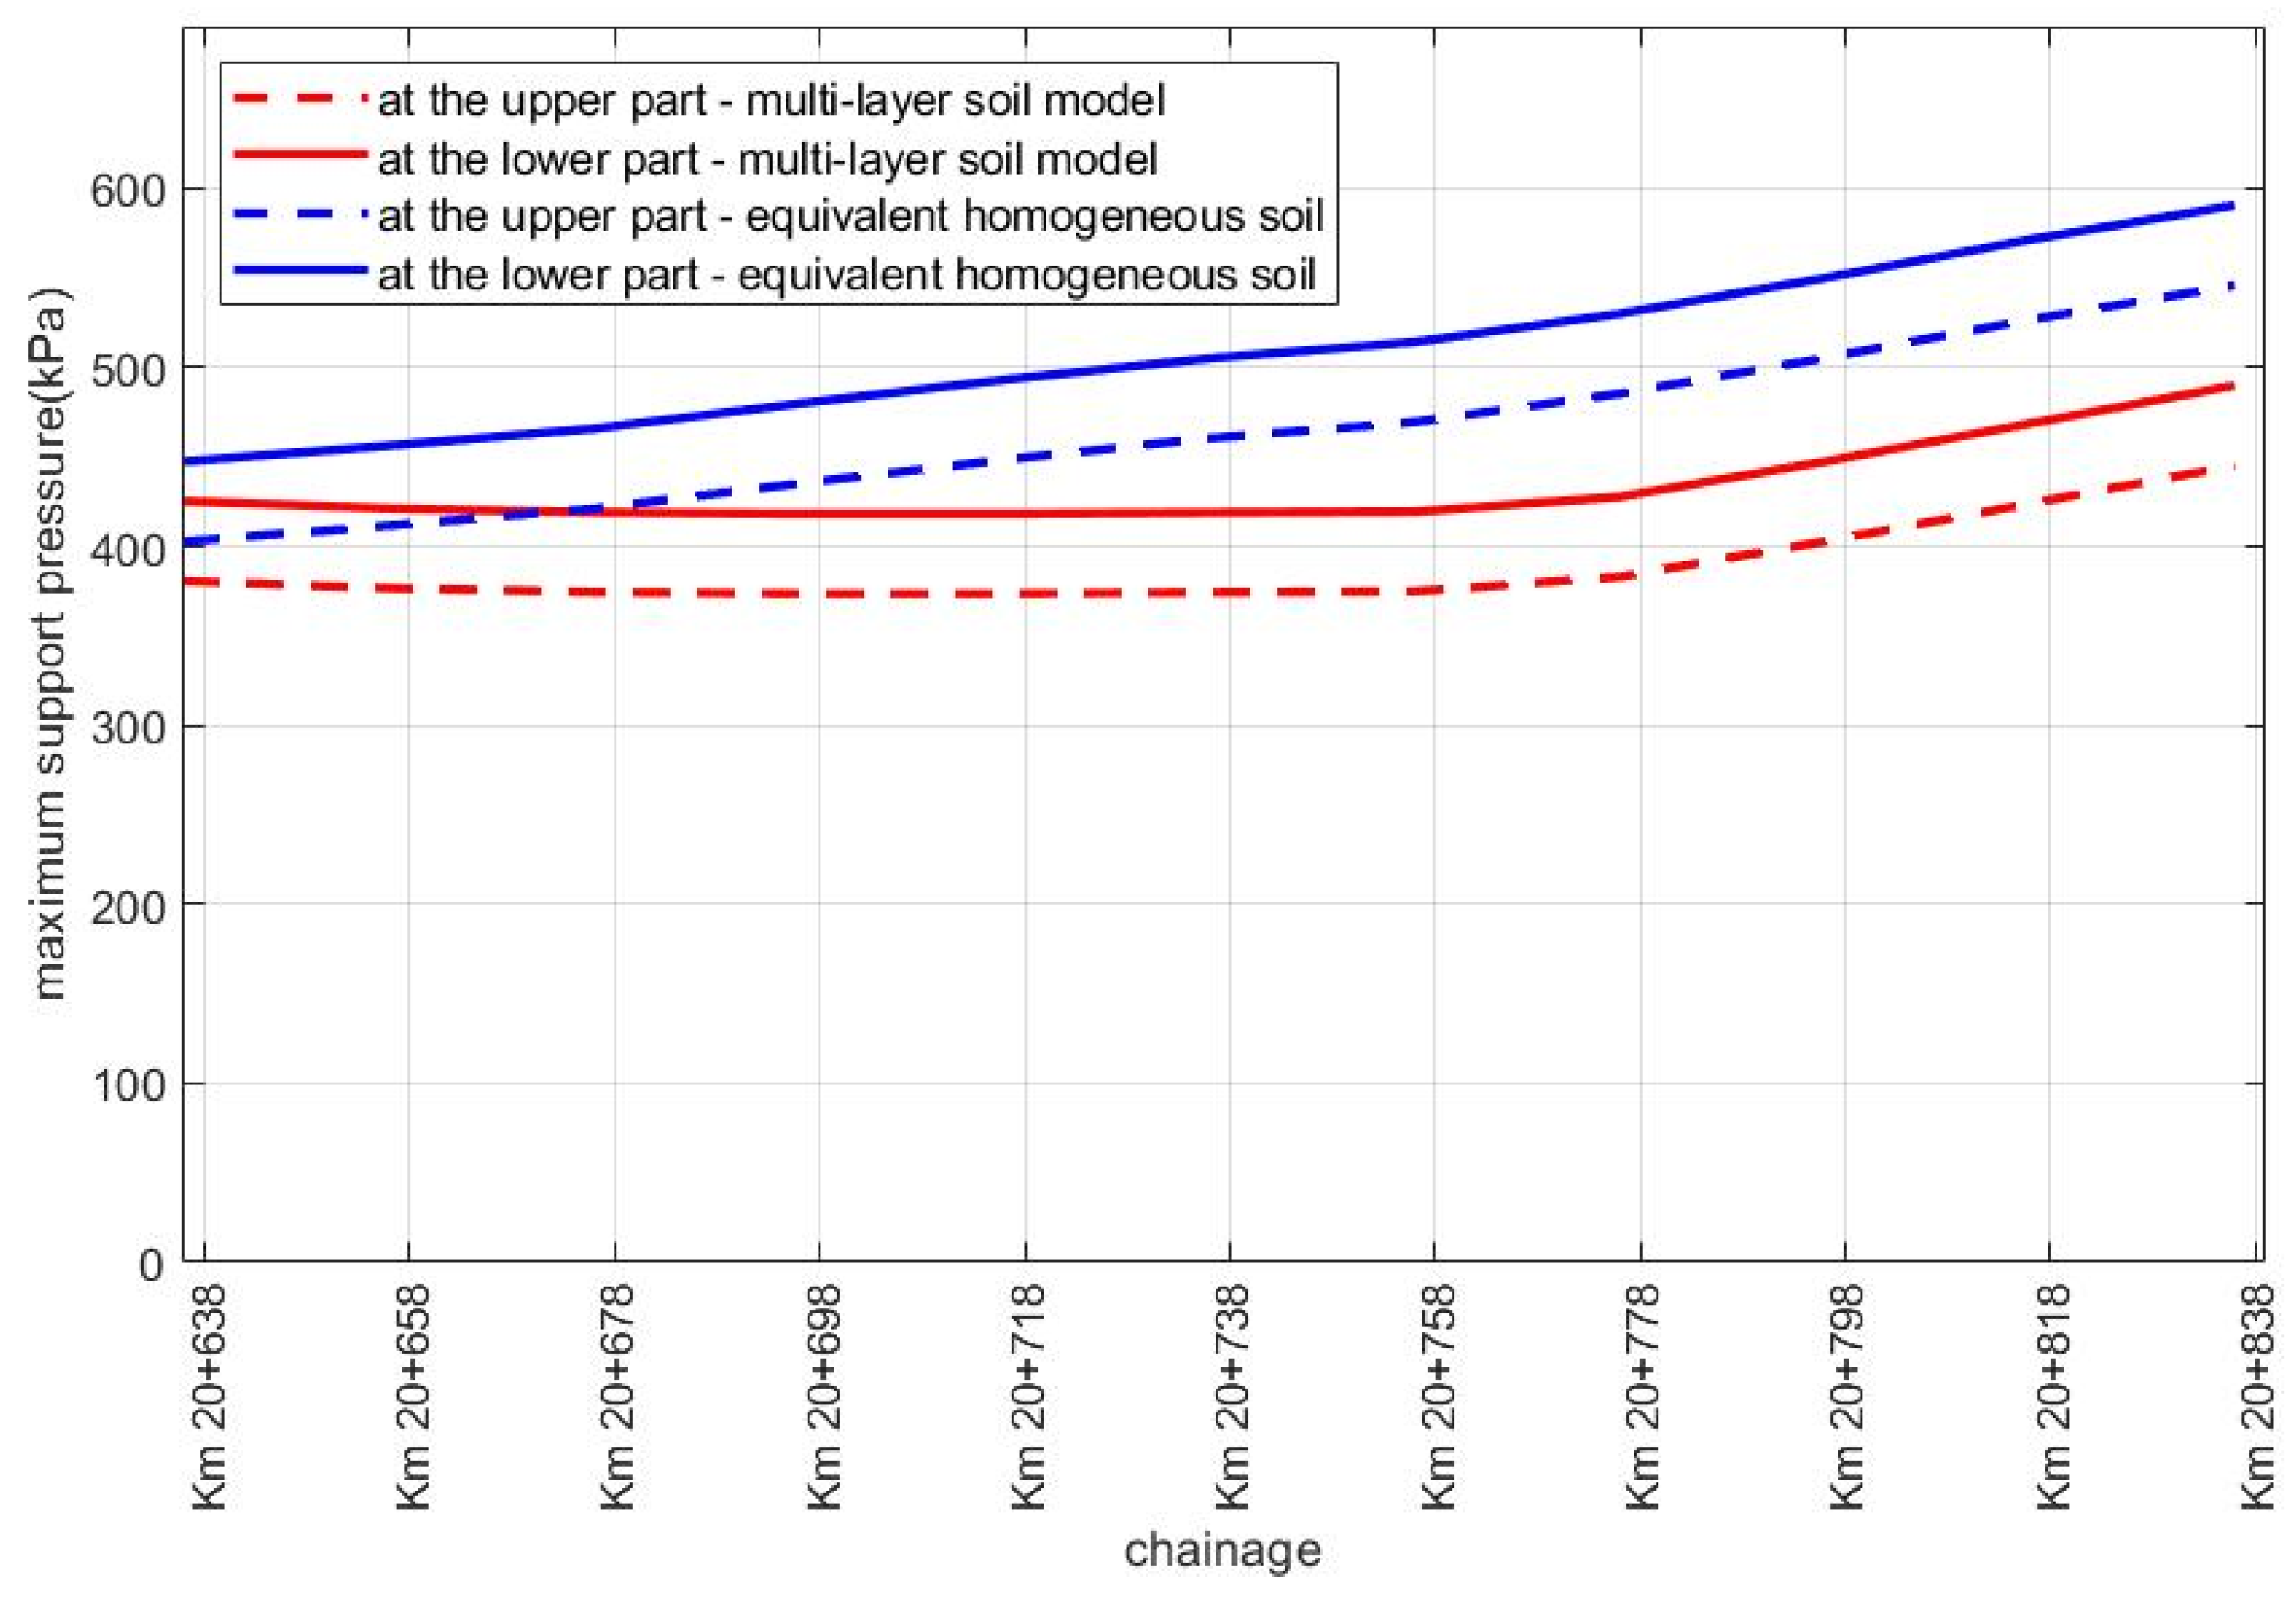
  • A high support pressure applied on the top of the tunnel, which may push the soil column upwards above the tunnel.
  • A high support pressure exerting on the lower part of the tunnel, which shoves the soil column above the tunnel and the tunnel itself. In this case, the support fluid flows into the gap between the tunnel and the surrounding soil.
There are some pumping support fluid locations at the tunneling face and the tail of the TBM (secondary grouting). Thus, the range of support pressures from the minimum support pressure to the maximum support pressure used in the TBM is often estimated for these locations (face and tail of the TBM). The blowout can occur when too high support pressures are applied. The lower part of the model corresponds to the potential blowout that may occur at the tail of the TBM. Blowout pressures in the model in this paper were estimated for both the upper part and the lower part. This consideration is in line with the difference in the fluid pumping pressure along the tunneling face perimeter.
The pressure exerting on both the upper and lower parts of the tunnel is a function of the depth (z-coordinate). Indeed, the EPB—TBM can apply a non-uniform pressure on the tunnel face to account for the initial stress gradient in the z-coordinate [31]. This gradient is significant and should be considered for a very shallow tunnel. By noting δb = dp/dz being the support pressure gradient, the support pressure on the upper part is
s = s 0 , t + δ p R c o s α
and on the lower part
s = s 0 , b δ p R c o s α
where s0,t and s0,b are the support pressure values at the top and the bottom of the tunnel; R is the radius of the tunnel; and α is the angle as shown in Figure 1. The gradient of support fluid is indicated in Bezuijen and Talmon [31] when investigating the behavior of grout around the TBM.
The determination of the maximum support pressure at the upper and lower parts is based on the equilibrium condition of the soil column above the tunnel, the assembly of the soil column, and the tunnel. According to the scheme in Figure 1 for multi-layered soil overhead the tunnel, the mass of the soil column G1 is
G 1 = i = 1 n G 1 , i = i = 1 n D γ i H i π 8 D 2 i = k n H i γ i i = k n H i
where G1,i is the body weight of the layer; Hi is the ith layer thickness; γi is the density of the ith soil layer; and D is the tunnel diameter. The tunnel is located from the kth layer to the nth layer.
When the soil column above the tunnel starts moving upwards, the shear force between this soil column and its surrounding soil can be estimated as
2 T = 2 i = 1 n T i = 2 i = 1 n H i c i + σ h , i , tan φ i = 2 i = 1 n H i c i + σ h , i , tan φ i
where Ti is the shear force on the one side of the ith layer; ci is the cohesion of the ith soil layer; φi is the friction angle of the ith soil layer; and σ h , i , = K 0 , i σ v , i , = K 0 , i γ i γ w z i is the effective horizontal stress with zi the depth of the ith soil layer.
The mass of the tunnel liner is approximated by
G 2 = π γ T D d
where d is the tunnel lining thickness, and γT is the density of the tunnel lining.
The total support pressure applied on the upper part is estimated as follows:
S v = 0 π d α 0 R s 0 , t + δ p R c o s α s i n α d r = D s 0 , t + δ p D 2 4
Considering the upper part, the equilibrium condition of the soil column above the tunnel is verified using the following equation:
G 1 + 2 T = S v
It is observed that G2 does not involve the equilibrium in Equation (7) for the upper part, since the support fluid flows into the gap above the tunnel liner and, thus, directly applies pressure on the excavated wall of the soil.
Substituting Equations (3), (4) and (6) into Equation (7) yields
i = 1 n D γ i H i π 8 D 2 i = k n H i γ i i = k n H i + 2 i = 1 n H i c i + σ h , i , tan φ i = D s 0 , t + δ p D 2 4
The rearrangement of this equation gives the maximum support pressure at the top of the tunnel; beyond this value, the blowout will occur as follows:
s 0 , t = i = 1 n γ i H i π 8 D i = k n H i γ i i = k n H i + 2 i = 1 n H i D c i + σ h , i , tan φ i δ p D 4
Considering the lower part, the equilibrium equation of the assembly of the tunnel and the soil column above the tunnel reads as
G 1 + G 2 + 2 T = S v
Introducing Equations (3)–(6) into Equation (10) yields the maximum support pressure at the bottom of the tunnel; beyond this value, passive failure will take place.
s 0 , b = i = 1 n γ i H i π 8 D i = k n H i γ i i = k n H i + 2 i = 1 n H i D c i + σ h , i , tan φ i + π d γ T δ p D 4
In summary, the derivation based on an equilibrium analysis in this section yields the maximum support pressure at the top and the bottom of the tunnel in Equations (9) and (11). This solution considers the pressure gradient on the tunnel face and the water table. The maximum pressure at the center of the tunnel face is the average value between those at its top and its bottom.

2.1. Equivalent Homogeneous Soil

Only a few multi-layer models] have been proposed in the literature to determine the maximum support corresponding to the passive failure of the tunneling face. Multi-layered soils are usually considered homogeneous soils with equivalent properties: density γ; cohesion c, friction angle φ, and coefficient of lateral K0. The case of an equivalent homogeneous soil is a particular case of the multi-layer model proposed in this study. Indeed, Equations (9) and (11) are written for the homogeneous soil, such as
s 0 , t = γ H π 8 D γ + 2 H D c + 1 2 H K 0 γ tan φ δ p D 4
s 0 , b = γ H π 8 D γ + 2 H D c + 1 2 H K 0 γ tan φ + δ p D 4 + π d γ T
Using the cover C = H + D 2 , Equations (12) and (13) become
s 0 , t = 2 D K 0 γ tan φ 1 2 + C D 2 + γ D + 2 c 1 2 + C D π 8 γ D δ p D 4
s 0 , b = 2 D K 0 γ tan φ 1 2 + C D 2 + γ D + 2 c 1 2 + C D π 8 γ D + δ p D 4 + π d γ T
To illustrate the solution, the proposed model was applied to show the maximum support pressure at the top and the bottom of the tunnel face for five representative soils, namely peat, soft clay, clay, clayed sand, and sand. The geotechnical properties of these soils are given in Table 1. The four water tables were hw = 0; 0.5 H; and H and C + D for each soil. The tunnel diameter D varied from 3 to 8 m. Figure 2, Figure 3, Figure 4, Figure 5 and Figure 6 plot the maximum support pressure smax at the top and the bottom of the tunnel face as a function of the C/D ratio. It was observed that the support pressure increases when the water table decreases. Moreover, the support pressure is also higher when the soil is better (from peat to sand). This result should be useful for a preliminary design of the tunnel during the excavation.

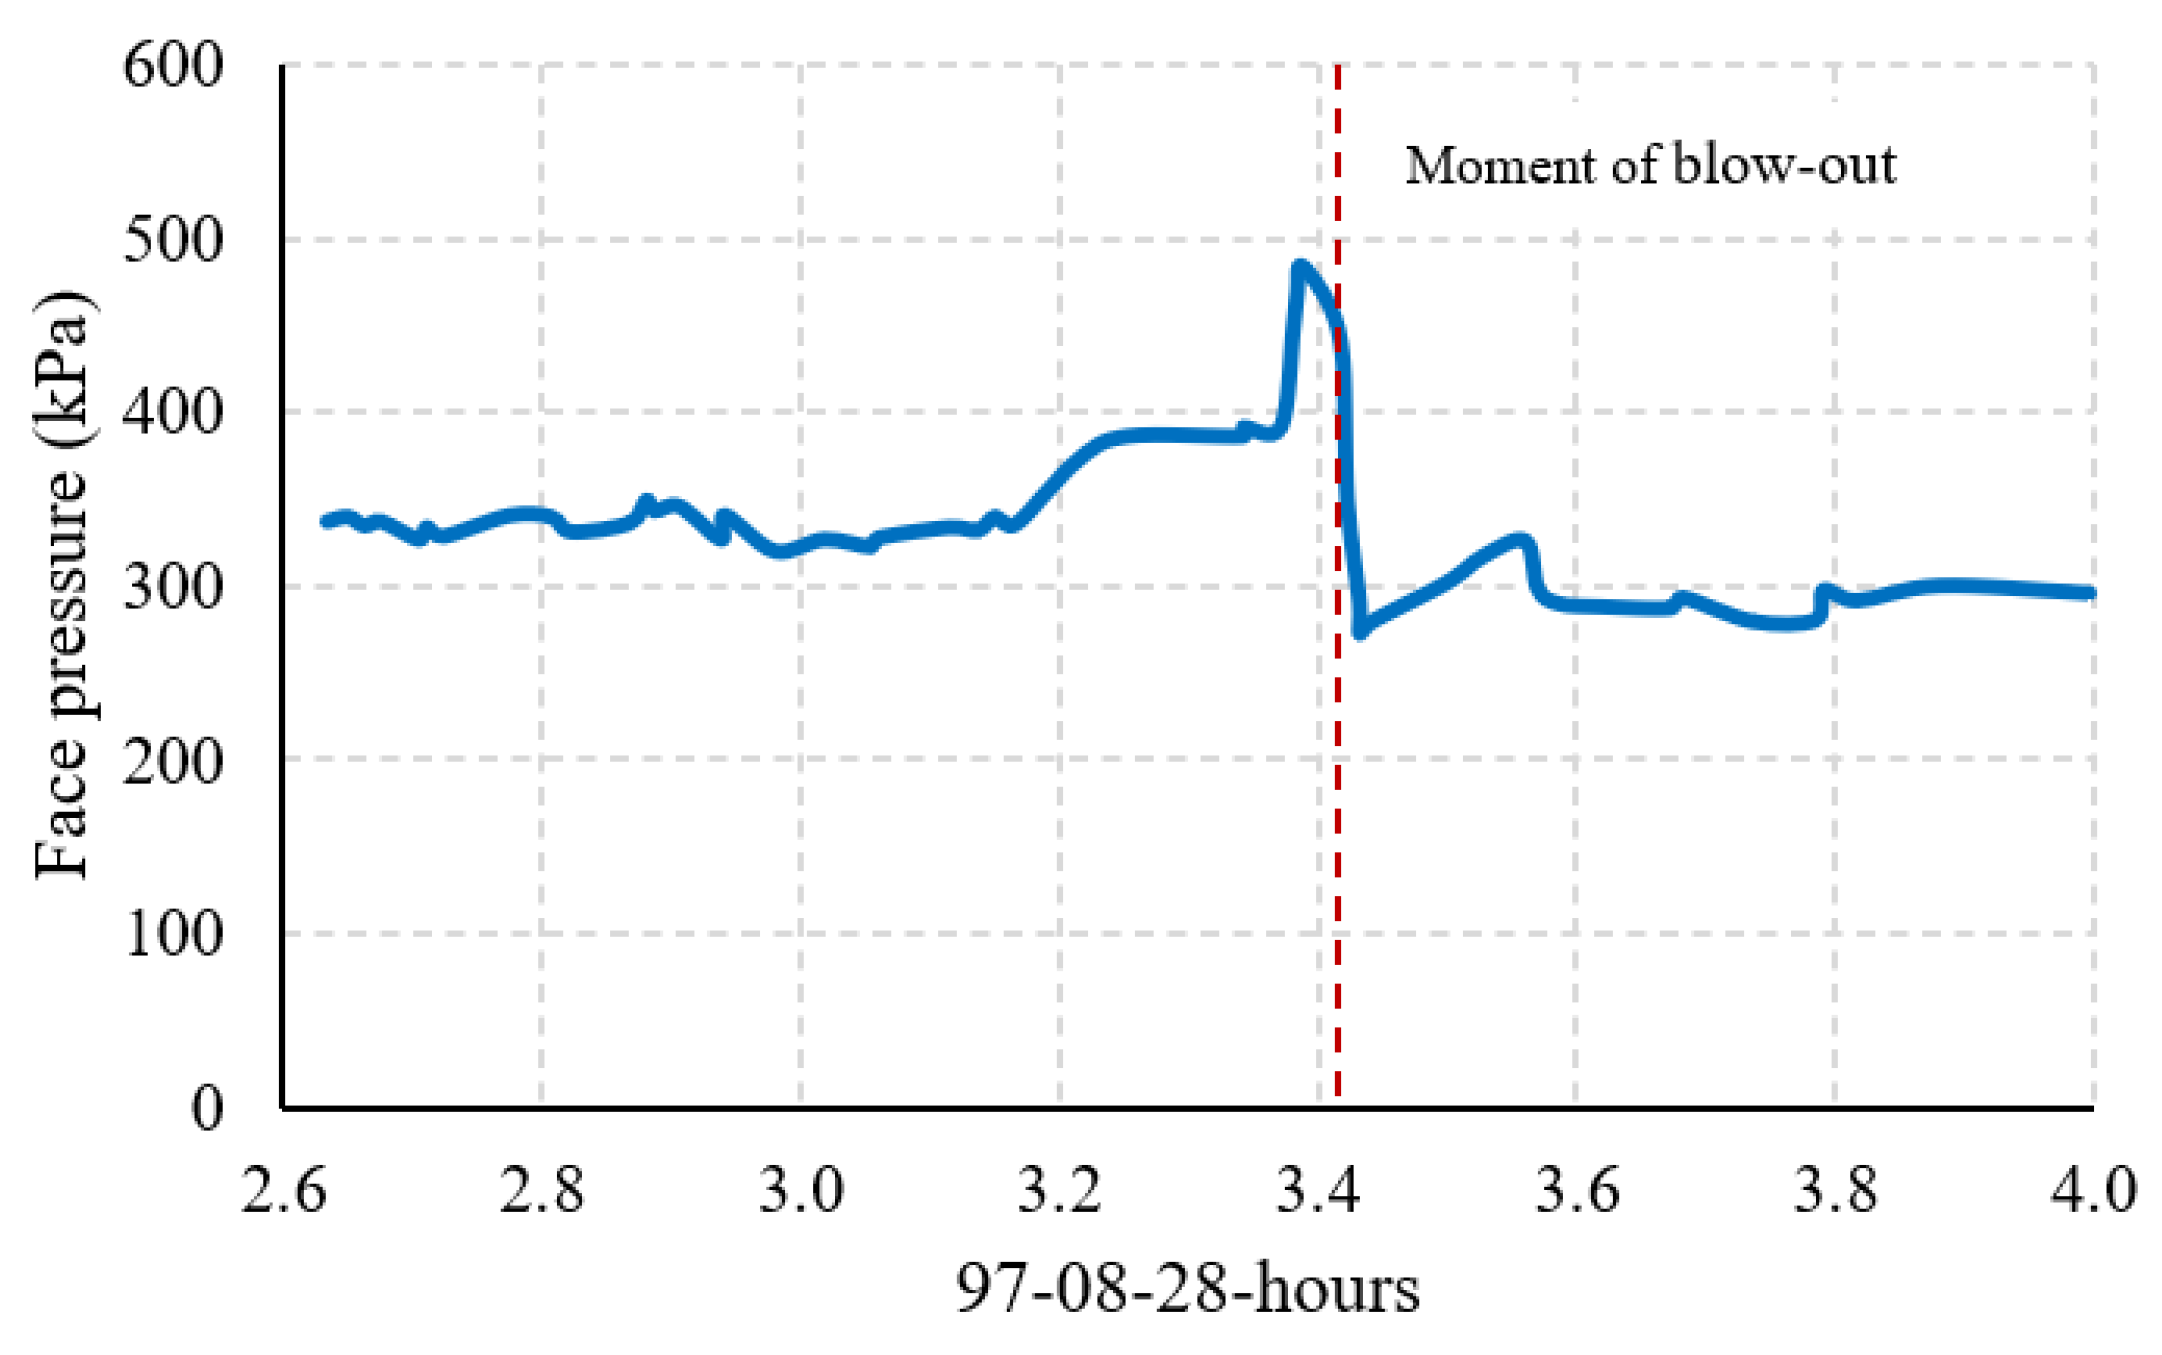
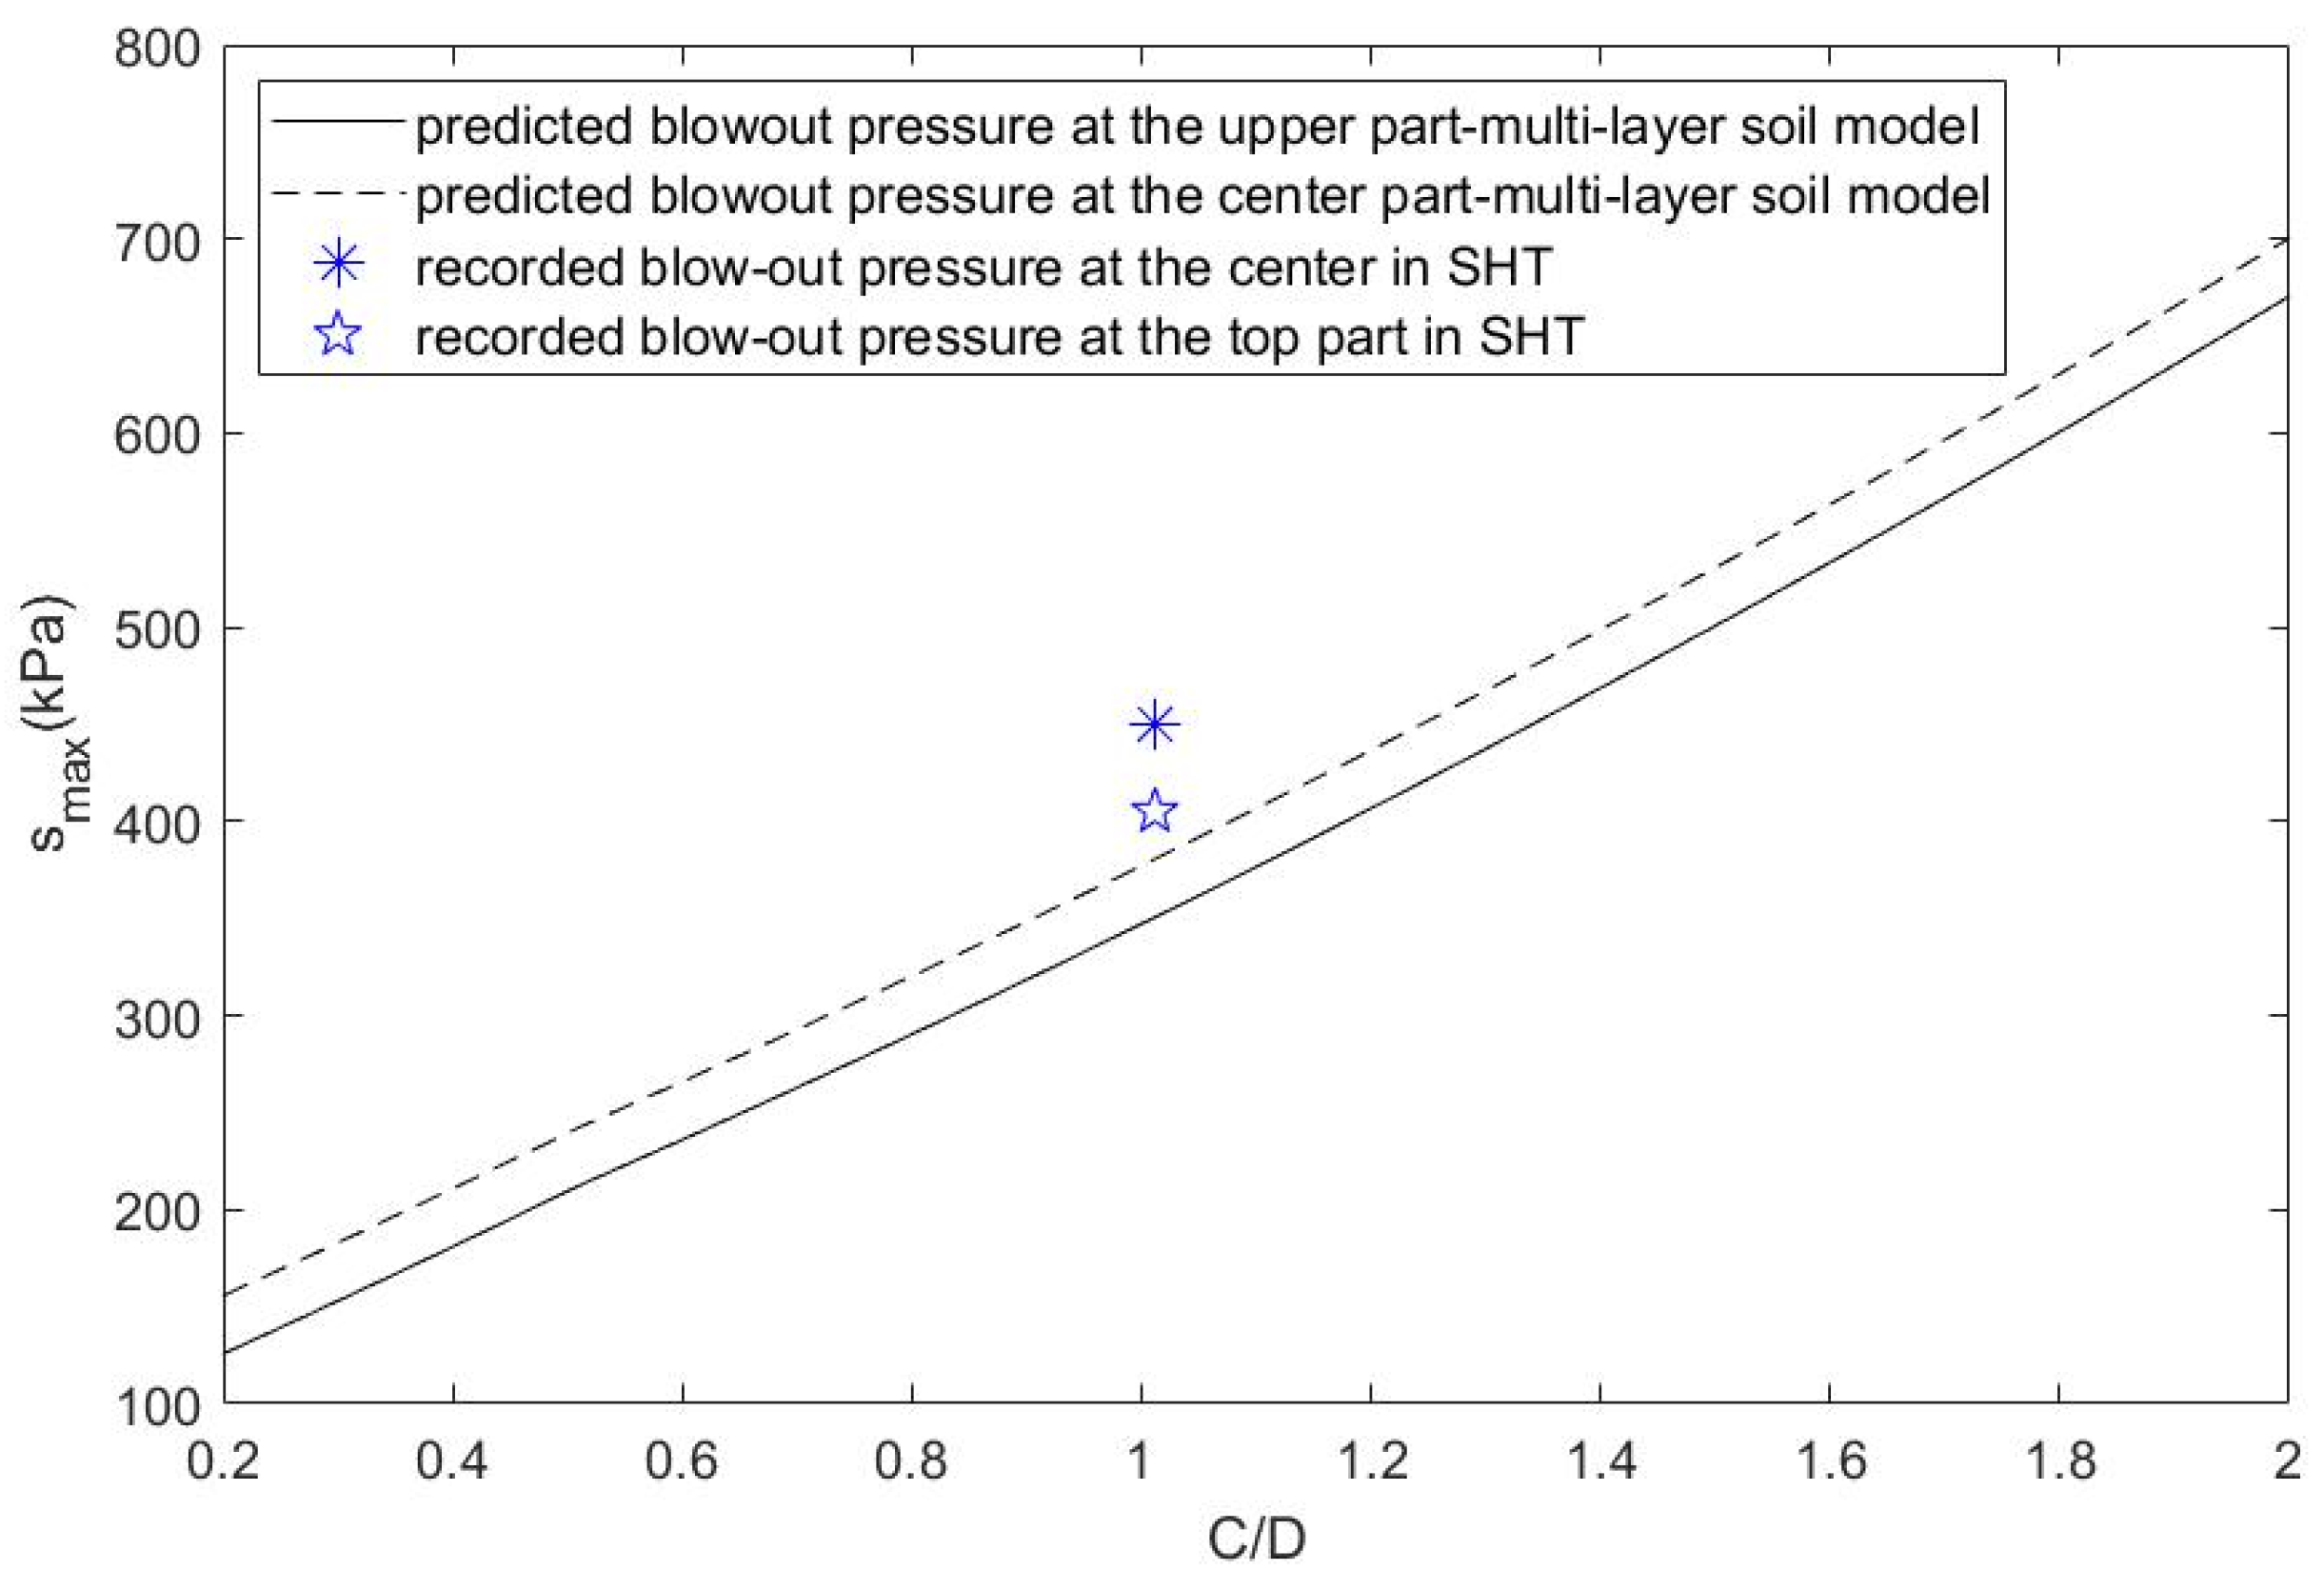
2.2. Model Validation

As mentioned in the introduction section, data from real works are the most relevant for the validation of an analytical and/or empirical model. The multi-layer blowout model proposed in this study was verified against the blowout event that occurred in the Second Heinenoord Tunnel project (in The Netherlands).
In the Netherlands, the Second Heinenoord Tunnel is a noteworthy achievement as it is the country’s first large-scale tunnel (D = 8.5 m) to be constructed using a shielded TBM (tunnel boring machine) for the excavation. The construction of the tunnel was carried out in Rotterdam from 1996 to 1999 beneath the Oude Maas River. According to Figure 7, the blowout incident corresponding to a sudden release of pressurized material took place when the tunnel was passing through the Oude Maas River. At this specific location, the tunnel was covered by 8.6 m of soil, including 4 m of Pleistocene sand, 4.6 m of soft Holocene layer, and recent river deposits. The Pleistocene sand had a friction angle of 36.5°, a unit weight of 20.5 kN/m3, and an earth pressure coefficient of 0.5. The very soft Holocene layer had a friction angle of 27°, a unit weight of 17.2 kN/m3, an earth pressure coefficient of 0.58, and a cohesion of 3 kPa [32]. Additionally, there was 11 m of column water above the soil [30]. The support pressure during the blowout occurrence that was documented at the tunneling face is presented in Figure 8. The recorded support pressure was 450 kPa at the center of the tunnel, or 405 kPa at the crown of the face.
By applying the current multi-layer model for the above data of the Second Heinenoord Tunnel, Figure 9 shows the predicted maximum support pressure at the top and the center of the tunnel versus the cover-to-diameter ratio. The recorded support pressure at the blowout incident position (C/D = 8.6/8.5) is also included in this figure for comparison purposes. As observed, the model proposed in the study is capable of accurately forecasting the blowout pressure with a close gap between the predicted and recorded blowout pressure at the site. The predicted pressures are 382 kPa and 352 kPa in comparison to the recorded pressure values at the site of 450 kPa and 405 kPa at the center and crown of the tunnel. Thus, the absolute errors in the predicted results are 68 kPa and 53 kPa at these two positions. The predicted values are around 85% of the recorded values for both the center and crown of the tunnel. The predicted blowout support pressure is conservative but still satisfactory for the tunneling process, with a safe margin.

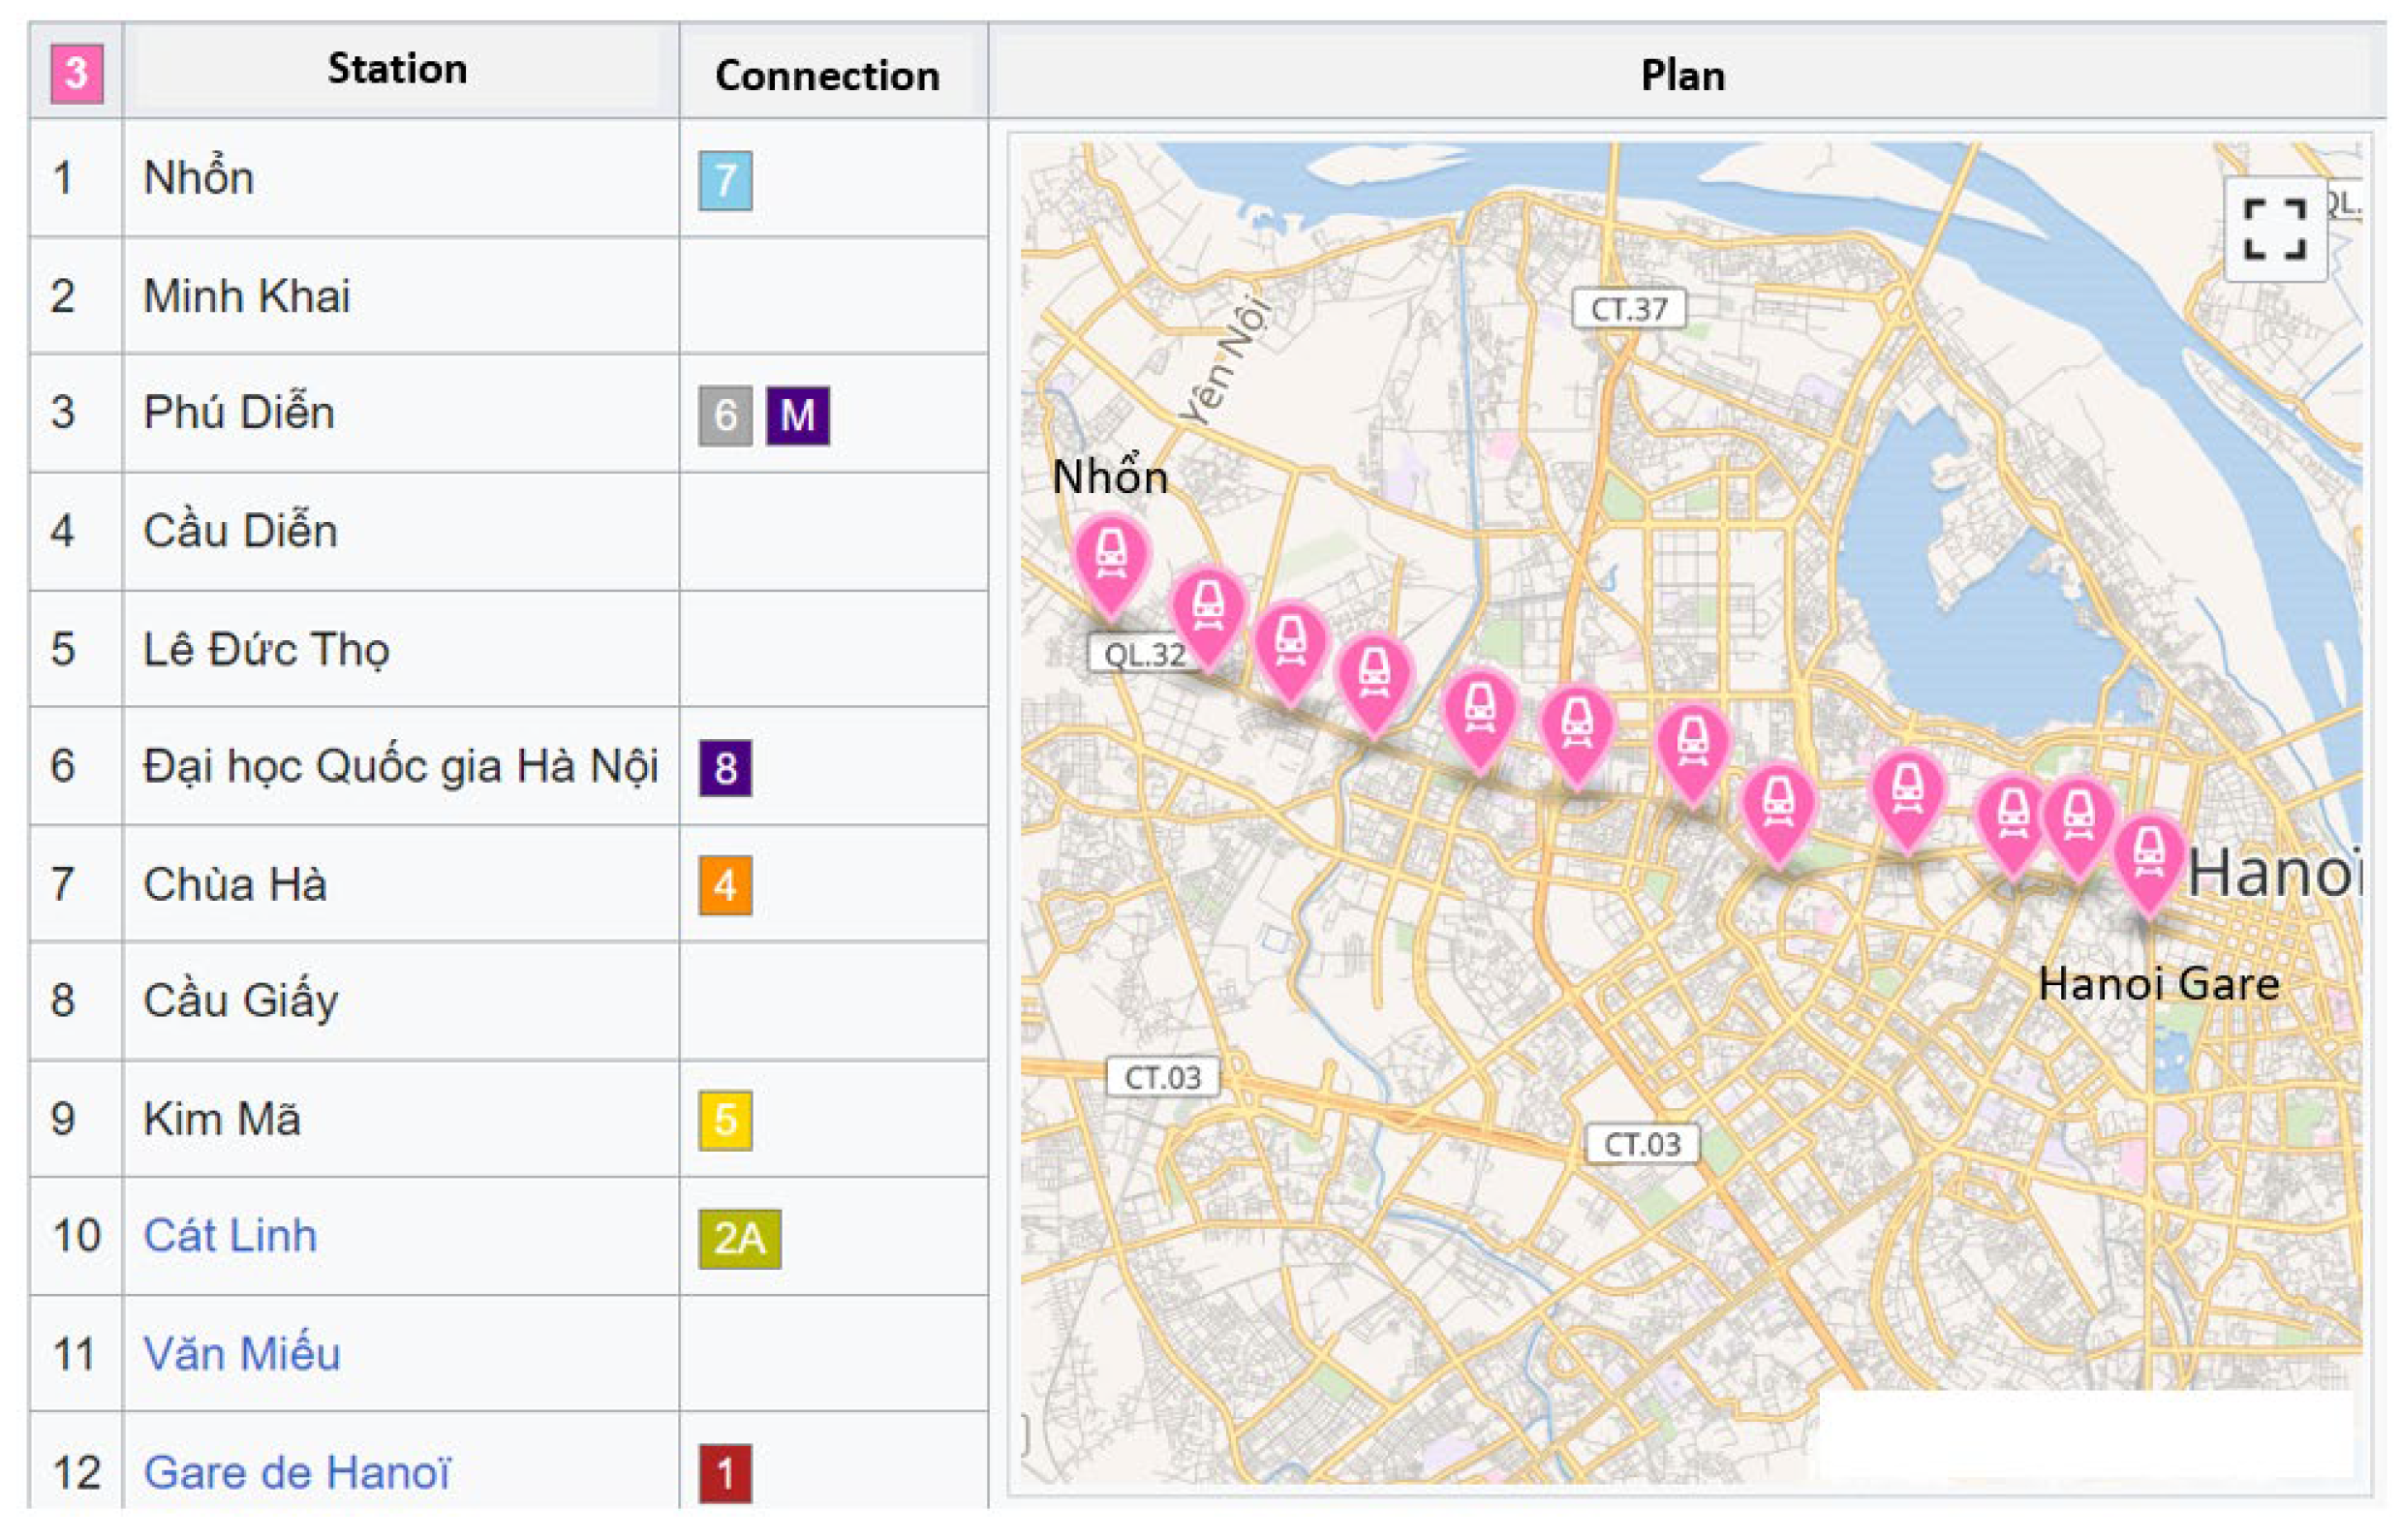
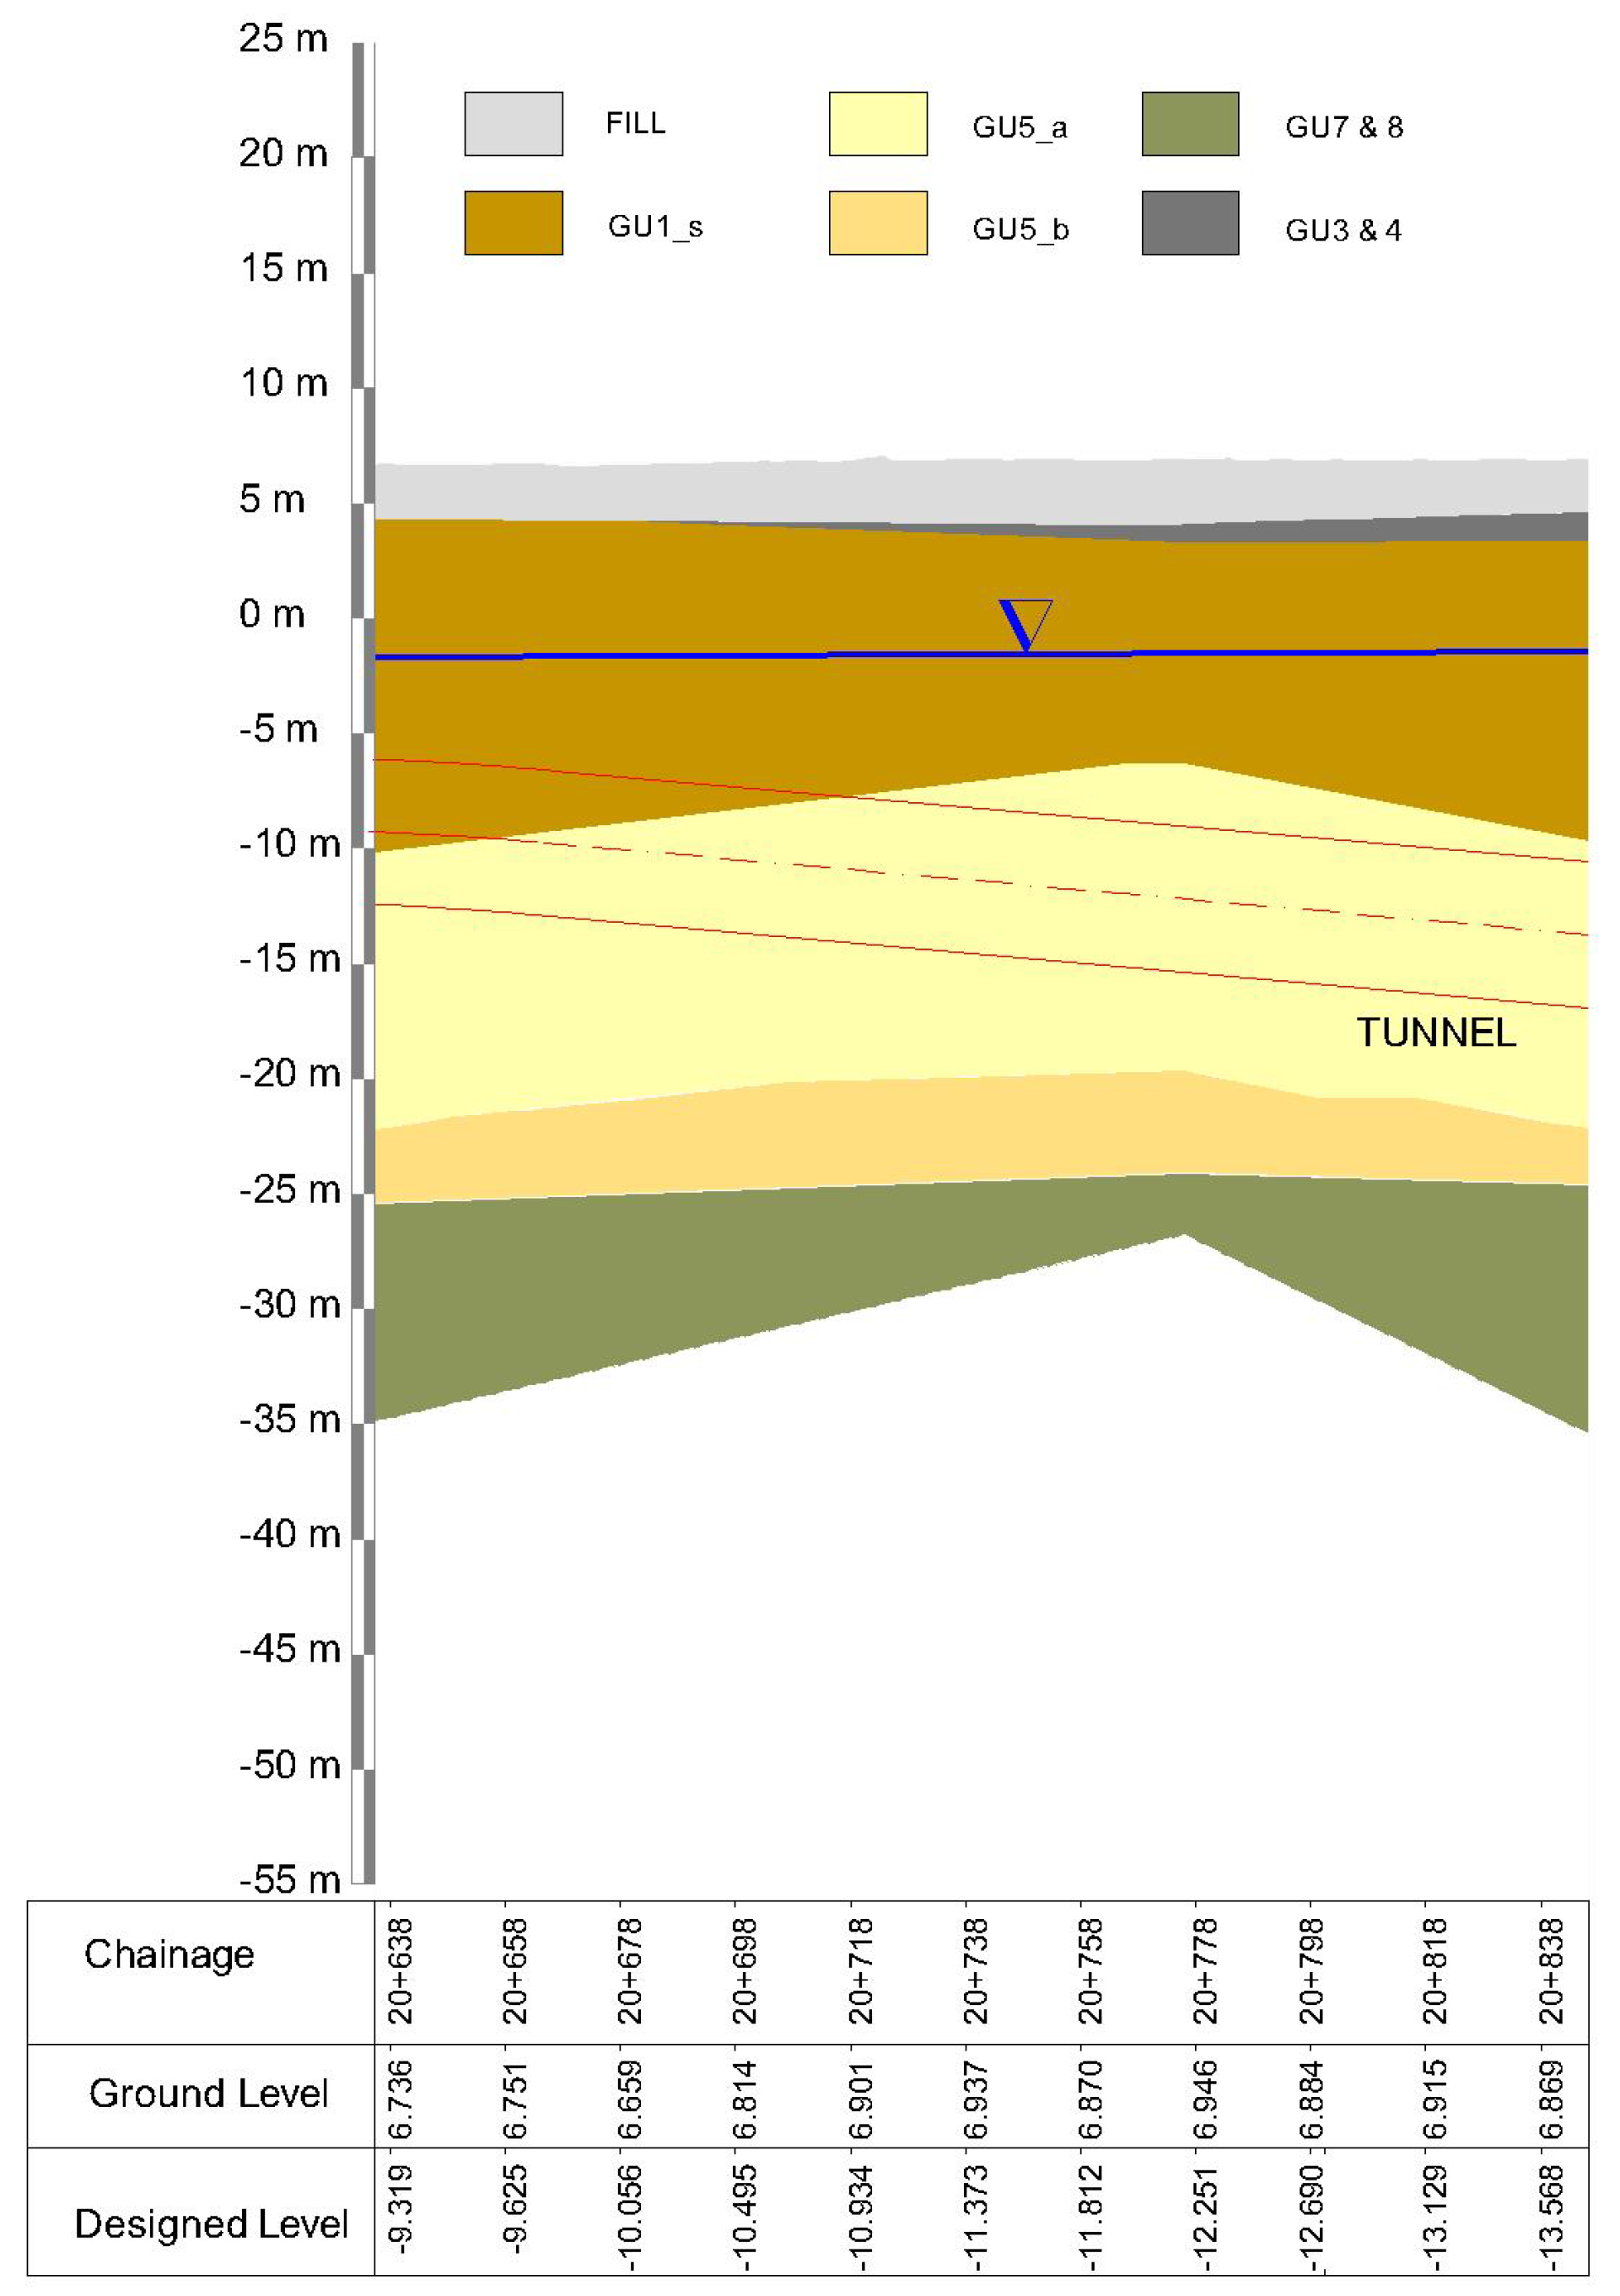
3. Application to the Hanoi Metro 3 Project

This section presents an application using the proposed model derived in the previous section to determine the maximum support pressure corresponding to the geotechnical condition of an underground segment within the Hanoi Metro 3 project. The maximum support pressure is determined for both real multi-layered soil data and the equivalent homogeneous soil. The comparison between them highlights the role of the multi-layer model compared to a one-layer model.
The Hanoi Metro Line 3 (also well-known as the Temple of Literature line) in Hanoi, Vietnam, is one of the Hanoi metro network projects. The Metro Line 3 will be the second line to be used and scheduled for completion in 2024. The length of Line 3 with 12 stations is 12.5 km, including an 8.5 km elevated section and a 4 km underground section (see Figure 10).
The underground segment between the two chainages Km 20 + 638 and Km 20 + 838 are considered in this study. Figure 11 displays the geological condition of this segment. It is observed that the tunnel is beneath two to four soil layers in the considered segments. The geotechnical properties of these four layers are given in Table 2. The water table is about 7.6–8.4 m under the ground surface. The cover varies along the tunnel and is considered in the calculation of the maximum support pressure.
Figure 12 shows the maximum support pressure predicted by the current model with real multi-layered soil data and equivalent homogeneous soil data. It is noted from Figure 11 that the overburden increases along the considered segment. The equivalent homogeneous soil model gives an increase in maximum support pressure when the cover increases. However, the multi-layer model predicts a constant maximum support pressure from Km 20 + 638 to Km 20 + 758, followed by an increase between Km 20 + 758 and Km 20 + 838. This is because of the change in the geological condition with the appearance of the GU3&4 layer, and the sand layer GU5 becomes larger. Between the two chainages Km 20 + 758 and Km 20 + 838, the difference between two support pressures resulting from the multi-layer and equivalent homogeneous soil model is about 100 kPa, i.e., about 20–25% of relative difference. The equivalent homogeneous model results in a higher support pressure than the multi-layer model. It means that the multi-layer model is more conservative than the equivalent homogeneous model. This comparison shows the necessity to consider a multi-layer model when predicting the maximum support pressure according to the passive failure of the tunneling face.

4. Conclusions

This study proposes a multi-layer model to predict the maximum support pressure exerted on the tunnel face, corresponding to the blowout (passive failure) when tunneling in a multi-layered soil. This model is derived by writing the equilibrium equation of the soil column above the tunnel in the plan passing through the tunnel face. The main novelties of this model in comparison to the recent limit equilibrium model proposed by Broere [3] consists of the multi-layered soil, the support pressure gradient, and the water table level. The current model is validated against the relevant blowout data of the Second Heinenoord Tunnel project (in the Netherlands).
The one-layer soil model is a particular case of the current multi-layer model, which is used to compute the maximum support pressure as a function of the cover-to-diameter ratio, the tunnel diameter, and the water table level for five representative soils (peat, organic clay, clay, clayed sand, and sand). This result should be useful for a preliminary design of a shallow tunnel within one soil layer.
The necessity of the multi-layer model is shown by applying the proposed model to an underground segment in the Hanoi Metro Line 3 project, where the tunnel is beneath two to four soil layers. A significant difference is shown between the support pressures resulting from real multi-layered soil data and equivalent homogeneous one-layer soil. This result highlights the importance of considering the real multi-layered soil data with a multi-layer blowout model for technical-economical optimization purposes.

Author Contributions

M.-N.V. (Minh-Ngan Vu): Conceptualization; methodology; software; validation; formal analysis; investigation; resources; data curation; writing—review and editing; visualization; project administration; funding acquisition. M.-N.V. (Minh-Ngoc Vu): Conceptualization; methodology; validation; formal analysis; investigation; resources; writing—original draft preparation, writing—review and editing; visualization; supervision. D.-T.P.: Conceptualization; methodology; validation; formal analysis; investigation; writing—review and editing; project administration. T.N.-S.: Conceptualization; methodology; writing—review and editing; visualization; supervision. Q.-B.N.: Conceptualization; methodology; validation; formal analysis; data curation; writing—review and editing. V.-D.D.: Conceptualization; methodology; validation; formal analysis; data curation; writing—review and editing. All authors have read and agreed to the published version of the manuscript.

Funding

This research was funded by the Ministry of Education and Training of Vietnam, Grant No. B2021-MDA-05.

Data Availability Statement

There is no data available to this manuscript.

Acknowledgments

The authors gratefully acknowledge the financial support from the Ministry of Education and Training of Vietnam.

Conflicts of Interest

The authors declare no conflict of interest.

References

  1. Anagnostou, G.; Kovári, K. Face stability condition with earth pressure balanced shields. Tunn. Undergr. Space Technol. 1994, 11, 165–173. [Google Scholar] [CrossRef]
  2. Jancsecz, S.; Steiner, W. Face support for a large mix-shield in heterogeneous ground conditions. In Proceedings of the 7th International Symposium Tunnelling’94, London, UK, 5–7 July 1994. [Google Scholar]
  3. Broere, W. Tunnel Face Stability and New CPT Applications. Ph.D. Thesis, Delft University of Technology, Delft, The Netherlands, 2001. [Google Scholar]
  4. Vu, M.N.; Broere, W.; Bosch, J.W. The impact of shallow cover on stability when tunnelling in soft soils. Tunn. Undergr. Space Technol. 2015, 50, 507–515. [Google Scholar] [CrossRef]
  5. Vu, M.N. Reducing the Cover-to-Diameter Ratio for Shallow Tunnels in Soft Soils. Ph.D. Thesis, Delft University of Technology, Delft, The Netherlands, 2016. [Google Scholar]
  6. Atkinson, J.H.; Potts, D.M. Stability of a shallow circular tunnel in cohesionless soils. Géotechnique 1977, 27, 203–215. [Google Scholar] [CrossRef]
  7. Leca, E.; Dormieux, L. Upper and lower bound solutions for the face stability of shallow circular tunnels in frictional material. Géotechnique 1990, 40, 581–606. [Google Scholar] [CrossRef]
  8. Subrin, D.; Wong, H. Tunnel face stability in frictional material: A new 3D failure mechanism. Comptes Rendus Mec. 2002, 330, 513–519. [Google Scholar] [CrossRef]
  9. Soubra, A.H.; Dias, D.; Emeriault, F.; Kastner, R. Three-dimensional face stability analysis of circular tunnels by a kinematical approach. In Proceedings of the GeoCongress 2008: Characterization, Monitoring, and Modeling of GeoSystems, New Orleans, Louisiana, 9–12 March 2008; pp. 894–901. [Google Scholar]
  10. Tang, X.W.; Liu, W.; Albers, B.; Savidis, S. Upper bound analysis of tunnel face stability in layered soils. Acta Geotech. 2014, 9, 661–671. [Google Scholar] [CrossRef]
  11. Mollon, G.; Dias, D.; Soubra, A.H. Rotational failure mechanisms for the face stability analysis of tunnels driven by pressurized shields. Int. J. Numer. Anal. Meth Geomech. 2011, 35, 1363–1388. [Google Scholar] [CrossRef]
  12. Han, K.H.; Zhang, C.P.; Zhang, D.L. Upper-bound solutions for the face stability of a shield tunnel in multilayered cohesive–frictional soils. Comput. Geotech. 2016, 79, 1–9. [Google Scholar] [CrossRef]
  13. Li, P.; Chen, K.; Wang, F.; Li, Z. An upper-bound analytical model of blow-out for a shallow tunnel in sand considering the partial failure within the face. Tunn. Undergr. Space Technol. 2019, 91, 102989. [Google Scholar] [CrossRef]
  14. Qarmout, M.; König, D.; Gussmann, P.; Thewes, M.; Schanz, T. Tunnel face stability analysis using Kinematical Element Method. Tunn. Undergr. Space Technol. 2019, 85, 354–367. [Google Scholar] [CrossRef]
  15. Sloan, S.W. Geotechnical stability analysis. Géotechnique 2013, 63, 531–571. [Google Scholar] [CrossRef]
  16. Zizka, Z.; Thewes, M. Recommendations for Face Support Pressure Calculations for Shield Tunnelling in Soft Ground; German Tunnelling Committee (ITA-AITES): Cologne, Germany, 2016. [Google Scholar]
  17. Vu, M.N.; Broere, W. A compact blowout model for shallow tunnelling in soft soils. Tunn. Undergr. Space Technol. 2023, 138, 105167. [Google Scholar] [CrossRef]
  18. Vu, M.N.; Broere, W.; Bosch, J. Volume loss in shallow tunnelling. Tunn. Undergr. Space Technol. 2016, 59, 77–90. [Google Scholar] [CrossRef]
  19. Berthoz, N.; Branque, D.; Subrin, D.; Wong, H.; Humbert, E. Face failure in homogeneous and stratified soft ground: Theoretical and experimental approaches on 1g EPBS reduced scale model. Tunn. Undergr. Space Technol. 2012, 30, 25–37. [Google Scholar] [CrossRef]
  20. Lu, X.L.; Wang, H.R.; Huang, M.S. Upper bound solution for the face stability of shield tunnel below the water table. Math. Probl. Eng. 2014, 2014, 727964. [Google Scholar] [CrossRef]
  21. Ibrahim, E.; Soubra, A.H.; Mollon, G.; Raphael, W.; Dias, D.; Reda, A. Three-dimensional face stability analysis of pressurized tunnels driven in a multilayered purely frictional medium. Tunn. Undergr. Space Technol. 2015, 49, 18–34. [Google Scholar] [CrossRef]
  22. Chen, R.P.; Li, J.; Kong, L.G.; Tang, L.J. Experimental study on face instability of shield tunnel in sand. Tunn. Undergr. Space Technol. 2013, 33, 12–21. [Google Scholar] [CrossRef]
  23. Senent, S.; Mollon, G.; Jimenez, R. Stability of tunnel face in rock masses with the Hoek-Brown failure criterion. Int. J. Rock. Mech. Min. Sci. 2013, 60, 440–451. [Google Scholar] [CrossRef]
  24. Senent, S.; Jimenez, R. A tunnel face failure mechanism for layered ground, considering the possibility of partial collapse. Tunn. Undergr. Space Technol. 2015, 47, 182–192. [Google Scholar] [CrossRef]
  25. Chen, R.P.; Tang, L.J.; Ling, D.S.; Chen, Y.M. Face stability analysis of shallow shield tunnels in dry sandy ground using the discrete element method. Comput. Geotech. 2011, 38, 187–195. [Google Scholar] [CrossRef]
  26. Zhang, Z.X.; Hu, X.Y.; Scott, K.D. A discrete numerical approach for modeling face stability in slurry shield tunnelling in soft soils. Comput. Geotech. 2011, 38, 94–104. [Google Scholar] [CrossRef]
  27. Guo, X.; Du, D.; Dias, D. Reliability analysis of tunnel lining considering soil spatial variability. Eng. Struct. 2019, 196, 109332. [Google Scholar] [CrossRef]
  28. Zhou, S.; Guo, X.; Zhang, Q.; Dias, D.; Pan, Q. Influence of a weak layer on the tunnel face stability–Reliability and sensitivity analysis. Comput. Geotech. 2020, 122, 103507. [Google Scholar] [CrossRef]
  29. Funatsu, T.; Hoshino, T.; Sawae, H.; Shimizu, N. Numerical analysis to better understand the mechanism of the effects of ground supports and reinforcement on the stability of tunnels using the distinct element method. Tunn. Undergr. Space Technol. 2018, 23, 561–573. [Google Scholar] [CrossRef]
  30. Bezuijen, A.; Brassinga, H.E. Blow-out pressures measured in a centrifuge model and in the field. In Tunnelling: A Decade of Progress: GeoDelft 1995–2005; CRC Press: Boca Raton, FL, USA, 2006; p. 143. [Google Scholar]
  31. Bezuijen, A.; Talmon, A. Processes around a TBM. In Geotechnical Aspects of Underground Construction in Soft Ground (IS-Shanghai 2008); Taylor Francis Group: Abingdon, UK, 2008; pp. 10–12. [Google Scholar]
  32. Bakker, K.J.; Leendertse, W.L.; Jovanovic, P.S.; Van Oosterhout, G.C. Monitoring: Evaluation of stresses in lining of the Second Heinenoord Tunnel. In Geotechnical Aspects of Underground Construction on Soft Ground; CRC Press: Boca Raton, FL, USA, 2000; pp. 197–202. [Google Scholar]
Figure 1. Blowout analysis for a shallow tunnel within multi-layered soils.
Buildings 13 01362 g001
Figure 2. Maximum support pressure at upper (left) and lower (right) parts as a function of C/D ratio for peat.
Buildings 13 01362 g002aBuildings 13 01362 g002b
Figure 3. Maximum support pressure at upper (left) and lower (right) parts as a function of C/D ratio for organic clay.
Buildings 13 01362 g003aBuildings 13 01362 g003b
Figure 4. Maximum support pressure at upper (left) and lower (right) parts as a function of C/D ratio for clay.
Buildings 13 01362 g004aBuildings 13 01362 g004b
Figure 5. Maximum support pressure at upper (left) and lower (right) parts as a function of C/D ratio for clayed sand.
Buildings 13 01362 g005aBuildings 13 01362 g005b
Figure 6. Maximum support pressure at upper (left) and lower (right) parts as a function of C/D ratio for sand.
Buildings 13 01362 g006aBuildings 13 01362 g006b
Figure 7. The blowout location in Second Heinenoord tunnel (reproduced from data described in Bezuijen and Brassinga [32]).
Buildings 13 01362 g007
Figure 8. The record of face support pressure at the center of the tunnel during the blowout incident (reproduced from data described in Bezuijen and Brassinga [32]).
Buildings 13 01362 g008
Figure 9. The record of face support pressure at the center of the tunnel during the blowout incident (Bezuijen and Brassinga [32]).
Buildings 13 01362 g009
Figure 10. Plan of the Hanoi Metro Line 3 (in Vietnam).
Buildings 13 01362 g010
Figure 11. Geological condition of the underground segment between two chainages Km 20 + 638 and Km 20 + 838.
Buildings 13 01362 g011
Figure 12. Predicted maximum support pressure resulting from the proposed model with real multi-layered soil data and equivalent homogeneous soil.
Buildings 13 01362 g012
Table 1. Properties of five considered soils.
Soil TypeUnit Weight
γ (kN/m3)
Cohesion
c (kPa)
Friction Angle
φ (°)
Coefficient
K (-)
Peat10.55200.65
Organic clay15.55200.65
Clay16.57330.5
Clayed Sand17.92350.4
Sand20-350.5
Table 2. Geotechnical properties of overburden soils of 200 m underground segment in Hanoi Metro Line 3 project.
LayerUnit Weight
γ (kN/m3)
Cohesion
c (kPa)
Friction Angle
φ (°)
Coefficient
K (-)
Fill19---
GU3 and 418.510250.58
GU1s165200.66
GU5a200340.44
GU5b20.50350.43
GU7 and 8210400.36
Disclaimer/Publisher’s Note: The statements, opinions and data contained in all publications are solely those of the individual author(s) and contributor(s) and not of MDPI and/or the editor(s). MDPI and/or the editor(s) disclaim responsibility for any injury to people or property resulting from any ideas, methods, instructions or products referred to in the content.

