
The Comparison of Code-Based and Empirical Seismic Fragility Curves of Steel and RC Buildings

Abstract
:1. Introduction
2. Building Typology and Damage Grades
3. Capacity Spectra
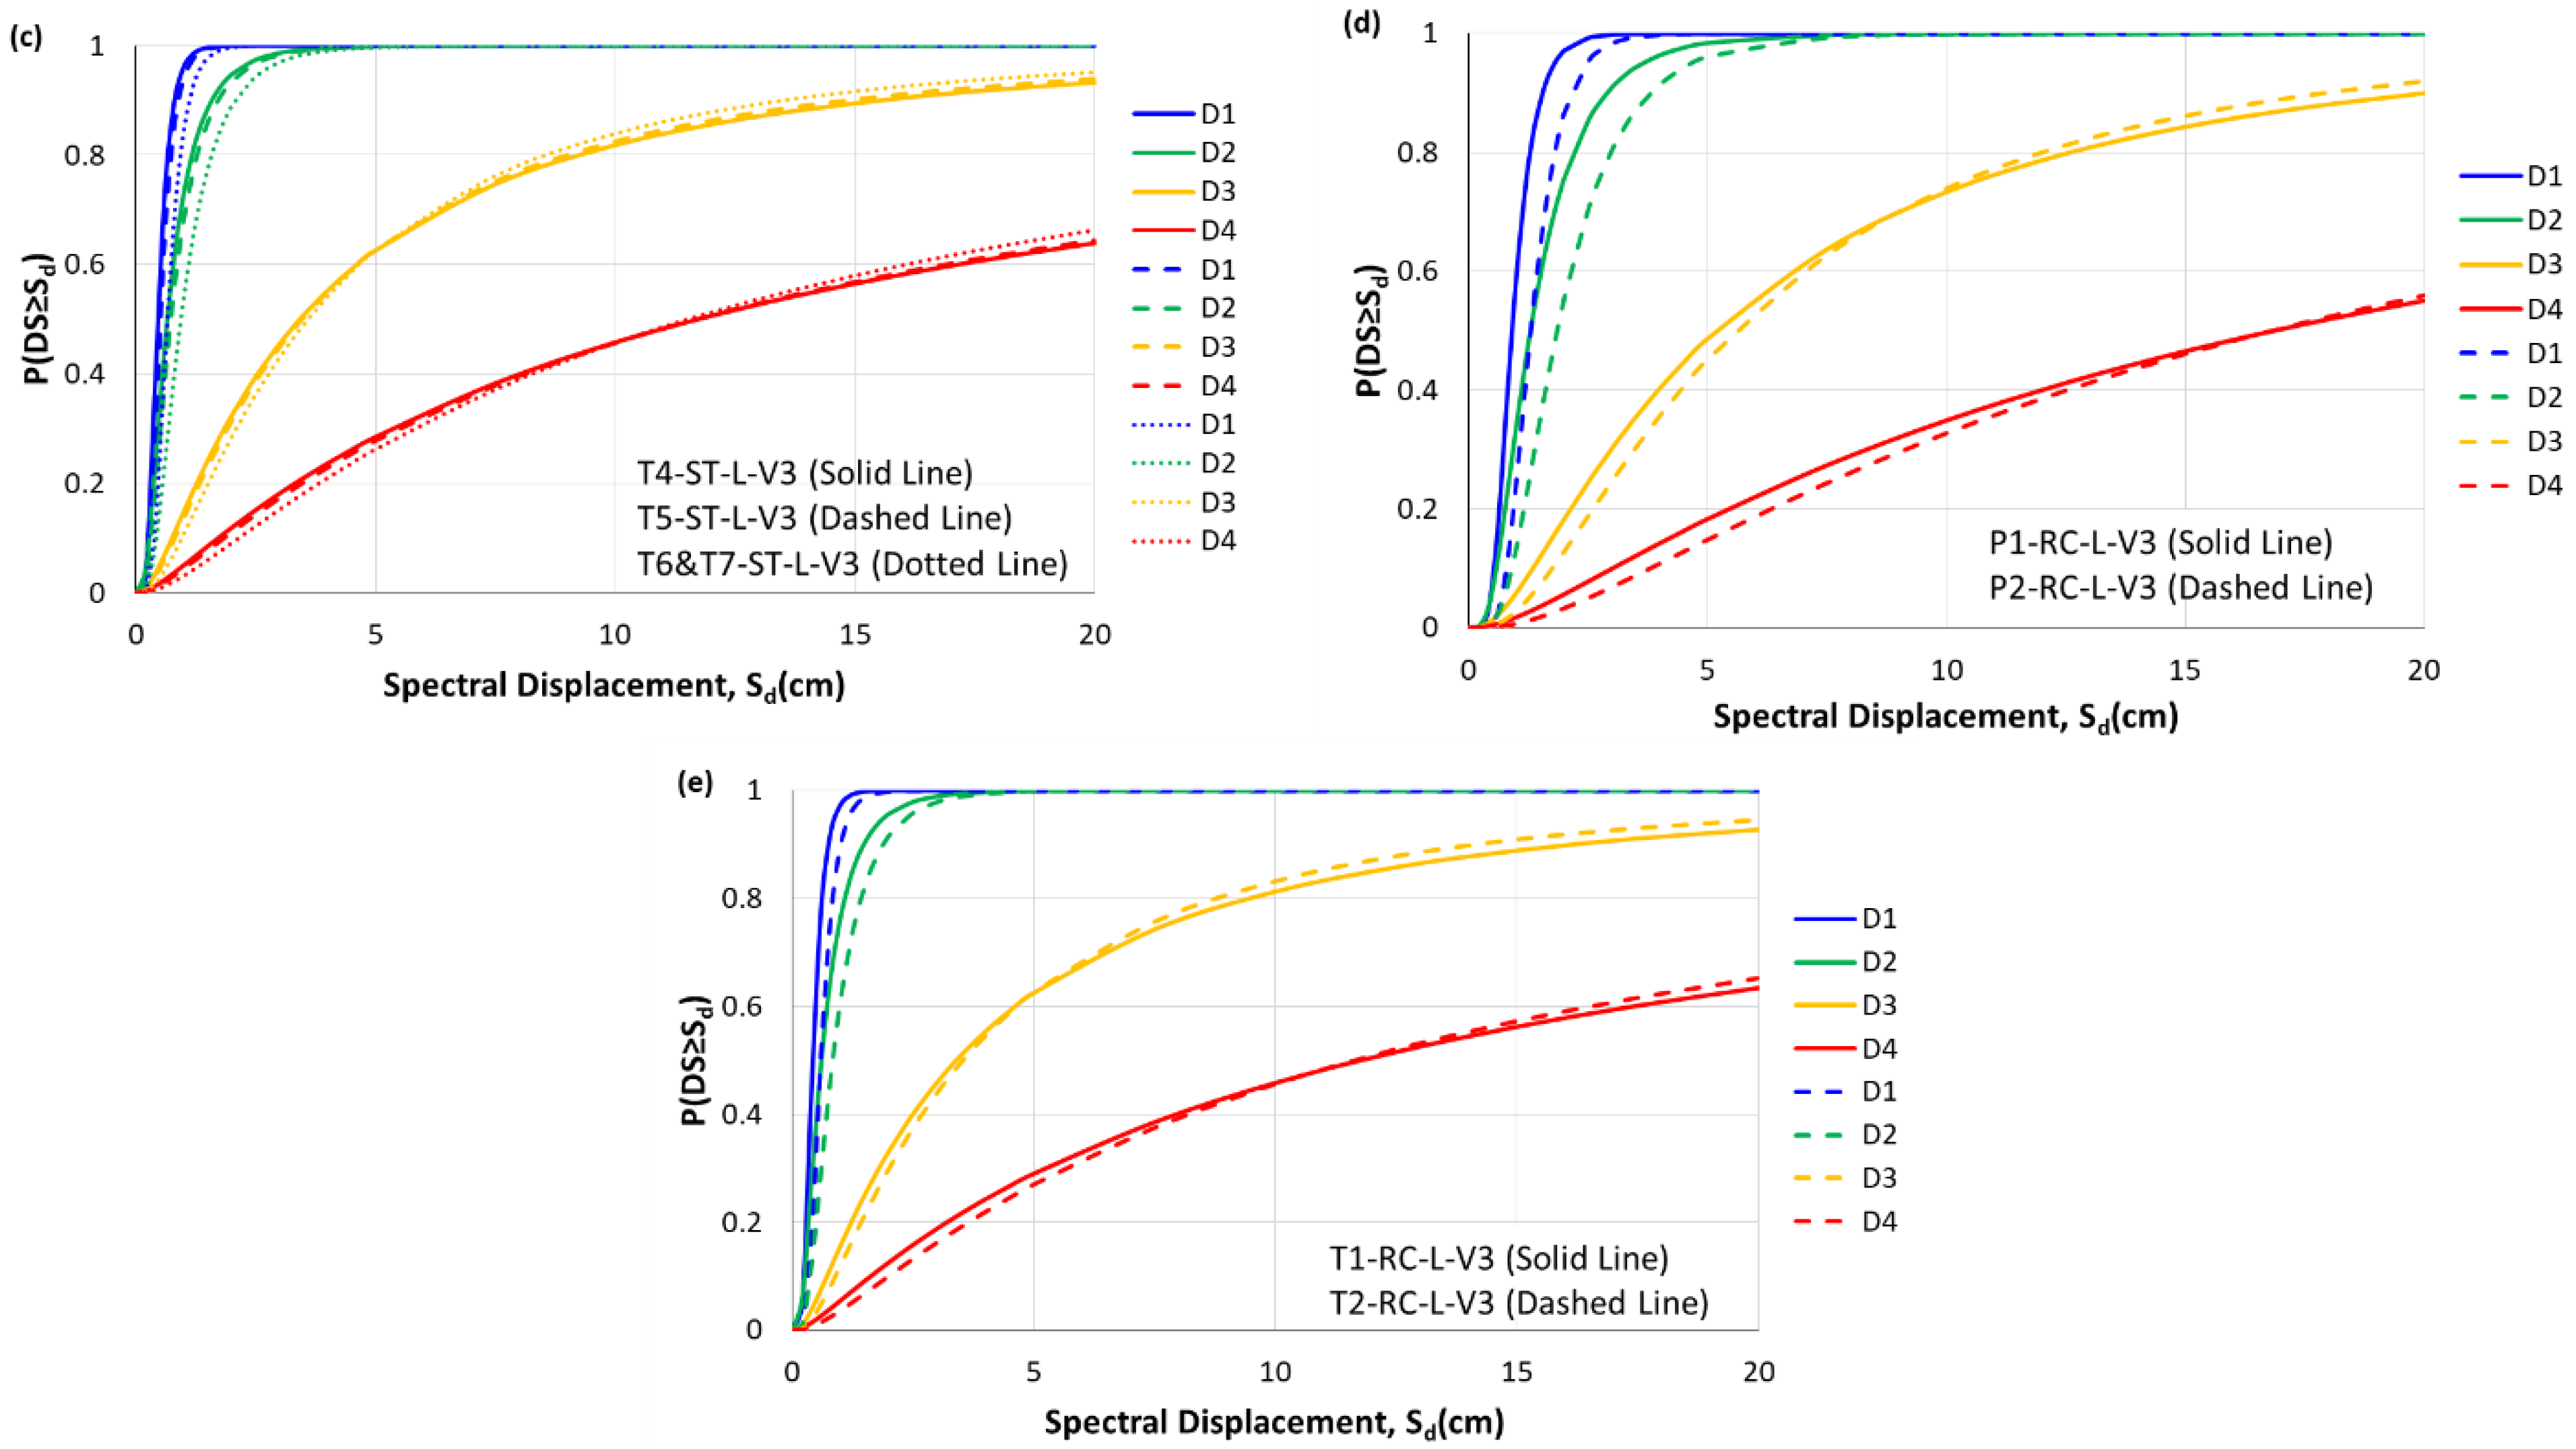
4. Fragility Curves
5. Comparison with Empirical Fragility Curves
6. Conclusions
Author Contributions
Funding
Data Availability Statement
Conflicts of Interest
References
- Karakas, C.C.; Palanci, M.; Senel, S.M. Fragility based evaluation of different code based assessment approaches for the performance estimation of existing buildings. Bull. Earthq. Eng. 2022, 20, 1685–1716. [Google Scholar] [CrossRef]
- Ministry of Public Works and Settlement of Turkey. TEC 2007, Specification for Buildings to be Built in Seismic Zones; Ministry of Public Works and Settlement of Turkey: Ankara, Turkey, 2007.
- Disaster and Emergency Management Presidency of Turkey. TBEC 2018, Turkey Earthquake Building Regulations; Disaster and Emergency Management Presidency of Turkey: Ankara, Turkey, 2018.
- CEN. Eurocode 8: Design of Structures for Earthquake Resistance—Part 3: Assessment and Retrofitting of Buildings; CEN: Brussels, Belgium, 2005. [Google Scholar]
- American Society of Civil Engineers. ASCE 41-17, Seismic Evaluation and Retrofit of Existing Buildings; American Society of Civil Engineers: Reston, VA, USA, 2017. [Google Scholar]
- Omidvar, B.; Gatmiri, B.; Derakhshan, S. Experimental vulnerability curves for the residential buildings of Iran. Nat. Hazards 2011, 60, 345–365. [Google Scholar] [CrossRef]
- Del Gaudio, C.; De Martino, G.; Di Ludovico, M.; Manfredi, G.; Prota, A.; Ricci, P.; Verderame, G.M. Empirical fragility curves from damage data on RC buildings after the 2009 L’Aquila earthquake. Bull. Earthq. Eng. 2017, 15, 1425–1450. [Google Scholar] [CrossRef]
- Gautam, D.; Fabbrocino, G.; de Magistris, F.S. Derive empirical fragility functions for Nepali residential buildings. Eng. Struct. 2018, 171, 617–628. [Google Scholar] [CrossRef]
- Biglari, M.; Formisano, A.; Hashemi, B.H. Empirical fragility curves of engineered steel and RC residential buildings after Mw 7.3 2017 Sarpol-e-zahab earthquake. Bull. Earthq. Eng. 2021, 19, 2671–2689. [Google Scholar] [CrossRef]
- Biglari, M.; Formisano, A. Urban seismic scenario-based risk analysis using empirical fragility curves for Kerendegharb after Mw 7.3, 2017 Iran earthquake. Bull. Earthq. Eng. 2022, 20, 6487–6503. [Google Scholar] [CrossRef]
- Vamvatsikos, D.; Cornell, C.A. Incremental dynamic analysis. Earthq. Eng. Struct. Dyn. 2001, 31, 491–514. [Google Scholar] [CrossRef]
- Réveillère, A.; Gehl, P.; Seyedi, D.; Modaressi, H. Development of seismic fragility curves for damaged reinforced concrete structures. In Proceedings of the 15th World Conference on Earthquake Engineering, Lisboa, Portugal, 24–28 September 2012; p. 999. [Google Scholar]
- Cao, X.-Y.; Feng, D.-C.; Li, Y. Assessment of various seismic fragility analysis approaches for structures excited by non-stationary stochastic ground motions. Mech. Syst. Signal Process. 2023, 186, 109838. [Google Scholar] [CrossRef]
- Cao, X.-Y.; Feng, D.-C.; Beer, M. Consistent seismic hazard and fragility analysis considering combined capacity-demand uncertainties via probability density evolution method. Struct. Saf. 2023, 103, 102330. [Google Scholar] [CrossRef]
- Kappos, A.J.; Panagopoulos, G.; Panagiotopoulos, C.; Penelis, G. A hybrid method for the vulnerability assessment of R/C and URM buildings. Bull. Earthq. Eng. 2006, 4, 391–413. [Google Scholar] [CrossRef]
- D’Ayala, D.; Meslem, A.; Vamvatsikos, D.; Porter, K.; Rossetto, T.; Crowley, H.; Silva, V. Guidelines for Analytical Vulnerability Assessment of Low-Mid-Rise Buildings—Methodology; Vulnerability Global Component Project; GEM Foundation: Pavia, Italy, 2014. [Google Scholar]
- Simoncelli, M.; Aloisio, A.; Zucca, M.; Venturi, G.; Alaggio, R. Intensity and location of corrosion on the reliability of a steel bridge. J. Constr. Steel Res. 2023, 206, 107937. [Google Scholar] [CrossRef]
- Suzuki, A.; Iervolino, I. Seismic Fragility of Code-conforming Italian Buildings Based on SDoF Approximation. J. Earthq. Eng. 2019, 25, 2873–2907. [Google Scholar] [CrossRef]
- Applied Technology Council (ATC). Earthquake Damage Evaluation Data for California, ATC-13; Applied Technology Council (ATC): Redwood, CA, USA, 1985. [Google Scholar]
- Milutinovic, Z.V.; Trendafiloski, G.S. RISK-UE. An Advanced Approach to Earthquake Risk Scenarios with Applications to Different European Towns; WP4: Vulnerability of Current Buildings; European Commission: Brussels, Belgium, 2004. [Google Scholar]
- International Conference of Building Officials (ICBO). Uniform Building Code; International Conference of Building Officials (ICBO): Whittier, CA, USA, 1994. [Google Scholar]
- Building and Housing Research Center. IRSt2800, Iranian Code of Practice for Seismic Resistant Design of Buildings, 3rd ed.; Building and Housing Research Center: Tehran, Iran, 2005. [Google Scholar]
- Building and Housing Research Center. IRSt2800, Iranian Code of Practice for Seismic Resistant Design of Buildings, 4th ed.; Building and Housing Research Center: Tehran, Iran, 2014. [Google Scholar]
- FEMA/NIBS. HAZUS—Earthquake Loss Estimation Methodology; Department of Homeland Security Federal Emergency Management Agency Mitigation Division: Washington, DC, USA, 1998; Volume 1. [Google Scholar]
- Fajfar, P. Capacity spectrum method based on inelastic demand spectra. Earthq. Eng. Struct. Dyn. 1999, 28, 979–993. [Google Scholar] [CrossRef]
- Freeman, S.A. Development and use of capacity spectrum method. In Proceedings of the 6th US National Conference on Earthquake Engineering, Seattle, WA, USA, 31 May–4 June 1998. [Google Scholar]
- Milutinovic, Z.V.; Trendafiloski, G.S. WP4: Level 2 Methodology—Code Based Approach, Case Study: Aseismic Design Codes in Macedonia; RISK-UE WP4 L2 Report; IZIIS: Skopje, North Macedonia, 2002. [Google Scholar]
- Vidic, T.; Fajfar, P.; Fischinger, M. Consistent inelastic design spectra: Strength and displacement. Earthq. Eng. Struct. Dyn. 1994, 23, 507–521. [Google Scholar] [CrossRef]
- Fajfar, P. A nonlinear analysis method for performance-based seismic design. Earthq. Spectra 2000, 16, 573–592. [Google Scholar] [CrossRef]
- Mahaney, J.A.; Paret, T.F.; Kehoe, B.E.; Freeman, S.A. The capacity spectrum method for evaluating structural response during the Loma Prieta earthquake. In Proceedings of the 1993 National Earthquake Conference, Memphis, TN, USA, 2–5 May 1993. [Google Scholar]
- Department of Homeland Security, FEMA. Multi-Hazard Loss Estimation Methodology: Earthquake Model; Technical Report; Department of Homeland Security, FEMA: Washington, DC, USA, 2003.
- Palanci, M.; Kalkan, A.; Sene, S.M. Investigation of shear effects on the capacity and demand estimation of RC buildings. Struct. Eng. Mech. 2016, 60, 1021–1038. [Google Scholar] [CrossRef]


| Main Type | Description | Height | No. of Stories | Type Name | |
|---|---|---|---|---|---|
| Steel (ST) | Braced frames | Eccentrically (EBF) | Low-rise (L) | 3 | B5-ST-L-V3 |
| Mid-rise (M) | 6 | B5-ST-M-V3 | |||
| Concentrically (CBF) | Low-rise (L) | 3 | B6-ST-L-V3 | ||
| Mid-rise (M) | 6 | B6-ST-M-V3 | |||
| Moment-resisting frame | Special (SMF) | Low-rise (L) | 3 | P4-ST-L-V3 | |
| Mid-rise (M) | 6 | P4-ST-M-V3 | |||
| Intermediate (IMF) | Low-rise (L) | 3 | P5-ST-L-V3 | ||
| Mid-rise (M) | 6 | P5-ST-M-V3 | |||
| Combination of moment-resisting frame and braced frame | SMF + EBF | Low-rise (L) | 3 | T4-ST-L-V3 | |
| Mid-rise (M) | 6 | T4-ST-M-V3 | |||
| SMF + CBF | Low-rise (L) | 3 | T5-ST-L-V3 | ||
| Mid-rise (M) | 6 | T5-ST-M-V3 | |||
| IMF + EBF | Low-rise (L) | 3 | T6-ST-L-V3 | ||
| Mid-rise (M) | 6 | T6-ST-M-V3 | |||
| IMF + CBF | Low-rise (L) | 3 | T7-ST-L-V3 | ||
| Mid-rise (M) | 6 | T7-ST-M-V3 | |||
| Reinforced concrete (RC) | Moment-resisting frame | Special (SMF) | Low-rise (L) | 3 | P1-RC-L-V3 |
| Mid-rise (M) | 6 | P1-RC-M-V3 | |||
| Intermediate (IMF) | Low-rise (L) | 3 | P2-RC-L-V3 | ||
| Mid-rise (M) | 6 | P2-RC-M-V3 | |||
| Combination of moment-resisting frame and RC shear wall | SMF + Special shear walls | Low-rise (L) | 3 | T1-RC-L-V3 | |
| Mid-rise (M) | 6 | T1-RC-M-V3 | |||
| IMF + Intermediate shear walls | Low-rise (L) | 3 | T2-RC-L-V3 | ||
| Mid-rise (M) | 6 | T2-RC-M-V3 | |||
| Main Type | Description | Height | No. of Stories | Type Name | |
|---|---|---|---|---|---|
| Steel (ST) | Braced frames | Eccentrically (EBF) | Low-rise (L) | 3 | B5-ST-L-V4 |
| Mid-rise (M) | 6 | B5-ST-M-V4 | |||
| Concentrically (CBF) | Low-rise (L) | 3 | B8-ST-L-V4 | ||
| Mid-rise (M) | 6 | B8-ST-M-V4 | |||
| Moment-resisting frame | Special (SMF) | Low-rise (L) | 3 | P4-ST-L-V4 | |
| Mid-rise (M) | 6 | P4-ST-M-V4 | |||
| Intermediate (IMF) | Low-rise (L) | 3 | P5-ST-L-V4 | ||
| Mid-rise (M) | 6 | P5-ST-M-V4 | |||
| Combination of moment-resisting frame and braced frame | SMF + EBF | Low-rise (L) | 3 | T5-ST-L-V4 | |
| Mid-rise (M) | 6 | T5-ST-M-V4 | |||
| IMF + EBF | Low-rise (L) | 3 | T6-ST-L-V4 | ||
| Mid-rise (M) | 6 | T6-ST-M-V4 | |||
| SMF + CBF | Low-rise (L) | 3 | T7-ST-L-V4 | ||
| Mid-rise (M) | 6 | T7-ST-M-V4 | |||
| IMF + CBF | Low-rise (L) | 3 | T8-ST-L-V4 | ||
| Mid-rise (M) | 6 | T8-ST-M-V4 | |||
| Reinforced concrete (RC) | Moment-resisting frame | Special (SMF) | Low-rise (L) | 3 | P1-RC-L-V4 |
| Mid-rise (M) | 6 | P1-RC-M-V4 | |||
| Intermediate (IMF) | Low-rise (L) | 3 | P2-RC-L-V4 | ||
| Mid-rise (M) | 6 | P2-RC-M-V4 | |||
| Combination of moment-resisting frame and RC shear wall | SMF + Special shear walls | Low-rise (L) | 3 | T1-RC-L-V4 | |
| Mid-rise (M) | 6 | T1-RC-M-V4 | |||
| IMF + Special shear walls | Low-rise (L) | 3 | T2-RC-L-V4 | ||
| Mid-rise (M) | 6 | T2-RC-M-V4 | |||
| IMF + Intermediate shear walls | Low-rise (L) | 3 | T3-RC-L-V4 | ||
| Mid-rise (M) | 6 | T3-RC-M-V4 | |||
| Damage Grade | Damage Grade Label | Structural Damage | Non-Structural Damage | Description |
|---|---|---|---|---|
| None | D0 | No | No | No |
| Minor | D1 | No | Slight | Fine cracks in plaster over frame members or in walls at the base. Fine cracks in partitions and infills. |
| Moderate | D2 | Slight | Moderate | Cracks in columns and beams of frames and structural walls. Cracks in partition and infill walls; fall of brittle cladding and plaster. Falling mortar from the joints of wall panels. |
| Severe | D3 | Moderate | Heavy | Cracks in columns and beam–column joints of frames at the base and joints of coupled walls. Spilling of concrete cover, buckling of reinforced rods. Large cracks in partition and infill walls, failure of individual infill panels. |
| Collapse | D4 | Heavy and very heavy | Very heavy and total collapse | Large cracks in structural elements with compression failure of concrete and fracture of rebars; bond failure of beam-reinforced bars; tilting of columns. The collapse of either a few columns or a single upper floor. The collapse of the ground floor or parts (e.g., wings) of buildings. |
| Typology | V3 | V4 | |||
|---|---|---|---|---|---|
| T (s) | R | T (s) | R | ||
| Steel | EBF | 7 | 7 | ||
| CBF | 6 | 5.5 | |||
| SMF | 10 | 7.5 | |||
| IMF | 7 | 5 | |||
| SMF + EBF | 10 | 7.5 | |||
| SMF + CBF | 9 | 7 | |||
| IMF + EBF | 7 | 6 | |||
| IMF + CBF | 7 | 6 | |||
| Reinforced concrete | SMF | 10 | 7.5 | ||
| IMF | 7 | 5 | |||
| SMF + Special shear walls | 11 | 7.5 | |||
| IMF + Special shear walls | - | 6.5 | |||
| IMF + Intermediate shear walls | 8 | 6 | |||
| Building Typology | Yield Point | Ultimate Point | ||
|---|---|---|---|---|
| Sdy (cm) | Say (cm/s2) | Sdu (cm) | Sau (cm/s2) | |
| B5-ST-L-V3 | 0.94 | 549.36 | 11.54 | 659.23 |
| B6-ST-L-V3 | 1.10 | 640.92 | 11.44 | 769.10 |
| P4-ST-L-V3 | 1.68 | 384.55 | 20.20 | 461.46 |
| P5-ST-L-V3 | 2.40 | 549.36 | 20.20 | 659.23 |
| T4-ST-L-V3 | 0.66 | 384.55 | 11.72 | 461.46 |
| T5-ST-L-V3 | 0.73 | 427.28 | 11.67 | 512.74 |
| T6&T7-ST-L-V3 | 0.94 | 549.36 | 11.54 | 659.23 |
| P1-RC-L-V3 | 1.29 | 384.55 | 16.85 | 461.46 |
| P2-RC-L-V3 | 1.84 | 549.36 | 16.79 | 659.23 |
| T1-RC-L-V3 | 0.60 | 349.59 | 11.76 | 419.51 |
| T2-RC-L-V3 | 0.82 | 480.69 | 11.61 | 576.83 |
| B5-ST-M-V3 | 2.66 | 549.36 | 22.32 | 659.23 |
| B6-ST-M-V3 | 3.10 | 640.92 | 22.32 | 769.10 |
| P4-ST-M-V3 | 3.28 | 265.03 | 39.37 | 318.04 |
| P5-ST-M-V3 | 4.69 | 378.62 | 39.37 | 454.34 |
| T4-ST-M-V3 | 1.86 | 384.55 | 22.32 | 461.46 |
| T5-ST-M-V3 | 2.07 | 427.28 | 22.32 | 512.74 |
| T6&T7-ST-M-V3 | 2.66 | 549.36 | 22.32 | 659.23 |
| P1-RC-M-V3 | 2.75 | 289.71 | 32.95 | 347.65 |
| P2-RC-M-V3 | 3.92 | 413.87 | 32.95 | 496.64 |
| T1-RC-M-V3 | 1.79 | 369.29 | 23.57 | 443.15 |
| T2-RC-M-V3 | 2.46 | 507.77 | 23.57 | 609.32 |
| Building Typology | Yield Point | Ultimate Point | ||
|---|---|---|---|---|
| Sdy (cm) | Say (g) | Sdu (cm) | Sau (g) | |
| B5-ST-L-V4 | 0.48 | 280.29 | 5.89 | 336.34 |
| B8-ST-L-V4 | 0.61 | 356.73 | 5.80 | 428.07 |
| P4-ST-L-V4 | 1.72 | 392.40 | 15.46 | 470.88 |
| P5-ST-L-V4 | 2.58 | 588.60 | 15.46 | 706.32 |
| T5-ST-L-V4 | 0.56 | 327.00 | 7.38 | 392.40 |
| T7-ST-L-V4 | 0.60 | 350.36 | 7.36 | 420.43 |
| T6&T8-ST-L-V4 | 0.70 | 408.75 | 7.29 | 490.50 |
| P1-RC-L-V4 | 1.30 | 392.40 | 12.76 | 470.88 |
| P2-RC-L-V4 | 1.94 | 588.60 | 12.67 | 706.32 |
| T1-RC-L-V4 | 0.59 | 345.42 | 7.80 | 414.51 |
| T2-RC-L-V4 | 0.68 | 398.56 | 7.74 | 478.28 |
| T3-RC-L-V4 | 0.74 | 431.78 | 7.71 | 518.13 |
| B5-ST-M-V4 | 1.35 | 280.29 | 11.39 | 336.34 |
| B8-ST-M-V4 | 1.72 | 356.73 | 11.39 | 428.07 |
| P4-ST-M-V4 | 2.78 | 224.51 | 25.02 | 269.42 |
| P5-ST-M-V4 | 4.17 | 336.77 | 25.02 | 404.13 |
| T5-ST-M-V4 | 1.58 | 327.00 | 14.23 | 392.40 |
| T7-ST-M-V4 | 1.69 | 350.36 | 14.23 | 420.43 |
| T6&T8-ST-M-V4 | 1.98 | 408.75 | 14.23 | 490.50 |
| P1-RC-M-V4 | 2.68 | 232.85 | 24.12 | 279.42 |
| P2-RC-M-V4 | 4.02 | 349.27 | 24.12 | 419.13 |
| T1-RC-M-V4 | 1.67 | 345.42 | 15.03 | 414.51 |
| T2-RC-M-V4 | 1.93 | 398.56 | 15.03 | 478.28 |
| T3-RC-M-V4 | 1.97 | 408.21 | 14.21 | 489.85 |
| Building Properties | Spectral Displacements, Sd (cm) | ||||||||
|---|---|---|---|---|---|---|---|---|---|
| Typology | Height (m) | D1 | D2 | D3 | D4 | ||||
| Median | Beta | Median | Beta | Median | Beta | Median | Beta | ||
| B5-ST-L-V3 | 9 | 0.66 | 0.41 | 0.94 | 0.62 | 3.59 | 1.03 | 11.54 | 1.31 |
| B6-ST-L-V3 | 0.77 | 0.40 | 1.10 | 0.59 | 3.68 | 0.96 | 11.44 | 1.23 | |
| P4-ST-L-V3 | 1.18 | 0.41 | 1.68 | 0.61 | 6.31 | 1.02 | 20.20 | 1.30 | |
| P5-ST-L-V3 | 1.68 | 0.39 | 2.40 | 0.55 | 6.85 | 0.88 | 20.20 | 1.12 | |
| T4-ST-L-V3 | 0.46 | 0.44 | 0.66 | 0.69 | 3.42 | 1.18 | 11.72 | 1.50 | |
| T5-ST-L-V3 | 0.51 | 0.43 | 0.73 | 0.67 | 3.47 | 1.14 | 11.67 | 1.44 | |
| T6&T7-ST-L-V3 | 0.66 | 0.41 | 0.94 | 0.62 | 3.59 | 1.03 | 11.54 | 1.31 | |
| P1-RC-L-V3 | 0.90 | 0.42 | 1.29 | 0.63 | 5.18 | 1.05 | 16.85 | 1.34 | |
| P2-RC-L-V3 | 1.29 | 0.39 | 1.84 | 0.56 | 5.58 | 0.91 | 16.79 | 1.16 | |
| T1-RC-L-V3 | 0.42 | 0.45 | 0.60 | 0.70 | 3.39 | 1.22 | 11.76 | 1.55 | |
| T2-RC-L-V3 | 0.57 | 0.42 | 0.82 | 0.64 | 3.52 | 1.09 | 11.61 | 1.38 | |
| B5-ST-M-V3 | 18 | 1.86 | 0.39 | 2.66 | 0.55 | 7.57 | 0.88 | 22.31 | 1.12 |
| B6-ST-M-V3 | 2.17 | 0.37 | 3.10 | 0.52 | 7.90 | 0.82 | 22.32 | 1.05 | |
| P4-ST-M-V3 | 2.30 | 0.41 | 3.28 | 0.61 | 12.30 | 1.02 | 39.37 | 1.30 | |
| P5-ST-M-V3 | 3.28 | 0.39 | 4.69 | 0.55 | 13.36 | 0.88 | 39.37 | 1.12 | |
| T4-ST-M-V3 | 1.30 | 0.41 | 1.86 | 0.61 | 6.97 | 1.02 | 22.32 | 1.30 | |
| T5-ST-M-V3 | 1.45 | 0.40 | 2.07 | 0.59 | 7.13 | 0.98 | 22.32 | 1.25 | |
| T6&T7-ST-M-V3 | 1.86 | 0.39 | 2.66 | 0.55 | 7.57 | 0.88 | 22.32 | 1.12 | |
| P1-RC-M-V3 | 1.92 | 0.41 | 2.75 | 0.61 | 10.30 | 1.02 | 32.95 | 1.30 | |
| P2-RC-M-V3 | 2.75 | 0.39 | 3.92 | 0.55 | 11.18 | 0.88 | 32.95 | 1.12 | |
| T1-RC-M-V3 | 1.25 | 0.42 | 1.79 | 0.63 | 7.23 | 1.06 | 23.57 | 1.35 | |
| T2-RC-M-V3 | 1.72 | 0.40 | 2.45 | 0.57 | 7.73 | 0.93 | 23.57 | 1.19 | |
| Building Properties | Spectral Displacements, Sd (cm) | ||||||||
|---|---|---|---|---|---|---|---|---|---|
| Typology | Height (m) | D1 | D2 | D3 | D4 | ||||
| Median | Beta | Median | Beta | Median | Beta | Median | Beta | ||
| B5-ST-L-V4 | 9 | 0.33 | 0.41 | 0.48 | 0.62 | 1.83 | 1.03 | 5.89 | 1.31 |
| B8-ST-L-V4 | 0.43 | 0.39 | 0.618 | 0.57 | 1.91 | 0.93 | 5.80 | 1.18 | |
| P4-ST-L-V4 | 1.20 | 0.39 | 1.72 | 0.56 | 5.15 | 0.91 | 15.46 | 1.16 | |
| P5-ST-L-V4 | 1.80 | 0.36 | 2.58 | 0.49 | 5.80 | 0.74 | 15.46 | 0.95 | |
| T5-ST-L-V4 | 0.39 | 0.42 | 0.56 | 0.63 | 2.27 | 1.06 | 7.38 | 1.35 | |
| T7-ST-L-V4 | 0.42 | 0.41 | 0.60 | 0.62 | 2.29 | 1.03 | 7.36 | 1.31 | |
| T6&T8-ST-L-V4 | 0.49 | 0.40 | 0.70 | 0.59 | 2.35 | 0.96 | 7.29 | 1.23 | |
| P1-RC-L-V4 | 0.91 | 0.40 | 1.30 | 0.58 | 4.16 | 0.94 | 12.76 | 1.20 | |
| P2-RC-L-V4 | 1.36 | 0.37 | 1.94 | 0.50 | 4.63 | 0.78 | 12.67 | 1.00 | |
| T1-RC-L-V4 | 0.41 | 0.42 | 0.59 | 0.63 | 2.39 | 1.06 | 7.80 | 1.35 | |
| T2-RC-L-V4 | 0.48 | 0.41 | 0.68 | 0.60 | 2.45 | 1.00 | 7.74 | 1.27 | |
| T3-RC-L-V4 | 0.52 | 0.40 | 0.74 | 0.59 | 2.48 | 0.96 | 7.71 | 1.23 | |
| B5-ST-M-V4 | 18 | 0.95 | 0.39 | 1.35 | 0.55 | 3.86 | 0.88 | 11.39 | 1.12 |
| B8-ST-M-V4 | 1.21 | 0.37 | 1.72 | 0.51 | 4.14 | 0.78 | 11.39 | 1.00 | |
| P4-ST-M-V4 | 1.95 | 0.39 | 2.78 | 0.56 | 8.34 | 0.91 | 25.01 | 1.16 | |
| P5-ST-M-V4 | 2.92 | 0.36 | 4.17 | 0.49 | 9.38 | 0.74 | 25.02 | 0.95 | |
| T5-ST-M-V4 | 1.11 | 0.39 | 1.58 | 0.56 | 4.74 | 0.91 | 14.23 | 1.16 | |
| T7-ST-M-V4 | 1.186 | 0.39 | 1.69 | 0.55 | 4.83 | 0.88 | 14.23 | 1.12 | |
| T6&T8-ST-M-V4 | 1.38 | 0.37 | 1.98 | 0.52 | 5.04 | 0.82 | 14.23 | 1.05 | |
| P1-RC-M-V4 | 1.88 | 0.39 | 2.68 | 0.56 | 8.04 | 0.91 | 24.12 | 1.16 | |
| P2-RC-M-V4 | 2.81 | 0.36 | 4.02 | 0.49 | 9.04 | 0.74 | 24.12 | 0.95 | |
| T1-RC-M-V4 | 1.17 | 0.39 | 1.67 | 0.56 | 5.01 | 0.91 | 15.03 | 1.16 | |
| T2-RC-M-V4 | 1.35 | 0.38 | 1.93 | 0.54 | 5.20 | 0.85 | 15.03 | 1.09 | |
| T3-RC-M-V4 | 1.38 | 0.37 | 1.97 | 0.52 | 5.03 | 0.82 | 14.21 | 1.05 | |
Disclaimer/Publisher’s Note: The statements, opinions and data contained in all publications are solely those of the individual author(s) and contributor(s) and not of MDPI and/or the editor(s). MDPI and/or the editor(s) disclaim responsibility for any injury to people or property resulting from any ideas, methods, instructions or products referred to in the content. |
© 2023 by the authors. Licensee MDPI, Basel, Switzerland. This article is an open access article distributed under the terms and conditions of the Creative Commons Attribution (CC BY) license (https://creativecommons.org/licenses/by/4.0/).
Share and Cite
Biglari, M.; Hosseini Hashemi, B.; Formisano, A. The Comparison of Code-Based and Empirical Seismic Fragility Curves of Steel and RC Buildings. Buildings 2023, 13, 1361. https://doi.org/10.3390/buildings13061361
Biglari M, Hosseini Hashemi B, Formisano A. The Comparison of Code-Based and Empirical Seismic Fragility Curves of Steel and RC Buildings. Buildings. 2023; 13(6):1361. https://doi.org/10.3390/buildings13061361
Chicago/Turabian StyleBiglari, Mahnoosh, Behrokh Hosseini Hashemi, and Antonio Formisano. 2023. "The Comparison of Code-Based and Empirical Seismic Fragility Curves of Steel and RC Buildings" Buildings 13, no. 6: 1361. https://doi.org/10.3390/buildings13061361