
Experimental Behavior of Confined Masonry Walls Rehabilitated with Reinforced Mortar Jacketing Subjected to Cyclic Loading


Abstract
:1. Introduction
2. Experimental Program
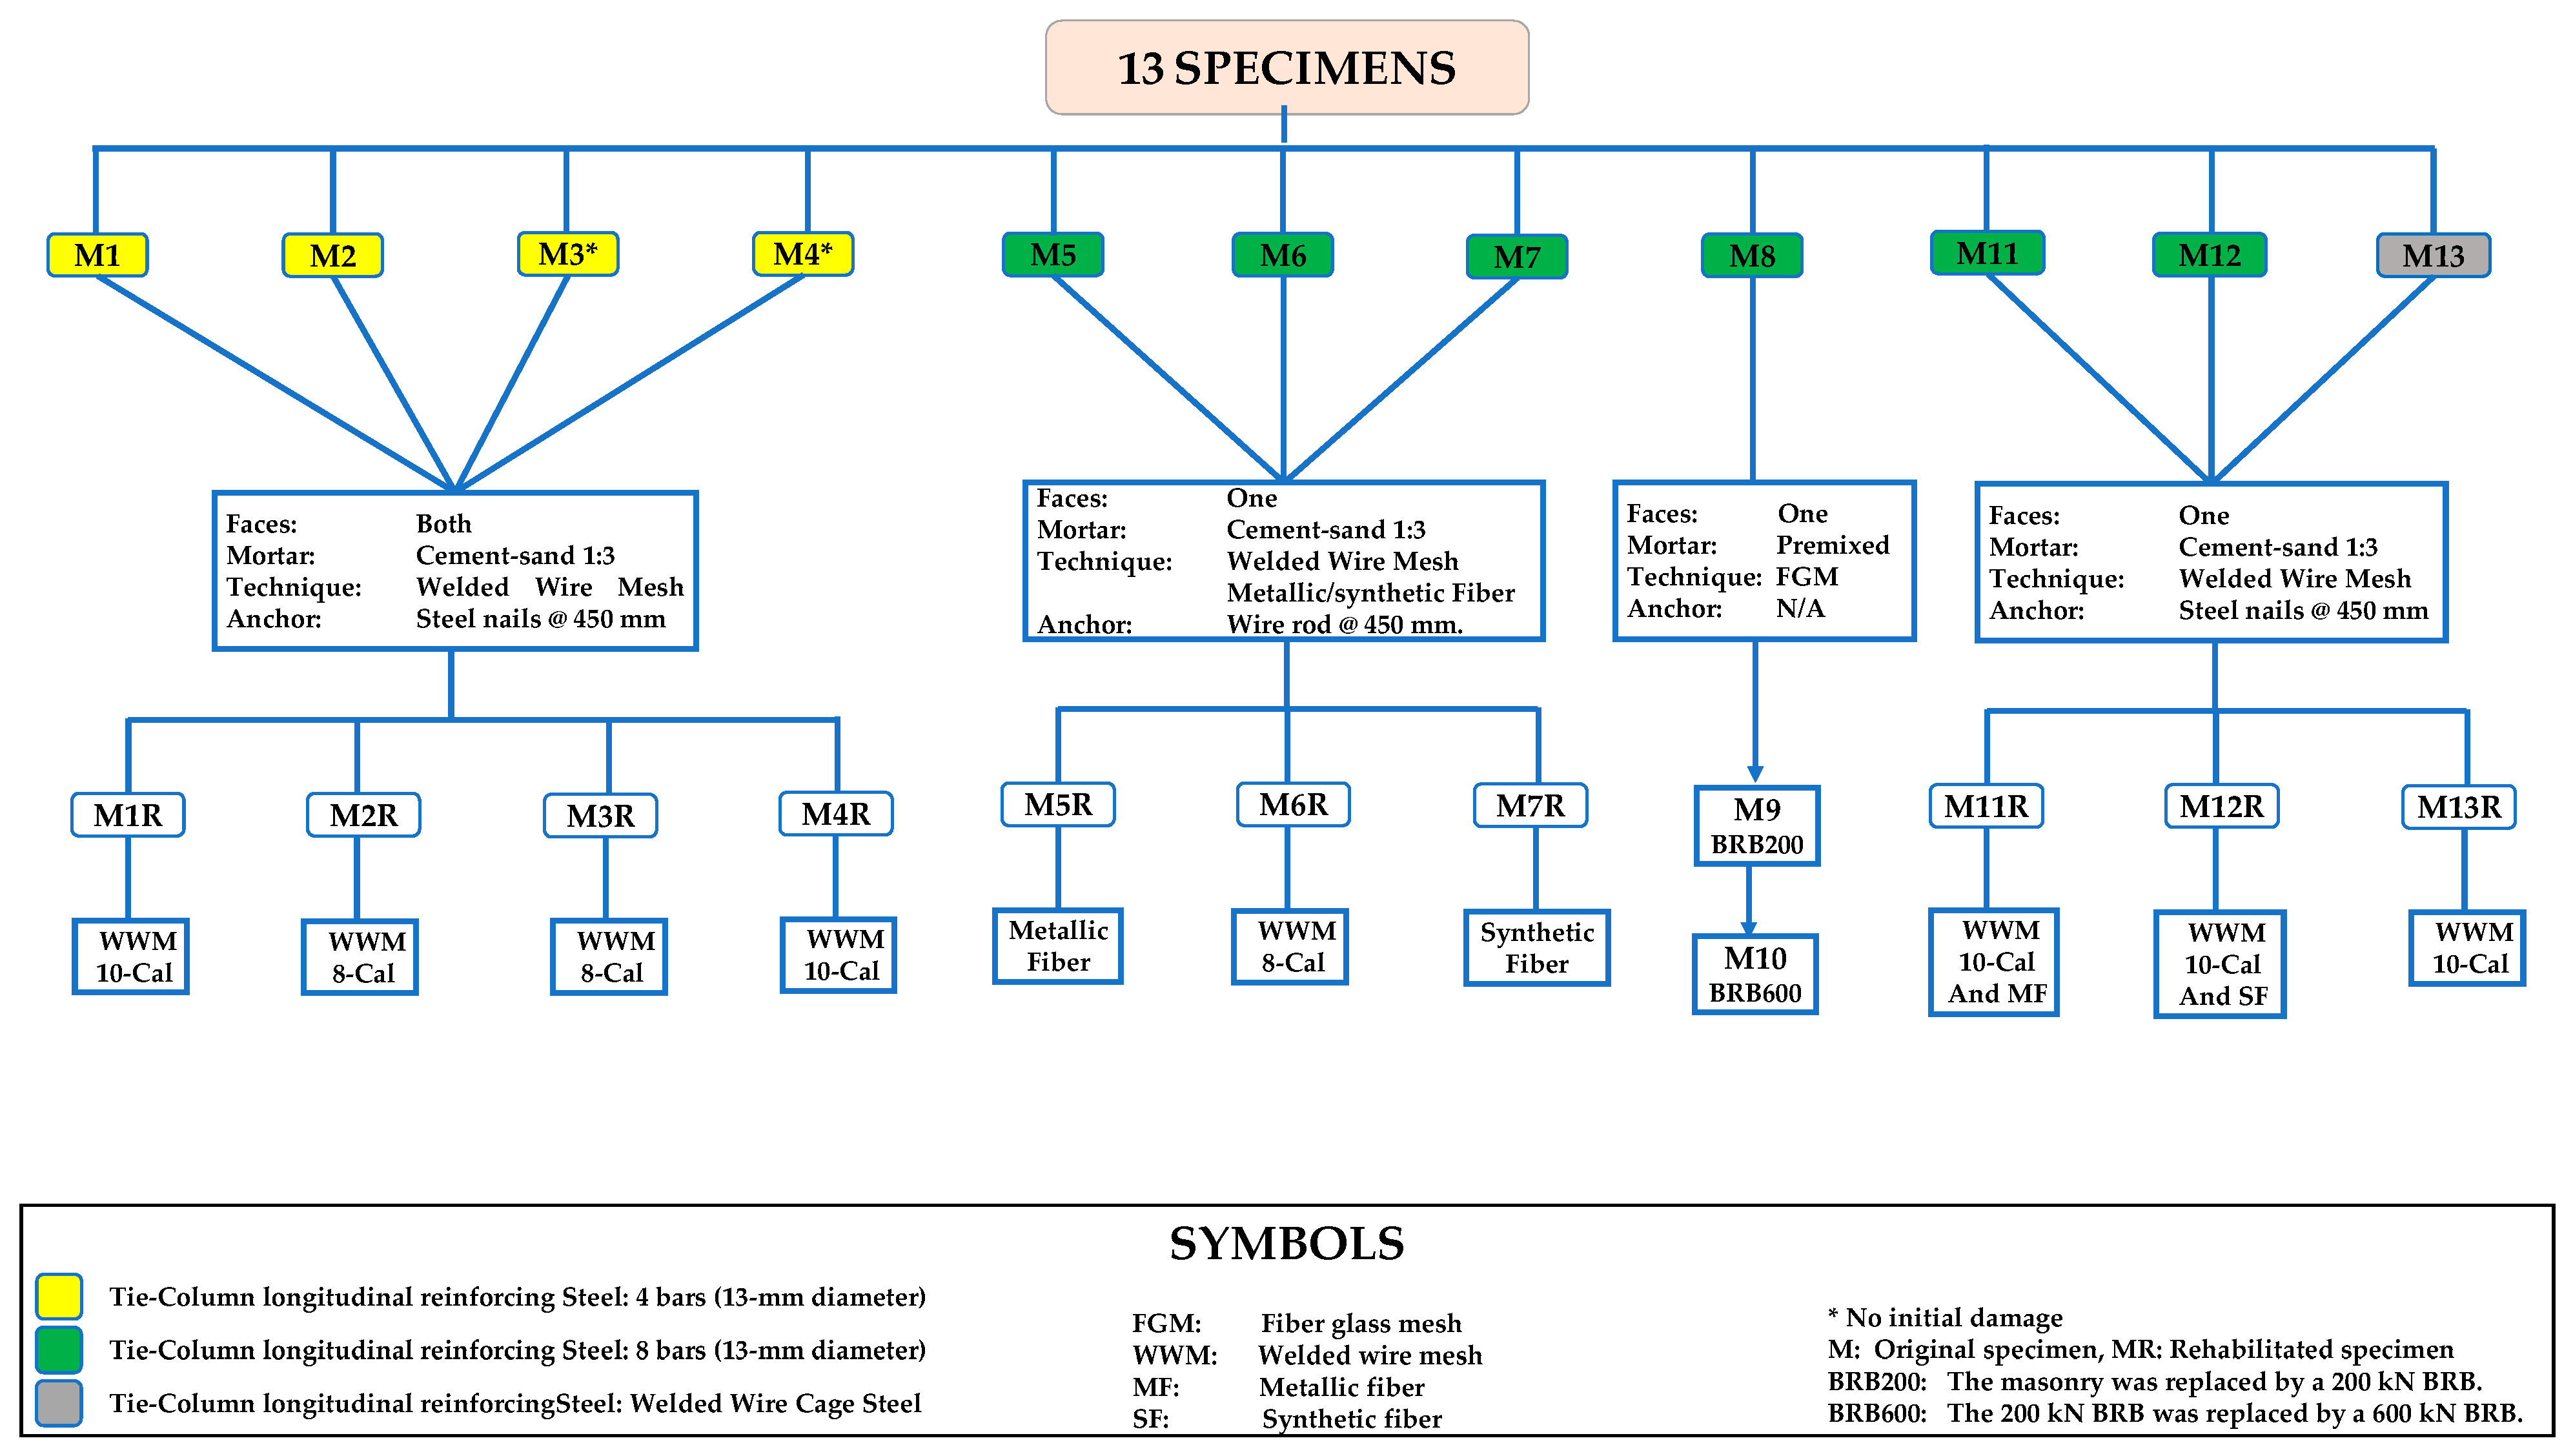
2.1. Tested Specimens
2.2. Material Properties
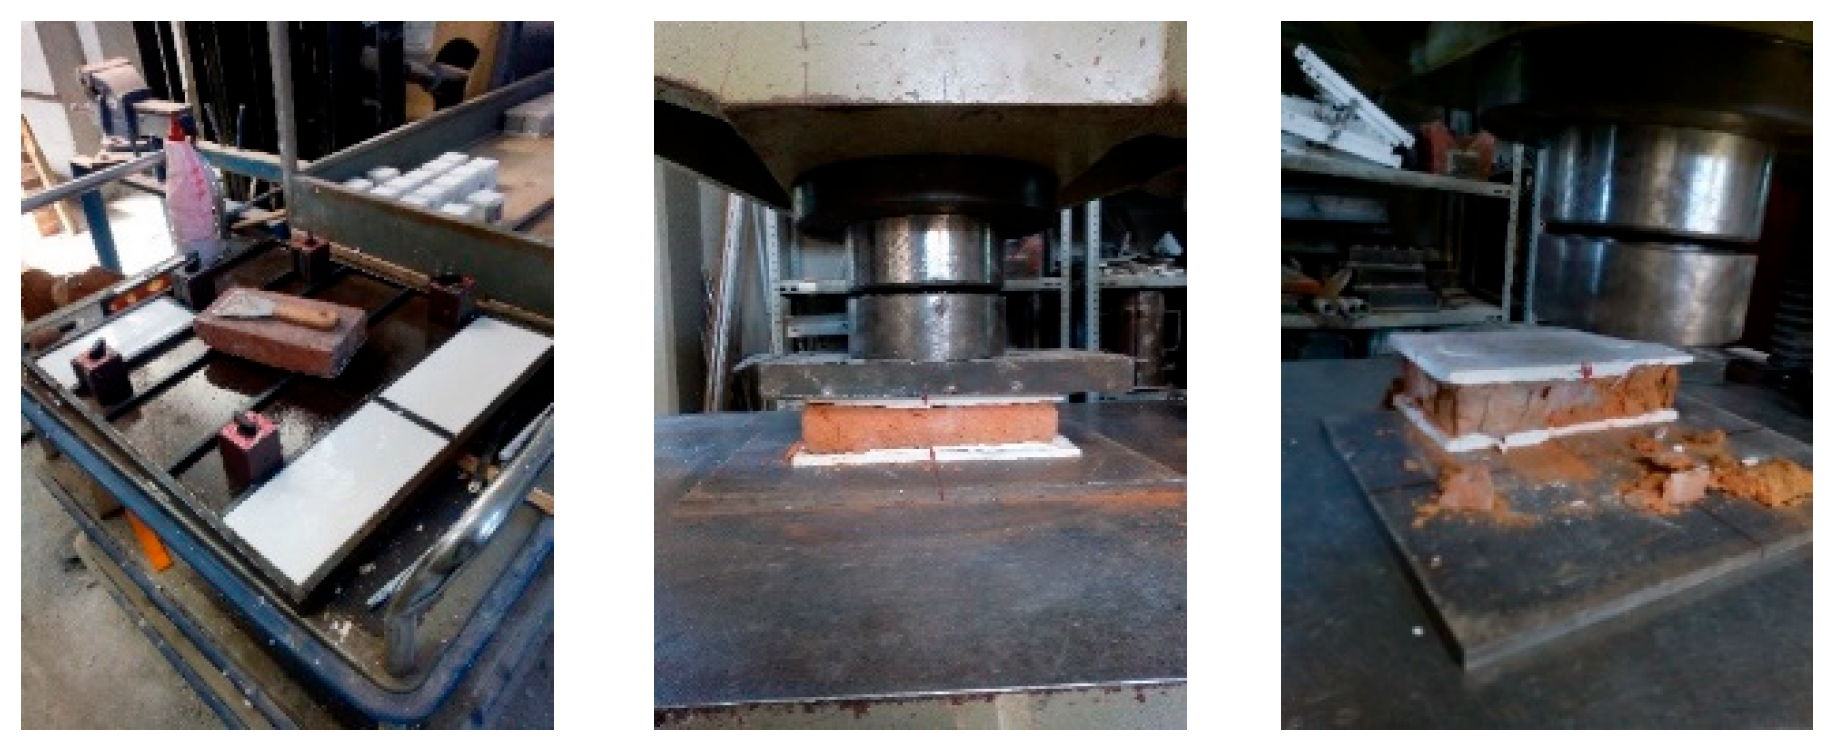
2.2.1. Masonry Units
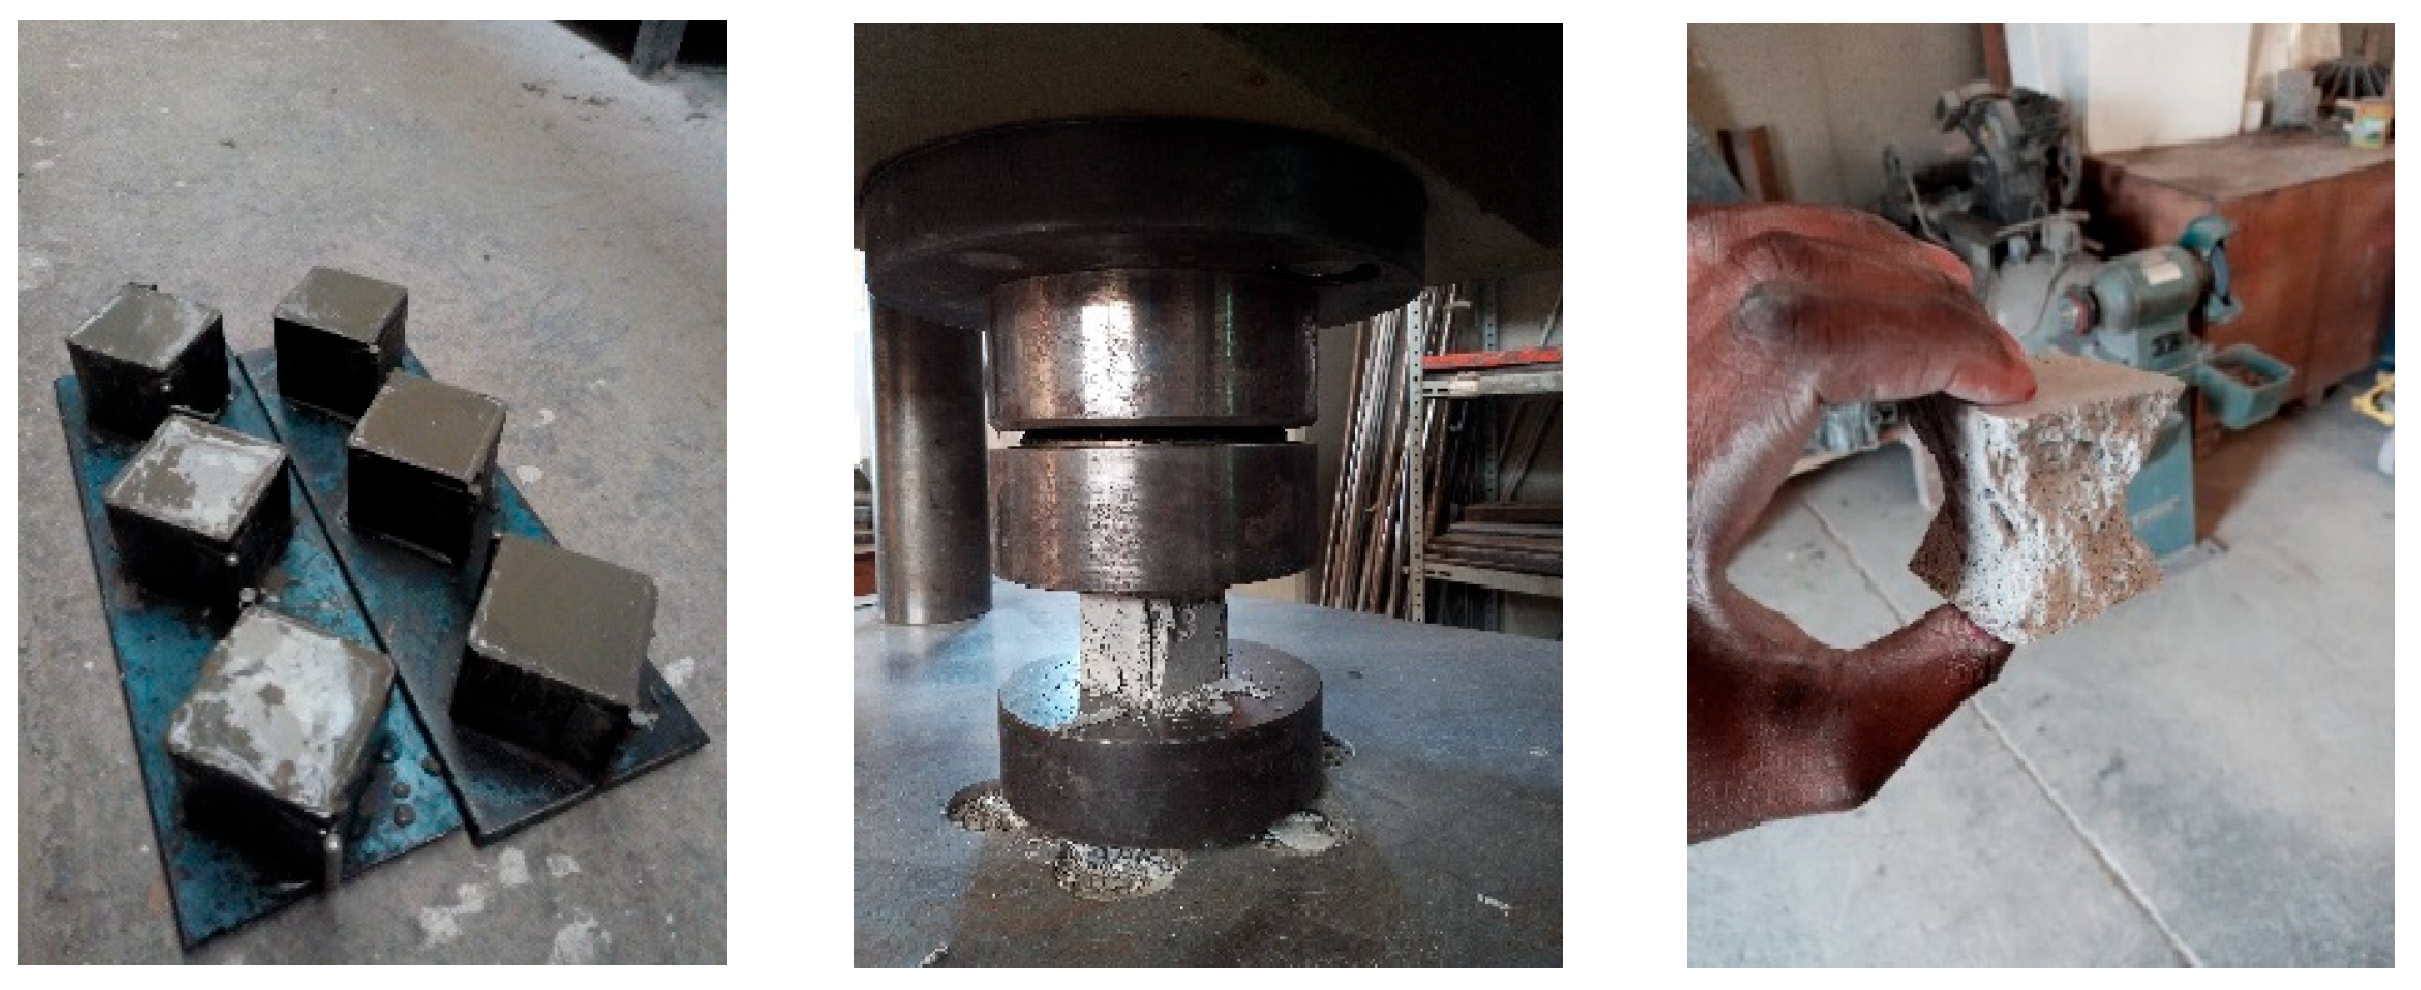
2.2.2. Mortar
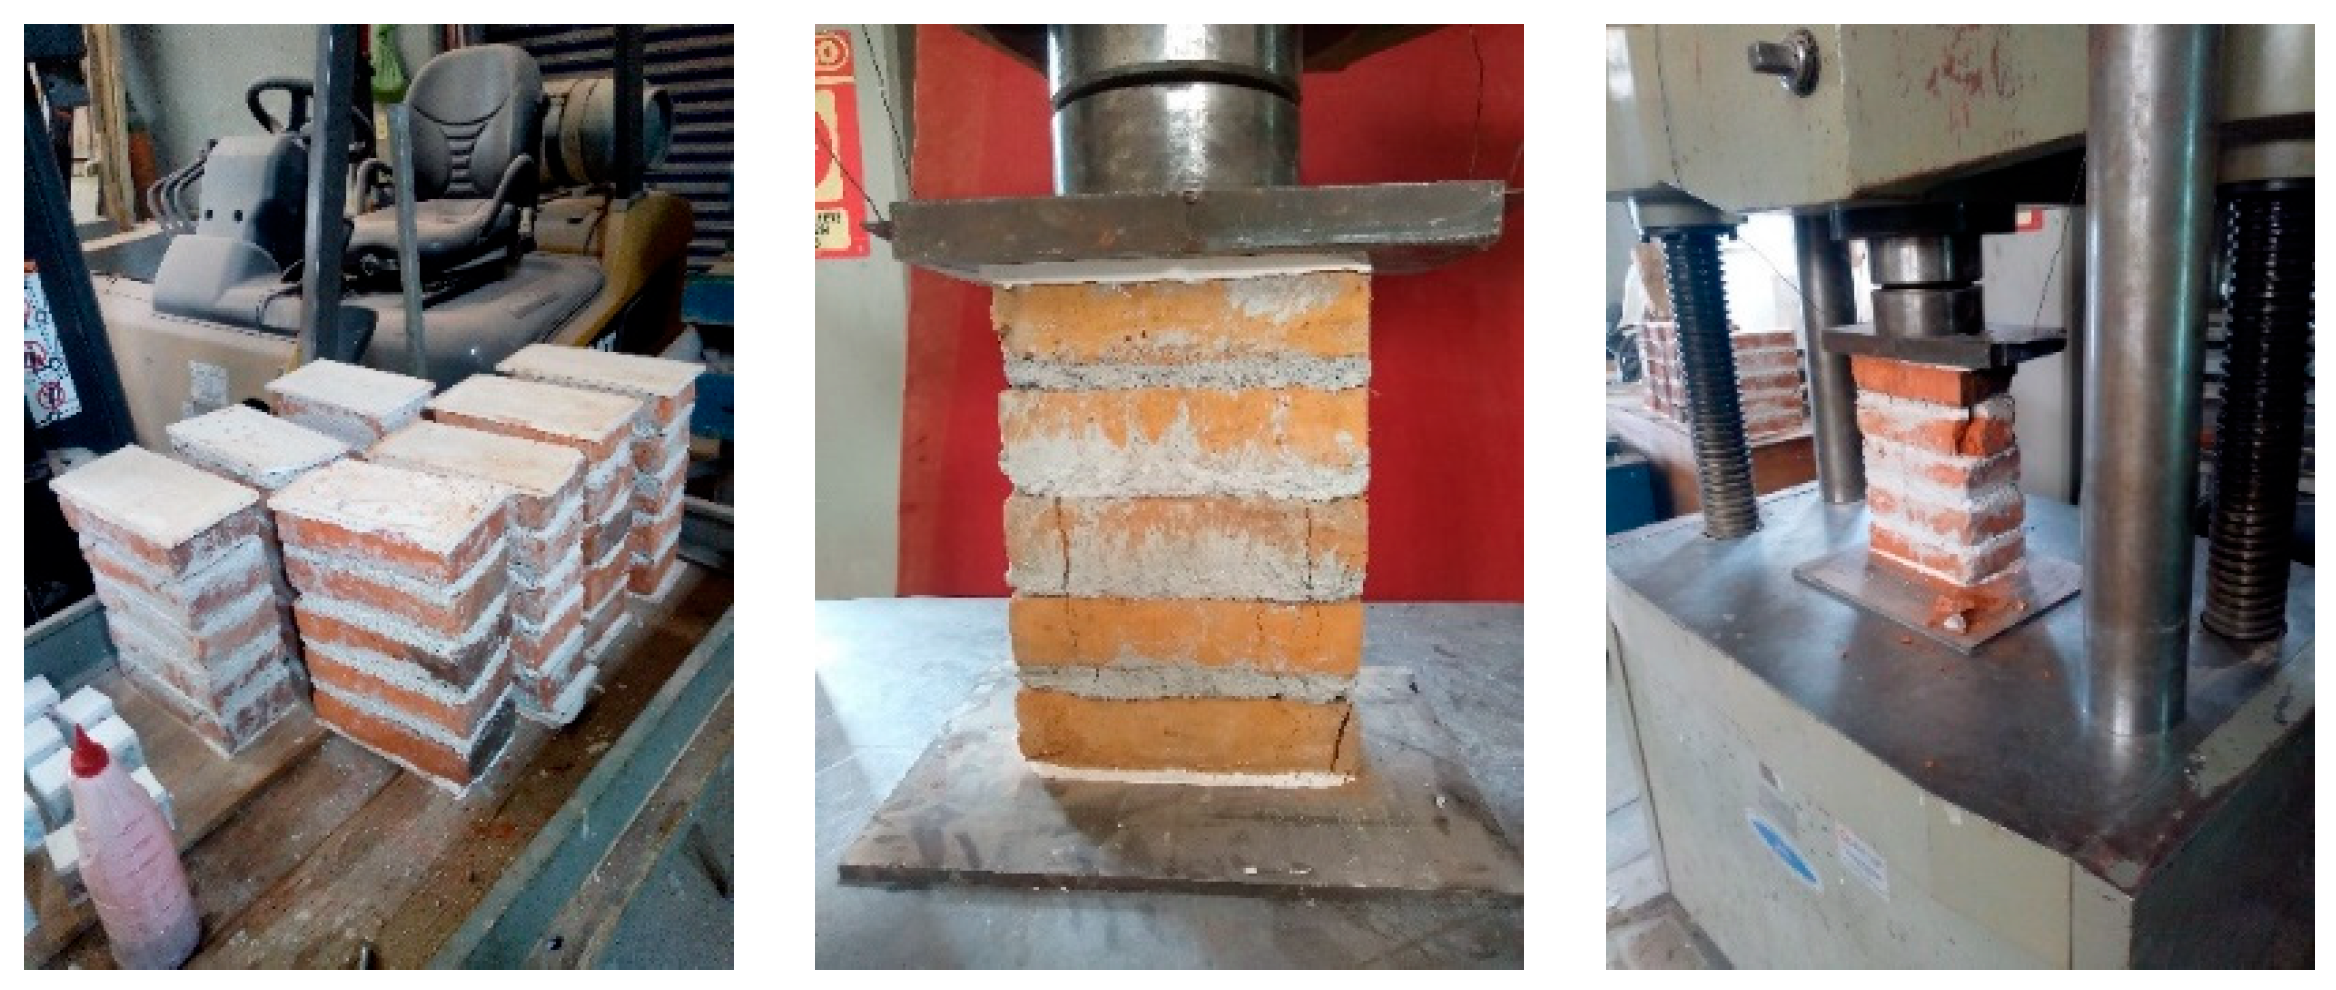
2.2.3. Prism Tests
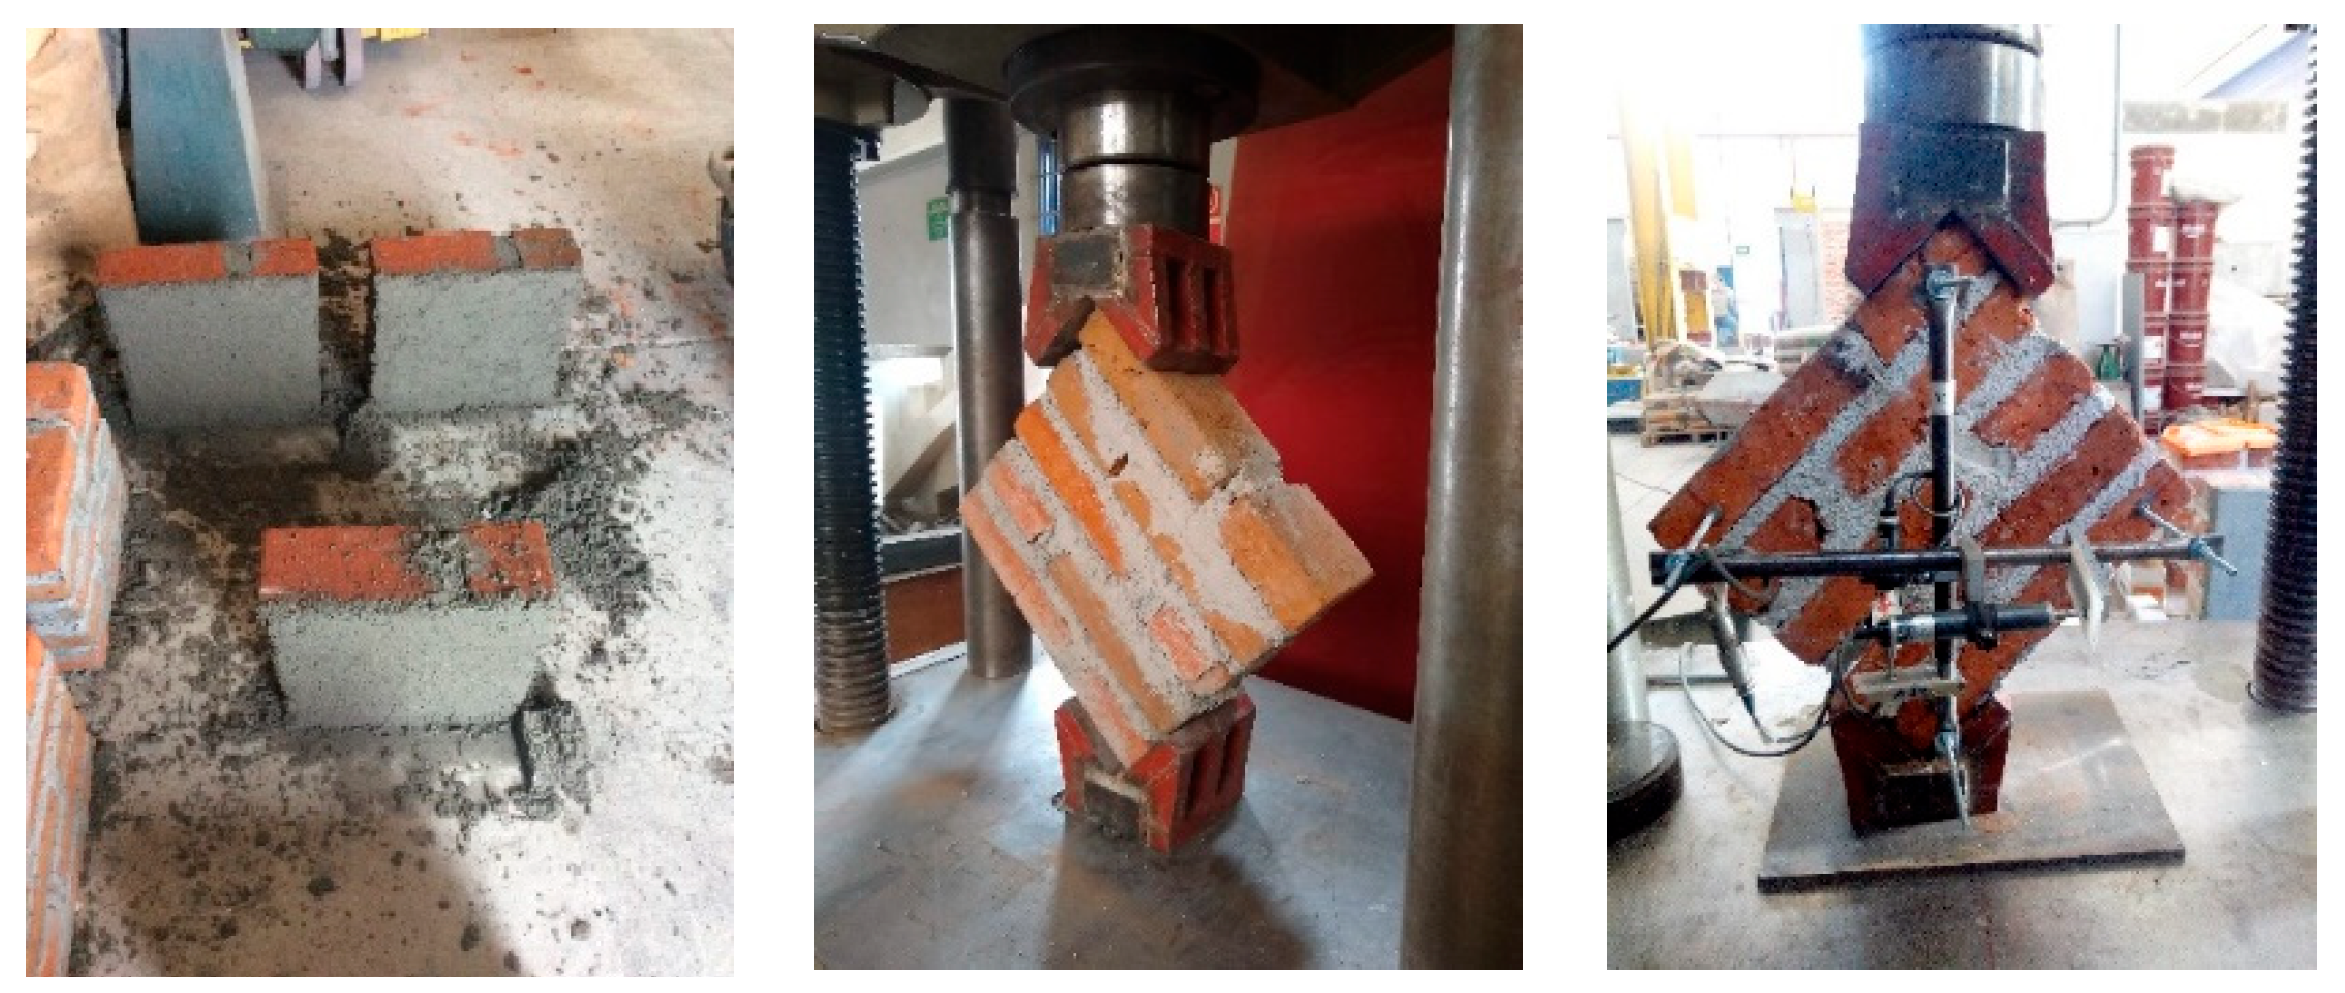
2.2.4. Diagonal Compression Test
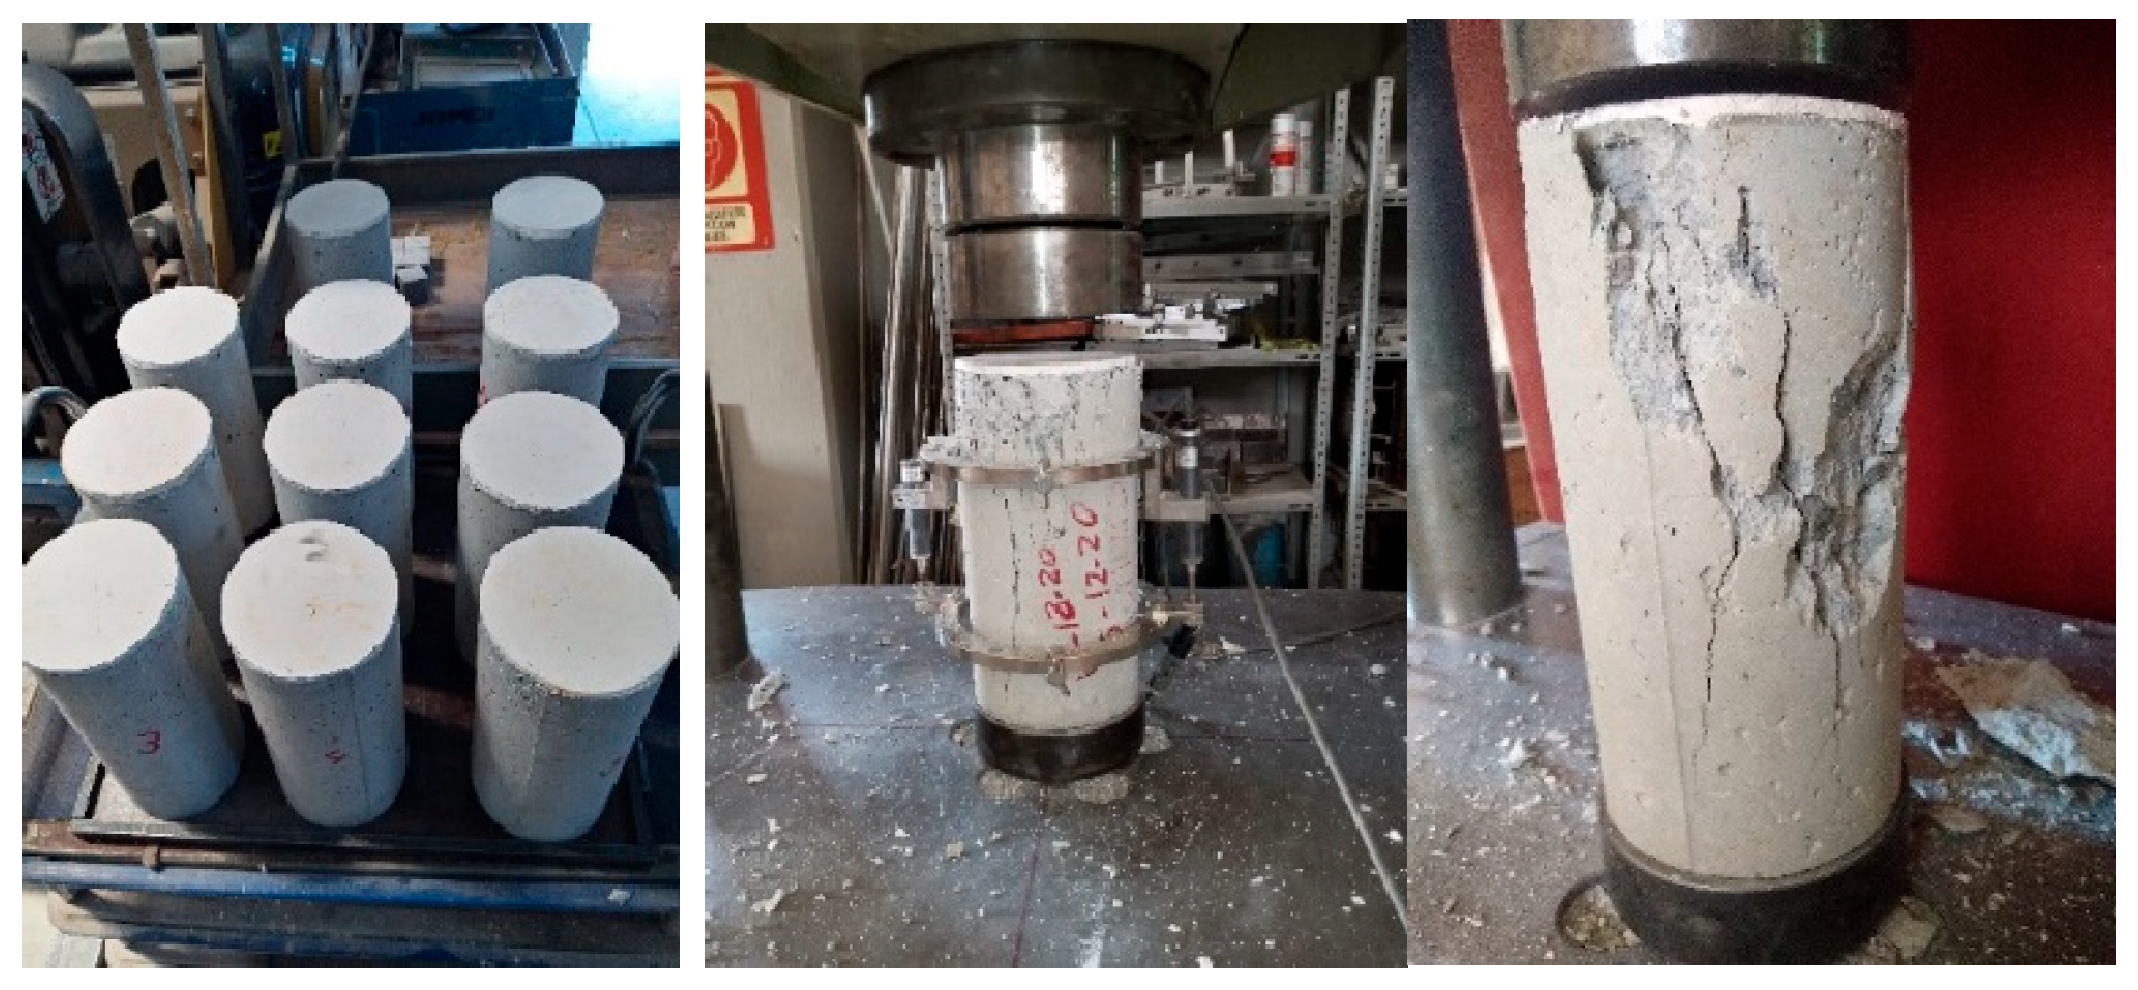
2.2.5. Concrete Compressive Strength
2.2.6. Reinforcing Steel
2.2.7. Welded Wire Mesh
2.2.8. Steel and Synthetic Fibers
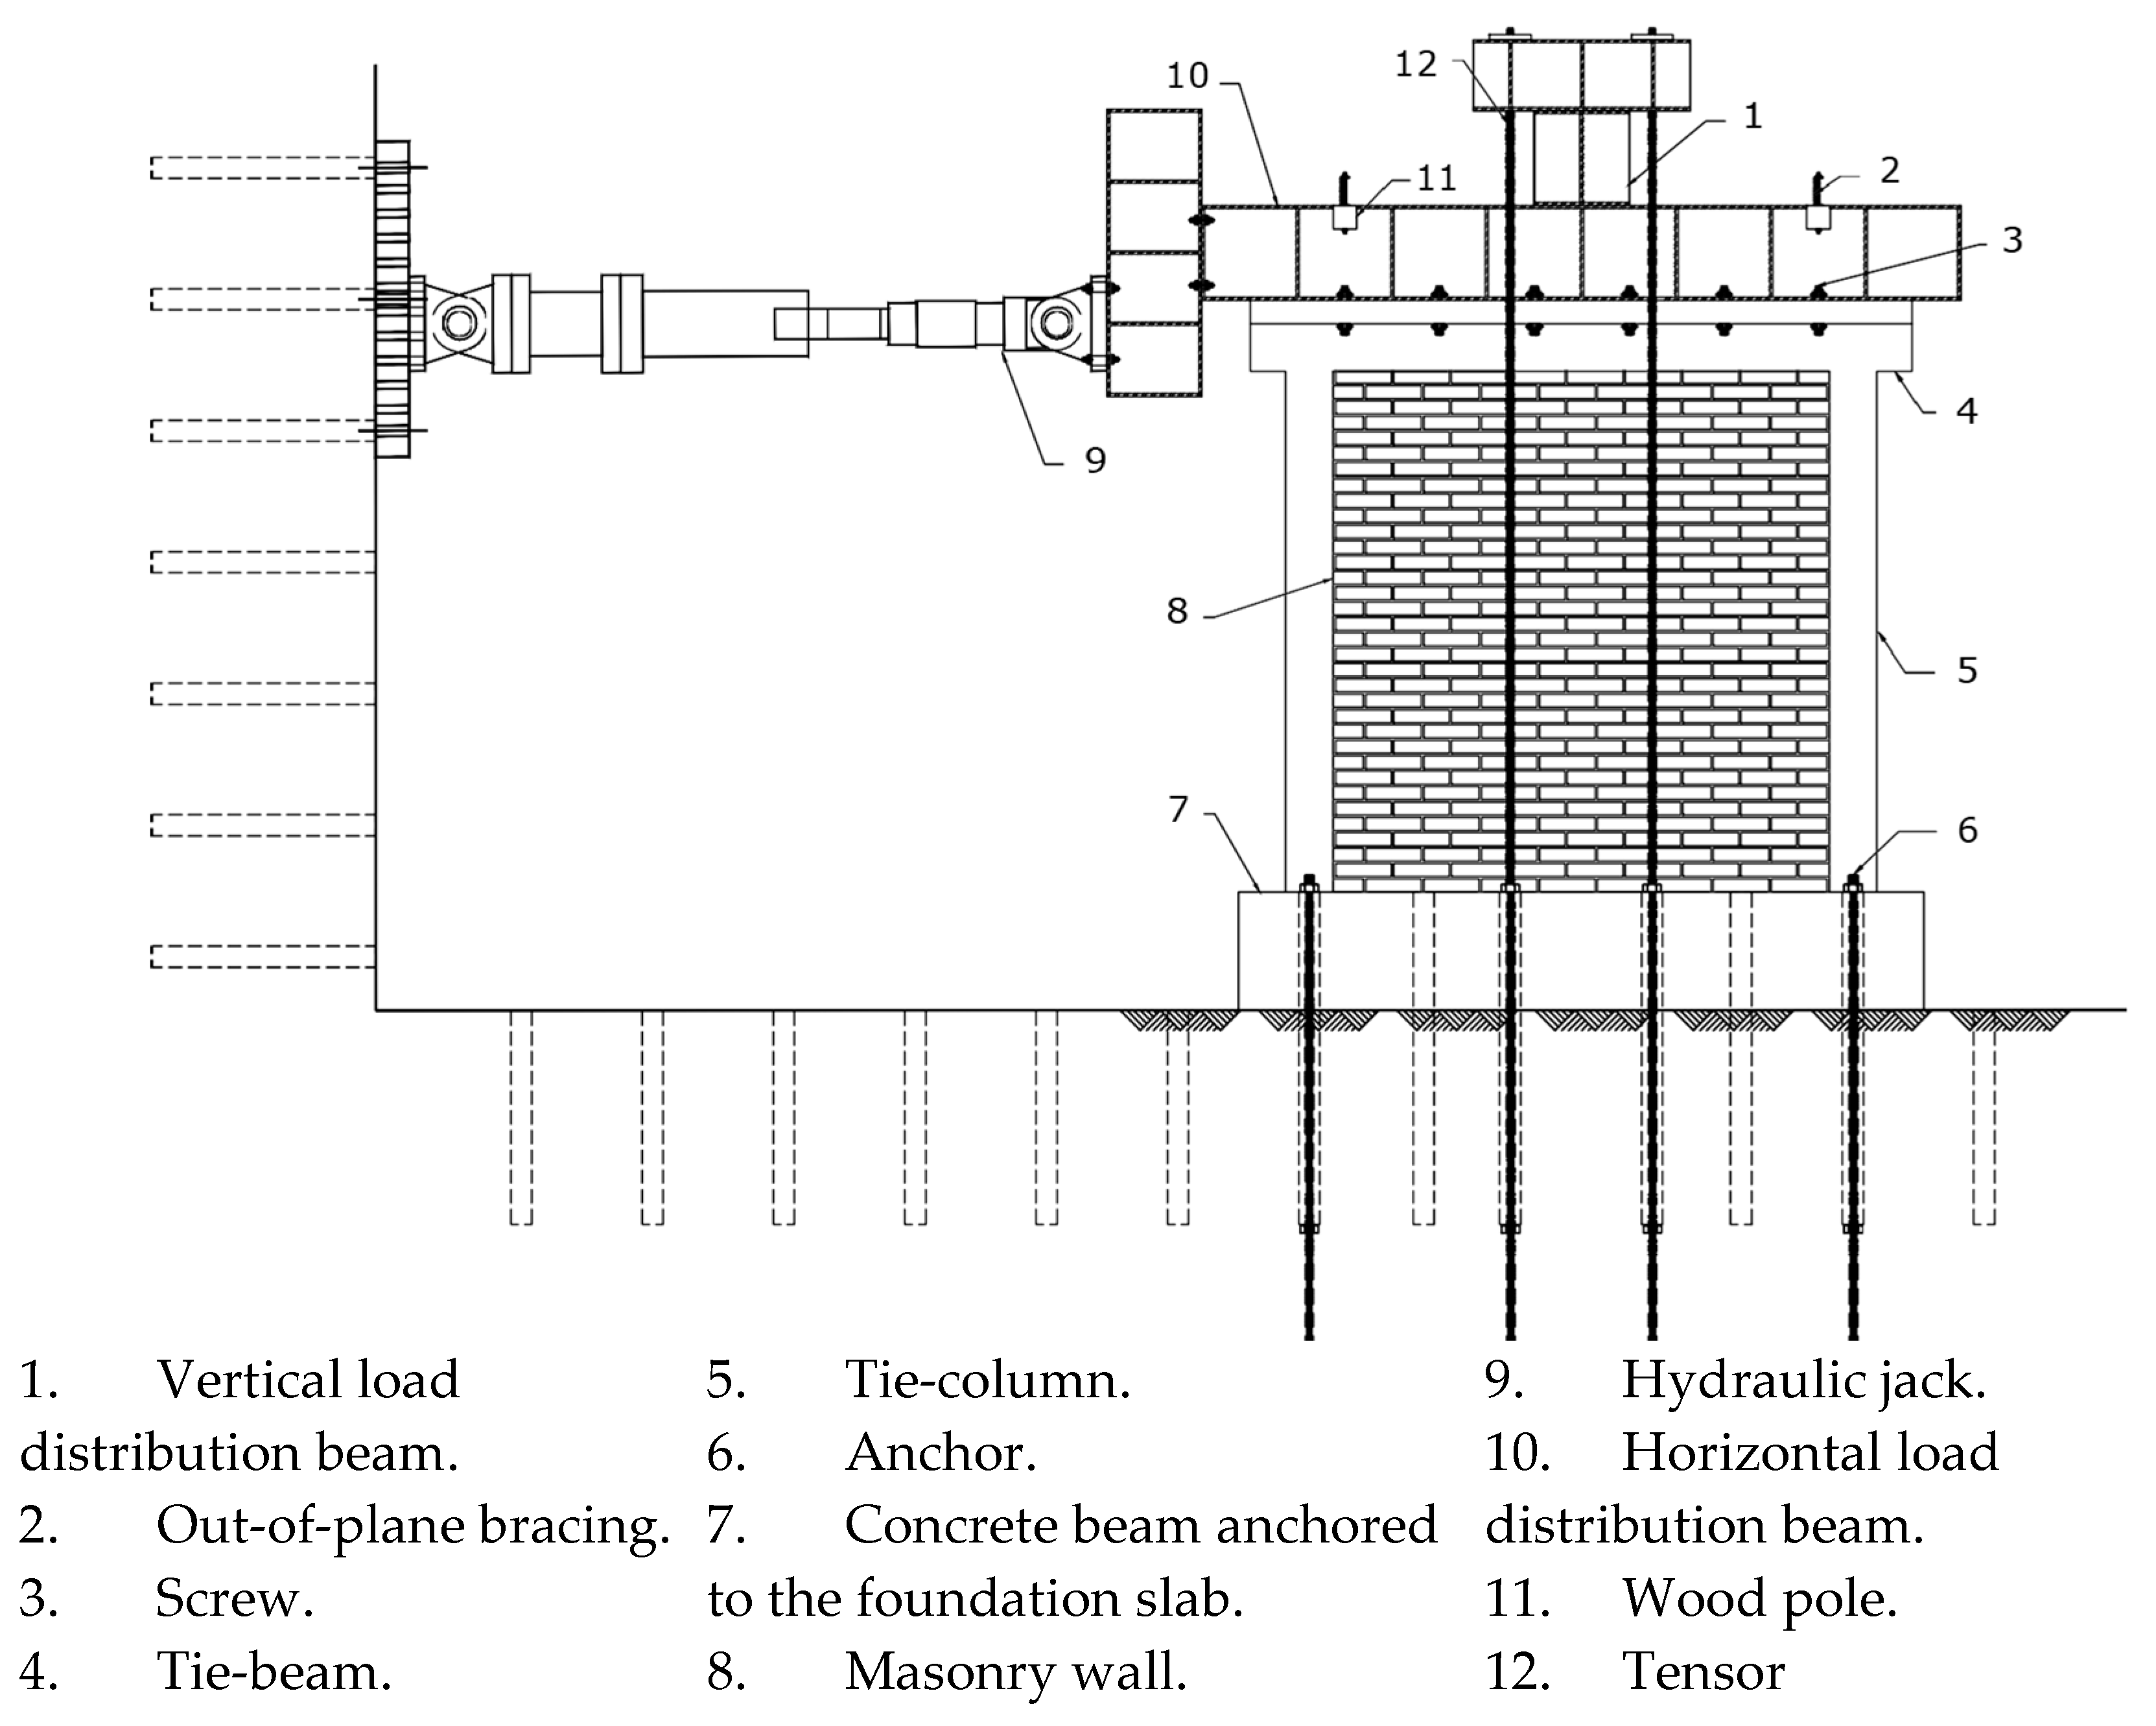
2.3. Test Setup
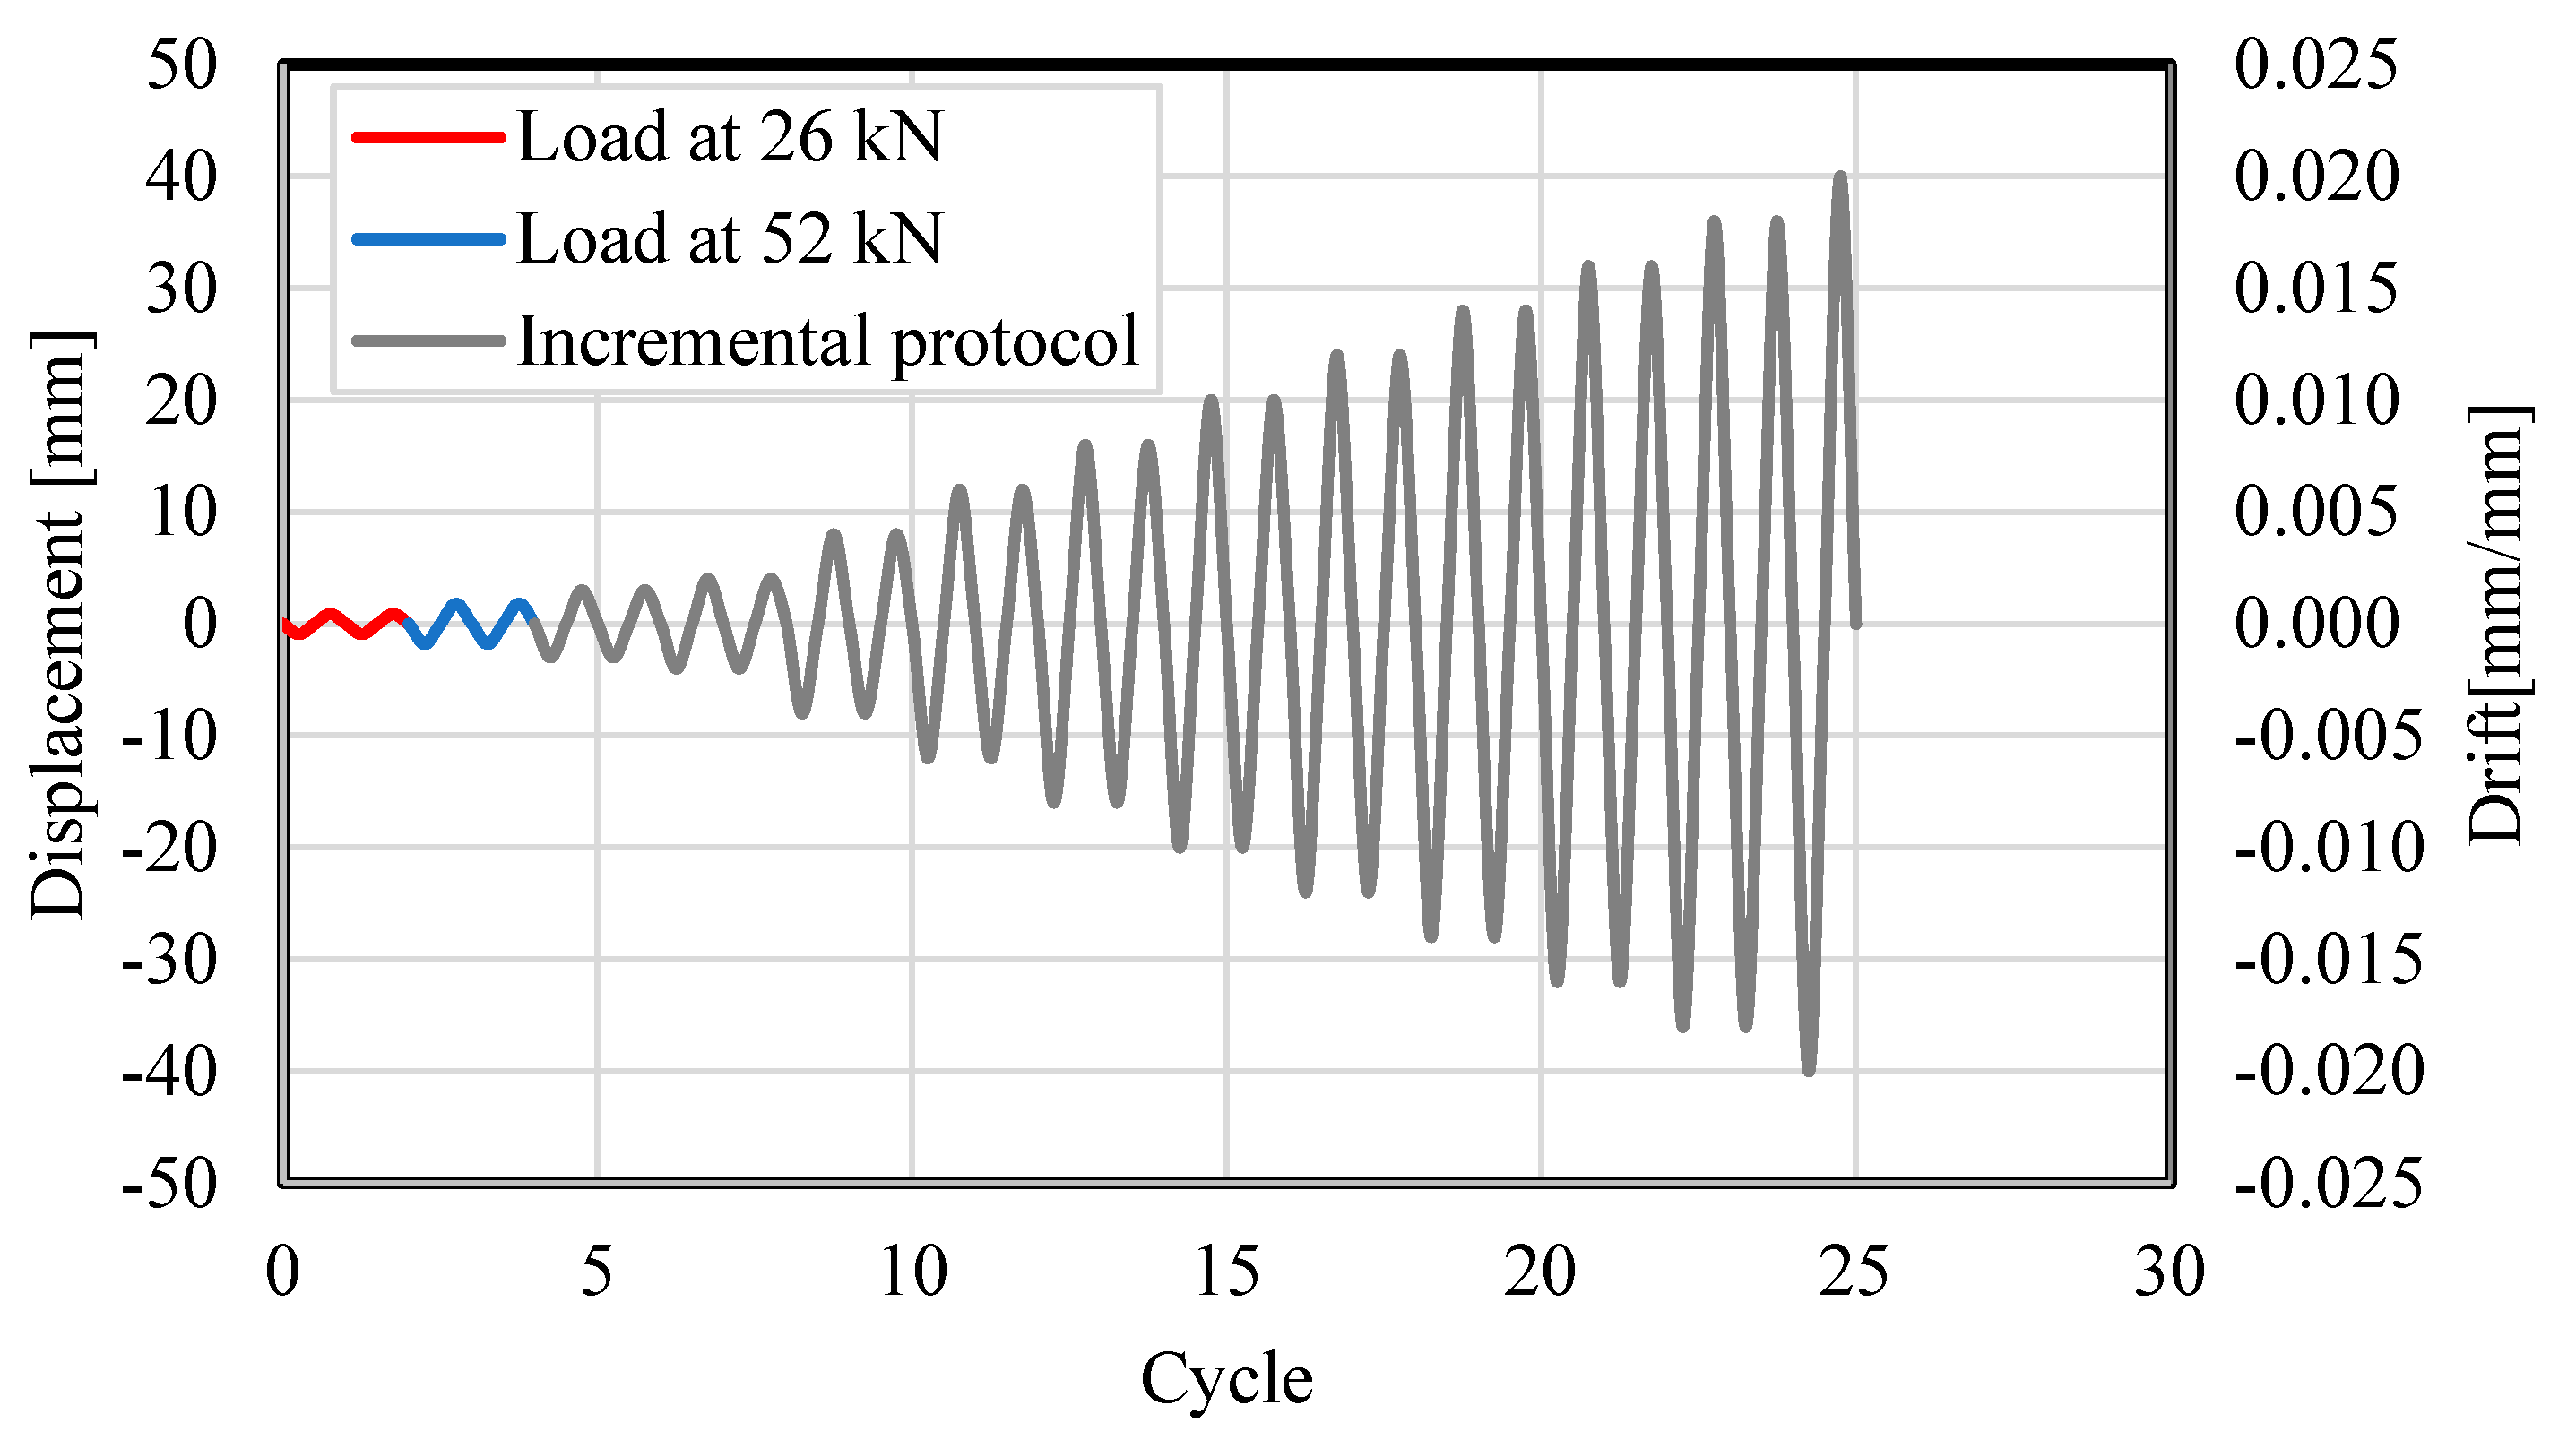
2.4. Loading Protocol
- First, two load cycles (red line) equivalent to 20 percent of the calculated lateral load carrying capacity were applied (i.e., at 26 kN);
- Then, two other load cycles (blue line), equivalent to 40 percent of the wall’s calculated strength, were applied (i.e., at 52 kN);
- Finally, incremental displacement-controlled cycles (gray line) were applied to failure;
- At each loading or displacement stage, two load cycles were applied.
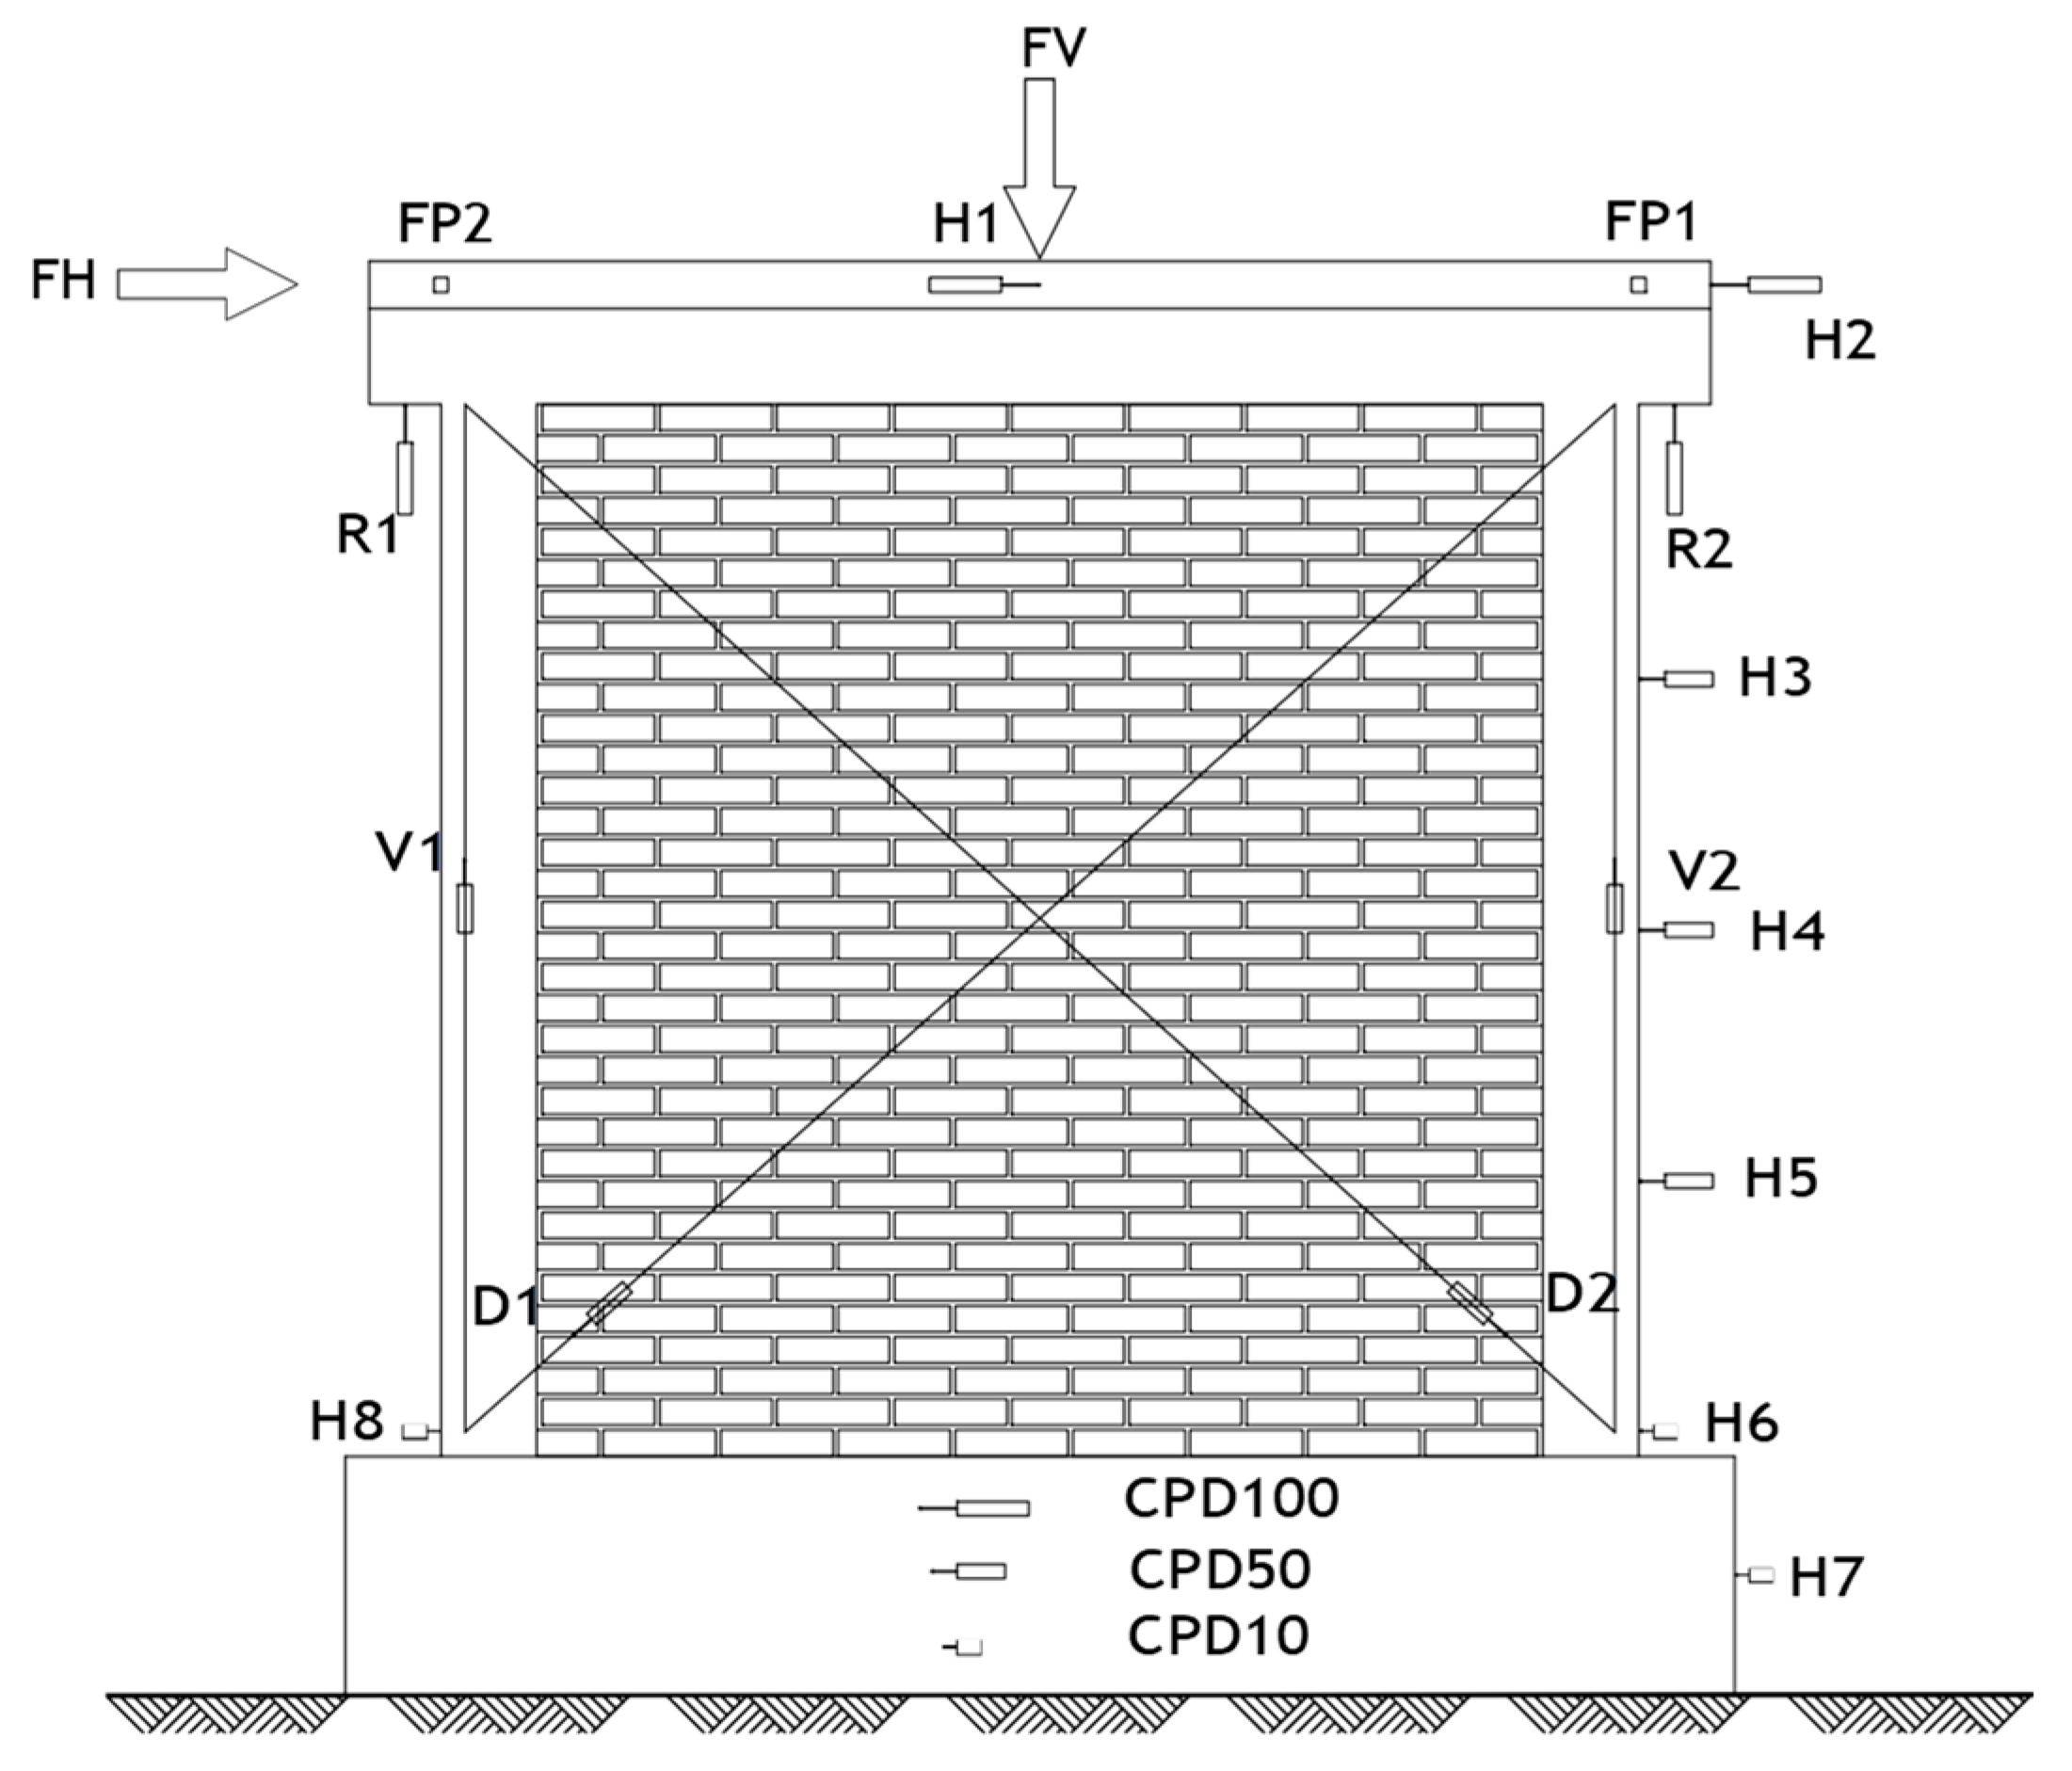
2.5. Instrumentation
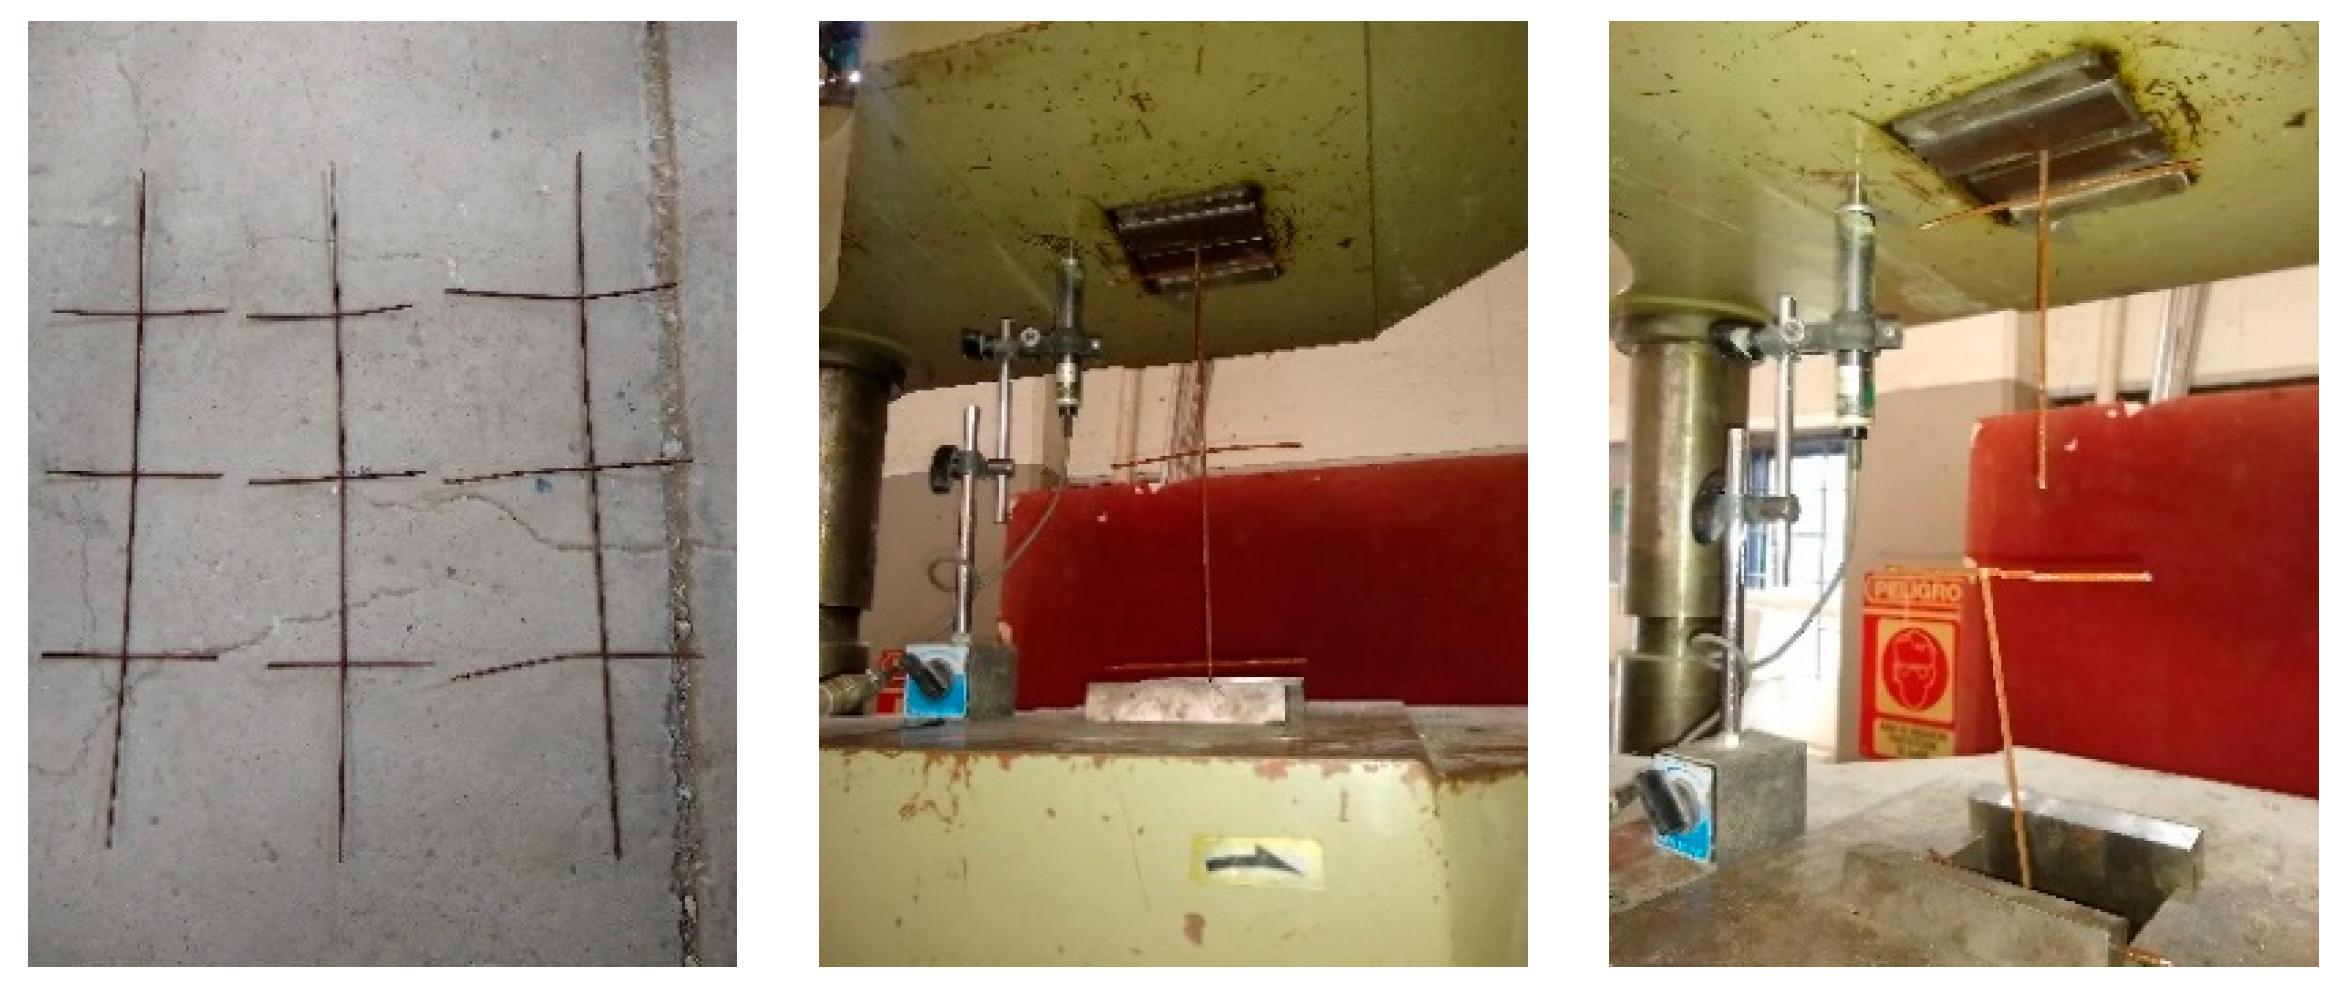
2.5.1. External Instrumentation
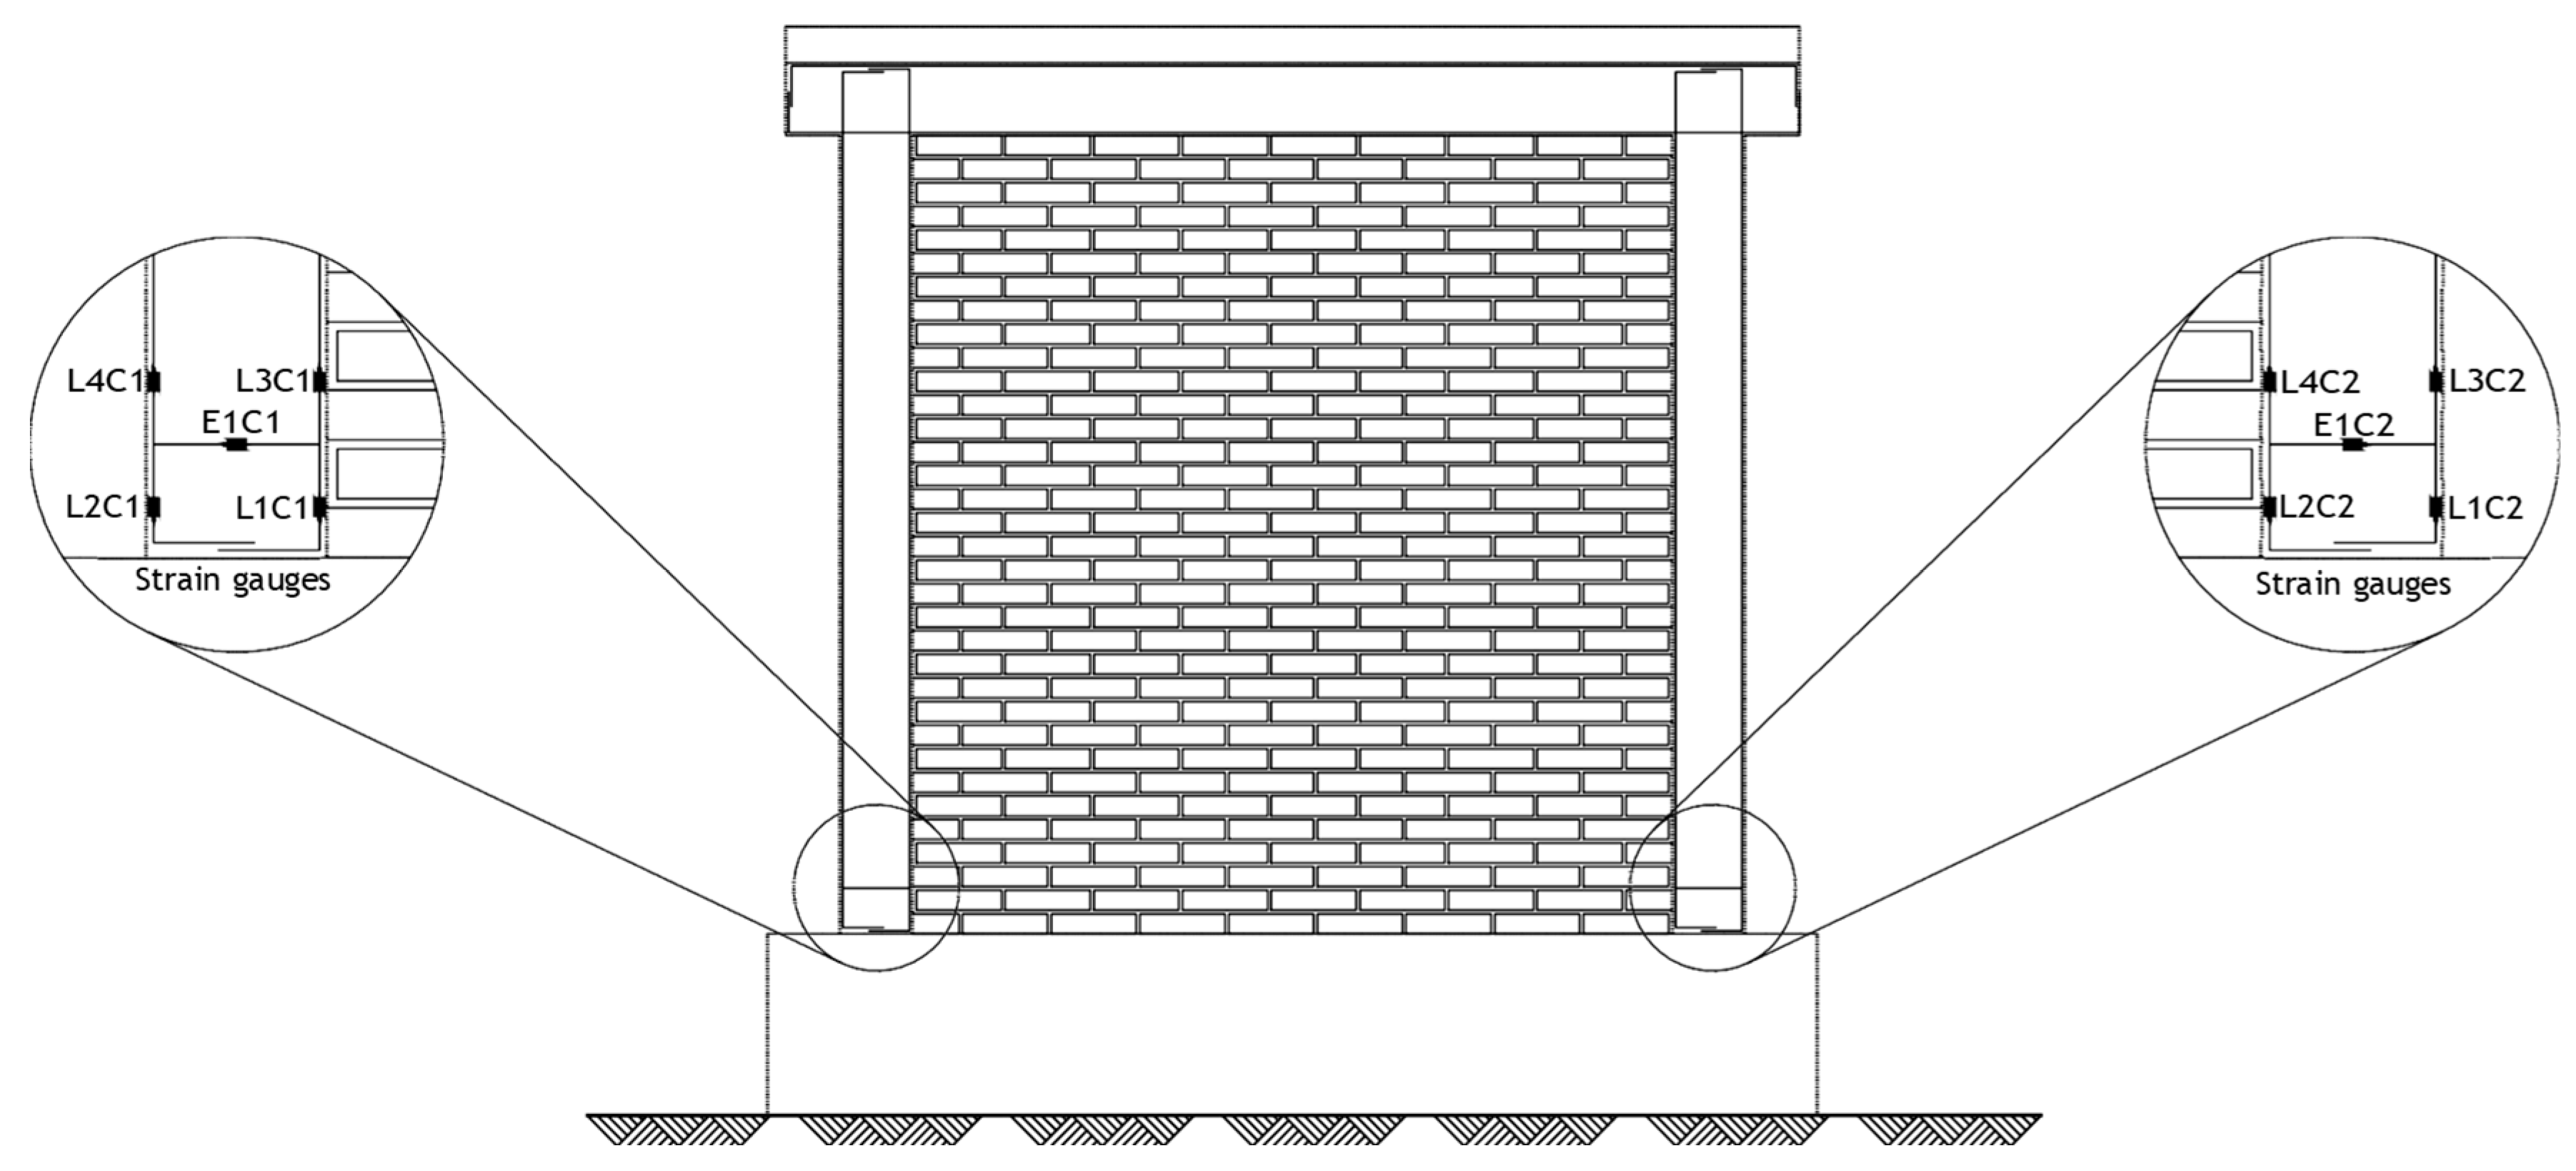
2.5.2. Internal Instrumentation
3. Construction and Rehabilitation of the Test Specimens
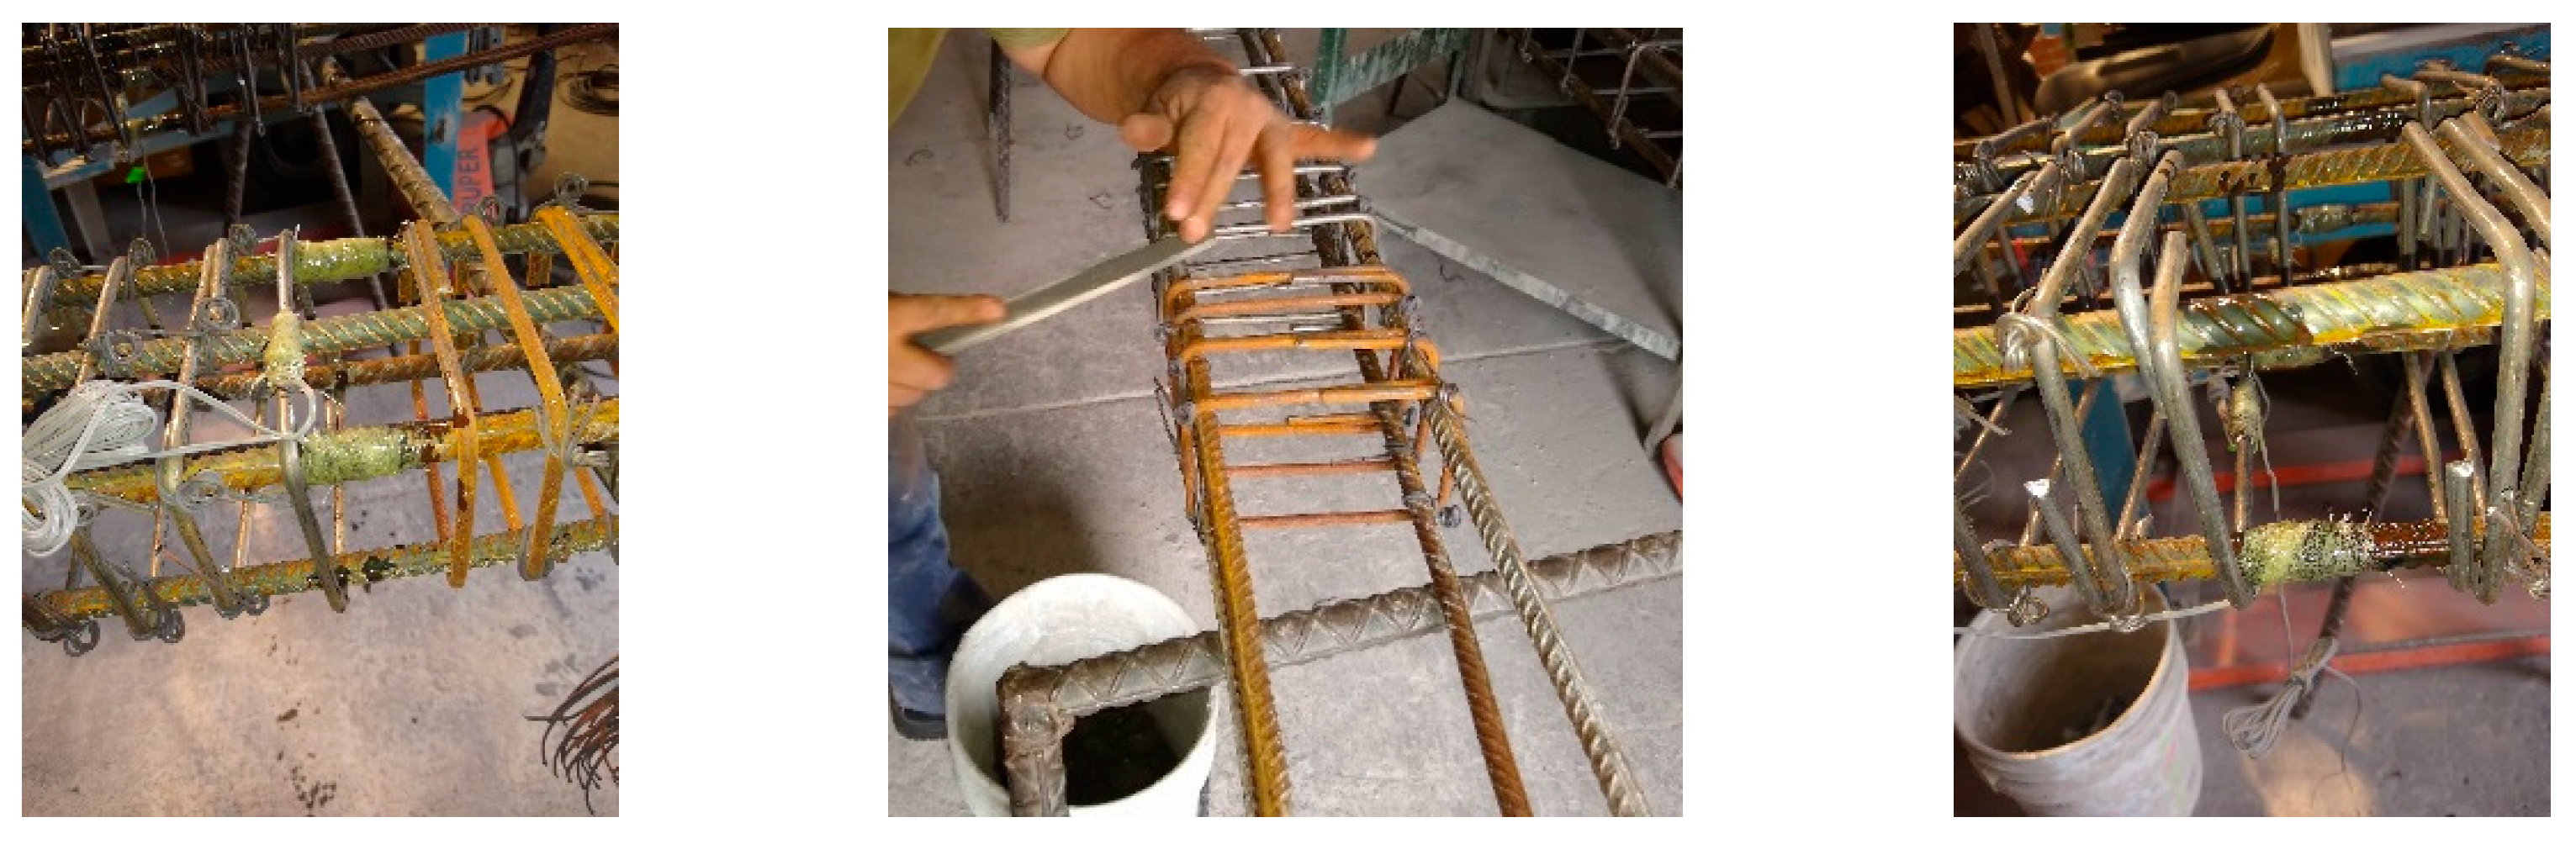
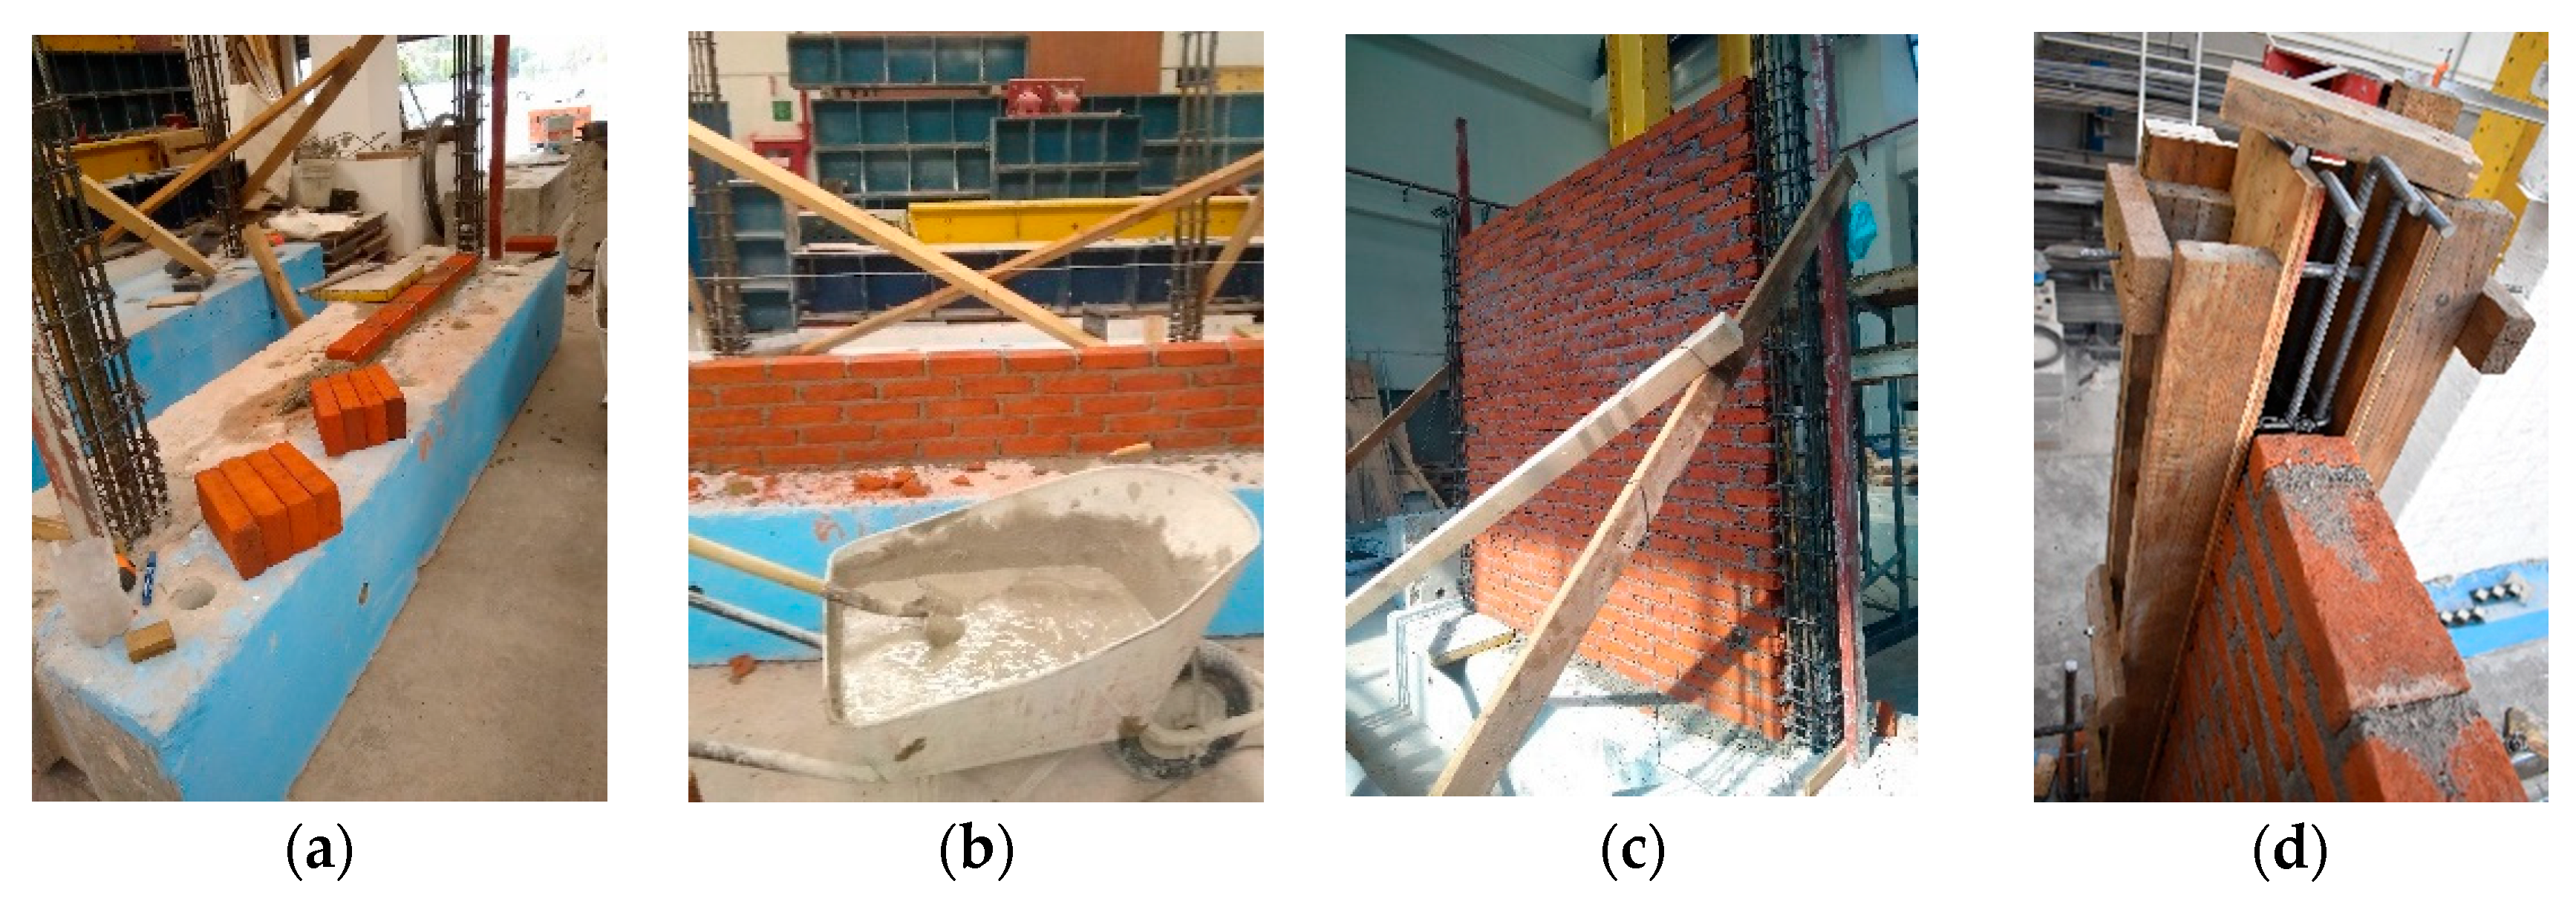
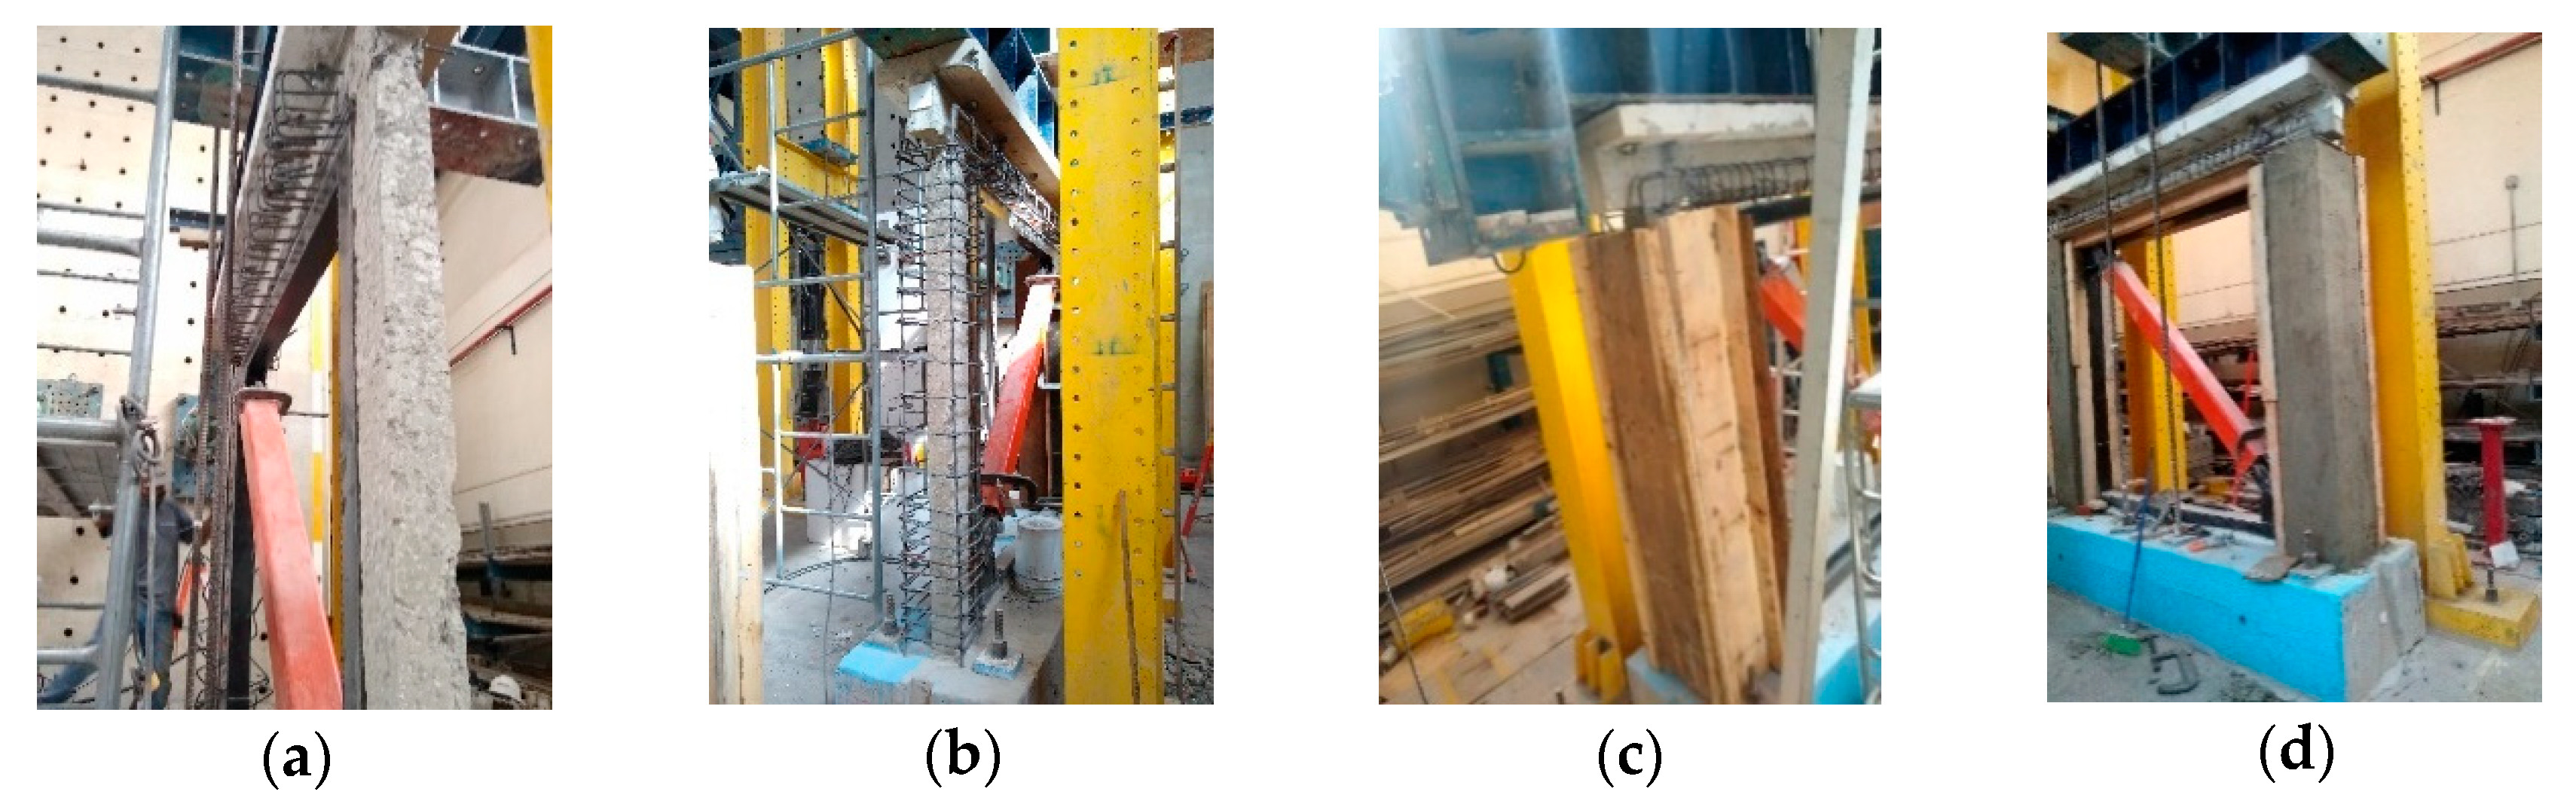
3.1. Construction of Test Specimens
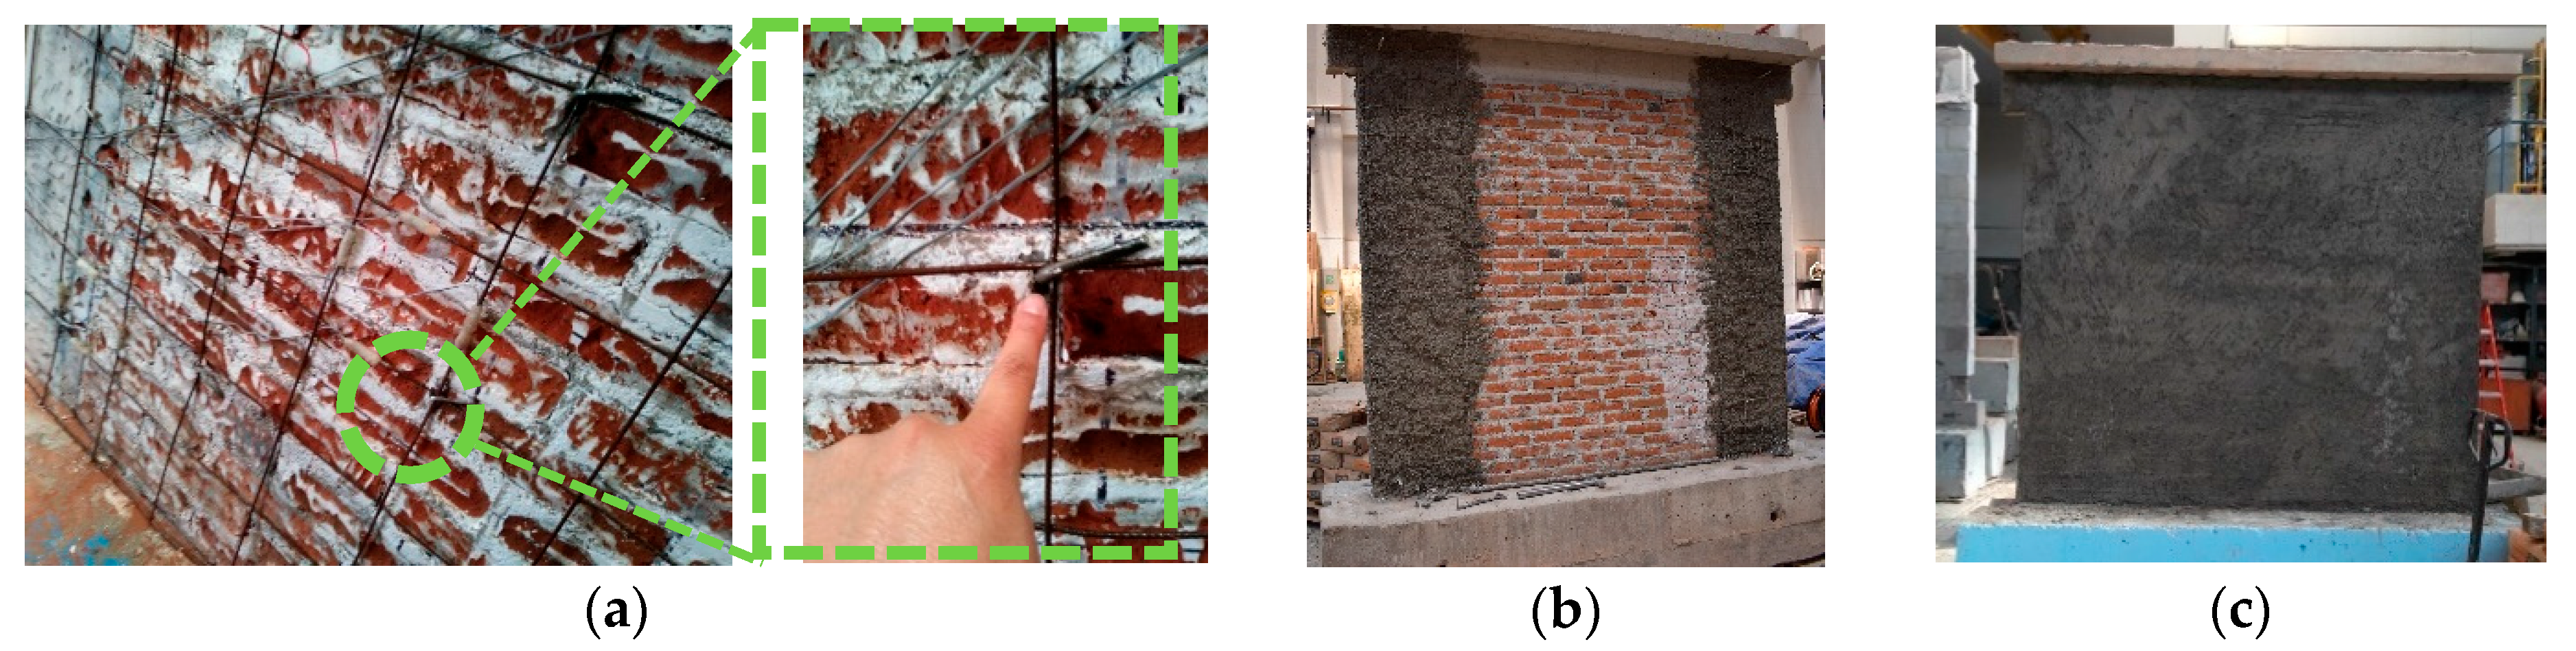
3.2. Rehabilitation with Mortar Reinforced with Welded Wire Mesh
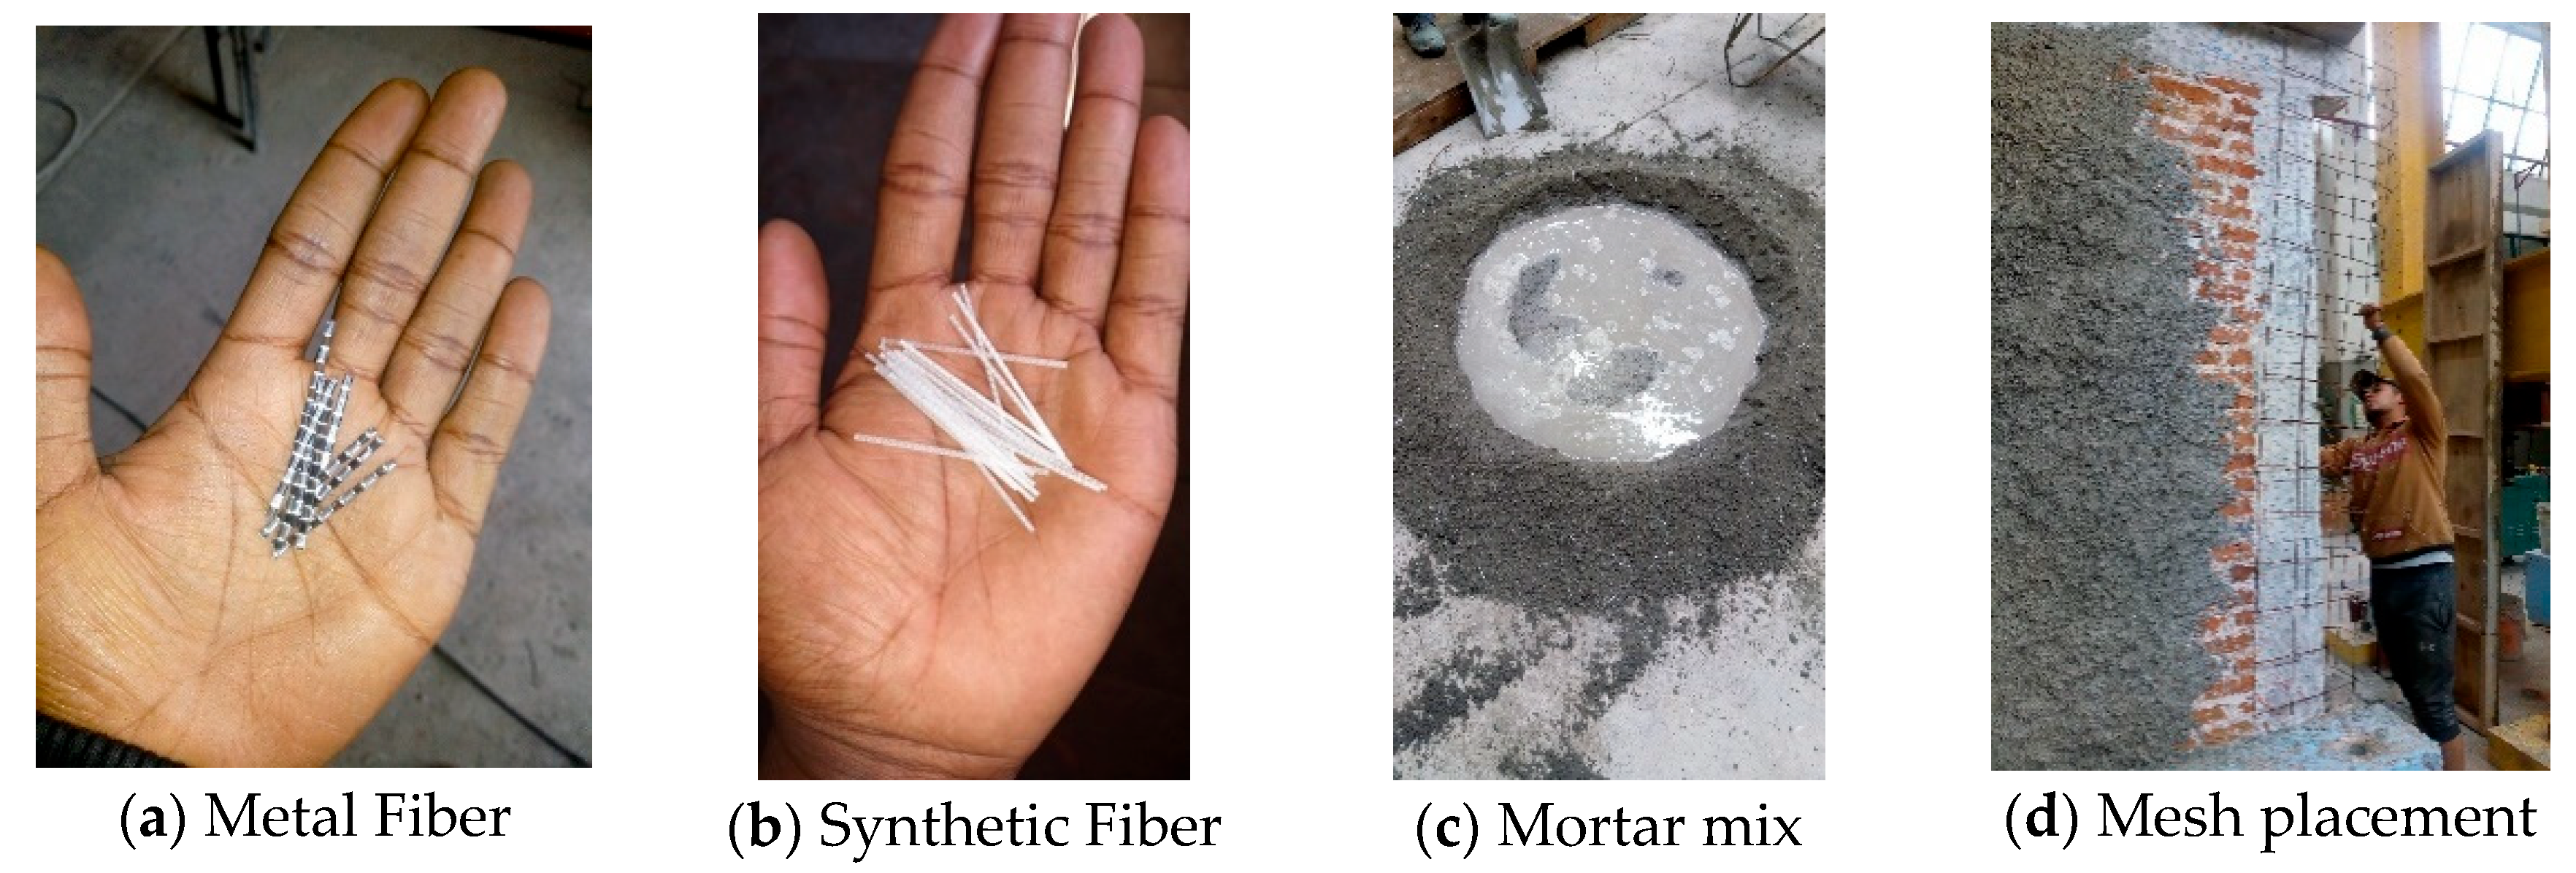
3.3. Rehabilitation with Mortar Reinforced with Fibers
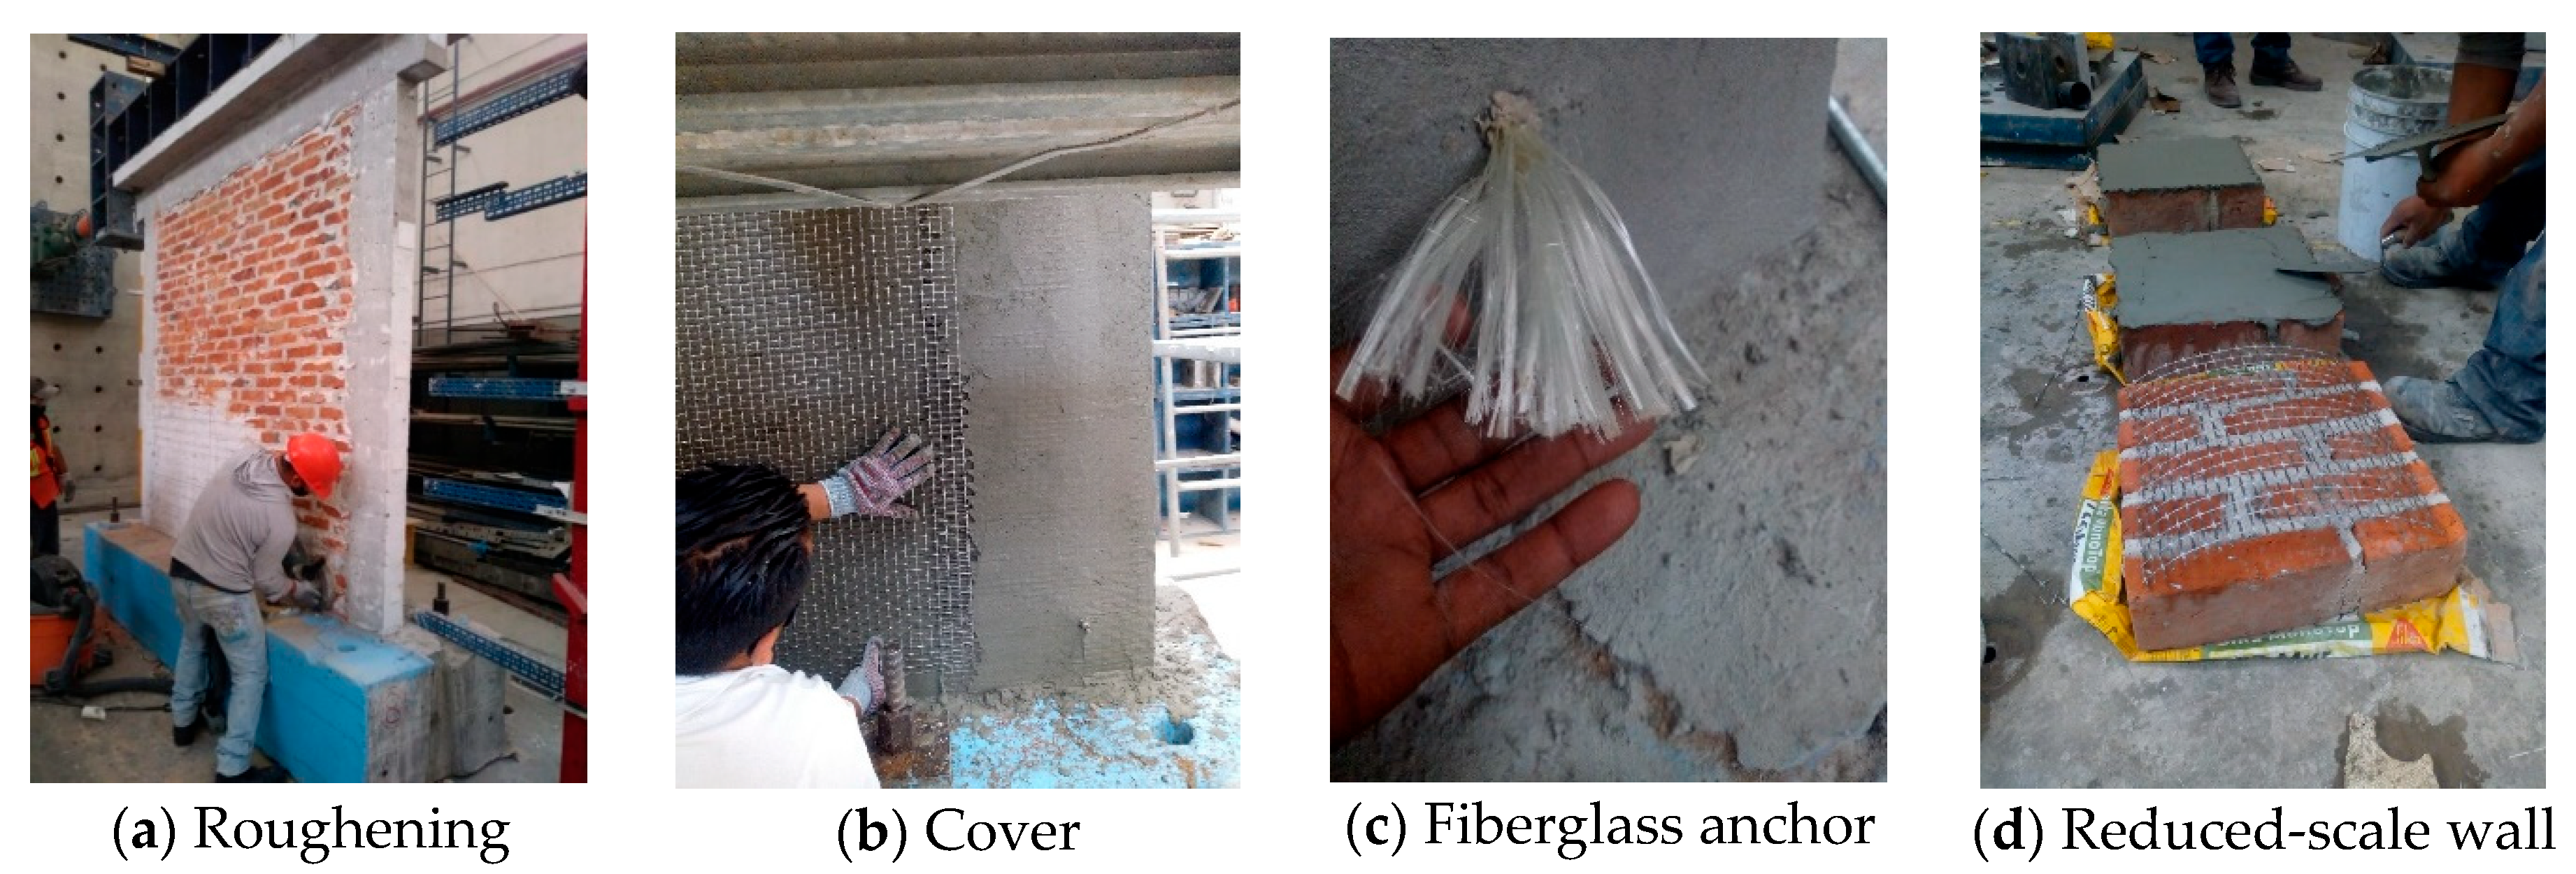
3.4. Rehabilitation with Fiberglass Mesh and Premixed Mortar
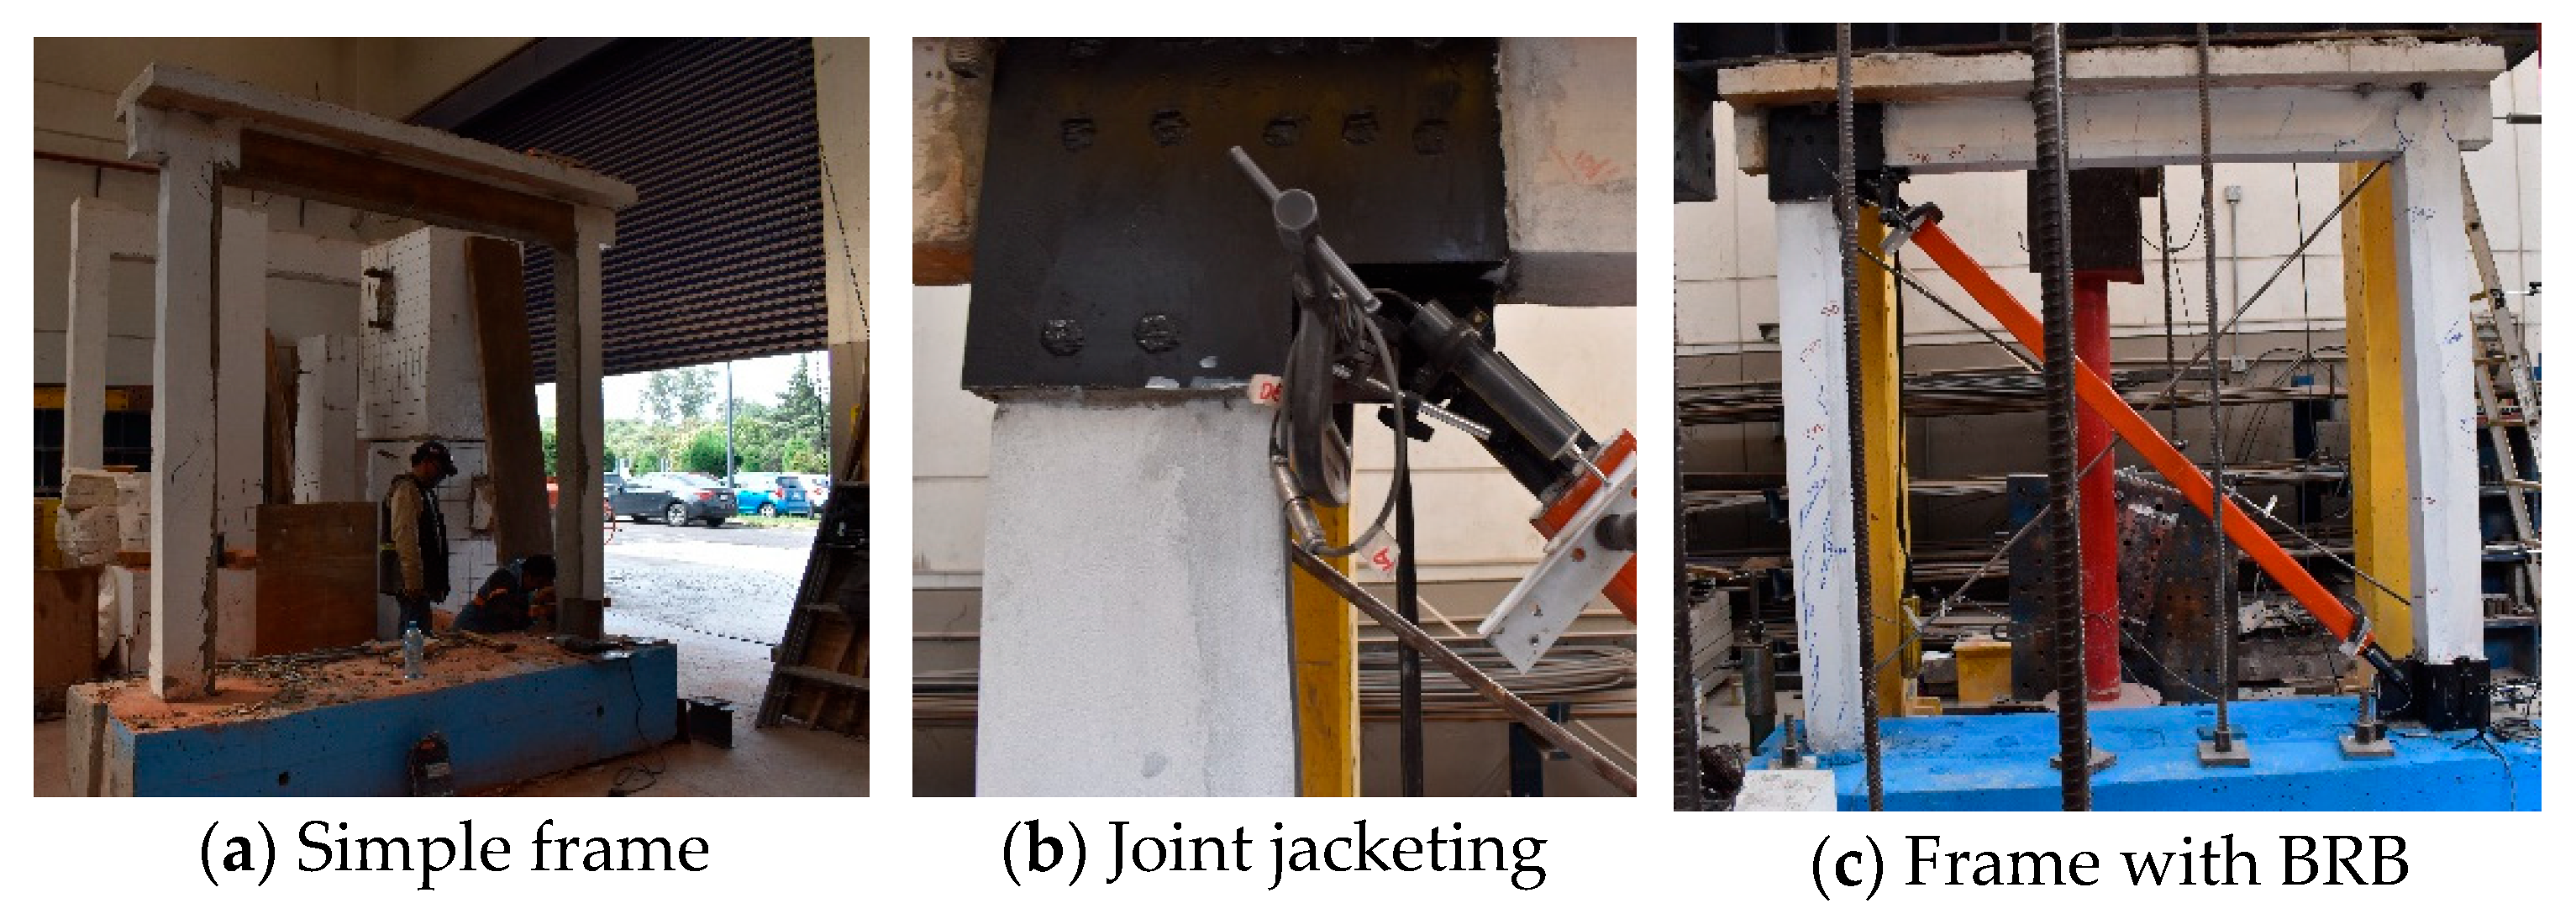
3.5. Rehabilitation with Buckling-Restrained Braces (BRB)
4. Experimental Results
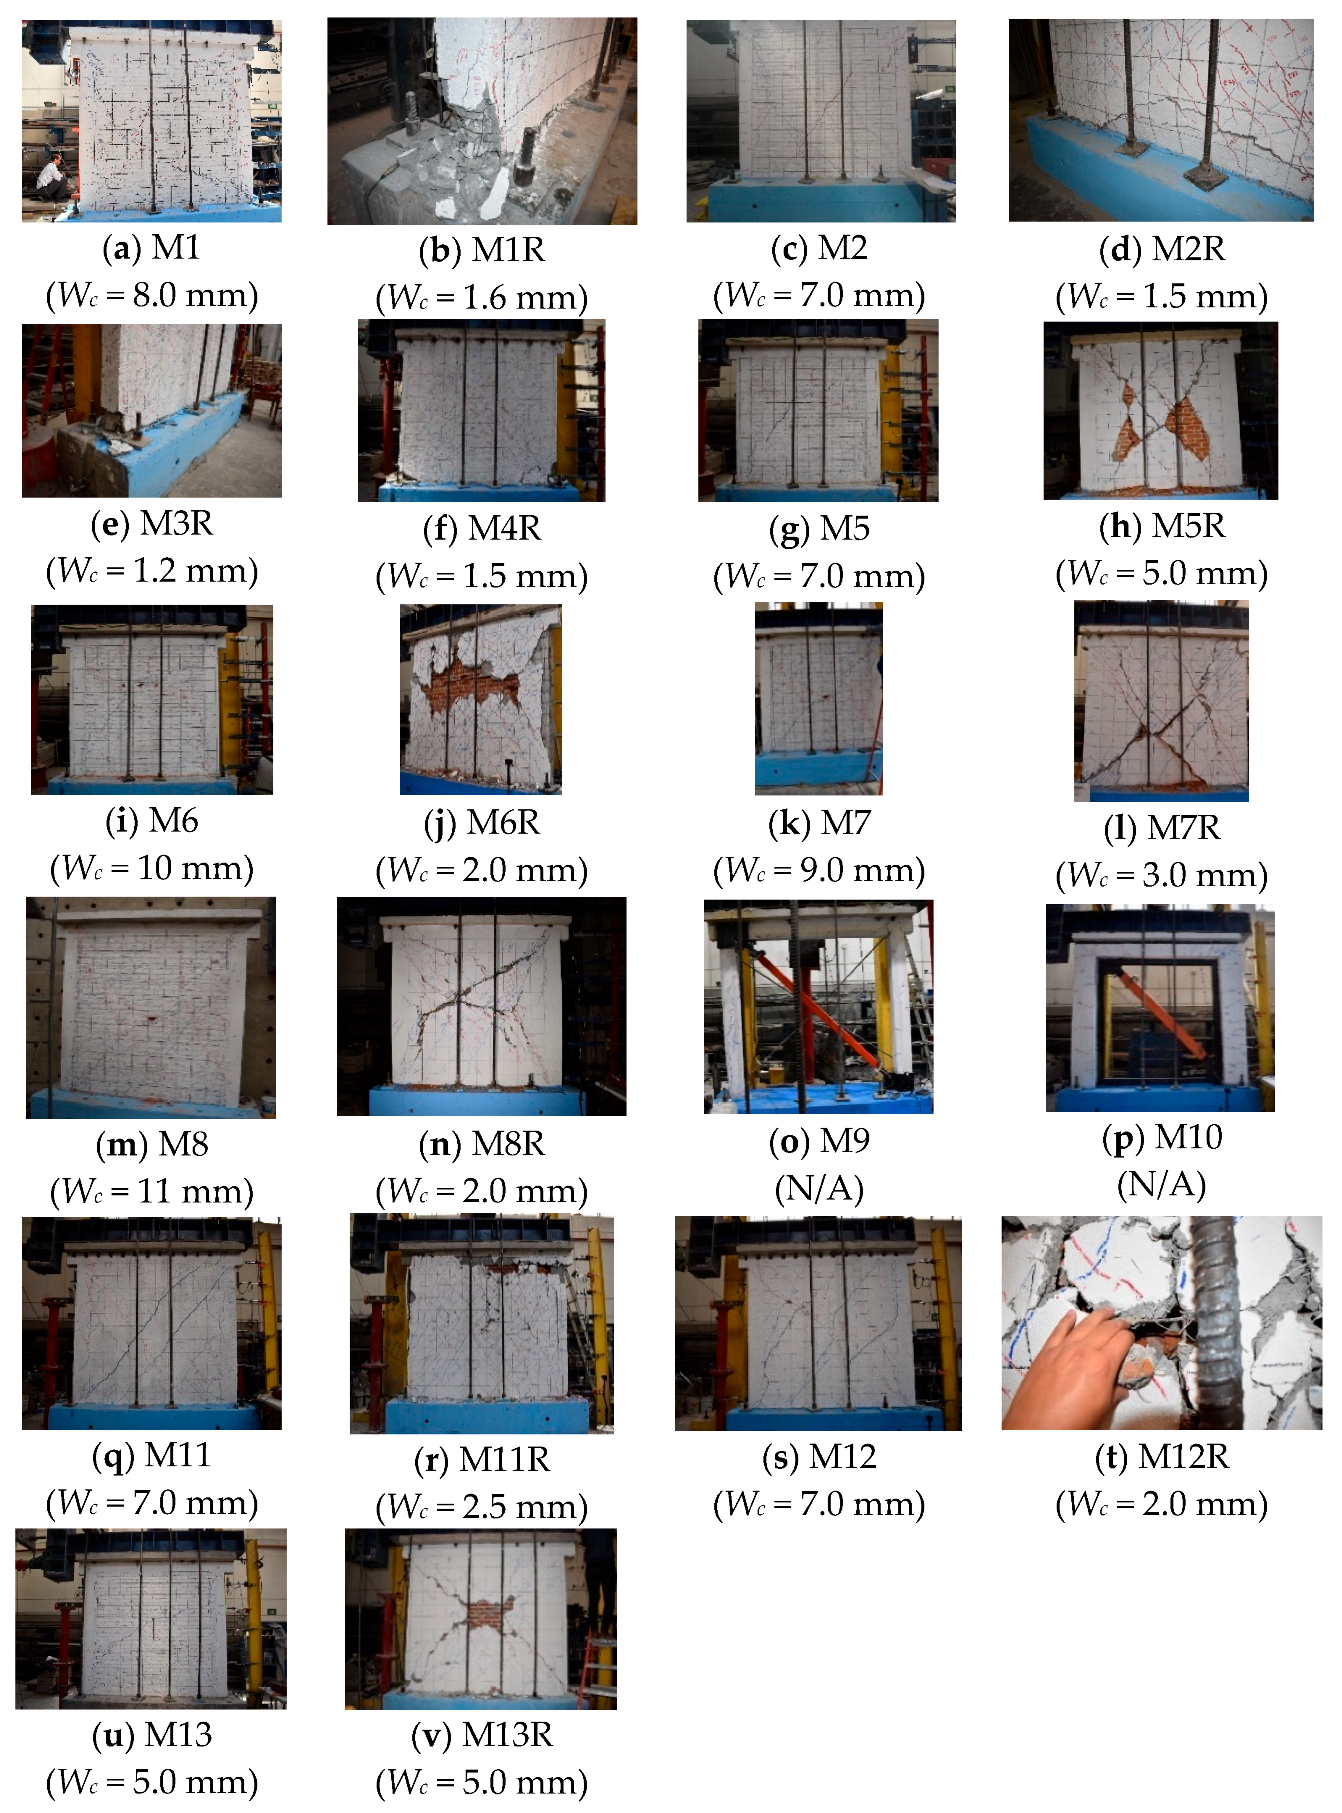
4.1. Assessment of Cracking
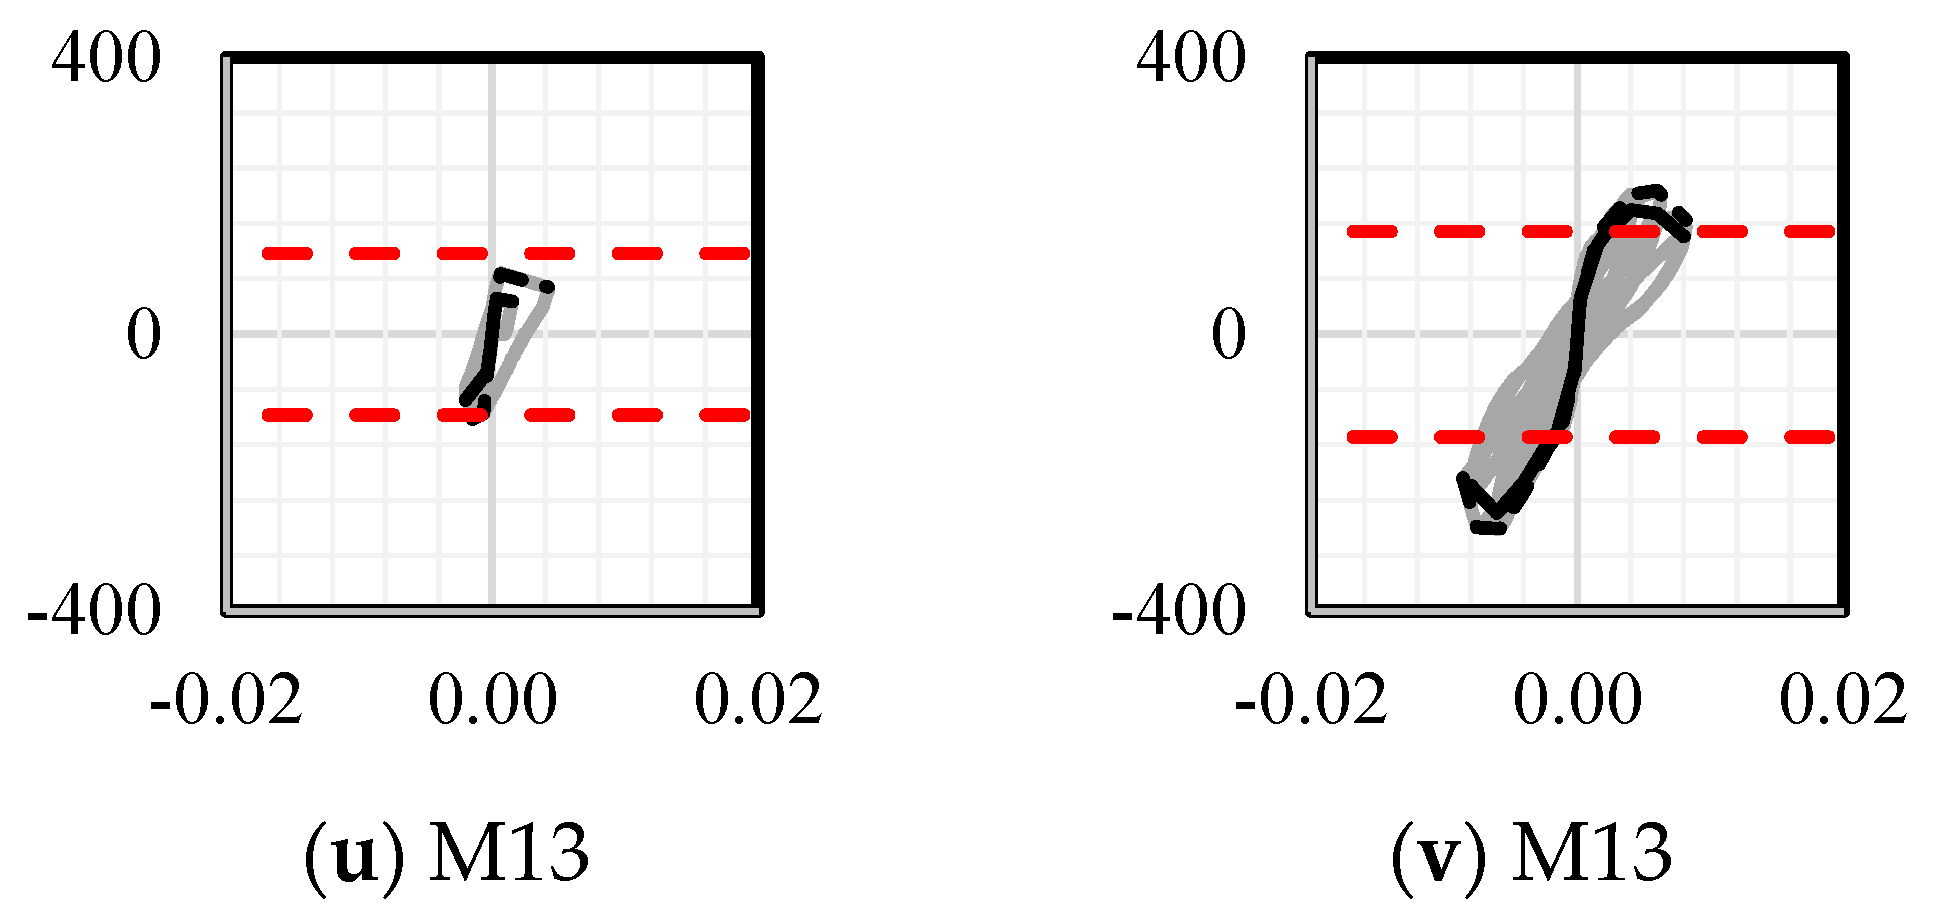
4.2. Load-Deformation Curves
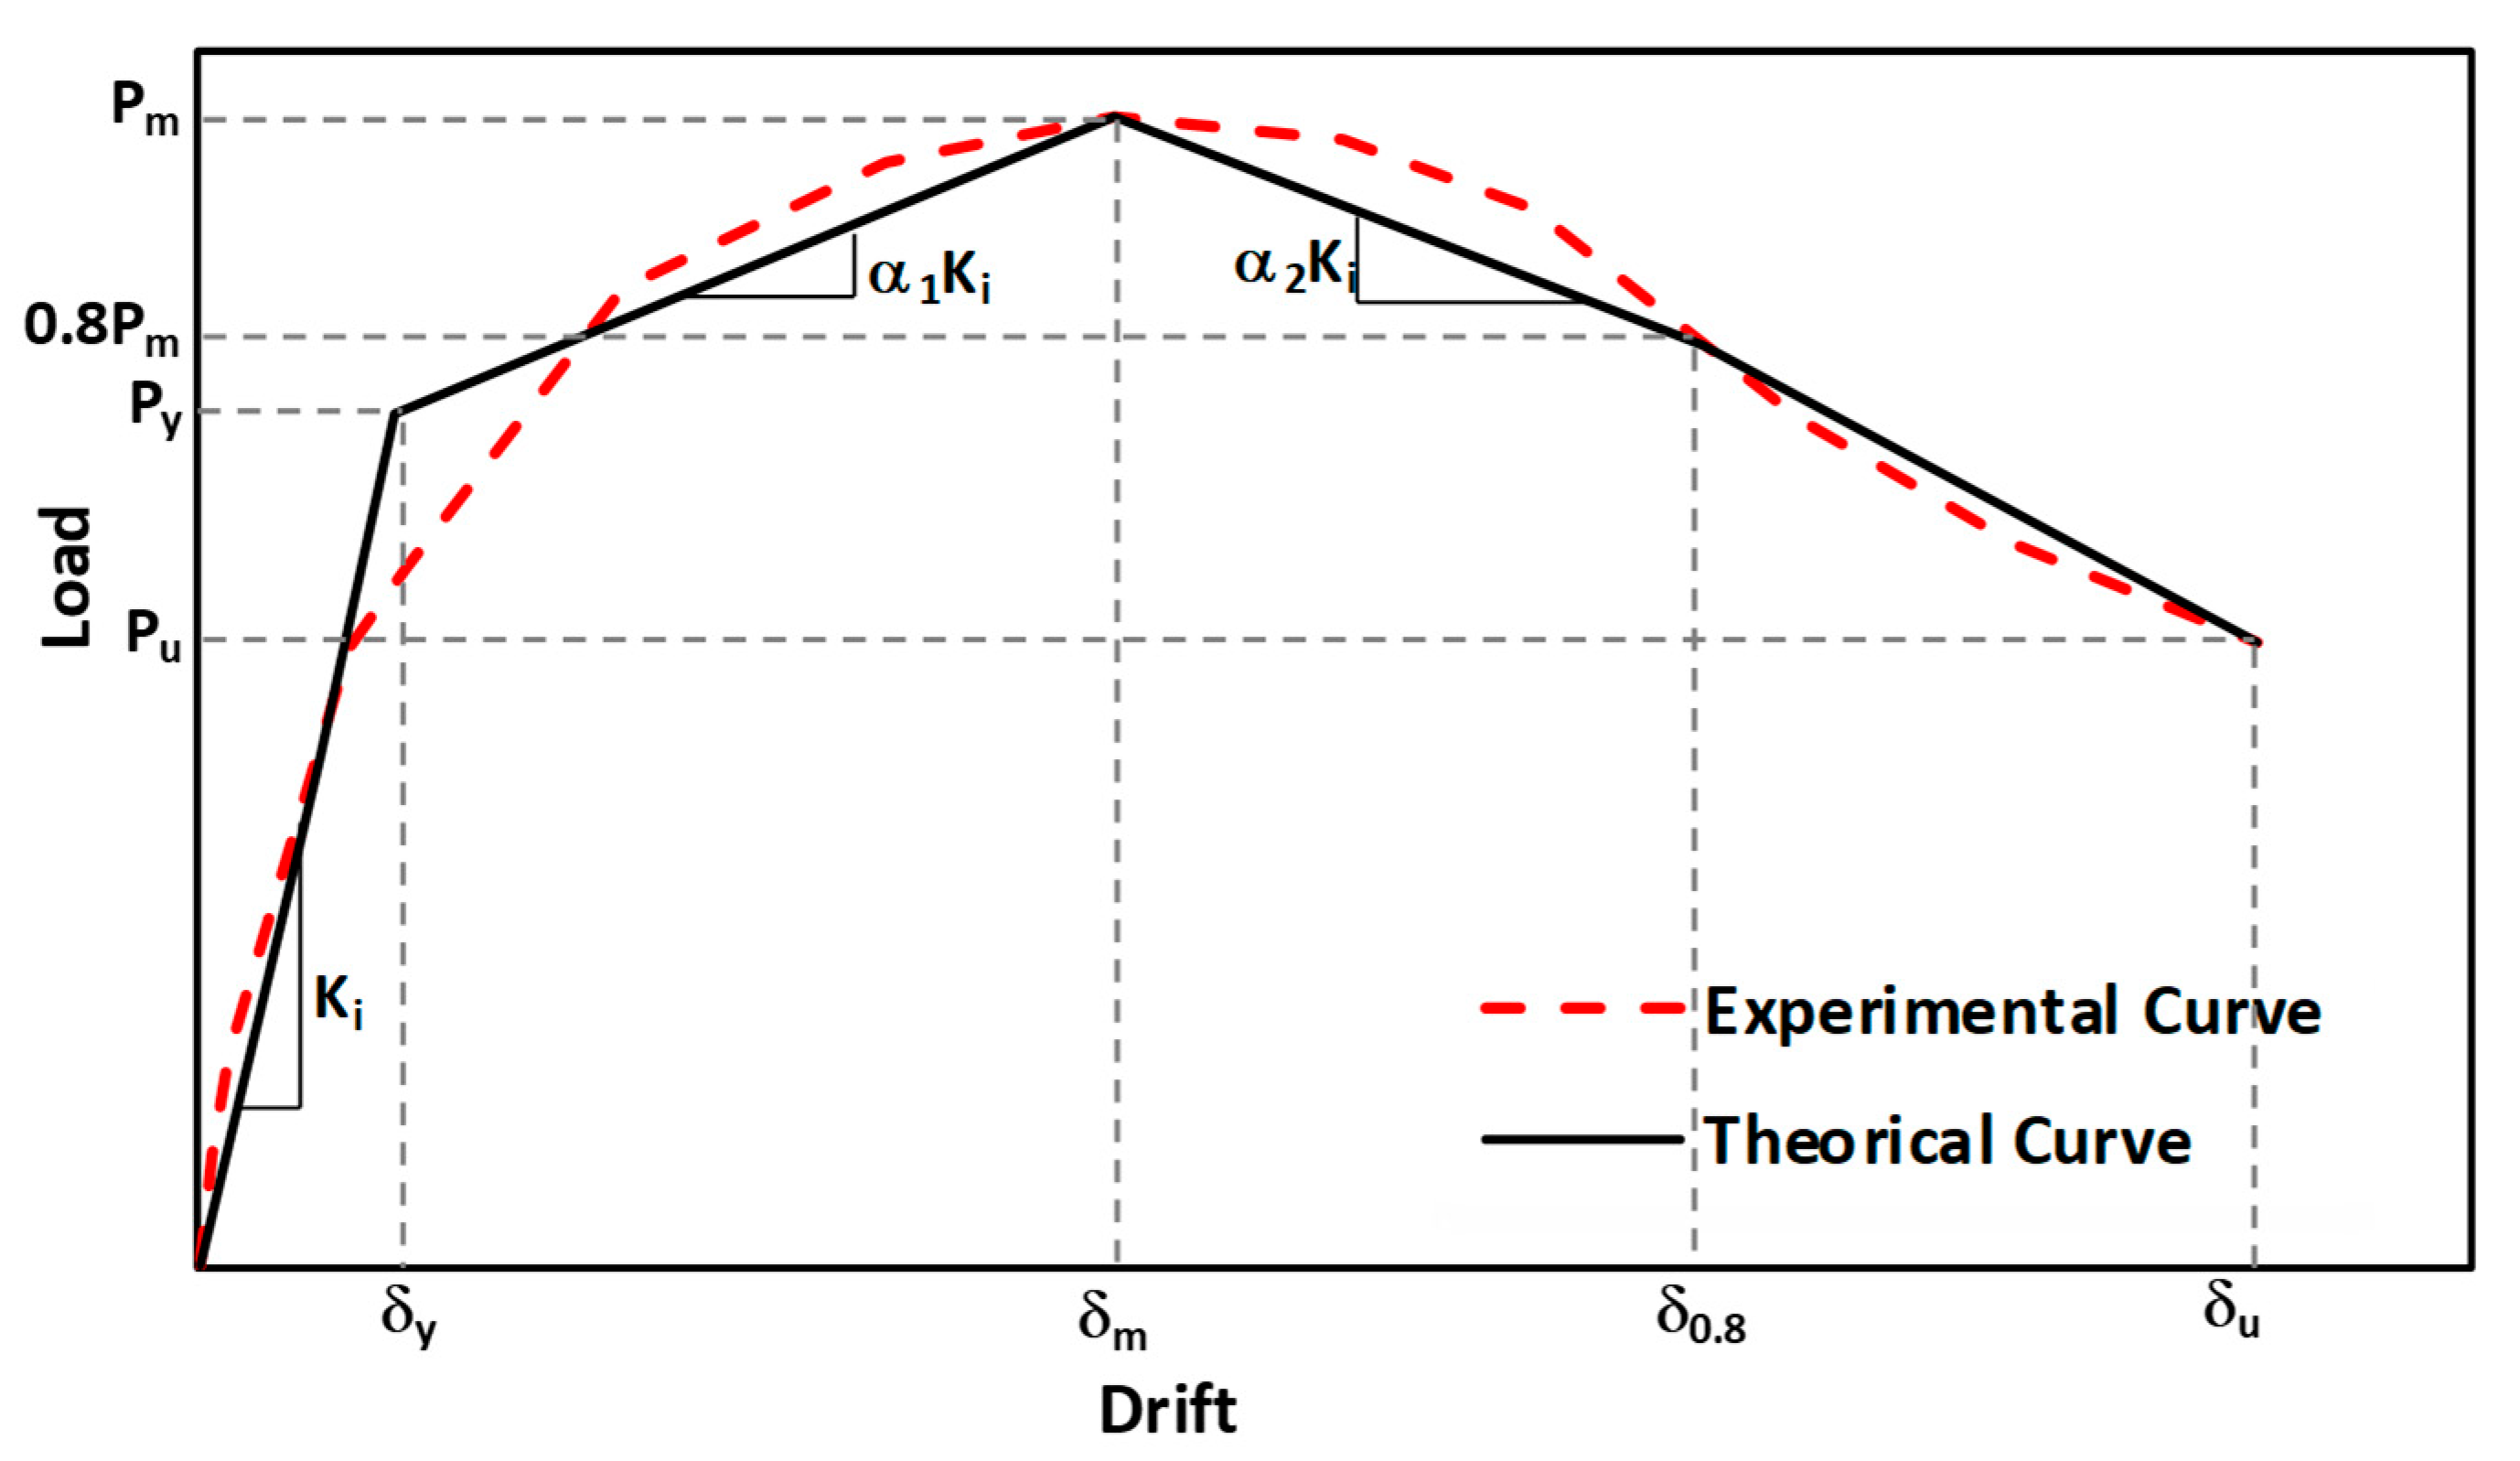
4.3. Backbone Curves
- (a)
- The area under the curve of the equivalent bilinear model that of the load-deformation envelope obtained experimentally must be equal;
- (b)
- The ascending branch of the equivalent bilinear model must intersect the experimental envelope at 0.6 P𝑦, where Py is the bilinear model yield load point.
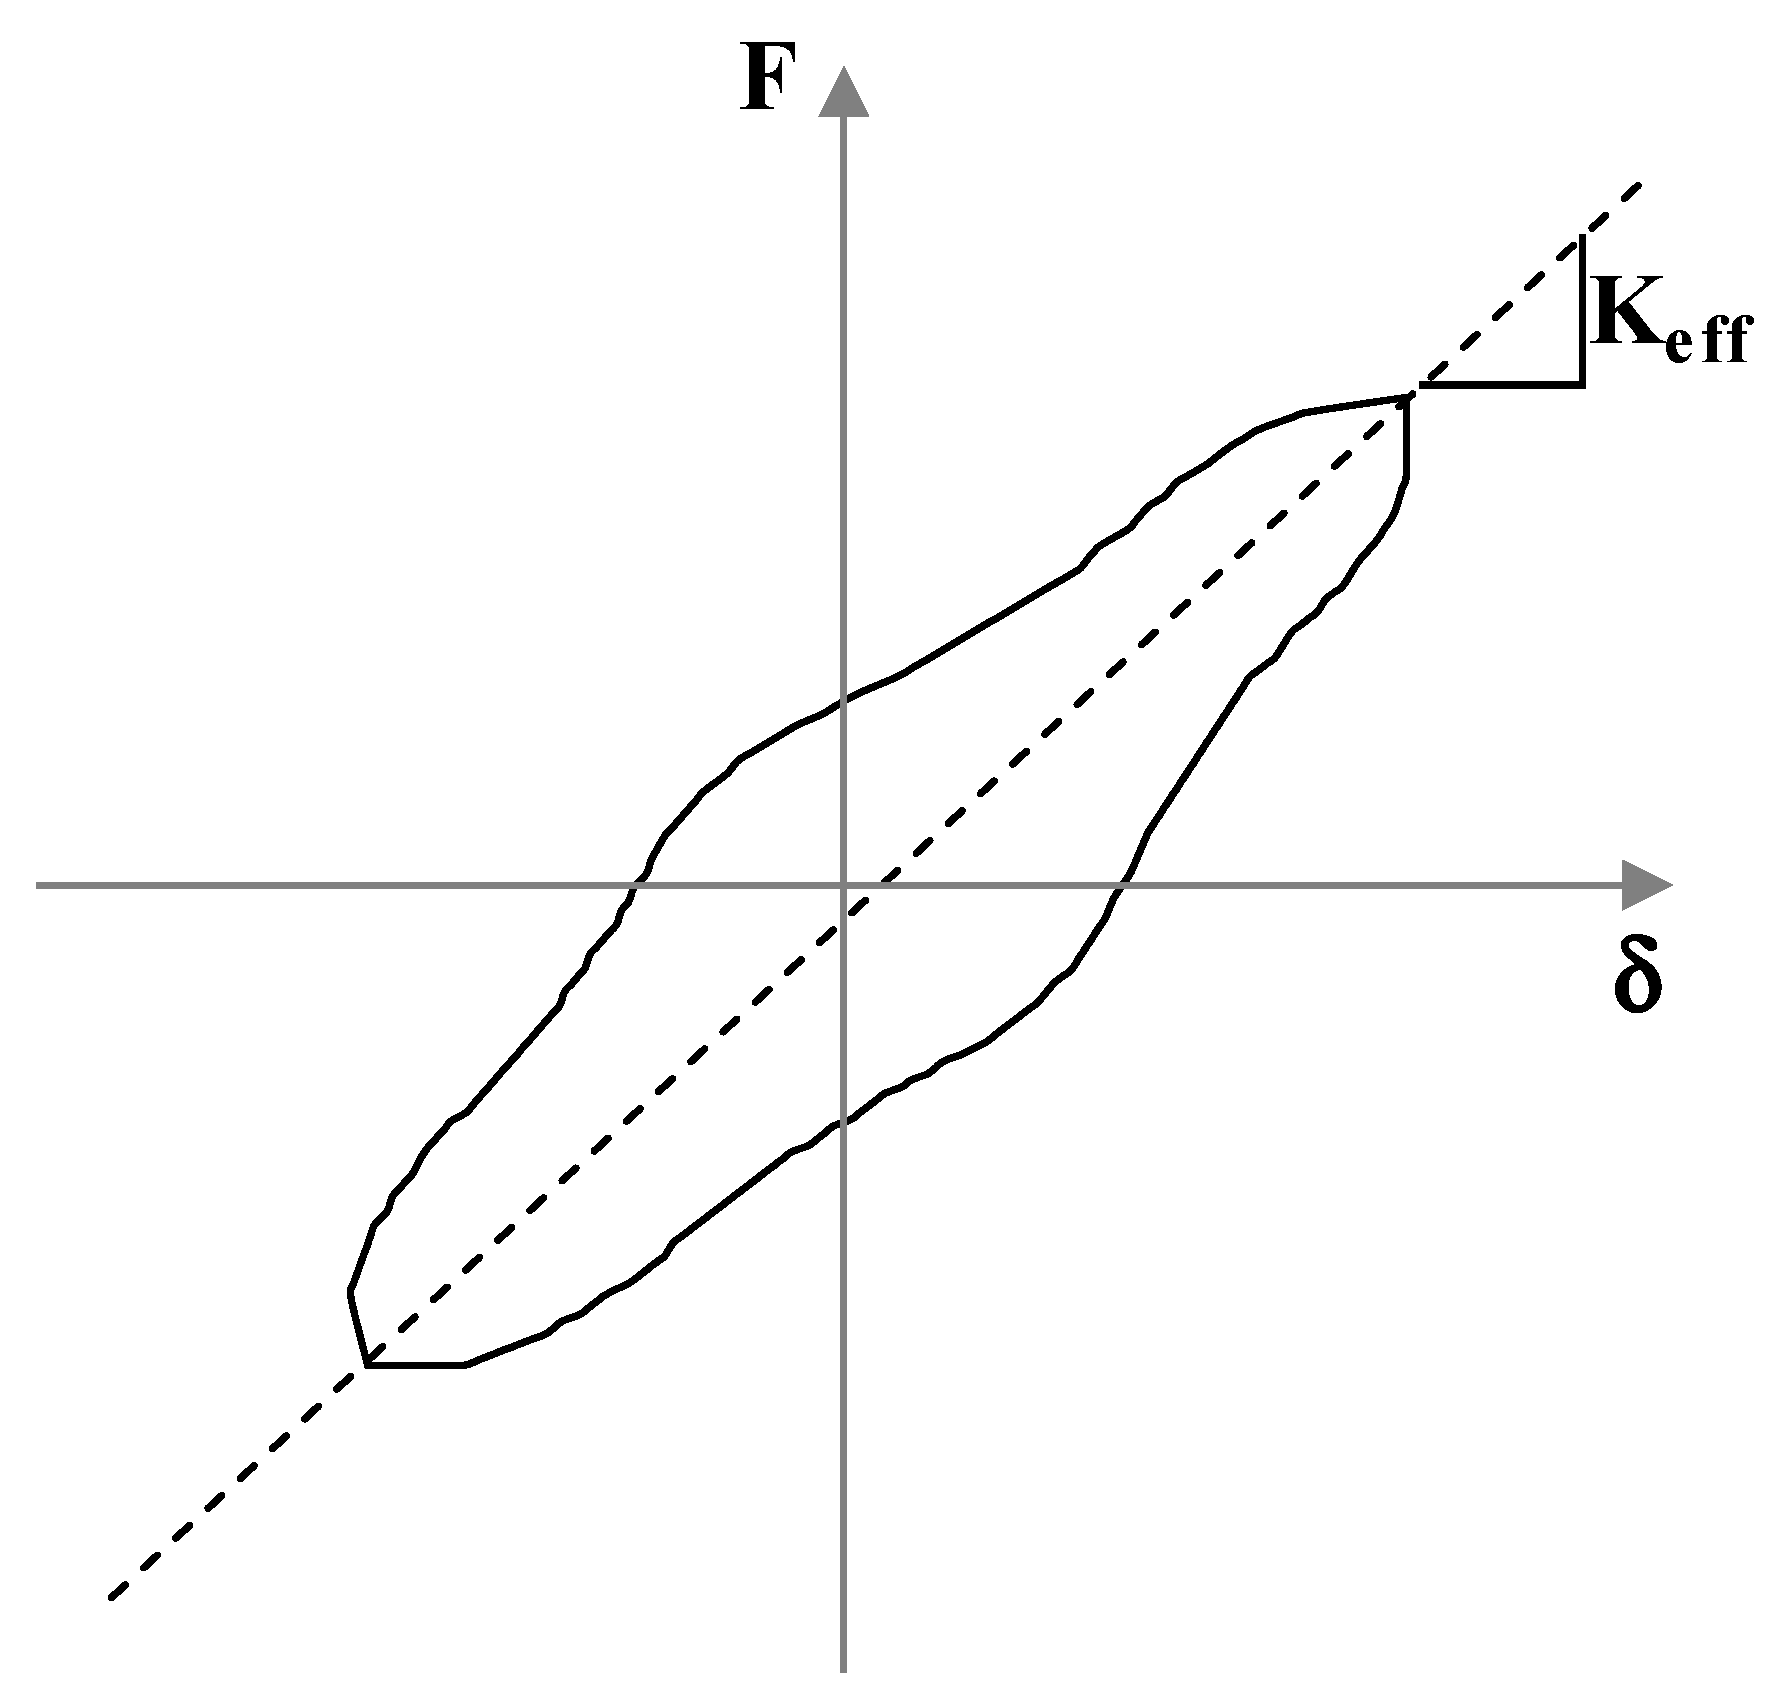
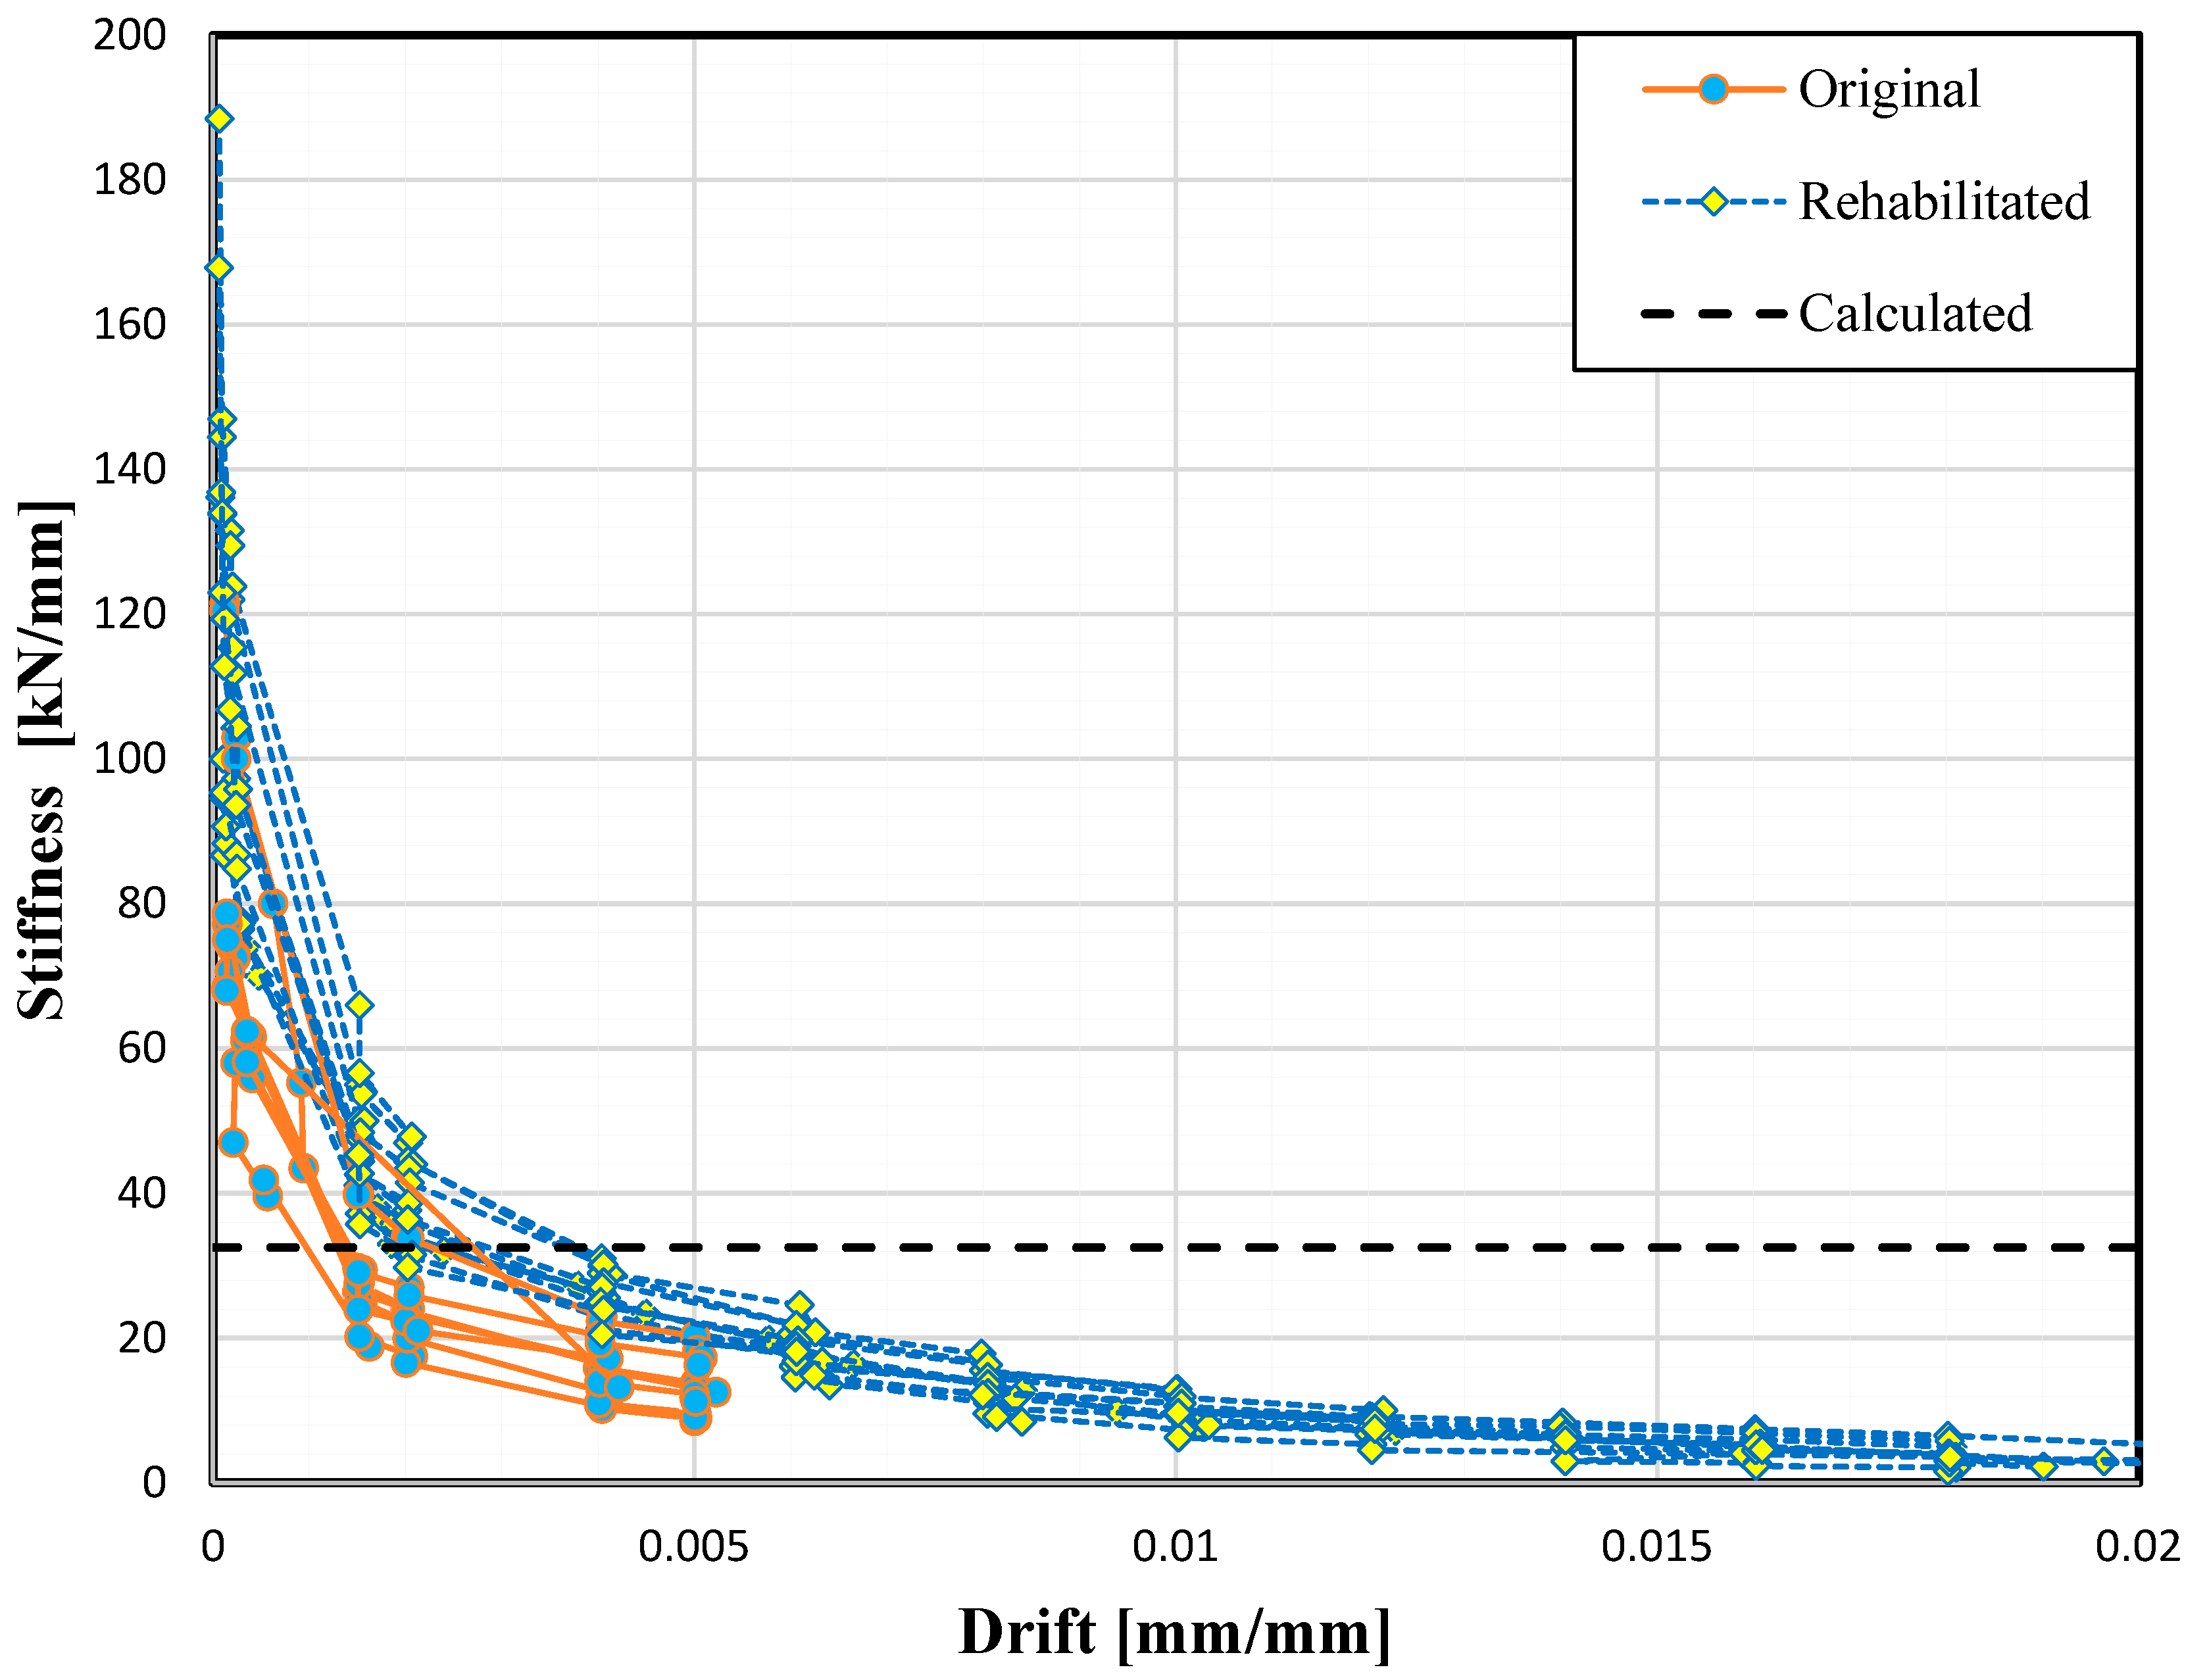
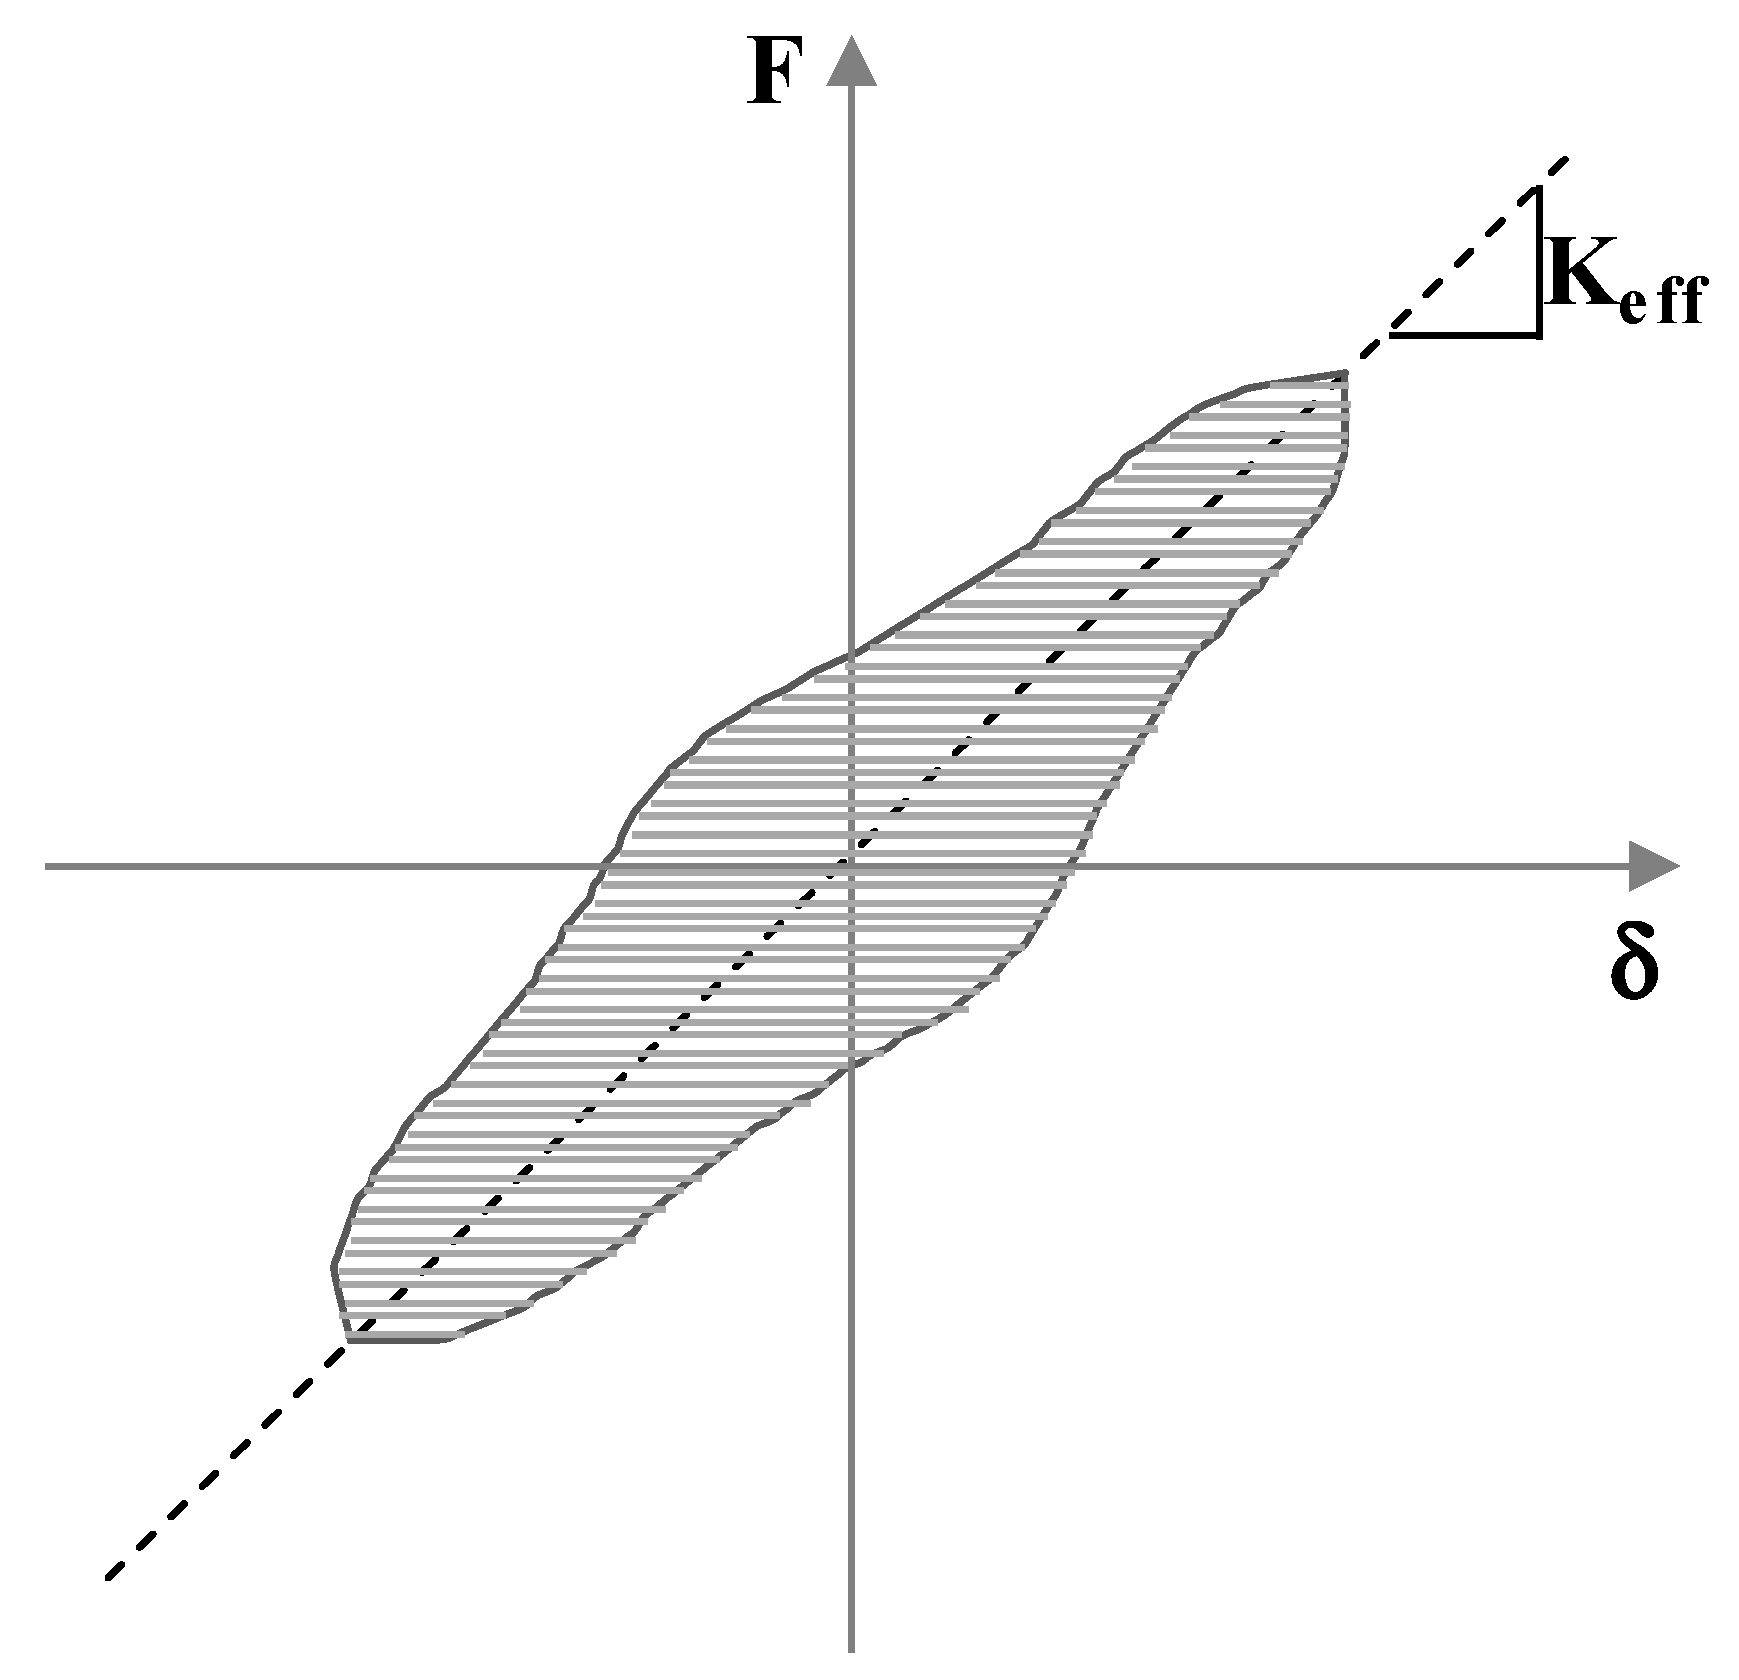
4.4. Stiffness Degradation
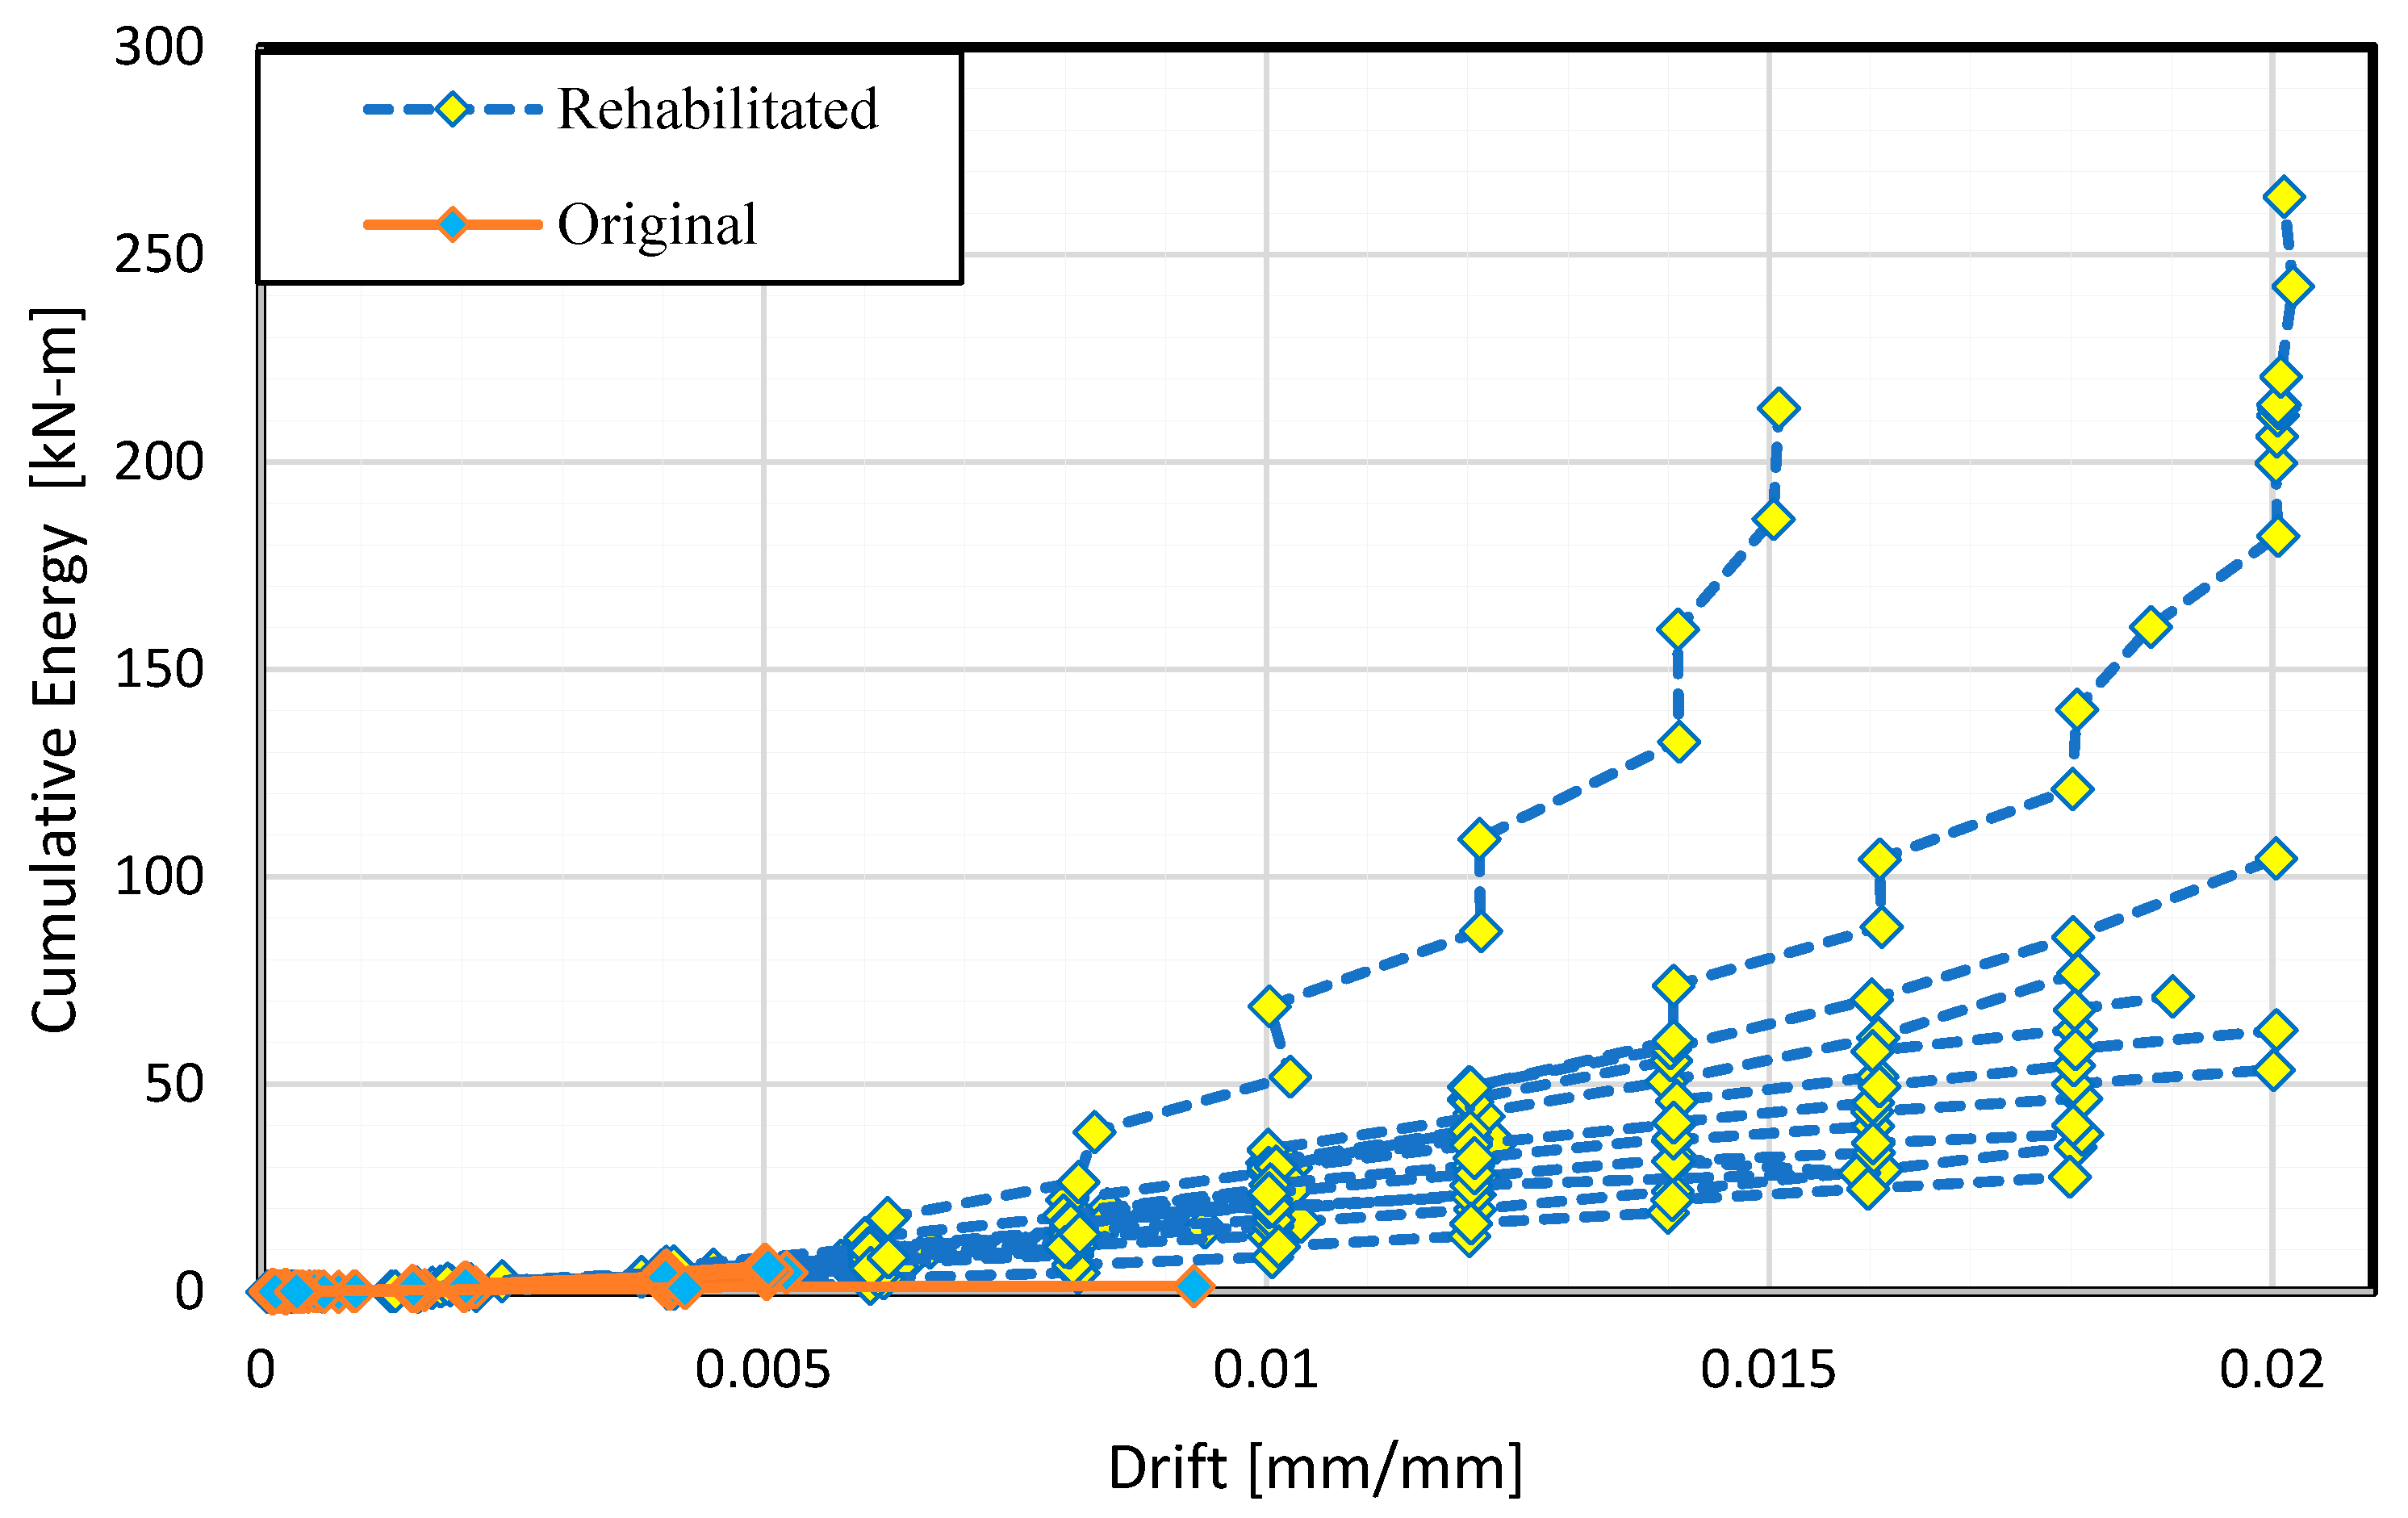
4.5. Energy Dissipation
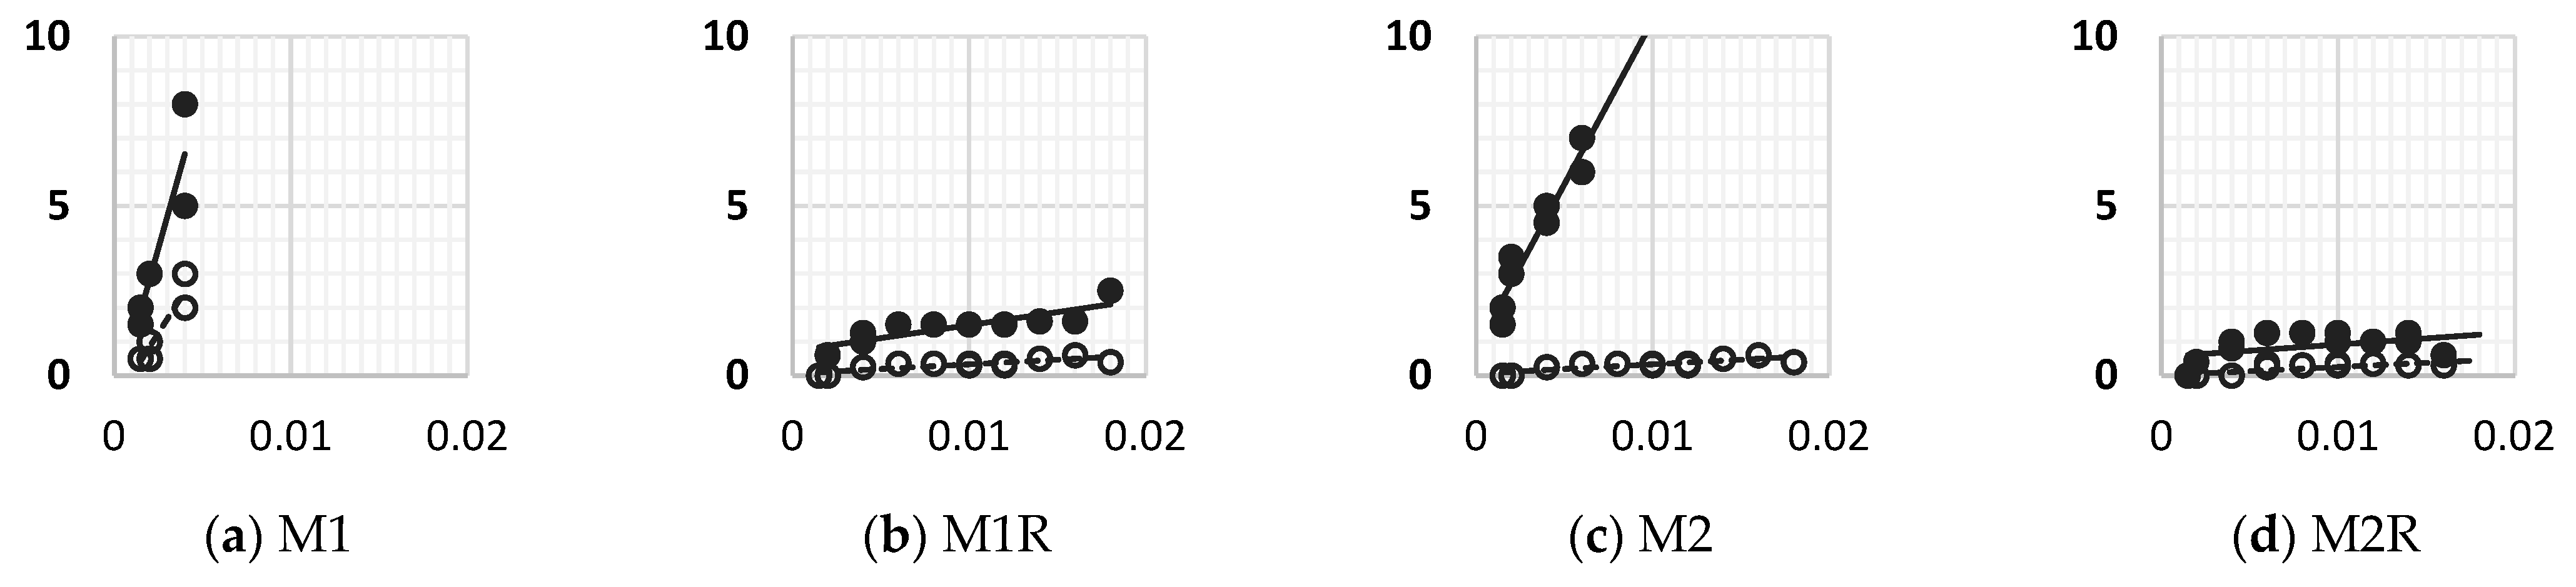
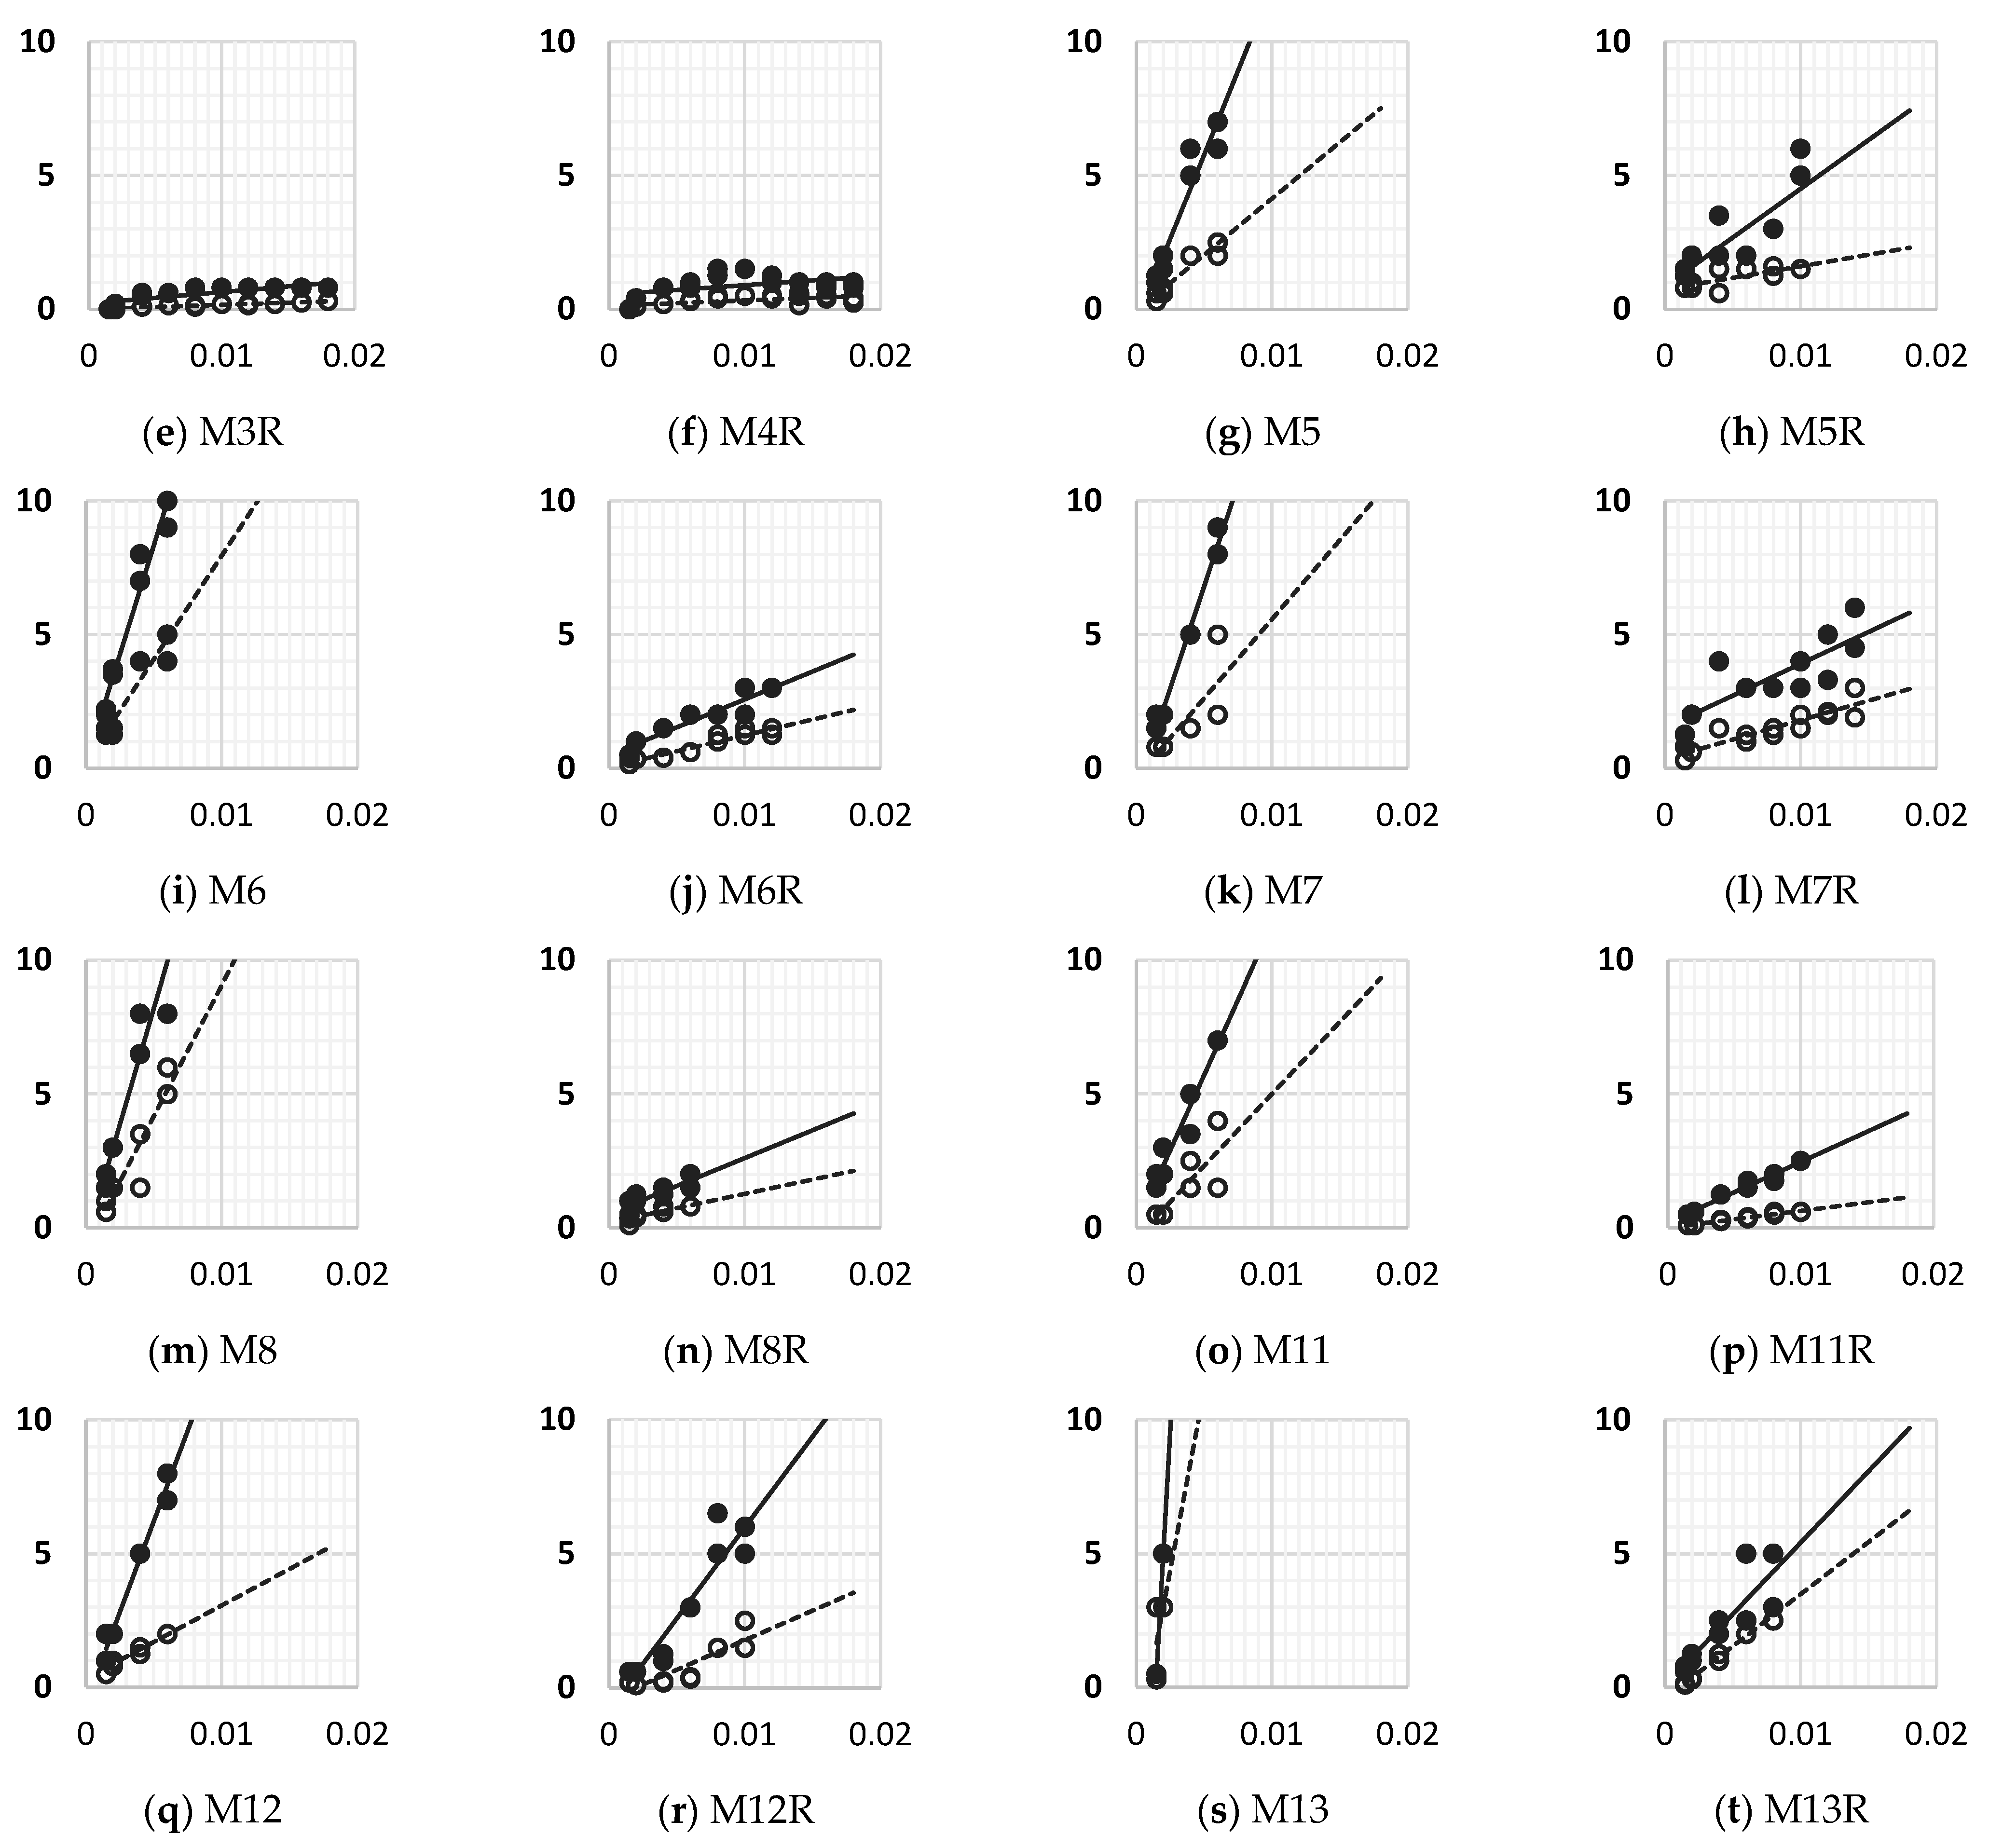
4.6. Crack Widths
5. Discussion
5.1. General Aspects
5.2. Effects of the Initial Damage
5.3. Effects of the Area of Steel of the Wire Mesh
5.4. Effects of the Type of Wire Mesh Anchorage
5.5. Effects of Fibers Combined with Wire Mesh
5.6. Effects of Buckling-Restrained Braces
5.7. Effects of Prefabricated Steel Welded Wire Cage
5.8. Comparison of the Rehabilitation Costs
6. Conclusions
- (1)
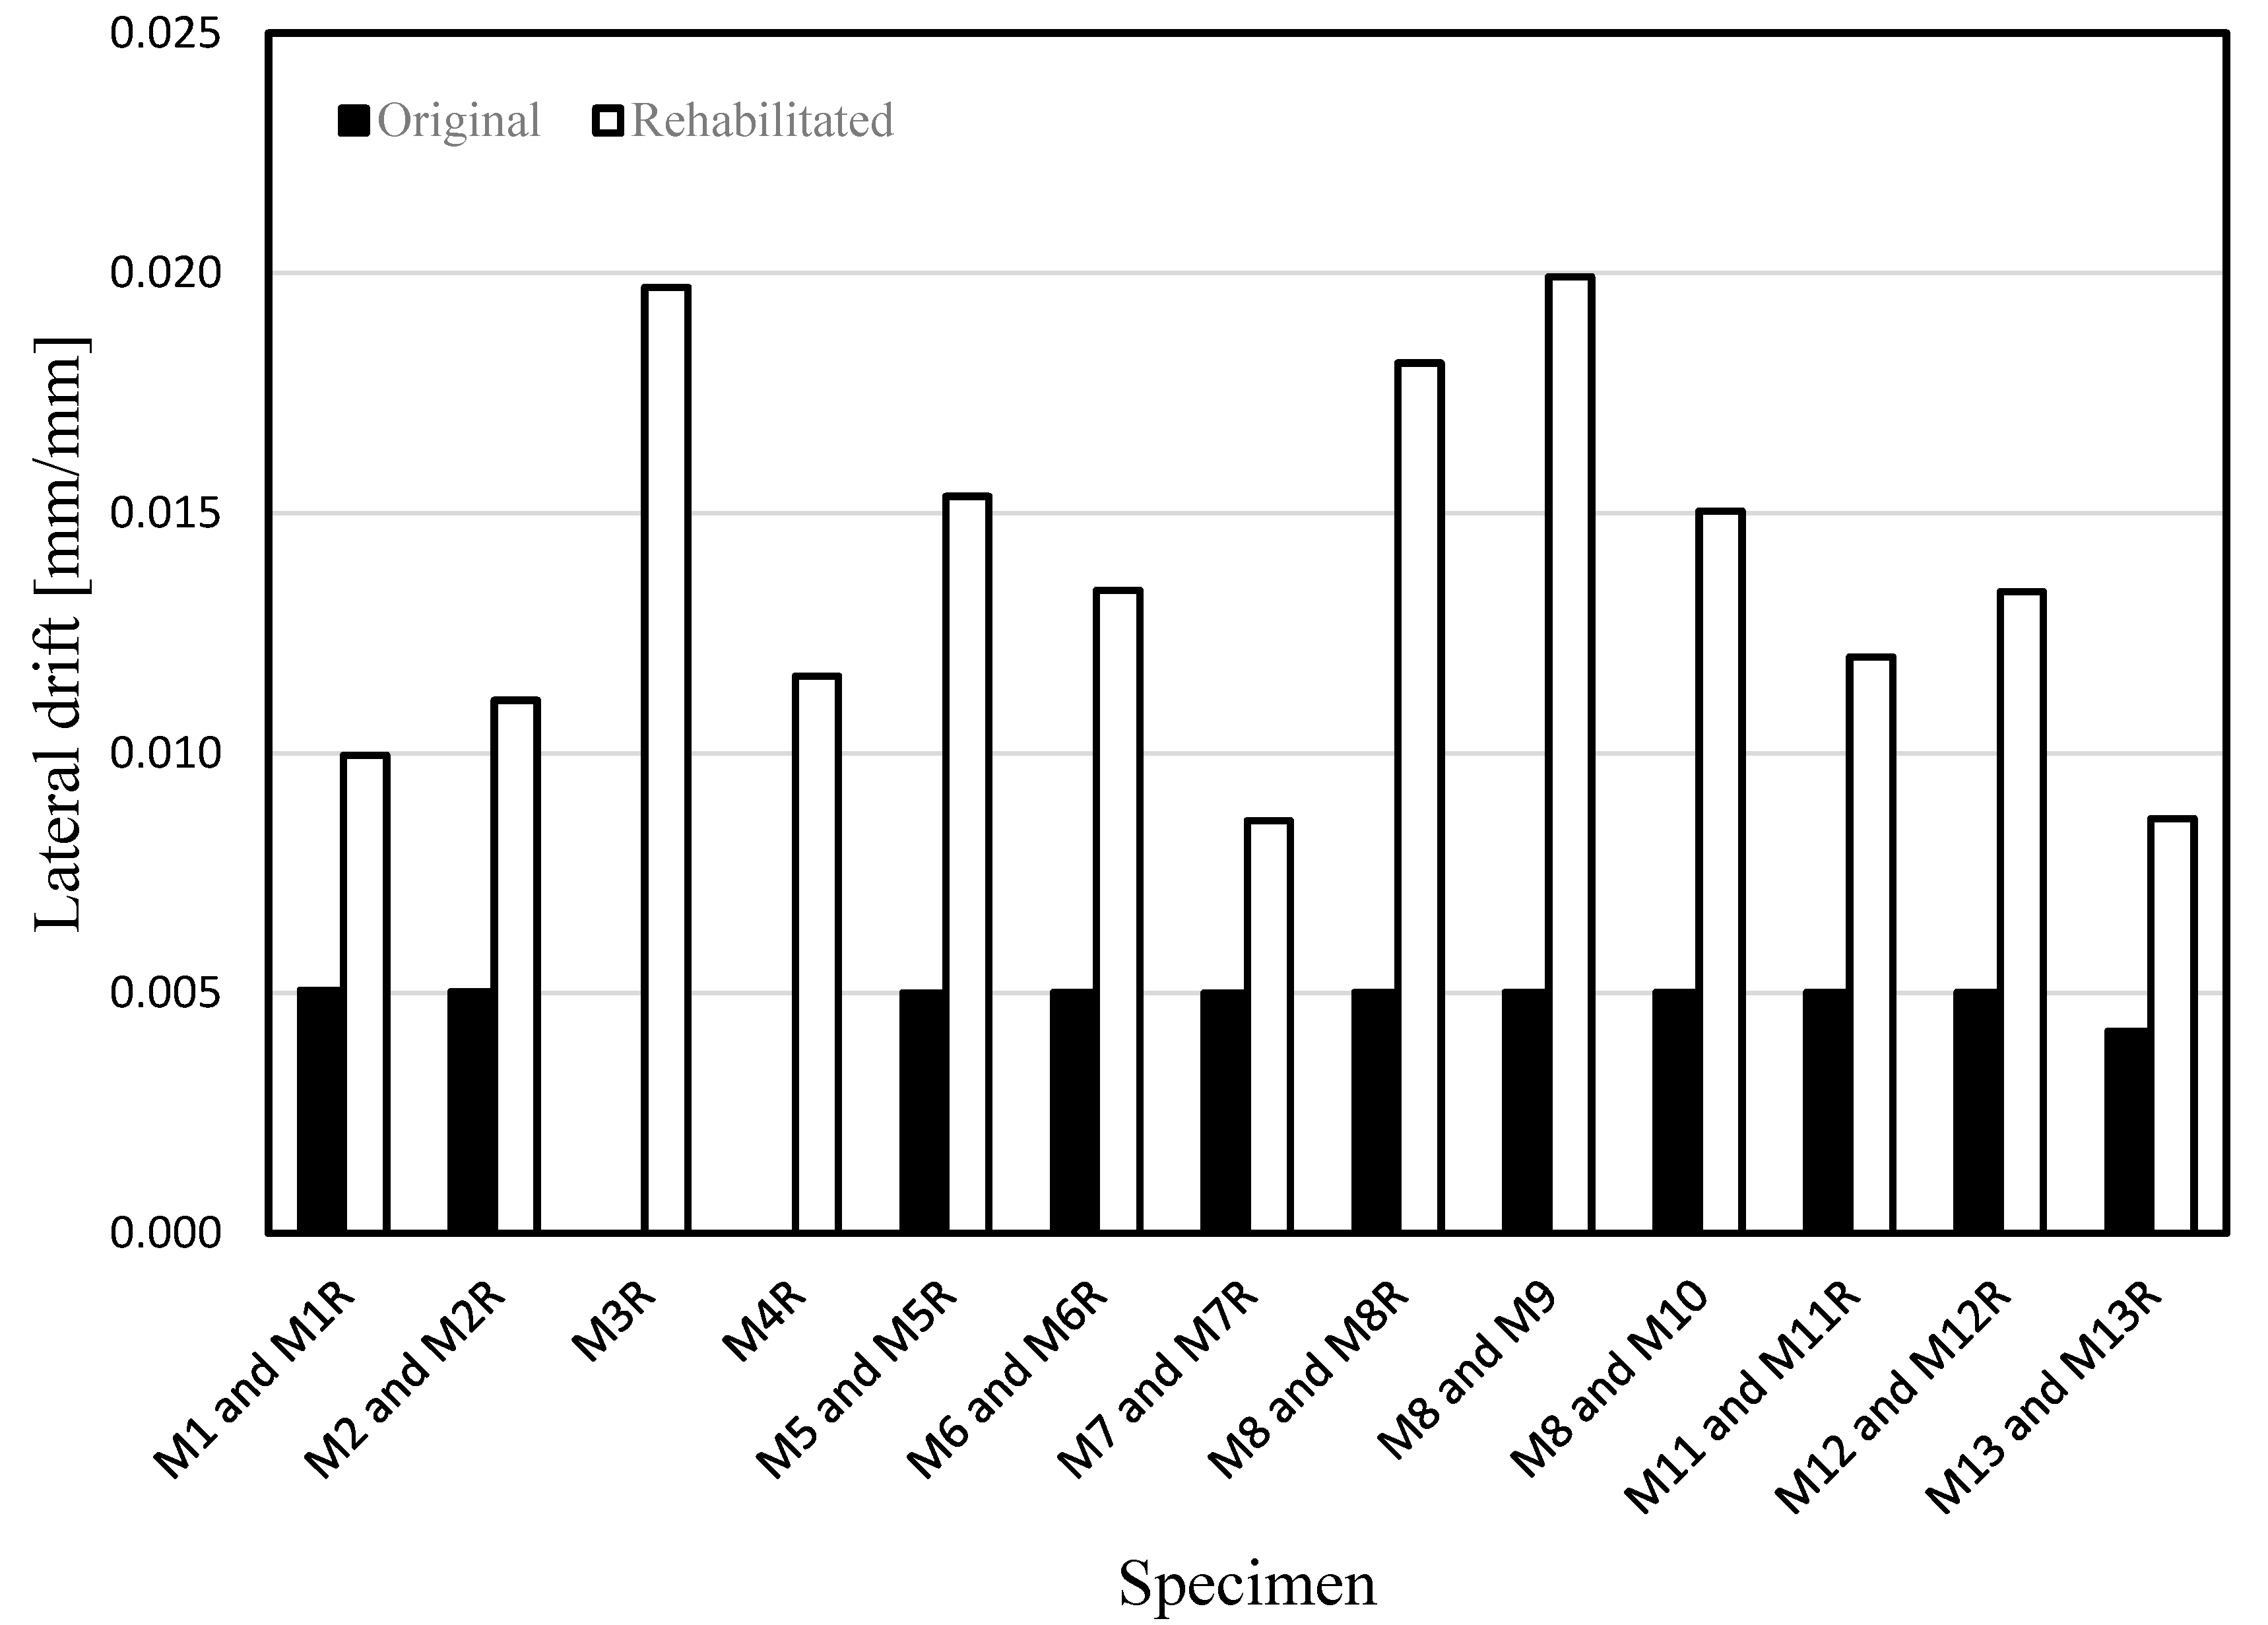
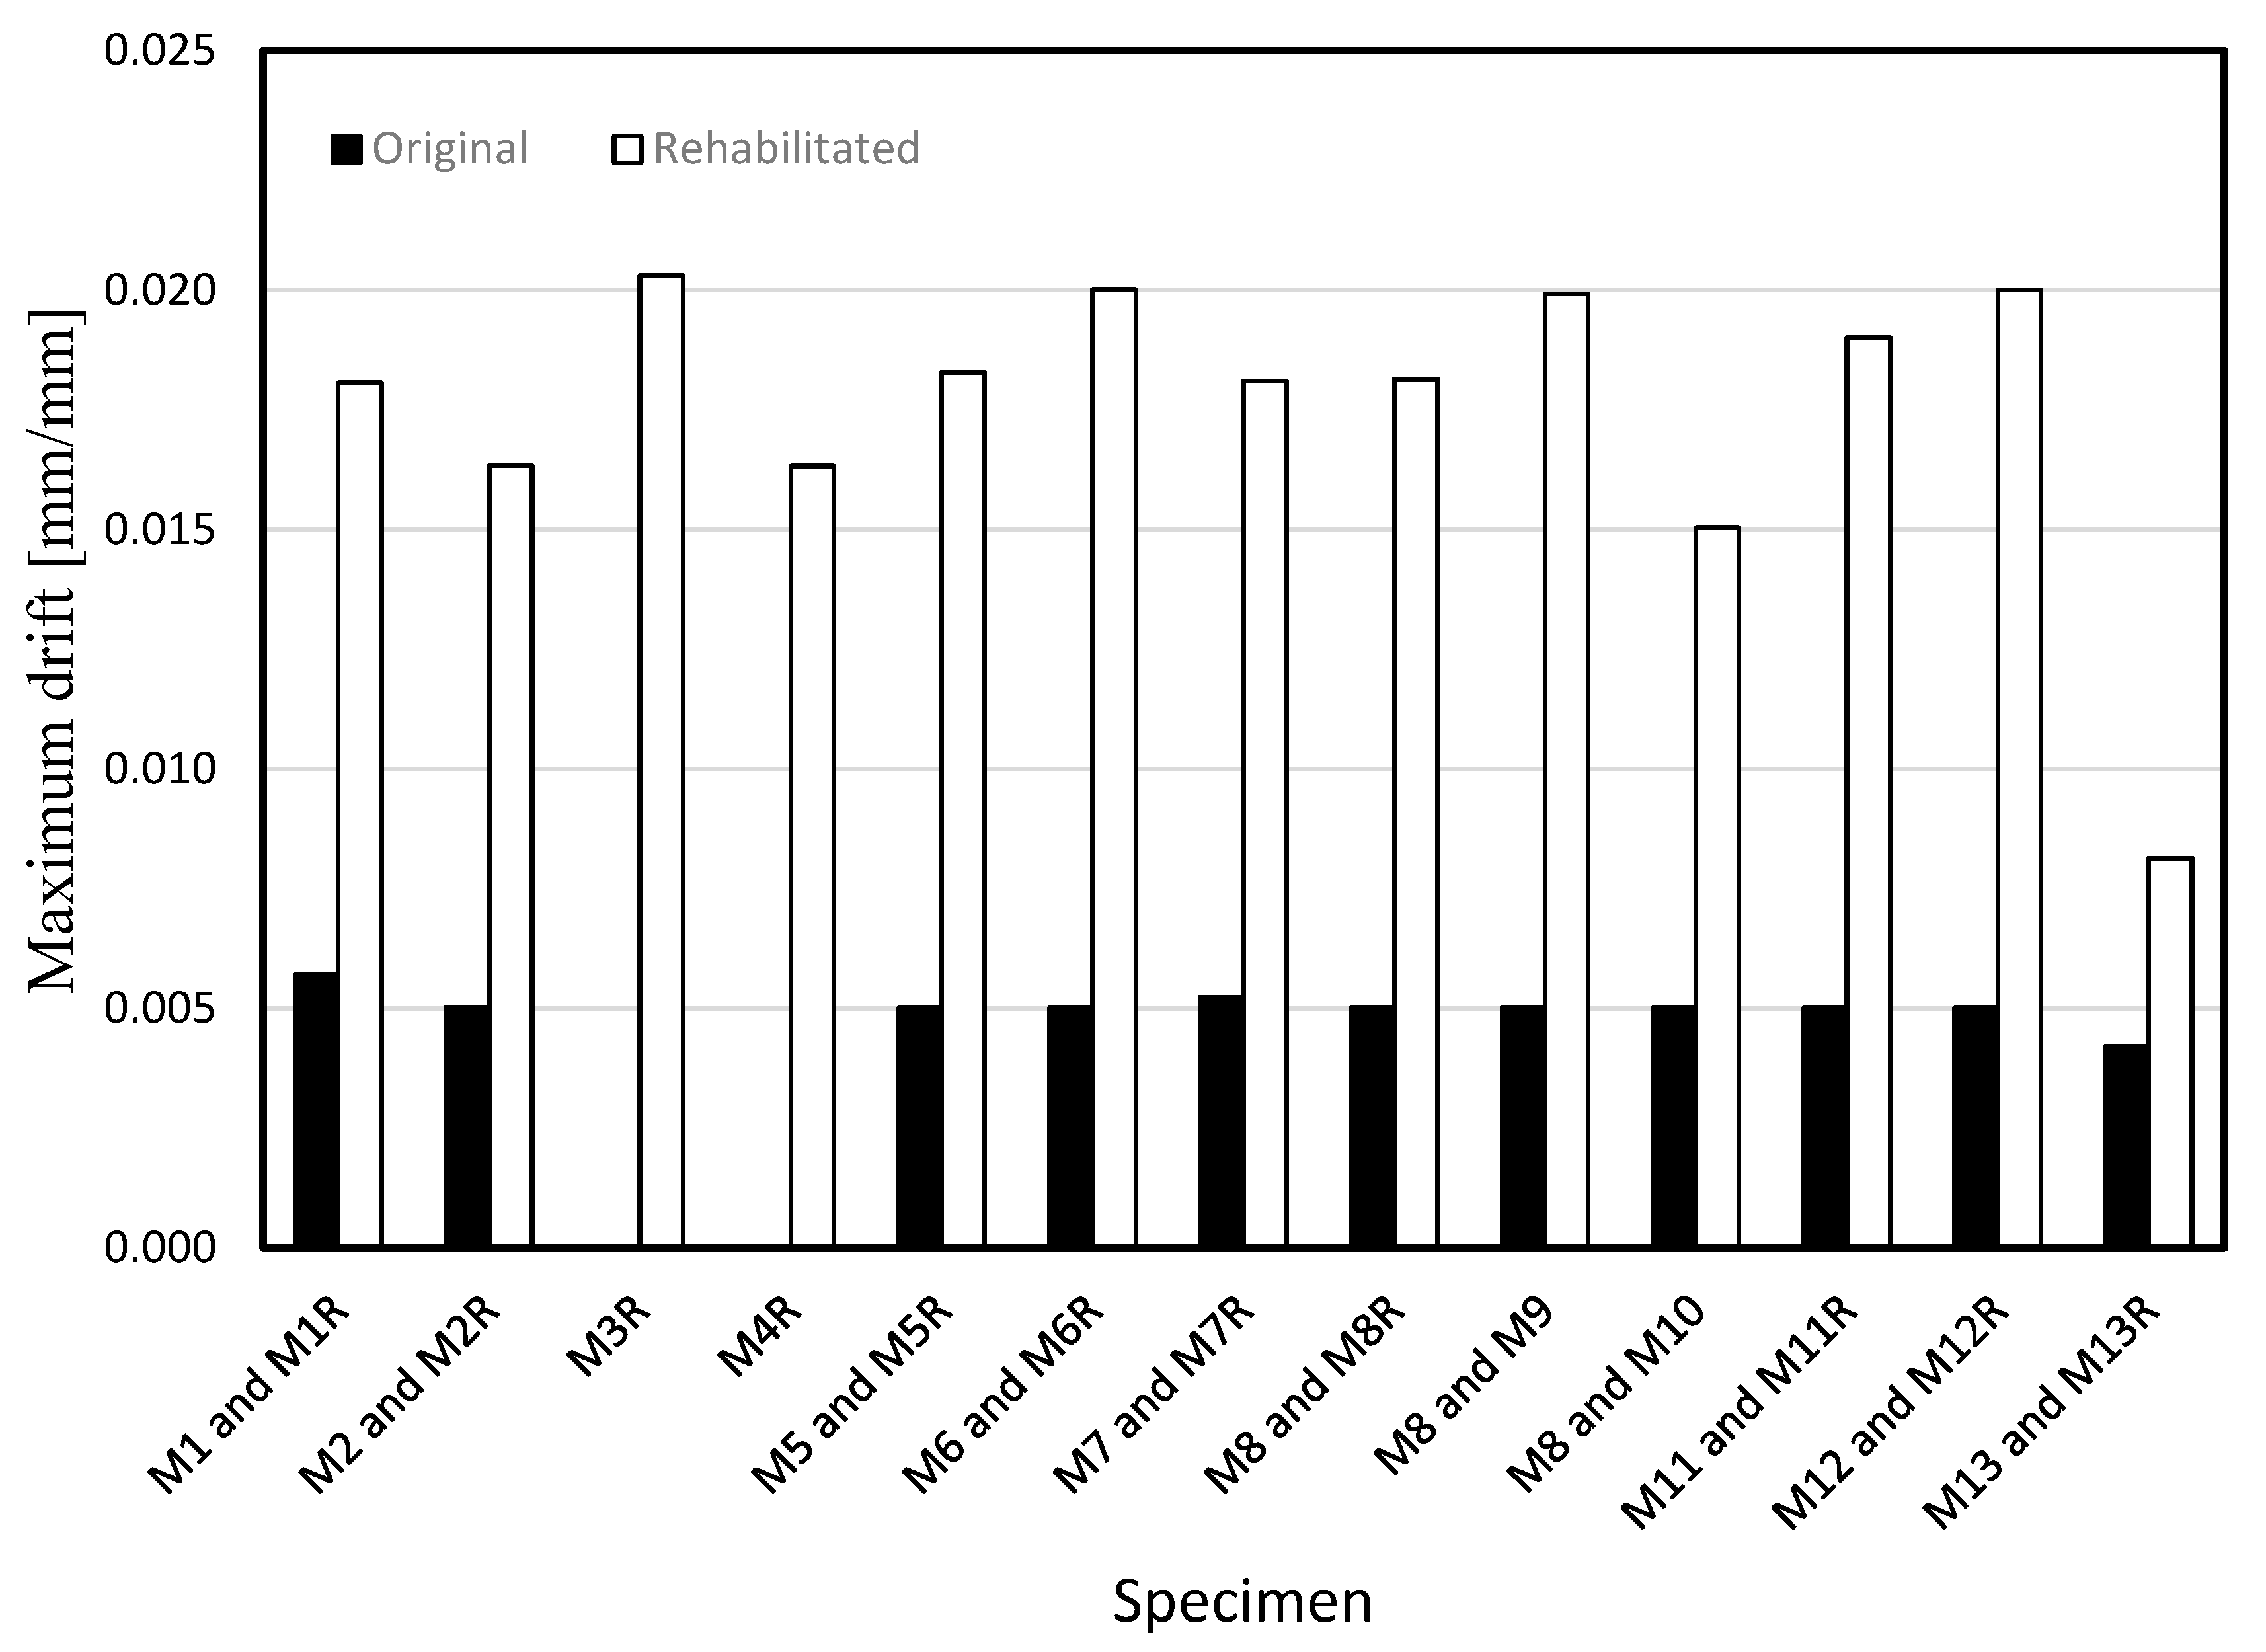
- All the rehabilitation techniques were adequate since wall strength capacity increased by an average of 84 percent, and deformation capacity tended to duplicate.
- (2)
- The strength and lateral deformation capacity of specimens rehabilitated in an original state were 19 percent greater than those of initially damaged walls rehabilitated.
- (3)
- Specimens rehabilitated on both faces exhibited a slide-controlled failure followed by crushing at the wall toe. This mode of failure is credited to the increase in shear strength by jacketing on both sides.
- (4)
- The stiffness of the rehabilitated walls was consistently larger than that of the original specimens.
- (5)
- Stiffness degraded with drift. At the start of the test, stiffness was different from that calculated using mechanical principles. The modulus of elasticity prescribed in design specifications (such as the NTC-Masonry [28]) should be revisited and modified.
- (6)
- In the original specimens tested, residual crack widths were, on average, close to 1 mm at lateral drifts to 0.002 and 5 mm at drifts to 0.005. Crack widths in rehabilitated walls were, on average, 55% smaller than their original counterparts.
- (7)
- As found in other experimental programs, specimens rehabilitated with welded wire meshes and cement mortar exhibited superior performance compared to the original walls. Unlike the original specimens, which presented a few large prominent inclined cracks in the wall, rehabilitated walls presented a uniform distribution of small-width cracks. In most cases, the strength and deformation capacity of walls jacketed with WWM and cement mortar were roughly double those for the original specimens.
- (8)
- Compared to the specimen rehabilitated with fiberglass mesh, the specimens rehabilitated with steel welded wire mesh developed almost the same maximum lateral deformation. However, in terms of strength, the latter had 25% more capacity. Considering the cost, the rehabilitation with welded wire mesh was considered more adequate.
- (9)
- Adding buckling-restrained braces is an attractive option for seismic rehabilitation, especially when weight (or mass) should be removed from the structure. Specimens exhibited wide and stable hysteresis cycles without strength degradation. Cracking in concrete tie-column and bond-beam elements contributed to stiffness degradation.
- (10)
- The specimen with tie columns reinforced with welded-wire steel cages showed poor behavior. After rehabilitation with mortar and WWM jacketing, significant improvement in its deformation and load capacity was seen.
Author Contributions
Funding
Data Availability Statement
Acknowledgments
Conflicts of Interest
References
- Meli, R.; Brzev, S.; Astroza, M.; Boen, T.; Crisafulli, F.; Dai, J. Seismic Design Guide for Low-Rise Confined Masonry Buildings; Earthquake Engineering Research Institute (EERI): Oakland, CA, USA, 2011. [Google Scholar]
- Marques, R.; Lourenço, P.B. Structural behavior, and design rules of confined masonry walls: Review and proposals. Constr. Build. Mater. 2019, 217, 137–155. [Google Scholar] [CrossRef]
- Varela, J.; Fernández, L.; Gamboa, J.; Prieto, A.; Moreno, J. Flexural behavior of confined masonry walls subjected to in-plane lateral loads. Earthq. Spectra 2019, 35, 405–422. [Google Scholar] [CrossRef]
- León, I.; Flores, L.E.; Reyes, C. Experimental study of masonry walls subjected to pure compression [CD-ROM]. In Proceedings of the XIV National Structural Engineering Congress, Acapulco, Mexico, 29–31 October 2004. (In Spanish). [Google Scholar]
- Cao, X.; Shen, D.; Feng, D.; Wang, C.; Qu, Z.; Wu, G. Seismic retrofitting of existing frame buildings through externally attached sub-structures: State of the art review and future perspectives. Build. Eng. 2022, 57, 2352–7102. [Google Scholar] [CrossRef]
- Bhattacharya, S.; Nayak, S.; Dutta, S.C. A critical review of retrofitting methods for unreinforced masonry structures. Int. J. Disaster Risk Reduct. 2014, 7, 51–67. [Google Scholar] [CrossRef]
- El-Diasity, M.; Okail, H.; Kamal, O.; Said, M. Structural performance of confined masonry walls retrofitted using ferrocement and GFRP under in-plane cyclic loading. Eng. Struct. 2015, 94, 54–69. [Google Scholar] [CrossRef]
- Gattesco, N.; Boem, I. Out-of-plane behaviour of reinforced masonry walls: Experimental and numerical study. Compos. B 2017, 128, 39–52. [Google Scholar] [CrossRef]
- Cruz, A.; Pérez, G.J.J. Seismic performance of confined masonry walls with joint reinforcement and aspect ratio: An experimental study. Eng. Struct. 2021, 242, 112484. [Google Scholar] [CrossRef]
- Diaz, M.; Zavala, C.; Gallardo, J.; Lavado, L. Experimental study of non-engineered confined masonry wall retrofitted with wire mesh and cement-sand mortar. In Proceedings of the 16th Conference on Earthquake Engineering, Santiago, Chile, 9–13 January 2017. [Google Scholar]
- Shermi, C.; Dubey, R.N. Study on out-of-plane behaviour of unreinforced masonry strengthened with welded wire mesh and mortar. Constr. Build. Mater. 2017, 143, 104–120. [Google Scholar] [CrossRef]
- Alcocer, S.M.; Pineda, J.A.; Ruiz, J.; Zepeda, J.A. Retrofitting of Confined Masonry Walls with Welded Wire Mesh. In Proceedings of the 11th Word Conference on Earthquake Engineering, Acapulco, Mexico, 23–28 June 1996; Elsevier: Amsterdam, The Netherlands, 1996. Article No. 1471. [Google Scholar]
- Alcocer, S.M. Use of horizontal steel and wire mesh as strengthening options for confined masonry walls. In Proceedings of the 7th Chilean Conference on Seismology and Earthquake Engineering and First Iberoamericano Earthquake Engineering Congress, La Serena, Chile, 9–13 November 1997; Volume 1, pp. 195–204. (In Spanish). [Google Scholar]
- SMIE. Masonry Buildings; Mexican Society of Structural Engineering: Mexico City, Mexico, 2019. (In Spanish) [Google Scholar]
- Can, Ö. Investigation of seismic performance of in-plane aligned masonry panels strengthened with Carbon Fiber Reinforced Polymer. Constr. Build. Mater. 2018, 186, 854–862. [Google Scholar] [CrossRef]
- D’Ambra, C.; Lignola, G.P.; Prota, A.; Sacco, E.; Fabbrocino, F. Experimental performance of FRCM retrofit on out-of-plane behaviour of clay bricks walls. Compos. B 2018, 148, 198–206. [Google Scholar] [CrossRef]
- Martins, A.; Vasconcelos, G.; Fangueiro, R.; Cunha, F. Experimental assessment of an innovative strengthening material for brick masonry infills. Compos. B Eng. 2015, 80, 328–342. [Google Scholar] [CrossRef]
- Ghiassi, B.; Oliveira, D.V.; Marques, V.; Soares, E.; Maljaee, H. Multi-level characterization of steel reinforced mortars for strengthening of masonry structures. Mater. Des. 2016, 110, 903–913. [Google Scholar] [CrossRef]
- Yacila, J.; Salsavilca, J.; Tarque, N.; Camata, G. Experimental assessment of confined masonry walls retrofitted with SRG under lateral cyclic loads. Eng. Struct. 2019, 199, 109555. [Google Scholar] [CrossRef]
- Deng, M.; Yang, S. Experimental and numerical evaluation of confined masonry walls retrofitted with engineered cementitious composites. Eng. Struct. 2020, 207, 110249. [Google Scholar] [CrossRef]
- Deng, M.; Zhang, W.; Yang, S. In-plane seismic behavior of autoclaved aerated concrete block masonry walls retrofitted with high ductile fiber-reinforced concrete. Eng. Struct. 2020, 219, 110854. [Google Scholar] [CrossRef]
- JICA—Japan International Cooperation Agency. National Center for Disaster Prevention (CENAPRED). February 2020. Available online: https://www.jica.go.jp/mexico/espanol/activities/disaster_01.html (accessed on 1 January 2023).
- Sika MonoTop—722 Mur. One-Component Mortar for the Repair and Strengthening of Traditional Walls. In Technical Sheet; Sika: Mexico City, Mexico, 2020. (In Spanish) [Google Scholar]
- Sika Fiber Force PP-48. Macro Synthetic Fibers for Strengthening of Concrete and Mortar. In Technical Sheet; Sika: Mexico City, Mexico, 2019. (In Spanish) [Google Scholar]
- Sika Fiber Xorex. Steel Fiber for Concrete and Mortar Strengthening. In Technical Sheet; Sika: Mexico City, Mexico, 2020. (In Spanish) [Google Scholar]
- StoneCrete. Mortar for structural covering. In Technical Sheet; Industrial Mexicana S.A. de C.V.: Mexico City, Mexico, 2018. (In Spanish) [Google Scholar]
- ASTM C39/C39M-12; Standard Test Method for Compressive Strength of Cylindrical Concrete Specimens. ASTM International: West Conshohocken, PA, USA, 2012.
- NTC-Masonry. Complementary Technical Standards for the Design and Construction of Masonry Structures; Official Gazette of Mexico City, Government of Mexico City: Mexico City, Mexico, 2020. (In Spanish) [Google Scholar]
- ASTM C469/C469M-10; Standard Test Method for Static Modulus of Elasticity and Poisson’s Ratio of Concrete in Compression. ASTM International: West Conshohocken, PA, USA, 2010.
- NMX-C-464-ONNCCE; Construction Industry—Masonry—Determination of Diagonal Compressive Strength and Shear Modulus of Prisms, As Well As Determination of Compressive Strength and Elastic Modulus of Clay or Concrete Masonry Prism—Test Method, Mexican Standards. National Agency for Standardization and Certification of Construction and Building: Mexico City, Mexico, 2010. (In Spanish)
- ASTM E519-15; Standard Test Method for Diagonal Tension (Shear) in Masonry Assemblages. ASTM International: West Conshohocken, PA, USA, 2015.
- Cao, X.; Xiong, C.; Feng, D.; Wu, G. Dynamic and probabilistic seismic performance assessment of precast prestressed reinforced concrete frames incorporating slab influence through three-dimensional spatial model. Bull. Earthq. Eng. 2022, 20, 6705–6739. [Google Scholar] [CrossRef]
- Aloisio, A.; Contento, A.; Alaggio, R.; Briseghella, B.; Fragiacomo, M. Probabilistic Assessment of a light-timber frame shear wall with variable pinching under repeated earthquakes. Struct. Eng. 2022, 148, 04022178. [Google Scholar] [CrossRef]
- FEMA P-356; Prestandard and Commentary for the Seismic Rehabilitation of Buildings. Federal Emergency Management Agency: Washington, DC, USA, 2000.
- FEMA P-795; Quantification of Building Seismic Performance Factors: Component Equivalency Methodology. Federal Emergency Management Agency: Washington, DC, USA, 2011.
- NTC-Seismic. Complementary Technical Standards for Seismic Design; Official Gazette of Mexico City, Government of Mexico City: Mexico City, Mexico, 2020. (In Spanish) [Google Scholar]
- Lubin, C. Experimental Behavior of Masonry Walls Rehabilitated with Different Techniques Subjected to Cyclic Loading. Master’s Dissertation, National Autonomous University of Mexico, Ciudad Universitaria, Mexico City, Mexico, 2022. (In Spanish). [Google Scholar]


| Damage | F * | Rehab. Mortar | Strengthening Method | Anchorage | ||
|---|---|---|---|---|---|---|
| Spec. | In.D | Rehab. | 25 mm@side | |||
| M1 | Yes | Yes | Both | cement-sand 1:3 | WWM 10-cal | Steel nails@450 mm |
| M2 | Yes | Yes | Both | cement-sand 1:3 | WWM 8-cal | Steel nails@450 mm |
| M3 | No | Yes | Both | cement-sand 1:3 | WWM 8-cal | Steel nails@450 mm |
| M4 | No | Yes | Both | cement-sand 1:3 | WWM 10-cal | Steel nails@450 mm |
| M5 | Yes | Yes | One | cement-sand 1:3 | MF | N/A |
| M6 | Yes | Yes | One | cement-sand 1:3 | WWM 8-cal | Wire rod@450 mm |
| M7 | Yes | Yes | One | cement-sand 1:3 | SF | N/A |
| M8 | Yes | Yes | One | Premixed | FGM | N/A |
| M9 | Yes | Yes | N/A | N/A | BRB | N/A |
| M10 | Yes | Yes | N/A | N/A | BRB | N/A |
| M11 ** | Yes | Yes | One | cement-sand 1:3 | WWM 10-cal and SF | Steel nails@450 mm |
| M12 ** | Yes | Yes | One | cement-sand 1:3 | WWM 10-cal and MF | Steel nails@450 mm |
| M13 | Yes | Yes | One | cement-sand 1:3 | WM 10-cal | Steel nails@450 mm |
| Material | Size [mm] | Strength [MPa] | Material | Size [mm] | Strength [MPa] |
|---|---|---|---|---|---|
| Brick units | 60 × 120 × 240 | 7.8 | Concrete for jacketing | 150 × 300 | 40.1 |
| Prisms | 120 × 235 × 315 | 3.44 | Concrete for foundation | 150 × 300 | 37.5 |
| Diagonal compression panels | 120 × 365 × 315 | 0.60 | Sika Monotop-722 Mur mortar | 50 × 50 × 50 | 28.6 |
| Walls with HM | 145 × 365 × 315 | 1.03 | StoneCrete mortar | 50 × 50 × 50 | 16.1 |
| Walls with FGRM | 130 × 365 × 315 | 1.05 | Synthetic fiber mortar | 50 × 50 × 50 | 25.0 |
| Walls with SFRM | 145 × 365 × 315 | 1.02 | Steel fiber mortar | 50 × 50 × 50 | 22.9 |
| Walls with MFRM | 145 × 365 × 315 | 1.01 | Hand-mixed mortar for ME | 150 × 300 | 1205 |
| CS Mortar | 50 × 50 × 50 | 13.24 | Synthetic fiber mortar for ME | 150 × 300 | 1355 |
| Wire mesh | L = 600 cm ∅ = 3.43 mm | 494 | Steel fiber mortar for ME | 150 × 300 | 1413 |
| Concrete for confining elements | 100 × 200 | 16.8 | StoneCrete mortar for ME | 150 × 300 | 4073 |
| ID | Dir | Py [kN] | Pm [kN] | P0.8 [kN] | Pu [kN] | δy Bilinear | δm Trilinear | δ0.8 Trilinear | δu Trilinear | Ki [kN/mm] | α1 | α2 |
|---|---|---|---|---|---|---|---|---|---|---|---|---|
| M1 | (+) | 118.2 | 138.0 | 126.0 | 110.4 | 0.0012 | 0.0036 | 0.0056 | 0.0082 | 40.9 | 0.19 | 0.07 |
| (−) | 132.4 | 147.0 | 132.0 | 117.6 | 0.0012 | 0.0039 | 0.0057 | 0.0074 | 42.7 | 0.02 | 0.01 | |
| M1R | (+) | 240.6 | 283.5 | 226.8 | 226.8 | 0.0022 | 0.0064 | 0.0085 | 0.0168 | 43.1 | 0.16 | 0.22 |
| (−) | 243.3 | 284.7 | 227.8 | 227.8 | 0.0021 | 0.0056 | 0.0099 | 0.0181 | 46.7 | 0.16 | 0.07 | |
| M2 | (+) | 105.2 | 130.0 | 130.0 | 130.0 | 0.0008 | 0.0048 | 0.0048 | 0.0048 | 51.8 | 0.10 | 0.03 |
| (−) | 92.5 | 100.0 | 101.0 | 101.0 | 0.0010 | 0.0020 | 0.0050 | 0.0050 | 36.6 | 0.36 | 0.03 | |
| M2R | (+) | 253.5 | 297.0 | 237.6 | 237.6 | 0.0022 | 0.0059 | 0.0098 | 0.0140 | 45.5 | 0.17 | 0.13 |
| (−) | 255.8 | 306.5 | 245.2 | 245.2 | 0.0021 | 0.0058 | 0.0111 | 0.0163 | 48.0 | 0.19 | 0.09 | |
| M3R | (+) | 303.7 | 333.0 | 266.4 | 266.4 | 0.0023 | 0.0100 | 0.0197 | 0.0200 | 52.5 | 0.05 | 0.05 |
| (−) | 306.4 | 340.0 | 272.0 | 272.0 | 0.0020 | 0.0061 | 0.0200 | 0.0200 | 60.2 | 0.10 | 0.03 | |
| M4R | (+) | 291.4 | 323.0 | 258.4 | 258.4 | 0.0017 | 0.0056 | 0.0056 | 0.0056 | 68.9 | 0.00 | 0.00 |
| (−) | 310.6 | 340.0 | 272.0 | 272.0 | 0.0021 | 0.0061 | 0.0114 | 0.0163 | 60.5 | 0.09 | 0.08 | |
| M5 | (+) | 148.6 | 169.5 | 168.0 | 168.0 | 0.0015 | 0.0036 | 0.0045 | 0.0045 | 38.6 | 0.17 | 0.01 |
| (−) | 163.6 | 180.5 | 180.5 | 180.5 | 0.0022 | 0.0050 | 0.0050 | 0.0050 | 29.1 | 0.18 | 0.03 | |
| M5R | (+) | 210.4 | 249.0 | 199.2 | 199.2 | 0.0021 | 0.0055 | 0.0131 | 0.0183 | 39.9 | 0.11 | 0.07 |
| (−) | 221.1 | 254.0 | 203.2 | 203.2 | 0.0020 | 0.0060 | 0.0154 | 0.0180 | 44.3 | 0.10 | 0.05 | |
| M6 | (+) | 122.8 | 133.0 | 133.0 | 133.0 | 0.0012 | 0.0050 | 0.0050 | 0.0050 | 41.2 | 0.05 | 0.01 |
| (−) | 128.8 | 147.0 | 117.6 | 117.6 | 0.0021 | 0.0036 | 0.0049 | 0.0050 | 24.4 | 0.37 | 0.38 | |
| M6R | (+) | 236.1 | 284.5 | 227.6 | 227.6 | 0.0020 | 0.0080 | 0.0132 | 0.0181 | 47.1 | 0.10 | 0.09 |
| (−) | 229.4 | 292.0 | 233.6 | 233.6 | 0.0024 | 0.0081 | 0.0134 | 0.0200 | 39.0 | 0.16 | 0.11 | |
| M7 | (+) | 148.2 | 166.0 | 132.8 | 132.8 | 0.0016 | 0.0040 | 0.0049 | 0.0049 | 37.2 | 0.15 | 0.02 |
| (−) | 150.6 | 190.0 | 152.0 | 152.0 | 0.0014 | 0.0046 | 0.0050 | 0.0050 | 43.6 | 0.20 | 0.49 | |
| M7R | (+) | 173.9 | 251.5 | 201.2 | 201.2 | 0.0014 | 0.0037 | 0.0086 | 0.0181 | 48.2 | 0.28 | 0.06 |
| (−) | 211.2 | 295.0 | 236.0 | 236.0 | 0.0020 | 0.0059 | 0.0086 | 0.0180 | 42.6 | 0.20 | 0.21 | |
| M8 | (+) | 124.7 | 134.5 | 126.0 | 126.0 | 0.0017 | 0.0037 | 0.0050 | 0.0050 | 28.7 | 0.16 | 0.02 |
| (−) | 150.2 | 161.0 | 161.0 | 161.0 | 0.0023 | 0.0050 | 0.0050 | 0.0050 | 25.7 | 0.09 | 0.02 | |
| M8R | (+) | 188.5 | 225.0 | 180.0 | 180.0 | 0.0017 | 0.0062 | 0.0130 | 0.0181 | 44.3 | 0.12 | 0.06 |
| (−) | 189.1 | 231.0 | 184.8 | 184.8 | 0.0018 | 0.0080 | 0.0124 | 0.0180 | 41.7 | 0.07 | 0.10 | |
| M9 | (+) | 170.3 | 195.0 | 193.0 | 193.0 | 0.0027 | 0.0200 | 0.0201 | 0.0201 | 25.0 | 0.04 | 0.10 |
| (−) | 182.2 | 202.6 | 202.6 | 202.6 | 0.0053 | 0.0199 | 0.0199 | 0.0199 | 18.6 | 0.10 | 0.19 | |
| M10 | (+) | 486.6 | 541.0 | 518.0 | 518.0 | 0.0037 | 0.0141 | 0.0150 | 0.0150 | 52.0 | 0.08 | 0.04 |
| (−) | 505.3 | 563.5 | 536.5 | 536.5 | 0.0033 | 0.0140 | 0.0150 | 0.0150 | 61.7 | 0.14 | 0.05 | |
| M11 | (+) | 265.5 | 267.0 | 267.0 | 267.0 | 0.0029 | 0.0050 | 0.0050 | 0.0050 | 36.7 | 0.02 | 0.11 |
| (−) | 217.3 | 242.0 | 242.0 | 242.0 | 0.0019 | 0.0050 | 0.0050 | 0.0050 | 46.9 | 0.13 | 0.06 | |
| M11R | (+) | 279.6 | 349.5 | 279.6 | 279.6 | 0.0016 | 0.0060 | 0.0120 | 0.0180 | 68.1 | 0.15 | 0.06 |
| (−) | 263.2 | 340.0 | 272.0 | 272.0 | 0.0016 | 0.0058 | 0.0115 | 0.0190 | 66.4 | 0.16 | 0.07 | |
| M12 | (+) | 218.5 | 230.0 | 230.0 | 230.0 | 0.0033 | 0.0050 | 0.0050 | 0.0050 | 26.7 | 0.20 | 0.04 |
| (−) | 194.1 | 228.5 | 228.5 | 228.5 | 0.0025 | 0.0050 | 0.0050 | 0.0050 | 31.6 | 0.26 | 0.05 | |
| M12R | (+) | 253.5 | 310.0 | 248.0 | 248.0 | 0.0019 | 0.0061 | 0.0134 | 0.0200 | 53.3 | 0.14 | 0.06 |
| (−) | 239.2 | 293.0 | 234.4 | 234.4 | 0.0020 | 0.0055 | 0.0152 | 0.0200 | 48.2 | 0.18 | 0.05 | |
| M13 | (+) | 77.4 | 87.0 | 68.0 | 68.0 | 0.0005 | 0.0007 | 0.0042 | 0.0042 | 66.1 | 0.58 | 0.00 |
| (−) | 119.5 | 122.5 | 122.5 | 122.5 | 0.0007 | 0.0015 | 0.0015 | 0.0015 | 65.0 | 0.04 | 0.01 | |
| M13R | (+) | 190.0 | 208.0 | 165.0 | 165.0 | 0.0019 | 0.0060 | 0.0081 | 0.0081 | 39.7 | 0.08 | 0.01 |
| (−) | 240.8 | 281.0 | 208.5 | 208.5 | 0.0021 | 0.0058 | 0.0086 | 0.0086 | 45.3 | 0.18 | 0.15 |
| Technique | Cost per m2 [$ MXP] | Strength [kN] | Cumulative Energy [kN-mm] | Cost per kN [$ MXP] | Cost per kN-mm |
|---|---|---|---|---|---|
| Both faces, 10-cal wire mesh with mortar | 422 | 285 | 76,761 | 9.3 | 0.034 |
| Both faces, 8-cal wire mesh with mortar | 470 | 307 | 55,769 | 9.6 | 0.053 |
| Single face, synthetic fiber with mortar | 316 | 253 | 34,925 | 7.8 | 0.057 |
| Single face, 8-cal wire mesh with mortar | 352 | 291 | 53,524 | 7.6 | 0.041 |
| Single face, steel fiber with mortar | 320 | 294 | 40,186 | 6.8 | 0.050 |
| Fiberglass mesh with premixed mortar | 1690 | 232 | 27,669 | 45.6 | 0.38 |
| Moderate-strength buckling-restrained brace | 1994 | 291 | 264,078 | 42.8 | 0.047 |
| High-strength buckling-restrained brace | 4826 | 564 | 213,005 | 53.5 | 0.14 |
| 8-cal wire mesh with mortar and synthetic fiber | 373 | 351 | 71,255 | 6.7 | 0.033 |
| 8-cal wire mesh with mortar and steel fiber | 377 | 309 | 63,016 | 7.6 | 0.037 |
Disclaimer/Publisher’s Note: The statements, opinions and data contained in all publications are solely those of the individual author(s) and contributor(s) and not of MDPI and/or the editor(s). MDPI and/or the editor(s) disclaim responsibility for any injury to people or property resulting from any ideas, methods, instructions or products referred to in the content. |
© 2023 by the authors. Licensee MDPI, Basel, Switzerland. This article is an open access article distributed under the terms and conditions of the Creative Commons Attribution (CC BY) license (https://creativecommons.org/licenses/by/4.0/).
Share and Cite
Lubin, C.; Guerrero, H.; Alcocer, S.M.; Lopez Batiz, O. Experimental Behavior of Confined Masonry Walls Rehabilitated with Reinforced Mortar Jacketing Subjected to Cyclic Loading. Buildings 2023, 13, 1314. https://doi.org/10.3390/buildings13051314
Lubin C, Guerrero H, Alcocer SM, Lopez Batiz O. Experimental Behavior of Confined Masonry Walls Rehabilitated with Reinforced Mortar Jacketing Subjected to Cyclic Loading. Buildings. 2023; 13(5):1314. https://doi.org/10.3390/buildings13051314
Chicago/Turabian StyleLubin, Cyprien, Hector Guerrero, Sergio M. Alcocer, and Oscar Lopez Batiz. 2023. "Experimental Behavior of Confined Masonry Walls Rehabilitated with Reinforced Mortar Jacketing Subjected to Cyclic Loading" Buildings 13, no. 5: 1314. https://doi.org/10.3390/buildings13051314