Article

Numerical Investigation on the Dynamic Response of Fault-Crossing Tunnels under Strike-Slip Fault Creep-Slip and Subsequent Seismic Shaking

1
School of Resources and Safety Engineering, Central South University, Changsha 410083, China
2
College of Civil Engineering and Architecture, Wenzhou University, Wenzhou 325000, China
3
Senior Engineering, China Railway Central-South Investment Development Co., Ltd., Changsha 410100, China
*
Author to whom correspondence should be addressed.
Buildings 2023, 13(5), 1163; https://doi.org/10.3390/buildings13051163
Submission received: 11 February 2023 / Revised: 4 April 2023 / Accepted: 26 April 2023 / Published: 27 April 2023
(This article belongs to the Special Issue Advanced Seismic Technologies in Underground Structures)

Abstract

:
Tunnels built in geologically active areas are prone to severe damage due to fault dislocation and subsequent earthquakes. Using the Ngong tunnel in the East African Rift Valley as an example, the dynamic response of a fault-crossing tunnel and the corresponding sensitivity are numerically simulated by considering four factors, i.e., tunnel joint stiffness, isolation layer elastic modulus, strike-slip fault creep-slip and earthquakes. The results show that a valley-shaped propagation of peak displacement at the tunnel invert occurs in the longitudinal axis direction under an earthquake alone. Then, it transforms into an S-shaped under strike-slip fault creep-slip and subsequent seismic shaking. The tunnel invert in the fault zone is susceptible to tensile and shear failures under strike-slip fault creep-slip movements of less than 15 cm and subsequent seismic shaking. Furthermore, the peak tensile and shear stress responses of the tunnel invert in the fault zone are more sensitive to fault creep-slip than earthquakes. They are also more sensitive to the isolation layer elastic modulus compared to the joint stiffness of a segmental tunnel with two segments. The stress responses can be effectively reduced when the isolation layer elastic modulus logarithmic ratio equals −4. Therefore, the isolation layer is more suitable to mitigate the potential failure under small strike-slip fault creep-slip and subsequent seismic shaking than segmental tunnels with two segments. The results of this study can provide some reference for the disaster mitigation of fault-crossing tunnels in terms of dynamic damage in active fault zones.

1. Introduction

Tunnels are considered one of the greatest achievements of civil engineering in the 20th century, enabling railways and highways to traverse mountains and rivers. With the expansion of transportation networks, an increasing number of tunnels are being built in high-intensity seismic zones with numerous active faults. The tunnel is inevitably needed to cross active faults. The Sichuan-Tibet railway has to cross the twelve deep and large active faults in the Qinghai-Tibet Plateau [1]. As an example of one belt and one road engineering, the Mombasa-Nairobi Railway crosses several faults in the East African Rift Valley with a creep slip velocity of about 2 mm/a [2].
Based on the movement direction, active faults can be roughly classified into normal, reverse and strike-slip faults. According to the movement mechanism, it is divided into a stick-slip fault or a creep-slip fault. The stick-slip fault, i.e., coseismic fault, may induce permanent ground deformations, such as fault dislocation, and subsequent earthquakes [3]. This always causes severe damage to fault-crossing tunnels, although tunnels are generally considered safer than aboveground structures [4,5,6,7]. For instance, the Tawarayama tunnel at the Futagawa fault zone, with a dislocation of 2.2 m, suffered lining cracks and localized failure in the 2016 Kumamoto earthquake [8]. The Daliang Tunnel crossing the Lenglongling fault was severely damaged with a maximum 2.7 m lining dislocation in the 2022 Menyuan earthquake [9]. Though the fault creep-slip may not induce an earthquake, it can also cause permanent ground displacement [10]. Theoretically, the creep-slip fault dislocation and subsequent earthquake may also cause severe damage to the fault-crossing tunnel.
Under the creep slip of normal, reverse or strike-slip faults, it results in the S-shaped displacement of the tunnel [11]. The tensile, shear and crushing failure of the tunnel lining invert and vault occurs at fault zones with a range from 3.5 to 4.0 times the tunnel diameter [10,12]. The tensile and shear stresses increase with the increase in the fault dislocation amplitude and width, surrounding rock density, tunnel segment length and tunnel diameter [13,14,15,16]. At the same time, they also decrease with increasing fault dip angle, the distance between adjacent fault planes and lining thickness [13,14]. The tensile strain of the fault-crossing tunnel decreases to the compressive strain with the increase in the crossing angle [17]. The extent and range of shear damage of the fault-crossing tunnel can be reduced by the tunnel segment, the increase in the tunnel depth and an adjustment of joint properties [18,19,20]. Under seismic shaking, the dynamic responses of tunnels at fault zones are amplified compared with the tunnels at other zones. They are dominated by multiple factors, as Tsinidis and He Chuan pointed out [21]. They increase with the increase in the wave impedance ratio of the surrounding rock to the fault, fault dip angle, the ratio of lining thickness to tunnel diameter, the earthquake wave dip angle and earthquake intensity [22,23,24,25,26]. Furthermore, the seismic response of the fault-crossing tunnel can be reduced by the implementation of segmental lining and isolation layers [24,27].
While the fault-crossing tunnel undergoes a fault creep-slip and subsequent earthquakes, the dynamic responses of the tunnel are dominated by fault dislocation direction and magnitude, segment length and joint properties, and the effect of an earthquake cannot be ignored [28,29,30]. The dynamic response of the fault-crossing tunnel is not a linear superposition, for various reasons. One reason is that the fault’s dislocation induces the reflection and refraction of seismic waves [31]. Another reason is that the dissipated energy of the tunnel sharply increases under their subsequent actions, when compared to one of their actions [32]. The third reason is that the cumulative attenuation of the tunnel’s overall stiffness induced by a normal fault creep slip increases the seismic dynamic response of the tunnel following subsequent earthquakes [33]. An adjustable flexible joint can not only improve the aseismic capability of the tunnel, but it can also impede the reduction of the overall tunnel stiffness by the concentration of shear tunnel displacement into the tunnel connection. Thus, the dynamic stress response exceeding its permitted bearing capacity is avoided by using the adjustably flexible joint or multilevel brittle-flexible joint [34,35]. However, when tunnel joints are applied, the upper structure of the tunnel still exhibits a severe seismic response [36]. This means that fault-crossing segmental tunnels may suffer damage from fault seismic shaking. Therefore, it is necessary to implement seismic mitigation methods for segmental tunnels to reduce the dynamic responses. At present, there have not been any studies on the isolation layer and tunnel segments for the reduction of tunnel dynamic damage from the subsequent actions of fault creep-slips and earthquakes. Therefore, this paper intends to numerically investigate the effects of the isolation layer and tunnel segments on tunnel dynamic responses under a strike-slip fault creep-slip and subsequent seismic shaking. The strike-slip fault is chosen with the consideration that the creep slip of the strike-slip fault has more influence on the tunnel than the reverse and normal faults [37].
In this study, a numerical fault-crossing tunnel model is presented based on the Ngong railroad tunnel in the East African Rift Valley. Then, the dynamic response of the tunnel is numerically experimented with in consideration of the tunnel joint stiffness and the isolation layer elastic modulus under a fault creep-slip and a subsequent earthquake. The sensitivities of the above factors to the dynamic response of fault-crossing tunnels are analyzed. Thus, a corresponding suggestion for fault-crossing tunnel dynamic damage reduction is presented. The results of this study can provide some reference for the disaster mitigation of fault-crossing tunnels in terms of dynamic damage in an active fault zone.

2. Numerical Analysis of a Tunnel under Strike-Slip Fault Creep-Slip and Subsequent Seismic Shaking

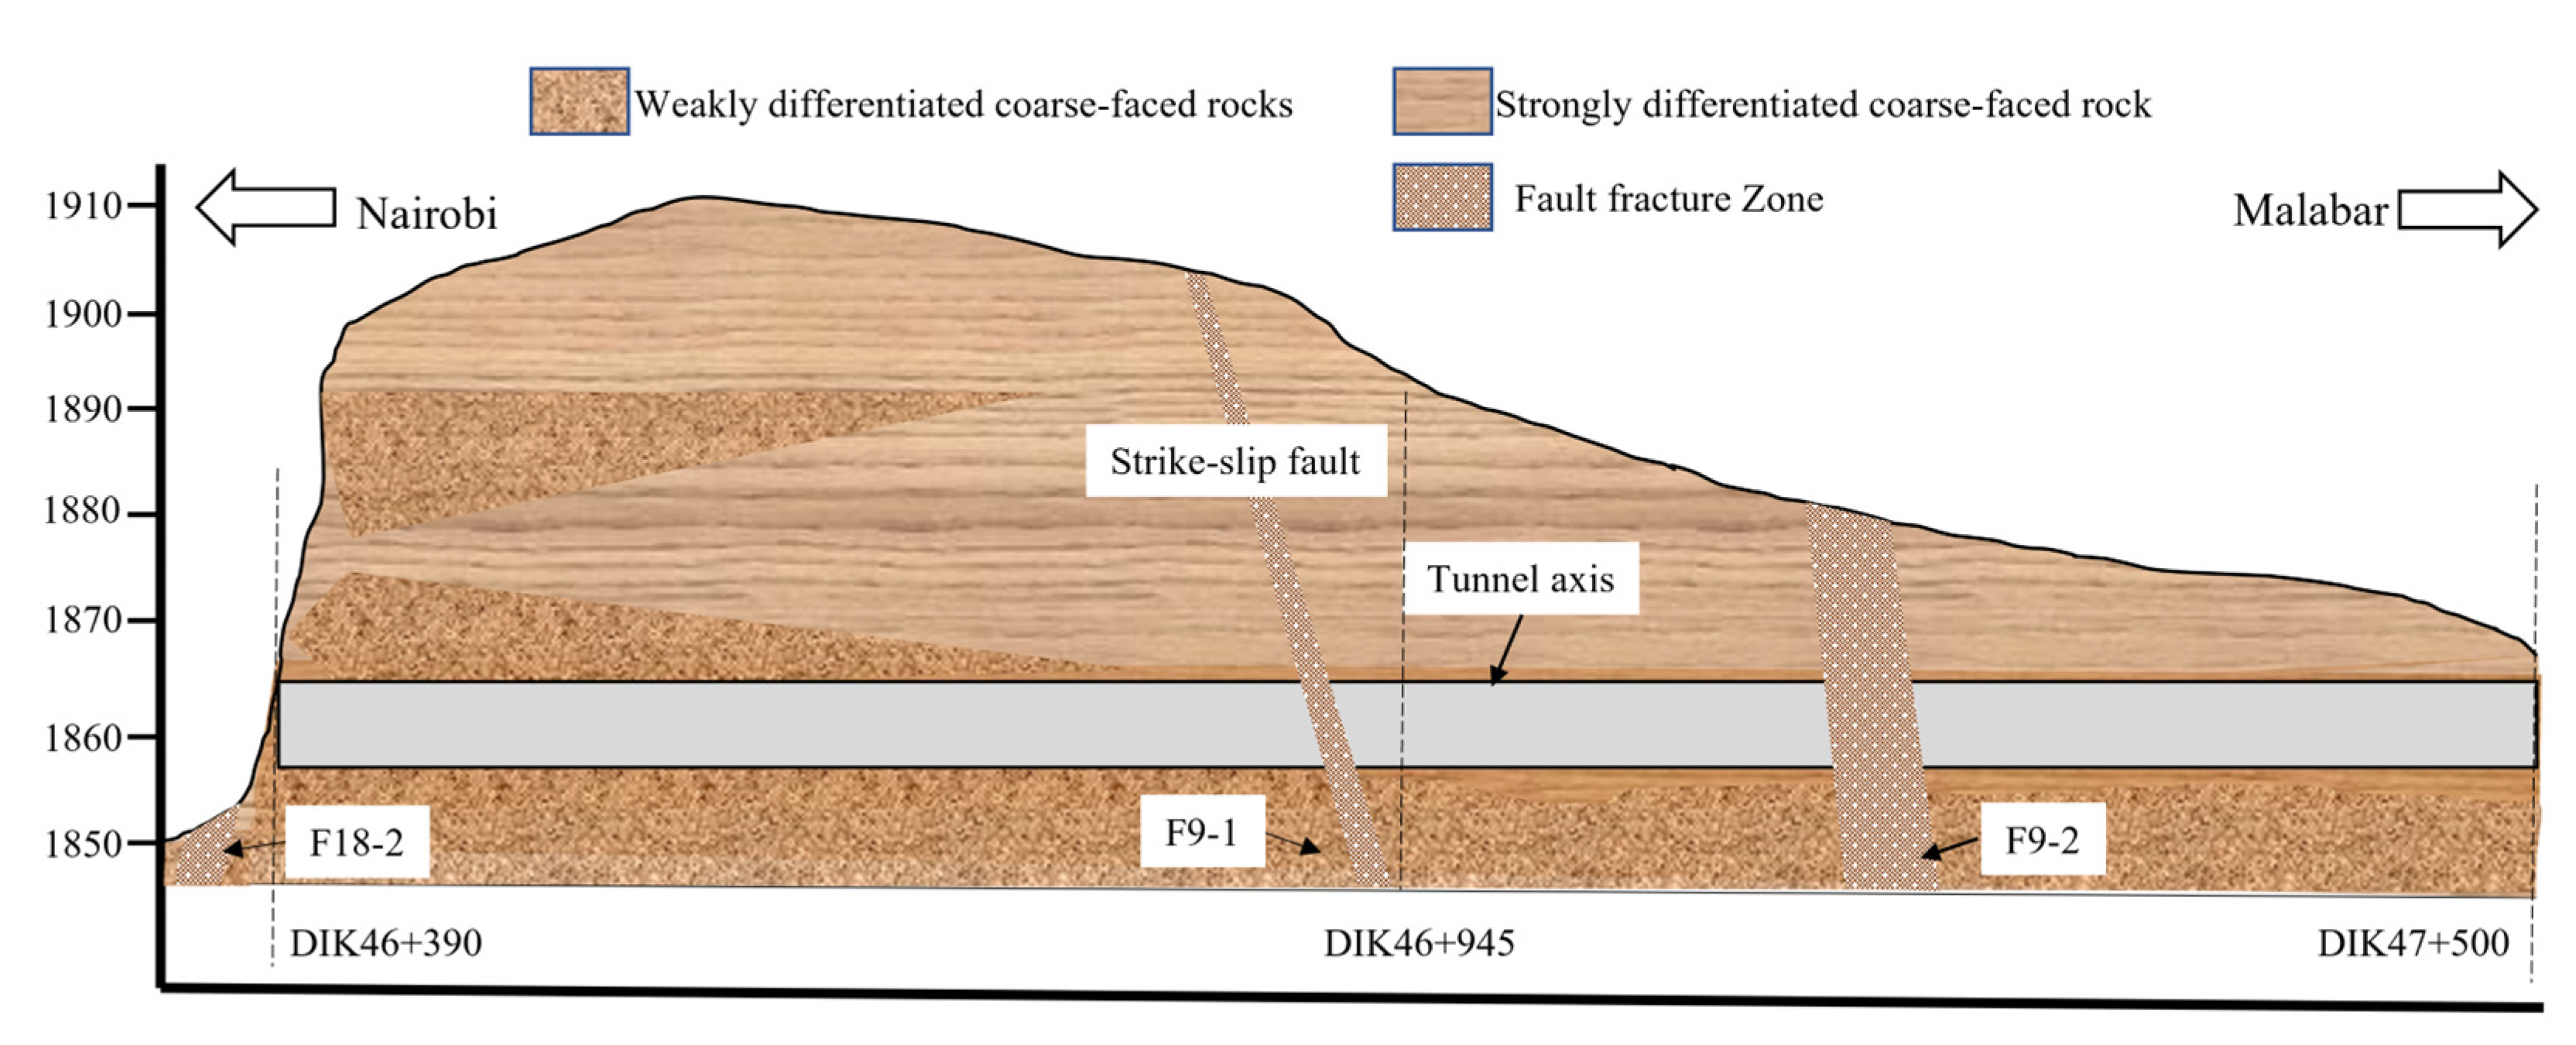
2.1. Engineering Background

The Ngong railroad tunnel, part of the Nairobi-Malaba Standard Gauge Railway in Kenya, is located in the transition zone between the Kapiti Plateau and the East African Rift Valley in Africa. With a length of 1.11 km and a maximal burial depth of 49.5 m, the tunnel is surrounded by strongly weathered trachyte and weakly weathered trachyte, and crosses faults F18-2, F9-1 and F9-2, as shown in Figure 1. The F9-1 fault, which is nearly vertical to the tunnel axis, has a width of approximately 10 m and an inclination angle of 60°. The F9-1 fault is inclined to horizontal slippage, with a magnitude of dislocation of 10 cm in 100 years [2]. The tunnel has a horseshoe-shaped cross section, as shown in Figure 2. Its primary and secondary supports were designed by the New Austrian Tunnelling Method. In this study, the dynamic response of the Ngong tunnel with the F9-1 fault is investigated by numerical simulations.

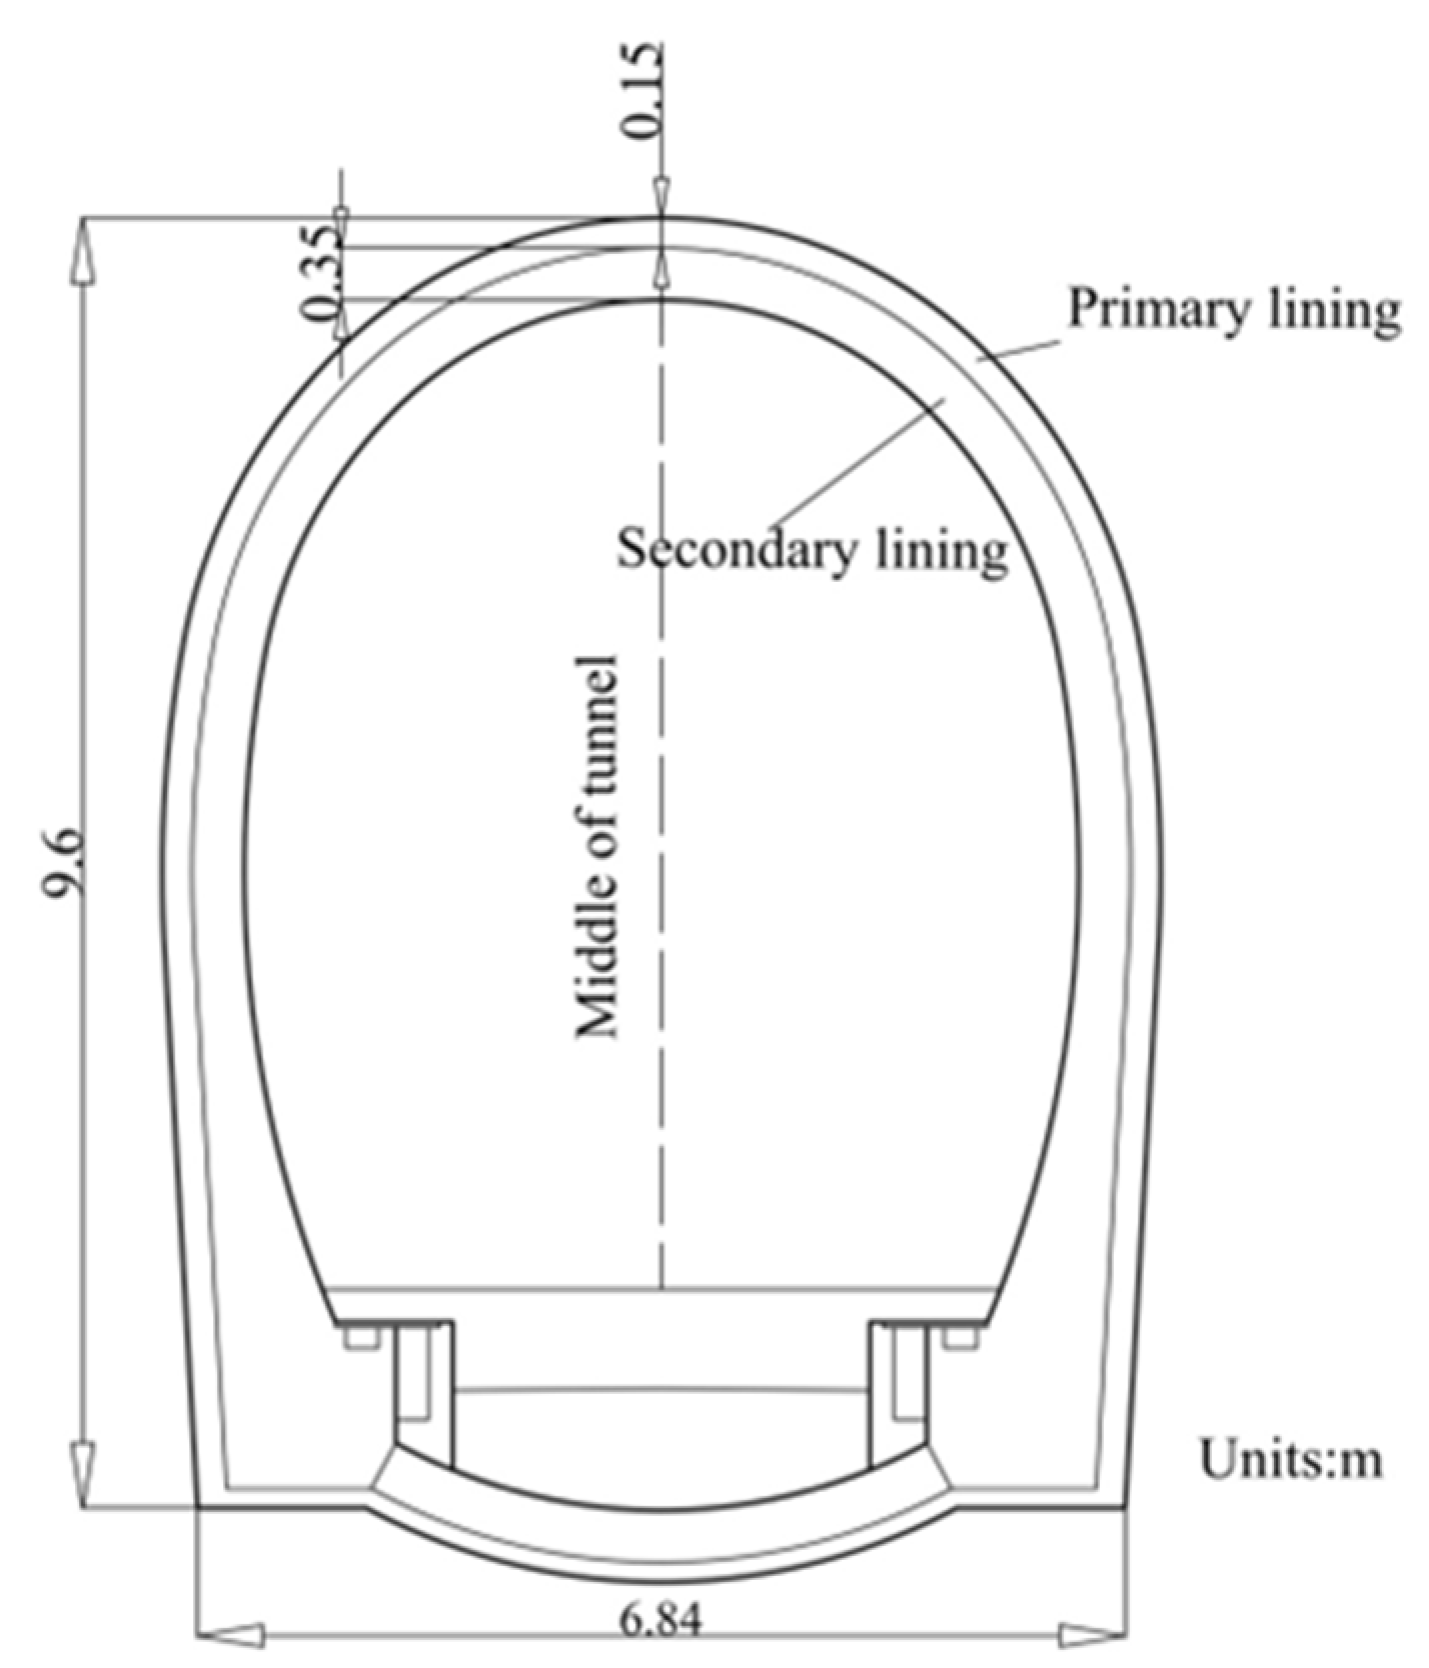
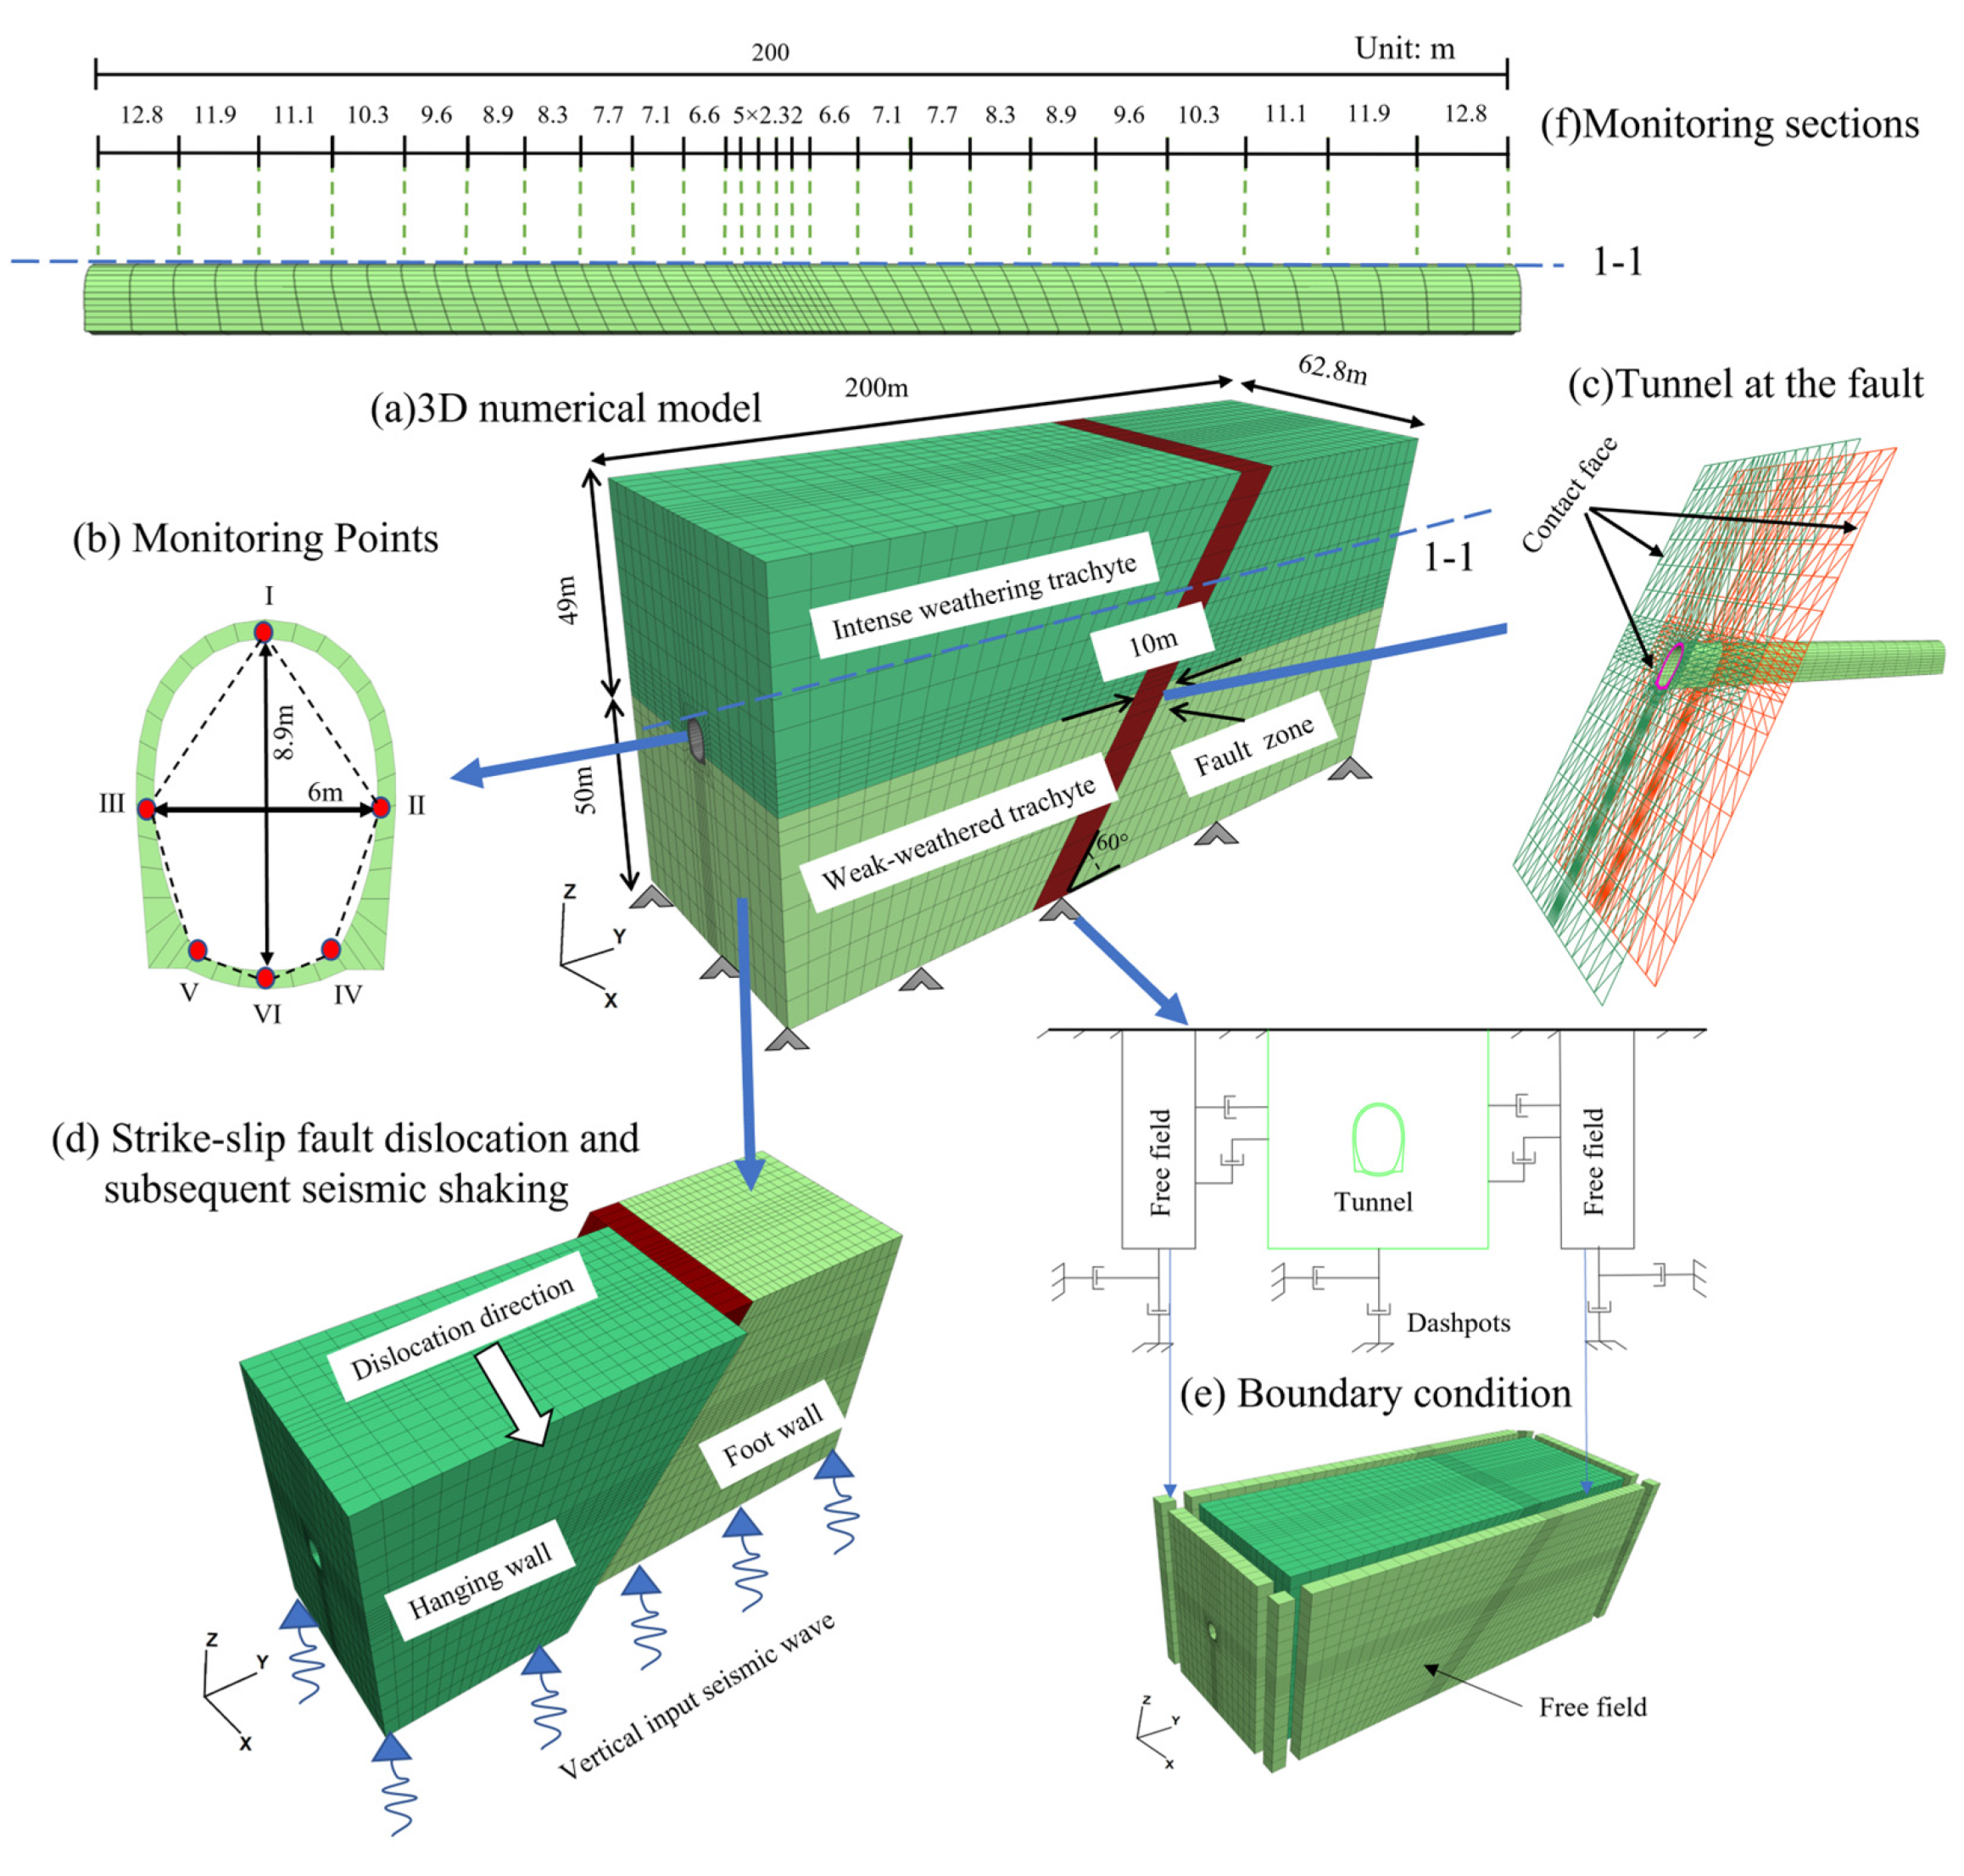
2.2. Numerical Model

This paper mainly studies the response of fault-crossing tunnels with tunnel joints and an isolation layer under strike-slip fault creep-slip and subsequent earthquakes. Several simplifications have been made, including the plain ground surface, neglecting the tunnel excavation process and considering ideal homogeneity and isotropy for the tunnel, the surrounding rock and the fault. The effects of the material inhomogeneity and joints in the rock mass from the response of the tunnel were beyond the scope of this study.
A 3D numerical model of the Ngong railroad tunnel (as shown in Figure 3) was established using FLAC3D software. The overall dimension of the numerical model was 200 m × 62.8 m × 99 m to meet the requirements of the boundary effect. The primary support of the tunnel has only experienced the load in the construction stage, while the secondary lining has resisted load effects throughout the service period. Therefore, the primary support was ignored, and only the 50 cm-thick secondary lining was considered. In addition, the joint between two segmental tunnels was numerically simulated with the interface technique, as shown in Figure 3c [35]. Previous studies have shown that increasing the thickness of the isolation layer can effectively reduce the seismic response of the tunnel. However, it is not significant to increase the thickness of the seismic isolation layer beyond the thickness of 20 cm [38,39]. Thus, a 20-cm-thick isolation layer was implemented between the lining and the surrounding rock.
A total of 25,200 solid elements were used in the model. The grid meshes were refined in the areas near the tunnel and the fault to improve the efficiency of the numerical simulation, as shown in Figure 3a. The isotropic elastic constitutive model was adopted for the lining and shock absorption layer, while the Mohr-Coulomb constitutive model was employed for the surrounding rock and fault. The local damping coefficient ( α L ) was calculated by α L = π D , where D is the critical damping ratio. According to engineering experience, the critical damping of the surrounding rock is usually taken as 5% [24]. Reference [40] recommended that a damping ratio of 0.3–0.7 could be selected for isolation to reduce the structure’s acceleration and displacement response under low-frequency ground motion. Materials with low elastic modulus and high damping, such as rubber and foam concrete, are commonly used for tunnel seismic isolation. The damping ratio of the rubber damping layer given in Reference [41] is 0.35. Thus, this study’s critical damping ratio of the isolation layer was 0.35. The interface elements between the surrounding rock and the fault were established as shown in Figure 3c. The normal stiffness ( K n ) and shear stiffness ( K s ) of the interface elements were calculated by:
K n = K s = 10 m a x K + 4 3 G Z m i n
where K is the bulk modulus, G is the shear modulus, and Z m i n is the smallest dimension on the connecting area in the normal direction of the contact surface. The mechanical parameters of the model were obtained based on a series of laboratory tests, as shown in Table 1.

2.3. Analysis Procedure

2.3.1. Numerical Experimental Design

The 108 (4 × 3 × 3 × 3) overall cases were designed through a full-scale experiment with four factors; i.e., fault dislocation magnitude ( ), earthquake intensity denoted by peak ground acceleration ( P G A ), tunnel joint stiffness logarithmic ratio ( γ ) and isolation layer elastic modulus logarithmic ratio ( η ), as tabulated in Table 2. Considering that the strike-slip fault in the engineering background will experience a 10 cm creep-slip within 100 years, the maximum fault dislocation magnitude ( ) was selected as 15 cm. A 0.4 g P G A was generally induced by a catastrophic earthquake with an intensity of 8 and was applied in this paper. Reference [35] indicated that the joint stiffness is related to the elastic modulus of the joint and the joint width. Here, we did not consider the effect of the joint width, which was assumed to be unit 1; then, the joint stiffness was related to the modulus of the joint material. The elastic modulus of the isolation materials in the previous studies ranged from 10−6 to 102 GPa [18,41]. The joint stiffness was made dimensionless to facilitate the analysis of the sensitivity of the joint stiffness. Thus, the joint stiffness logarithmic ratio ( γ ) was selected from −7 to 1, representing the stiffness variation in the range of 10−6 to 102 GPa/m. In addition, the elastic modulus of the isolation layer was taken with reference to the literature [39]. γ and η are calculated by:
γ = l g k s 1 k s 2 = lg k n 1 k n 2 ,   η = lg E 0 E 1
where k s 1 and k s 2 are the shear stiffness of the tunnel and the surrounding rock at the fault zone, respectively. k n 1 and k n 2 are the corresponding normal stiffnesses. k n 1 , k n 2 are 46, 46 GPa/m, respectively. E 0 and E 1 , with a value of 35 GPa, are the elastic modulus of the seismic layer and the lining, respectively. k s 1 , k s 2 and E 0 are tabulated in Table 2.

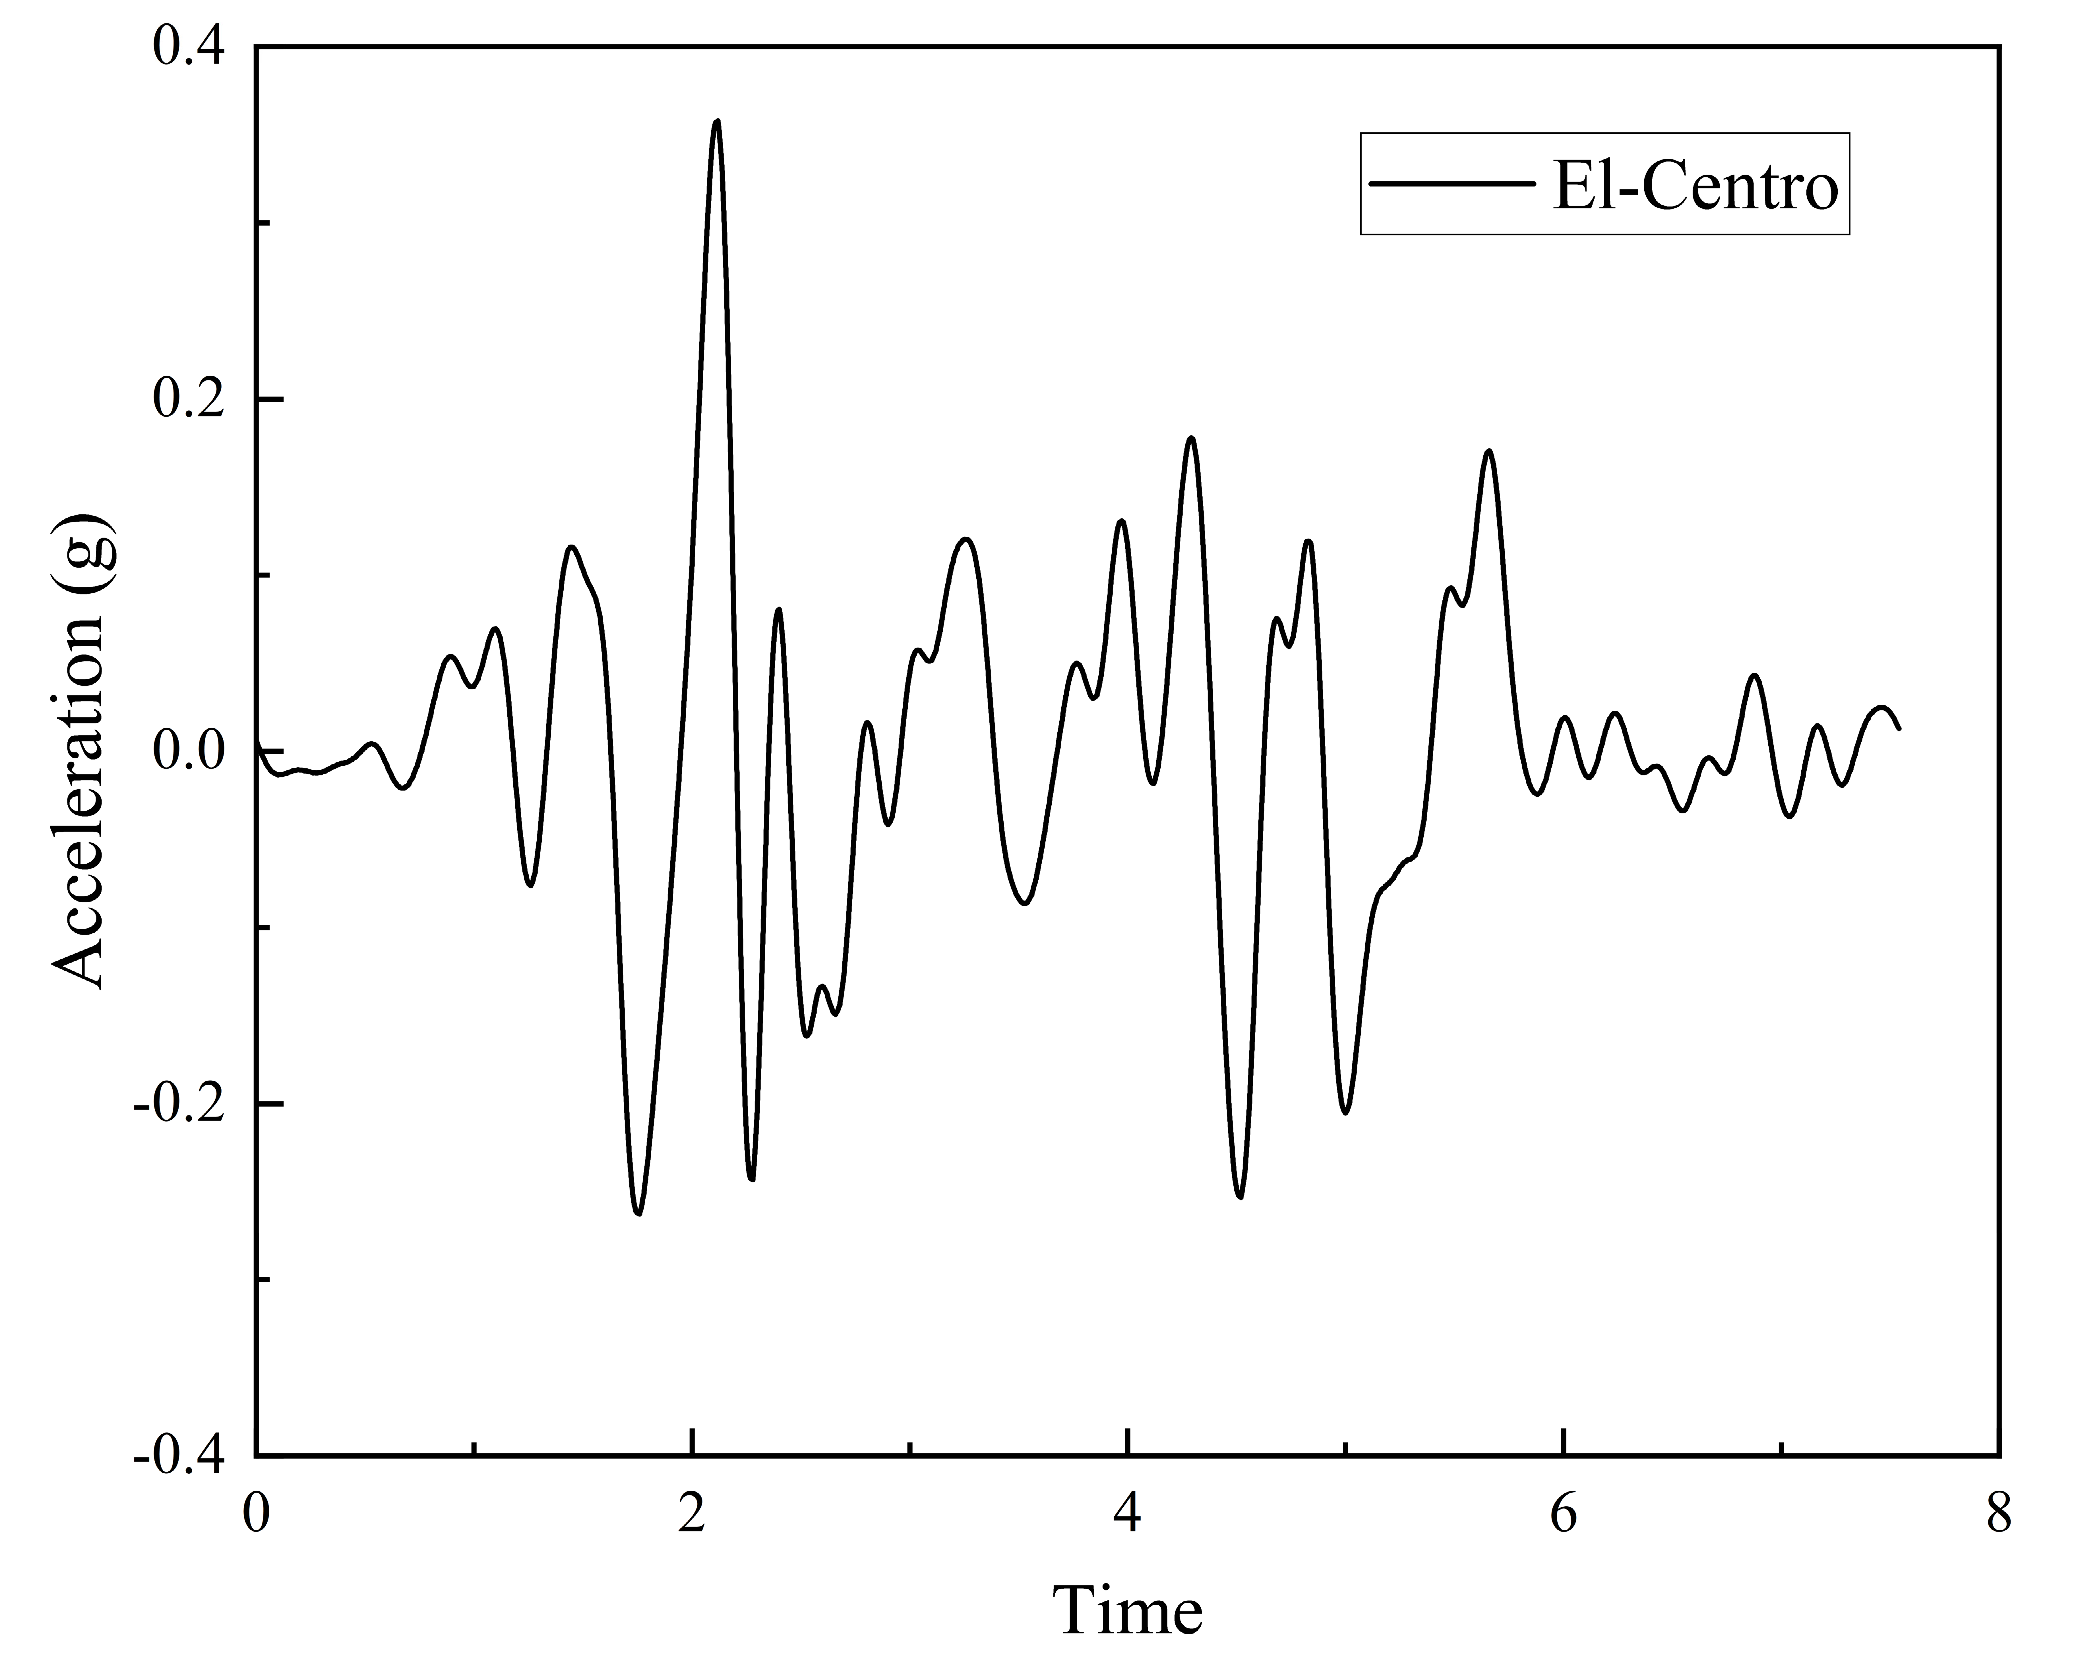
2.3.2. Loading Process and Monitoring

The loading process was divided into the fault creep-slip and subsequent seismic motion stages. During the creep-slip stage, all the nodes on the sides and bottom of the model were constrained, and gravity was applied to obtain the model’s initial stress equilibrium. Then, the fault and footwall were fixed, and a small velocity of the hanging wall along the horizontal (x-axis) direction was achieved up to the required fault dislocation magnitude, as shown in Figure 3d. A small velocity magnitude was selected to avoid the quasistatic fault dislocation developing into a dynamic process. The dynamic module of FLAC3D was opened after the strike-slip fault creep-slip. During the seismic motion stage, selecting an appropriate seismic input is the main issue in evaluating the seismic response of a cross-fault tunnel. From previous seismic events, earthquake damage to tunnels was mainly caused by low-frequency ( f < 20 Hz) waves [38]. The 1940 El Centro ground motion was recorded during the M6.9 strike-slip earthquake at a soil site located approximately 8 km from the surface projection of the fault, which is one of the earliest recorded and most widely used near-field ground motions [42]. Therefore, the El-Centro wave, which is the representative near fault wave, is used to analyze the seismic response in this study. The waveforms with a peak acceleration of 0.4 g are plotted in Figure 4, with filtering and baseline correction. Then, the wave is input from the bottom of the model, as shown in Figure 3d. The free-field boundary was used at the side of the model to eliminate the wave reflection effect (as shown in Figure 3e).
To record the dynamic response of the tunnel lining, 26 monitoring sections were laid along the tunnel’s longitudinal axis, as shown in Figure 3f. Each section had six monitoring points involving the vault (I), right arch springing (II), left arch springing (III), right arch foot (IV), left arch foot (V) and the invert (VI), as shown in Figure 3b. The displacement and stress of each monitoring point were monitored during the fault dislocation and subsequent earthquake processes, and then the peak displacement and peak stress were obtained.

2.4. Sensitivity Analysis

To facilitate the analysis of the effect of the above four factors on the peak stress response of the tunnel lining, the following indices were defined by:
ω 1 = p e a k   σ 1 f t k ,   ω 2 = p e a k   τ f τ ,   ω 3 = p e a k   σ 3 f c k
where ω 1 , ω 2 and ω 3 represent the relative peak values of the first principal stress ( σ 1 ), maximum shear stress ( τ ) and third principal stress ( σ 3 ) among the stress-time history curves, respectively. f t k , f τ and f c k are the standard tensile, shear and compressive strength concrete with values of 2.51, 3.80 and 29.6 MPa, respectively [43,44].
The relative peak stress response of the tunnel lining was established as a function of the normalizations of Δ , P G A , γ and η using the multivariate nonlinear fitting method with the expression of
ω i = f α Δ , α P G A , α γ , α η    i = 1 , 2 , 3
where α Δ = Δ Δ m i n Δ m a x Δ m i n , α P G A = P G A P G A m i n P G A m a x P G A m i n , α γ = γ γ m i n γ m a x γ m i n , α η = η η m i n η m a x η m i n , m a x , m i n , P G A m a x , P G A m i n , γ m a x , γ m i n , η m a x and η m i n are tabulated in Table 2.

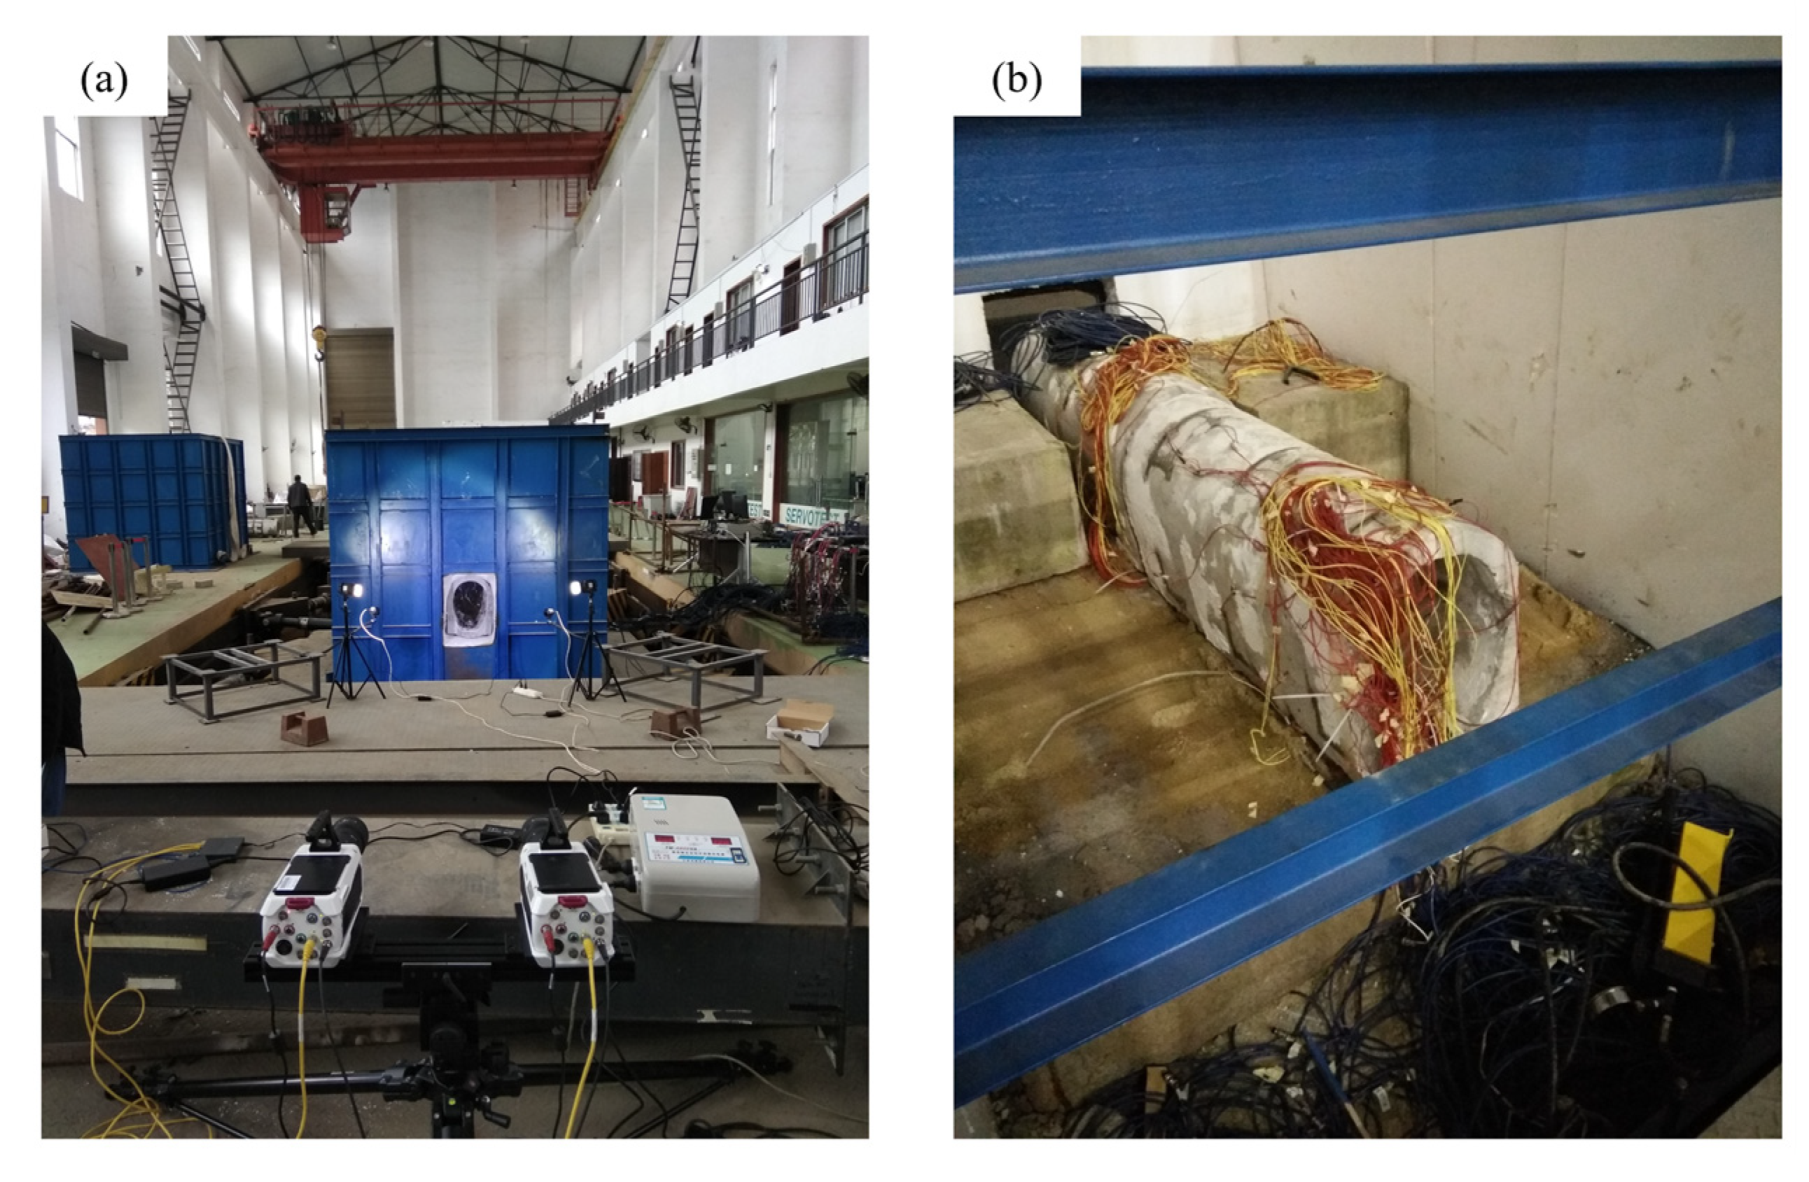
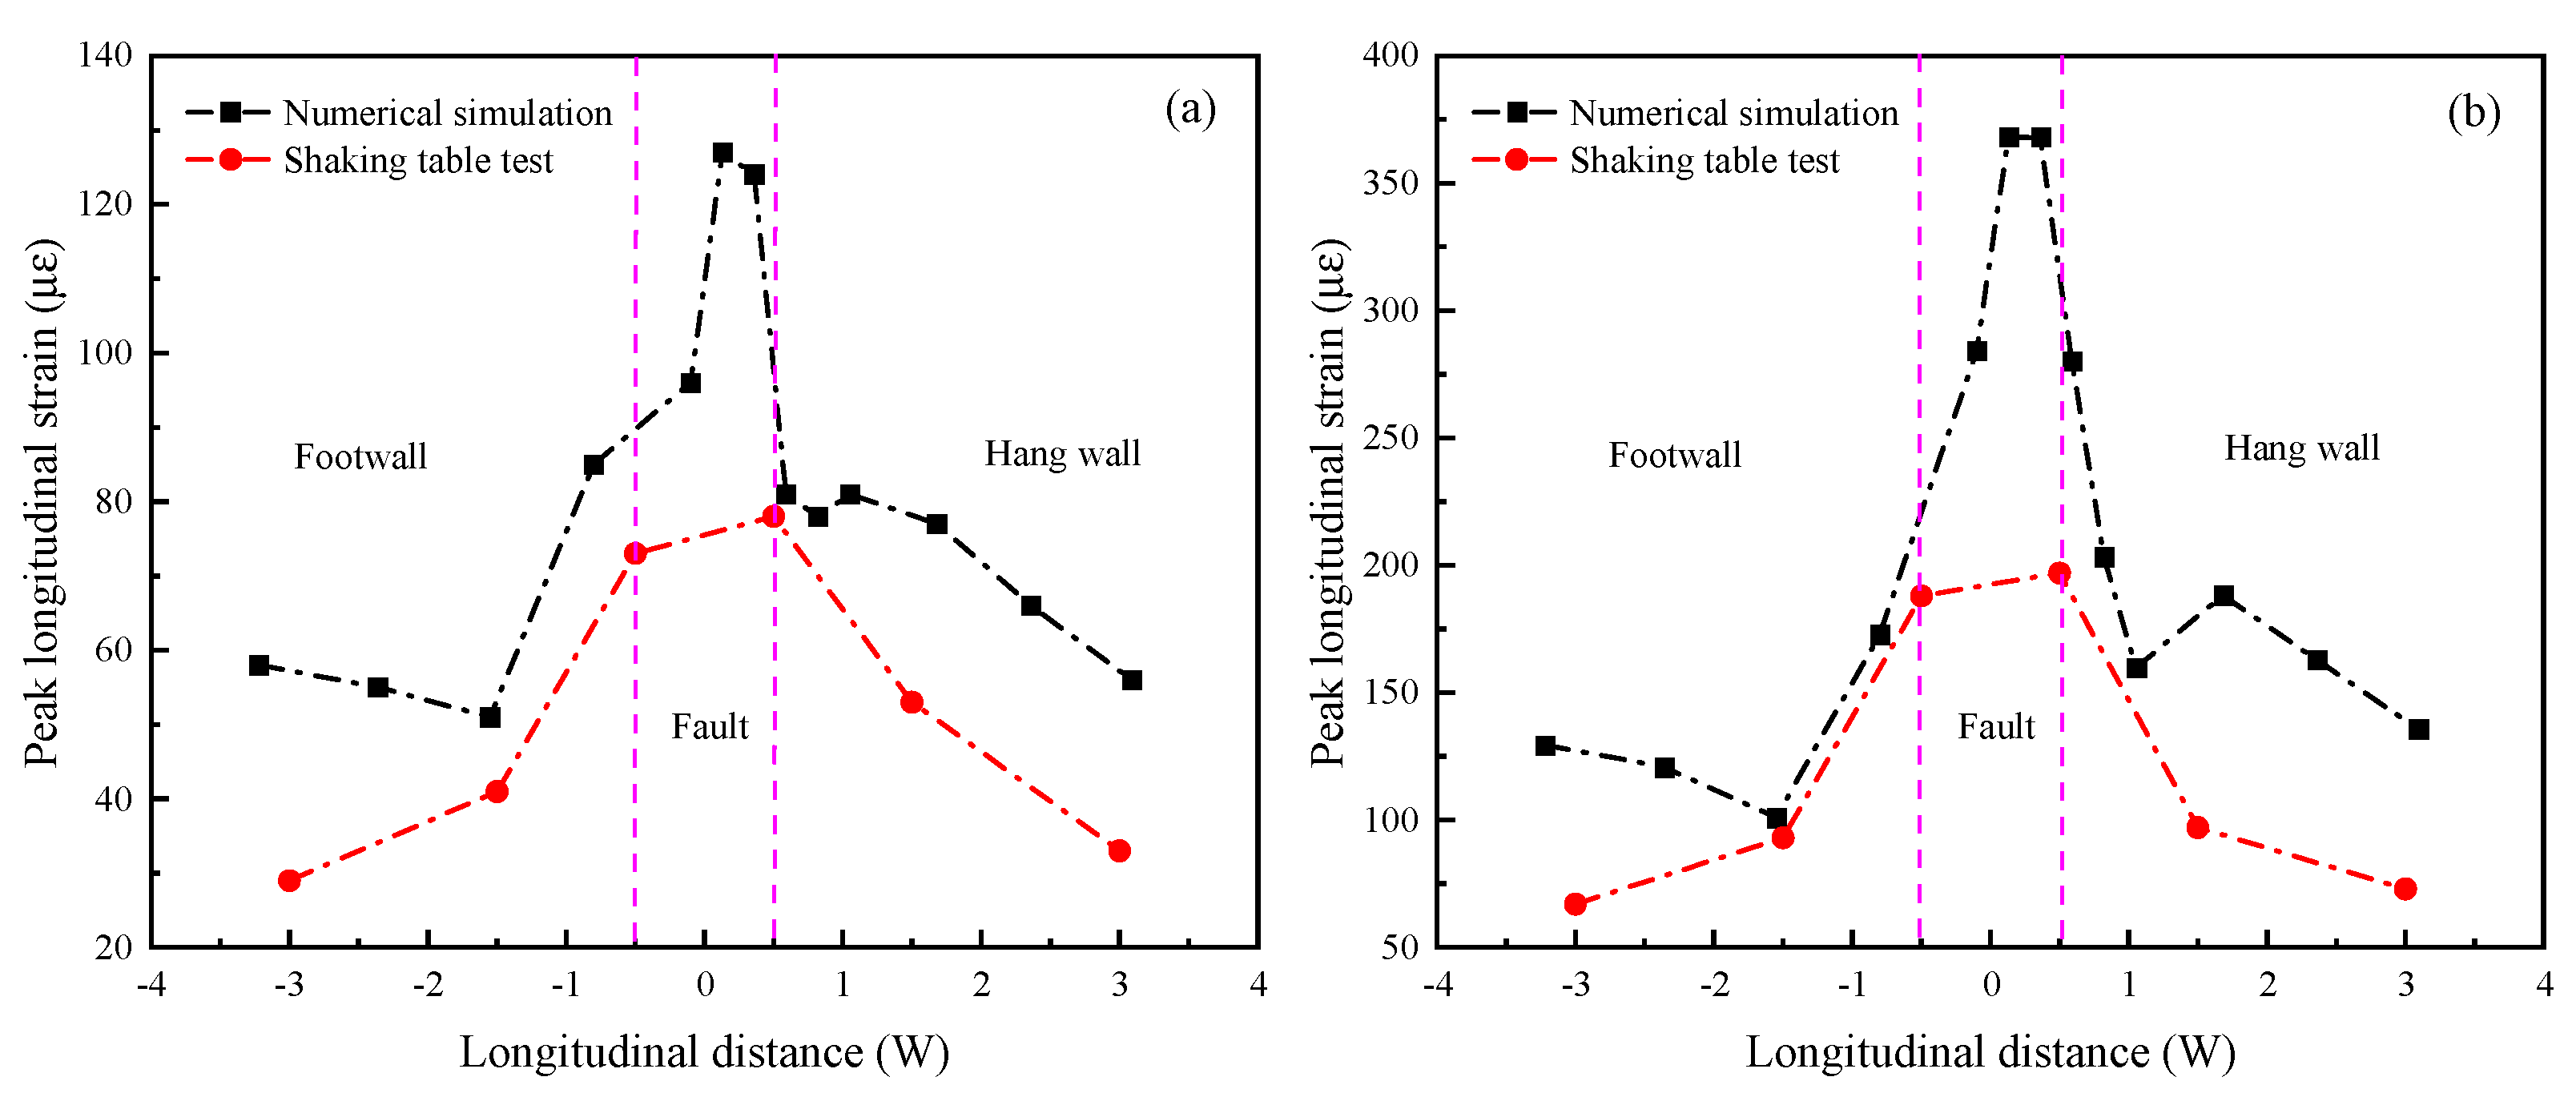
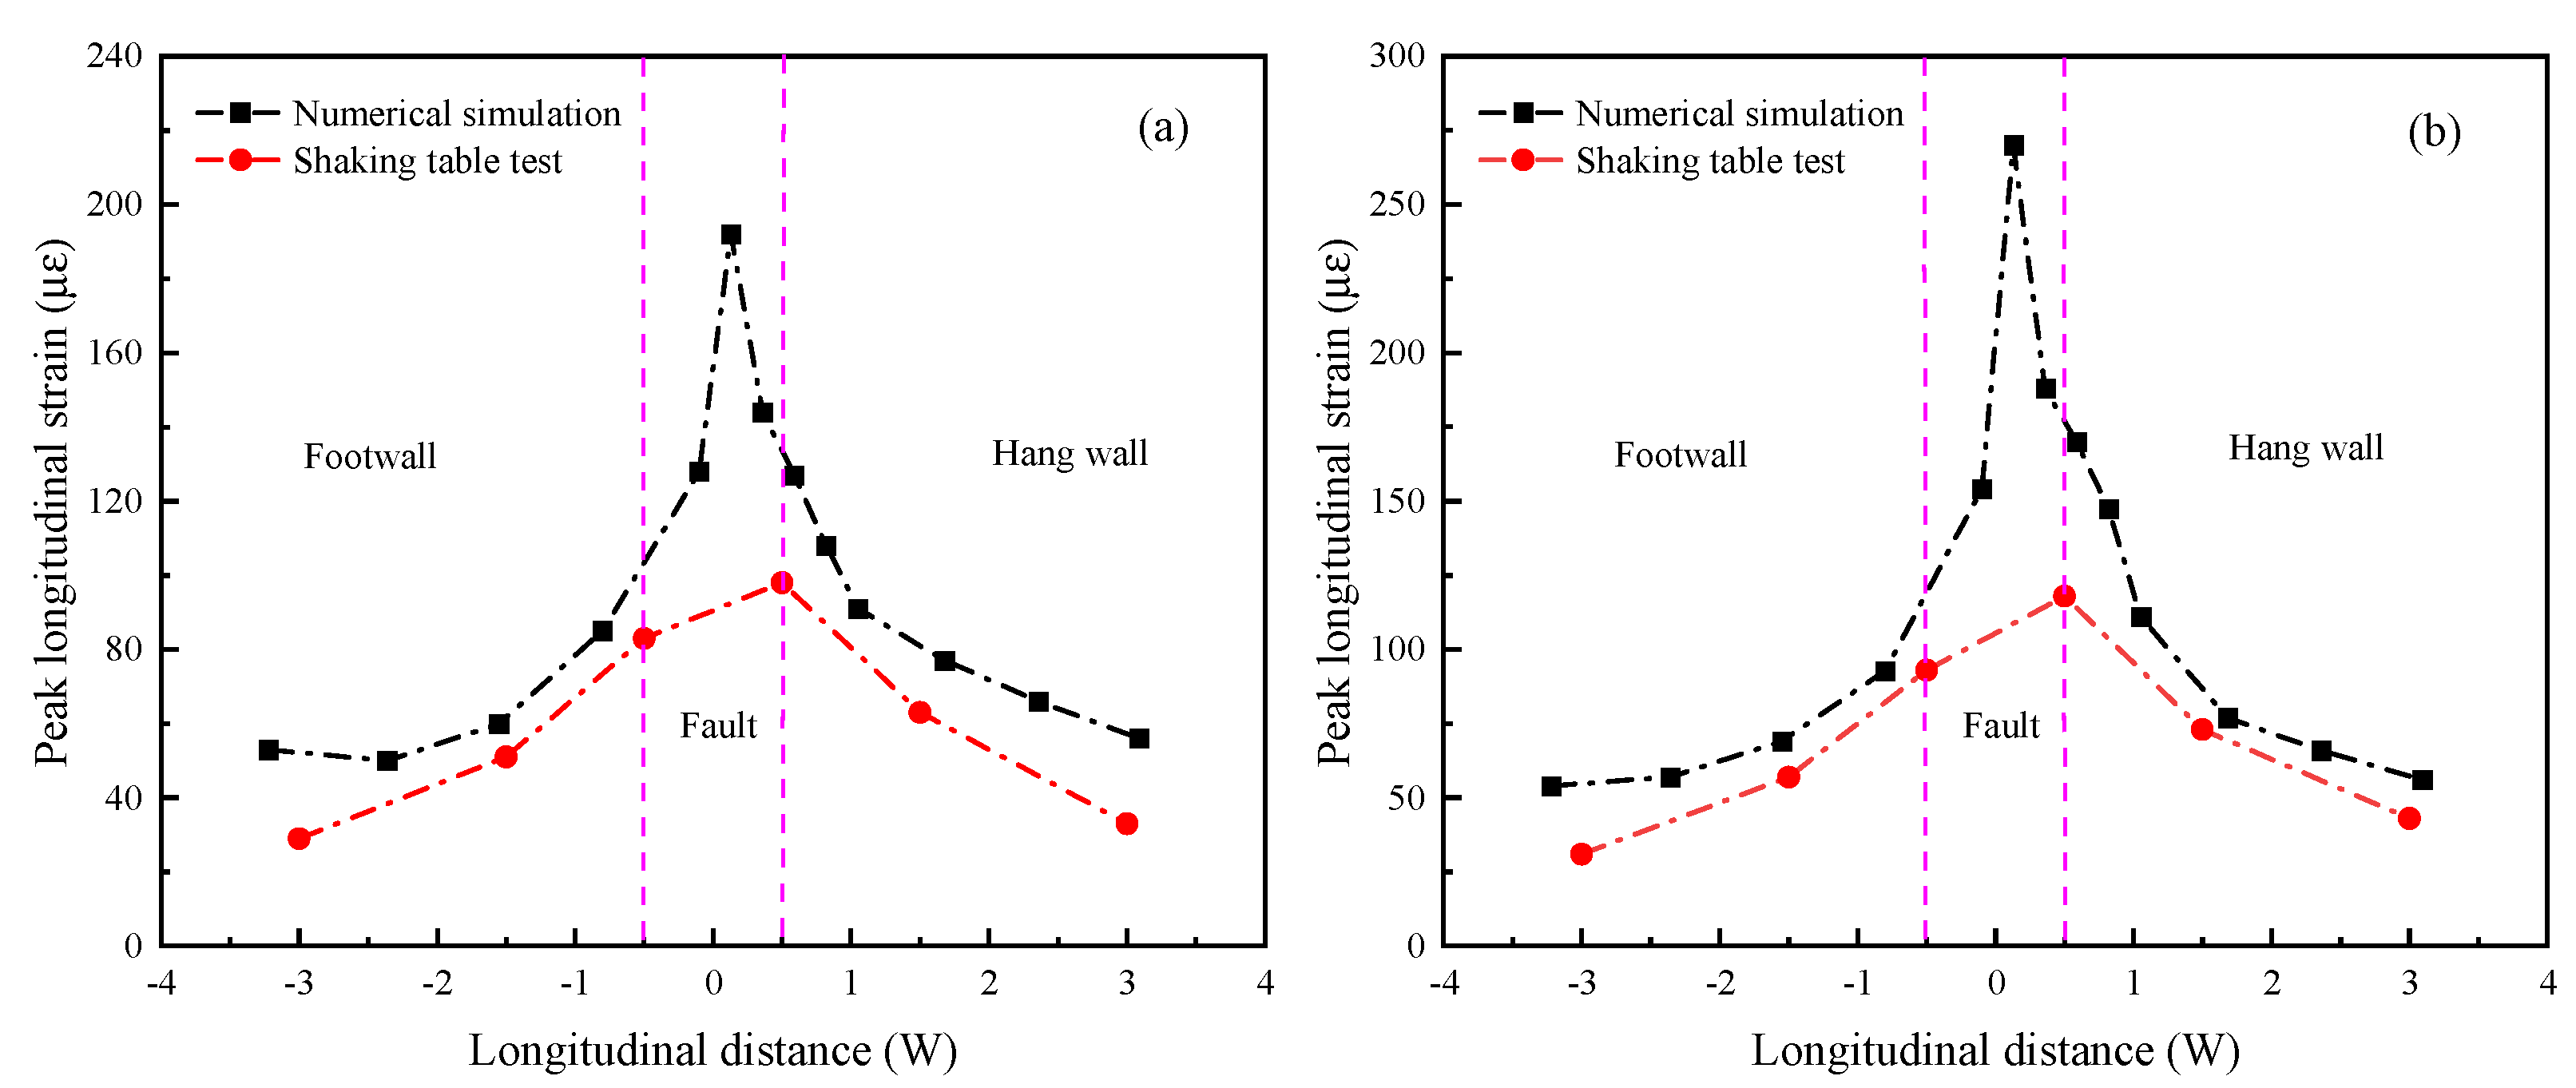
3. Verification of the Numerical Model

The numerical model is calibrated with the results of the physical model. To the best knowledge of the authors, the combined effect of strike-slip fault creep-slip and subsequent seismic excitation on tunnels has not been experimentally carried out. Therefore, the numerical model is verified by the responses of the Ngong railroad tunnel under seismic shaking, the combination of a normal fault creep-slip and subsequent seismic excitation, respectively [33,45].
Figure 5 shows the shaking table test model of the Ngong railroad tunnel with the geometric similarity ratio of 1/20. The length of the model tunnel is about three times the fault width ( W ). This test was conducted under seismic shaking, as well as under fault creep-slip and subsequent seismic excitation. Further details are available in the literature [33,45].
Figure 6 plots the numerical and experimental tunnel strains under 0.2 g and 0.4 g seismic shaking, respectively. The fault dislocation on the numerical model boundary is set to zero. Figure 6 shows that the peak longitudinal strains of the lining invert from the numerical model are similar to the ones from the shaking table experiment. Both are characterized by the amplification of peak longitudinal strains at the center of the fault compared to the ones at other positions along the tunnel axis.
Figure 7 plots the numerical and experimental tunnel strains under fault creep-slip (2 cm and 4 cm) and subsequent 0.2 g seismic excitation. The fault dislocation direction of the numerical mode is changed from a horizontal direction to a vertical one. This change represents the normal fault creep slip. Figure 7 shows that the numerical model and shaking table experiment also have similar peak longitudinal strains lining the invert and a amplified peak longitudinal strain at the center of the fault zone in comparison to other positions along the tunnel axis. In summary, the proposed numerical tunnel model provides consistent results with the shaking table test. Therefore, this numerical tunnel is verified to be reasonable and can be used for further analysis.

4. Numerical Results

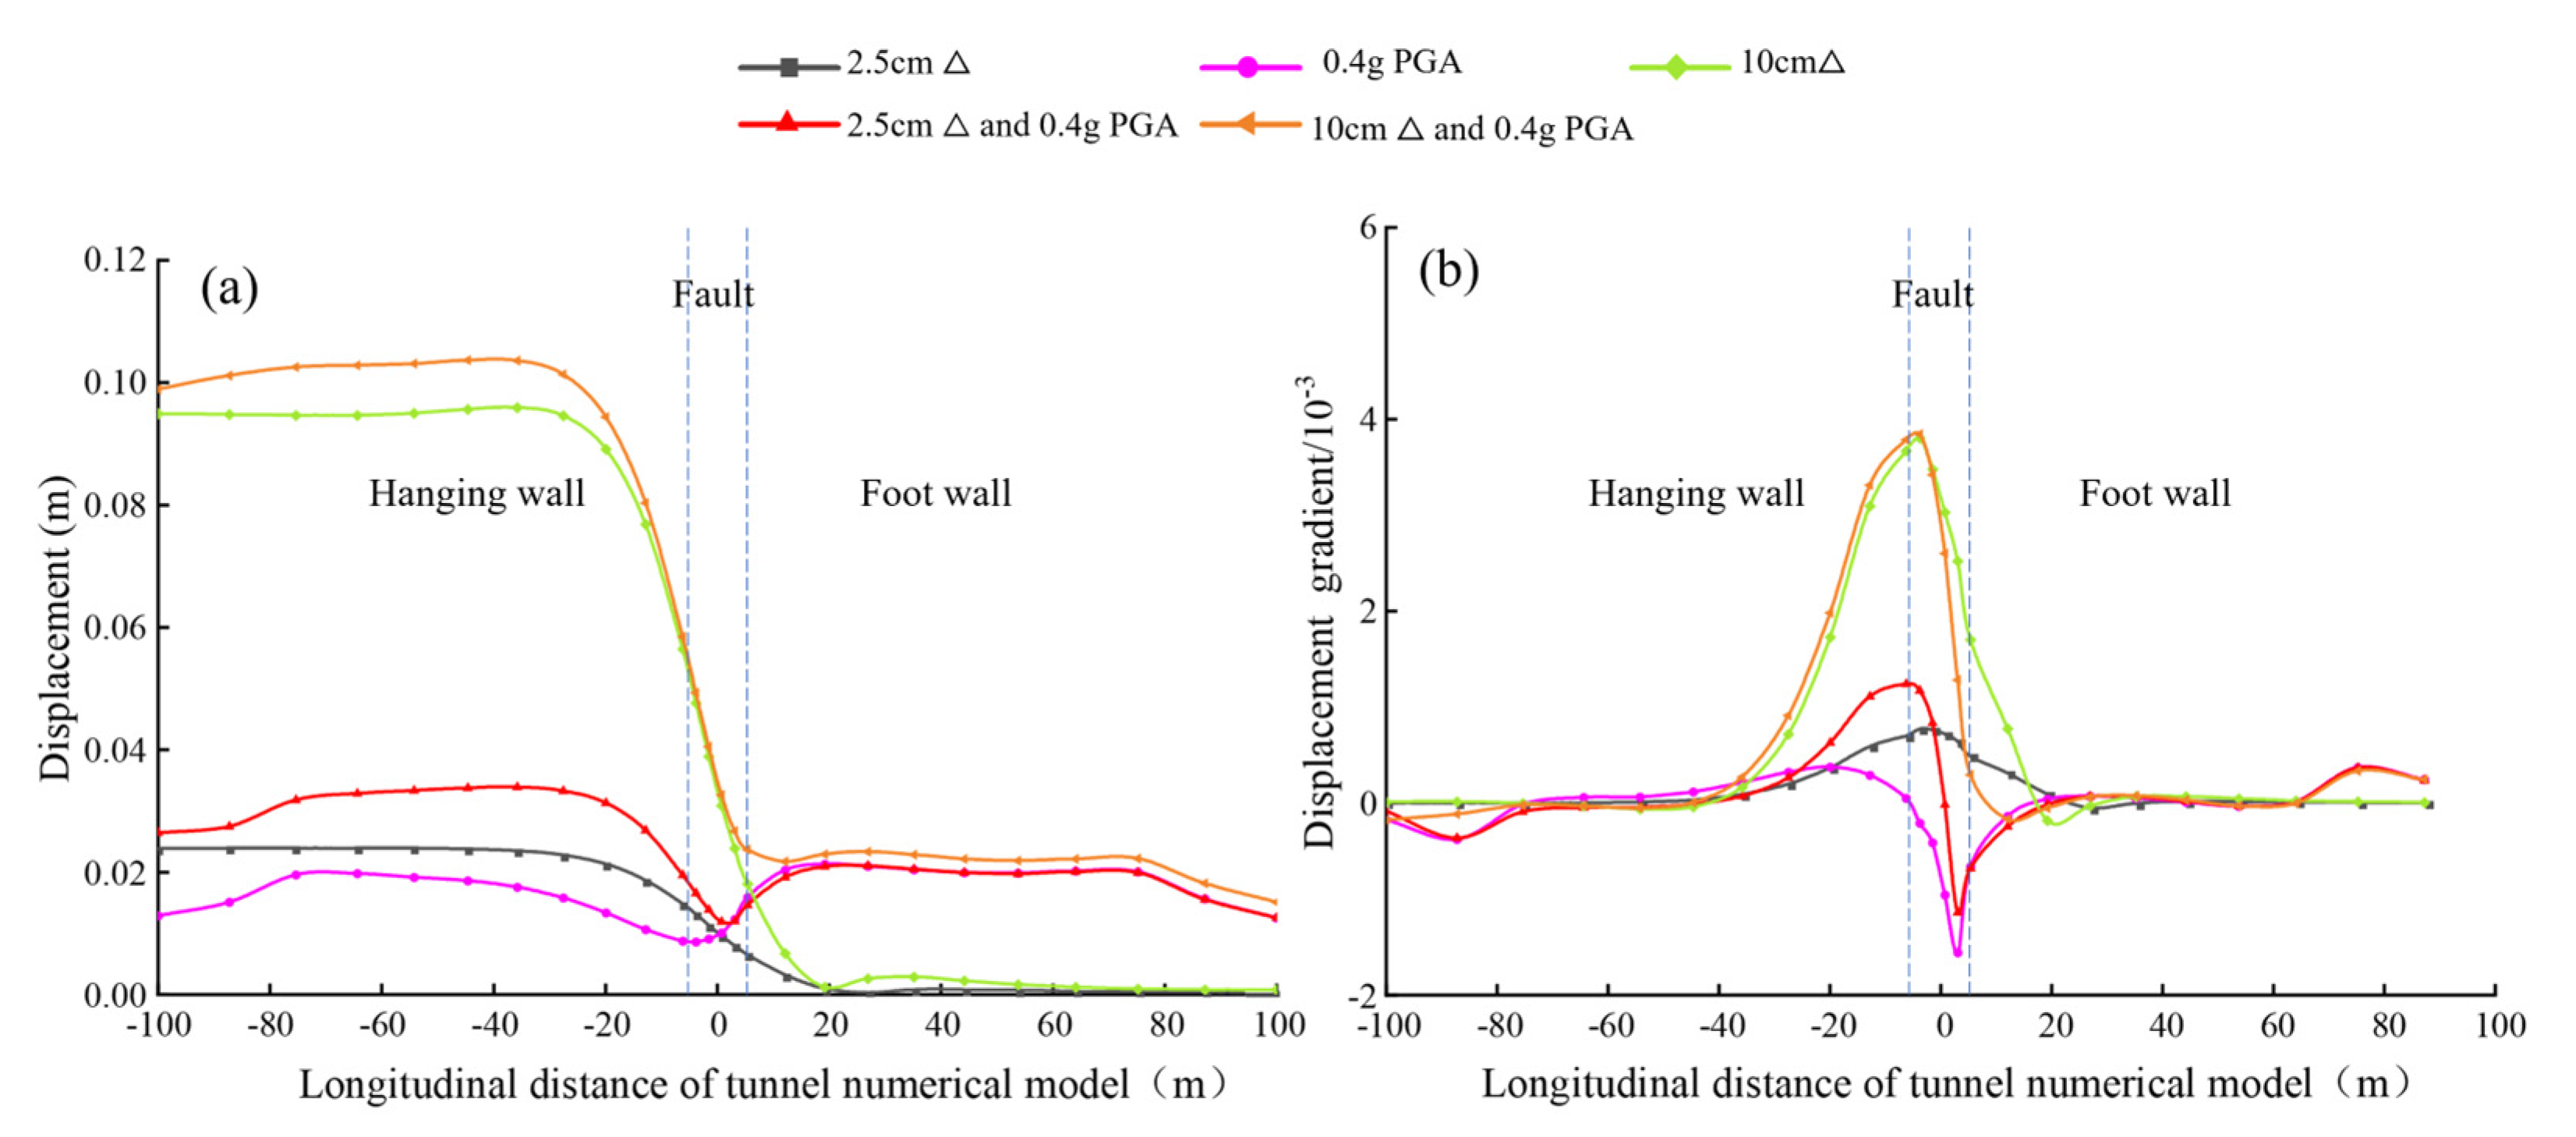
4.1. Peak Displacement Response of the Tunnel

Figure 8 shows the peak displacement and peak displacement gradient at the tunnel invert along the tunnel longitudinal direction under strike-slip fault creep-slip (Δ) and subsequent 0.4 g (PGA) seismic shaking. The peak displacement direction and magnitude in Figure 8 are determined by the horizontal fault displacement and vertical earthquake displacement. It can be seen in Figure 8a that the presence of an isolation layer changes the hill-shaped propagation of peak displacement at the tunnel invert to the valley-shaped distribution under seismic excitation alone. The reason for this is that the isolation layer’s damping performance and low modulus reduce the vibration amplitude of the tunnel at the fault. Furthermore, the valley-shaped distribution of peak displacements under seismic excitation is transformed into an S-shaped distribution under the combined fault dislocation and seismic excitation. Correspondingly, the peak displacement gradient propagation alters from a valley to a hill shape, as shown in Figure 8b. Notably, regardless of seismic excitation, fault creep-slip or combined effects, the displacement gradient curves have a pattern of sharp changes near the fault and are smoother at places far from the fault. The maximum displacement gradients (absolute values) are within the fault zone, where the stiffness and strength of the fault are low compared to the surrounding rocks of the hanging wall and footwall. The gradients of the peak displacement curves are closely related to the mechanical characteristics of the rock masses. Meanwhile, it can be seen that the peak displacements at the tunnel in the hanging wall are smaller than those in the footwall. This may be because the relative slippage of the hanging wall is induced by seismic excitation compared to the footwall [41]. In addition, the peak displacement at the invert in the hanging wall under only a 0.4 g seismic excitation is close to that under only a 2.5 cm fault dislocation. Although the input motion has a vibration amplitude of 8.8 cm, it can be reduced and absorbed by the isolation layer when it reaches the tunnel lining [27]. As a result, the 0.4 g seismic excitation only induces approximately 2.5 cm peak displacement at the tunnel invert.

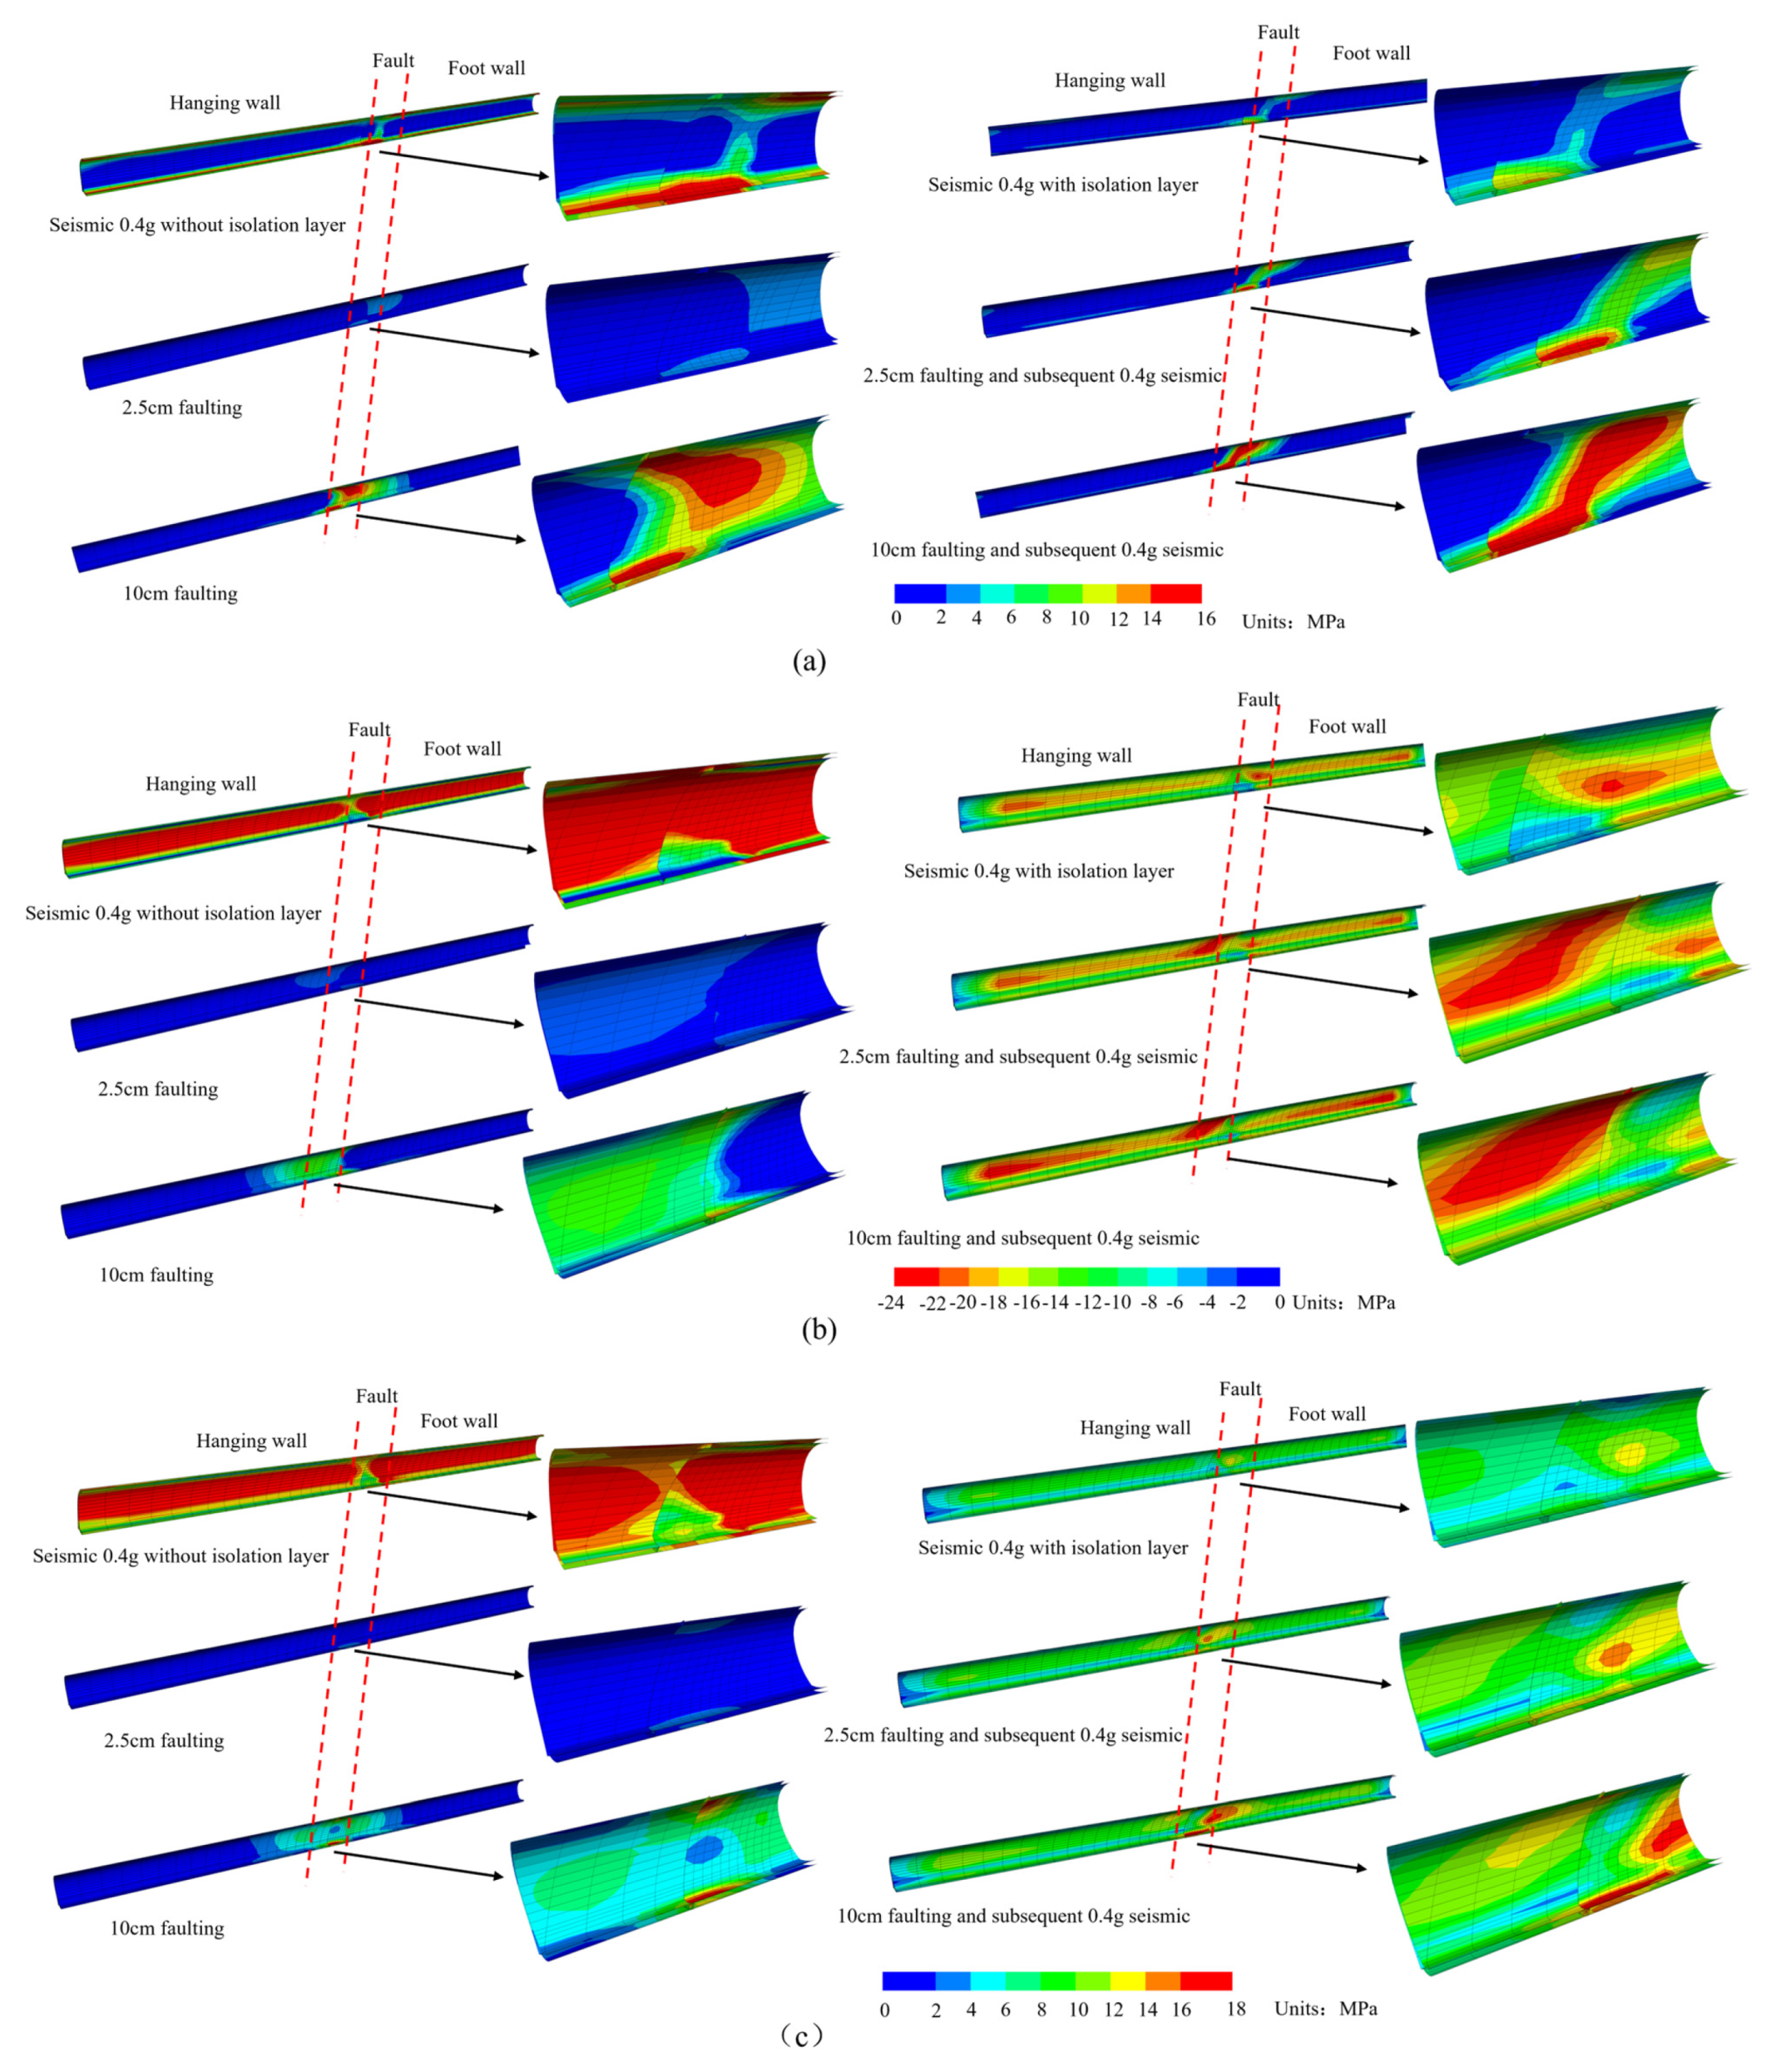
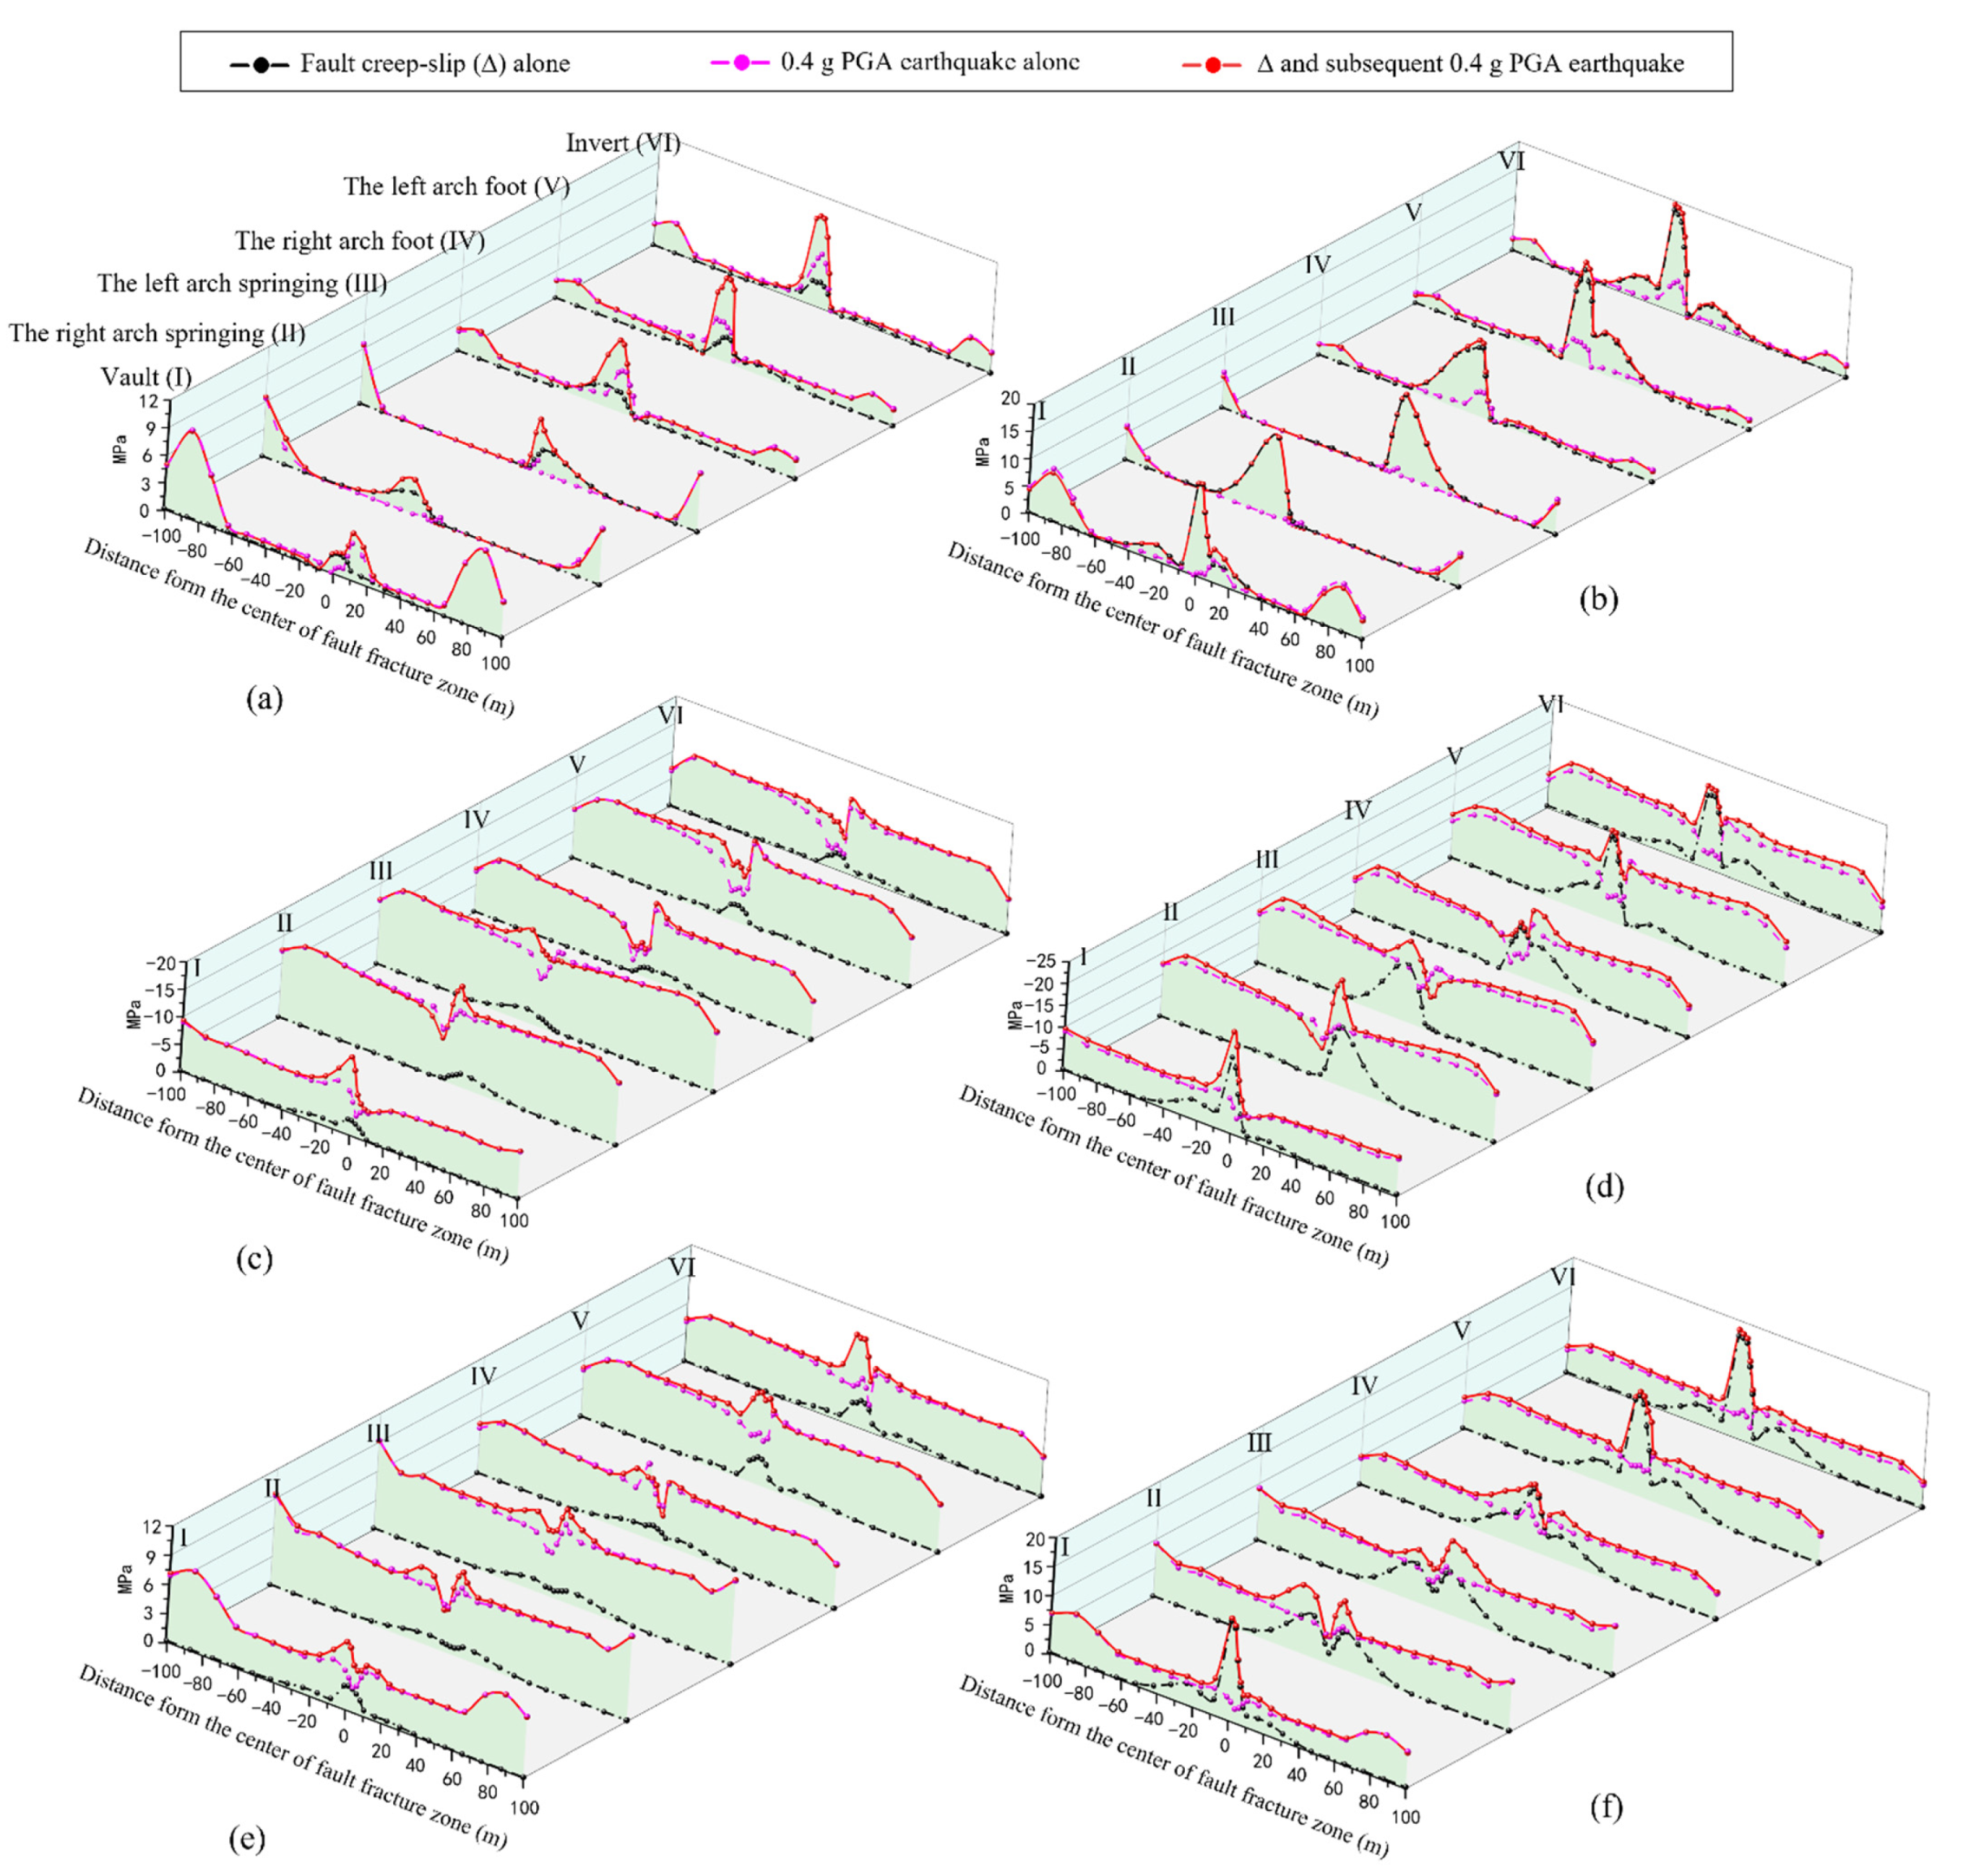
4.2. Stress Response of the Tunnel

Figure 9 plots the σ 1 , σ 3 and τ contours of the tunnel with a γ of −7 and η of −4 under Δ and a subsequent 0.4 g PGA seismic excitation, respectively. In this paper, σ 1 and σ 3 are the tensile and compressive stresses which are represented by the positive and negative stresses, respectively. Figure 9 shows that σ 1 , σ 3 and τ of the tunnel are mainly concentrated in the fault zone. The stress concentration zone of the concrete lining exhibits tensile stress ( σ 1 ) and shear stress ( τ ), which are larger than the corresponding standard strength; for example, the maximum σ 1 = 16 MPa > 2.51 MPa and maximum τ = 18 MPa > 3.8 MPa. The compressive stress in Figure 9c is less than the standard compressive strength. This means the tunnel at the fault zone will undergo tensile and shear failure under strike-slip fault creep-slip and subsequent seismic shaking. According to reference [8], extensive shear-type and tension-type cracks were observed in the Tawarayama tunnel during the Kumamoto earthquake (Japan, 2016) due to the interaction of strike-slip fault dislocations and seismic shaking. Meanwhile, Figure 9 shows that the tunnel stress concentration zone gradually expands with the increase in the fault creep-slip magnitude. Reference [14] noted that the tunnel section located at the fault movement surface is first damaged with the strike-slip fault movement. The degree of damage increases with the magnitude of the fault movement. In addition, the stress concentration is significantly reduced by the isolation layer under the strike-slip fault creep-slip and subsequent seismic shaking.

4.3. Peak Stress Response of the Tunnel

Figure 10 plots the peak stress responses of the tunnel with a γ of −7 and η of −4 under Δ and a subsequent 0.4 g of PGA seismic excitation. If the fault centerline is the axis of symmetry, the peak stress distribution in the vault and the invert is symmetric about the fault axis. The peak stress distribution of the left arch springing and right arch springing is centrosymmetric, as well as the left and right arch foot. The peak tensile stress and shear stress at the tunnel invert of the fault zone are more extensive than those at other positions. Moreover, the peak tensile stress at the invert reaches 9.81 MPa and exceeds the sum of 2.63 MPa under 2.5 cm Δ alone and 5.28 MPa under 0.4 g PGA seismic excitation alone. The peak compressive and shear stress have the same characteristics as the peak tensile stress, as shown in Figure 10. It can be deduced that the peak tensile stress under the combined effect is greater than the sum of that under fault creep-slip alone and that under seismic excitation alone. This indicates that tunnel stress responses at the fault are amplified by the combined effect when compared to fault dislocation or seismic motion.

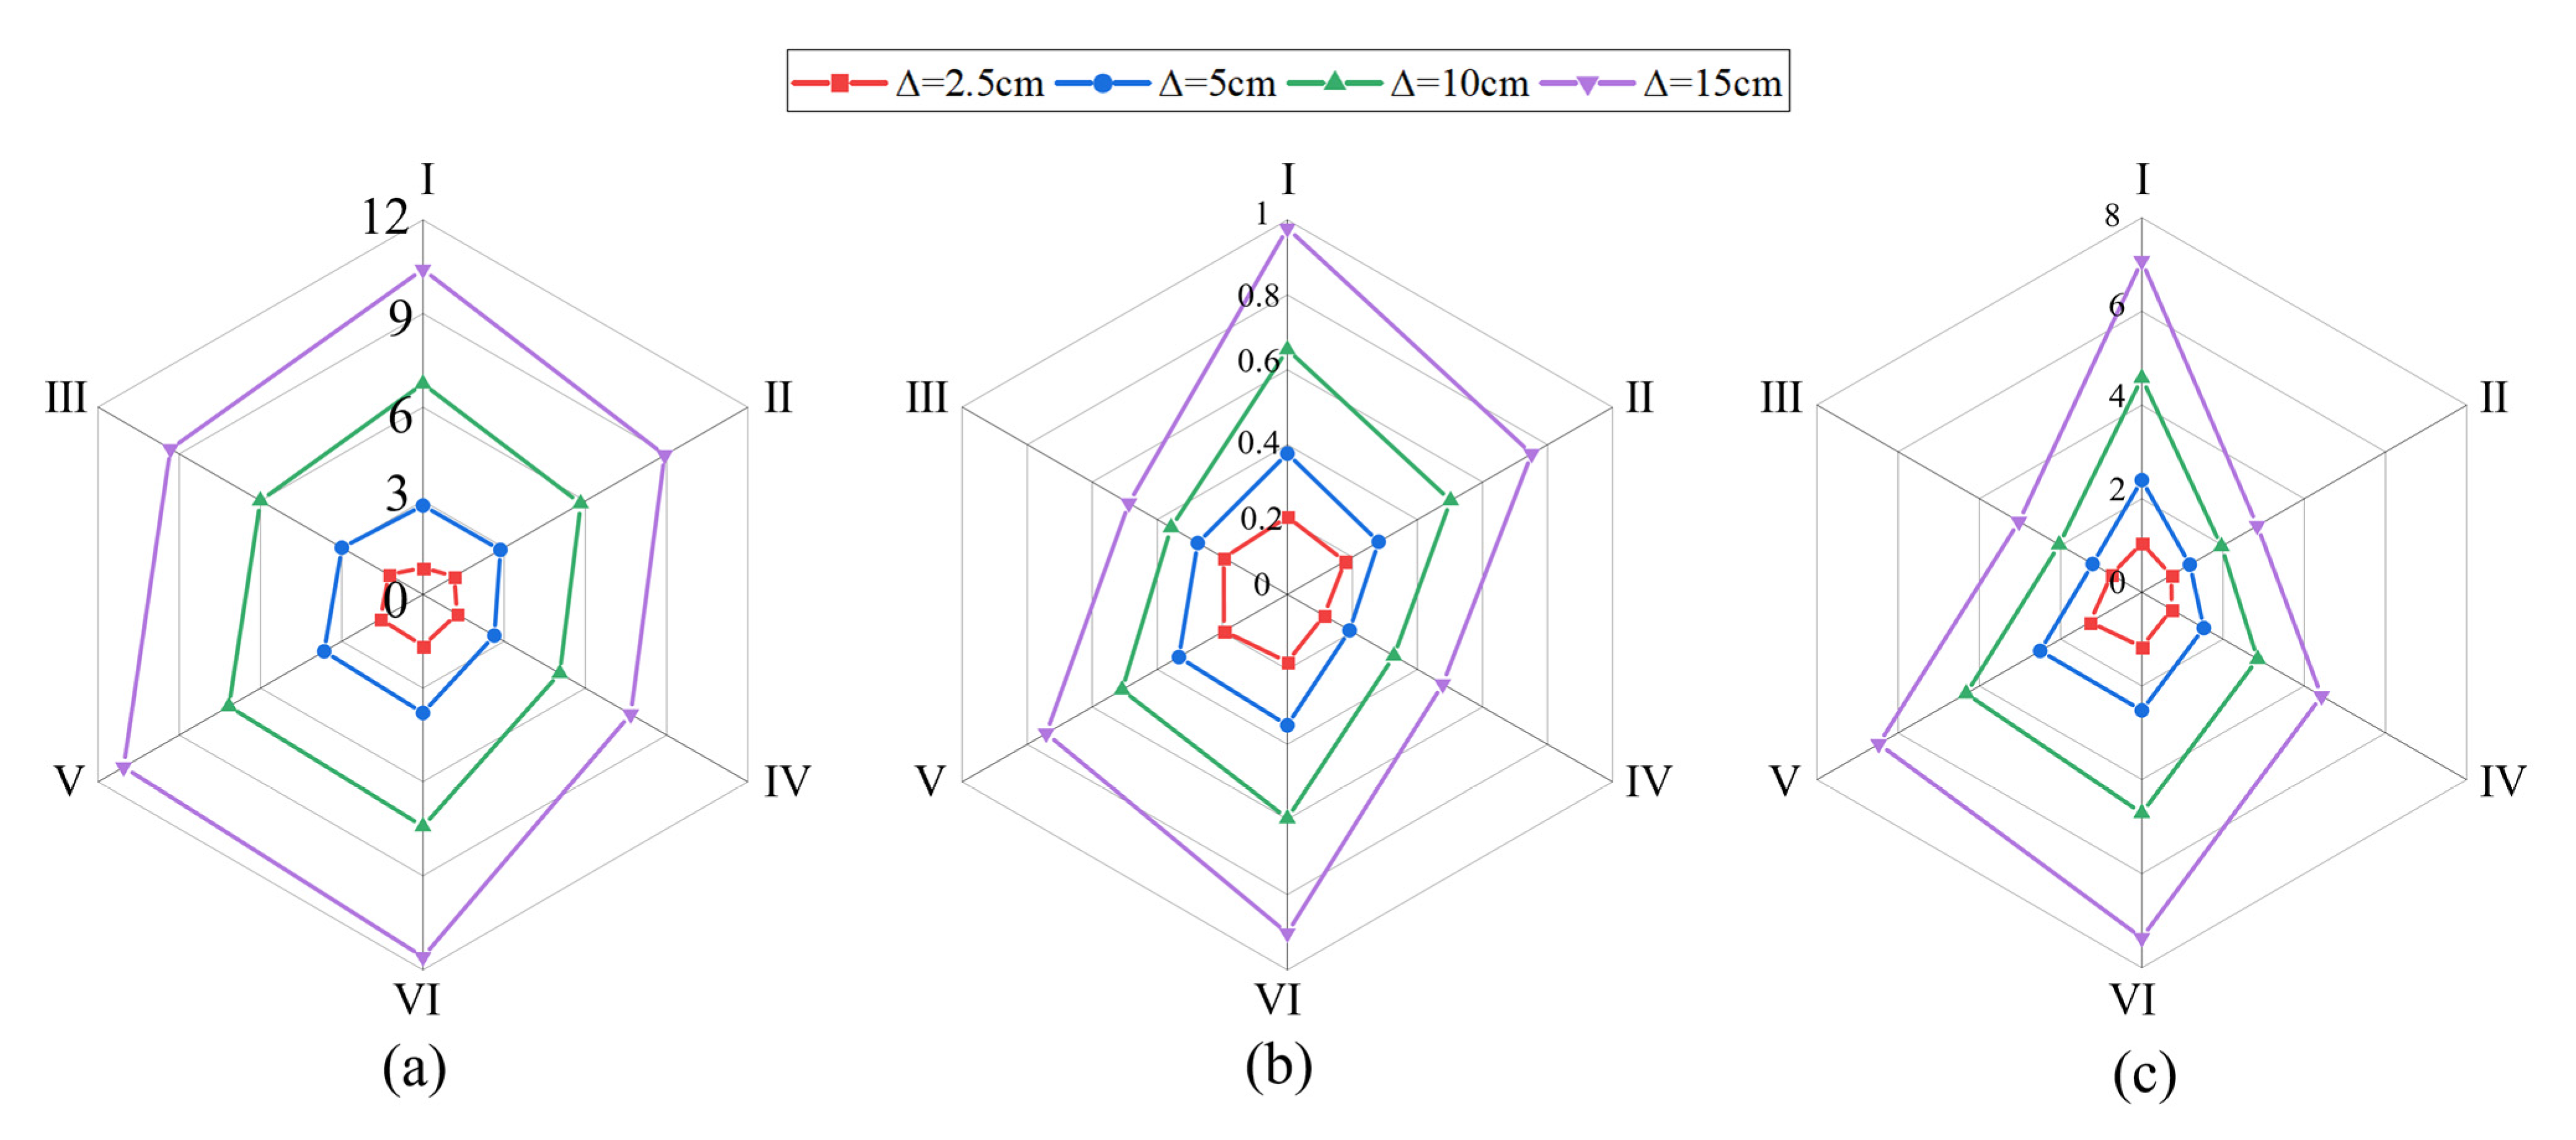
4.3.1. Effect of Fault Dislocation

Figure 11 shows the effect of Δ on the relative peak stress responses; i.e., ω 1 , ω 2 and ω 3 at the fault section of the tunnel with a γ of −7 and η of −4 under fault dislocations and a subsequent 0.1 g PGA of seismic excitation. The relative tensile stress ( ω 1 ) is evenly distributed at the fault section (Figure 11a), while the relative shear stress ( ω 2 ) occurs with a pyriform distribution at the fault section (Figure 11c). Figure 11 also shows that the ω 1 , ω 3 and ω 2 at the invert (VI point), vault (I point) and invert (VI point) of the fault section are larger than those at other positions. They increase from 1.64 to 11.58, from 0.2 to 0.97 and from 2.52 to 7.36 with the increase in from 2.5 cm to 15 cm, respectively. As the magnitude of the fault dislocation increases, so does the relative peak stress, making the tunnel more vulnerable to damage. In fact, the greater the displacement accumulated by the fault creep-slip, the greater the uncoordinated deformation between the tunnel and the surrounding rock. Once the deformation exceeds the limit value, the lining will be cracked. The damage to the lining accumulates as the cracks develop and may cause complete damage or collapse even before an earthquake occurs. Moreover, the tunnel invert is the most vulnerable to more severe tensile and shear failure, and should be primarily protected under strike-slip fault creep-slip and subsequent earthquakes.

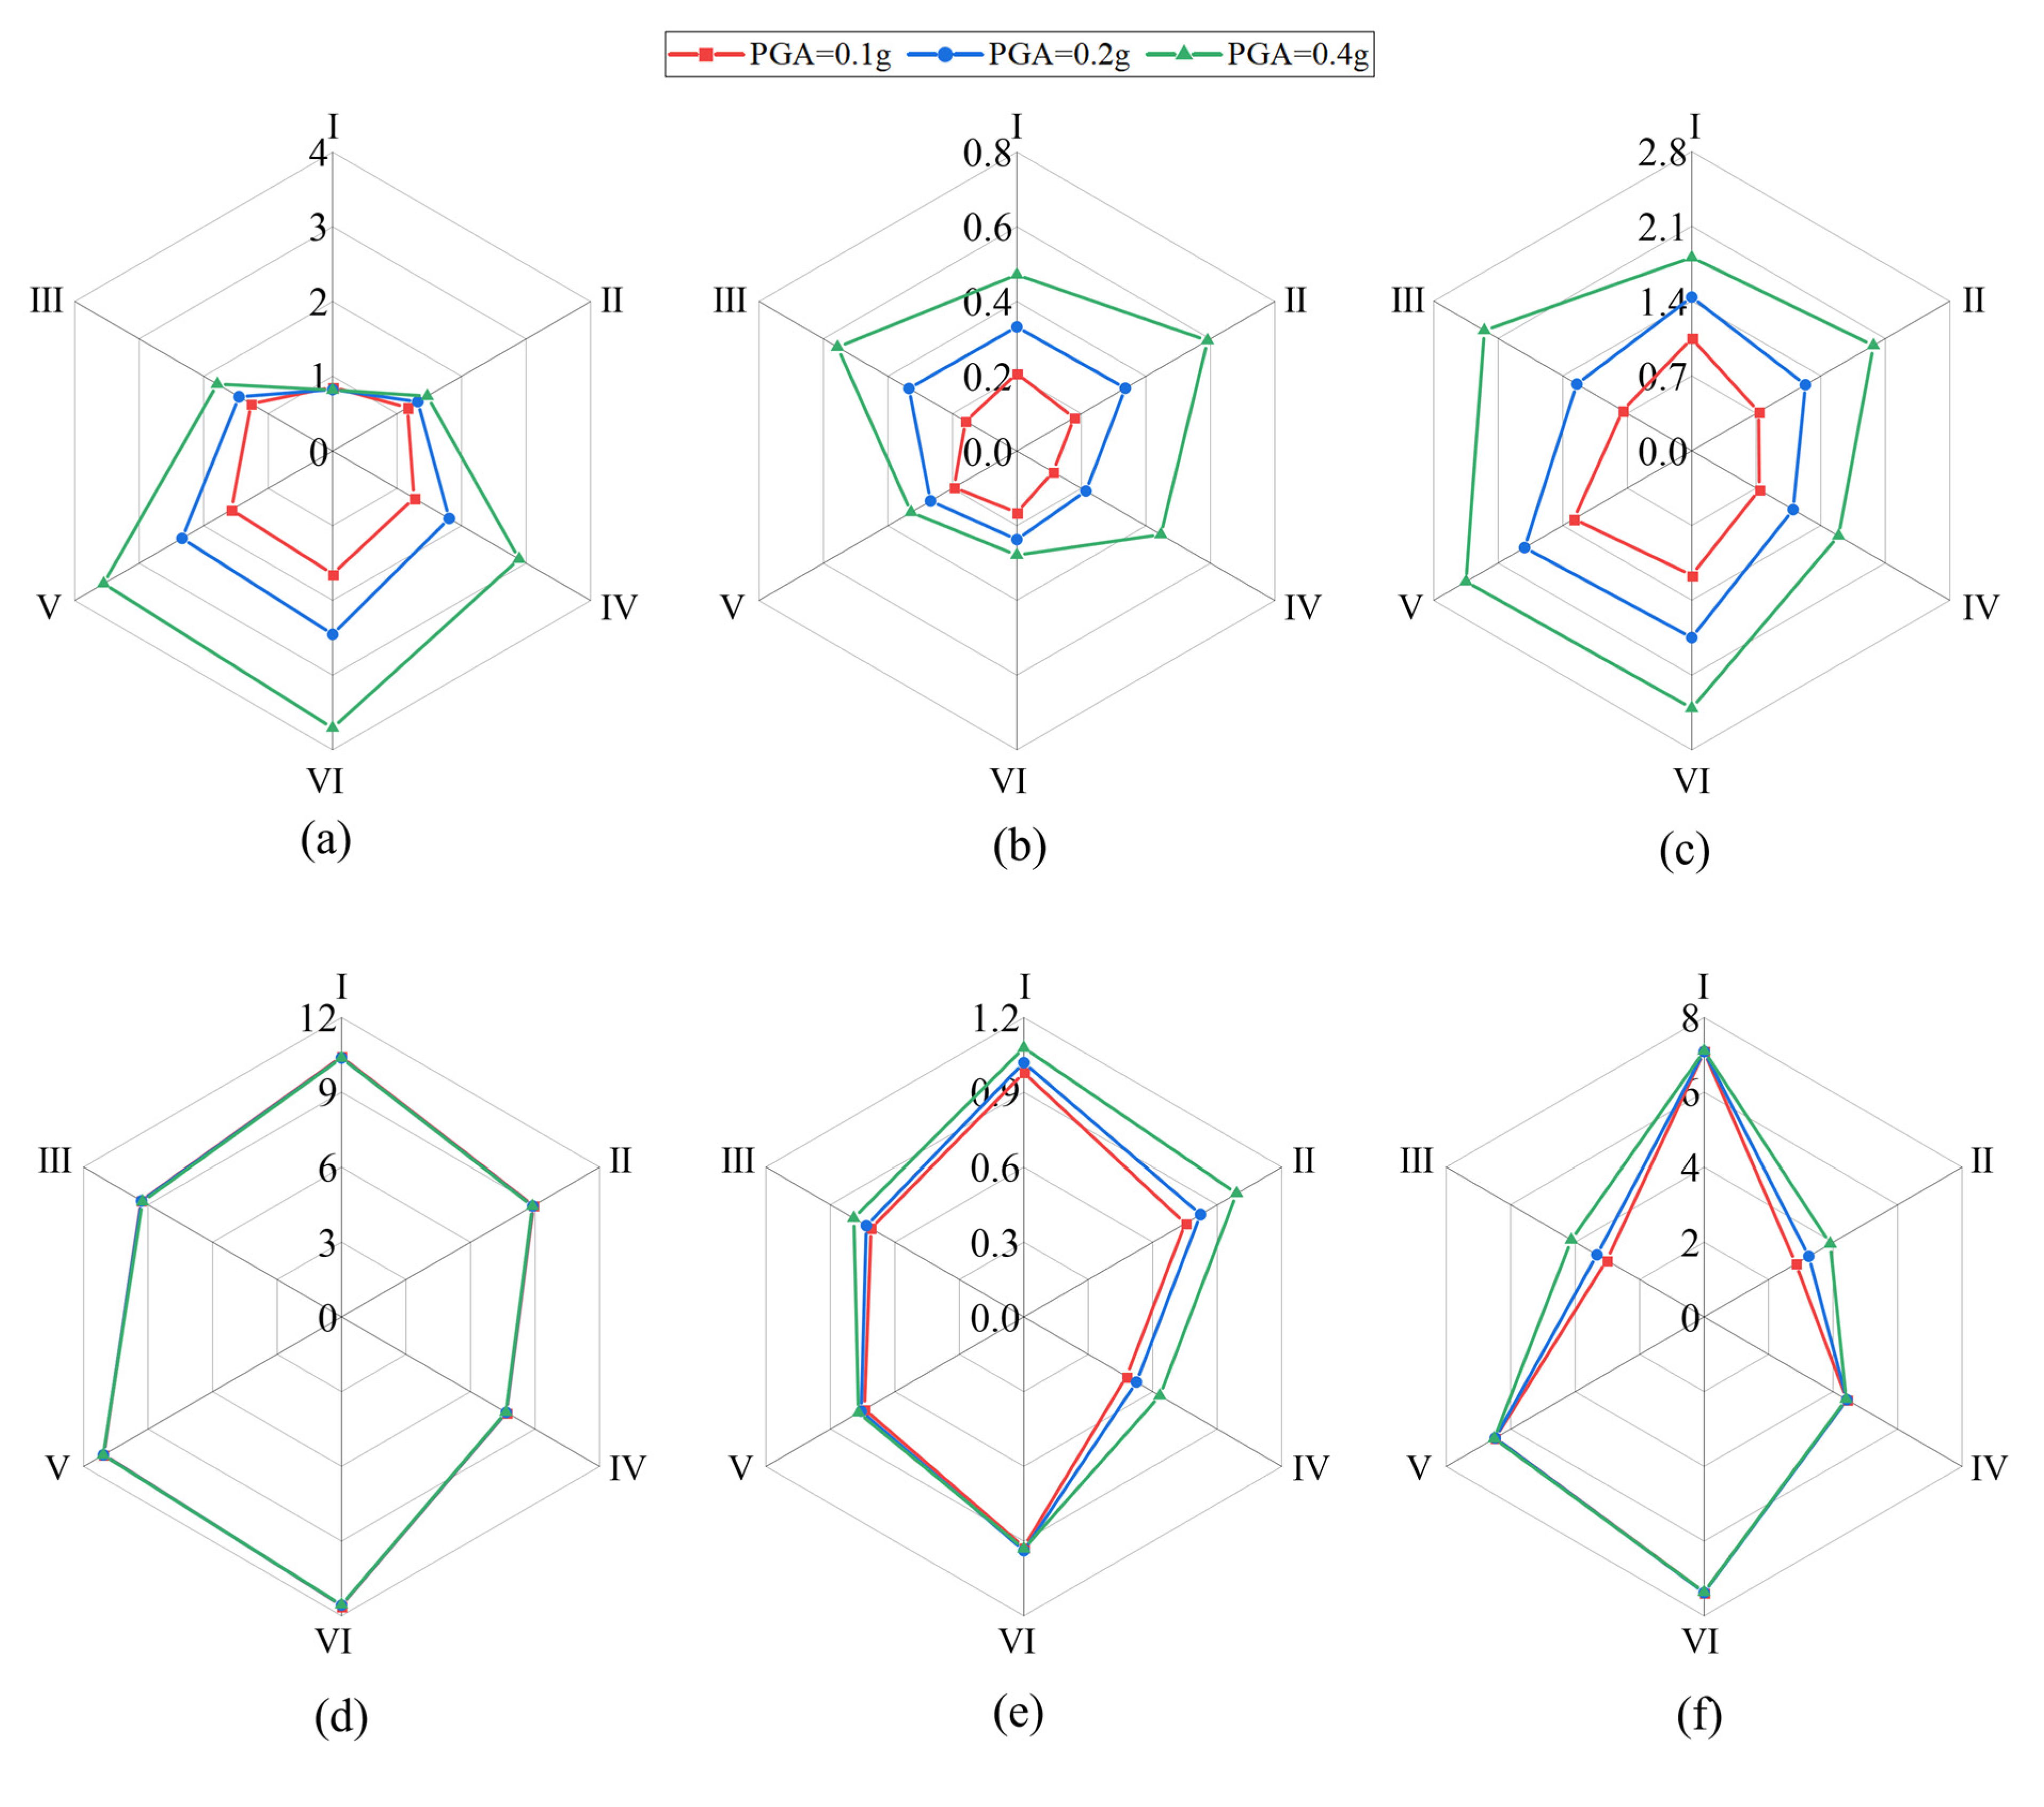
4.3.2. Effect of Earthquake Intensity

Figure 12 plots the effects of PGA on the relative peak stress responses at the fault section of the tunnel with a γ of −7 and η of −4 under 2.5 cm Δ and 15 cm Δ , respectively. Figure 12a–c shows that ω 1 at the invert, ω 2 at the left arch foot and ω 3 at the left arch foot are larger than those at other points under 2.5 cm Δ and subsequent earthquakes, respectively. They increase from 1.64 to 3.7, from 0.19 to 0.59 and from 1.26 to 2.45 with an increase in PGA from 0.1 g to 0.4 g, respectively. Figure 12a shows that the relative tensile stress at the vault remains constant, while the relative tensile stress at other positions increases with increasing PGA. However, when Δ equals 15 cm, the relative peak stress slightly varies with PGA from 0.1 g to 0.4 g, as shown in Figure 12d–f. In summary, these indicate that the relative peak stress is dominated by the fault dislocation under the 15 cm Δ and subsequent 0.1–0.4 g seismic shaking. In comparison, it is mainly determined by the seismic shaking when Δ equals 2.5 cm. It is noted that this result is applied to the peak stress response of the tunnel at the fault. The effect of fault dislocation on the tunnel is limited to the vicinity of the fault zone, and the peak stress response of the tunnel away from the fault rises as the PGA increases. Combined with the verification results in Section 3, it is clear that the seismic response of the tunnel at the fault is more intense with or without the initial dislocation.

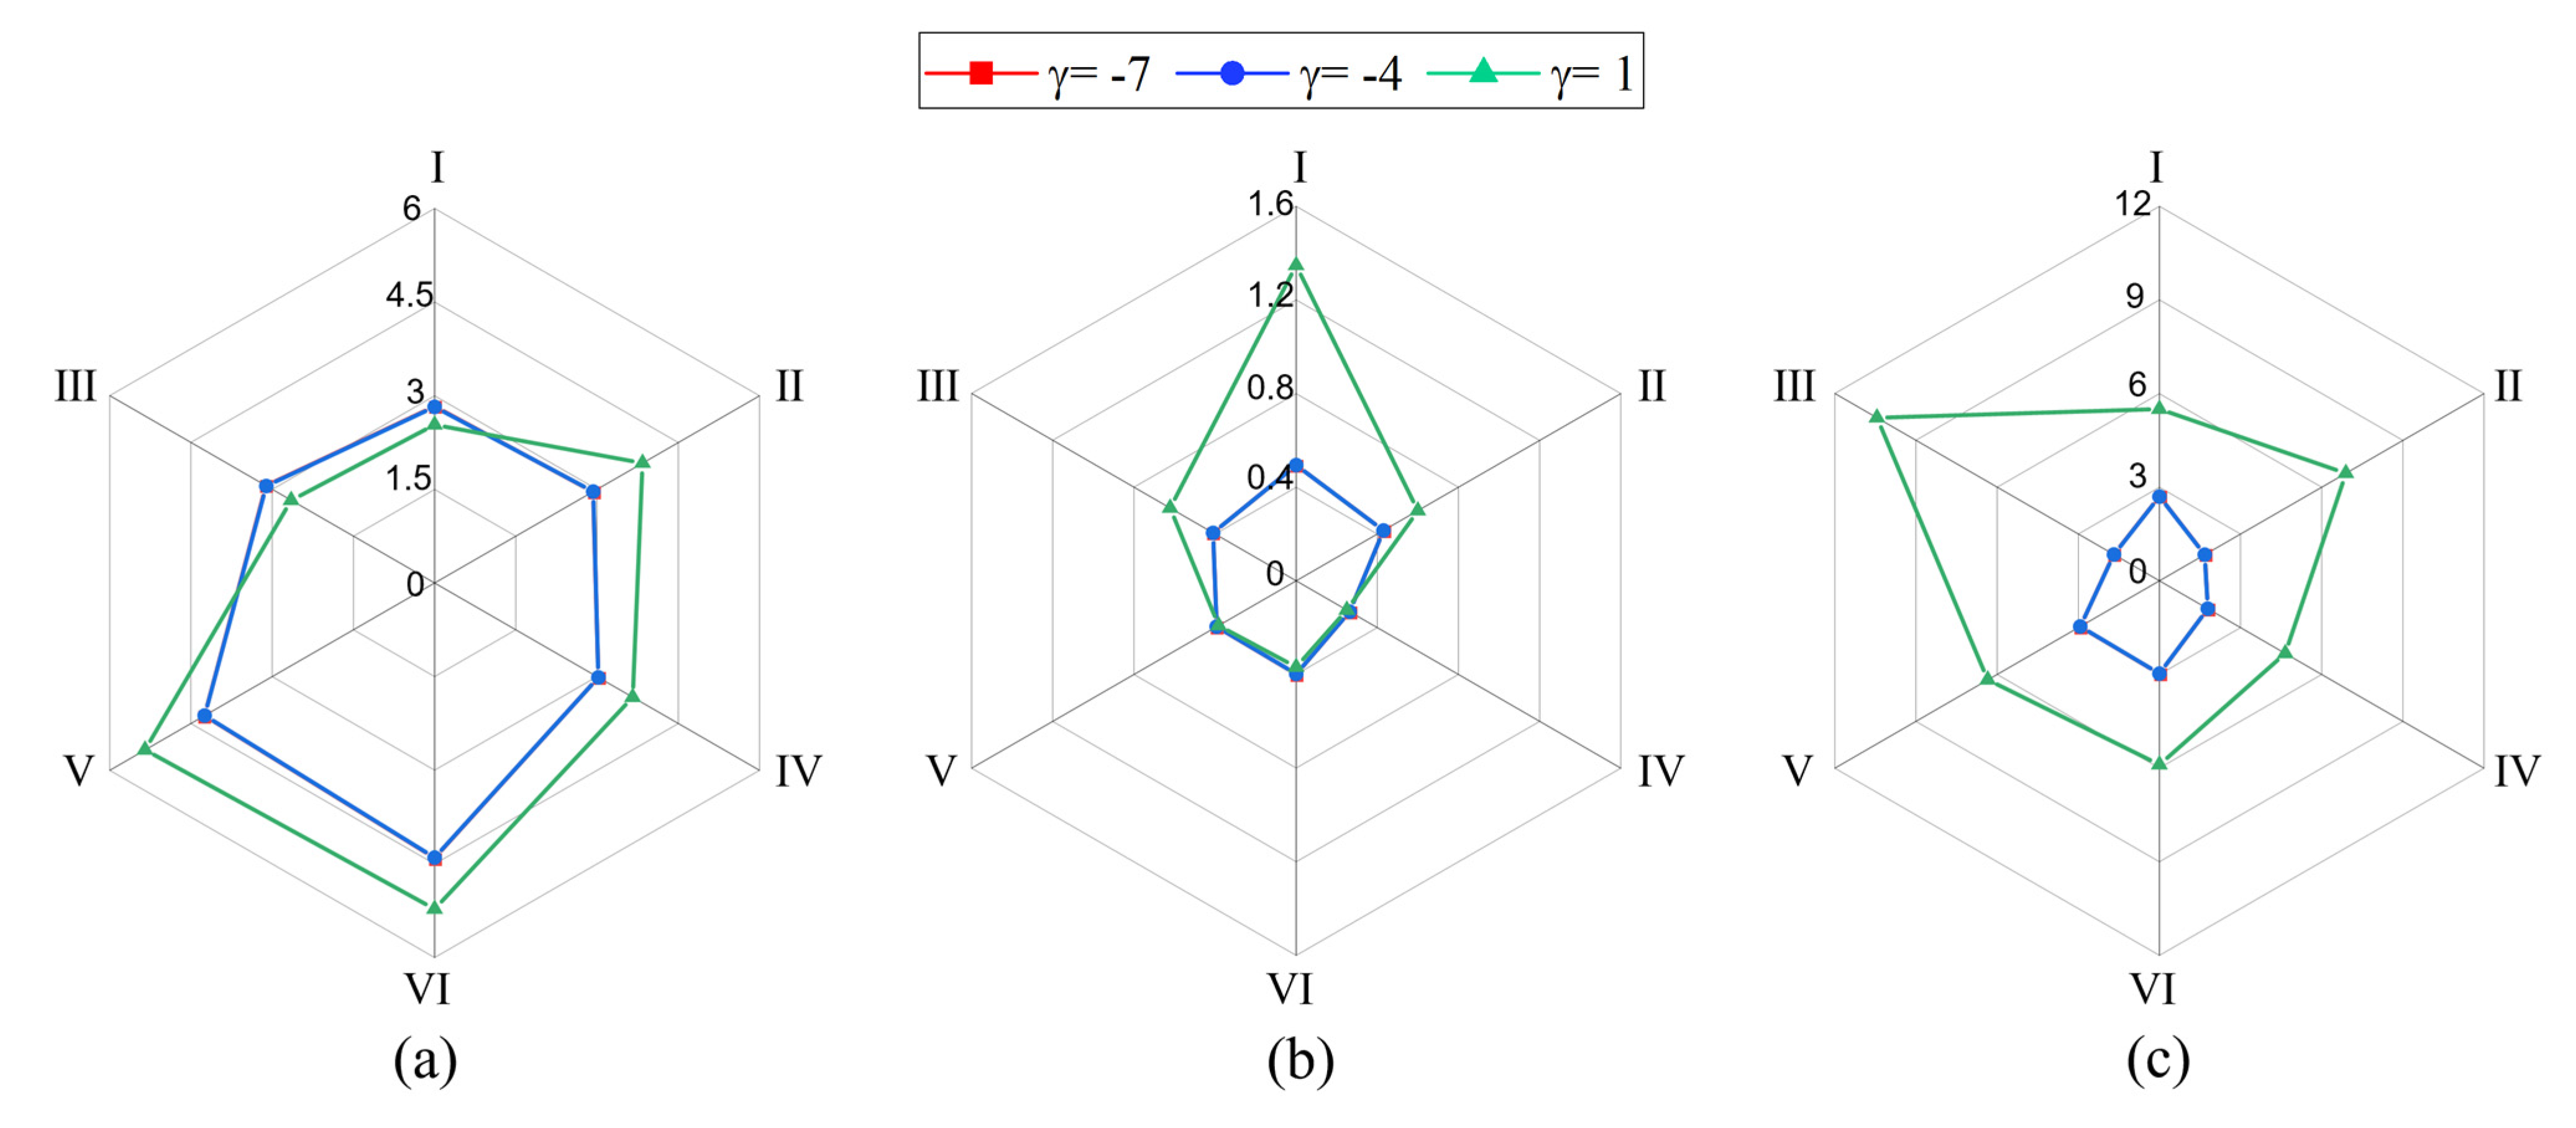
4.3.3. Effect of the Logarithmic Ratio of Tunnel Joint Stiffness

Figure 13 plots the relative peak stress responses of the tunnel at the fault section affected by the tunnel joint stiffness logarithmic ratio ( γ ) under 5 cm Δ and subsequent 0.2 g seismic shaking. Figure 13 shows that ω 2 decreases 0.71 times from 10.44 to 2.97 with decreasing γ from 1 to −4, while ω 3 and ω 1 decrease from 1.35 to 0.49 by 0.63 times and 5.34 to 4.39 by 0.18 times, respectively. However, the relative peak stress basically remains the same when γ changes from −4 to −7. This indicates that the lower joint stiffness does not reduce the peak stress response of the tunnel. The literature [35,36] showed that a flexible joint stiffness with a logarithmic ratio of −2 to −1 can effectively reduce the extent of tunnel damage under the combination of fault rupture and seismic excitation. Therefore, it can be deduced that an appropriate reduction in tunnel joint stiffness can effectively reduce the peak stress response of the tunnel. However, an indiscriminate decrease in joint stiffness cannot provide a more favorable mitigation condition.

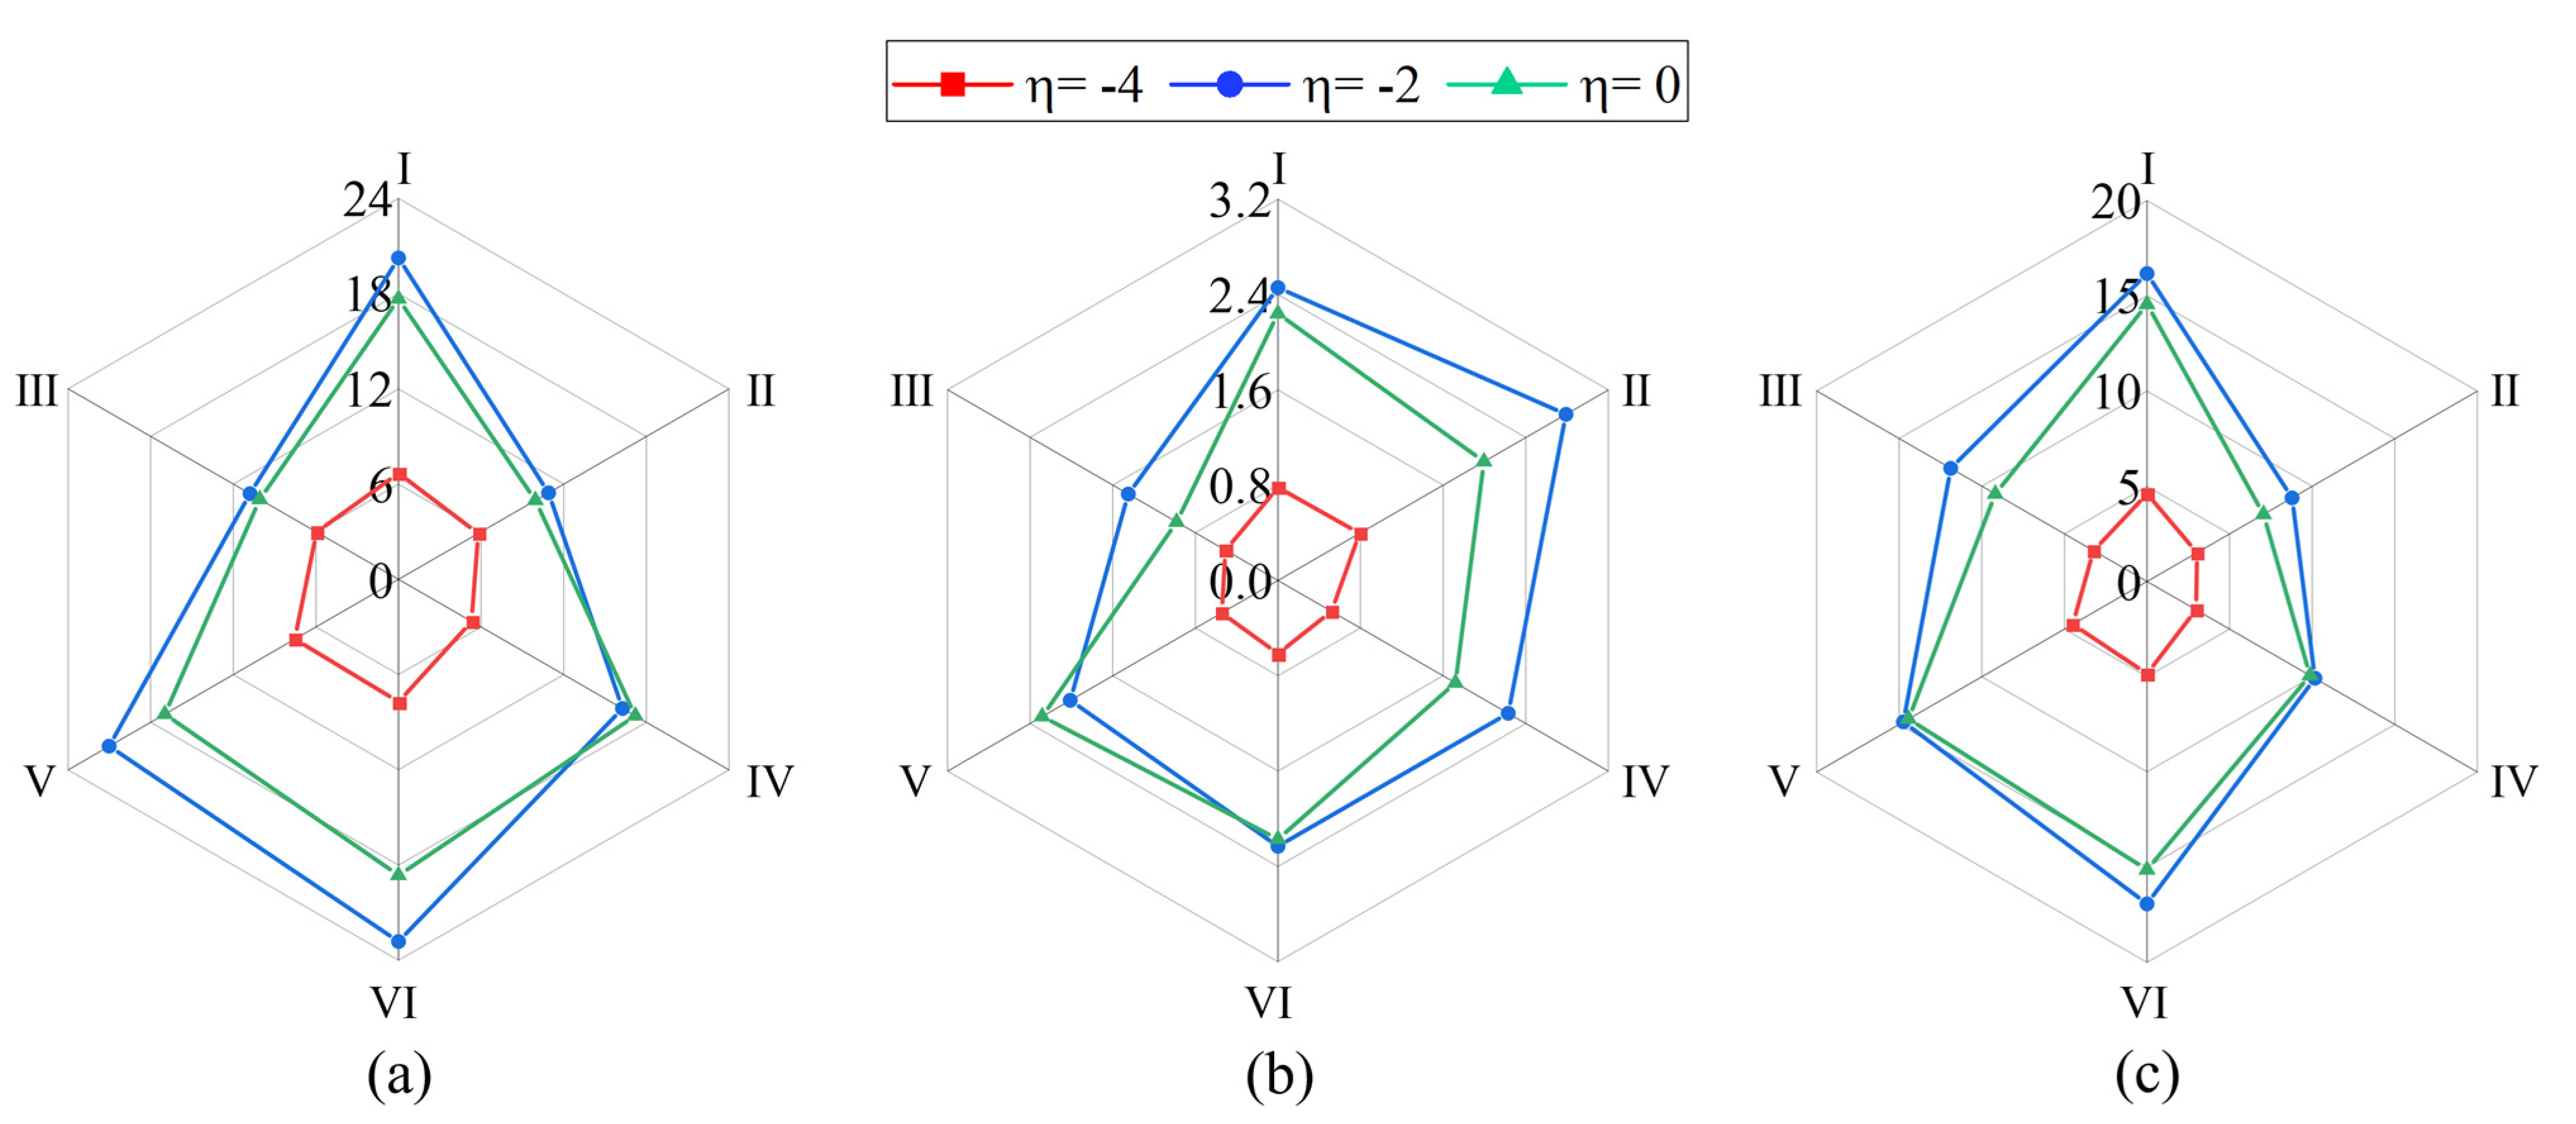
4.3.4. Effect of the Isolation Layer Elastic Modulus Logarithmic Ratio

Figure 14 depicts the effects of η on the relative peak stress responses of the tunnel with a γ of −7 under 10 cm Δ and a subsequent 0.4 g PGA seismic excitation. It can be seen in Figure 14 that ω 1 , ω 3 and ω 2 at the fault section are evenly distributed and reach the maximum at the invert (VI point), right arch springing (IV point) and the invert (VI point), respectively. When η is equal to −4, the values of ω 1 , ω 3 and ω 2 are the smallest (7.27, 0.79 and 4.85, respectively), while when η is equal to −2, values are the greatest (22.82, 2.79 and 16.93, respectively). In addition, η equals 0 represents an increase in the thickness of the lining, and the relative peak stress at this point is slightly less than the peak stress when η equals −2. It can be deduced that the isolation layer with an η of −4 can effectively reduce the stress response of the tunnel lining. Reference [39] also showed that the internal force of the tunnel lining significantly decreases when η is from −1 to −4. This means that the lower elastic modulus of the isolation layer can be used under combined strike-slip fault creep-slip and subsequent seismic shaking. Reference [46] pointed out that when η changes from 1 to −3, the peak seismic stress of the tunnel is significantly reduced, but the oval relative deformation of the tunnel cross-section is amplified. On the other hand, the isolation layer should be sufficiently rigid to withstand the static load caused by the release of in situ stress in the rock [38]. Therefore, a suitable reduction in the isolation layer’s elastic modulus can offer superior mitigation conditions while maintaining the ability to support loads.

5. Discussions

A total of 108 groups of results are used to establish relative peak stress functions, i.e., ω 1 , ω 2 at the invert and ω 3 at the vault, of α , α P G A , α γ and α η by the least squares method as
ω 1 = 21.08 α Δ + 2.63 α P G A 9.63 α Δ α P G A + 0.17 α r 20.22 α η 2 + 25.17 α η + 0.86 , α Δ < 0.49 13.53 α Δ + 0.27 α P G A 0.26 α Δ α P G A + 0.17 α r 43.32 α η 2 + 54.73 α η 1.17 , α Δ 0.49 ( R 2 = 0.99 )
ω 2 = 14.83 α Δ + 0.48 α P G A 1.28 α Δ α P G A + 0.01 α r 12.54 α η 2 + 16.50 α η + 0.78 , α Δ < 0.54 11.04 α Δ + 0.13 α P G A 0.12 α Δ α P G A + 0.02 α r 31.98 α η 2 + 43.34 α η 2.72 , α Δ 0.54 R 2 = 0.99
ω 3 = 2.09 α Δ + 0.32 α P G A 0.77 α Δ α P G A + 0.32 α r 2.23 α η 2 + 2.57 α η + 0.24 , α Δ < 0.47 1.39 α Δ + 0.07 α P G A + 0.08 α Δ α P G A + 0.30 α r 4.07 α η 2 + 5.43 α η 0.15 , α Δ 0.47 ( R 2 = 0.92 )
where α Δ with values of 0.49, 0.54 and 0.47 indicate 8.63, 9.25 and 8.38 cm Δ , respectively. It should be noted that this conclusion is obtained under the cases of this paper, and a general relationship of the critical α Δ with relative peak stress requires further studies.
The derivatives of ω 1 , ω 2 and ω 3 are tabulated in Table 3. The larger the results in Table 3 are, the more sensitive the factors are. In comparison with these derivatives of the factors in Table 3, it can be found that derivatives in ω 1 and ω 2 are larger than the same ones in ω 3 , except α γ . This further suggests that the tunnel is more susceptible to tensile and shear failure than compressive failure.
Table 3 shows that the derivatives for α Δ in ω 1 and ω 2 are greater than those for α P G A . Therefore, it is deduced that the peak tensile and shear stress responses of the invert in the fault zone are more sensitive to a fault creep-slip of less than 15 cm than to seismic shaking.
The derivatives for α η in ω 1 , ω 2 are greater than those for α γ . Thus, the peak tensile and shear stress responses of the invert in the fault zone are more sensitive to the isolation layer elastic modulus compared with the joint stiffness of the segmental tunnel with two segments. When the derivative of α η is greater than zero, the relative peak stress decreases with the decrease in the isolation layer elastic modulus. This is consistent with the opinion that a suitable decrease in the elastic modulus of the isolation layer can offer favorable mitigation conditions. Hence, it can be deduced that the isolation layer is more suitable to mitigate the potential failure under a small fault creep-slip and subsequent seismic shaking compared with segmental tunnels with two segments.
In Table 3, it is noted that the coupling effect of fault dislocation and earthquakes should be considered due to the larger derivatives of α Δ α P G A with values of −9.63 in ω 1 and −1.28 in ω 2 . The coupled effect may be the reason for the stress amplification of the tunnel lining at the fault under fault creep-slip dislocation and subsequent seismic shaking compared to fault dislocation or seismic motion. The coupled mechanism of fault dislocation and earthquakes requires more in-depth research. Low-frequency waves less than 20 Hz are responsible for tunnel earthquake damage [38] and contain the El-Centro wave selected in this paper. Therefore, the above analysis can provide a reference for the tunnel response under similar fault dislocations and subsequent seismic responses dominated by low-frequency components.

6. Conclusions

Using the Ngong railroad tunnel in the East African Rift Valley as an example, the dynamic responses and the peak stress sensitivities of fault-crossing tunnels with the tunnel joint and the isolation layer are numerically investigated under strike-slip fault creep-slip and subsequent seismic shaking. The main conclusions are drawn as follows:
(1) The valley-shaped propagation of peak displacement at the tunnel invert occurs in the longitudinal axis direction under an earthquake alone. Then, it transforms into an S-shaped under strike-slip fault creep-slip and subsequent seismic shaking.
(2) The tunnel invert in the fault zone is susceptible to tensile and shear failures under strike-slip fault creep-slip and subsequent seismic shaking.
(3) The peak tensile and shear stress responses of the tunnel invert in the fault zone are more sensitive to fault creep-slip than earthquakes. The peak tensile and shear stresses of the tunnel invert in the fault zone are more sensitive to the isolation layer elastic modulus than the joint stiffness of the segmental tunnel with two segments. They are effectively reduced when the isolation layer elastic modulus logarithmic ratio equals −4.
(4) Favorable mitigation conditions for the tunnel can be provided by a reasonable reduction in the isolation layer’s elastic modulus and a drop in the stiffness of the flexible joints. In addition, the isolation layer is better suited to mitigate the potential failure under small fault creep-slip and subsequent seismic shaking than segmental tunnels with two segments.
The works mentioned above are based on numerical and experimental approaches. However, the theoretical analysis of the combined effect needs more extensive research. The nonlinear longitudinal response of the tunnel under the interaction of fault dislocation and earthquakes will be analytically addressed further in the future.

Author Contributions

Conceptualization, S.P. and L.F.; methodology, S.P.; software, Y.Z.; validation, Y.Z., S.P. and Z.X.; formal analysis, Y.Z.; investigation, S.P.; resources, G.W. and G.C.; data curation, Y.Z.; writing—original draft preparation, Y.Z.; writing—review and editing, S.P.; visualization, Y.Z.; supervision, S.P.; project administration, S.P. and L.F.; funding acquisition, S.P. and L.F. All authors have read and agreed to the published version of the manuscript.

Funding

The research was funded by the National Natural Science Foundation of China (Grant No. 52174100 and No. 51674287), and the National Science Foundation of Hunan Province, China (Grant No. 2021JJ30834).

Institutional Review Board Statement

Not applicable.

Informed Consent Statement

Not applicable.

Data Availability Statement

The data that support the findings of this study are available upon request from the authors.

Conflicts of Interest

The authors declare no conflict of interest.

References

  1. Cui, P.; Ge, Y.; Li, S.; Li, Z.; Xu, X.; Zhou, G.G.; Chen, H.; Wang, H.; Lei, Y.; Zhou, L. Scientific challenges in disaster risk reduction for the Sichuan–Tibet Railway. Eng. Geol. 2022, 309, 106837. [Google Scholar] [CrossRef]
  2. Baker, B.H.; Wohlenberg, J. Structure and Evolution of the Kenya Rift Valley. Nature 1971, 229, 538–542. [Google Scholar] [CrossRef] [PubMed]
  3. Brace, W.F.; Byerlee, J.D. Stick-Slip as a Mechanism for Earthquakes. Science 1966, 153, 990–992. [Google Scholar] [CrossRef] [PubMed] [Green Version]
  4. Wang, T.-T.; Kwok, O.-L.A.; Jeng, F.-S. Seismic response of tunnels revealed in two decades following the 1999 Chi-Chi earthquake (Mw 7.6) in Taiwan: A review. Eng. Geol. 2021, 287, 106090. [Google Scholar] [CrossRef]
  5. Yan, G.; Shen, Y.; Gao, B. Experimental study of stick-slip fault crossing segmental tunnels with joints. Rock Soil Mech. 2019, 40, 4450–4458. (In Chinese) [Google Scholar]
  6. Liu, G.; Zhang, Y.; Ren, J.; Xiao, M. Seismic Response Analysis of Tunnel through Fault Considering Dynamic Interaction between Rock Mass and Fault. Energies 2021, 14, 6700. [Google Scholar] [CrossRef]
  7. Huang, J.; Chen, X.; Zhao, X.; Zhao, M. Nonlinear Response of Tunnels under Coseismic Displacement Induced by Strike-Slip Fault. Int. J. Géoméch. 2022, 22, 04022177. [Google Scholar] [CrossRef]
  8. Zhang, X.; Jiang, Y.; Sugimoto, S. Seismic damage assessment of mountain tunnel: A case study on the Tawarayama tunnel due to the 2016 Kumamoto Earthquake. Tunn. Undergr. Space Technol. 2018, 71, 138–148. [Google Scholar] [CrossRef] [Green Version]
  9. Chen, P.; Geng, P.; Chen, J.; Gu, W. The seismic damage mechanism of Daliang tunnel by fault dislocation during the 2022 Menyuan Ms6.9 earthquake based on unidirectional velocity pulse input. Eng. Fail. Anal. 2023, 145, 107047. [Google Scholar] [CrossRef]
  10. Liu, X.; Zhang, C.; Xiao, H.; Zhou, H.; Chi, F. Deformation and failure characteristics of a deeply buried tunnel subjected to creep slip fault movement: Based on the engineering conditions of Yunnan water intake project. Bull. Eng. Geol. Environ. 2022, 81, 322. [Google Scholar] [CrossRef]
  11. Zhang, C.-Q.; Liu, X.-Y.; Zhu, G.-J.; Zhou, H.; Zhu, Y.; Wang, C. Distribution patterns of rock mass displacement in deeply buried areas induced by active fault creep slip at engineering scale. J. Cent. South Univ. 2020, 27, 2849–2863. [Google Scholar] [CrossRef]
  12. Lin, D.; Yuan, R.; Shang, Y.; Bao, W.; Wang, K.; Zhang, Z.; Li, K.; He, W. Deformation and failure of a tunnel in the restraining bend of a strike–slip fault zone: An example from Hengshan Mountain, Shanxi Province, China. Bull. Eng. Geol. Environ. 2017, 76, 263–274. [Google Scholar] [CrossRef]
  13. Zaheri, M.; Ranjbarnia, M.; Dias, D.; Oreste, P. Performance of segmental and shotcrete linings in shallow tunnels crossing a transverse strike-slip faulting. Transp. Geotech. 2020, 23, 100333. [Google Scholar] [CrossRef]
  14. Zhong, Z.; Wang, Z.; Zhao, M.; Du, X. Structural damage assessment of mountain tunnels in fault fracture zone subjected to multiple strike-slip fault movement. Tunn. Undergr. Space Technol. 2020, 104, 103527. [Google Scholar] [CrossRef]
  15. Zhou, G.; Sheng, Q.; Cui, Z.; Wang, T.; Ma, Y. Investigating the Deformation and Failure Mechanism of a Submarine Tunnel with Flexible Joints Subjected to Strike-Slip Faults. J. Mar. Sci. Eng. 2021, 9, 1412. [Google Scholar] [CrossRef]
  16. Zaheri, M.; Ranjbarnia, M.; Dias, D. 3D numerical investigation of segmental tunnels performance crossing a dip-slip fault. Geomech. Eng. 2020, 23, 351–364. [Google Scholar]
  17. Wang, Z.; Zhao, M.; Huang, J.; Zhong, Z.; Du, X. Numerical Modeling of Reverse Fault Rupture and Its Impact on Mountain Tunnels. J. Earthq. Eng. 2022. [Google Scholar] [CrossRef]
  18. Yan, G.; Shen, Y.; Gao, B.; Zheng, Q.; Fan, K.; Huang, H. Damage evolution of tunnel lining with steel reinforced rubber joints under normal faulting: An experimental and numerical investigation. Tunn. Undergr. Space Technol. 2020, 97, 103223. [Google Scholar] [CrossRef]
  19. Zhen, C.; Li, J.H.; Fu, X.W.; Sheng, Q.; Zhou, G.X.; Ma, Y.L.N.; Wang, T.Q. Evaluating the response of a tunnel subjected to strike-slip fault rupture in conjunction with model test and hybrid discrete-continuous numerical modeling. Rock Mech. Rock Eng. 2022, 55, 4743–4764. [Google Scholar] [CrossRef]
  20. Yan, G.; Zhao, B.; Wang, Z.; Gao, B. Simplified analytical solution for responses of fault-crossing tunnels with flexible joints under fault movement. Structures 2022, 45, 984–998. [Google Scholar] [CrossRef]
  21. Tsinidis, G.; de Silva, F.; Anastasopoulos, I.; Bilotta, E.; Bobet, A.; Hashash, Y.M.; He, C.; Kampas, K.; Knappett, J.; Madabhushi, G.; et al. Seismic behaviour of tunnels: From experiments to analysis. Tunn. Undergr. Space Technol. 2020, 99, 103334. [Google Scholar] [CrossRef]
  22. Jiao, H.; Du, X.; Zhao, M.; Huang, J.; Zhao, X.; Ouyang, W. Nonlinear Seismic Response of Rock Tunnels Crossing Inactive Fault under Obliquely Incident Seismic P Waves. J. Earth Sci. 2021, 32, 1174–1189. [Google Scholar] [CrossRef]
  23. Liu, Z.; Liu, J.; Pei, Q.; Yu, H.; Li, C.; Wu, C. Seismic response of tunnel near fault fracture zone under incident SV waves. Undergr. Space 2021, 6, 695–708. [Google Scholar] [CrossRef]
  24. Wen, Y.; Xin, C.; Shen, Y.; Huang, Z.; Gao, B. The seismic response mechanisms of segmental lining structures applied in fault-crossing mountain tunnel: The numerical investigation and experimental validation. Soil Dyn. Earthq. Eng. 2021, 151, 107001. [Google Scholar] [CrossRef]
  25. Huang, J.; Zhao, M.; Du, X. Non-linear seismic responses of tunnels within normal fault ground under obliquely incident P waves. Tunn. Undergr. Space Technol. 2017, 61, 26–39. [Google Scholar] [CrossRef]
  26. Mei, X.; Sheng, Q.; Cui, Z. Effect of Near-Fault Pulsed Ground Motions on Seismic Response and Seismic Performance to Tunnel Structures. Shock Vib. 2021, 2021, 9999007. [Google Scholar] [CrossRef]
  27. Xin, C.; Wang, Z.; Yu, J. The evaluation on shock absorption performance of buffer layer around the cross section of tunnel lining. Soil Dyn. Earthq. Eng. 2020, 131, 106032. [Google Scholar] [CrossRef]
  28. Anastasopoulos, I.; Gerolymos, N.; Drosos, V.; Georgarakos, T.; Kourkoulis, R.; Gazetas, G. Behaviour of deep immersed tunnel under combined normal fault rupture deformation and subsequent seismic shaking. Bull. Earthq. Eng. 2008, 6, 213–239. [Google Scholar] [CrossRef]
  29. Varnusfaderani, M.G.; Golshani, A.; Majidian, S. Analysis of cylindrical tunnels under combined primary near fault seismic excitations and subsequent reverse fault rupture. Acta Geodyn. Geomater. 2017, 14, 5–26. [Google Scholar] [CrossRef] [Green Version]
  30. Cui, Z.; Sheng, Q.; Li, J.H.; Fu, X.W. Deformation and failure of a tunnel subjected to the coupling effect of a quasi-static faulting and seismic impact. Rock Soil Mech. 2022, 43, 1364–1373. (In Chinese) [Google Scholar]
  31. Yang, Z.; Lan, H.; Zhang, Y.; Gao, X.; Li, L. Nonlinear dynamic failure process of tunnel-fault system in response to strong seismic event. J. Asian Earth Sci. 2013, 64, 125–135. [Google Scholar] [CrossRef]
  32. Chen, Z.Y.; Guo, Y.P. Analysis of cross fault tunnel damage under combined action of fault dislocation and ground motion. J. Disast. Prev. Mitig. Eng. 2023, 43, 132–137. (In Chinese) [Google Scholar]
  33. Fan, L.; Chen, J.-L.; Peng, S.-Q.; Qi, B.-X.; Zhou, Q.-W.; Wang, F. Seismic response of tunnel under normal fault slips by shaking table test technique. J. Cent. South Univ. 2020, 27, 1306–1319. [Google Scholar] [CrossRef]
  34. Yan, G.; Gao, B.; Shen, Y.; Zheng, Q.; Fan, K.; Huang, H. Shaking table test on seismic performances of newly designed joints for mountain tunnels crossing faults. Adv. Struct. Eng. 2020, 23, 248–262. [Google Scholar] [CrossRef]
  35. Cui, Z.; Sheng, Q.; Zhang, G.M.; Zhang, M.C.; Mei, X.C. Response and mechanism of a tunnel subjected to combined fault rupture deformation and subsequent seismic excitation. Transp. Geotech. 2022, 34, 100749. [Google Scholar]
  36. Shen, Y.; Wang, Z.; Yu, J.; Zhang, X.; Gao, B. Shaking table test on flexible joints of mountain tunnels passing through normal fault. Tunn. Undergr. Space Technol. 2020, 98, 103299. [Google Scholar] [CrossRef]
  37. Zhao, X.; Cheng, D.J.; Dai, Z.J.; Li, R.H.; Wang, Z. Influence of fault dislocation on water conveyance tunnel. J. Chang’an Univ. 2021, 41, 96–106. (In Chinese) [Google Scholar]
  38. Zhao, W.; Chen, W.; Yang, D. Interaction between strengthening and isolation layers for tunnels in rock subjected to SH waves. Tunn. Undergr. Space Technol. 2018, 79, 121–133. [Google Scholar] [CrossRef]
  39. Zhao, W.; Chen, W.; Yang, D.; Gao, H.; Xie, P. Analytical solution for seismic response of tunnels with composite linings in elastic ground subjected to Rayleigh waves. Soil Dyn. Earthq. Eng. 2022, 153, 107113. [Google Scholar] [CrossRef]
  40. Li, Z.-X.; Wen, D.; Shi, Y.; Wei, X.; Liu, B. A frequency-dependent variable damping control method for base-isolated structures under ground motions with different frequency characteristics. Soil Dyn. Earthq. Eng. 2023, 165, 107717. [Google Scholar] [CrossRef]
  41. Zhou, H.; He, C.; Wang, X.; Chen, Y.; Li, J. Assessment of the Seismic Response of Shallow Buried Elliptical Tunnels. J. Earthq. Eng. 2023, 27, 465–487. [Google Scholar] [CrossRef]
  42. Malhotra, P.K. Response of buildings to near-field pulse-like ground motions. Earthq. Eng. Struct. D 1999, 28, 1309–1326. [Google Scholar] [CrossRef]
  43. Ministry of Housing and Urban-Rural Development of the People′s Republic of China. Code for Design of Concrete Structures: GB50010-2010; China Architecture and Building Press: Beijing, China, 2015; pp. 209–215.
  44. Shi, S. Shear strength, modulus of rigidity and young’s modulus of concrete. China Civ. Eng. J. 1999, 32, 47–52. (In Chinese) [Google Scholar]
  45. Liu, X.; Zeng, Y.; Fan, L.; Peng, S.; Liu, Q. Investigation on Rupture Initiation and Propagation of Traffic Tunnel under Seismic Excitation Based on Acoustic Emission Technology. Sensors 2022, 22, 4553. [Google Scholar] [CrossRef]
  46. Yu, H.; Wang, Q. Analytical solution for deep circular tunnels covered by an isolation coating layer subjected to far-field shear stresses. Tunn. Undergr. Space Technol. 2021, 115, 104026. [Google Scholar] [CrossRef]
Figure 1. Sketch of the longitudinal section of the Ngong tunnel and the surrounding rock (unit: m).
Buildings 13 01163 g001
Figure 2. Typical cross section of the Ngong tunnel.
Buildings 13 01163 g002
Figure 3. 3D numerical model of the tunnel under strike-slip fault creep-slip and subsequent seismic shaking.
Buildings 13 01163 g003
Figure 4. Input El-Centro wave with filtering and baseline correction.
Buildings 13 01163 g004
Figure 5. Experimental model. (a) Outer profile of the model; (b) Inside of the model.
Buildings 13 01163 g005
Figure 6. A qualitative comparison of the shaking table test and numerical simulation: (a) 0.2 g seismic excitation; (b) 0.4 g seismic excitation.
Buildings 13 01163 g006
Figure 7. A comparison of the shaking table test and numerical simulation: (a) 2 cm creep-slip and subsequent 0.2 g seismic excitation; (b) 4 cm creep-slip and subsequent 0.2 g seismic excitation.
Buildings 13 01163 g007
Figure 8. Peak displacement responses at the lining invert of the tunnel with γ of −7 and η of −4. (a) Peak displacement; (b) Peak displacement gradient.
Buildings 13 01163 g008
Figure 9. Stress contours of the lining under Δ and subsequent 0.4 g PGA earthquake at 7.5 s. (a) σ 1 (tensile stress), (b) σ 3 (compressive stress) and (c) τ (shear stress).
Buildings 13 01163 g009
Figure 10. Peak stress responses under Δ and subsequent 0.4 g PGA earthquake. (a) σ 1 (2.5 cm Δ ), (b) σ 1 (10 cm Δ ), (c) σ 3 (2.5 cm Δ ), (d) σ 3 (10 cm Δ ), (e) τ (2.5 cm Δ ) and (f) τ (10 cm Δ ).
Buildings 13 01163 g010
Figure 11. Relative peak stresses at the fault section under Δ and subsequent 0.1 g PGA earthquake. (a) Relative peak tensile stress ( ω 1 ), (b) relative peak compressive stress ( ω 3 ) and (c) relative peak shear stress ( ω 2 ).
Buildings 13 01163 g011
Figure 12. Relative peak stress at the fault section under strike-slip fault creep-slip and subsequent seismic shaking. (a) ω 1 (2.5 cm Δ ), (b) ω 3 (2.5 cm Δ ), (c) ω 2 (2.5 cm Δ ), (d) ω 1 (15 cm Δ ), (e) ω 3 (15 cm Δ ) and (f) ω 2 (15 cm Δ ).
Buildings 13 01163 g012
Figure 13. Relative peak stress at the fault section affected by γ under 5.0 cm and subsequent 0.2 g seismic shaking. (a) Relative peak tensile stress ( ω 1 ), (b) relative peak compressive stress ( ω 3 ) and (c) relative peak shear stress ( ω 2 ).
Buildings 13 01163 g013
Figure 14. Relative peak stress at the fault section affected by η under 10 cm Δ and subsequent 0.4 g seismic shaking. (a) Relative peak tensile stress ( ω 1 ), (b) relative peak compressive stress ( ω 3 ) and (c) relative peak shear stress ( ω 2 ).
Buildings 13 01163 g014
Table 1. Properties of materials used in the 3D numerical model.
ComponentDensity
/ k g · m 3
Elastic Modulus
/GPa
Poisson’s RatioInternal
Frication
Angle/°
Cohesion
/MPa
Strongly weathered trachyte24006.50.32300.5
Weakly weathered trachyte24006.50.28451
Fault22002.00.3240.4
Lining2500350.2--
Table 2. Parameters used in the analysis.
Level Δ /cm PGA/g γ η K s 1 (GPa/m) K n 1 (GPa/m) E 0 (GPa)
12.5 ( Δ m i n )0.1 ( P G A m i n )−7 ( γ m i n )−4 ( η m i n )4.6 × 10−64.6 × 10−63.5 × 10⁻³
250.2−4−24.6 × 10−34.6 × 10−30.35
3100.4 ( P G A m a x )1 ( γ m a x )0 ( η m a x )46046035
415 ( Δ m a x )------
Table 3. Derivatives of ω 1 , ω 2 and ω 3 .
ω i α Δ α P G A α Δ α P G A α r α η Notes
ω 1 21.082.63−9.630.17−40.44 α η + 25.17 α Δ < 0.49
13.530.27−0.260.17−86.32 α η + 54.73 α Δ 0.49
ω 2 14.830.48−1.280.01−25.08 α η + 16.50 α Δ < 0.54
11.040.13−0.120.02−63.96 α η + 43.34 α Δ 0.54
ω 3 2.090.32−0.770.32−4.46 α η + 2.57 α Δ < 0.47
1.390.070.080.30−8.14 α η + 5.43 α Δ 0.47
Disclaimer/Publisher’s Note: The statements, opinions and data contained in all publications are solely those of the individual author(s) and contributor(s) and not of MDPI and/or the editor(s). MDPI and/or the editor(s) disclaim responsibility for any injury to people or property resulting from any ideas, methods, instructions or products referred to in the content.

