1. Introduction
Existing earthquake damage shows that the damage to underground structures during earthquakes is mainly imposed on the underground structures by the surrounding soil layers [
1]. As a result, the characteristics of the surrounding soil layer have a decisive influence on the seismic response of underground structures, and this influence is mainly reflected by the soil structure stiffness ratio [
2].
The shaking table model test is a powerful method to study the dynamic interaction between soil and underground structures. To make the model test reflect the seismic response law of underground structures reasonably, the selection of model soil in the model test is of utmost significance. In the model test of underground structures, structures are generally made of particulate concrete [
3], plexiglass [
4], aluminum alloy [
5], and gypsum [
6]. Compared with the original concrete material, the elastic modulus of these materials and the stiffness of the structure are much weaker than the original structure. Therefore, the soil structure stiffness ratio of the model soil to the model structure is quite different from that of the original soil to the prototype structure if the prototype soil is still used in the model test. This will lead to the distortion of the soil-structure stiffness ratio similarity ratio, by which the response of the structural model cannot truly reflect the response of the prototype structure. To reduce the distortion of the stiffness ratio, the model soil needs to be reconfigured, instead of using the original soil. On the other hand, the load capacity of the early constructed shaking table is limited [
3,
6], and the sum of the weights of the model box and model soil will exceed its load capacity easily. Sawdust soil, sawdust sand, rubber granule soil, and other remolded soil can be employed as model soil to overcome the above two problems. First, the density of the model soil can be reduced to meet the bearing capacity requirements of the shaking table. In addition, the model soil with different shear modulus can be obtained by adjusting the content of sawdust, which can effectively reduce the distortion of the soil structure stiffness ratio.
Because of the above advantages, many scholars have conducted research on model soil. Kitada [
7] performed a shaking table test in which silicone rubber was used to study the dynamic interaction between buildings during an earthquake. Turan [
8] mixed bentonite, glycerol, and water to make model soil for the shaking table test to check the effectiveness of a laminar soil container. The model soil was prepared by mixing kaolin, bentonite, F-grade fly ash, lime, and water. The shear wave velocity of the model soil under different curing periods was tested by the bending element test. The undrained shear strength of the model soil was measured by the dynamic triaxial test, and model soil satisfying the test requirements was obtained [
9,
10,
11]. Pistolas [
12] studied the effects of rubber content and rubber particle size on the dynamic properties of rubber granular soil. El-Sherbiny [
13] studied the dynamic characteristics of a mixture of sand and EPS at small stress and small strain. Yan [
14] mixed sawdust and sand in a certain proportion to prepare sawdust for the shaking table test based on a similar theory.
Based on the above literature review, it can be seen that there is much work on model soil composed of silicone rubber and kaolin, but sawdust soil has been seldom studied. Before preparing the shaking table model test of the underground structure-soil-surface structure complex interaction system [
15], we compared and selected the model soil. Considering the applicability and convenience of model soils, five kinds of model soils—sawdust soil, sawdust sand, rubber granular soil, rubber powder soil, and sawdust kaolin—were selected as the research objects, and a laboratory soil dynamic test was carried out. The dynamic characteristics of the test data were analyzed, and a reasonable model soil was selected.
2. Preparation of Model Soil
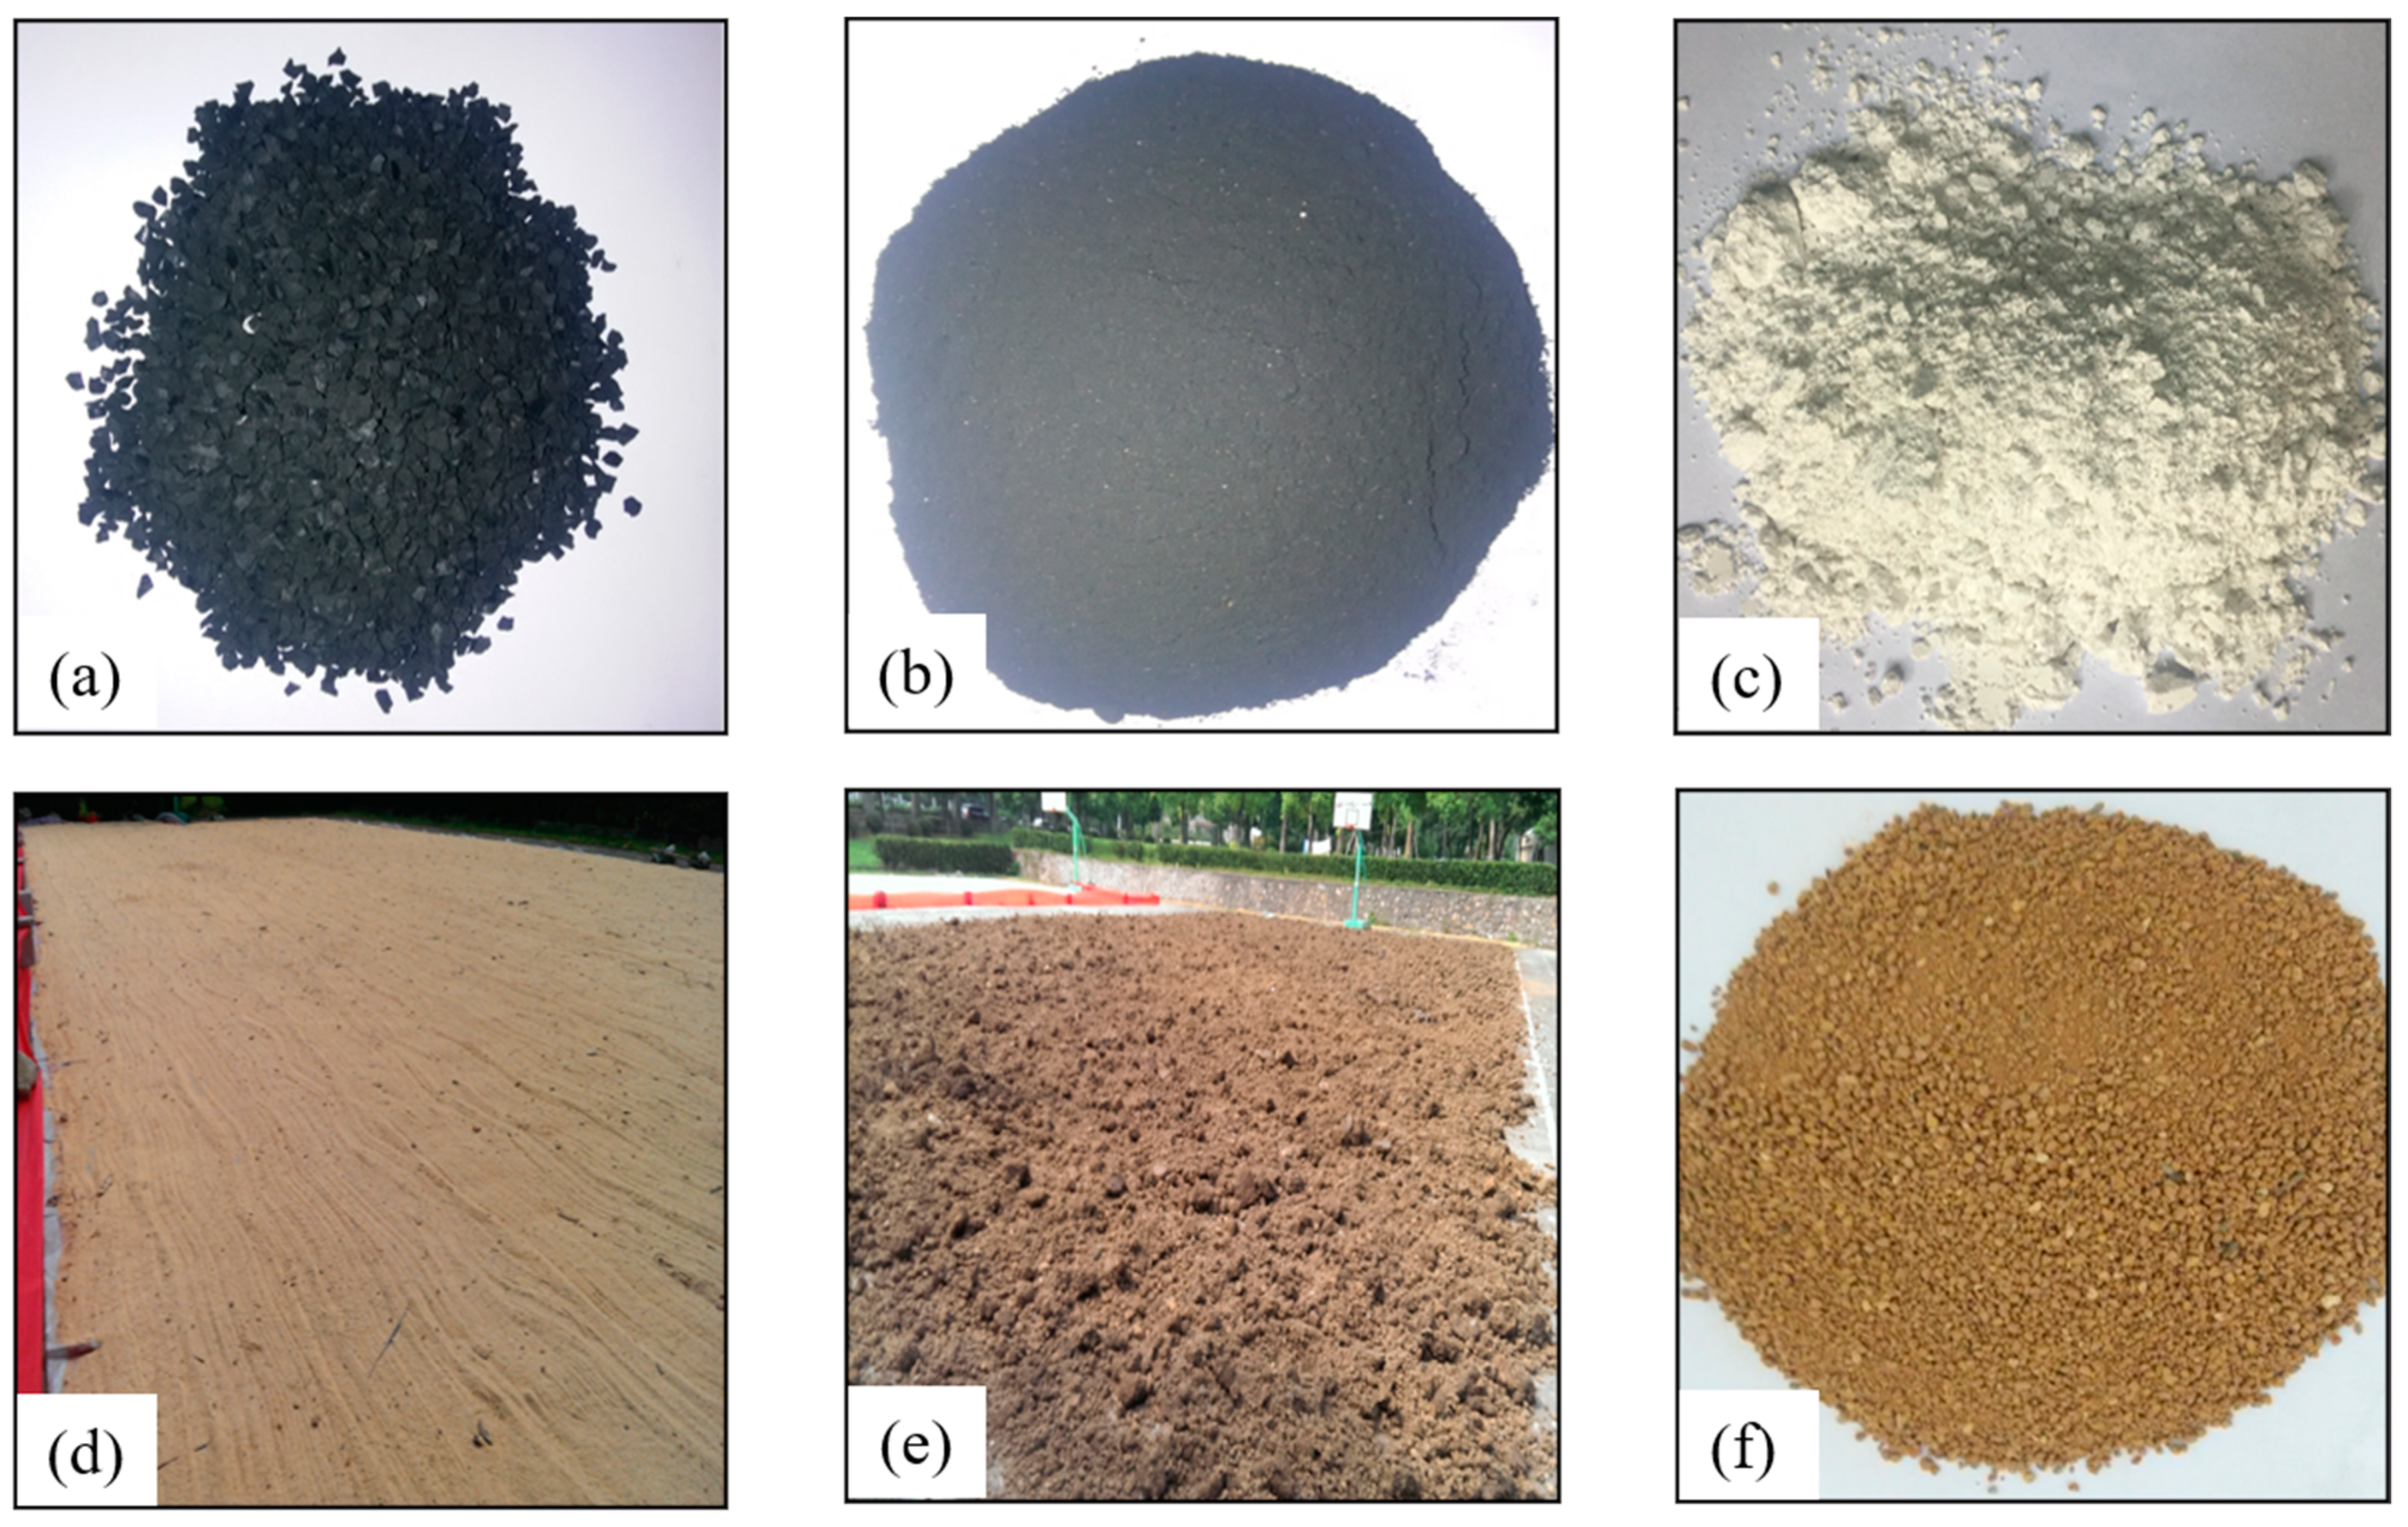
The main materials selected in this experiment were rubber particles, rubber powder, sawdust, kaolin, 0.2–0.8 mm quartz sand, and undisturbed silty clay. The materials are shown in
Figure 1. The undisturbed silty clay was taken from a subway station site. Its moisture content was 20.4% and its density was 1.94 g/cm
3. The sawdust was taken from a wood processing plant, and the rubber particle size was 2–4 mm. The rubber powder (40–60 mesh), quartz sand (0.2–0.8 mm), and kaolin (800 mesh) were purchased from the relevant factories. First, the silty clay was dried, rolled, and screened for particle sizes less than 3 mm. Similarly, sawdust was dried first and screened for impurities. In addition, the silty clay was mixed with sawdust, rubber particles, or rubber powder in a certain proportion, and the sawdust and kaolin were mixed to prepare the model soil.
Based on the existing literature [
14] and preliminary tests, three different ratios were selected for each of the five model soils. For each model soil of the matching ratio, the density of the model soil was measured by the cutting ring method, and the water content of the model soil was measured. The contents of the obtained model soil are listed in
Table 1,
Table 2,
Table 3,
Table 4 and
Table 5.
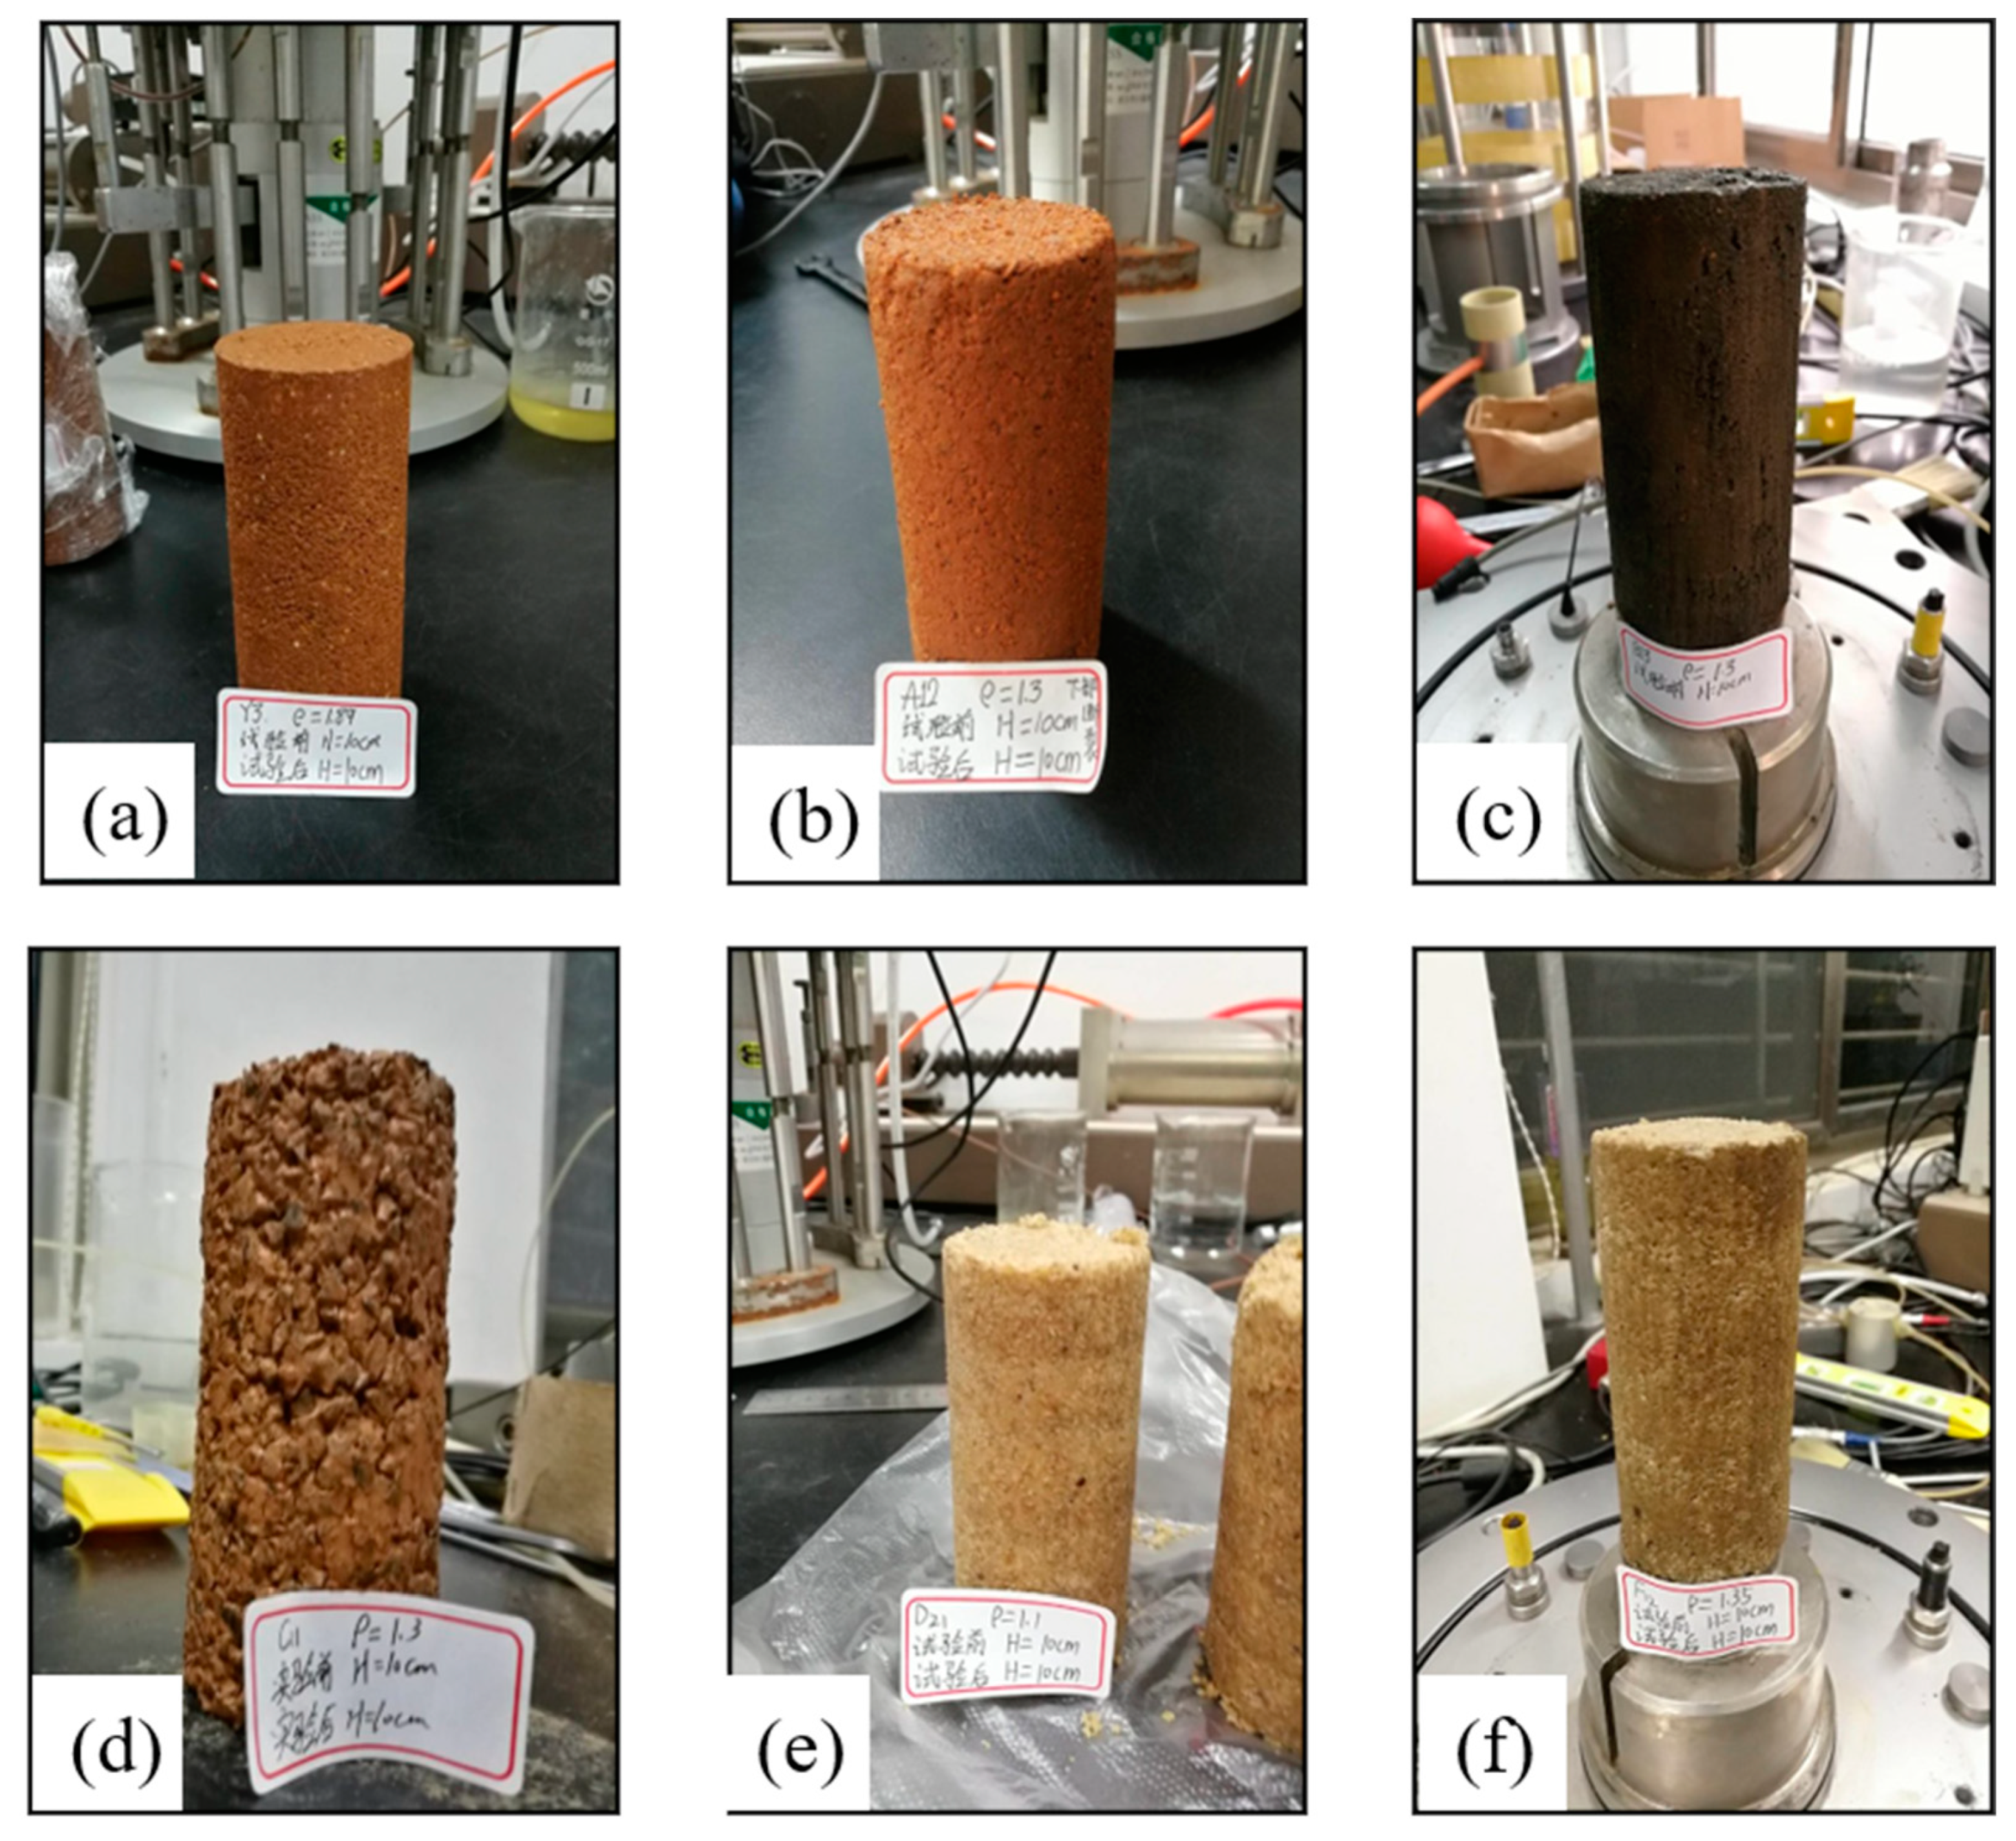
Regarding the above-mentioned matching ratio, the clay and the selected material were poured into a basin to be uniformly stirred. Then, water was poured in three times, and the mixture was uniformly stirred. Next, the mixture was layered into a split mould [
16] and compacted in layers. The prepared test sample is shown in
Figure 2.
3. Test Instrument and Principle
Both dynamic triaxial and resonance column tests were carried out to determine the dynamic characteristics of the model soils. The main technical indicators for the dynamic triaxial test were as follows: geometric dimensions of the sample: 39.1 × 100 mm (diameter × height); vertical excitation frequency: 0.01–5 Hz; axial static/dynamic load: 0–40 kN; confining pressure: 0–1700 kPa; maximum volume change: 200 mL; resolution: 0.04 mL. With the vertical displacement sensor, the range was more than 50 mm, the accuracy was 0.07%, and the resolution was 0.208 m.
During the resonance column test, the lower end of the sample was fixed, and torque was generated by a driving system at the upper end of the sample. The response of the sample after excitation was measured by the acceleration sensor located on the top disk of the free end of the sample. In the process of resonance, the resonance frequency of the sample was measured by changing the frequency of the applied excitation. By the measured resonance frequency and the density and size of the specimen, the dynamic shear modulus was calculated. The damping ratio of the specimen under this shear strain was measured by free vibration.
For the resonance column test, the variation curves of dynamic shear strain and dynamic shear modulus of the soil samples can be obtained directly in a small strain range. However, the relationship between the axial force and axial strain of soil samples can be obtained in a large strain range by the dynamic triaxial test. We obtained the relationship between the dynamic shear strain and dynamic shear modulus of soil samples using a previously described treatment method [
16]. To correlate the results of the dynamic triaxial test and the resonance column test, the dynamic elastic modulus
Ed and the dynamic axial strain
εd were converted into the dynamic shear modulus
Gd and the dynamic shear strain
γd using Equations (1) and (2), respectively.
where
μd is the dynamic Poisson’s ratio. Considering that the strength of the remolded soil is relatively low and the dynamic Poisson’s ratio is difficult to determined based on the measured and empirical methods, the connection effect of the experimental data of the resonant column and the dynamic three-axis was very poor. Considering the aim of this study was to find a reasonable model soil for shaking table test to obtain the seismic response of the underground structure, the soil-structure stiffness ratio was a very important factor, and the stiffness of the soil was generally characterized by its shear modulus. Therefore, soil stiffness was determined in this study based on soil initial shear modulus, which were obtained by the resonant column test in the small strain range. Therefore, only the results of the resonant column test and the correlation analysis are given in this study.
4. Dynamic Test Results
It is well known that the strength of model soils is lower than that of the original soil. The model soil samples will be damaged under higher confining pressures. Therefore, the model soil samples were only tested under confining pressures of 50 kPa and 100 kPa, while the original soil samples were tested under confining pressures of 50 kPa, 100 kPa, 200 kPa, and 300 kPa. It can be seen from
Table 1 that the three soil samples were prepared in the shown proportions, and the average values of the three tests were taken from the test results.
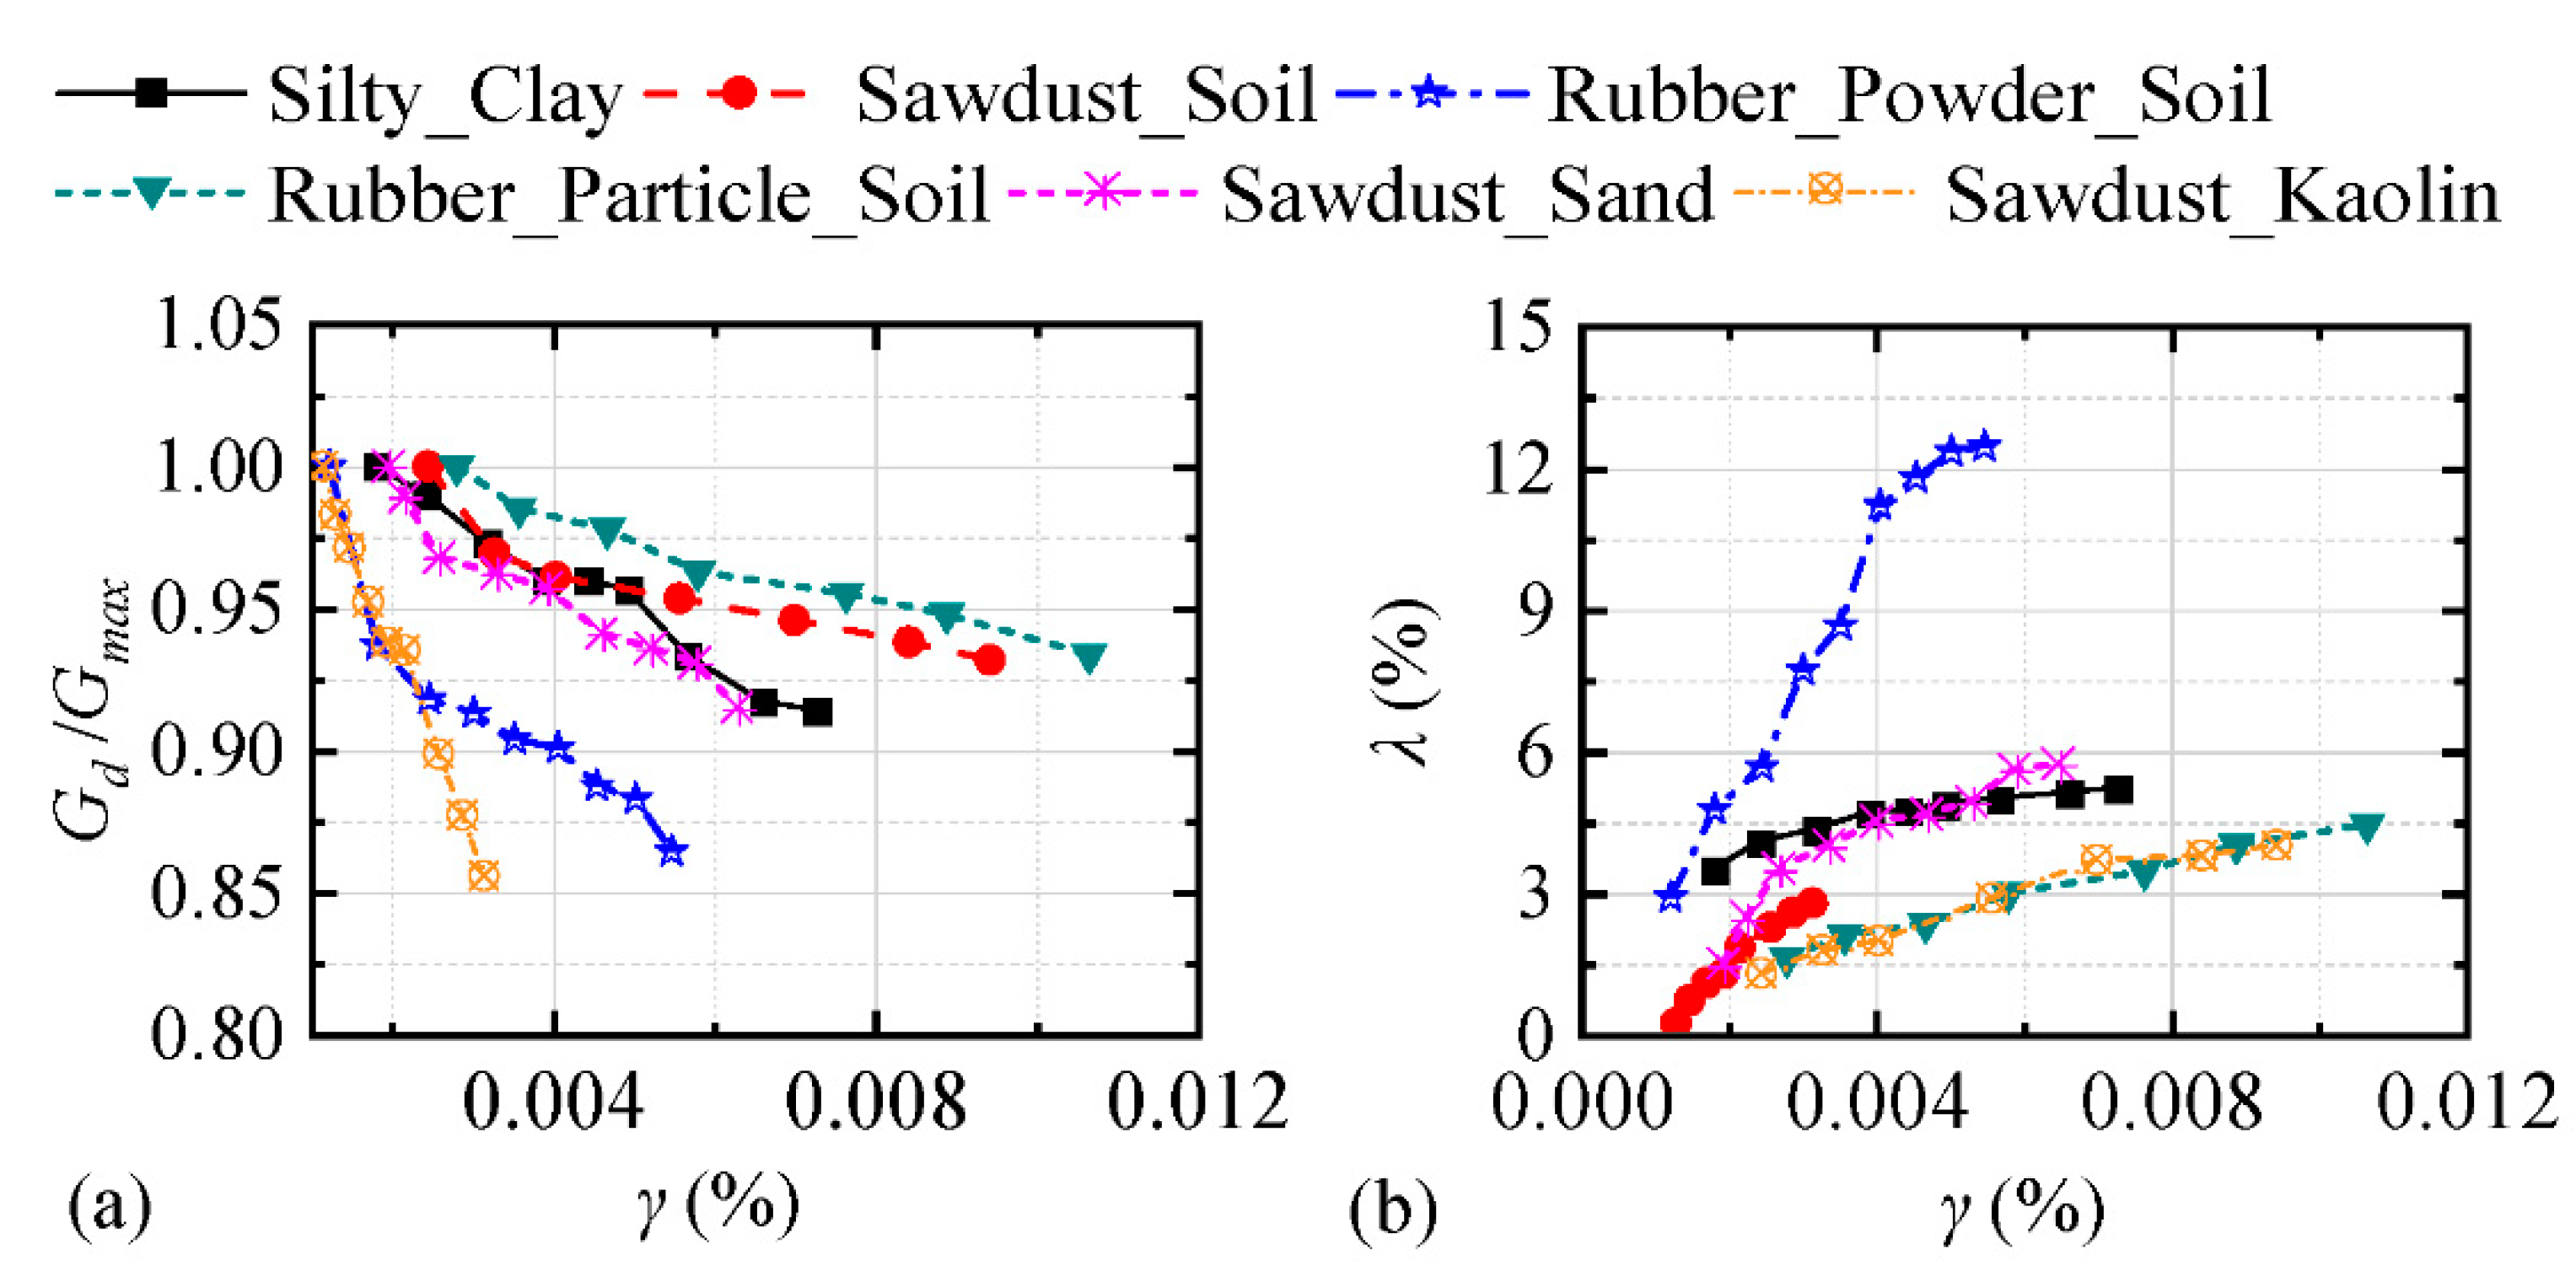
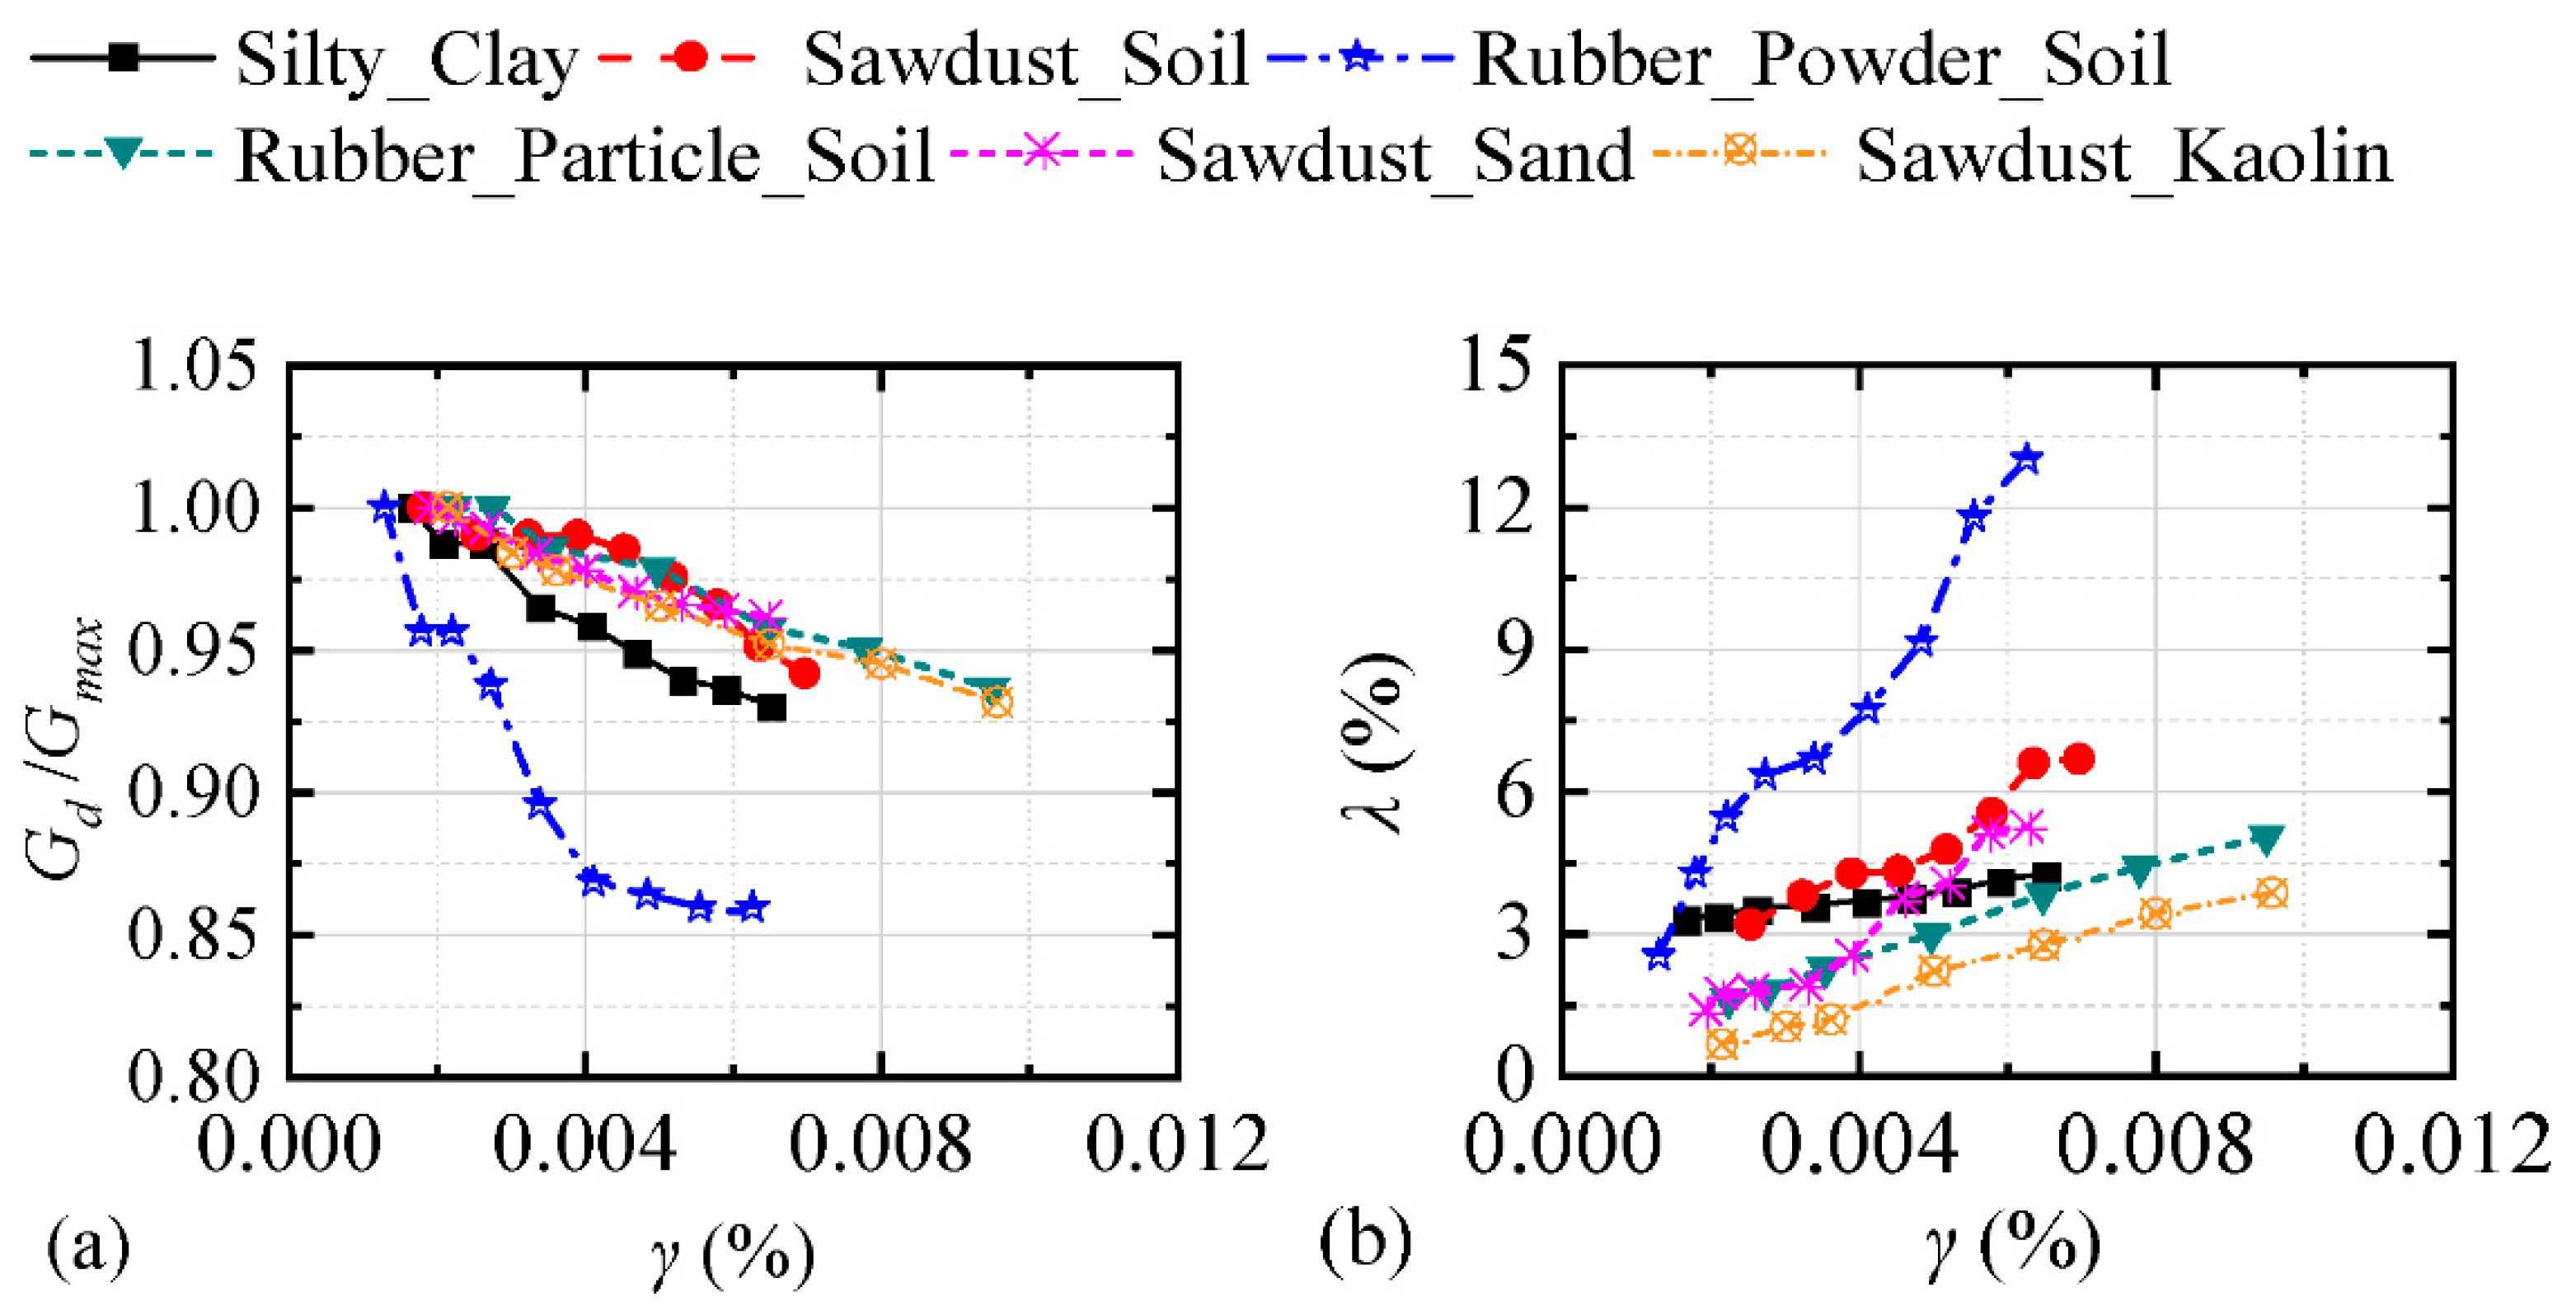
5. Discussion and Analysis of the Test Results
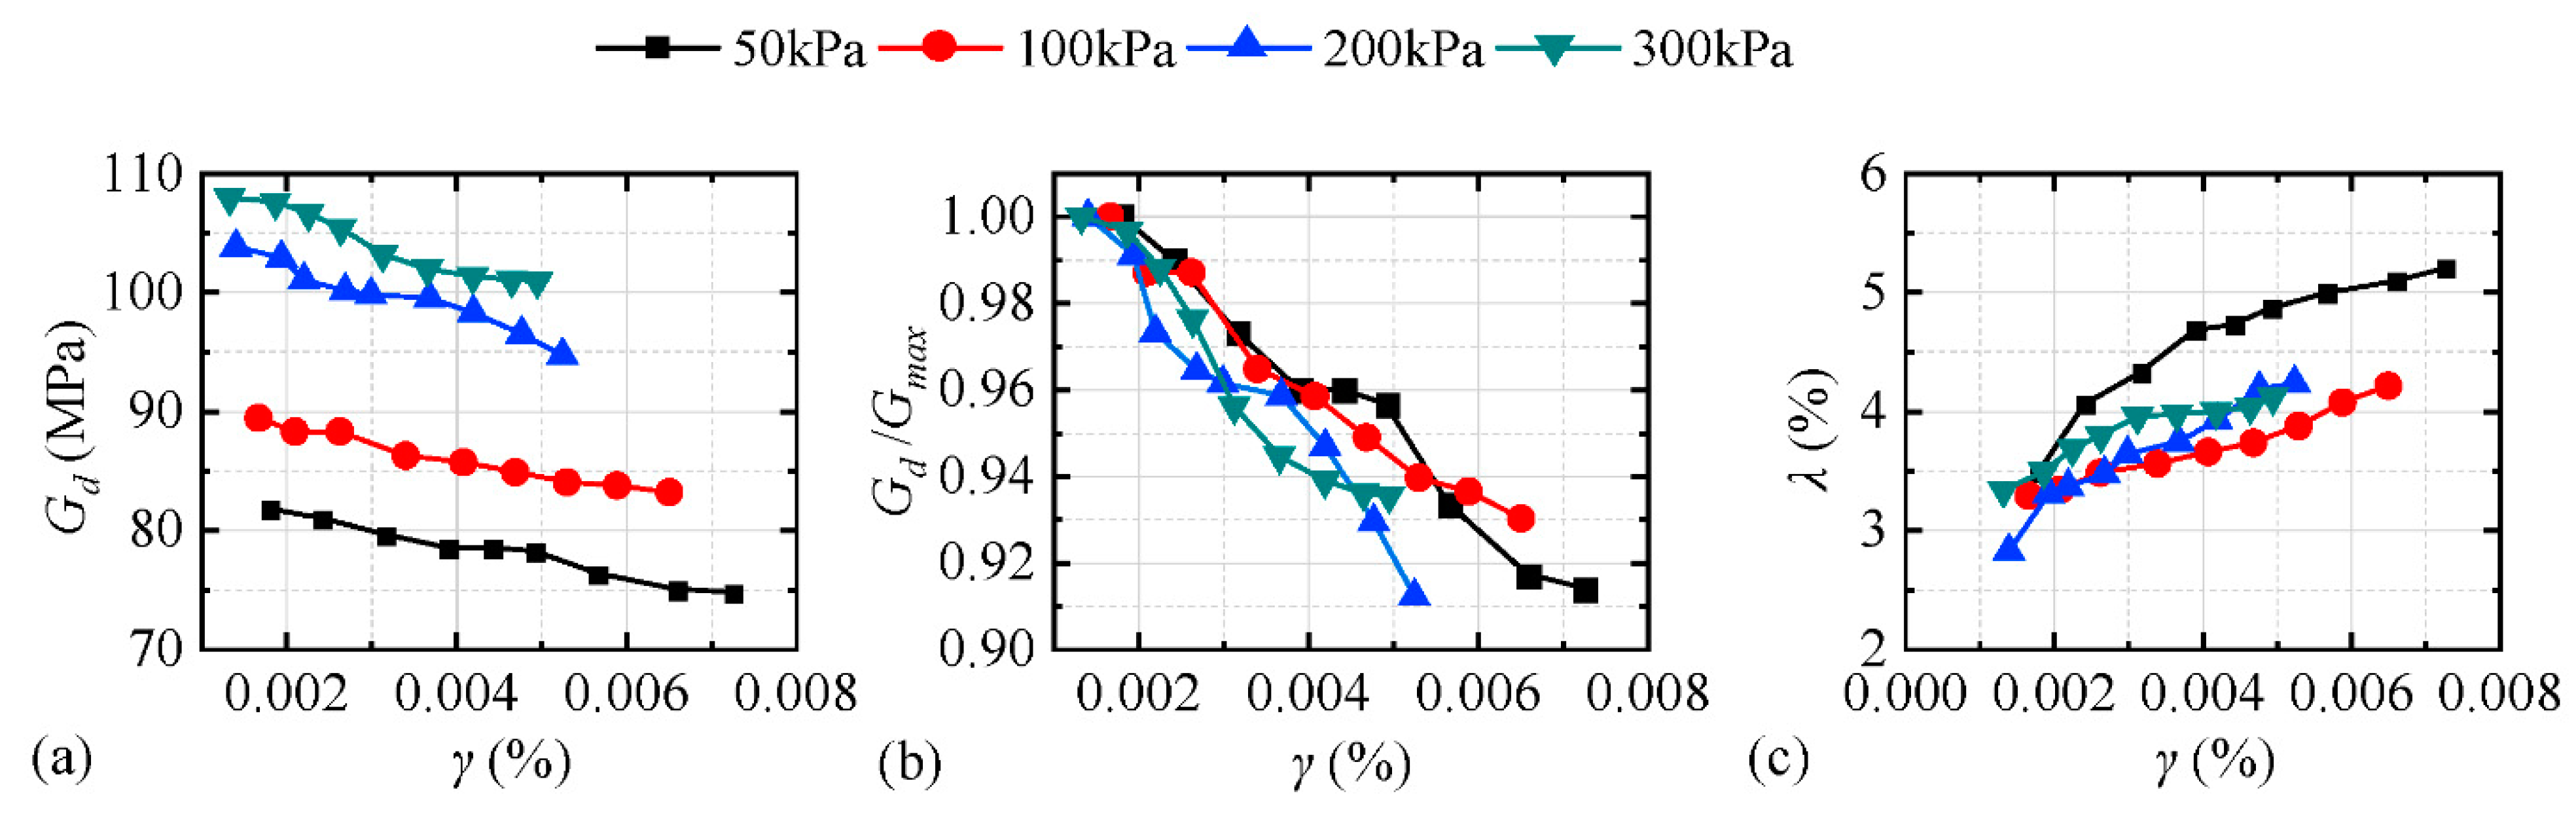
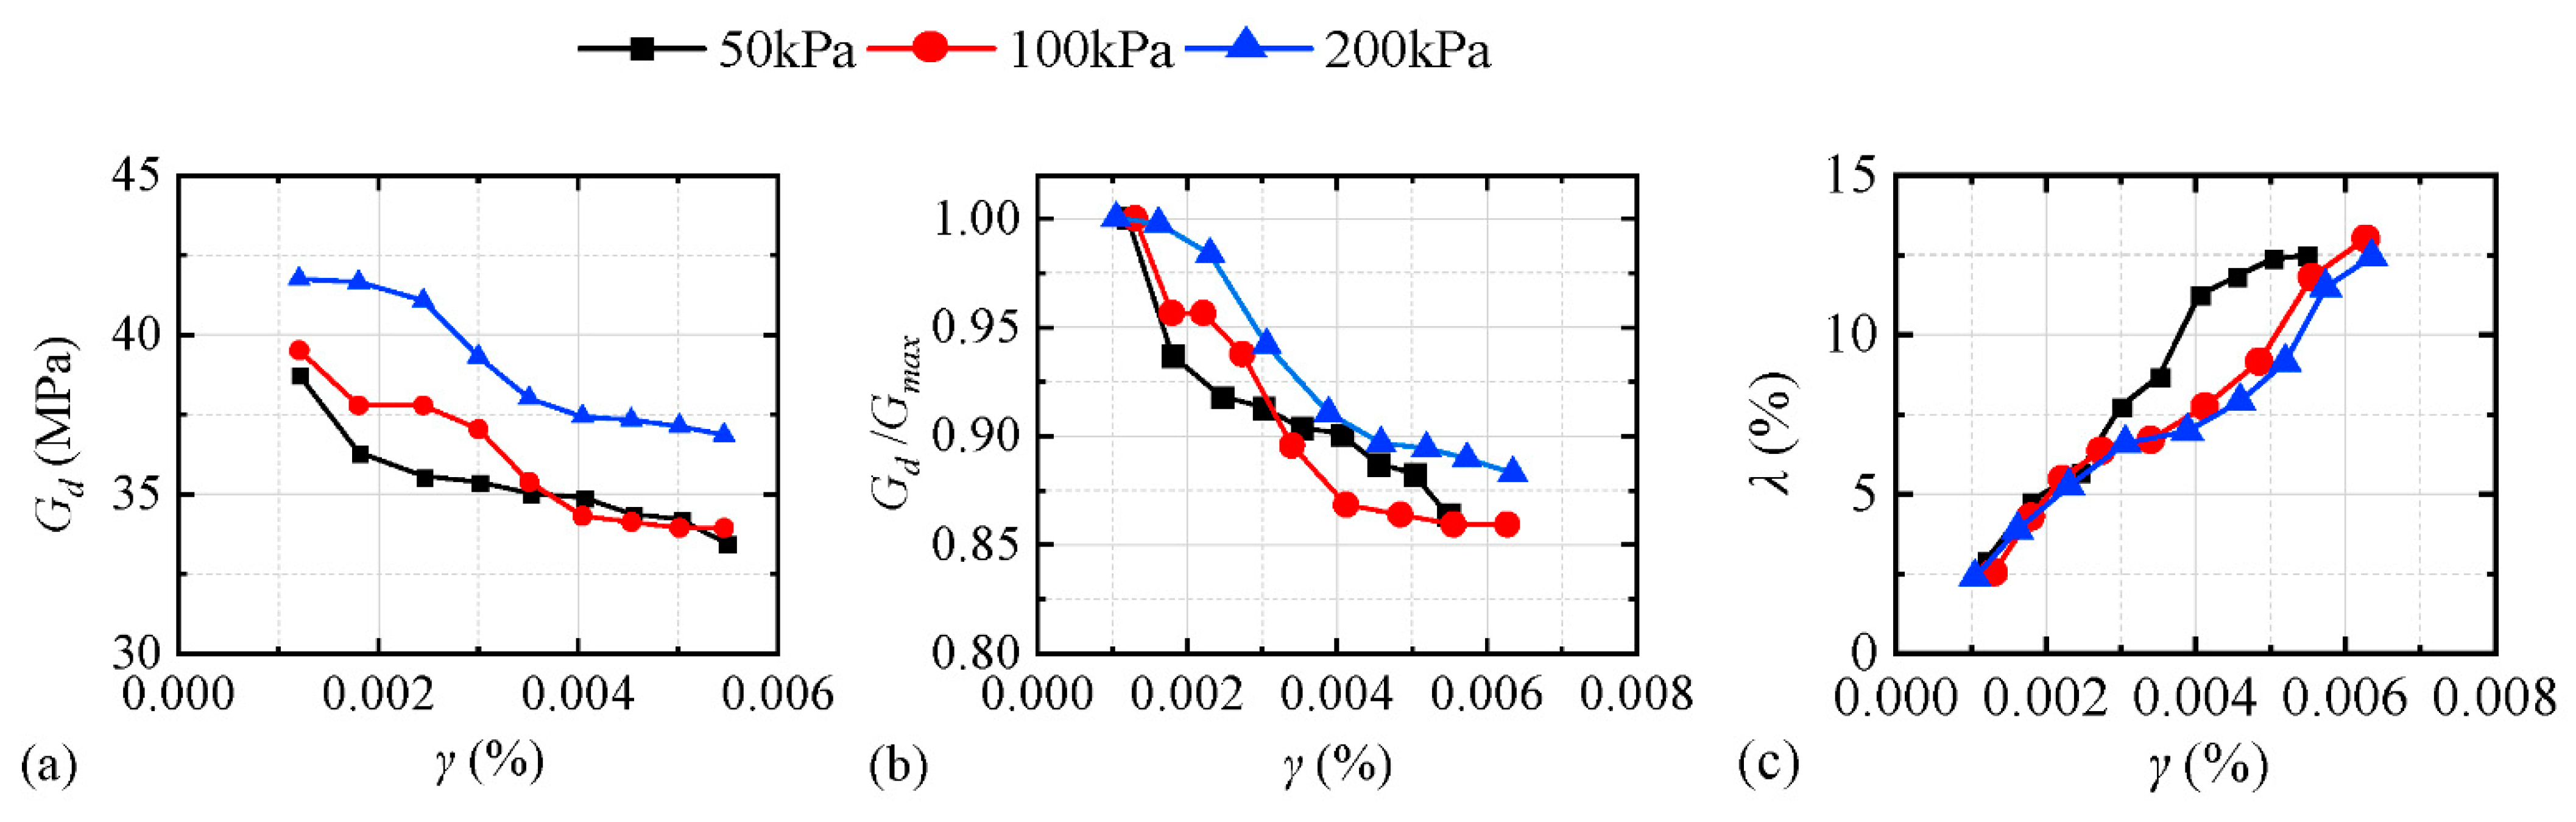
By the dynamic shear modulus of the undisturbed soil, the curves of the normalized dynamic shear modulus, and the dynamic damping ratio relative to the initial dynamic shear modulus with the dynamic shear strain (
Figure 3), the typical softening effect of soft soil can be seen; that is, the soil shear modulus decreased with an increase in dynamic shear strain, and the damping increased with an increase in dynamic shear strain, which was consistent with a large number of research results on soft soil. Furthermore, the stress-strain relationship can be described by the classical Hardin–Drnevich model [
17,
18] or an improved Davidenkov model [
19].
where
Gd and
Gmax are the instantaneous dynamic shear modulus and the maximum shear modulus of soil, respectively;
λ and
λmax are the instantaneous damping ratio and maximum damping ratio, respectively;
is the dynamic shear strain;
is the shear strain for reference; and A, B, and
β are the calibration constants.
1. The remolded soil satisfied the law of strain softening. The larger the surrounding rock was, the larger the initial dynamic shear modulus of the model soil was, and the slower the attenuation rate was. The damping ratio increased with increasing shear strain as a whole; however, the increase rate under different confining pressures was irregular.
2. The stiffness (initial dynamic shear modulus) of the five model soils under the same confining pressure was reduced as follows: rubber powder soil, sawdust sand, sawdust soil, rubber granular soil, and sawdust kaolin.
3. The content of the undisturbed soil in the soil sample was large; therefore, the dynamic shear modulus was large, which is a logical result.
4. Compared with the original soil, the shear modulus of sawdust soil was greatly reduced. In addition to sawdust kaolin and sawdust sand, the damping ratio of other soil samples increased to a certain extent; the main reason for this was that compared with the original soil, the remolded soil was loose and easy to consume because of the addition of elastic materials such as sawdust. Therefore, the damping ratio was relatively high, while the sawdust sand and sawdust kaolin were relatively dense because of quartz sand and kaolin, and the damping ratio did not increase but slightly decreased.
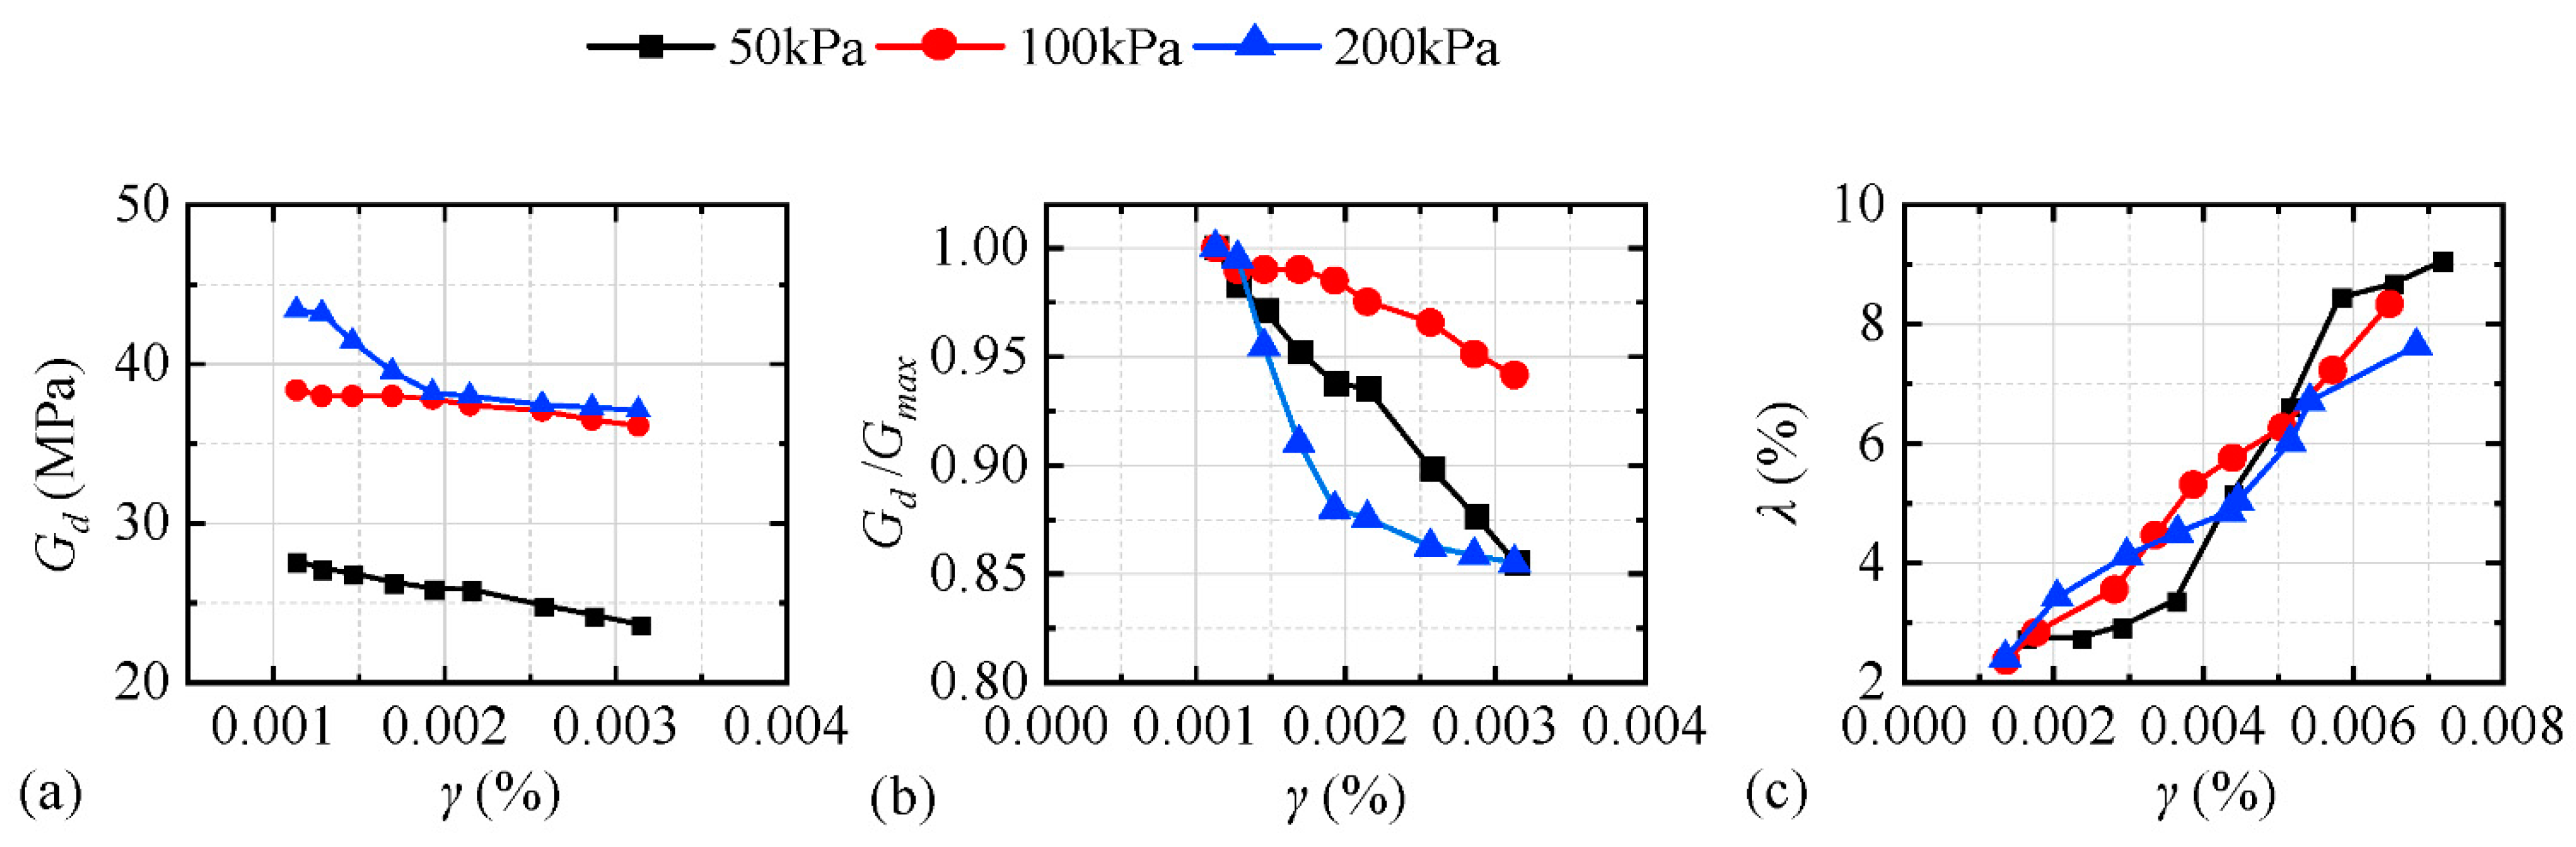
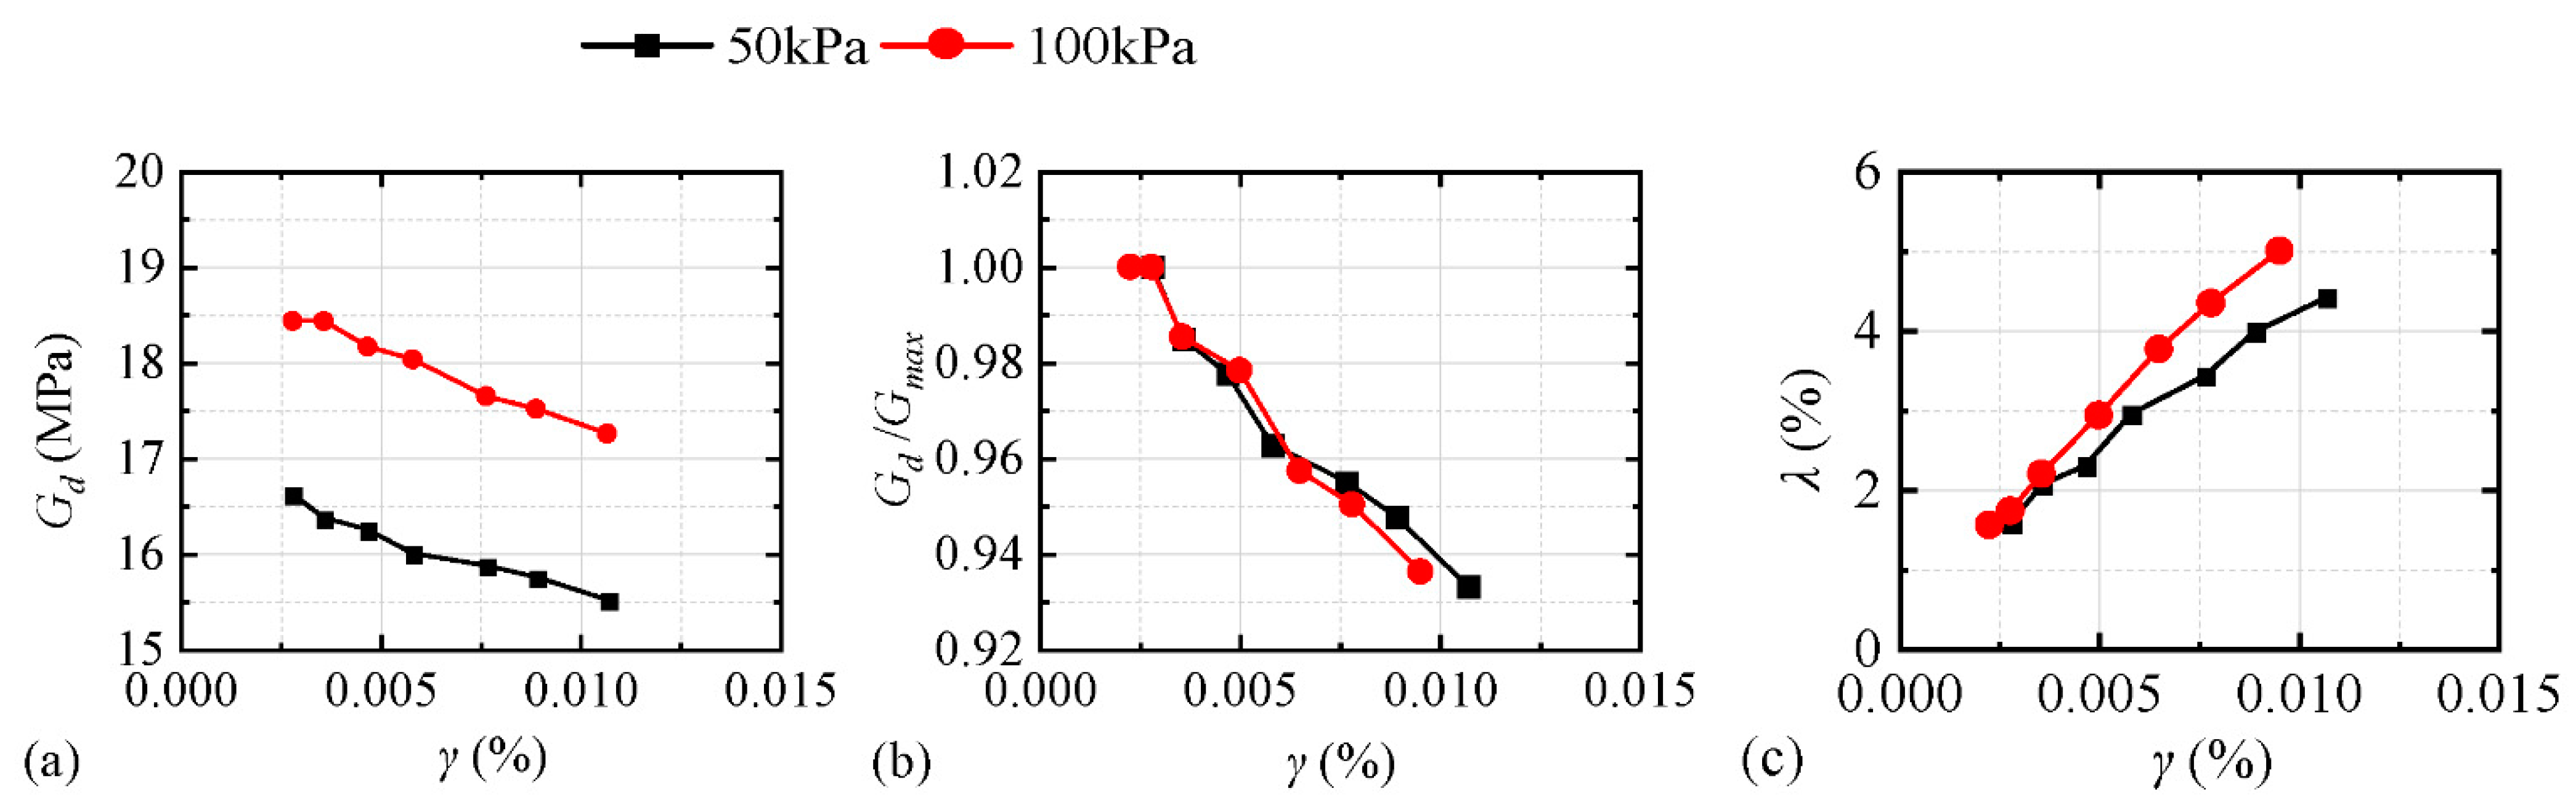
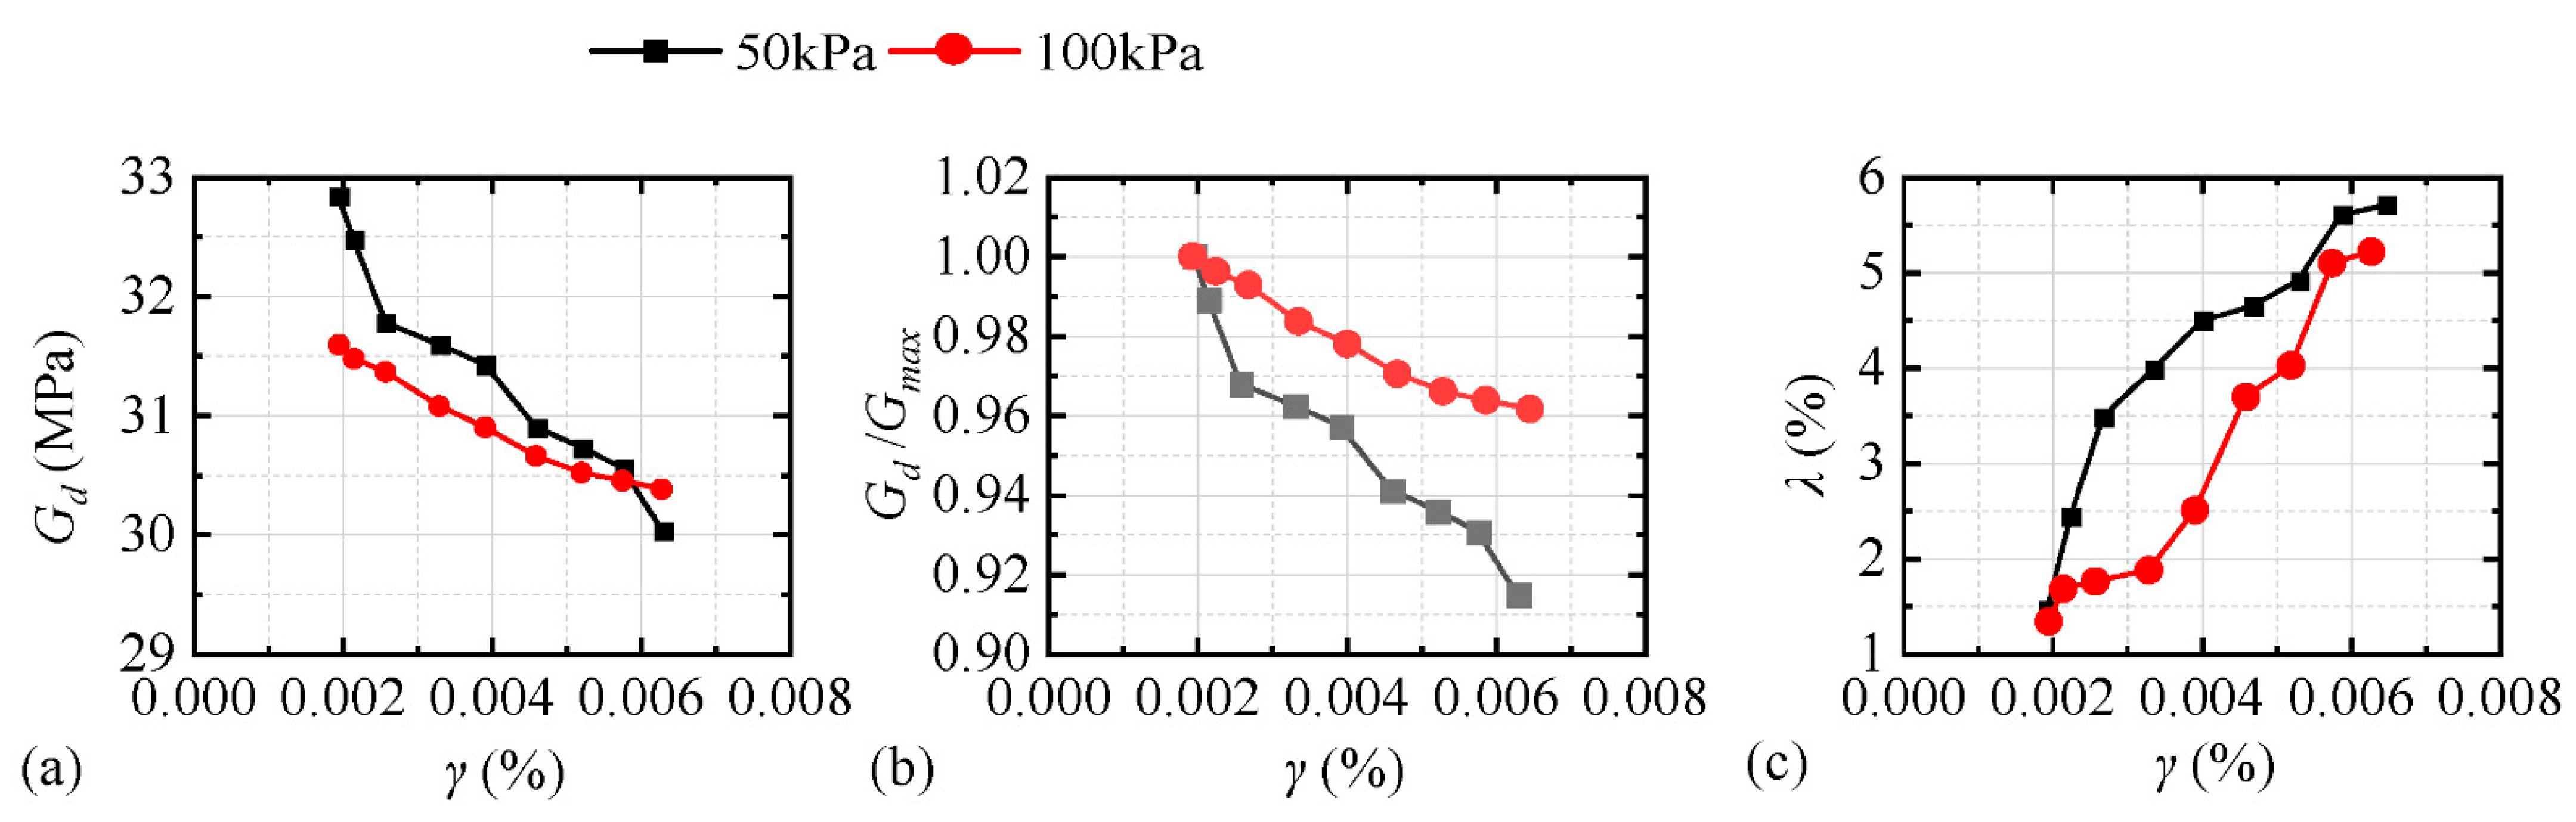
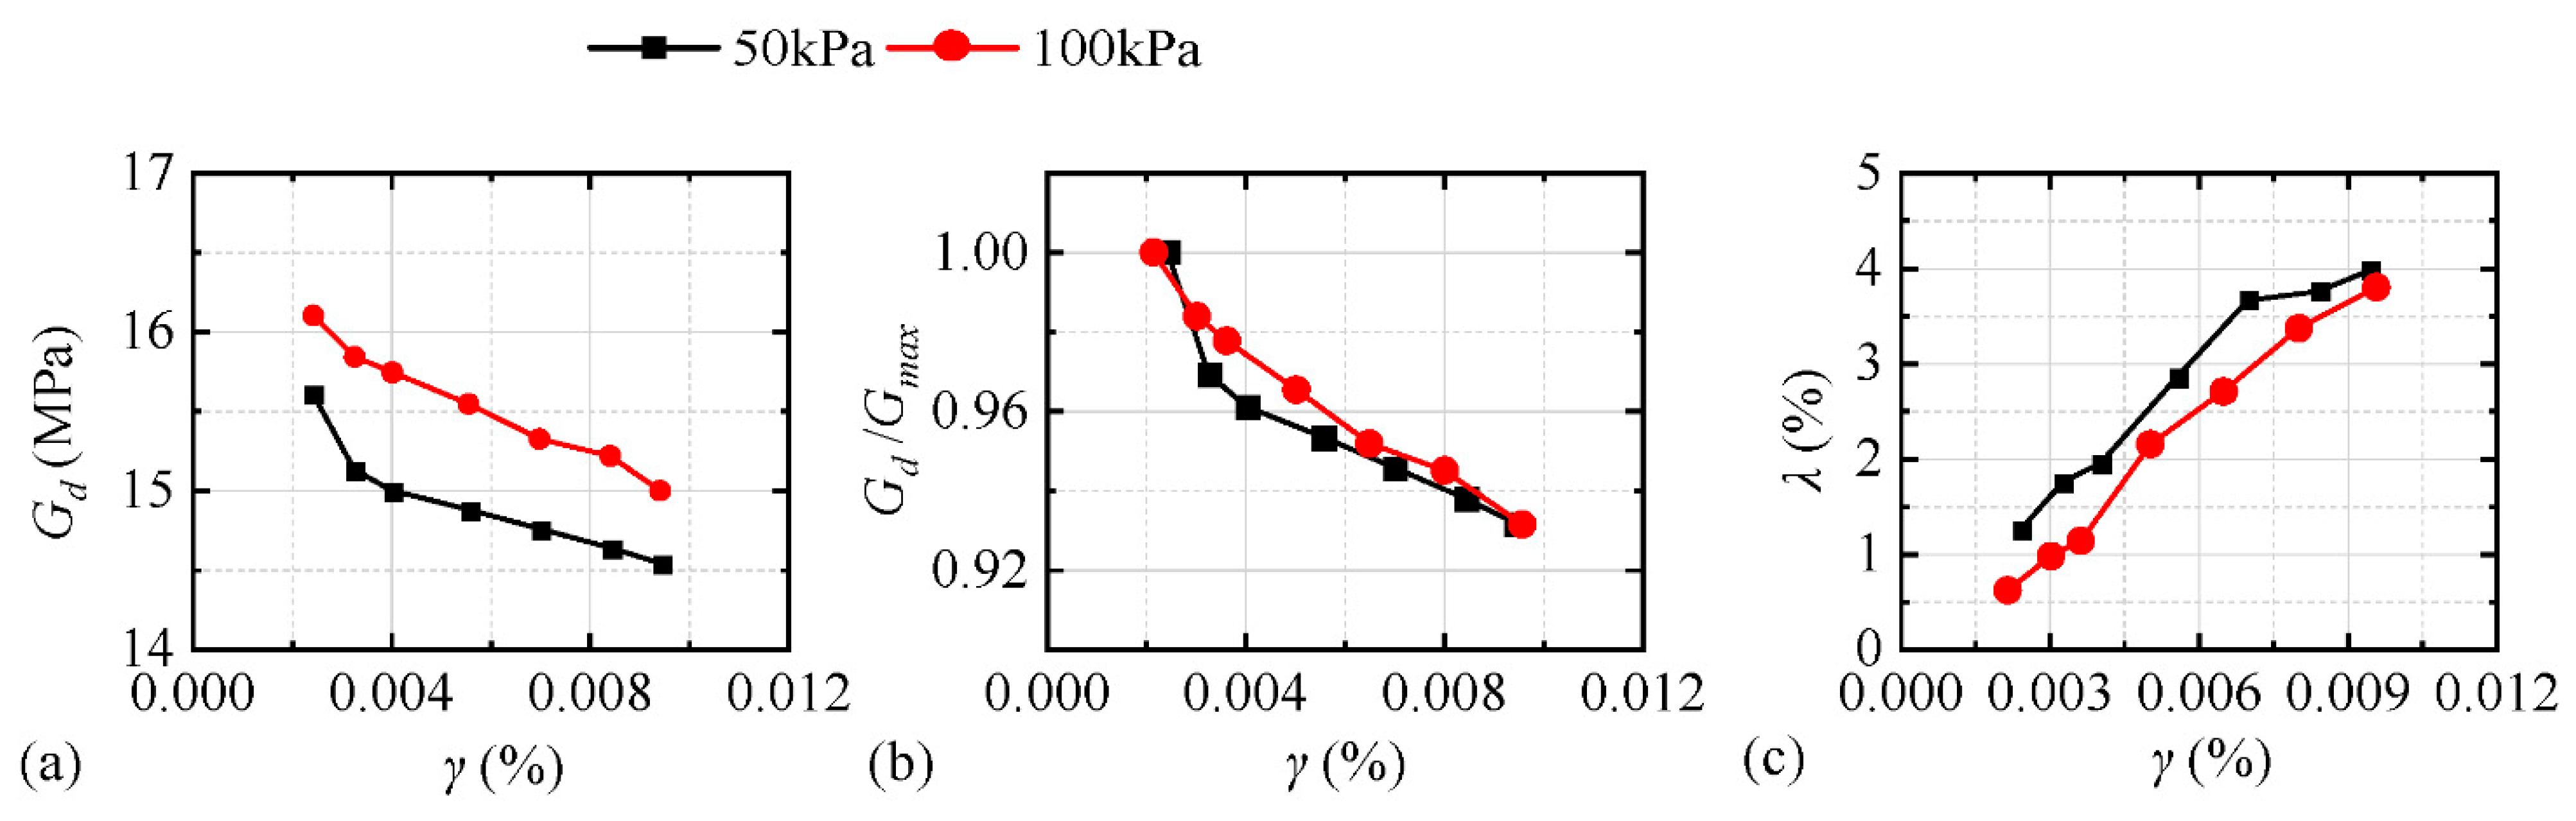
When the confining pressures were 50 kPa and 100 kPa, the dynamic characteristics of the five model soils and the undisturbed soils were compared.
Figure 9 and
Figure 10 illustrate the curves of the variations in the dynamic shear modulus and the dynamic damping ratio with the dynamic shear strain, respectively. In general, the dynamic shear modulus attenuation law and the dynamic damping ratio of the five model soils were similar to those of the undisturbed soil and could be used as model soil for the model test. However, the effect of sawdust soil and sawdust sand was the best. The second was rubber granular soil, and the effect of the rubber powder soil and sawdust kaolin was the worst. The reason was that the main body of the sawdust soil and the sawdust sand was cohesive soil and quartz sand, which mainly embodied the mechanical properties of the soil, and the rubber powder and the kaolin had small particle sizes.
Therefore, the mechanical property was different from that of the original clay. In addition, rubber granular soil, because of the large elastic characteristics of rubber particles, leads to a large rebound of soil samples and is difficult to compact. At the same time, because of the disadvantages of light mixing and easy floating, it is difficult to use rubber granular soil in a large volume. Based on the above-mentioned comparative analysis, it was suggested that sawdust and sawdust sand be used as model soil to perform the vibration table model test.
6. Similarity Ratio Design of Soil-Structure Stiffness Ratio
Wang [
2] provided the analytical equations for calculating the Stiffness Ratio of Tunnel—Soil (SRTS) of a circular tunnel (Equation (5)) and single hole rectangular tunnel (Equation (6)).
where
Et and
Es are the elastic modulus of the soil and the tunnel structure, respectively;
νs and
νt are Poisson’s ratio of soil and tunnel structure materials, respectively;
R is the radius of the tunnel structure, and
It is the moment of inertia of the unit width of the tunnel section, which is equal to
T3/12. T is the wall thickness of the structure.
H and
L are the height and width of the rectangular tunnel structure, respectively, and
IB and
IH are the moment of inertia of the top (bottom) plate and the moment of inertia of the side wall, respectively.
For a typical circular tunnel, the diameter was 6 m and the segment thickness was 0.35 m. It was made of C30 concrete, had a soil mass density of 1900 kg/m3, a shear modulus of 81.67 MPa when the confining pressure was 50 kPa, and a Poisson’s ratio of 0.42. However, the structural model adopted the conventional geometric similarity ratio of 1/30, and the elastic modulus of unconventional particulate concrete was about 9.00 GPa. Thus, the similarity ratio of elastic modulus was 0.30, and the acceleration similarity ratio was 1. The prototype structure-soil stiffness ratio calculated according to the above formula was 6.58. To make the model structure-model soil similarity ratio of the model structure equal to or close to 1, the shear modulus of the model soil was set to 24.50 MPa.
For a typical single-cell rectangular tunnel, the length and width of the concrete section were 6 m, the wall thickness of the structure was 0.35 m, and C30 was used. The material and design of the soil parameters and structural model were consistent with the above results. Given the above formula, the stiffness ratio of the prototype structure to soil was 13.71. To make the similarity ratio of the model structure to the model soil equal to or close to 1, the shear modulus of the model soil was 24.50 MPa.
Compared with the test results of the above five model soils, it can be seen that the dynamic shear modulus of the sawdust soil was the closest to the theoretical calculation value when the confining pressure was 50 kPa, and the second was the sawdust sand (31.59 MPa). Therefore, the above suggestions were verified; that is, it is recommended that sawdust and sawdust sand be used as the model soil for the model test of the vibration table.
7. Model Test Verification
Yan [
14] successfully used sawdust to study the seismic response of the raised immersed tube tunnel under non-uniform vibration excitation. Based on the test results of the above model soil, the shaking table test of the complex interaction system between underground structure, soil, foundation, and surface structure was carried out using sawdust soil [
15] to explore the interaction between the underground structure and surface structure during an earthquake. The contents of this test included a free field test, soil-tunnel test, soil-surface frame test, and tunnel-soil-surface frame test. To verify the rationality of the sawdust soil, we only provided the results of the free field test conditions; the other conditions can be found in the literature [
15].
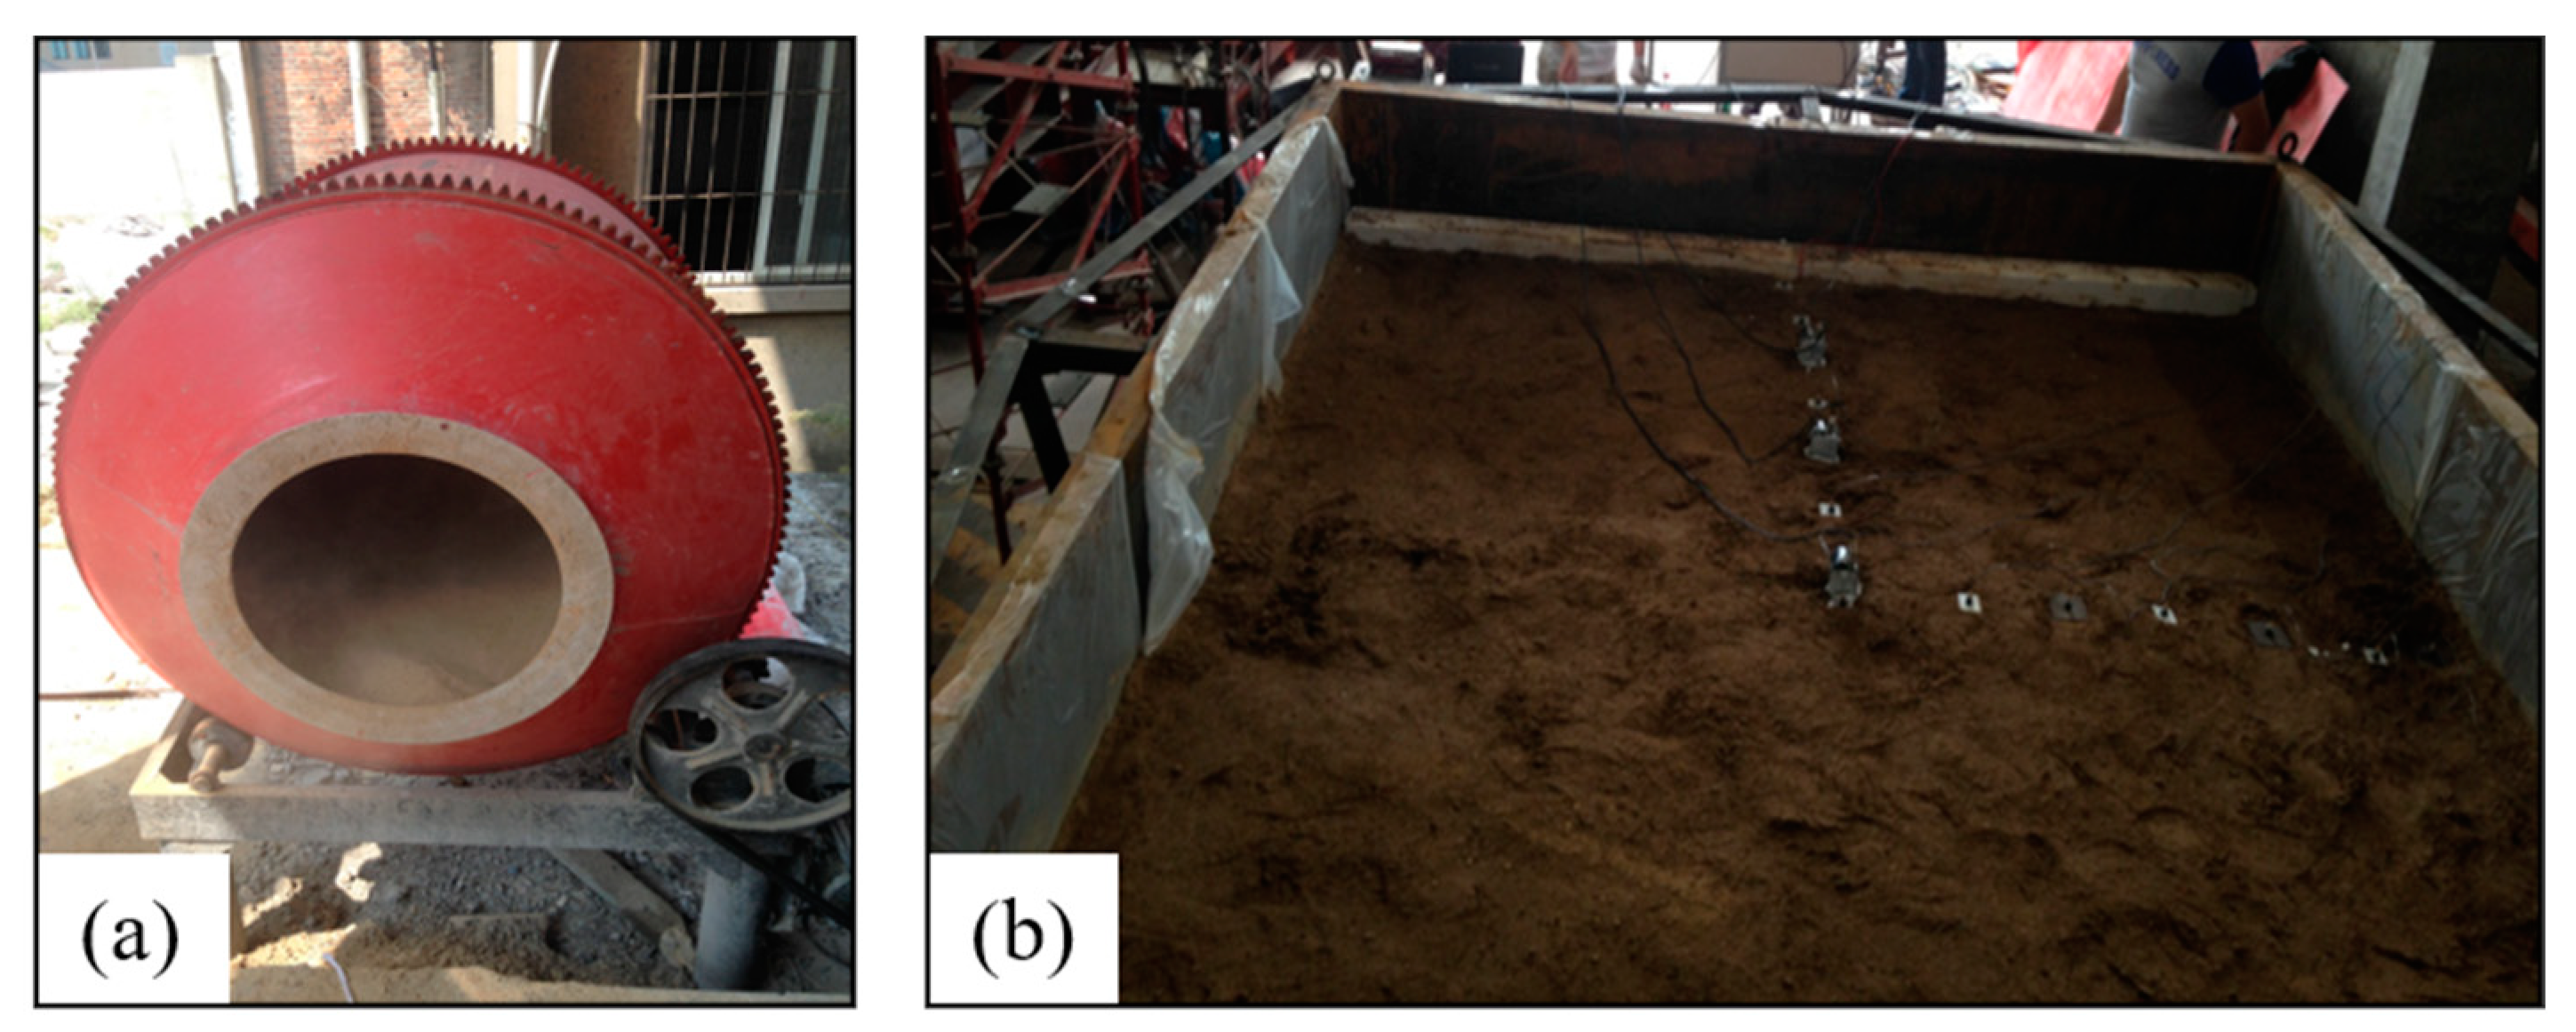
Because of the large volume of sawdust soil, the undisturbed soil and sawdust were first dried on the site and then mixed and stirred in proportion (
Figure 11a), filling, and layered compaction (
Figure 11b). After stratified compaction, the soil surface was sealed and statically set for three days.
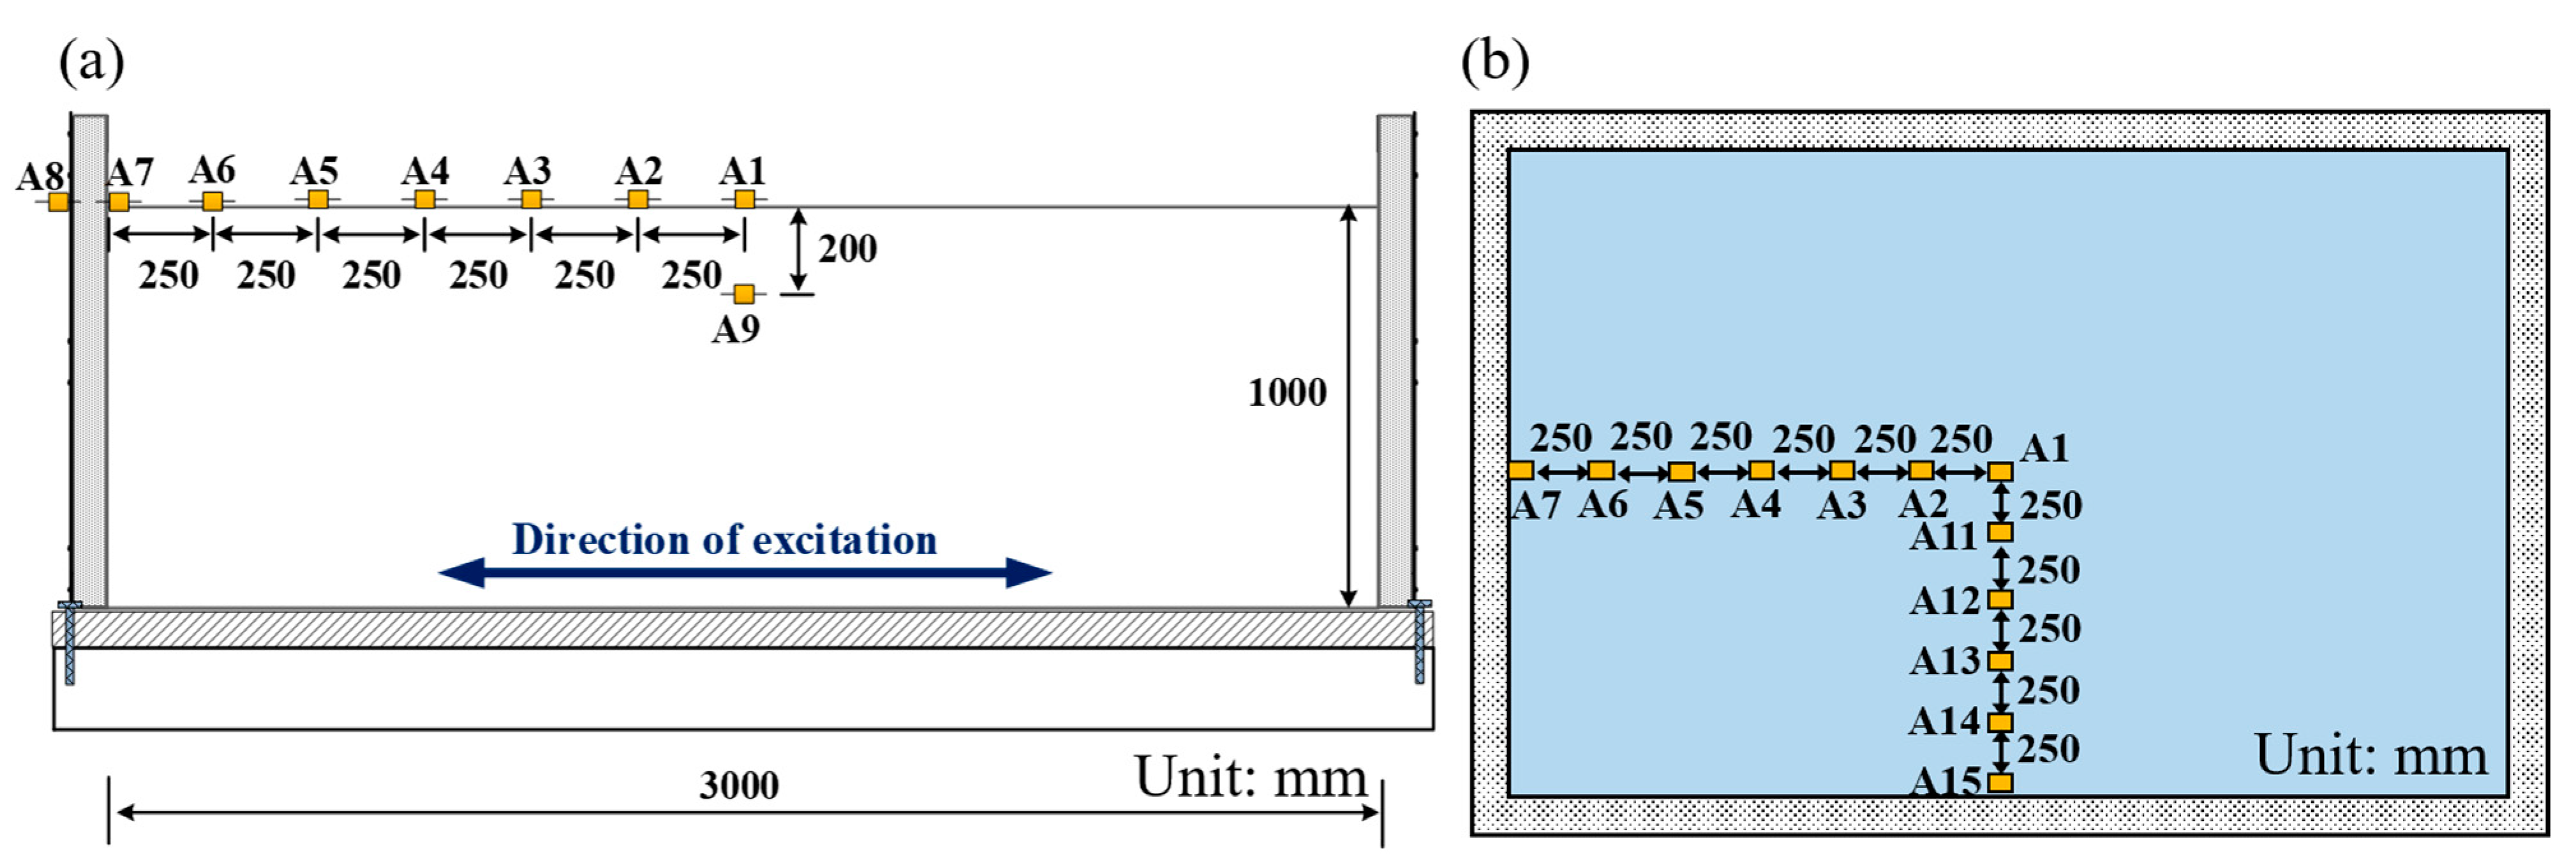
The depth of the soil at the free field was 1 m, and the arrangement of the acceleration sensor is shown in
Figure 12.
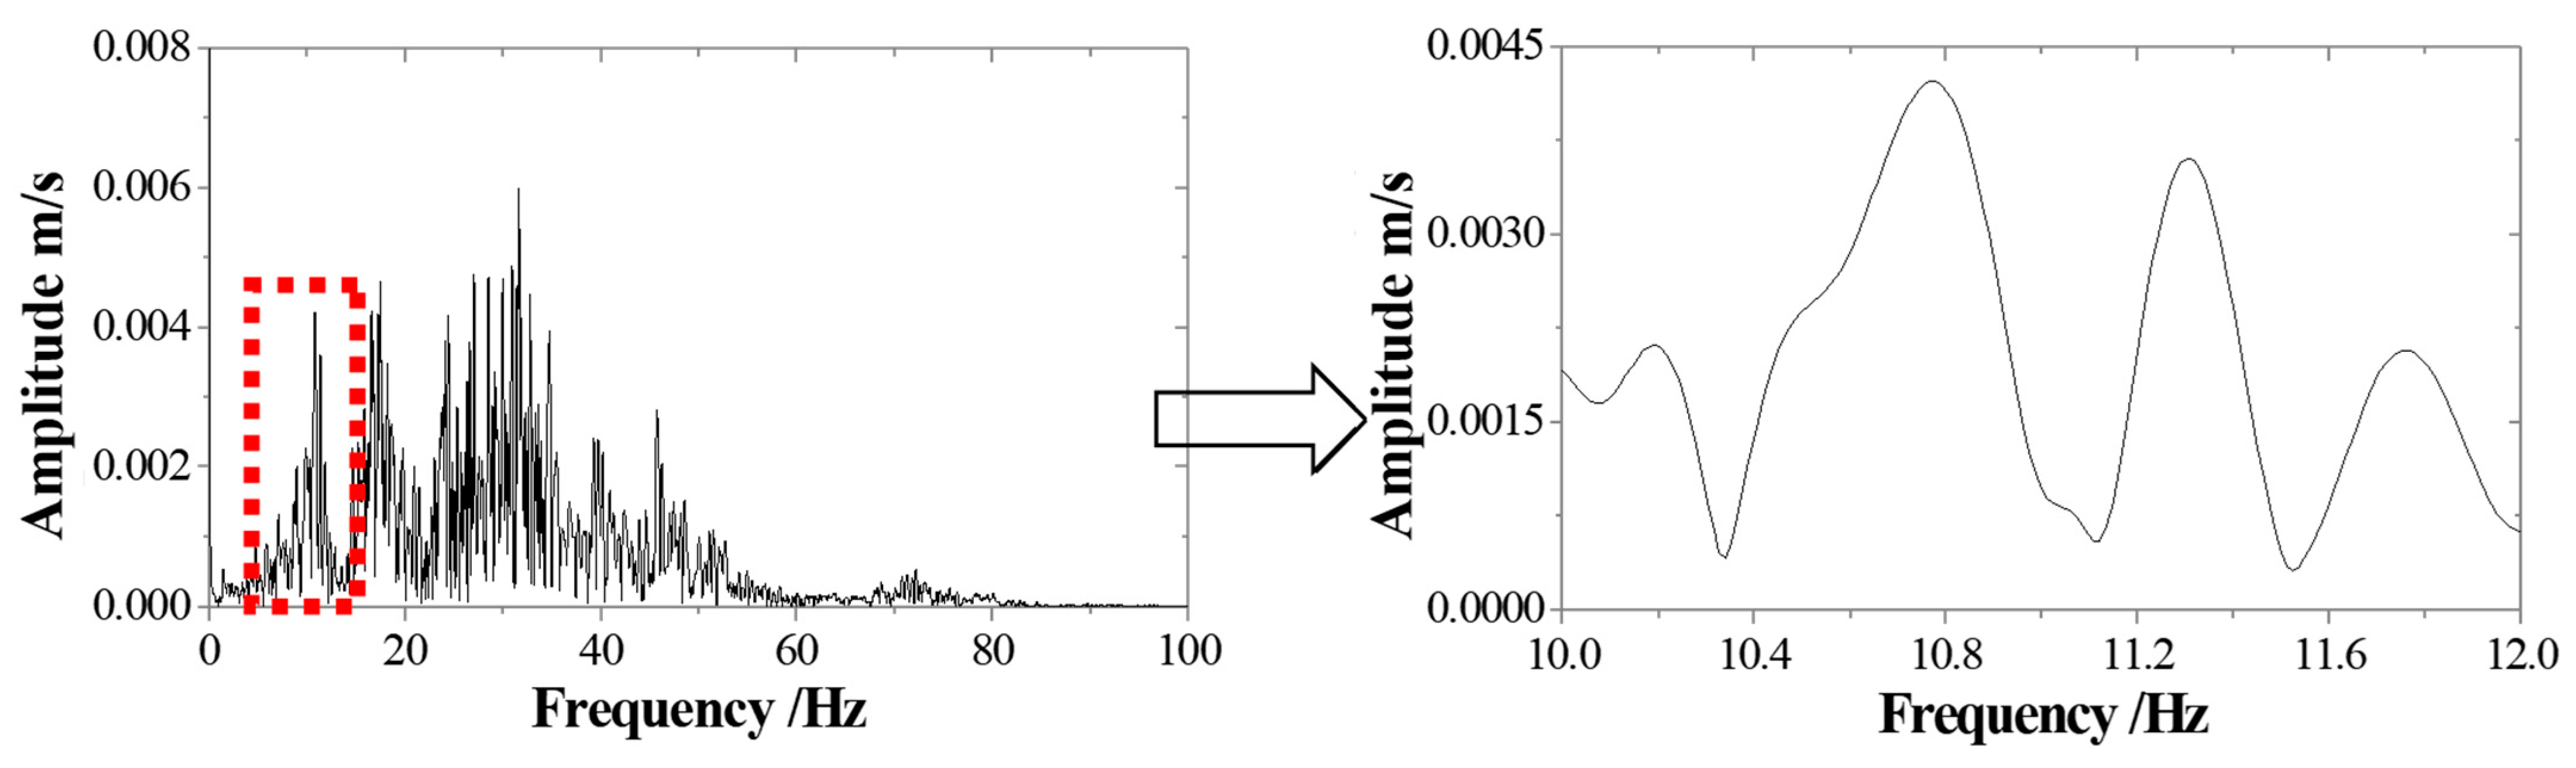
Taking the acceleration time history curve of the model soil surface under sinusoidal excitation as an example, the acceleration amplitude spectrum curve (
Figure 13) was obtained by fast Fourier transform, and then, the frequency and damping ratio of the system was obtained by half power method [
20,
21] (
Table 6).
The theoretical value of the natural vibration frequency of the model was obtained from the empirical Equation (7) of the free-field seismic response analysis:
where
fn is the n-order natural vibration frequency of soil and
VS and
h are shear wave velocity and soil thickness, respectively. As the density of sawdust soil is known, the shear wave velocity can be determined if the maximum dynamic shear modulus of sawdust soil is known, and the theoretical value of the natural vibration frequency of model soil can be determined.
The depth of the test soil was 0.9 m, and the overburden pressure at the average depth of 0.45 m was approximately 5.4 kPa, which was limited because of the limitation of the test instrument and could not be tested at such a small confining pressure. Therefore, the maximum dynamic shear modulus and circumference were considered to be the linear trend, and the value of the maximum dynamic shear modulus under different confining pressures of sawdust is shown in
Figure 4a. The empirical formula of the relationship between confining pressure and initial shear modulus can be fitted based on the existing different confining pressure test data. The corresponding shear modulus at a lower confining pressure (especially low confining pressure that the test equipment cannot reach) can be determined according to this formula. This method can be called the epitaxial method. When the confining pressure of 5.4 kPa was determined, the maximum dynamic shear modulus could be approximately determined as 3.52 MPa by the epitaxial method, the shear wave velocity
VS was 54.42 m/s, and the theoretical value of the first-order natural frequency of model soil was 54.4/4/0.9 = 15.10 Hz. By comparing the experimental data with the theoretical calculation results, the following results were obtained:
1. The identified system frequency value of 10.80 Hz was close to the theoretical calculation value of 15.10 Hz. The reason for the error was that, when the soil-making power test was performed, the model soil was formed in a sample preparation device for convenience for the indoor test. A certain pressure was applied to the soil sample to make the soil sample compact. Thus, by comparison with the model soil in the model box, the compactness of the soil sample in the laboratory test was higher, so the fundamental frequency of the system was less than the laboratory test value. In future shaking table tests, the bending element can be used to directly measure the shear wave velocity in the model soil to reduce the influence of sampling disturbances.
2. With the increase of the amplitude of the input ground motion, the frequency of identification decreased and the damping increased, which indicated that the stiffness of soil was decaying, i.e., nonlinear deformation of soil occurred, which was consistent with the dynamic characteristics of soft soil.
Based on the above analysis, it can be preliminarily determined that the fundamental frequency of the model soil was 10.80 Hz, the corresponding shear wave velocity was 39.96 m/s, and the density was 1190 Kg/m
3. Then, the dynamic shear modulus was 1.91 MPa. In this experiment, the size of the circular tunnel was consistent with that of the tunnel structure in
Section 5; however, the tunnel was made of plexiglass with a density of 1120 kg m
3 and an elastic modulus of 2.10 GPa. The prototype structure-soil stiffness ratio was 6.58 according to Equations (5) and (6), and the structural-soil stiffness ratio of the structural model was only 4.03.
The structure-soil stiffness ratio of the prototype and the model was not equal to 1, and there was still a certain gap between both the prototype and the model. The main reason was that the thickness of the model soil (sawdust soil) was too thin, the soil was relatively loose, and its stress level was low, which also showed that in the complex design of the soil-structure interaction shaking table model test, it was impossible to achieve all aspects, and only the main factors could be grasped. The structure-soil stiffness similarity ratio distortion could only be reduced as much as possible and perhaps it could not be completely avoided.
8. Conclusions
In this study, five types of model soil were prepared based on the undisturbed silty clay and common additive materials, and the dynamic characteristics of soils were given. Based on their respective dynamic characteristics, some suggestions on the selection of model soil were given, the suggestions were applied to the shaking table model test of the complex interaction system, and good results were obtained. The main research results of this paper were as follows:
1. The variation of dynamic shear modulus and dynamic damping ratio of various model soils with dynamic shear strain agreed well with that of undisturbed soil, which showed that the model soil could reflect the dynamic characteristics of the undisturbed soil, and could be used in the model test instead of the undisturbed soil, and had the function of reducing the structural-soil stiffness ratio distortion and adjusting the weight of the model soil.
2. In theory, the structure-soil stiffness ratio distortion can be completely avoided. However, the practical test involved the limitation of confining pressure and the elasticity of the model soil, and the distortion of the structure-soil stiffness was inevitable. The distortion of the structure-soil stiffness ratio could be reduced as much as possible by adjusting the proportion, which also showed the complexity of the scale model test.
3. In comparison, sawdust soil and sawdust sand could better simulate the original soil, and the effect of the rubber powder soil and sawdust was the worst; therefore, sawdust soil and sawdust sand were applied in the actual vibration table test.
The test conditions and some rebound characteristics of the model soil were limited, which resulted in the connection between the dynamic triaxial test data and the test data of the resonance column not being ideal. At the same time, more tests need to be conducted under different confining pressures so that the hypothesis of determining the shear modulus of soil under small confining pressure by the method of linear interpolation mentioned in this study can be verified or modified. Furthermore, if possible, the bending element should be employed in the shaking model test to record the shear wave in model soil directly, and then soil shear modulus can be obtained by shear velocity and density. This can help to determine the soil properties correctly. These links need to be further improved in follow-up research.


