Article

Prediction Study on the Alignment of a Steel-Concrete Composite Beam Track Cable-Stayed Bridge

1
Chongqing Key Laboratory of Energy Engineering Mechanics & Disaster Prevention and Mitigation, Chongqing University of Science & Technology, Chongqing 400074, China
2
School of Civil Engineering and Architecture, Chongqing University of Science & Technology, Chongqing 400074, China
3
T. Y. Lin International Engineering Consulting (China) Co., Ltd., Chongqing 401121, China
*
Author to whom correspondence should be addressed.
Buildings 2023, 13(4), 882; https://doi.org/10.3390/buildings13040882
Submission received: 15 February 2023 / Revised: 9 March 2023 / Accepted: 21 March 2023 / Published: 28 March 2023
(This article belongs to the Special Issue Intelligent Building Health Monitoring and Assessment)

Abstract

:
Due to the alignment of track bridges directly affecting the safety and comfort of rail traffic operation, the alignment prediction of track bridges needs to be accurate. However, the structure of steel-concrete composite beam (SCCB) cable-stayed bridges is more complex, and the alignment prediction needs to be more accurate. To further improve the accuracy of alignment prediction for large-span SCCB track cable-stayed bridges, a method based on the response surface method (RSM) is proposed. In this paper, the Nanjimen Yangtze River Track Special Bridge was taken as a case for research. Considering the randomness of the influencing factors, the 95% confidence interval was obtained by using Monte Carlo (MC) sampling analysis, and the predicted values were within the confidence interval. The results show that the method integrates the confidence interval under each confidence level by simulating the long-term deformation of different years after bridge completion. The method could accurately predict the alignment of large-span SCCB track cable-stayed bridges, and thereby provide technical support for alignment control and ensure the safe and comfortable operation of rail transit.

Graphical Abstract

1. Introduction

Bridges are key elements of the transportation system. Health monitoring and assessment of large-span bridges, mastering the evolution law of structural state, predicting structural performance changes and early warning of emergencies are effective means to ensure bridge operation safety, and are the priorities and research direction in bridge engineering. As a response parameter of the bridge structure, the bridge alignment can directly reflect the overall state and performance degradation of the structure (i.e., force change, material degradation, stiffness degradation, etc. all could cause the alignment change) and is an important parameter for assessment of the structure state. Structural state monitoring, analysis and assessment with bridge alignment as the key index is one of the important aspects of bridge health monitoring. Bridge alignment prediction is an area of intense research in academia and industry which has important theoretical significance and engineering application value.
SCCB are a new type of structure developed on the basis of steel and concrete. This structure can resist the lifting and opposite sliding at the interface of the steel beam and concrete bridge deck by setting shear connectors (shear nails, bending bars, etc.) between the steel beam and the concrete bridge deck, so as to make it work together as a whole. The SCCB bridge has the advantages of both steel and concrete structures, and is the main development direction of long-span bridges. The research on the alignment prediction of SCCB bridges is of great significance. Due to the influence of large traffic volume, narrow width, and high frequency of operation, the error between the predicted alignment and actual alignment of large-span SCCB track cable-stayed bridges can be large. The alignment state of such bridges directly impacts their safe construction and operation. If the error of alignment prediction is too large, it can cause a great threat to the safety of the whole bridge. Alignment analyses of large-span SCCB track cable-stayed bridges have been carried out in several studies, starting from the response surface method (RSM), and accurate alignment predictions were obtained.
Changes in bridge alignment are closely related to the bridge structure system, material characteristics, construction technology, etc. Researchers have carried out a large number of related studies and achieved fruitful research results. Ahad et al. [1,2] explored the role of bonding between ultra-high-performance concrete and reinforcement through experiments. Xiong [3] studied the influence of different influencing factors on the construction control of SCCB cable-stayed bridges through a geometric control method and identified the parameter sensitivity affecting the alignment of the main beam.
In order to reduce the influence of the construction process, several researchers have proposed different methods to improve the efficiency of alignment analysis for large-span bridges as bridge construction technology continues to mature. Xin et al. [4] proposed a new method based on improved variational mode decomposition (IVMD) and conditional kernel density estimation (CKDE) analysis data to obtain a high reliability bridge alignment prediction. Lu et al. [5] have proposed an agent model which is based on mind evolutionary computation-back propagation (MEC-BP) to improve the efficiency of the finite dimension analysis through the assistance of the model, using the model to study the alignment of a large span of waveform steel webs. Zhou et al. [6] proposed an optimized extreme learning machine algorithm to obtain the optimum extreme learning machine (ELM) data through an MEC search and then added in the ELM for the training so as to obtain a model with an average error of only 0.225 cm to generate a construction alignment prediction of large-span continuous rigid bridges. Chen et al. [7] established the multivariable grey model (MGM) (1,2) on the basis of grey system theory in order to combine the grey prediction model and the characteristics of the arch rib space of the shaped arch. They used the actual work for comparison to prove that the MGM(1,2) model is an accurate and reasonable method to predict the arch rib space of a shaped arch bridge alignment. Li and Zhu et al. [8] evaluated the long-term state of the Qingma Bridge under traffic load by a suspension cable monitoring system. Li and Wei et al. [9] proposed a cable state evaluation method based on machine learning, which showed that the cable tension ratio is only related to the properties of the cable and the transverse position of the vehicle on the deck. The model analysis showed that the tension ratio can be considered an effective feature reflecting the cable state which can be used effectively for cable state evaluation. Considering the inaccuracy of monitoring systems caused by temperature in some specific cases, Li et al. [10] proposed a method to extract bridge deformation under the influence of temperature and effectively analyzed the influence of temperature. Zhang et al. [11] established the dual defects magnetic dipole model with double defects in the cable and evaluated the state of the cable by quantifying the fracture width. Statistical methods are also becoming more widely used in the field of civil engineering. Among them, multiple linear regression is a statistical method that uses mathematical models to describe the relationship between one or more dependent variables. Yang et al. [12] analyzed eight parameters using the multiple linear regression method. In this way, the energy consumption of buildings could be analyzed and predicted. This statistical method is also applicable to the prediction research of bridge engineering. RSM is often used as a statistical method in engineering research. Li et al. [13] revised the model of cable-stayed bridges based on RSM. Using RSM, Ma et al. [14] performed synchronous revision of the structural parameters of the multi-scale finite element model (FEM) for a concrete-filled steel tube bridge. Xin et al. [15] used RSM to predict the long-term deformation of track cable-stayed bridges in a probabilistic sense considering five main structural parameters. Liu et al. [16] combined the RSM and equivalent normalization method (JC method) to analyze the reliability of large-span bridges.
However, the RSM has been applied less to the prediction of the alignment for large-span SCCB track cable-stayed bridges. There is less research on how to accurately predict the alignment for large-span SCCB track cable-stayed bridges. In this study, the RSM was used to conduct the alignment prediction based on environmental factors, actual situation on site, applicable standards and specifications, and other factors. It can supplement the alignment prediction research of entire large-span track bridges, and provide a reference for bridge health monitoring, assessment and reasonable alignment control during the operation period.

2. Experiment Principles

2.1. Design of Experiments

The structural alignment of bridges is influenced by many factors, many of which are random. The randomness of influencing factors should be considered in the prediction of bridge alignment. When selecting the samples of influencing factors, samples that can reflect the spatial characteristics and laws [17,18,19,20,21] should be selected as far as possible to improve the accuracy and efficiency of the experiment and achieve more precise results [22,23].
At present, the most common experimental design methods are uniform and orthogonal. Compared with the orthogonal design method, the uniform design method, which can solve more influencing factors in a shorter test time, is more suitable for large-span track SCCB cable-stayed bridges. This method is characterized by uniform dispersion, neatness, and comparability, making it an application of the pseudo MC method [24]. In this paper, the test sample points were selected with reference to the U8 (88) uniform design table based on the aspects of design complexity, environmental randomness and practical stability.

2.2. Experiment Methods

2.2.1. Response Surface Method

The multivariate linear regression method [25,26,27] is adopted to convert the nonlinear system into a linear system. The partial least squares method is adopted to optimize and find the matching function. The method of minimum error squared is adopted to fit the model prediction. The principle of the method is as follows.
1.
The independent variable matrix Aα × β is a standardized treatment to obtain V0 and its column vectors V01,…,V0β; the dependent variable matrix Bα × δ is a standardized treatment to obtain M0 and its column vectors M01,…,M0δ, where V0 is expressed as V0 = (V01,…,V0β)α × β and M0 is expressed as M0 = (M01,…,M0δ)α × β.
2.
The transpose matrix of V0 and M0 are denoted by V 0 T and M 0 T . The characteristic vectors φ1, φ2 corresponding to the maximum eigenvalues of V 0 T M0  M 0 T V0 and V 1 T M0  M 0 T V1, respectively, are calculated. Then t1 and t2 are calculated, where t1 = V0φ1, V1 = V0t1G1′, G 1 = V 0 T t 1 t 1 2 , t2 = V1φ2, V2 = V1t2G2′, and G 2 = V 1 T t 2 t 2 2 . This step is repeated until step m when tm, and Vm−1 are obtained.
3.
To establish a suitable model, m finite components t1, …, tn are selected. After executing to step m, the regression equation can be obtained, which is given as:
M 0 k = α k 1 V 01 + + α k β V 0 β + M k
where αk1, …, α are the regression coefficients.

2.2.2. Accuracy Test

After obtaining the data, the accuracy of the model needs to be tested. The multivariate RSM model was used in this work, so it is reasonable to use an R2 test to judge the accuracy of the model. which is given as:
R 2 = 1 j = 1 m [ f x j f ^ x j ] 2 j = 1 m [ f x j f x ] 2
where f(x)j is the jth sample point response value, f ^ x j is the calculated value of the response surface corresponding to the jth sample point, and f x is the average value, which is obtained from f x = 1 m j = 1 m f x j . The calculated R2 is between 0 and 1, and the closer the value is to 1, the more accurate it is.

2.2.3. Monte Carlo Sampling Analysis

In order to improve the accuracy of the predicted values represented by the response surface function, sample selection is significant. The MC method was selected for sampling in this study. To begin with, xi (i = 1, 2, …, n) are the independent random parameters in the influence model function f(x), and each corresponding independent parameter xi (i = 1, 2, …, n) is randomly sampled to obtain a random sample of x1, x2, …, xn. Then, xi is substituted into a specific program for repeated random sampling and analysis. The response values of the M group structure are obtained, which are denoted as f(x)1, f(x)2, …, f(x)m. Furthermore, the average value μ and standard deviation σ of f(x) are calculated, which can be expressed as:
μ = f x = 1 m j = 1 m f x j
σ = 1 m 1 j = 1 m [ f x j μ ] 2

3. Application Analysis

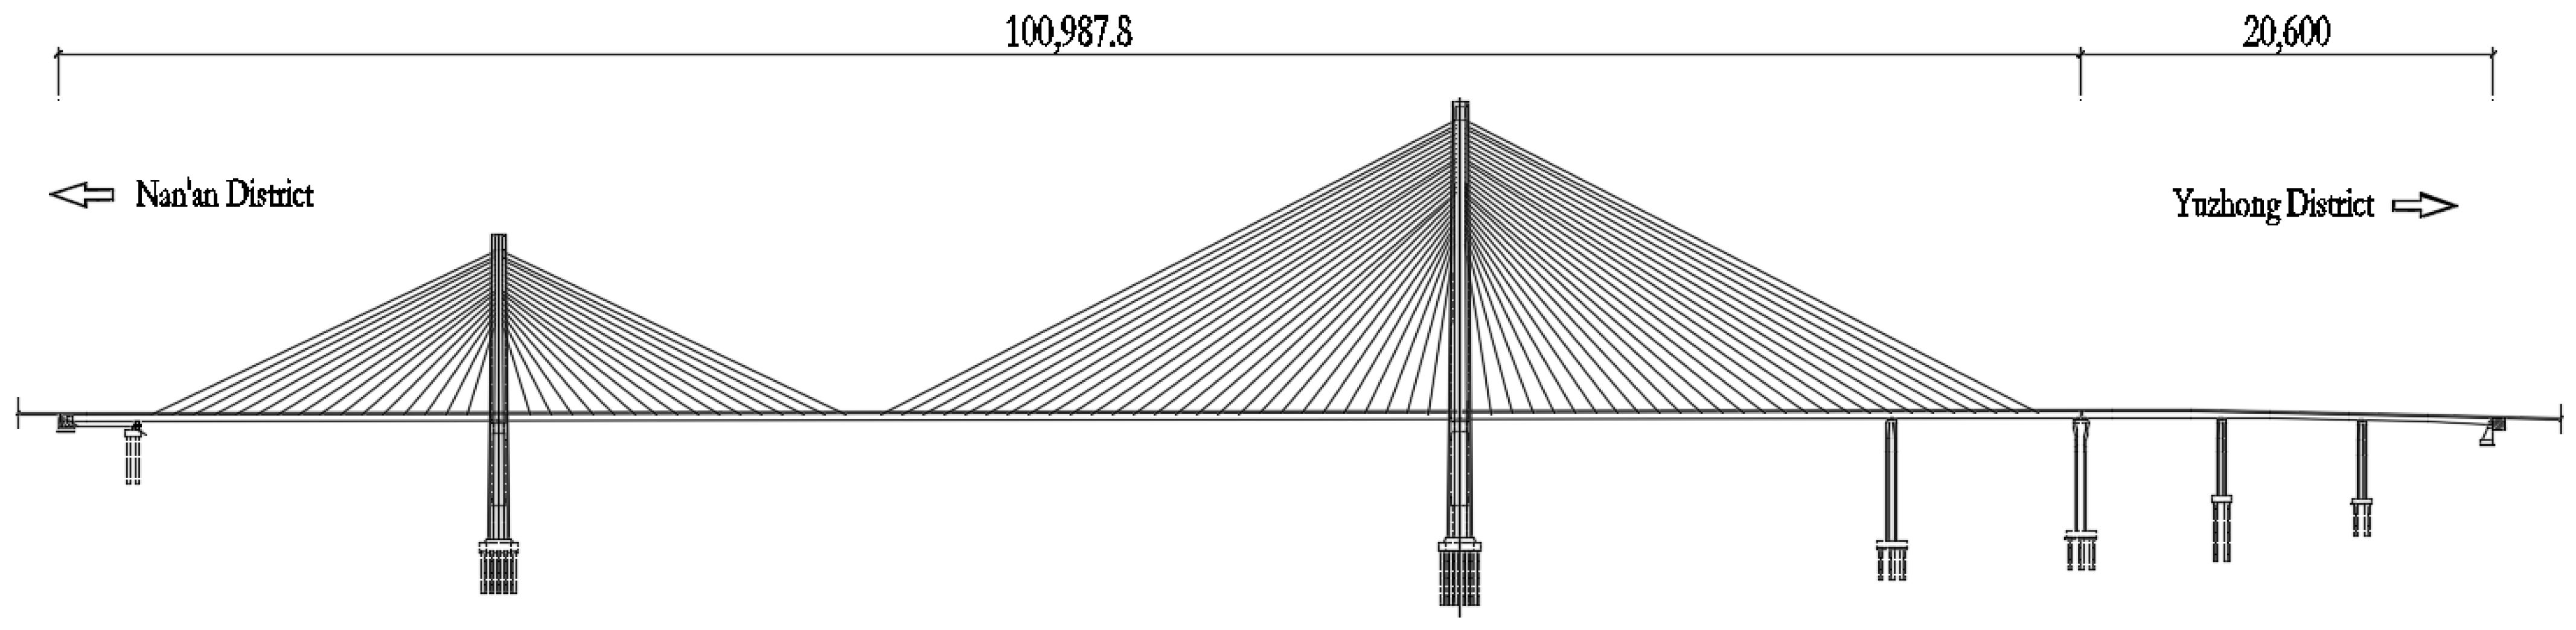
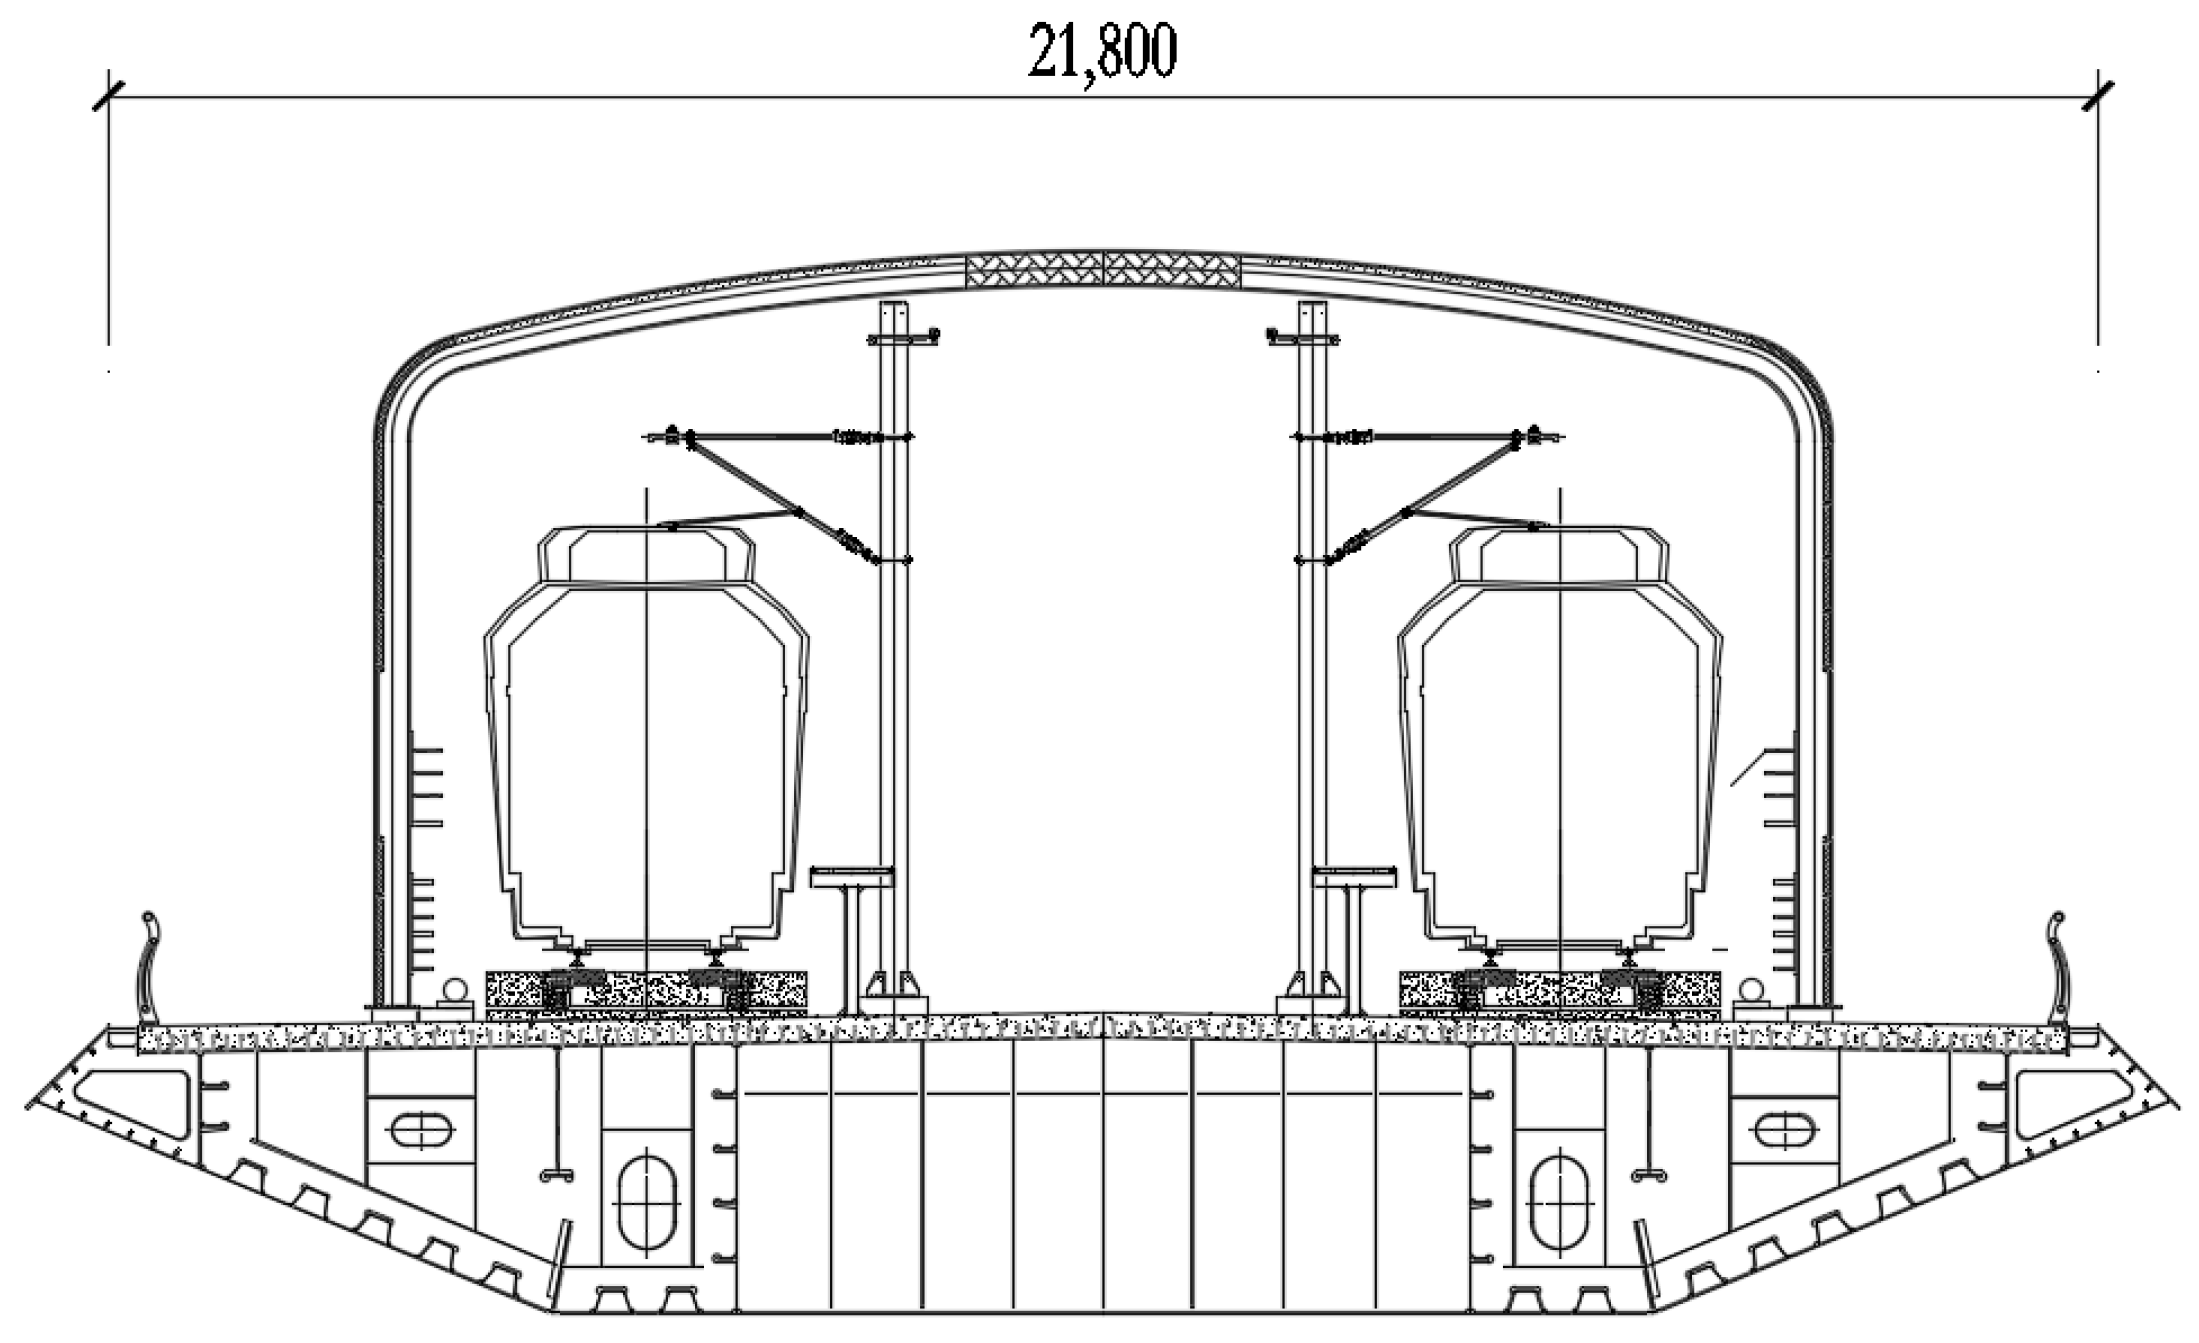
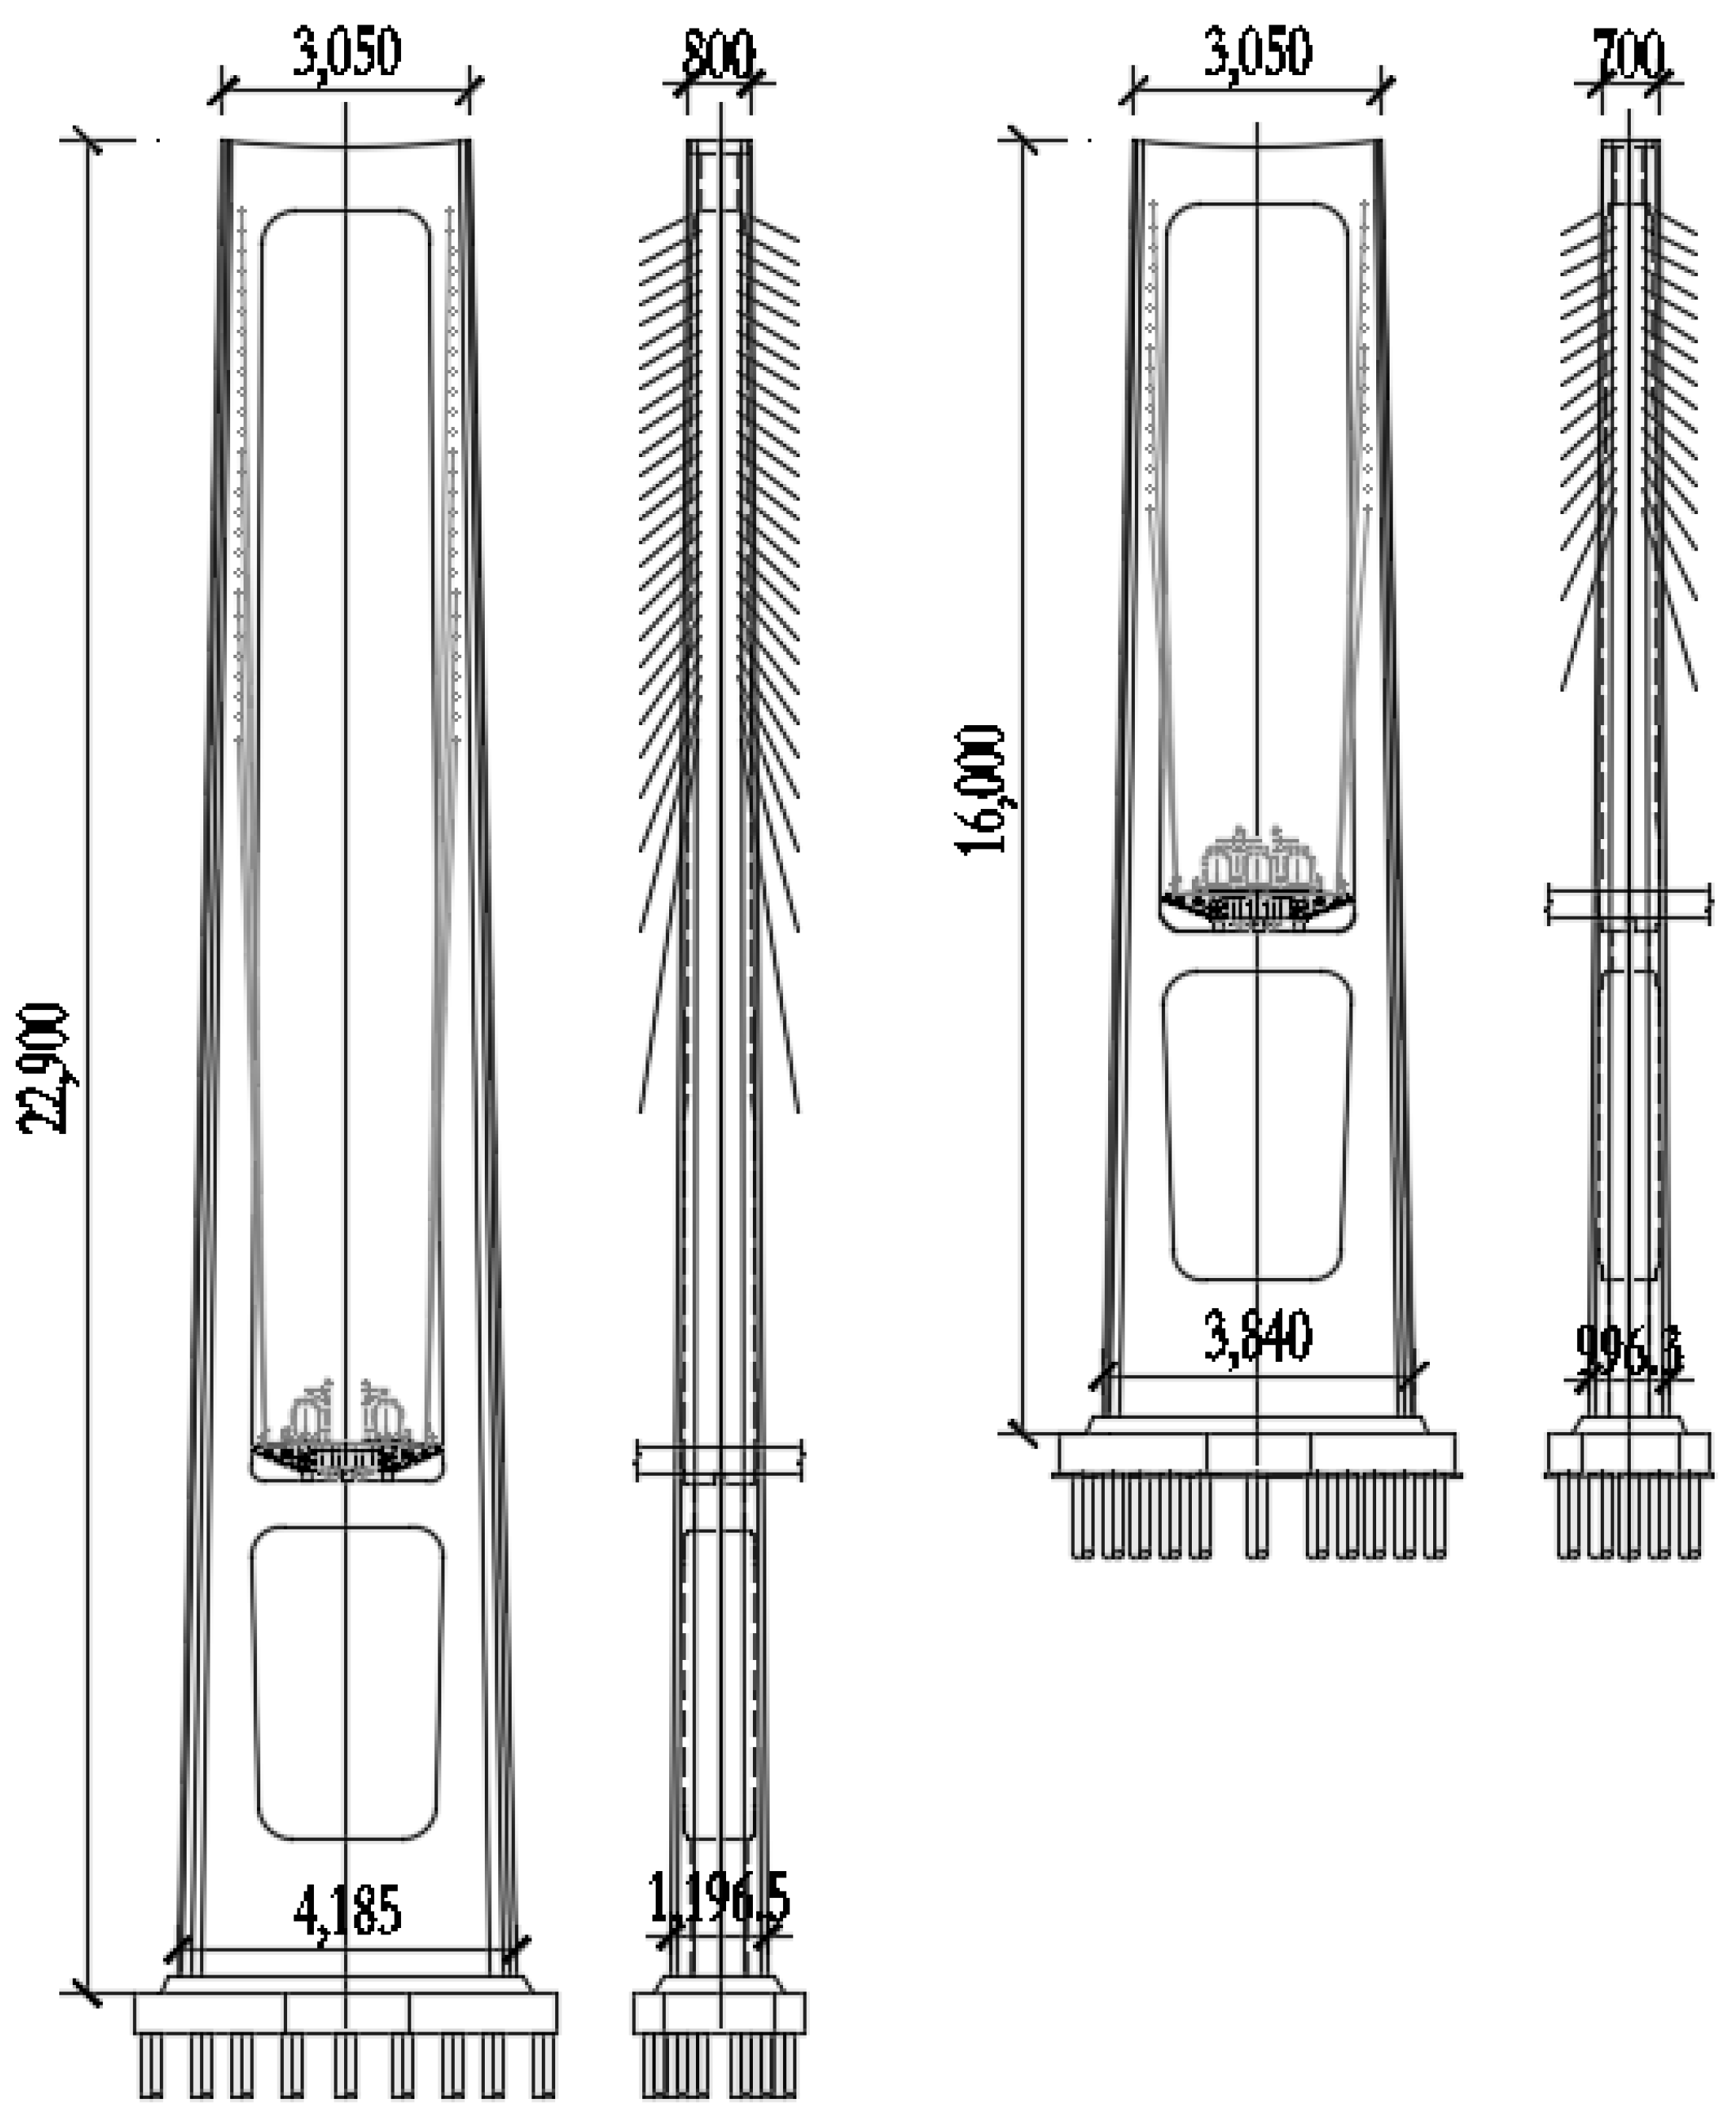
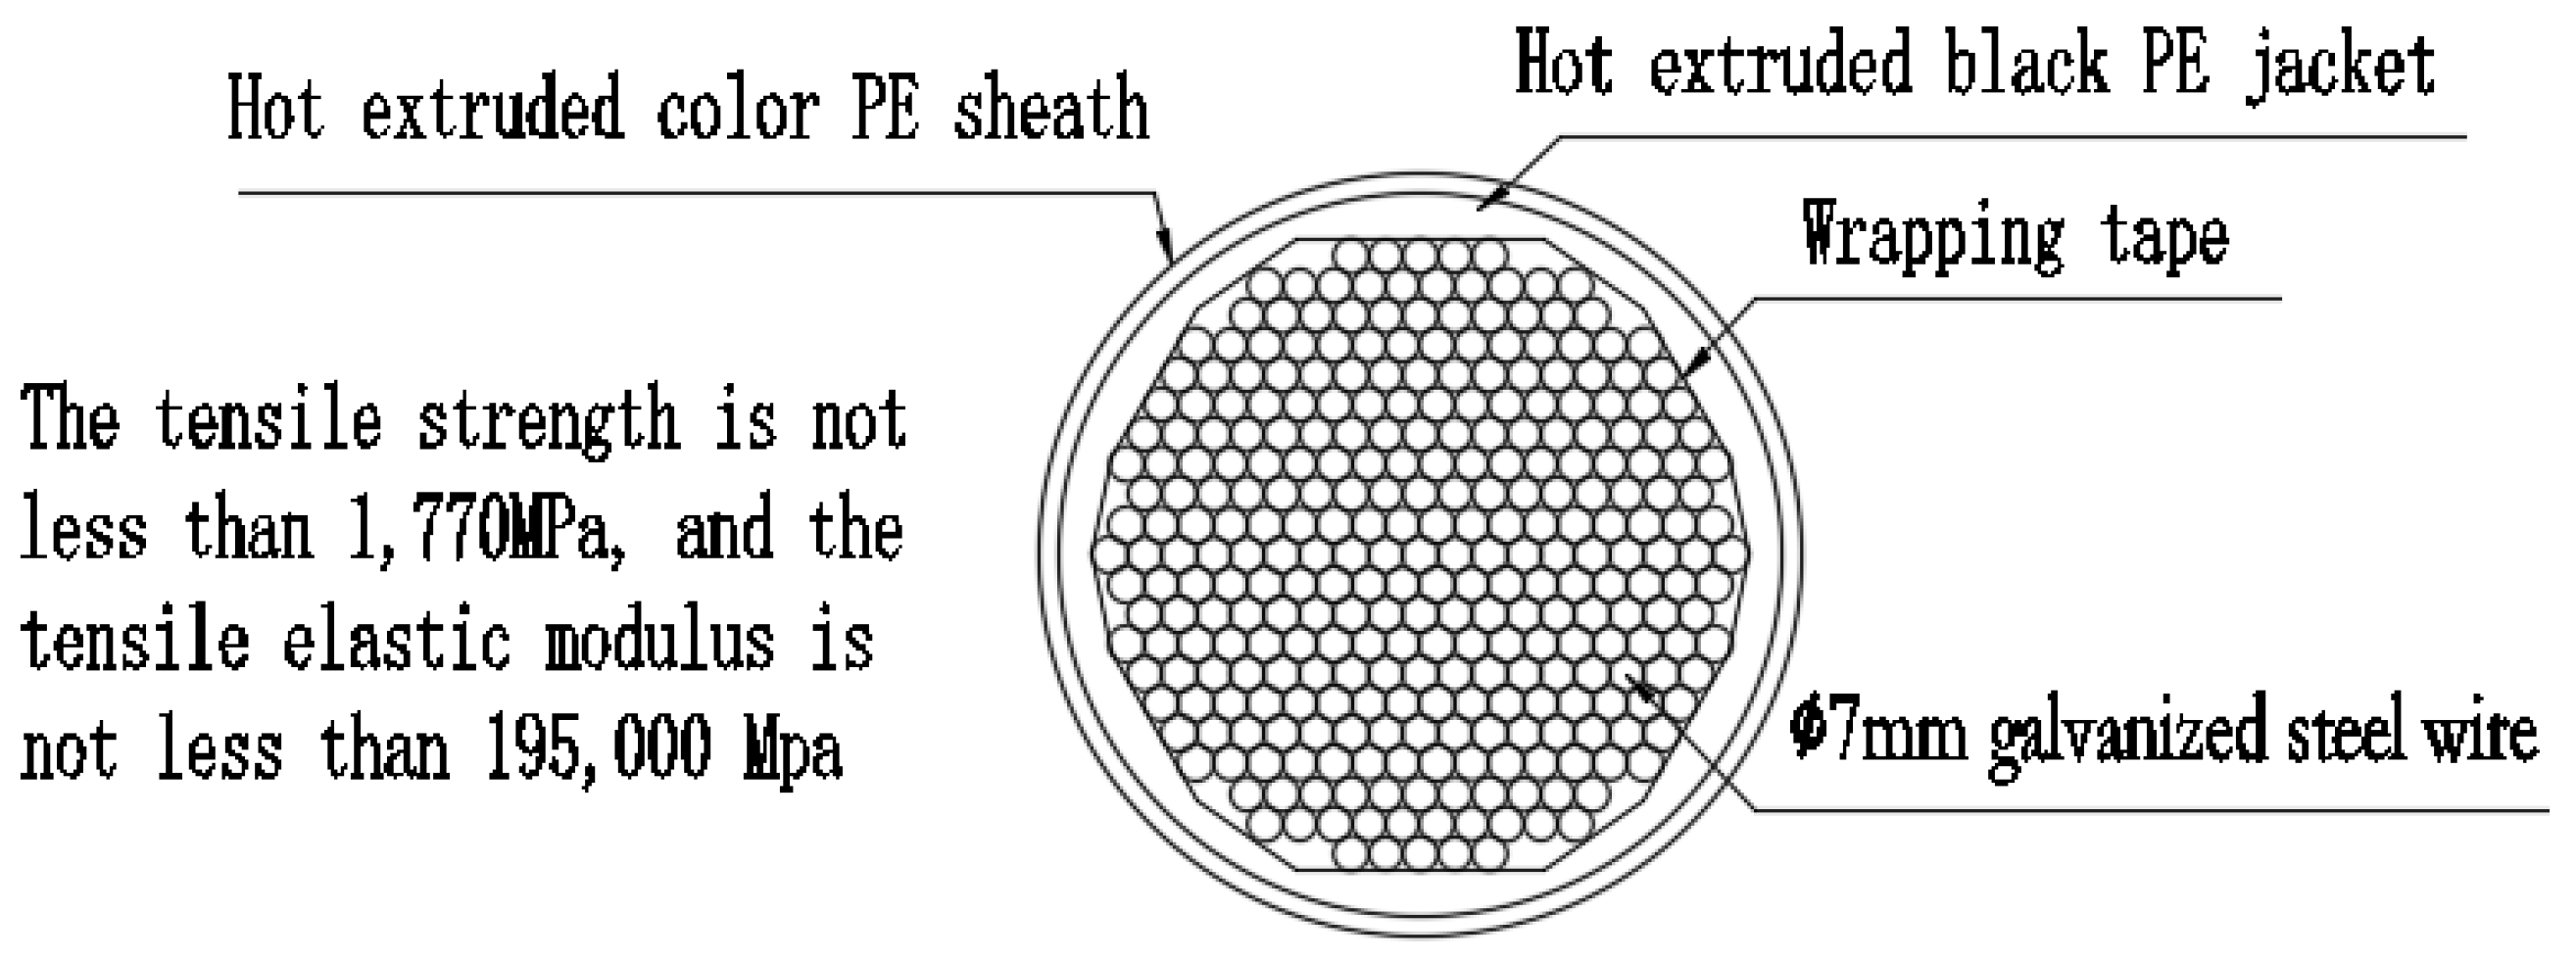
3.1. Project Profile

The Nanjimen Yangtze River Track Special Bridge connects Yuzhong District and Nan’an District and is an important link in the second phase project of Chongqing Rail Transit Line 10. The main bridge is a five-span double-cable plane and high-low tower cable-stayed bridge with a semi-floating system. The span arrangement of the main bridge is 34.5 + 180.5 + 480 + 215.5 + 94.5 m. The main girder is a SCCB, and the portal tower form is used. The bridge type layout, cross-section view of the main beam, the main tower, and the cable are shown in Figure 1, Figure 2, Figure 3 and Figure 4, respectively.

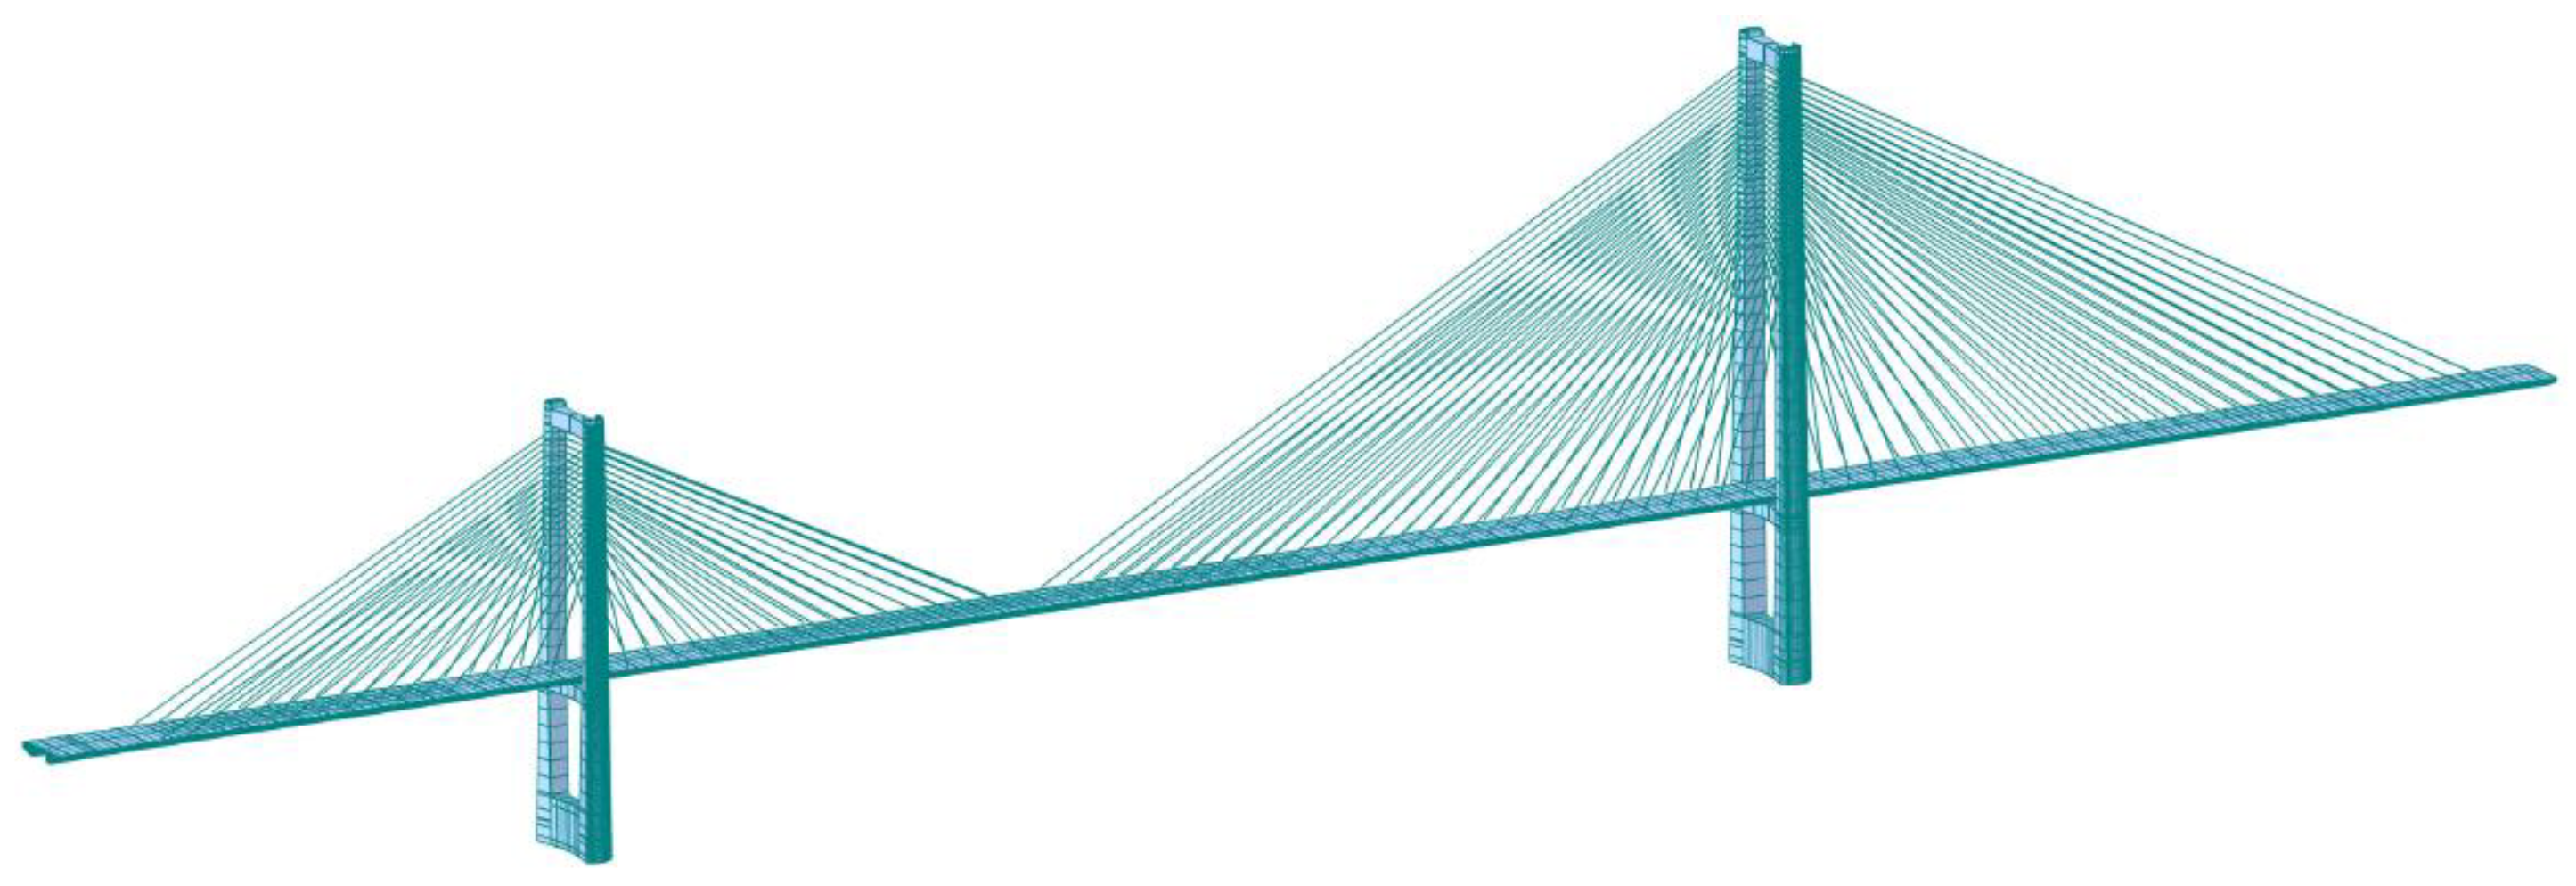
3.2. Finite Element Analysis

MIDAS/Civil was used to carry out the FE numerical analysis model of the Nanjimen Yangtze River Track Special Bridge (Figure 5). The model used beam elements to simulate the main tower, pier, and main beam, and truss elements to simulate the cables. The boundary conditions of the model included complete consolidation between the main tower and the pier, a rigid connection between the main tower and the stay cable, and tri-directional restraint at the boundary of the auxiliary pier. In this model, the shrinkage and creep of concrete were considered, and the material properties given in the design drawings were used. At the same time, according to the “Code for Design of Railway Bridges and culverts” (TB10002-2017) issued by the National Railway Administration, the time-dependent characteristics were considered, and the software was used to automatically calculate the most adverse effects of shrinkage and creep loads.

3.3. Model Establishment

3.3.1. Selection of Parameters to Establish the Model

For the alignment analysis of large-span SCCB track cable-stayed bridges, it is necessary to select suitable random parameters and obtain the average value and coefficient of variation of these parameters. In this study, the random parameters and their statistical characteristics were selected considering the environmental factors, actual situation on the site, applicable standards and specifications, and other factors of the Nanjimen Yangtze River Track Special Bridge. The statistical characteristics of the random parameters are shown in Table 1, where X1 is the strength of the main beam, X2 is the mean annual humidity of the main beam environment, X3 is the concrete age at the beginning of main beam shrinkage, X4 is the strength of the main tower, X5 is the mean annual humidity of the main tower environment, X6 is the concrete age at the beginning of the main tower shrinkage, X7 is the volume weight of the main beam, and X8 is the volume weight of the main tower.

3.3.2. Selection of Samples to Establish the Model

To study the long-term deformation of the entire bridge, six different time nodes were selected for analysis, namely, 1/2 year, 1 year, 2 years, 3 years, 5 years, and 10 years since the bridge completion. The vertical deformation of the mid-span position of the main span for these time nodes was studied. The structural influence values were denoted as S1/2, S1, S2, S3, S5, and S10, respectively, and the uniformity experiment was carried out according to the uniform design table of U8(88). Eight sample points were obtained by testing each set of data, with the deformation of the main beam defined as negative when vertically downward and positive when vertically upward. In this way, the sample points of the uniform design (Table 2) and the structural response data were obtained (Table 3).

3.4. Response Surface Analysis

3.4.1. Response Surface Model Fitting

By fitting the data in Table 2 and Table 3 with the least square method, six response models were obtained, which are expressed as:
S 1 / 2 = 237.4451 + 0.6211 X 1 + 0.4659 X 2 + 0.4235 X 3 + 0.6655 X 4 + 0.7896 X 5 + 0.3584 X 6 + 0.8470 X 7 + 0.8470 X 8
S 1 = 403.5580 + 1.0634 X 1 + 0.7976 X 2 + 0.7251 X 3 + 1.1394 X 4 + 1.3518 X 5 + 0.6135 X 6 + 1.4501 X 7 + 1.4501 X 8
S 2 = 638.1748 + 1.6983 X 1 + 1.2737 X 2 + 1.1579 X 3 + 1.8196 X 4 + 2.1589 X 5 + 0.9798 X 6 + 2.3159 X 7 + 2.3159 X 8
S 3 = 883.0270 + 2.3753 X 1 + 1.7814 X 2 + 1.6195 X 3 + 2.5449 X 4 + 3.0194 X 5 + 1.3703 X 6 + 3.2390 X 7 + 3.2390 X 8
S 5 = 1262.020 + 3.4276 X 1 + 2.5707 X 2 + 2.3370 X 3 + 3.6724 X 4 + 4.3571 X 5 + 1.9774 X 6 + 4.6740 X 7 + 4.6740 X 8
S 10 = 1879.095 + 5.1519 X 1 + 3.8639 X 2 + 3.5127 X 3 + 5.5199 X 4 + 6.5490 X 5 + 2.9723 X 6 + 7.0253 X 7 + 7.0253 X 8

3.4.2. Response Surface Model Validation

To verify the statistical relationship between the structure and the selected random variables, the accuracy of the six fitted response surface models was tested. The results are shown in Table 4.
As shown in Table 4, the average value of the six response surfaces is 0.9091. More than 90% is due to changes in the model parameters, indicating that the model has high fitting accuracy and is more reliable.

3.5. Deformation Data Analysis

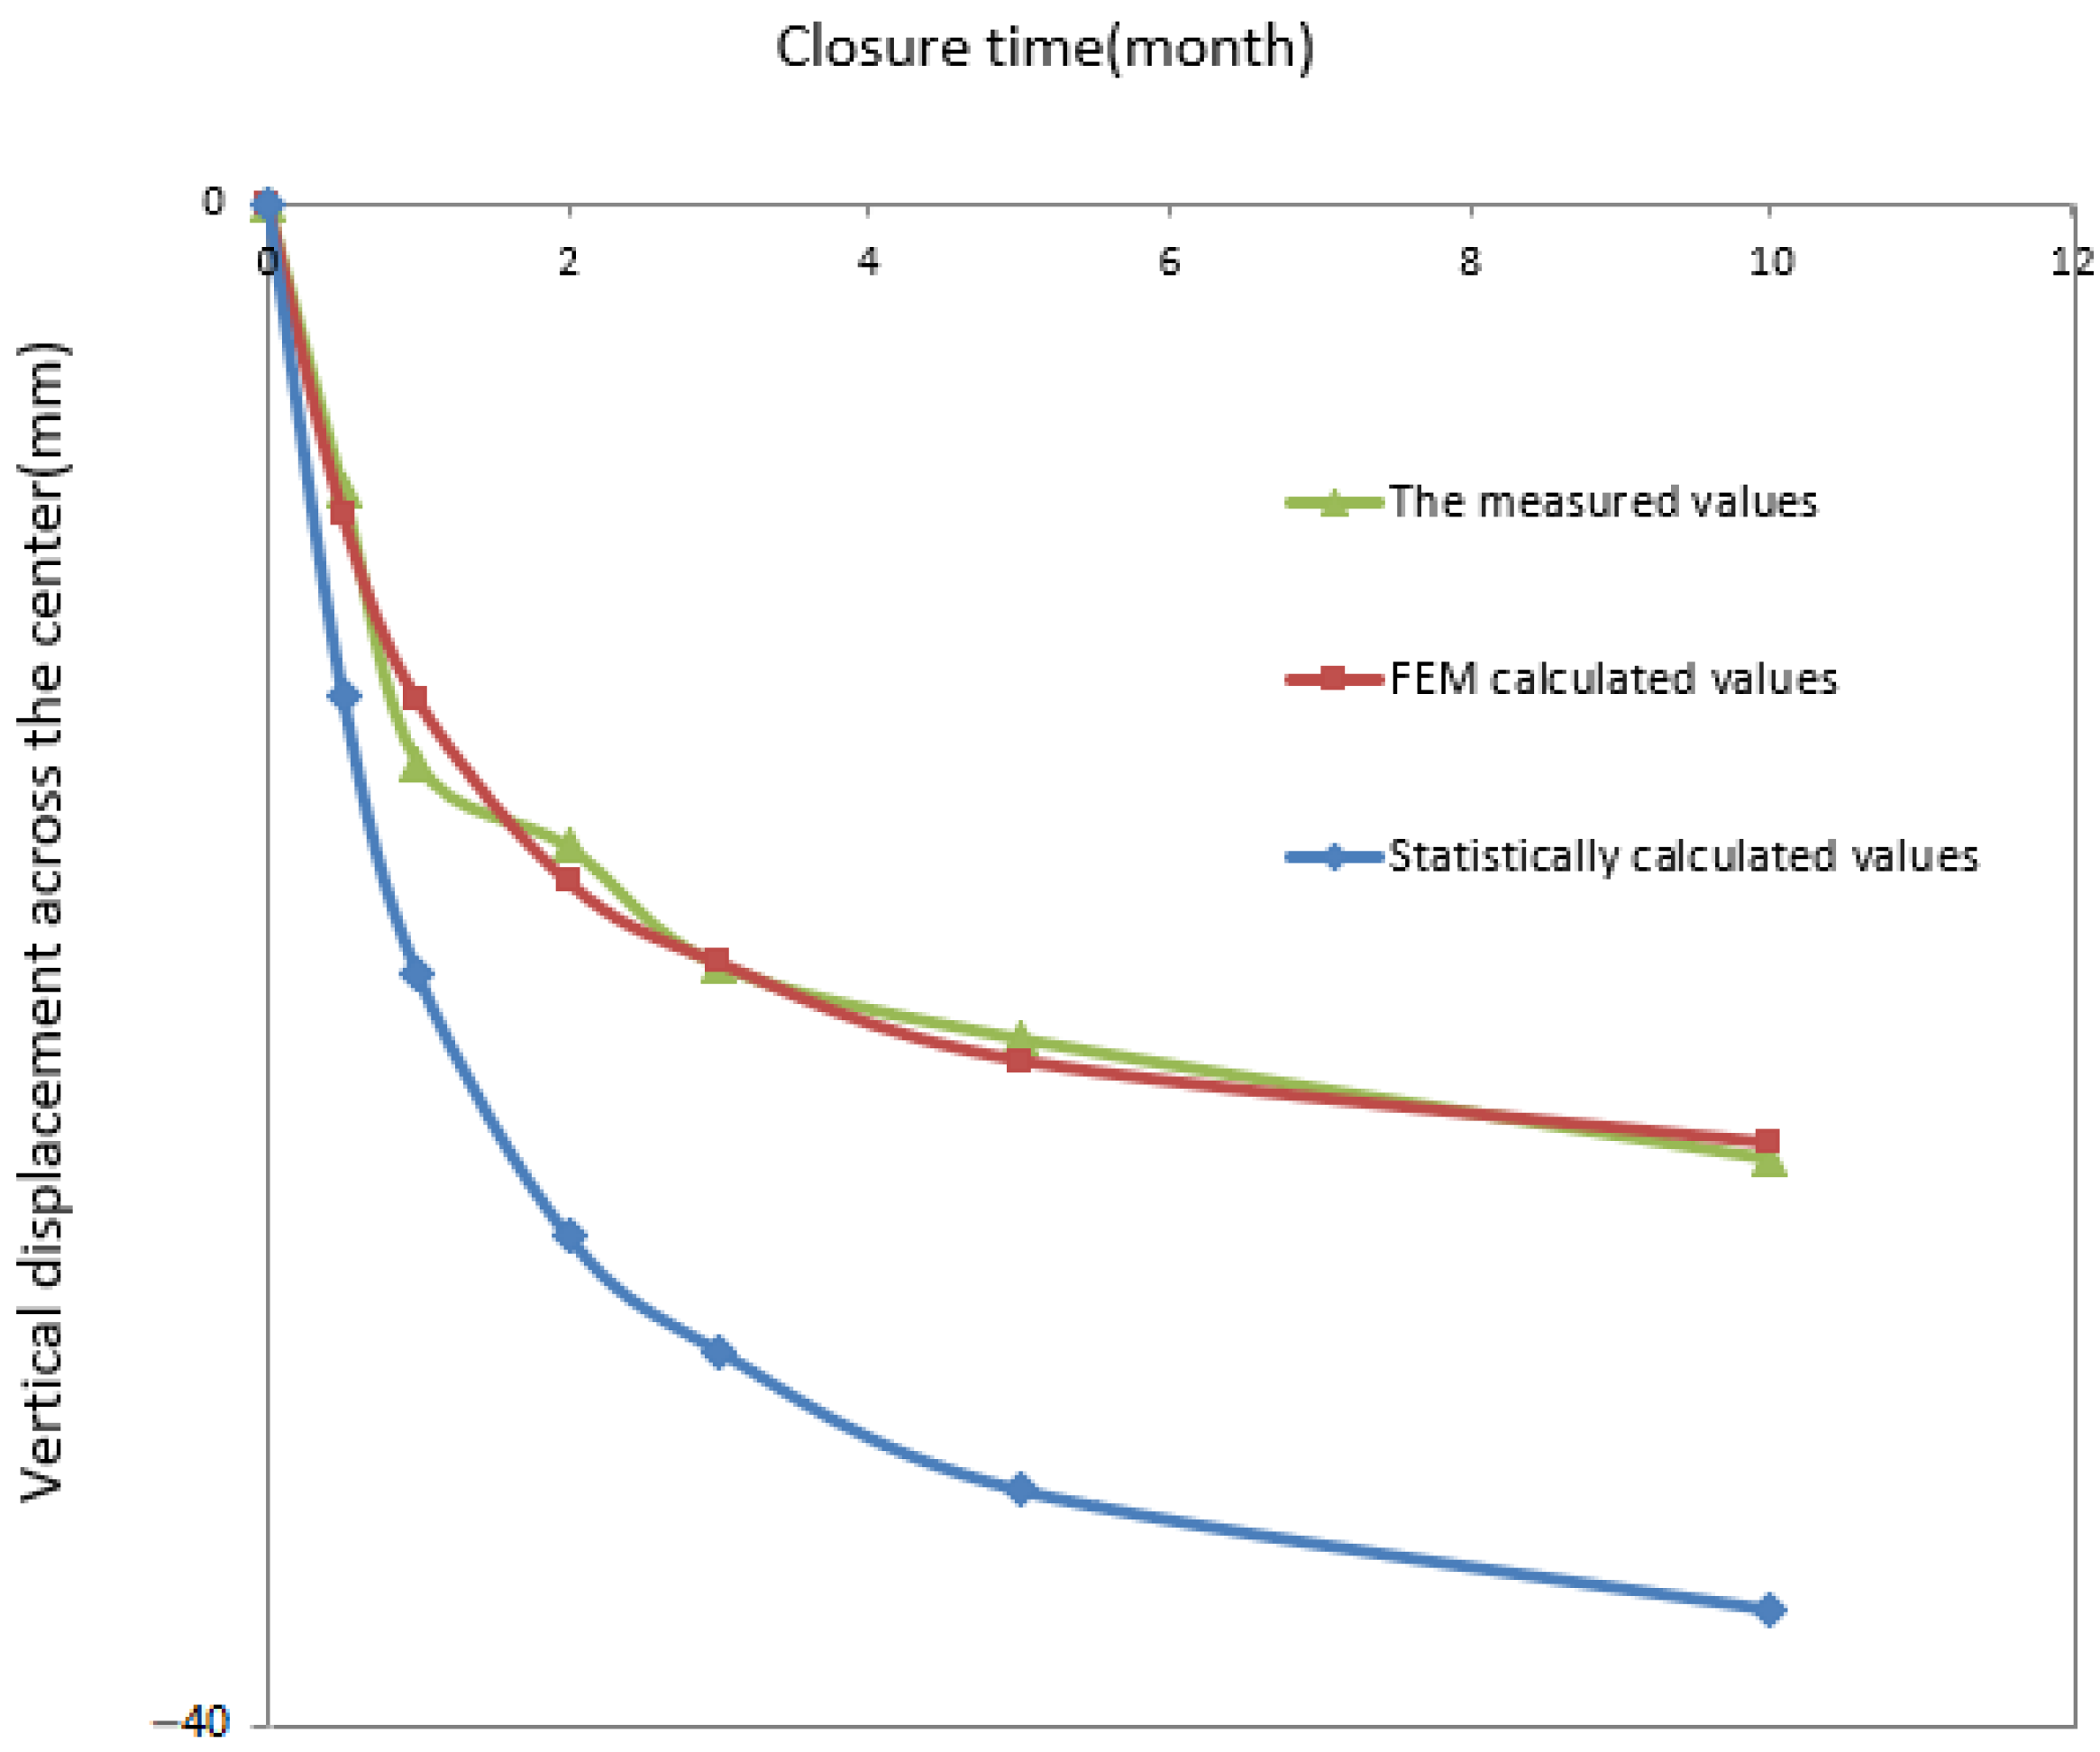
3.5.1. Deformation Data Analysis since Closure of the Main Span

To verify the applicability of the method, the measured values, FEM calculated values and statistically calculated values (calculated by the MC-RSM method) of the vertical deformation data since closure of the main span were compared and analyzed. The measured deformation data was obtained from the health monitoring system (HMS) of Nanjimen Yangtze River Track Special Bridge. Using phase shift regression analysis, an empirical regression equation [28,29] was established to exclude the influence of temperature effects, and then compared with the calculation results. The results are shown in Figure 6.
As shown in Figure 6, the measured values of vertical deformation in the mid-span since closure of the main-span are relatively close to the FEM calculated values, with small fluctuations around the FEM calculated values. However, the engineering prediction values are low due to the fluctuation. At the same time, the statistically calculated values obtained by the MC-RSM method envelop the measured values. Although there is a gap between the statistically calculated and measured values, the statistically calculated values are more certain because they focus on the calculation and analysis of the sample data, and there is also some defect tolerance while maintaining accuracy and reliability. In addition, the statistically calculated values only consider some of the influencing factors and cannot include all the actual influencing factors, leading to partial deviation of the calculated results. If there were more factors studied, the statistically calculated results would be closer to the actual situation.

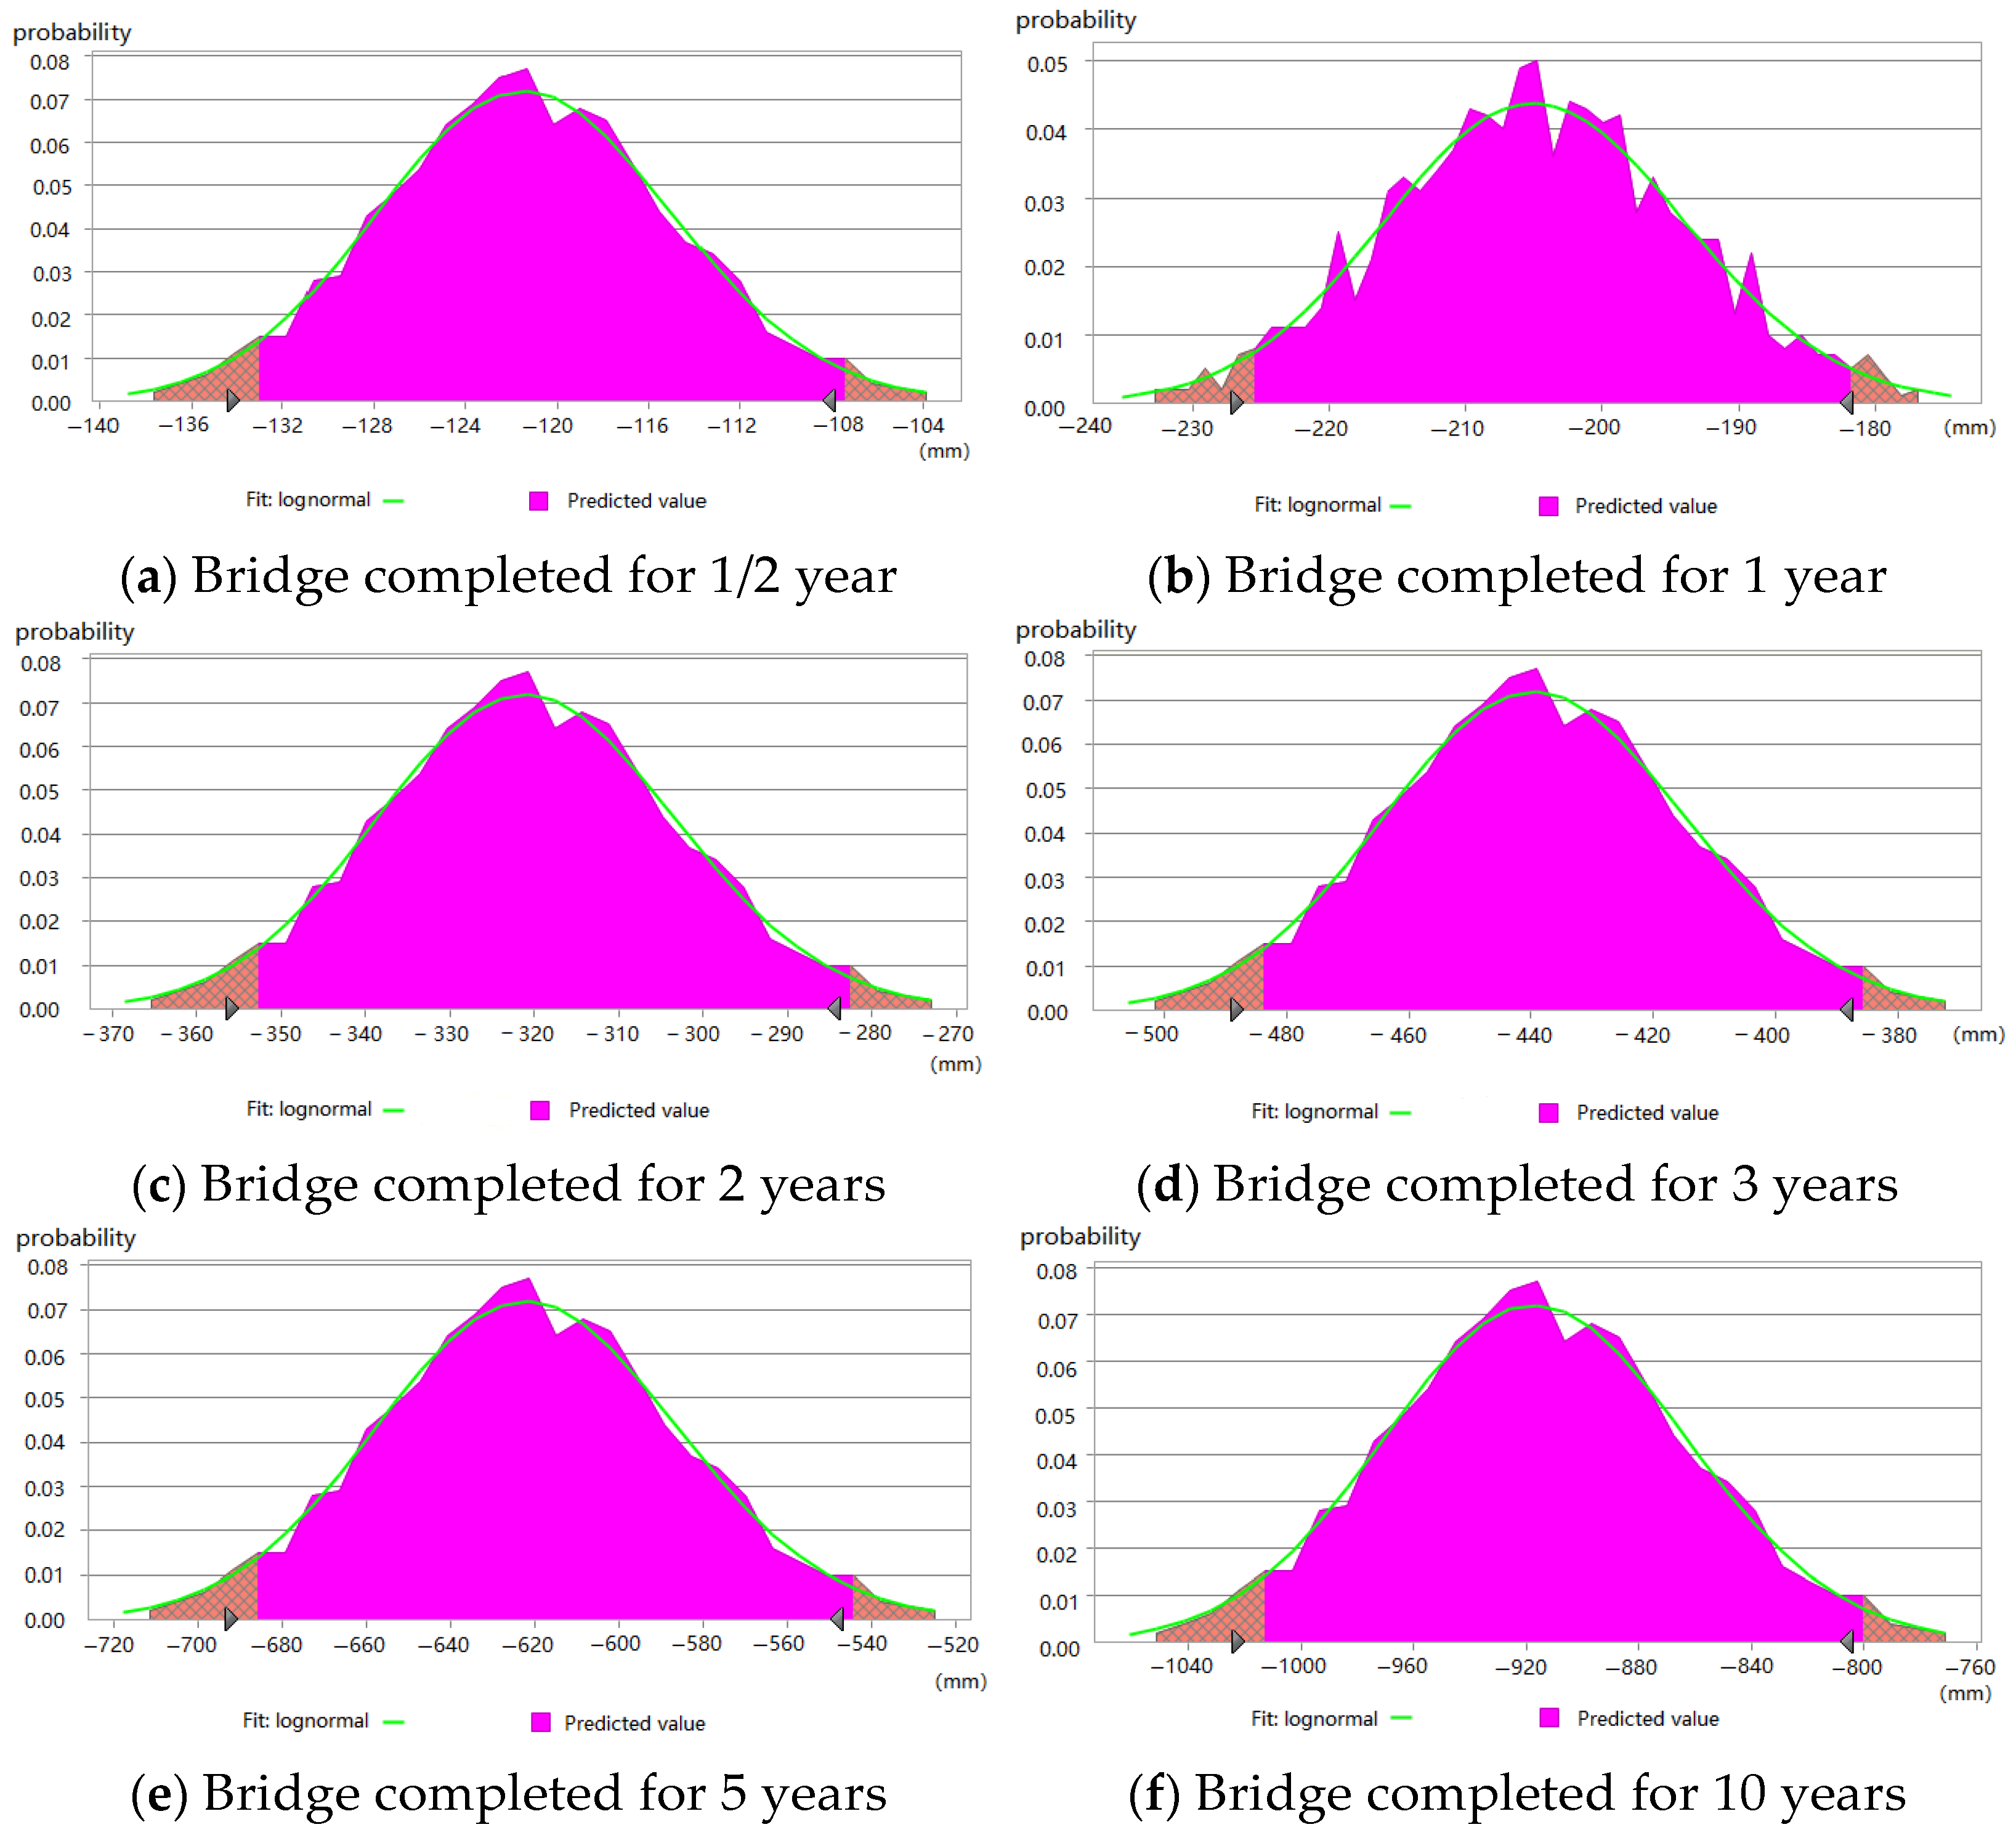
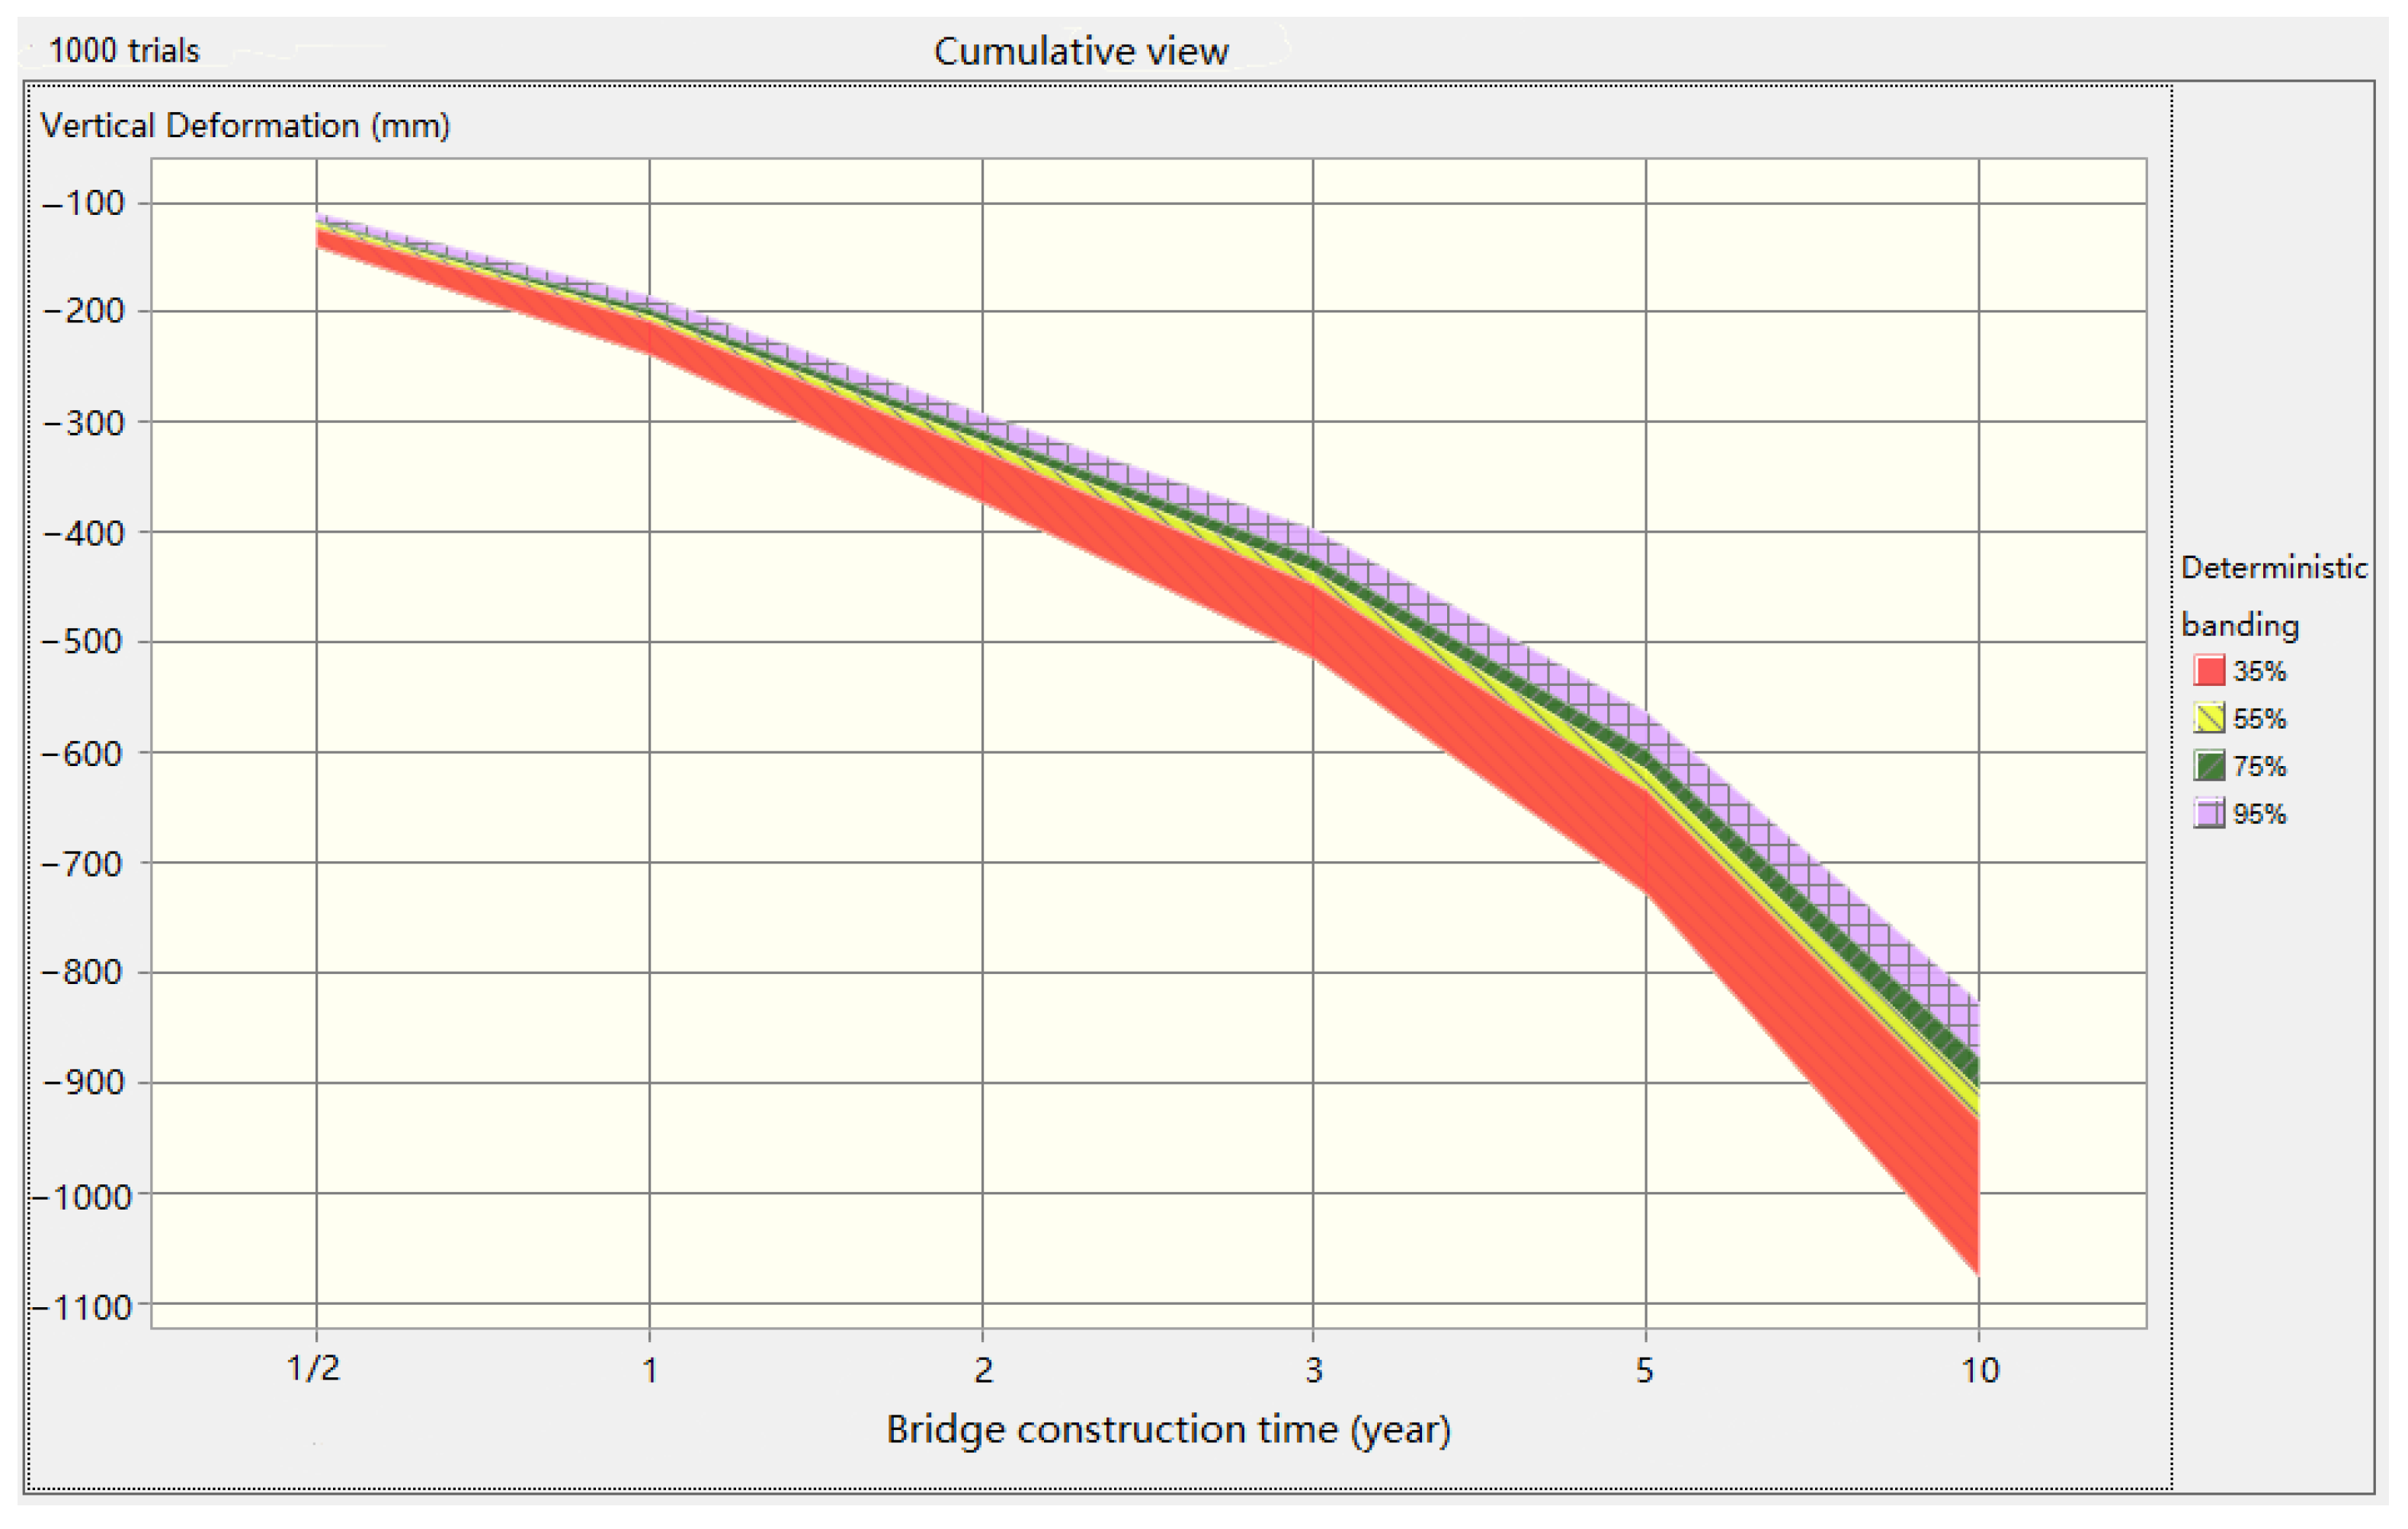
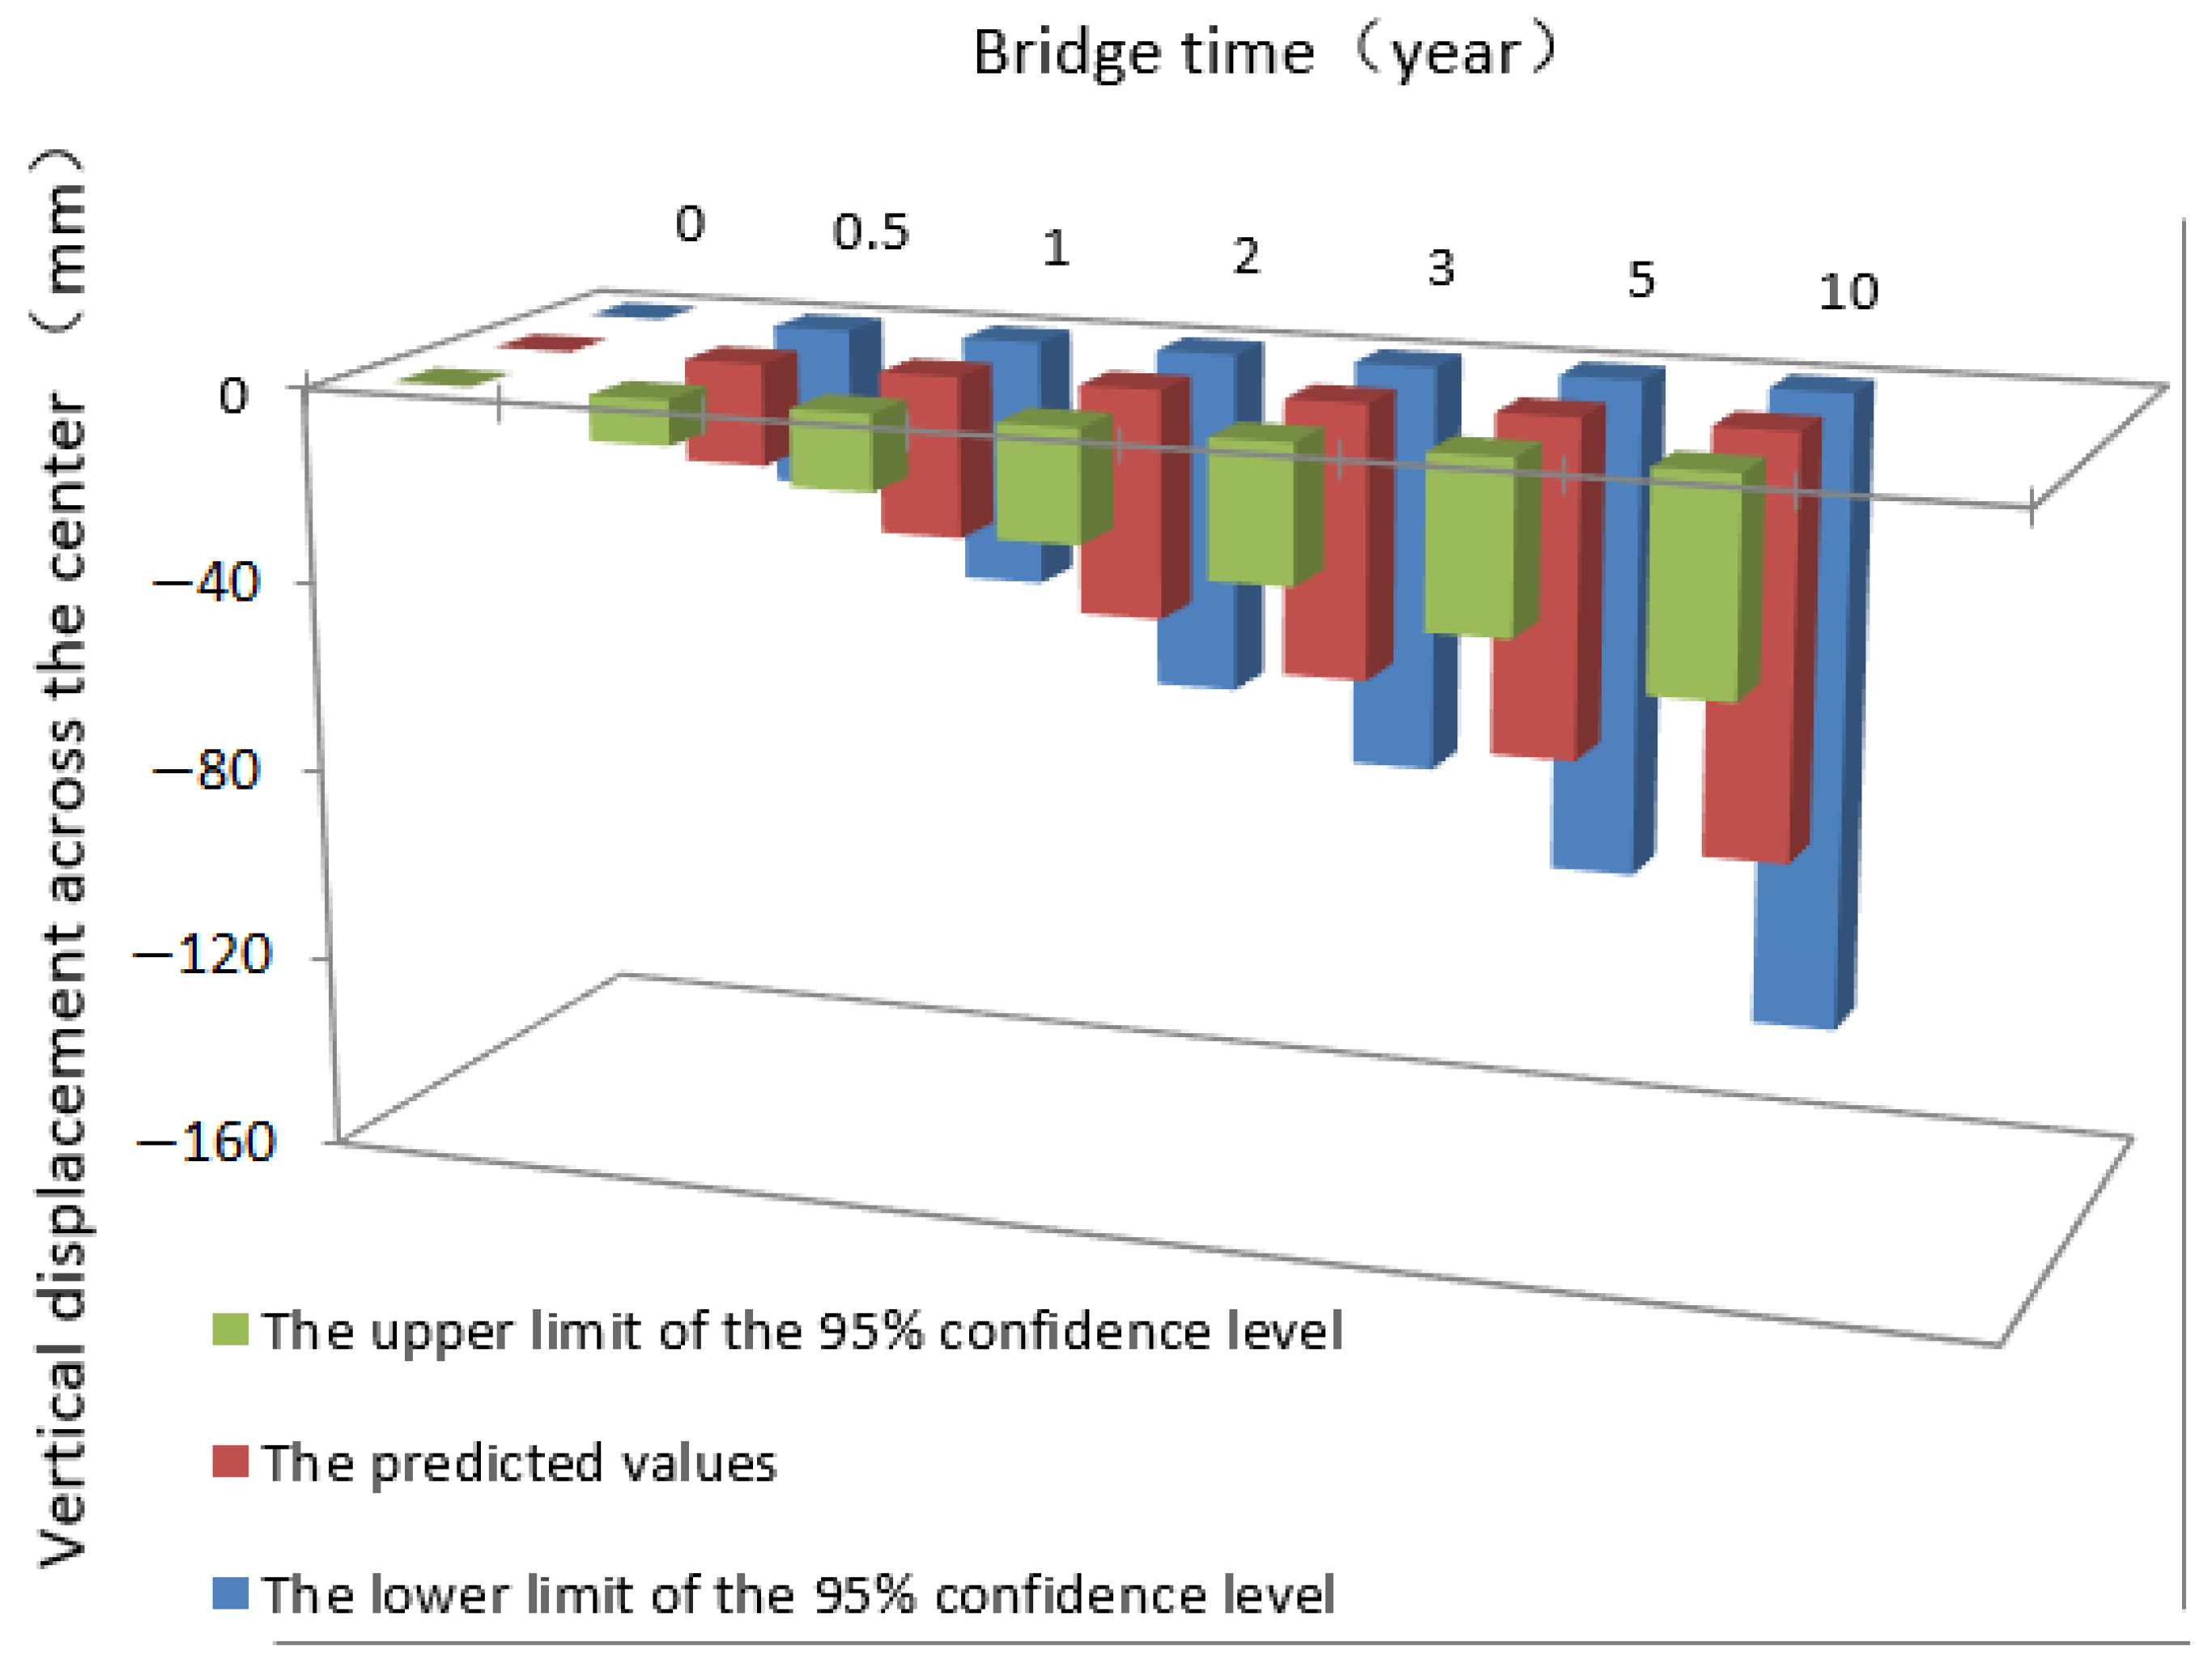
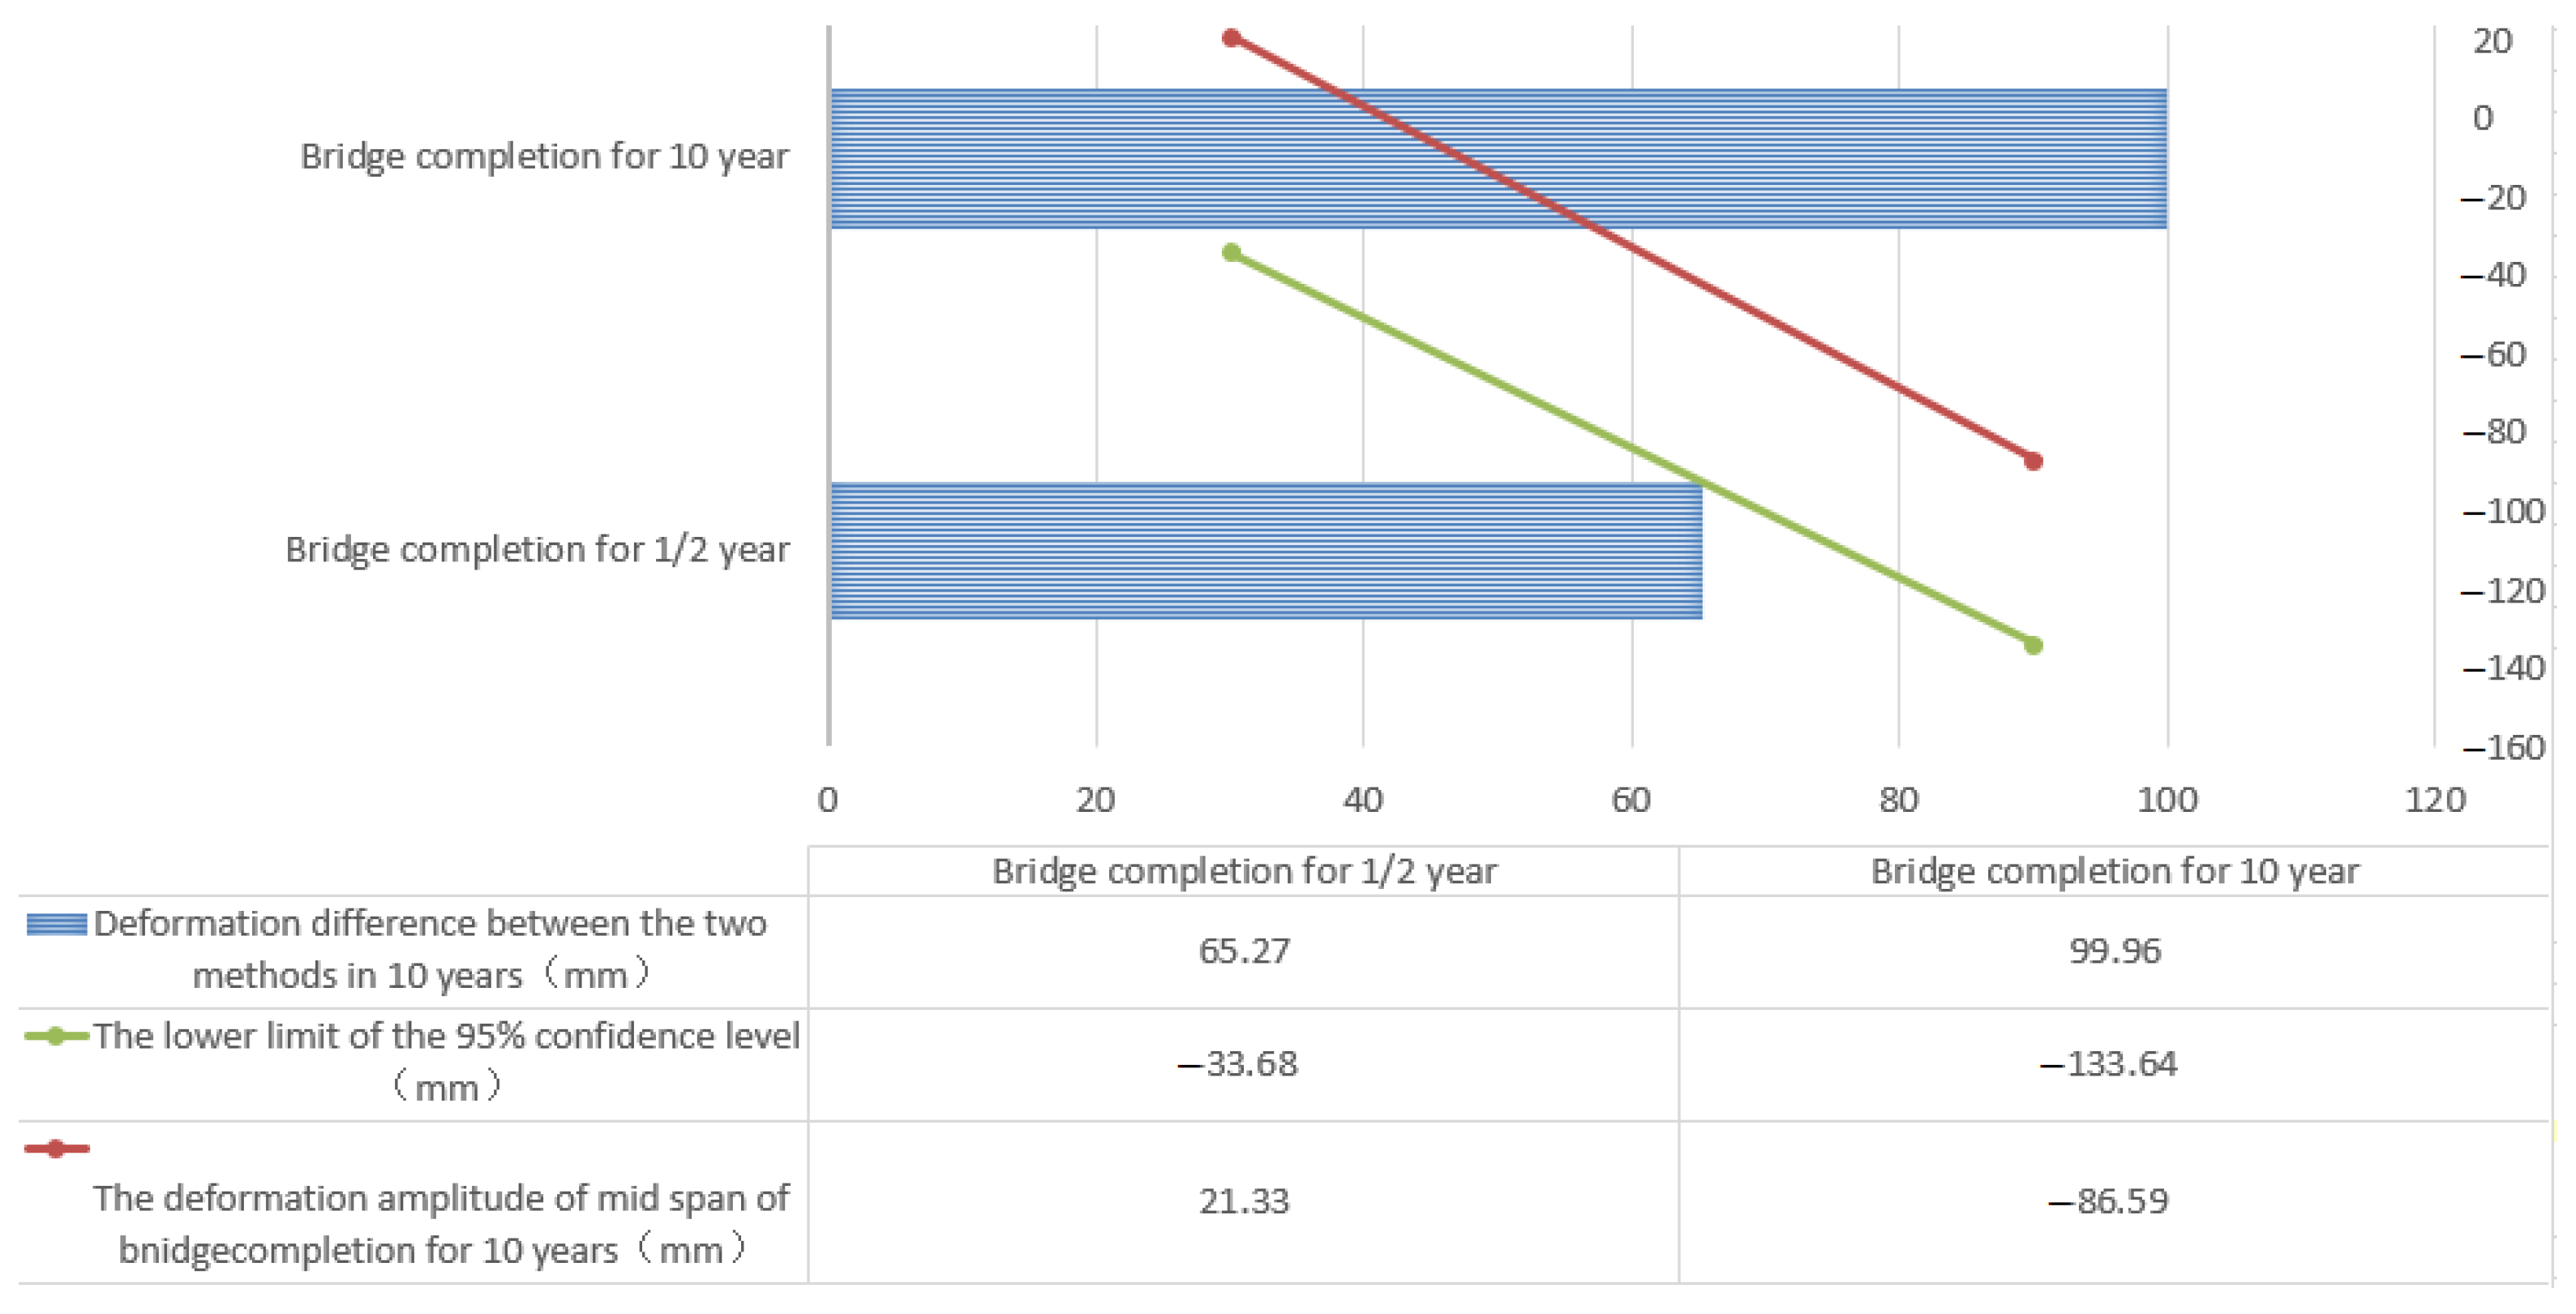
3.5.2. Predictive Analysis of Deformation after Bridge Completion

When predicting deformation at the mid-span of the main span, the MC method was applied, selecting a sample number of 10,000. The shrinkage and creep of the Nanjimen Yangtze River Track Special Bridge were analyzed randomly based on the variability of the material parameters. The average value and standard deviation of vertical deformation at the mid-span of the main span were analyzed by selecting six time nodes from 1/2 year to 10 years after bridge completion. The results are shown in Table 5.
Table 5 shows that the difference between the design expected values and the average values (obtained by sampling statistical analysis) is small, according to the parameters selected in this paper. It shows that the maximum vertical deformation at the mid-span of the main span can be well predicted. Furthermore, it can be seen that the standard value increases over time, indicating the discreteness of the deformation increment gradually increases.
The MC method obtained the probability distribution of vertical deformation at different time nodes, with the distribution results shown in Figure 7. The confidence levels under five representative percentages were selected, which were 35%, 55%, 75%, and 95%, respectively.
The vertical deformation predicted interval at each chosen time node for different random factors was plotted for these five different confidence levels. Figure 8 shows the results for the vertical deformation of different deformation intervals in 10 years.
Furthermore, the predicted values obtained by the FE calculation were compared with the confidence interval at the 95% confidence level. The predicted values for vertical deformation at the mid-span of the main span were obtained using MIDAS/Civil considering different time nodes after bridge completion. Under the same random parameters, the confidence intervals at the 95% confidence level were obtained by the MC method sampling, and the comparison results are shown in Figure 9.
Figure 9 illustrates that the predicted values obtained by the proposed model fall within the 95% confidence interval, demonstrating the high accuracy of the parameter distribution and analysis method. The 10-year deformation amplitude of the bridge calculated by the finite element software and the variation value of the lower limit of 95% confidence level are shown in Figure 10. It can be seen that the 10-year deformation interval calculated by the finite element software is (−86.5963, −21.3299) mm, and the variation value is 65.2664 mm. Using the uncertainty analysis method of MC-RSM, the variation interval of the lower limit of the 95% confidence level is (−133.64, −33.68) mm, and the variation amplitude of the lower limit of the 95% confidence level is 99.96 mm. The deformation difference between the two methods increased from 12.35 mm at half a year to 47.04 mm at 10 years. The deformation amplitude of the mid-span of the bridge at 10 years after completion (calculated by the FE method) and the lower limit of the 95% confidence level (predicted by the MC-RSM method) and the deformation difference obtained by the two methods in 10 years are shown in Figure 10. The vertical deformation at the mid-span of the main span is relatively discrete, resulting in small calculation values by the FE method, which is due to the influence of parameter randomness. It can be concluded that environmental factors, material factors, and other factors should be considered comprehensively when analyzing the alignment of large-span track SCCB cable-stayed bridges.

4. Conclusions

In this paper, an alignment prediction of a large-span track SCCB cable-stayed bridge was carried out by RSM considering the environmental factors, actual situation on site, applicable standards and specifications of the Nanjimen Yangtze River track Special Bridge. The deformation change of eight factors under the influence of randomness was discussed. The following main conclusions were obtained.
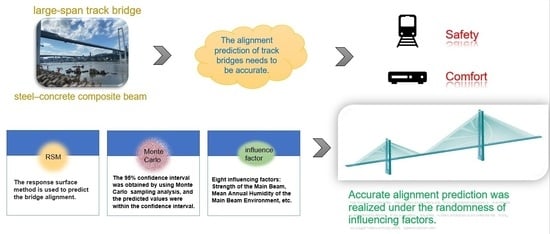
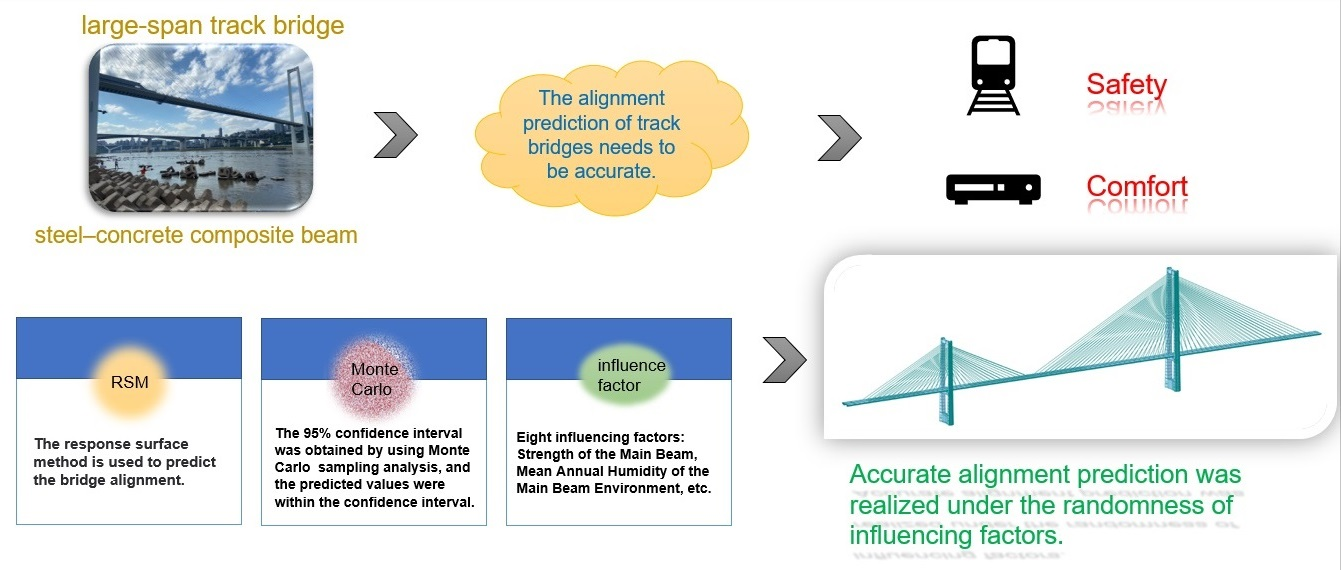
  • Combining different influencing factors with the alignment of the entire large-span track SCCB cable-stayed bridge, the RSM method was used to solve the problem of low accuracy of alignment prediction for large-span SCCB track cable-stayed bridges. Accurate alignment prediction was realized under the randomness of influencing factors.
  • The MC method was combined with the RSM method for analysis. The partial least squares method was used to verify the analysis according to the influencing factors combined with the uniform design method. The long-term deformation for different years after bridge completion was predicted. In addition, the finite element calculated value interval of (−86.5963, −21.3299) mm is included in the 95% confidence interval of (−133.64, −33.68) mm.
  • RSM can be used to analyze different influencing factors. In this paper, eight influencing factors, such as the strength of the main beam, were analyzed, to realize the alignment prediction of the bridge. In addition, other influencing factors could be analyzed and studied quickly and effectively through this method, reducing the test cost and time, and improving work efficiency.
  • RSM was used to predict and analyze the alignment of SCCB cable-stayed bridges, and the predicted values at different years over 10 years were obtained. Alignment prediction is an important consideration in the field of bridge health monitoring. The prediction method based on RSM provides a theoretical basis and engineering application reference for reasonable alignment control and state evaluation of bridges.
Due to the limited space, only the randomness of the eight influencing factors of the bridge was analyzed and studied in this paper, which resulted in the deviation between the predicted results and the actual results. To obtain more accurate results, further research on more influencing factors is required.
In addition, the time since the bridge completion is relatively short, so the deformation data for only one year after closure of the main span have been compared in this paper. As more extended deformation data becomes available, further verification is needed.

Author Contributions

Conceptualization, X.L. and X.C.; methodology, P.D.; software, P.D.; validation, X.L., X.C. and P.D.; formal analysis, X.L.; investigation, S.T. and H.L.; resources, P.D and S.T.; data curation, P.D. and S.T.; writing—original draft preparation, H.L.; writing—review and editing, X.L. and X.C.; visualization, H.L.; supervision, X.L.; project administration, X.L. All authors have read and agreed to the published version of the manuscript.

Funding

This work was supported by the Open Fund of the Chongqing Key Laboratory of Energy Engineering Mechanics and Disaster Prevention and Mitigation (EEMDPM2021201) and the Chongqing Institute of Science and Technology Research Grant Program (CKRC2021074).

Institutional Review Board Statement

Not applicable.

Informed Consent Statement

Not applicable.

Data Availability Statement

Apart from the original traffic data that were collected through WIM systems, all of the other data, models, and the code that was generated or used during the study are available from the corresponding author by request.

Conflicts of Interest

The authors declare no conflict of interest.

References

  1. Ahad, A.P.; Xiong, F.; Yang, P.; Huang, D.; Reza, S.S. Comprehensive equation of local bond stress between UHPC and reinforcing steel bars. Constr. Build. Mater. 2020, 262, 119942. [Google Scholar]
  2. Ahad, A.P.; Zhang, Z.R.; Mojdeh, A.P.; Xiong, F.; Zhang, L.L.; Yang, Q.H.; Siti, J.M. UHPC-PINN-parallel micro element system for the local bond stress–slip model subjected to monotonic loading. Structures 2022, 46, 570–597. [Google Scholar]
  3. Xiong, S.Z. Structural Parameter Sensitivity Analysis of Cable-stayed Bridge with Composite Steel Beams. China Foreign Highw. 2016, 36, 159–162. [Google Scholar]
  4. Xin, J.; Jiang, Y.; Zhou, J.; Peng, L.; Liu, S.; Tang, Q. Bridge deformation prediction based on SHM data using improved VMD and conditional KDE. Eng. Struct. 2022, 261, 114285. [Google Scholar] [CrossRef]
  5. Lu, Z.Y.; Wang, X.M.; Zhao, B.J.; Ren, W.P. Construction alignment prediction of large span waveform steel web continuous rigid bridge based on MEC-BP agent model. J. Chang. Univ. (Nat. Sci. Ed.) 2021, 41, 53–62. [Google Scholar]
  6. Zhou, S.X.; Deng, F.M.; Han, Z.; Yu, L.H.; Wu, L.Q. Construction alignment prediction for large-span continuous bridges based on optimal limit learning machine. J. Railw. 2019, 41, 134–140. [Google Scholar]
  7. Chen, D.Y.; Yan, Q.S.; Zhu, S.Y. Gray prediction of spatial alignment of arch ribs of shaped arch bridges based on MGM(1,n) model. J. South China Univ. Technol. (Nat. Sci. Ed.) 2019, 47, 120–127. [Google Scholar]
  8. Li, S.L.; Zhu, S.Y.; Xu, Y.L.; Chen, Z.W.; Li, H. Long-term condition assessment of suspenders under traffic loads based on structural monitoring system: Application to the Tsing Ma Bridge. Struct. Control. Health Monit. 2012, 19, 82–101. [Google Scholar] [CrossRef]
  9. Li, S.L.; Wei, S.Y.; Bao, Y.Q.; Li, H. Condition assessment of cables by pattern recognition of vehicle-induced cable tension ratio. Eng. Struct. 2018, 155, 1–15. [Google Scholar] [CrossRef]
  10. Li, S.; Xin, J.; Jiang, Y.; Wang, C.; Zhou, J.; Yang, X. Temperature-induced deflection separation based on bridge deflection data using the TVFEMD-PE-KLD method. J. Civ. Struct. Health Monit. 2023. [Google Scholar] [CrossRef]
  11. Zhang, H.; Li, H.; Zhou, J.; Tong, K.; Xia, R. A multi-dimensional evaluation of wire breakage in bridge cable based on self-magnetic flux leakage signals. J. Magn. Magn. Mater 2023, 566, 170321. [Google Scholar] [CrossRef]
  12. Yang, H.; Ran, M.Y. Analysis and prediction of building energy consumption based on BPT-MLR model. J. Huaqiao Univ. (Nat. Sci. Ed.) 2023, 3, 1–9. [Google Scholar]
  13. Li, Y.Q.; Liu, X.H.; Chen, Z.L.; Zhang, H. Model modification of cable-stayed bridge based on cable force response surface method. J. China Railw. Soc. 2021, 43, 168–174. [Google Scholar]
  14. Ma, Y.P.; Liu, Y.J.; Liu, J. Multi-scale finite element model correction of steel tube concrete composite truss bridge based on response surface method. China J. Highw. Transp. 2019, 32, 51–61. [Google Scholar]
  15. Xin, J.Z.; Zhou, J.T.; Yang, Y.; Zhong, J.H.; Niu, Y.F. Application of response surface method in long-term deformation prediction of cable-stayed bridge tower with large-span. J. Jiangsu Univ. (Nat. Sci. Ed.) 2016, 37, 367–372. [Google Scholar]
  16. Liu, J.; Yan, C.; Fang, Q.Z.; Liu, C.Y. Reliability analysis of long-span bridge based on the combination of response surface method and JC method. Bridge Constr. 2022, 52, 32–38. [Google Scholar]
  17. Tarhouni, I.; Frómeta, D.; Casellas, D.; Costa, J.; Maimí, P. Assessing the effect of the experimental parameters in the evaluation of the essential work of fracture in high-strength thin sheets. Eng. Fract. Mech. 2022, 270, 106949. [Google Scholar] [CrossRef]
  18. Ye, C.L.; He, S.X.; Hou, Y.L. The Design of Simple Axial Tensile Testing Instrument and Experimental Study of Reasonable Sample Size. Railw. Stand. Des. 2016, 60, 9–15. [Google Scholar]
  19. Ye, D.; Xu, Z.; Liu, Y.Q. Solution to the problem of bridge structure damage identification by a response surface method and an imperialist competitive algorithm. Sci. Rep. 2022, 12, 16495. [Google Scholar] [CrossRef]
  20. Liu, J.; Wang, H.L.; Zhang, Z.G.; Lv, P. Research on damage recognition response surface model and optimization algorithm of cable-stayed bridge. Railw. Constr. 2016, 15, 2347. [Google Scholar]
  21. Wang, Y.B.; Wang, L. Finite Element Model Modification of an Arch Bridge Based on Response Surface Method. In IOP Conference Series: Materials Science and Engineering; IOP Publishing: Bristol, UK, 2020; Volume 782. [Google Scholar]
  22. Miao, C.Q.; Zhuang, M.L.; Dong, B. Environment—Environmental Factors; Data on Environmental Factors Reported by Researchers at Southeast University (Stress Corrosion of Bridge Cable Wire by the Response Surface Method). Ecol. Environ. Conserv. 2019, 51, 646–652. [Google Scholar]
  23. Hong, X.J.; Zhang, X.S.; Guo, N.; Li, H.M. Application of optimized fractional order GM(1,1) model in bridge linear control. J. Chongqing Jiaotong Univ. (Nat. Sci. Ed.) 2022, 41, 65–70. [Google Scholar]
  24. Jiang, Y.; Hui, Y.; Wang, Y.; Peng, L.; Huang, G.; Liu, S. A novel eigenvalue-based iterative simulation method for multi-dimensional homogeneous non-Gaussian stochastic vector fields. Struct. Saf. 2023, 100, 102290. [Google Scholar] [CrossRef]
  25. Li, X.G.; Ding, P.; Zhou, J.T.; Chen, X.H.; Qi, Y. Linear prediction analysis of cable-stayed bridge of long-span rail transit considering parameter randomness. Railw. Archit. 2019, 59, 64–69. [Google Scholar]
  26. Chen, Z.S.; KT, T.; Liu, S.M.; Zhou, J.T.; Zeng, Y. Application of a self-adaptive Kalman filter approach in alignment control for an extra long span rail transit cable-stayed bridge. Struct. Infrastruct. Eng. 2017, 13, 1186–1197. [Google Scholar] [CrossRef]
  27. Chen, Z.S.; Zhou, J.T.; Kim, T.T.; Hu, G.; Li, Y.; Wang, X. Alignment control for a long span urban rail-transit cable-stayed bridge considering dynamic train loads. Sci. China Technol. Sci. 2016, 59, 1759–1770. [Google Scholar] [CrossRef]
  28. Veselov, I.V.; Gamlitskiy, Y.A. Engineering Method of Modeling and Optimization of Chemical-Technological Processes. Russ. Sci. J. 2017, 5, 56–65. [Google Scholar]
  29. Liu, S.M.; Liu, F.P.; Liu, L. Bridge Structural Safety Assessment Technology Based on Statistic Analysis. Appl. Mech. Mater. 2012, 1802, 2486–2491. [Google Scholar] [CrossRef]
Figure 1. The bridge type layout of Nanjimen Yangtze River Track Special Bridge (unit: mm).
Buildings 13 00882 g001
Figure 2. Cross-sectional view of the main beam (unit: mm).
Buildings 13 00882 g002
Figure 3. Cross-sectional view of the main tower (unit: mm).
Buildings 13 00882 g003
Figure 4. Cross-sectional view of the cable.
Buildings 13 00882 g004
Figure 5. The FEM numerical analysis model of the Nanjimen Yangtze River Track Special Bridge.
Buildings 13 00882 g005
Figure 6. Comparison of vertical deformation at the mid-span of the main span.
Buildings 13 00882 g006
Figure 7. Probability distribution of vertical deformation at different time nodes.
Buildings 13 00882 g007
Figure 8. Vertical deformation predicted interval at different confidence levels.
Buildings 13 00882 g008
Figure 9. Prediction of vertical deformation at the mid-span of the main span (unit: mm).
Buildings 13 00882 g009
Figure 10. Comparison of 10-year deformation amplitude (unit: mm).
Buildings 13 00882 g010
Table 1. Statistical characteristics of random parameters.
Statistical CharacteristicsStrength of the Main Beam X1/(N/mm2)Mean Annual Humidity of the Main Beam Environment X2/(%)Concrete Age at the Beginning of Main Beam Shrinkage X3/(day)Strength of the Main Tower X4/(N/mm2)Mean Annual Humidity of the Main Tower Environment X5/(%)Concrete Age at the Beginning of the Main Tower Shrinkage X6/(day)Volume Weight of the Main Beam X7/(N/mm3)Volume Weight of the Main Tower X8/(N/mm3)
Type of distributionNormal distributionNormal distributionNormal distributionNormal distributionNormal distributionNormal distributionNormal distributionNormal distribution
Average value60793507932626
Coefficient of variation0.150.200.220.140.120.260.110.11
Table 2. Sample points based on uniform design.
Serial NumberX1/(N/mm2)X2/(%)X3/(day)X4/(N/mm2)X5/(%)X6/(day)X7/(N/mm3)X8/(N/mm3)
159.4078.22.1249.4478.5301.9625.5625.56
259.5578.42.3449.5878.6482.2225.6725.67
359.7078.62.5649.7278.7662.4825.7825.78
459.8578.82.7849.8678.8842.7425.8925.89
560.0079.03.0050.0079.0023.0026.0026.00
660.1579.23.2250.1479.1203.2626.1126.11
760.3079.43.4450.2879.2383.5226.2226.22
860.4579.63.6650.4279.3563.7826.3326.33
Table 3. Structural response data (mm).
Serial NumberS1/2S1S2S3S5S10
1−21.810−37.231−50.194−61.070−76.402−98.043
2−22.271−34.782−50.784−61.656−77.336−99.256
3−22.732−35.310−51.350−62.803−78.614−100.498
4−23.231−35.639−52.549−64.103−80.249−101.795
5−25.981−39.213−55.915−67.192−83.015−104.833
6−25.245−38.547−55.291−66.585−82.416−104.202
7−17.659−27.846−36.506−41.716−48.309−55.856
8−14.690−24.974−33.767−39.047−45.754−52.834
Table 4. Accuracy tests of response surface models.
ModelsR2ModelsR2
S1/20.8993S50.9455
S10.8714S100.9425
S20.8788Average value0.9091
S30.9173
Table 5. Random analysis results for deformation at the mid-span of the main span.
Working ConditionsDesign Expected Values (mm)Measured Values (mm)Statistical Characteristic Values
Average Values (mm)Standard Deviation
Time after bridge completion1/2 year−21.33−20.02−21.703.54
1 year−33.56−25.13−34.194.77
2 years−47.28/−48.297.86
3 years−56.60/−58.0210.40
5 years−69.46/−71.5114.31
10 years−86.60/−89.6620.52
Disclaimer/Publisher’s Note: The statements, opinions and data contained in all publications are solely those of the individual author(s) and contributor(s) and not of MDPI and/or the editor(s). MDPI and/or the editor(s) disclaim responsibility for any injury to people or property resulting from any ideas, methods, instructions or products referred to in the content.

