
Prediction of the Debonding Failure of Beams Strengthened with FRP through Machine Learning Models

Abstract
:1. Introduction
2. Construct the Indicator System
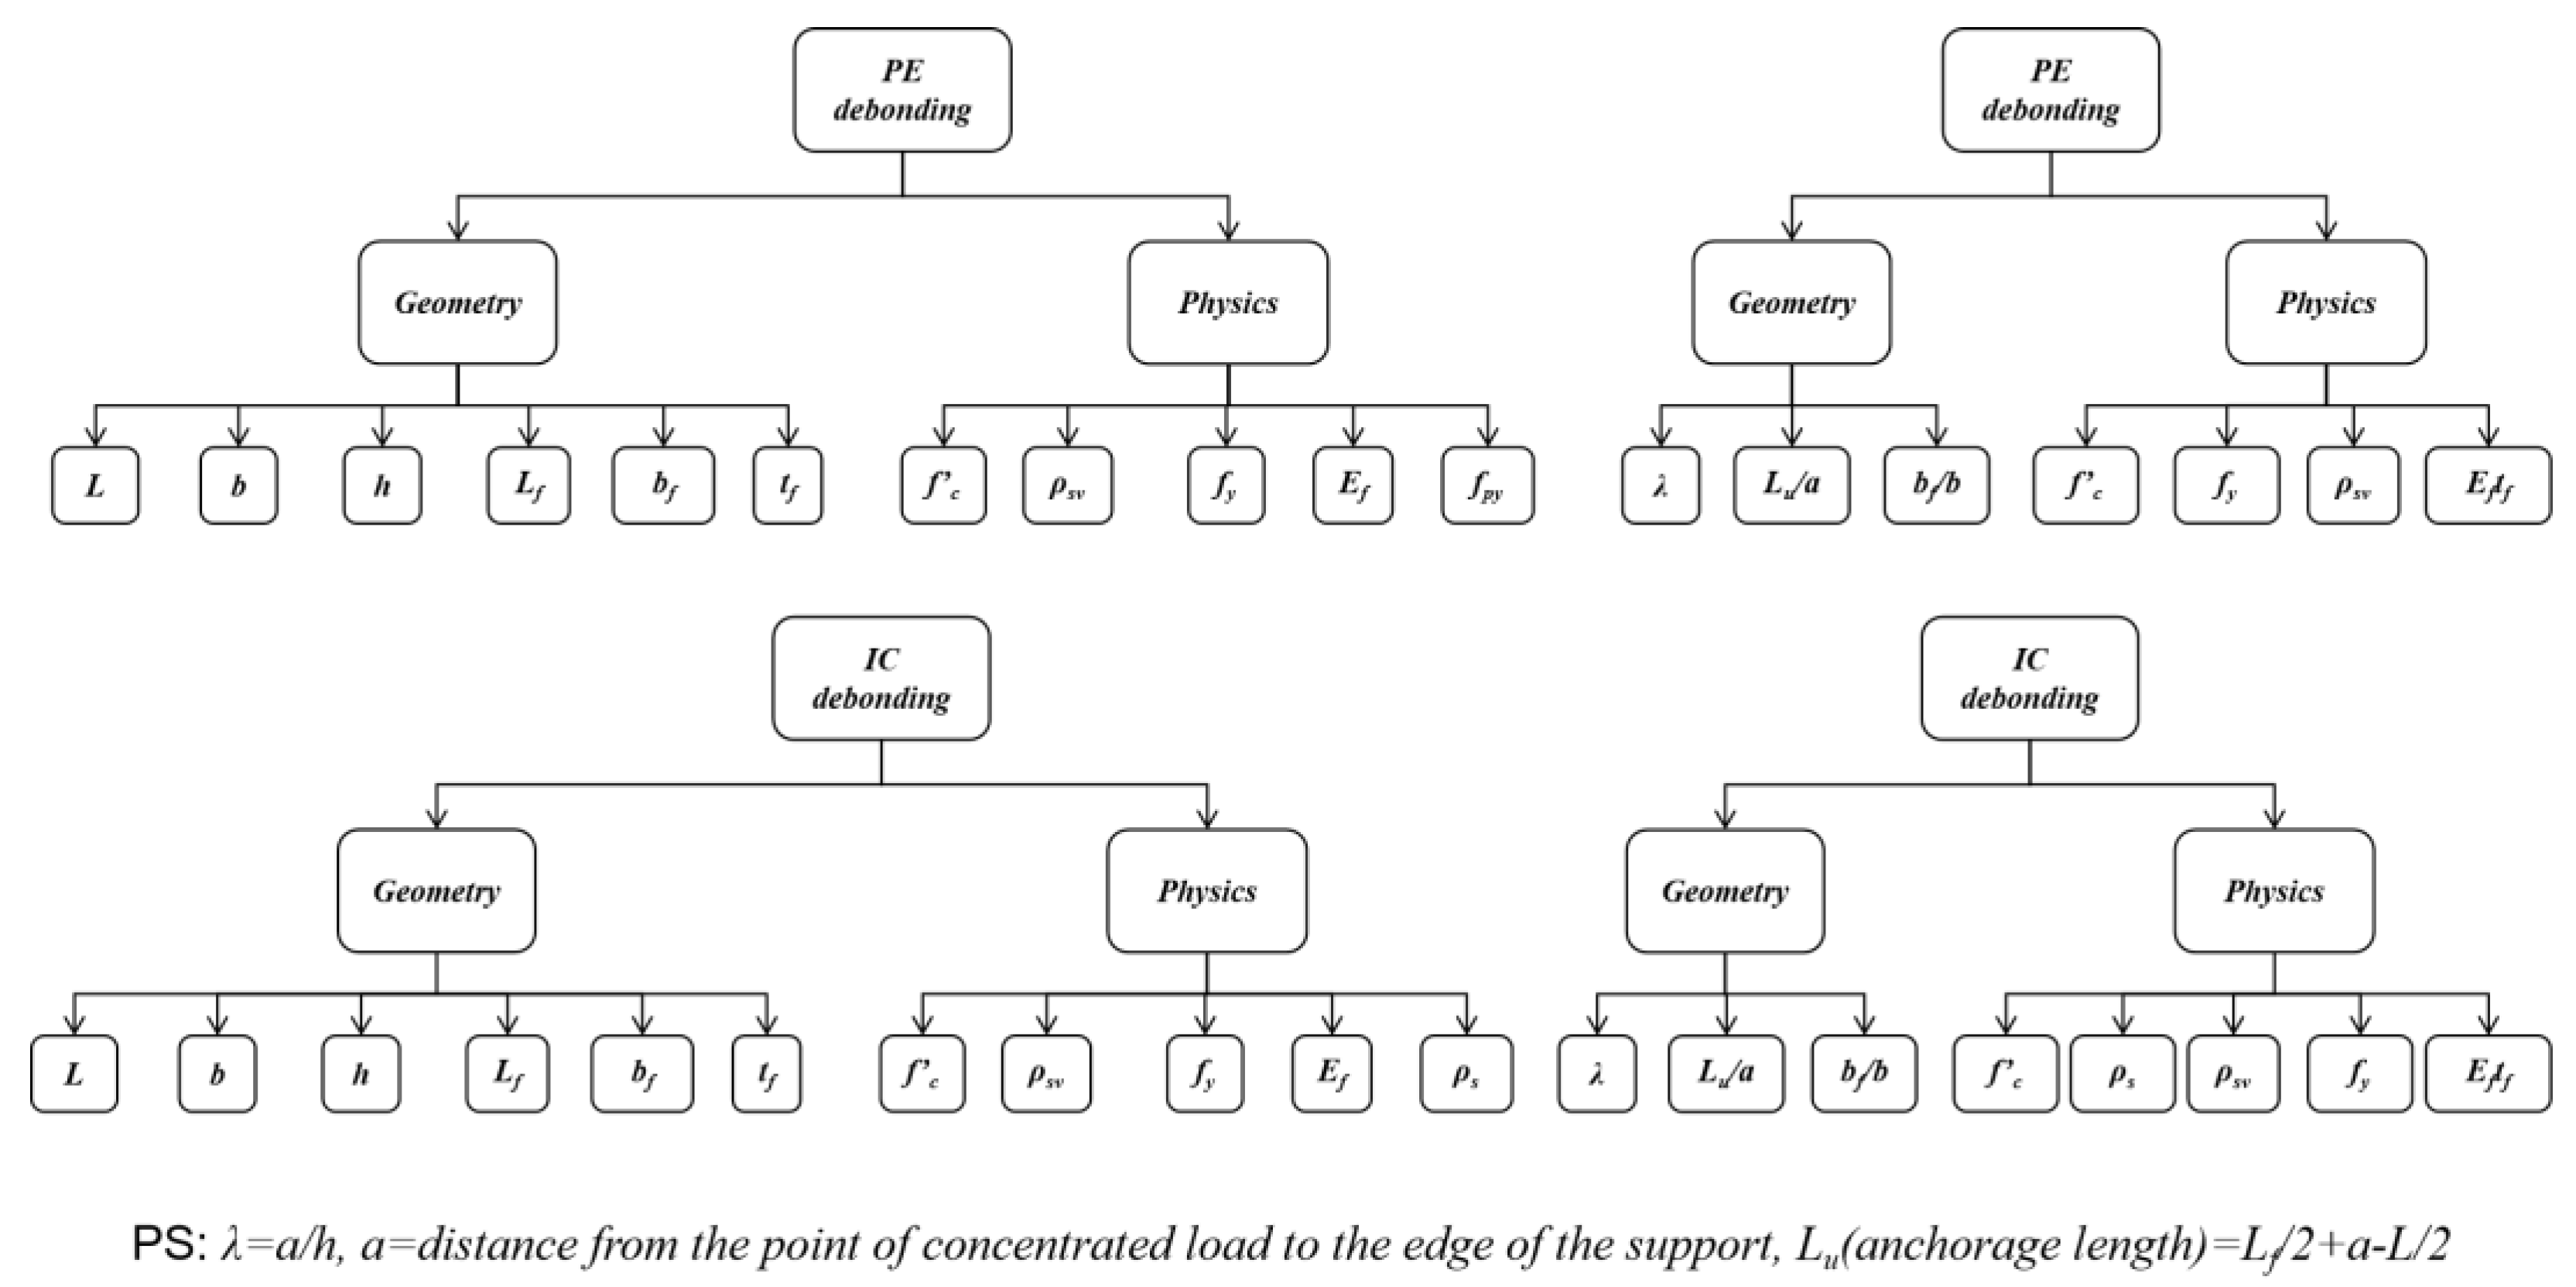
2.1. Primary Indicator System
2.2. Data Collection
- (a)
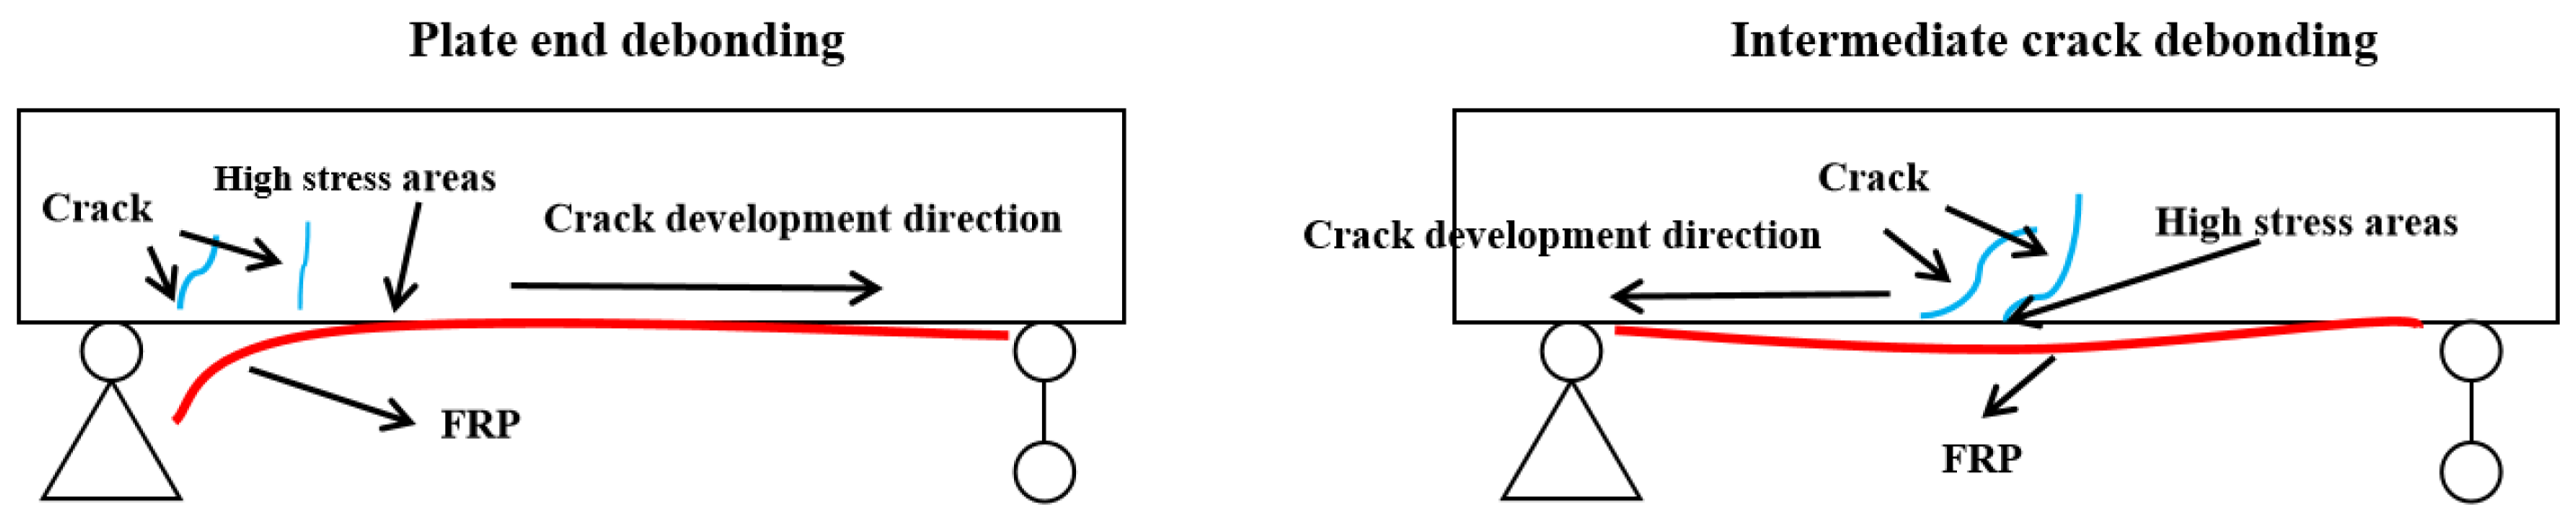
- Debonding failure occurred in all 229 strengthened beams, including IC debonding and PE debonding, as shown in Table 1.
- (b)
- The FRP sheets were not prestressed. The ends of the strengthened beams were not anchored.
- (c)
- The geometric and material properties of the strengthened beams, FRP, and reinforcements are clear.

| Reference | Beam | Number | Failure Mode |
|---|---|---|---|
| [33] | C D G I M | 5 | PE |
| [34] | B2 B3 B4 B6 | 4 | PE |
| [35] | A4 A5 B3 | 3 | PE |
| [36] | 1Bu 2Bu 3Bu 1Cu 2Cu 3Cu | 6 | PE |
| [37] | B1U,1.0 B3U,1.0 B4U,1.0 B1U,2.3 | 4 | PE |
| [38] | VR5 VR6 VR7 VR8 | 4 | PE |
| [39] | P2 P3 P4 P5 | 4 | PE |
| [40] | 2 | 1 | PE |
| [41] | A3 A8 C2 | 3 | PE |
| [42] | AF.2 AF.2.1 AF.3 AF.4 BF.2-1 BF.3-1 CF.2-1 CF.3-1 | 15 | PE |
| CF.4-1 DF2 DF3 DF4 EF.1-1 EF.3-1 EF.4-1 | PE | ||
| [43] | BF2 BF3 BF4 BF5 | 4 | PE |
| [44] | F5 F6 F7 F10 | 4 | PE |
| [45] | 1N4 1N6 | 2 | PE |
| [46] | Beam3 Beam4 Beam5 | 3 | PE |
| [47] | A950 A1100 A1150 | 3 | PE |
| [48] | A4 A6 A8 B5 | 4 | PE |
| [49] | 1A 1B 2A 2B 3A 3B | 6 | PE |
| [50] | A-S1 B-S1 | 2 | PE |
| [51] | A1-1 A2-1 A3-1 A4-1 A5-1 | 10 | PE |
| A1-11 A2-11 A3-11 A4-11 A5-11 | PE | ||
| [52] | 1T6LN 2T6LN 2T4LN | 3 | PE |
| [53] | A0 B0 | 2 | PE |
| [54] | Bb1 Bb3 | 2 | PE |
| [55] | E1a E1b E2a E2b E3a E3b | 11 | PE |
| E4a E4b E5a E5b E3b2 | PE | ||
| [56] | RB1 | 1 | PE |
| [57] | B3-12D-2L15 B4-12D-3L15 | 2 | PE |
| [17] | CS-B CS-L3-B CS-W100-B CP-B | 4 | PE |
| [58] | A3 B2 B3 | 3 | PE |
| [59] | B85P B70P B25P | 3 | PE |
| [60] | C2 | 1 | PE |
| [10] | S-0.5-35-360 | 1 | PE |
| [61] | S(AT1)C B(AT1)C | 2 | PE |
| [62] | BC1-1 BC1-2 BC2-1 BC3-1 BC4-1 BC4-2 | 6 | PE |
| [55] | B | 1 | IC |
| [6] | SM2 SM3 MM2 MM3 | 4 | IC |
| [63] | A1.1 A3.1 | 2 | IC |
| [64] | S-A R-A | 2 | IC |
| [65] | H-75-2 C3 | 2 | IC |
| [66] | CB3-2S CB4-2S CB5-3S CB6-3S | 8 | IC |
| CB7-1S CB8-1SB CB9-1SB CB10-2SB | IC | ||
| [67] | A11 A12 A21 A31 A32 | 9 | IC |
| [68] | A41 A42 A51 A52 | IC | |
| [51] | BP BF | 2 | IC |
| A3 A4 A5 A6 B3 B4 B5 B6 | 8 | IC | |
| [54] | A10 A20 B10 B20 | 4 | IC |
| [69] | S1a S1b S2a S2b S3a S3b | 6 | IC |
| [70] | B11 B12 B21 B22 B31 B32 | 6 | IC |
| Beam 2 Beam 6 | 2 | IC | |
| [71] | S2PF7M S3PS1M S3PS2M | 3 | IC |
| [72] | B5 B6 B7 B8 | 4 | IC |
| [73] | A2 | 1 | IC |
| NFCB1 NFCBW2 | 2 | IC | |
| [74] | EBR | 1 | IC |
| [58] | 1 2 4 3 9 | 10 | IC |
| [75] | 10 11 12 5 6 | IC | |
| B-04/0.5S B-08/S1 BF-04/0.5S BF-06/S | 4 | IC | |
| [76] | S-0 S-0.4 S-0.6 | 3 | IC |
| [77] | W-CSP1-0 W-CSP1-0E W-CSP1-4(1) W-CSP2-3-0 | 17 | IC |
| [78] | W-CSP2-3-4(1) W-CSP2-3-4(2) W-CSP2-3-4(3) | ||
| W-CSP6-9-0 W-CSP6-9-4(1) W-CSP6-9-4(2) W-CSP6-9-4(3) | |||
| P-CSP1(1) P-CSP2-3(1) P-CSP2-3(2) P-CSP6-9(1) P-CSP6-9(2) |
2.3. Data Analysis and Indicator System Establishment
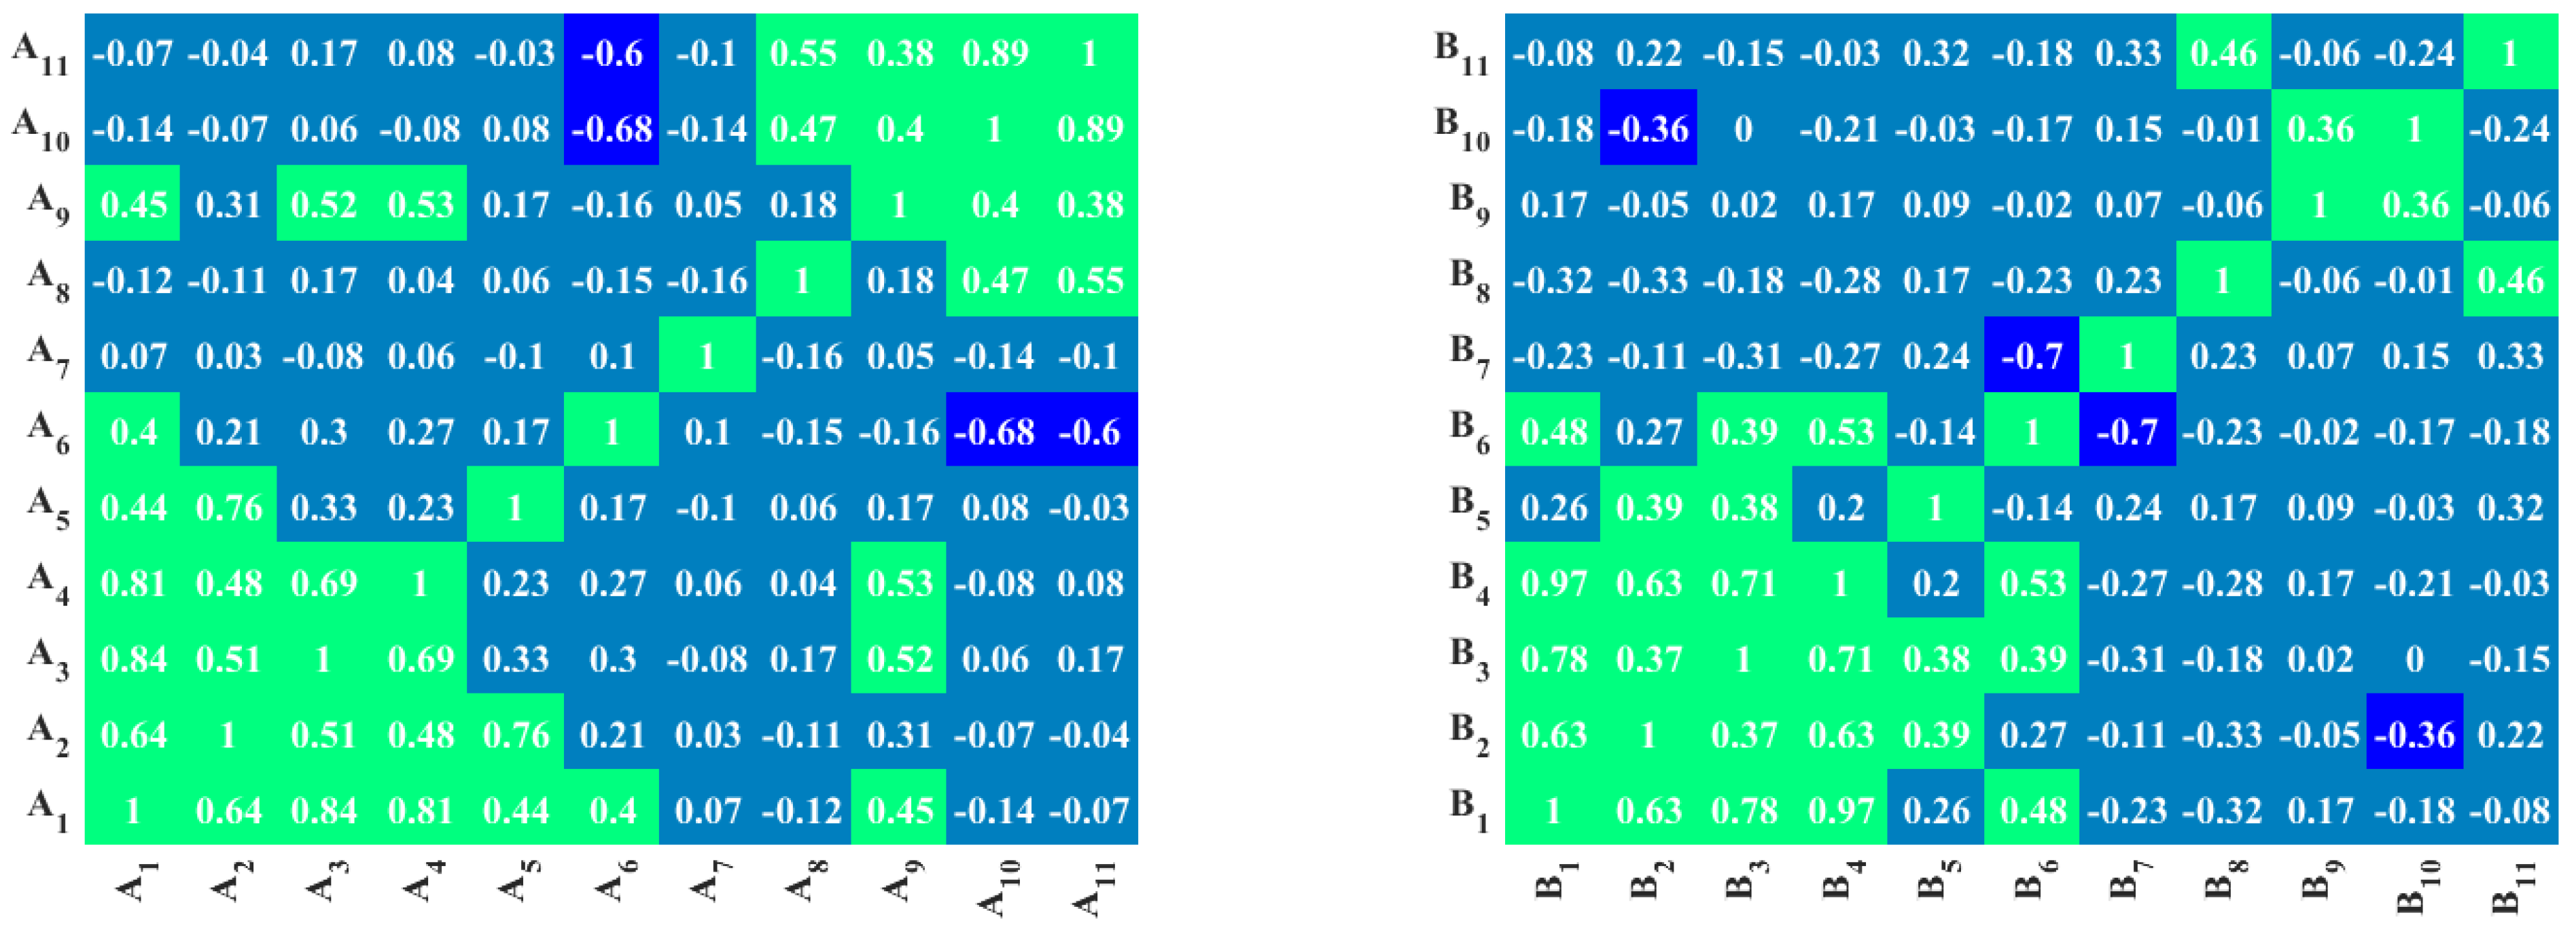
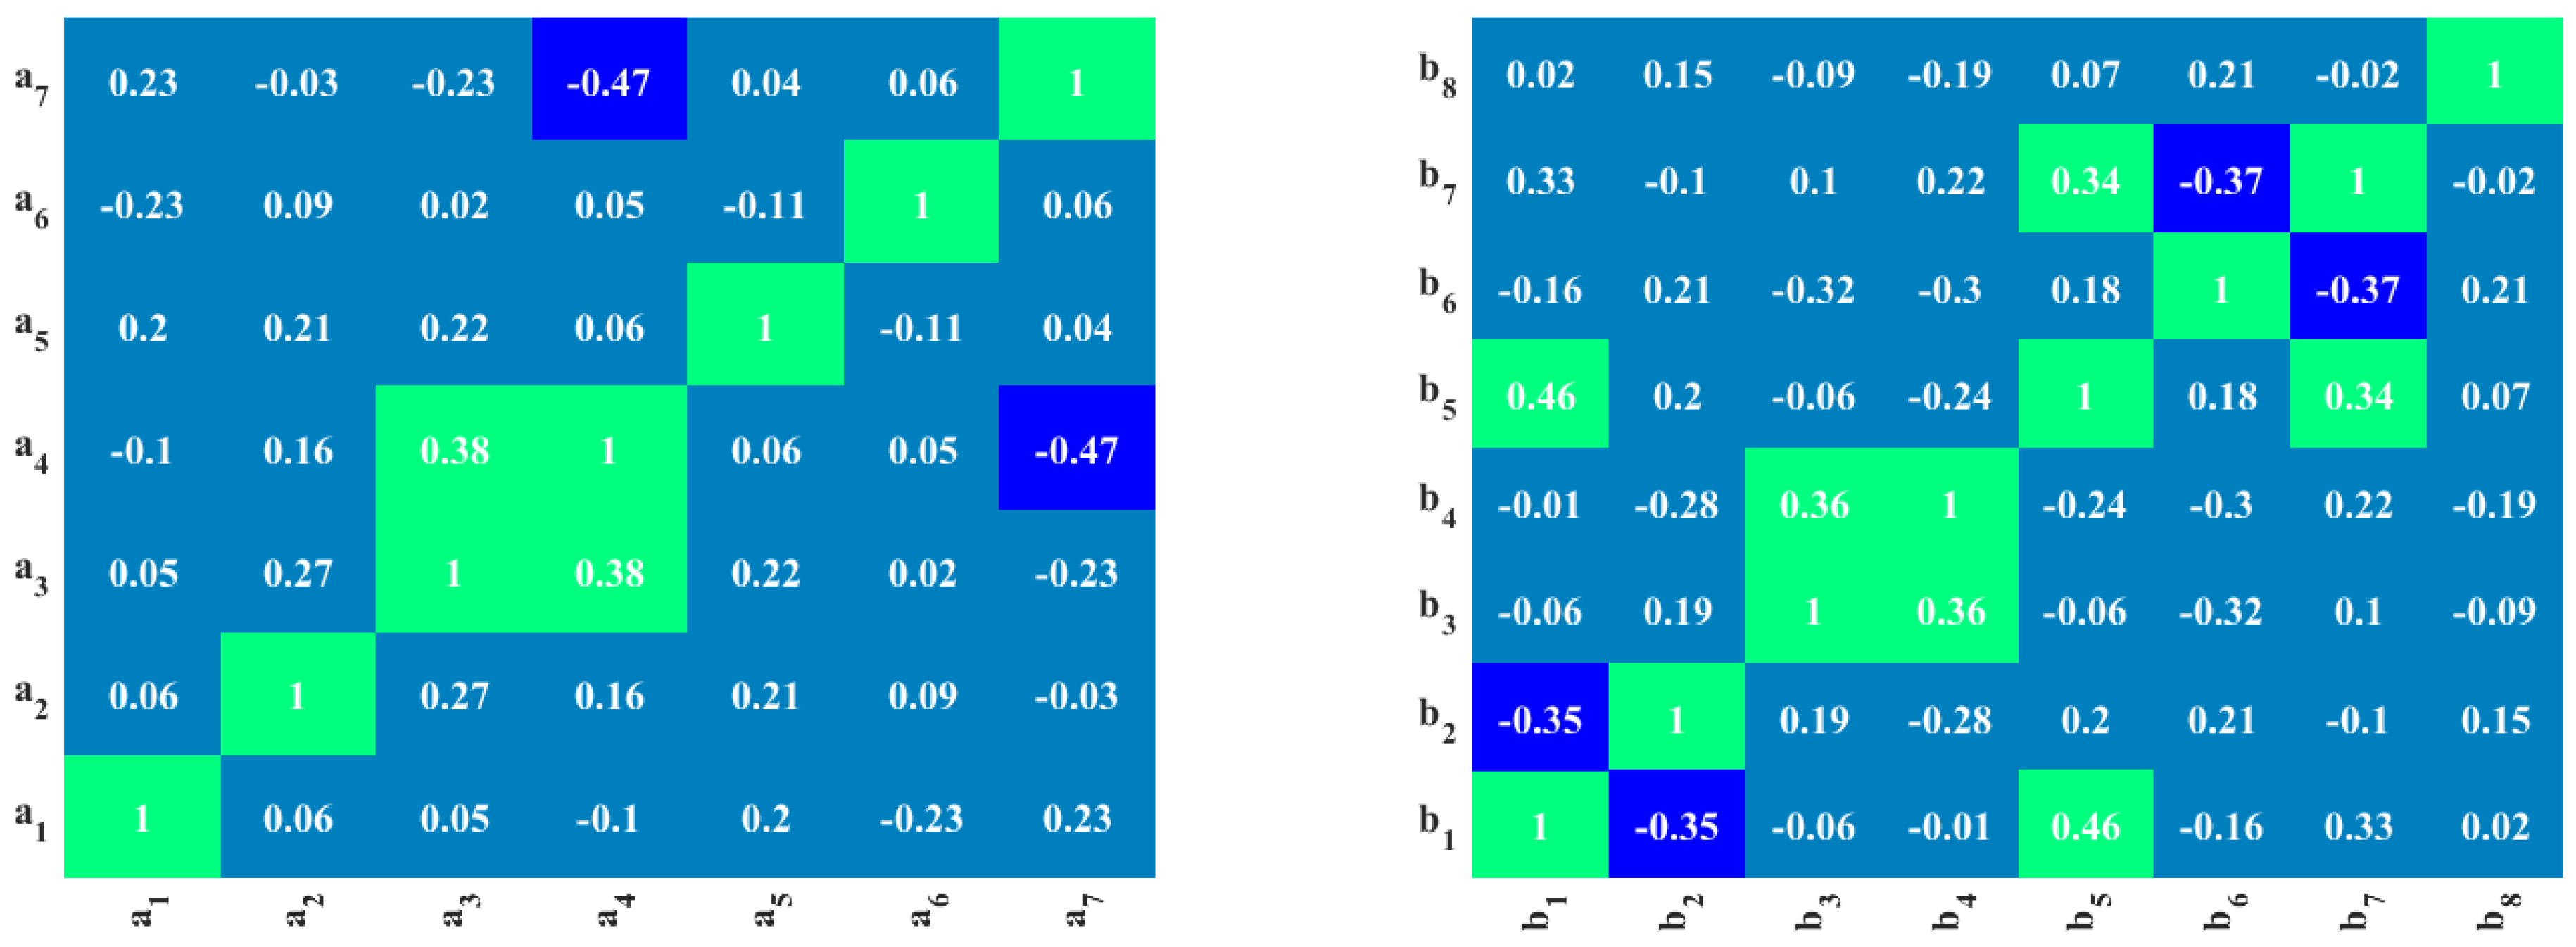
2.3.1. Correlation Analysis
2.3.2. Grey Correlation Analysis
- (a)
- Determine the reference series reflecting the characteristics of the system behavior and the comparison series affecting the system behavior.
- (b)
- Dimensionless processing of the reference and comparison series.
- (c)
- Find the grey correlation coefficient between the reference series and the comparison series, noted here as ξ, which is shown in Equation (2).where a denotes the minimum difference of the data in the subsequence and b denotes the maximum difference of the data in the subsequence; ρ is the resolution factor and generally taken as 0.5.
- Search for correlation. Because the correlation coefficient is the value of the degree of correlation between the comparison series and the reference series at each point, it has more than one number, and the information is too scattered to facilitate a holistic comparison. Therefore, it is necessary to pool the correlation coefficients at each point into one value; that is, to find its average value, as a quantitative representation of the degree of correlation between the comparison series and the reference series, the correlation degree is noted as ri, and its formula is as follows in Equation (3).
3. Construction of the Machine Learning Models
3.1. Machine Learning Algorithms
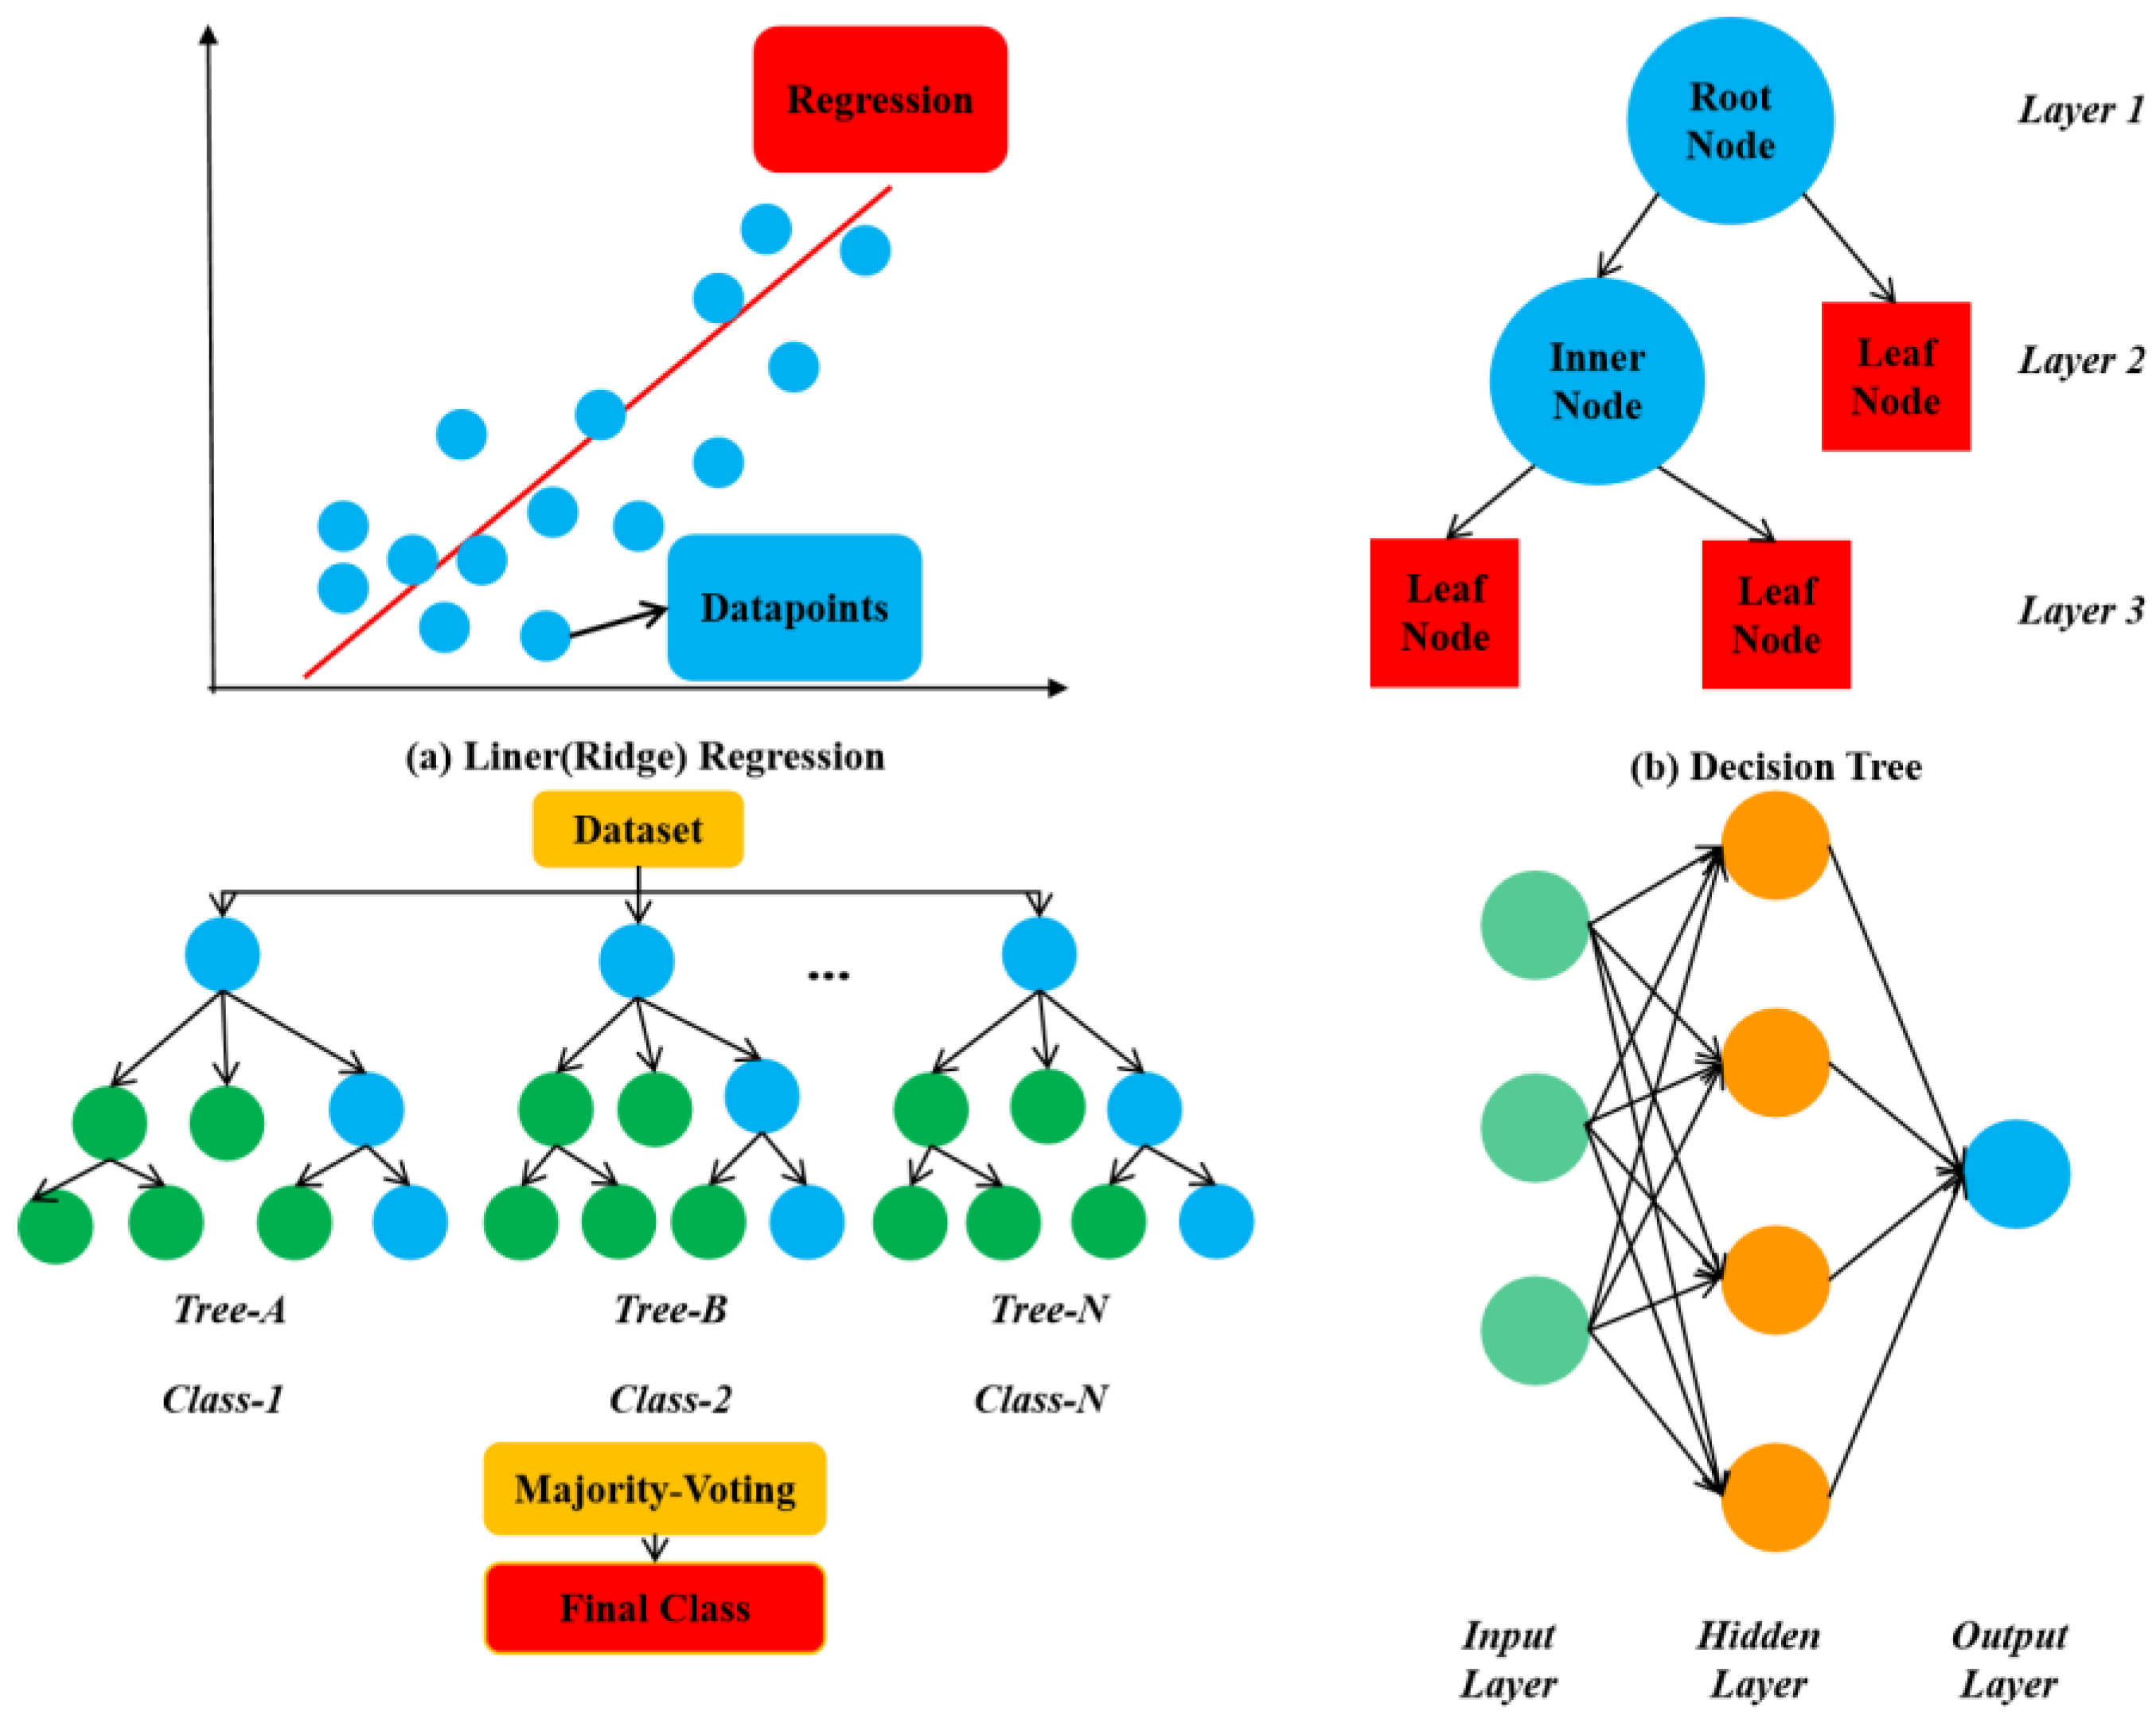
3.1.1. Linear Regression
3.1.2. Ridge Regression
3.1.3. Decision Tree
3.1.4. Random Forest
3.1.5. BP Neural Network
3.2. Model Construction and Evaluation
3.3. Model Optimization
4. Evaluation of Models Recommended by Codes
5. Parametric Study
6. Discussion and Conclusions
- (1)
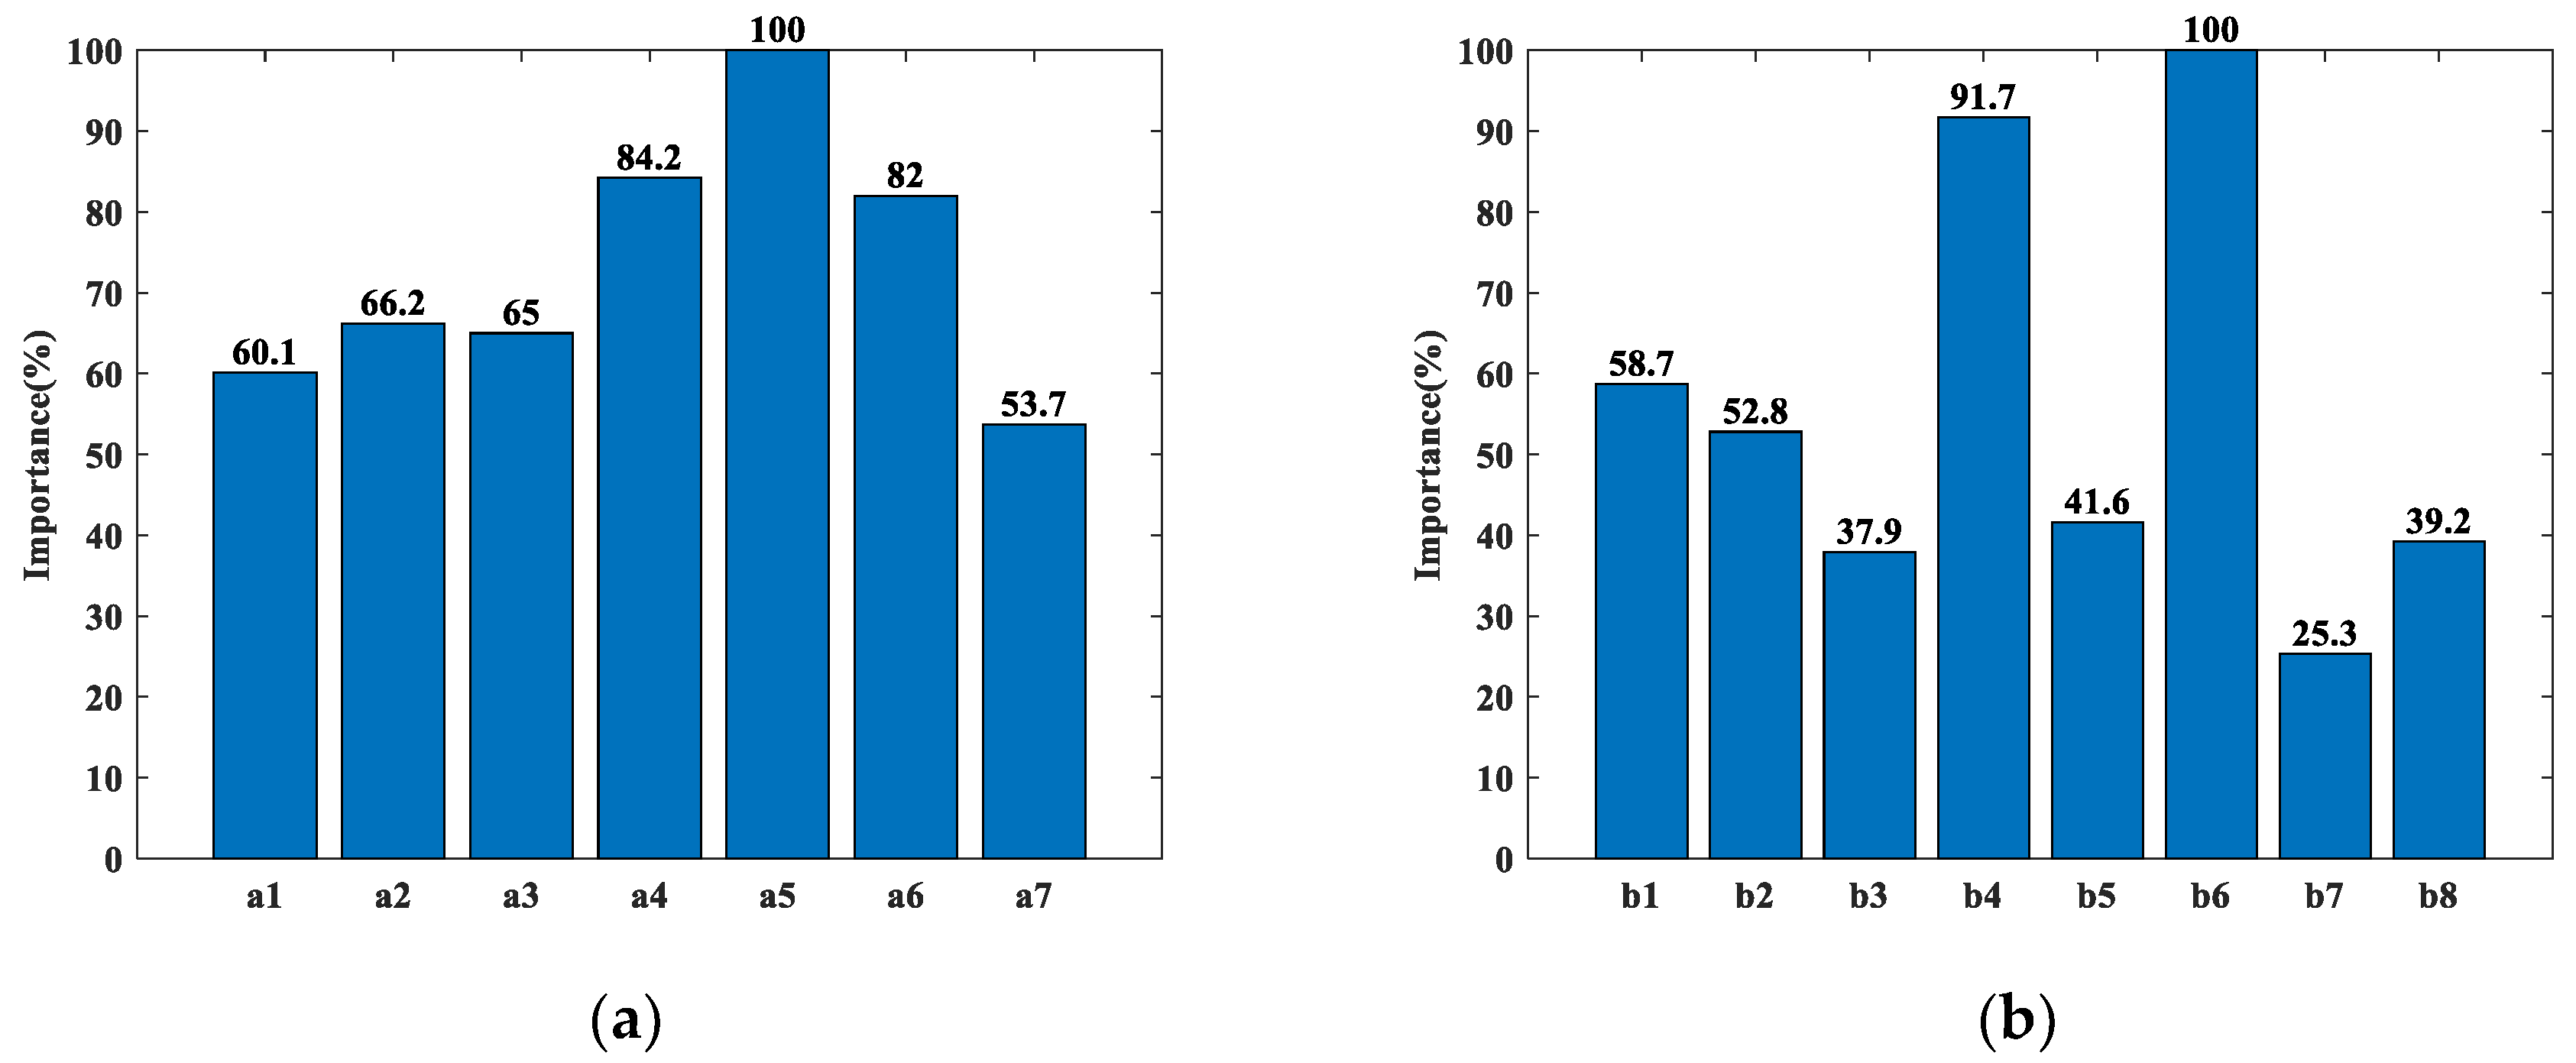
- The correlation between the indicators in the established mixed indicator system is insignificant, and the correlation with the predicted values is significant. Additionally, FRP stiffness (Eftf) and concrete strength (f’c) have a large effect on both PE and IC debonding.
- (2)
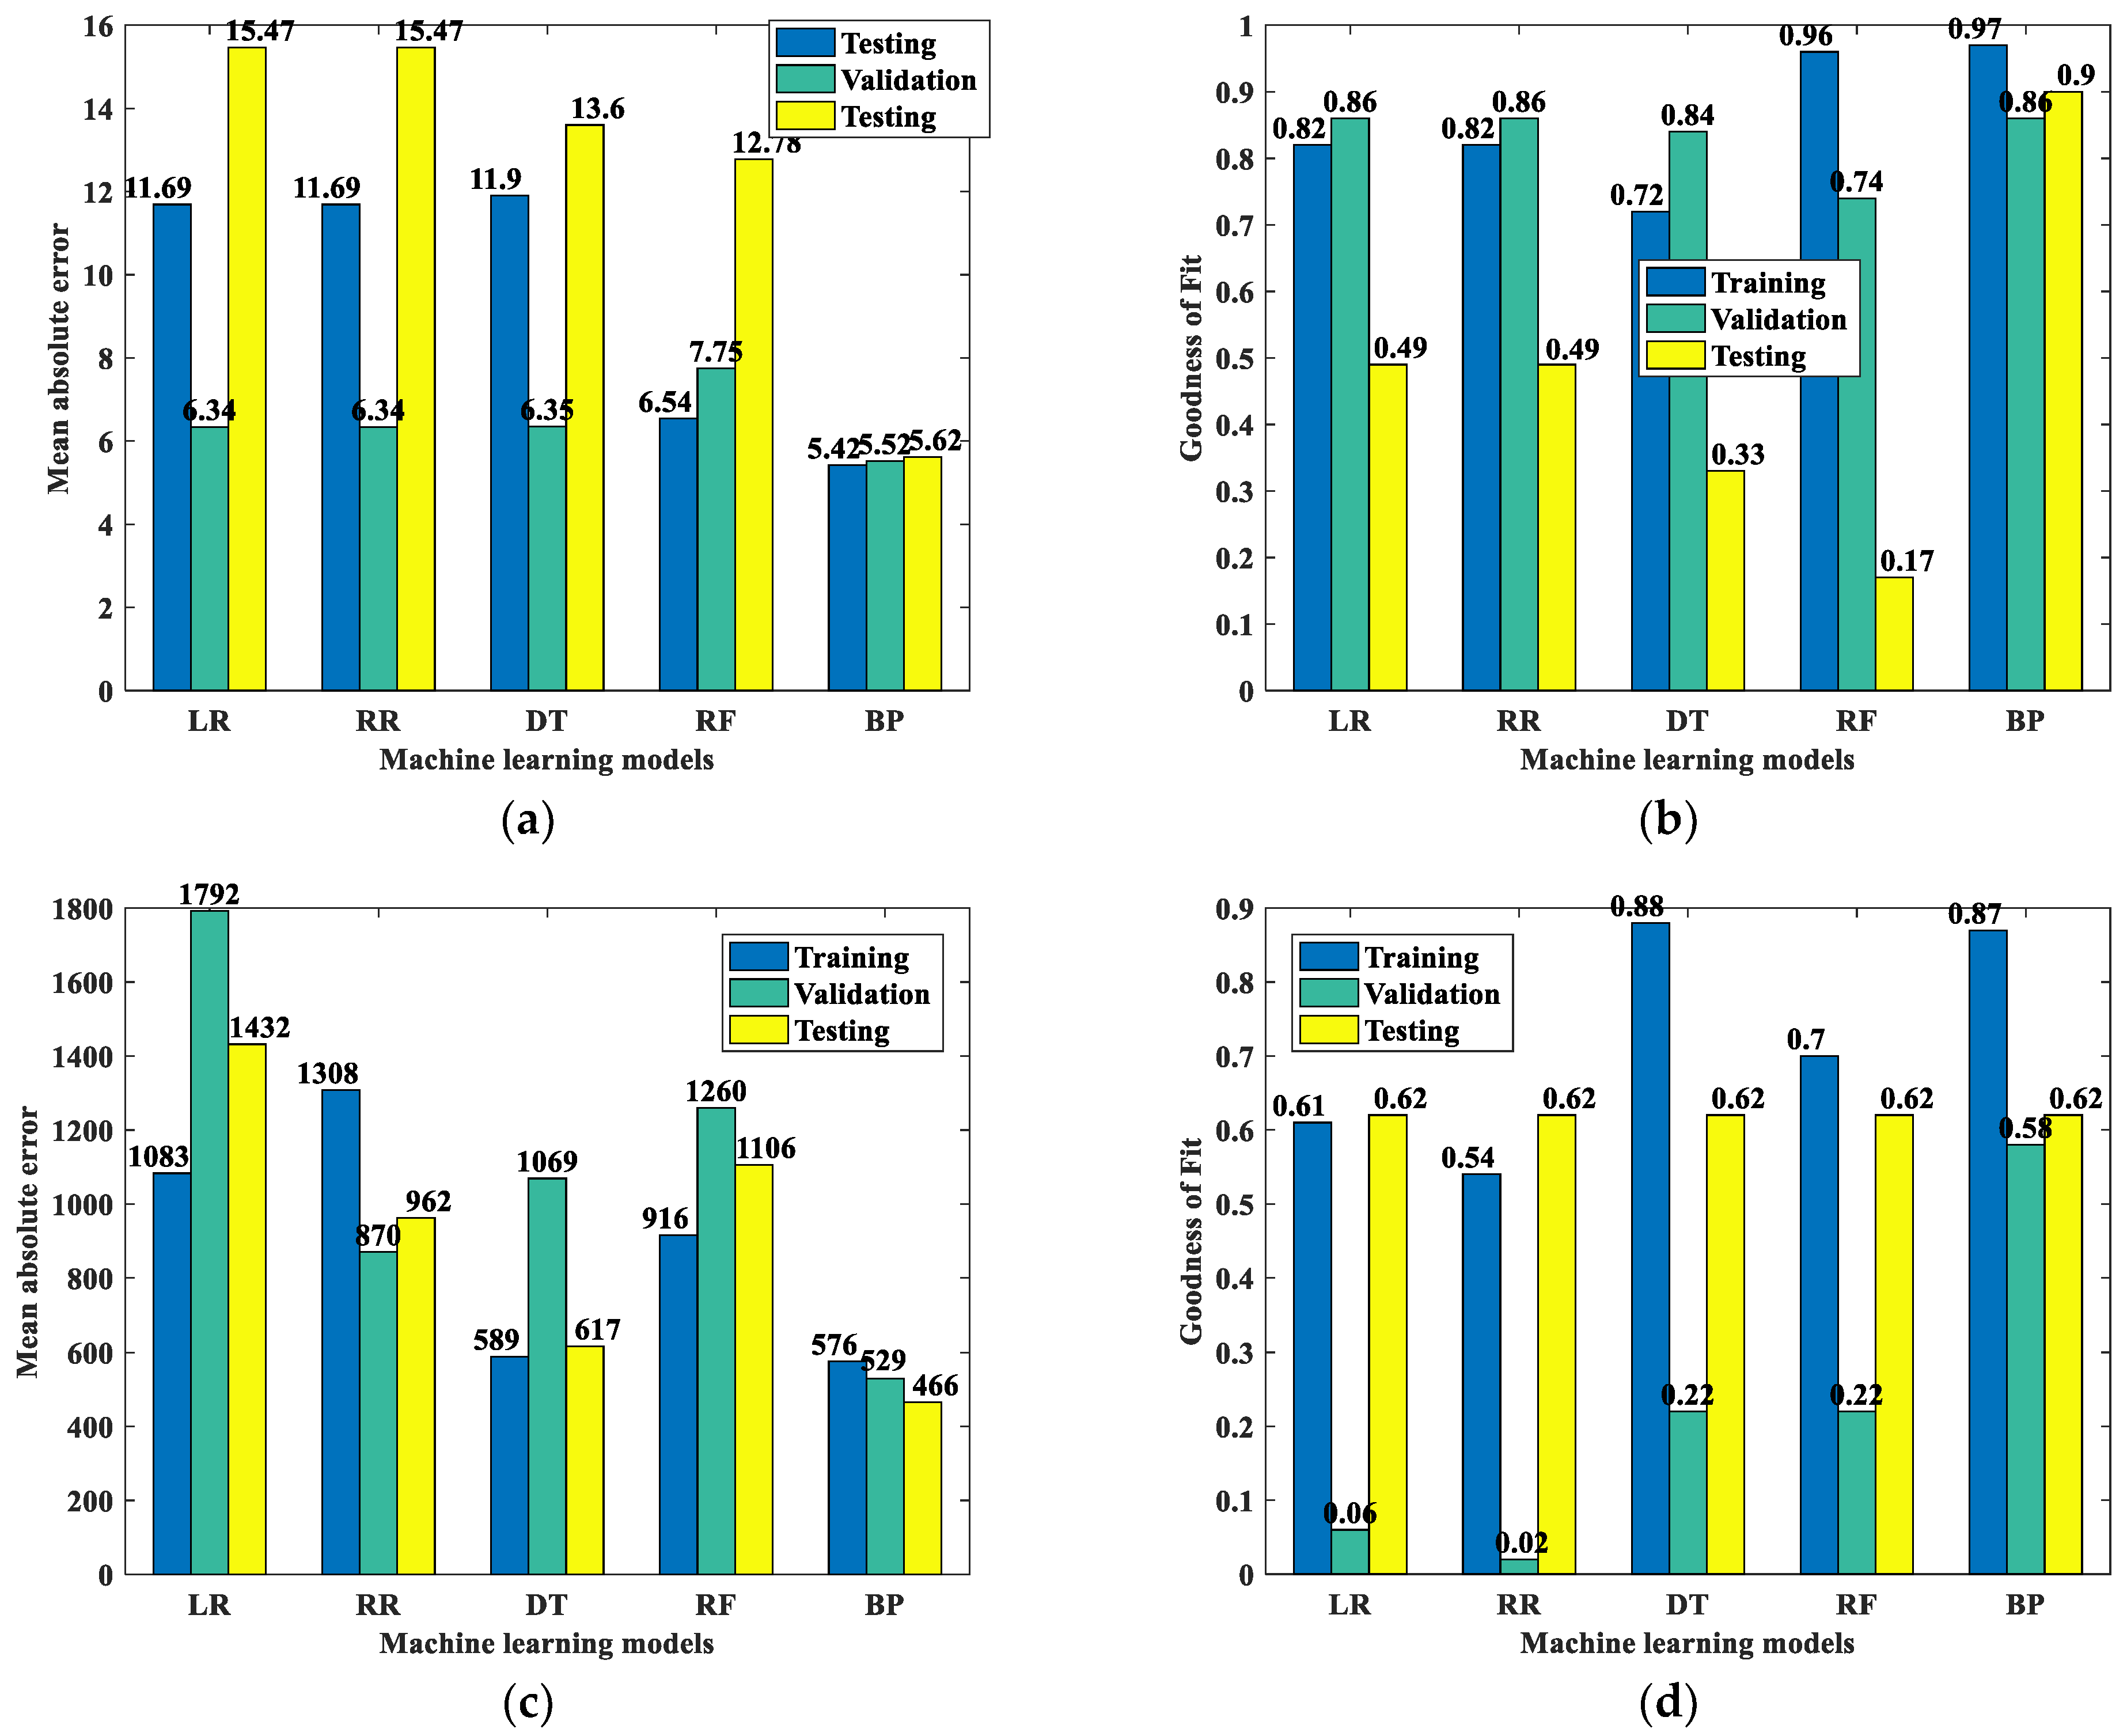
- For the prediction of PE and IC debonding, the BP neural network has the best performance compared to other machine learning algorithms.
- (3)
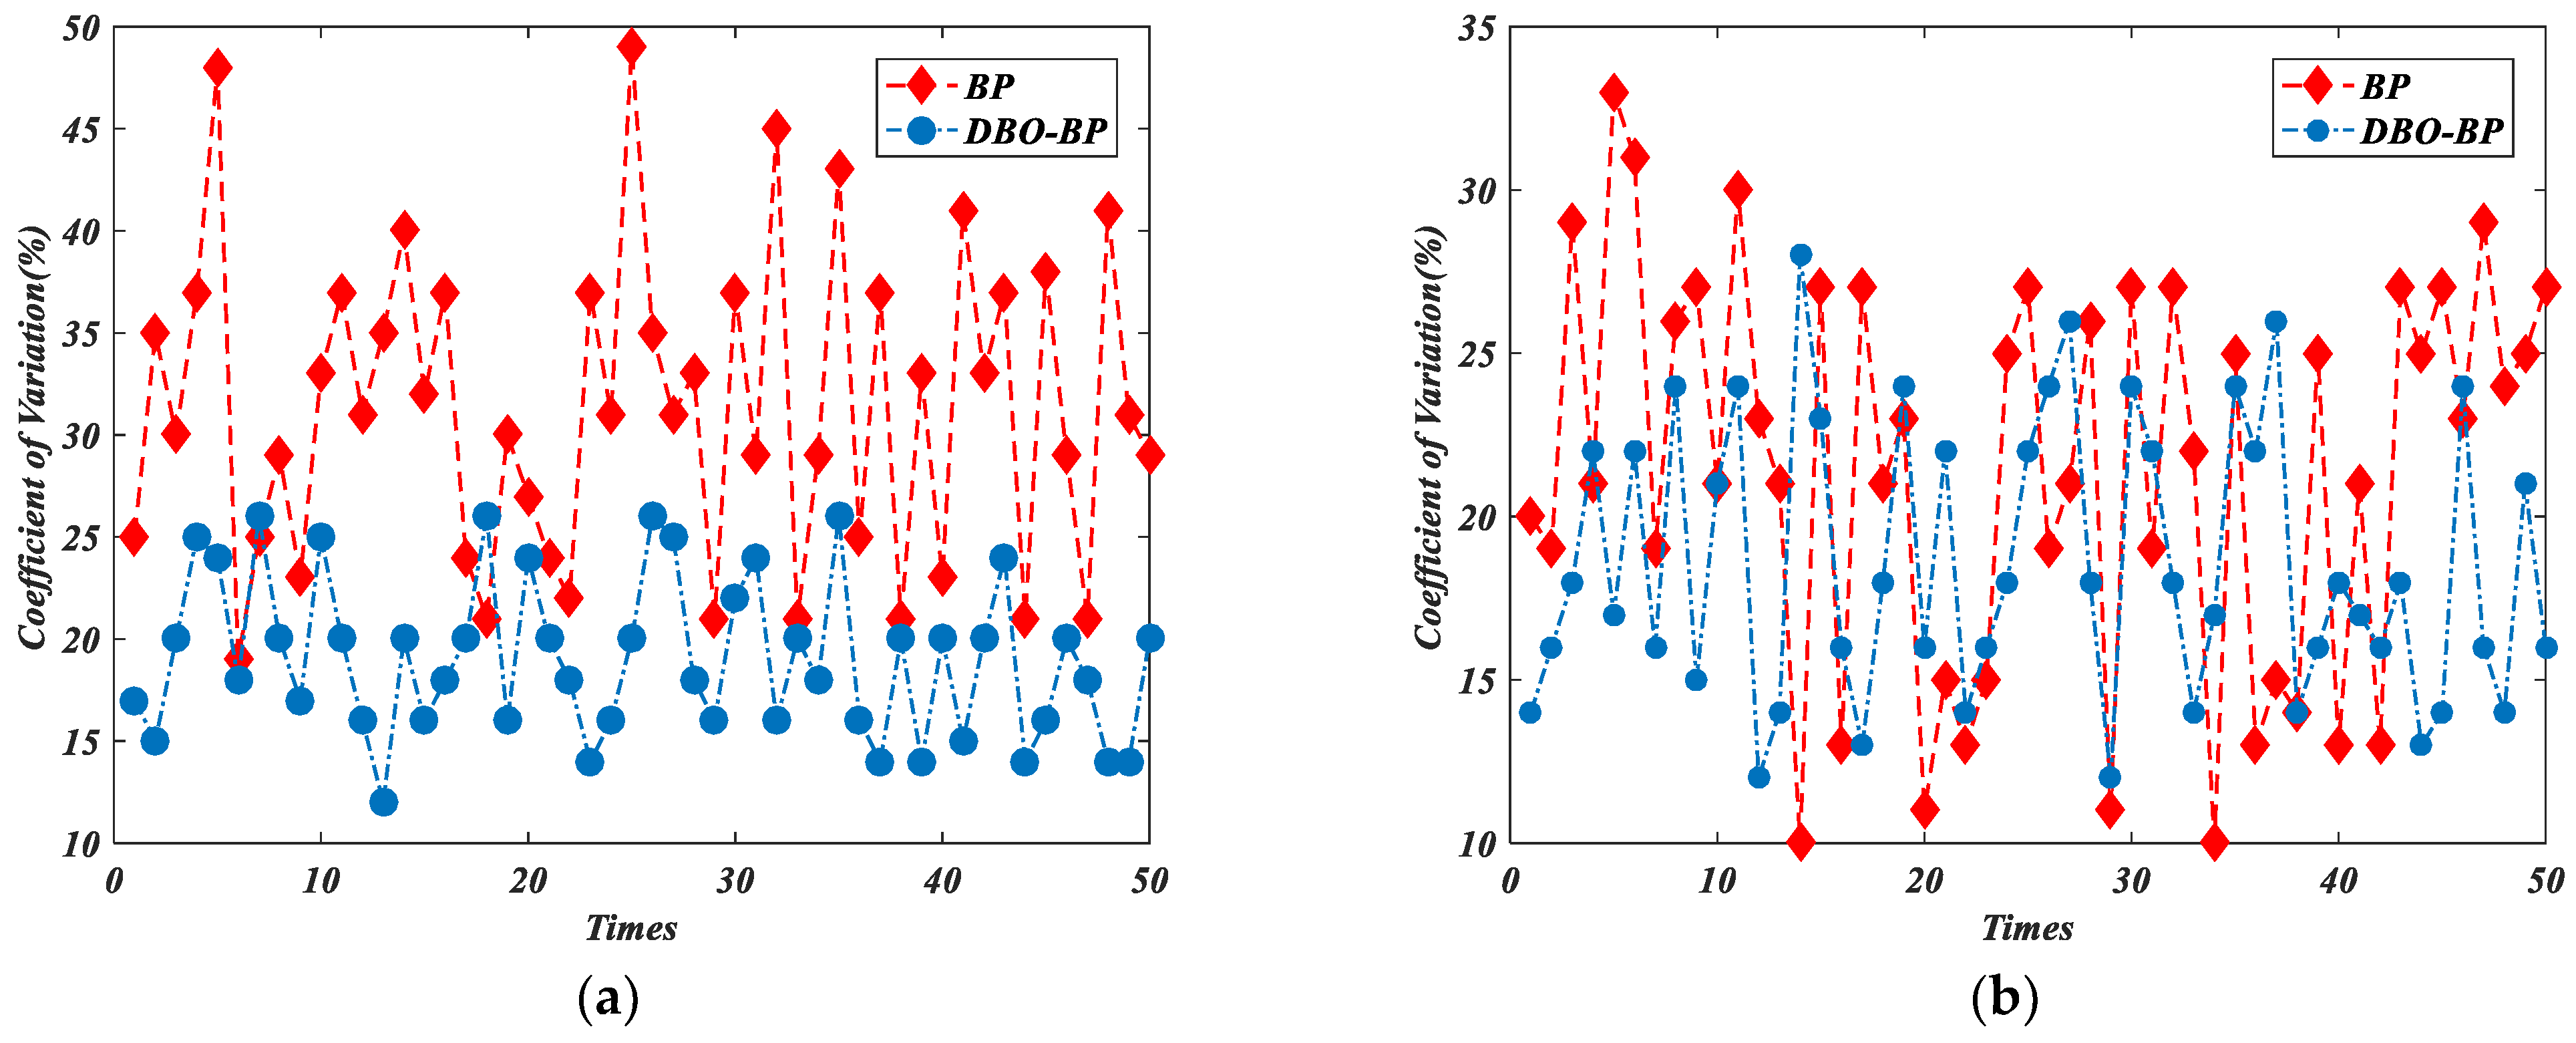
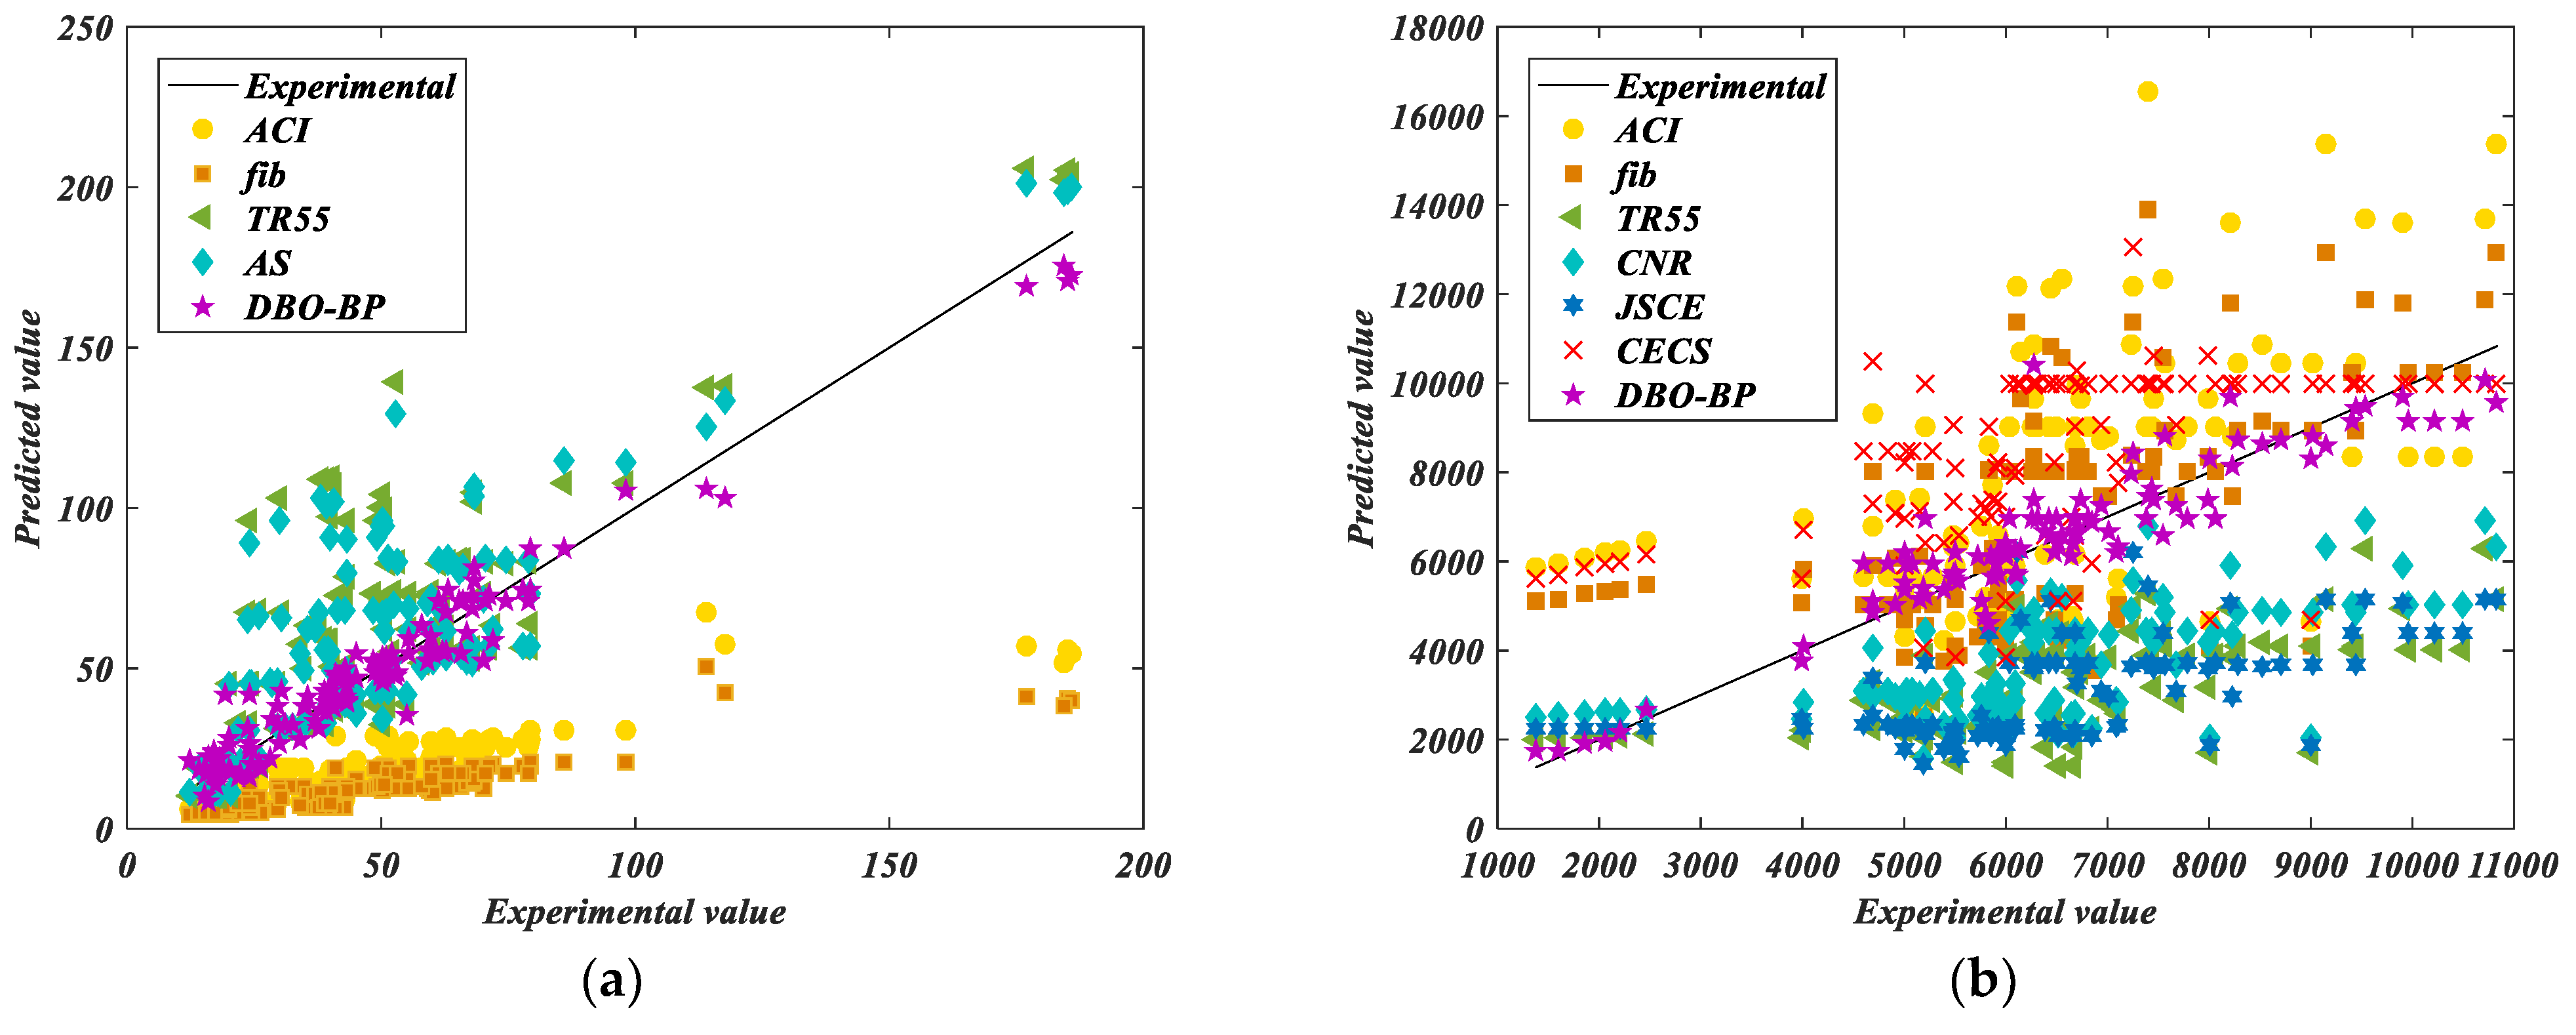
- The model optimized by the DBO algorithm is significantly accurate and can better predict PE and IC debonding. The models suggested by codes have a significant coefficient of variation and are conservative or overestimate the state of the strengthened beam in case of failure.
- (4)
- The experimental data used in this paper are unevenly distributed, which will affect the accuracy of the model to some extent. More data need to be collected in the future to build a more reliable model. Additionally, the parameters considered in this paper are not complete and more parameters need to be investigated in the future.
Author Contributions
Funding
Data Availability Statement
Conflicts of Interest
References
- Li, S.; Xin, J.; Jiang, Y.; Wang, C.; Zhou, J.; Yang, X. Temperature-induced deflection separation based on bridge deflection data using the TVFEMD-PE-KLD method. J. Civ. Struct. Health Monit. 2023, 1–17. [Google Scholar] [CrossRef]
- Jiang, Y.; Hui, Y.; Wang, Y.; Peng, L.; Huang, G.; Liu, S. A novel eigenvalue-based iterative simulation method for multi-dimensional homogeneous non-Gaussian stochastic vector fields. Struct. Saf. 2023, 100, 102290. [Google Scholar] [CrossRef]
- Zhang, H.; Li, H.; Zhou, J.; Tong, K.; Xia, R. A multi-dimensional evaluation of wire breakage in bridge cable based on self-magnetic flux leakage signals. J. Magn. Magn. Mater. 2023, 566, 170321. [Google Scholar] [CrossRef]
- Xin, J.; Jiang, Y.; Zhou, J.; Peng, L.; Liu, S.; Tang, Q. Bridge deformation prediction based on SHM data using improved VMD and conditional KDE. Eng. Struct. 2022, 261, 114285. [Google Scholar] [CrossRef]
- Kotynia, R.; Oller, E.; Marí, A.; Kaszubska, M. Efficiency of shear strengthening of RC beams with externally bonded FRP materials—State-of-the-art in the experimental tests. Compos. Struct. 2021, 267, 113891. [Google Scholar] [CrossRef]
- Bakay, R.; Sayed-Ahmed, E.Y.; Shrive, N.G. Interfacial debonding failure for reinforced concrete beams strengthened with carbon-fibre-reinforced polymer strips. Can. J. Civ. Eng. 2009, 36, 103–121. [Google Scholar] [CrossRef]
- Ceroni, F.; Pecce, M.; Matthys, S.; Taerwe, L. Debonding strength and anchorage devices for reinforced concrete elements strengthened with FRP sheets. Compos. Part B Eng. 2008, 39, 429–441. [Google Scholar] [CrossRef]
- Al-Saawani, M.A.; El-Sayed, A.K.; Al-Negheimish, A.I. Assessment of plate-end debonding design provisions for RC beams strengthened with FRP. Lat. Am. J. Solids Struct. 2020, 17. [Google Scholar] [CrossRef]
- Chen, J.; Sun, B.; Bao, Z. A brief discussion of the prestressed carbon fiber board reinforcement material system. In Proceedings of the Twelfth National Academic Exchange Conference on Building Inspection, Appraisal and Reinforcement, Guangzhou, China, 6–7 December 2004. [Google Scholar]
- Al-Saawani, M.; El-Sayed, A.K.; Al-Negheimish, A.I. Effect of basic design parameters on IC debonding of CFRP-strengthened shallow RC beams. J. Reinf. Plast. Compos. 2015, 34, 1526–1539. [Google Scholar] [CrossRef]
- Oehlers, D.J. Reinforced Concrete Beams with Plates Glued to their Soffits. J. Struct. Eng. 1992, 118, 2023–2038. [Google Scholar] [CrossRef]
- Zhang, S.-S.; Teng, J.G. End cover separation in RC beams strengthened in flexure with bonded FRP reinforcement: Simplified finite element approach. Mater. Struct. 2015, 49, 2223–2236. [Google Scholar] [CrossRef]
- Jansze, W. Strengthening of RC Members in Bending by Externally Bonded Steel Plates. Ph.D. Thesis, Delft University of Technology, Delft, The Netherlands, 1997. [Google Scholar]
- Ahmed, O.; Van Gemert, D. Effect of Longitudinal Carbon Fiber Reinforced Plastic Laminates on Shear Capacity of Reinforced Concrete Beams. Spec. Publ. 1999, 188, 933–944. [Google Scholar] [CrossRef]
- FIB International. Externally Applied FRP Reinforcement for Concrete Structures; FIB International: Lausanne, Switzerland, 2001. [Google Scholar]
- Smith, S.; Teng, J. FRP-strengthened RC beams. II: Assessment of debonding strength models. Eng. Struct. 2002, 24, 397–417. [Google Scholar] [CrossRef]
- Yao, J.; Teng, J. Plate end debonding in FRP-plated RC beams—I: Experiments. Eng. Struct. 2007, 29, 2457–2471. [Google Scholar] [CrossRef]
- Concrete Society. Design Guidance for Strengthening Concrete Structures Using Fibre Composite Materials, 2nd ed.; Concrete Society Technical Rep. 55; Concrete Society: Surrey, UK, 2004. [Google Scholar]
- American Concrete Institute Committee. 440 Report. Guide for the Design and Construction of Externally Bonded FRP Systems for Strengthening Concrete Structures; American Concrete Institute Committee: Farmington Hills, MI, USA, 2017. [Google Scholar]
- AS 5100.8; Bridge Design, Part 8: Rehabilitation and Strengthening of Existing Bridges. Standards Australia, SA1 Global Limited: Sydney, Austrilia, 2017.
- El-Sayed, A.K.; Al-Saawani, M.A.; Al-Negheimish, A.I. Empirical shear based model for predicting plate end debonding in FRP strengthened RC beams. J. Civ. Eng. Manag. 2021, 27, 117–138. [Google Scholar] [CrossRef]
- Japan Society of Civil Engineers (JSCE). Recommendations for Upgrading of Concrete Structures with Use of Continuous Fiber Sheets; Japan Society of Civil Engineers (JSCE): Tokyo, Japan, 1997. [Google Scholar]
- China Association for Engineering Construction Standardization (CECS146). Technical Specification for Strengthening Concrete Structure with Carbon Fiber Reinforced Polymer Laminate; China Planning Press: Beijing, China, 2003. [Google Scholar]
- CNR-DT, 200; Guide for the Design and Construction of Externally Bonded FRP Systems for Strengthening Existing Structures. Italian National Research Council: Rome, Italy, 2004.
- Kim, Y.J.; Harries, K.A. Statistical Characterization of Reinforced Concrete Beams Strengthened with FRP Sheets. J. Compos. Constr. 2013, 17, 357–370. [Google Scholar] [CrossRef]
- Bilotta, A.; Faella, C.; Martinelli, E.; Nigro, E. Design by testing procedure for intermediate debonding in EBR FRP strengthened RC beams. Eng. Struct. 2013, 46, 147–154. [Google Scholar] [CrossRef]
- López-González, J.C.; Fernández-Gómez, J.; Díaz-Heredia, E.; López-Agüí, J.C.; Villanueva-Llauradó, P. IC debonding failure in RC beams strengthened with FRP: Strain-based versus stress increment-based models. Eng. Struct. 2016, 118, 108–124. [Google Scholar] [CrossRef]
- Li, X.-H.; Wu, G. Finite-Element Analysis and Strength Model for IC Debonding in FRP-Strengthened RC Beams. J. Compos. Constr. 2018, 22, 04018030. [Google Scholar] [CrossRef]
- Zhang, J.; Guo, R.; Li, S.; Zhao, S. Prediction of the IC debonding failure of FRP-strengthened RC beams based on the cohesive zone model. Lat. Am. J. Solids Struct. 2020, 17. [Google Scholar] [CrossRef]
- Fang, Z.; Roy, K.; Chen, B.; Sham, C.-W.; Hajirasouliha, I.; Lim, J.B. Deep learning-based procedure for structural design of cold-formed steel channel sections with edge-stiffened and un-stiffened holes under axial compression. Thin-Walled Struct. 2021, 166, 108076. [Google Scholar] [CrossRef]
- Fang, Z.; Roy, K.; Ingham, J.; Lim, J.B.P. Assessment of end-two-flange web crippling strength of roll-formed aluminium alloy perforated channels by experimental testing, numerical simulation, and deep learning. Eng. Struct. 2022, 268, 114753. [Google Scholar] [CrossRef]
- Fang, Z.; Roy, K.; Xu, J.; Dai, Y.; Paul, B.; Lim, J.B. A novel machine learning method to investigate the web crippling behaviour of perforated roll-formed aluminium alloy unlipped channels under interior-two flange loading. J. Build. Eng. 2022, 51, 104261. [Google Scholar] [CrossRef]
- Ritchie, P.A.; Thomas, D.A.; Lu, L.W.; Conelly, G.M. External reinforcement of concrete beams using fibre reinforced plastics. ACI Struct. J. 1991, 88, 490–500. [Google Scholar]
- Quantrill, R.J.; Hollaway, L.C.; Thorne, A.M. Experimental and analytical investigation of FRP strengthened beam response: Part I. Mag. Concr. Res. 1996, 48, 331–342. [Google Scholar] [CrossRef]
- Arduini, M.; Di Tommaso, A.; Nanni, A. Brittle failure in FRP plate and sheet bonded beams. ACI Struct. J. 1997, 94, 363–370. [Google Scholar]
- Garden, H.N.; Hollaway, L.C.; Thorne, A.M. A preliminary evaluation of carbon fibre reinforced polymer plates for strengthening reinforced concrete members. Proc. Inst. Civ. Eng. Struct. Build. 1997, 123, 127–142. [Google Scholar] [CrossRef]
- Garden, H.N.; Quantrill, R.J.; Hollaway, L.C.; Thorne, A.M.; Parke, G.A.R. An experimental study of the anchorage length of carbon fiber composite plates used to strengthen reinforced concrete beams. Constr. Build. Mater. 1998, 12, 203–219. [Google Scholar] [CrossRef]
- Beber, A.J.; Campos Filho, A.; Campagnolo, J.L. Flexural strengthening of R/C beams with CFRP sheets. In Proceedings of the 8th International Conference in Structural Faults - Repair-99, London, UK, 13–15 July 1999. [Google Scholar]
- David, E.; Djelal, C.; Ragneau, E.; Bodin, F.B. Use of FRP to strengthen and repair RC beams: Experimental study and numerical simulations. In Proceedings of the Eighth International Conference on Advanced Composites for Concrete Repair, London, UK, 1999. [Google Scholar]
- Hau, K.M. Experiments on Concrete Beams Strengthened by Bonding Fibre Reinforced Plastic Sheets. Master’s Thesis, The Hong Kong Polytechnic University, Hong Kong, China, 1999. [Google Scholar]
- Tumialan, G.; Serra, P.; Nanni, A.; Belarbi, A. Concrete cover delamination in reinforced concrete beams strengthened with carbon fiber reinforced polymer sheets. In Proceedings of the Fourth International Symposium on Fiber Reinforced Polymer Reinforcement for Reinforced Concrete Structures, Baltimore, MD, USA, 1 January 1999; pp. 725–735. [Google Scholar]
- Ahmed, O.A.F. Strengthening of R. C. Beams by Means of Externally bonded CFRP Laminates: Improved Model for Plateend shear. Ph.D. Thesis, Department of Civil Engineering, Catholicke University of Leuven, Leuven, Belgium, 2000. [Google Scholar]
- Matthys, S. Structural Behavior and Design of Concrete Beams Strengthened with Externally Bonded FRP Reinforcement. Ph.D. Thesis, Ghent University, Ghent, Belgium, 2000. [Google Scholar]
- Fanning, P.J.; Kelly, O. Ultimate Response of RC Beams Strengthened with CFRP Plates. J. Compos. Constr. 2001, 5, 122–127. [Google Scholar] [CrossRef]
- Gao, B.; Leung, W.; Cheung, C.; Kim, J.K.; Leung, C.K.Y. Effects of adhesive properties on strengthening of concrete beams with composite strips. In Proceedings of the International Conference on FRP Composites in Civil Engineering, Hong Kong, China, 12–15 December 2001; pp. 423–432. [Google Scholar]
- Maalej, M.; Bian, Y. Interfacial shear stress concentration in FRP-strengthened beams. Compos. Struct. 2001, 54, 417–426. [Google Scholar] [CrossRef]
- Nguyen, D.M.; Chan, T.K.; Cheong, H.K. Brittle Failure and Bond Development Length of CFRP-Concrete Beams. J. Compos. Constr. 2001, 5, 12–17. [Google Scholar] [CrossRef]
- Rahimi, H.; Hutchinson, A. Concrete Beams Strengthened with Externally Bonded FRP Plates. J. Compos. Constr. 2001, 5, 44–56. [Google Scholar] [CrossRef]
- Smith, S.; Teng, J.G. Shear-Bending Interaction in Debonding Failures of FRP-Plated RC Beams. Adv. Struct. Eng. 2003, 6, 183–199. [Google Scholar] [CrossRef]
- Valcuende, M.; Benlloch, J.; Parra, C.J. Ductility of reinforced concrete beams strengthened with CFRP strips and fabric. In Proceedings of the Sixth International Symposium on FRP Reinforcement for Concrete Structures, Singapore, 8–10 July 2003; pp. 337–346. [Google Scholar]
- Breña, S.F.; Macri, B.M. Effect of Carbon-Fiber-Reinforced Polymer Laminate Configuration on the Behavior of Strengthened Reinforced Concrete Beams. J. Compos. Constr. 2004, 8, 229–240. [Google Scholar] [CrossRef]
- Gao, B.; Kim, J.K.; Leung, C.K.Y. Taper ended FRP strips bonded to RC beams: Experiments and FEM analysis. In Proceedings of the Second International Conference on FRP in Civil Engineering, Adelaide, Australia, 8–10 December 2004; pp. 399–405. [Google Scholar]
- Gao, B.; Kim, J.-K.; Leung, C.K. Experimental study on RC beams with FRP strips bonded with rubber modified resins. Compos. Sci. Technol. 2004, 64, 2557–2564. [Google Scholar] [CrossRef]
- Grace, N.F.; Singh, S.B. Durability evaluation of carbon fiber-reinforced polymer strengthened concrete beams: Experimental study and design. ACI Struct. J. 2005, 102, 40–48. [Google Scholar]
- Pham, H.B.; Al-Mahaidi, R. Prediction algorithms for debonding failure loads of carbon fiber reinforced polymer retrofitted reinforced concrete beams. J. Compos. Constr. 2006, 10, 48–59. [Google Scholar] [CrossRef]
- Benjeddou, O.; Ben Ouezdou, M.; Bedday, A. Damaged RC beams repaired by bonding of CFRP laminates. Constr. Build. Mater. 2007, 21, 1301–1310. [Google Scholar] [CrossRef]
- Esfahani, M.R.; Kianoush, M.R.; Tajari, A.R. Flexural behavior of reinforced concrete beams strengthened by CFRP sheets. Eng. Struct. 2007, 29, 2428–2444. [Google Scholar] [CrossRef]
- Ceroni, F. Experimental performances of RC beams strengthened with FRP materials. Constr. Build. Mater. 2010, 24, 1547–1559. [Google Scholar] [CrossRef]
- Al-Tamimi, A.K.; Hawileh, R.; Abdalla, J.; Rasheed, H.A. Effects of Ratio of CFRP Plate Length to Shear Span and End Anchorage on Flexural Behavior of SCC RC Beams. J. Compos. Constr. 2011, 15, 908–919. [Google Scholar] [CrossRef]
- Sadrmomtazi, A.; Rasmi Atigh, H.; Sobhan, J. Experimental and analytical investigation on bond performance of the interfacial debonding in flexural strengthened RC beams with CFRP sheets at tensile face. Asian J. Civ. Eng. (BHRC) 2014, 15, 391–410. [Google Scholar]
- Hasnat, A.; Islam, M.M.; Amin, A.F.M.S. Enhancing the Debonding Strain Limit for CFRP-Strengthened RC Beams Using U-Clamps: Identification of Design Parameters. J. Compos. Constr. 2016, 20. [Google Scholar] [CrossRef]
- Skuturna, T.; Valivonis, J. Experimental study on the effect of anchorage systems on RC beams strengthened using FRP. Compos. Part B Eng. 2016, 91, 283–290. [Google Scholar] [CrossRef]
- Saadatmanesh, H.; Ehsani, M.R. RC beams strengthened with GFRP plates. I: Experimental study. J. Struct. Eng. 1991, 117, 3417–3433. [Google Scholar] [CrossRef]
- Arduini, M.; Nanni, A. Behavior of Precracked RC Beams Strengthened with Carbon FRP Sheets. J. Compos. Constr. 1997, 1, 63–70. [Google Scholar] [CrossRef]
- Spadea, G.; Swamy, R.N.; Bencardino, F. Strength and Ductility of RC Beams Repaired with Bonded CFRP Laminates. J. Bridg. Eng. 2001, 6, 349–355. [Google Scholar] [CrossRef]
- White, T.W.; Soudki, K.A.; Erki, M.-A. Response of RC Beams Strengthened with CFRP Laminates and Subjected to a High Rate of Loading. J. Compos. Constr. 2001, 5, 153–162. [Google Scholar] [CrossRef]
- Grace, N.F.; Abdel-Sayed, G.; Ragheb, W. Strengthening of concrete beams using innovative ductile fiber-reinforced polymer fabric. Struct. J. 2002, 99, 692–700. [Google Scholar]
- Alagusundaramoorthy, P.; Harik, I.E.; Choo, C.C. Flexural Behavior of R/C Beams Strengthened with Carbon Fiber Reinforced Polymer Sheets or Fabric. J. Compos. Constr. 2003, 7, 292–301. [Google Scholar] [CrossRef]
- Maalej, M.; Leong, K. Effect of beam size and FRP thickness on interfacial shear stress concentration and failure mode of FRP-strengthened beams. Compos. Sci. Technol. 2005, 65, 1148–1158. [Google Scholar] [CrossRef]
- Zhang, A.-H.; Jin, W.-L.; Li, G.-B. Behavior of preloaded RC beams strengthened with CFRP laminates. J. Zhejiang Univ. A 2006, 7, 436–444. [Google Scholar] [CrossRef]
- Lee, S.; Moy, S. A Method for Predicting the Flexural Strength of RC Beams Strengthened with Carbon Fiber Reinforced Polymer. J. Reinf. Plast. Compos. 2007, 26, 1383–1401. [Google Scholar] [CrossRef]
- Rusinowski, P.; Täljsten, B. Intermediate Crack Induced Debonding in Concrete Beams Strengthened with CFRP Plates—An Experimental Study. Adv. Struct. Eng. 2009, 12, 793–806. [Google Scholar] [CrossRef]
- Gunes, O.; Buyukozturk, O.; Karaca, E. A fracture-based model for FRP debonding in strengthened beams. Eng. Fract. Mech. 2009, 76, 1897–1909. [Google Scholar] [CrossRef]
- Pan, J.; Leung, C.K.; Luo, M. Effect of multiple secondary cracks on FRP debonding from the substrate of reinforced concrete beams. Constr. Build. Mater. 2010, 24, 2507–2516. [Google Scholar] [CrossRef]
- Sena-Cruz, J.M.; Barros, J.A.; Coelho, M.R.; Silva, L.F. Efficiency of different techniques in flexural strengthening of RC beams under monotonic and fatigue loading. Constr. Build. Mater. 2012, 29, 175–182. [Google Scholar] [CrossRef] [Green Version]
- Kotynia, R. Debonding failures of RC beams strengthened with externally bonded strips. In Proceedings of the International Symposium on Bond Behaviour of FRP in Structures (BBFS 2005), Hong Kong, China, 7–9 December 2005. [Google Scholar]
- Al-Zaid, R.A.; El-Sayed, A.K.; Al-Negheimish, A.I.; Shuraim, A.B.; Alhozaimy, A.M. Strengthening of structurally damaged wide shallow RC beams using externally bonded CFRP plates. Lat. Am. J. Solids Struct. 2014, 11, 946–965. [Google Scholar] [CrossRef] [Green Version]
- Yalim, B.; Kalayci, A.S.; Mirmiran, A. Performance of FRP-Strengthened RC Beams with Different Concrete Surface Profiles. J. Compos. Constr. 2008, 12, 626–634. [Google Scholar] [CrossRef]
- Bi, Y.; Wu, S.; Pei, J.; Wen, Y.; Li, R. Correlation analysis between aging behavior and rheological indices of asphalt binder. Constr. Build. Mater. 2020, 264, 120176. [Google Scholar] [CrossRef]
- Kong, L.; Chen, X.; Du, Y. Evaluation of the effect of aggregate on concrete permeability using grey correlation analysis and ANN. Comput. Concr. 2016, 17, 613–628. [Google Scholar] [CrossRef]
- Huang, C.-H.; Hsieh, S.-H. Predicting BIM labor cost with random forest and simple linear regression. Autom. Constr. 2020, 118, 103280. [Google Scholar] [CrossRef]
- Wang, X.; Liang, Y.; Wang, Q.; Zhang, Z. Empirical models for tool forces prediction of drag-typed picks based on principal component regression and ridge regression methods. Tunn. Undergr. Space Technol. 2017, 62, 75–95. [Google Scholar] [CrossRef]
- Dabiri, H.; Farhangi, V.; Moradi, M.J.; Zadehmohamad, M.; Karakouzian, M. Applications of Decision Tree and Random Forest as Tree-Based Machine Learning Techniques for Analyzing the Ultimate Strain of Spliced and Non-Spliced Reinforcement Bars. Appl. Sci. 2022, 12, 4851. [Google Scholar] [CrossRef]
- Moradi, N.; Tavana, M.H.; Habibi, M.R.; Amiri, M.; Moradi, M.J.; Farhangi, V. Predicting the Compressive Strength of Concrete Containing Binary Supplementary Cementitious Material Using Machine Learning Approach. Materials 2022, 15, 5336. [Google Scholar] [CrossRef]
- Xue, J.; Shen, B. Dung beetle optimizer: A new meta-heuristic algorithm for global optimization. J. Supercomput. 2022, 1–32. [Google Scholar] [CrossRef]


| Codes | PE Debonding | IC Debonding |
|---|---|---|
| ACI440.2R | ||
| fib | ||
| TR55 | ||
| AS 5100.8 | ||
| CNR | ||
| JSCE | ||
| CECS |
| PE Debonding | IC Debonding | |||
|---|---|---|---|---|
| Models | Coefficient of Variation | Conservative Value | Coefficient of Variation | Conservative Value |
| ACI440.2R | 26.6% | 100% | 46.8% | 29% |
| fib | 25.1% | 100% | 45.4% | 40% |
| TR55 | 48.3% | 39% | 38.6% | 96% |
| AS 5100.8 | 44.5% | 38% | ||
| CNR | 40.1% | 94% | ||
| JSCE | 44.7% | 94% | ||
| CECS | 38.8% | 14% | ||
| DBO-BP | 19% | 48% | 10% | 42% |
| P | P | ||||||||||||||
|---|---|---|---|---|---|---|---|---|---|---|---|---|---|---|---|
| H | O | ||||||||||||||
| h1 | h2 | h3 | h4 | h5 | h6 | h7 | h8 | h9 | h10 | h11 | h12 | h13 | V | ||
| I | Φ | −0.9 | −0.5 | −0.3 | −0.4 | 0.3 | 0.5 | −0.6 | 1.2 | −0.5 | −0.4 | −0.9 | −0.7 | −0.7 | |
| a1 | 1.0 | −0.4 | −0.2 | −0.9 | −0.1 | −0.3 | −0.1 | −0.2 | −0.5 | −0.1 | 0.8 | 0.6 | 0.2 | ||
| a2 | 0.8 | 0.4 | −1.1 | 0.3 | 0.9 | −1.5 | 0.7 | 0.1 | 0.4 | 0.5 | −0.6 | 0.4 | −0.1 | ||
| a3 | −1.2 | 0.0 | −0.3 | −1.1 | −0.1 | 0.3 | −0.8 | 0.6 | 0.6 | −0.1 | −0.4 | −0.4 | −0.1 | ||
| a4 | −0.8 | 0.4 | −1.2 | 1.2 | −1.1 | 1.7 | 0.0 | −1.1 | 0.1 | −0.2 | −0.8 | −0.7 | 0.4 | ||
| a5 | 0.0 | −0.1 | 0.9 | −1.6 | 0.7 | −1.0 | −0.6 | 0.9 | 0.0 | −0.3 | −1.2 | 1.3 | 0.4 | ||
| a6 | 0.0 | 1.5 | −0.8 | −0.2 | 0.5 | 0.7 | 0.8 | 0.6 | 0.2 | −0.1 | −1.4 | 0.1 | −0.8 | ||
| a7 | 0.0 | 0.8 | 0.8 | 0.6 | 0.0 | −0.7 | −0.1 | 0.5 | 0.2 | 0.3 | −1.0 | −0.9 | −0.4 | ||
| H | Φ | 0.4 | |||||||||||||
| h1 | 1.0 | ||||||||||||||
| h2 | −1.1 | ||||||||||||||
| h3 | 0.9 | ||||||||||||||
| h4 | −1.5 | ||||||||||||||
| h5 | −0.7 | ||||||||||||||
| h6 | 0.9 | ||||||||||||||
| h7 | 1.3 | ||||||||||||||
| h8 | 0.4 | ||||||||||||||
| h9 | 0.5 | ||||||||||||||
| h10 | 0.3 | ||||||||||||||
| h11 | −1.5 | ||||||||||||||
| h12 | −1.2 | ||||||||||||||
| h13 | 1.3 | ||||||||||||||
| P | |||||||
|---|---|---|---|---|---|---|---|
| H | O | ||||||
| h1 | h2 | h3 | h4 | h5 | ε | ||
| I | Φ | −0.6 | 0.4 | −0.3 | 1.1 | −0.1 | |
| b1 | 0.9 | −1.2 | −0.4 | −0.2 | −0.8 | ||
| b2 | −0.4 | −0.6 | 0.7 | −0.6 | 1.0 | ||
| b3 | −0.1 | 0.3 | 0.1 | 0.6 | 0.7 | ||
| b4 | −0.4 | 0.8 | 1.2 | −0.1 | −0.8 | ||
| b5 | −0.6 | 0.1 | 0.2 | 0.0 | 0.8 | ||
| b6 | −1.6 | −0.8 | −0.2 | 1.1 | 1.0 | ||
| b7 | 0.3 | 0.4 | 0.0 | 0.4 | −0.8 | ||
| b8 | −0.6 | −1.0 | −0.2 | −0.9 | 0.6 | ||
| H | Φ | 0.7 | |||||
| h1 | 1.5 | ||||||
| h2 | 0.7 | ||||||
| h3 | −0.6 | ||||||
| h4 | −0.8 | ||||||
| h5 | 1.5 | ||||||
Disclaimer/Publisher’s Note: The statements, opinions and data contained in all publications are solely those of the individual author(s) and contributor(s) and not of MDPI and/or the editor(s). MDPI and/or the editor(s) disclaim responsibility for any injury to people or property resulting from any ideas, methods, instructions or products referred to in the content. |
© 2023 by the authors. Licensee MDPI, Basel, Switzerland. This article is an open access article distributed under the terms and conditions of the Creative Commons Attribution (CC BY) license (https://creativecommons.org/licenses/by/4.0/).
Share and Cite
Hu, T.; Zhang, H.; Zhou, J. Prediction of the Debonding Failure of Beams Strengthened with FRP through Machine Learning Models. Buildings 2023, 13, 608. https://doi.org/10.3390/buildings13030608
Hu T, Zhang H, Zhou J. Prediction of the Debonding Failure of Beams Strengthened with FRP through Machine Learning Models. Buildings. 2023; 13(3):608. https://doi.org/10.3390/buildings13030608
Chicago/Turabian StyleHu, Tianyu, Hong Zhang, and Jianting Zhou. 2023. "Prediction of the Debonding Failure of Beams Strengthened with FRP through Machine Learning Models" Buildings 13, no. 3: 608. https://doi.org/10.3390/buildings13030608