Article

Research on Characterization of 3D Morphology of Coarse Aggregate Based on Laser Scanning

1
School of Urban Construction, Wuhan University of Science and Technology, Wuhan 430070, China
2
School of Machinery and Automation, Wuhan University of Science and Technology, Wuhan 430081, China
*
Author to whom correspondence should be addressed.
Buildings 2023, 13(4), 1029; https://doi.org/10.3390/buildings13041029
Submission received: 2 March 2023 / Revised: 5 April 2023 / Accepted: 11 April 2023 / Published: 14 April 2023

Abstract

:
The morphology of coarse aggregate has a significant impact on the road performance of asphalt mixtures and aggregate characterization studies, but many studies were based on the two-dimensional morphology of coarse aggregate, which failed to consider morphological characteristics in a holistic manner. In order to quantitatively analyze the shape, angularity, and texture characteristics of roadway coarse aggregates, a rapid and accurate multiparameter characterization method of coarse aggregate 3D morphology is explored in this article. A 3D laser scanner is used to obtain the 3D point cloud data of pebble, granite, and basalt, and the solid models of the three coarse aggregates are reconstructed. In addition, the fitted ellipsoidal algorithm and Laplace smoothing algorithm are proposed for the characterization analysis of the overall shape, angularity, and surface roughness of coarse aggregate, and the variation rules of multicharacteristic parameters of coarse aggregate are summarized. The results of the study show that the ratio of the three axes of the fitted ellipsoid can be used to classify the shape of coarse aggregate into four types, among which the cubic shape accounts for the majority of the coarse aggregate. By analyzing the fitted ellipsoidal value and the change rate of angularity of coarse aggregate, it is concluded that the larger the values of both, the more angular the aggregate is. Moreover, the study finds that the fitted ellipsoidal value can characterize not only the shape of coarse aggregate, but also its angularity to some extent. Compared with the spherical value, the fitted ellipsoidal value has better variability and is more “sensitive” to the overall data. The change in surface area can well characterize the texture of coarse aggregate. When the particle size is small, the larger the surface area change rate of the coarse aggregates, the better the roughness of the aggregates, among which the surface area change rate of basalt is the largest. The influence of aggregate morphology was not adequately considered in previous studies of asphalt-aggregate adhesion, and this study provides parameter help for subsequent quantitative analysis of the relationship between asphalt-aggregate adhesion and coarse aggregate morphology.

1. Introduction

Coarse aggregate is one of the most common construction materials used in road construction, accounting for 50–80% of the total amount of asphalt mixture, which constitutes the basic structural skeleton of asphalt pavement. The shape, size distribution, texture, strength, and other characteristics of coarse aggregate not only directly affect the performance of asphalt mixtures [1], but also affect the spalling property of asphalt pavements. The spalling of coarse aggregate can be divided into adhesion damage and cohesion damage, both of which are related to the morphology of asphalt and coarse aggregate [2]. Moreover, the binding of coarse aggregate to binder is related to the physical properties of coarse aggregates, such as porosity, texture, and surface area, so it can be seen that effective coarse aggregate morphology characterization is one of the relevant indicators of aggregate adhesion. Li et al. [3] studied the characteristics of coarse aggregate morphological parameters, particle size, and particle gradation by statistical analysis and 2D image digitization. According to the size in space and the aggregation pattern in the morphological analysis, the morphology of coarse aggregate can be divided into three categories: shape, angularity, and texture [4].
Wang et al. [5] described the shape of coarse aggregate by the shape index SI and roundness, and Zhao [6] proposed CHA (an evaluation index of angularity) to evaluate the angularity of coarse aggregate by using digital processing technology and computer technology combined with the convex packet algorithm. Regarding texture, Bessa et al. [7] used a high-resolution profilometer to collect the surface morphology data of samples to achieve the characterization of surface texture. Moreover, Lucas et al. [8] obtained the surface texture characteristics by wavelet-metering the image at the pixel level, while Masad and Button [9] used the corrosion-expansion method to quantify the texture characteristics of coarse aggregate. In addition, Zhang et al. [10] characterized the surface texture of coarse aggregate by analyzing the fractal dimension D. However, due to the serious impact of placement in the 2D method on the data and the incompleteness of the 2D analysis, an increasing number of scholars have described the morphology of coarse aggregate as a whole from a 3D perspective. Yang et al. [11] proposed the sphericity S for describing the degree of irregularity of coarse aggregate to characterize the shape of aggregate, which solved the problem of characterization inaccuracy by means of traditional measurements and 2D digitized images [12]. Fu et al. [13] identified the triangular mesh model surface of aggregate particles by using programming techniques to characterize the angularity of coarse aggregate by calculating the principal curvature and principal curvature direction. Additionally, Li et al. [14] used the box counting dimension method to quantitatively analyze the acquired surface texture of coarse aggregate.
In recent years, extraction techniques for morphological features of coarse aggregate have also been developed. Cheng et al. [15] obtained the internal structure of the mixture by CT tomography, and produced continuous 2D slice images by scanning, and finally aggregated the images into a 3D model. Then, Gao et al. [16] obtained the 3D angle (3DA) of coarse aggregate to characterize its angularity with the help of CT technology. Jin et al. [17] studied the angle and the surface texture of aggregate based on the surface triangulation method. With the increase in extraction methods for 3D modeling of coarse aggregate, the application of 3D morphological characterization of aggregate has been developed in various studies. For instance, Li et al. [18] studied the processing quality of aggregate by 3D morphological characterization. Apart from this, Lucas et al. [19] measured and evaluated the aggregate-binder adhesiveness by analyzing the angularity and texture of the aggregate. However, the study only analyzed the adhesiveness of coarse aggregates in the asphalt mixture, and lacked quantitative analysis of single coarse aggregates, which could not well investigate the adhesion mechanism between coarse aggregates and asphalt. In addition, literature analysis also found many other problems in the existing studies of characterization of coarse aggregate, such as the influence of how coarse aggregates are placed on characterization in 2D studies, complicated parameter calculation in 3D characterization, and the tedious process of obtaining models by CT scanning.
Therefore, the objective of this article is to quantitatively investigate the 3D morphological characteristics of single coarse aggregate and asphalt-coarse aggregate adhesiveness. For this purpose, laser scanning technology is used to obtain the 3D model of coarse aggregate, and the photoelectric colorimetric method is used to determine the degree of a strip of asphalt. Furthermore, a fitted ellipsoidal model with better shape reproduction is proposed to replace the previous sphericity model, and its programming algorithm and application in the experiment are detailed. Additionally, the Laplace smoothing algorithm is written to smooth the prominent textures on the surface of models, while reducing the destruction of the basic texture to the greatest extent. On this basis, this article studies the variation rule of 3D morphological features (shape, angularity, and texture) in three coarse aggregates with different lithologies.

2. Index of 3D Morphological Characterization of Coarse Aggregate and Algorithm

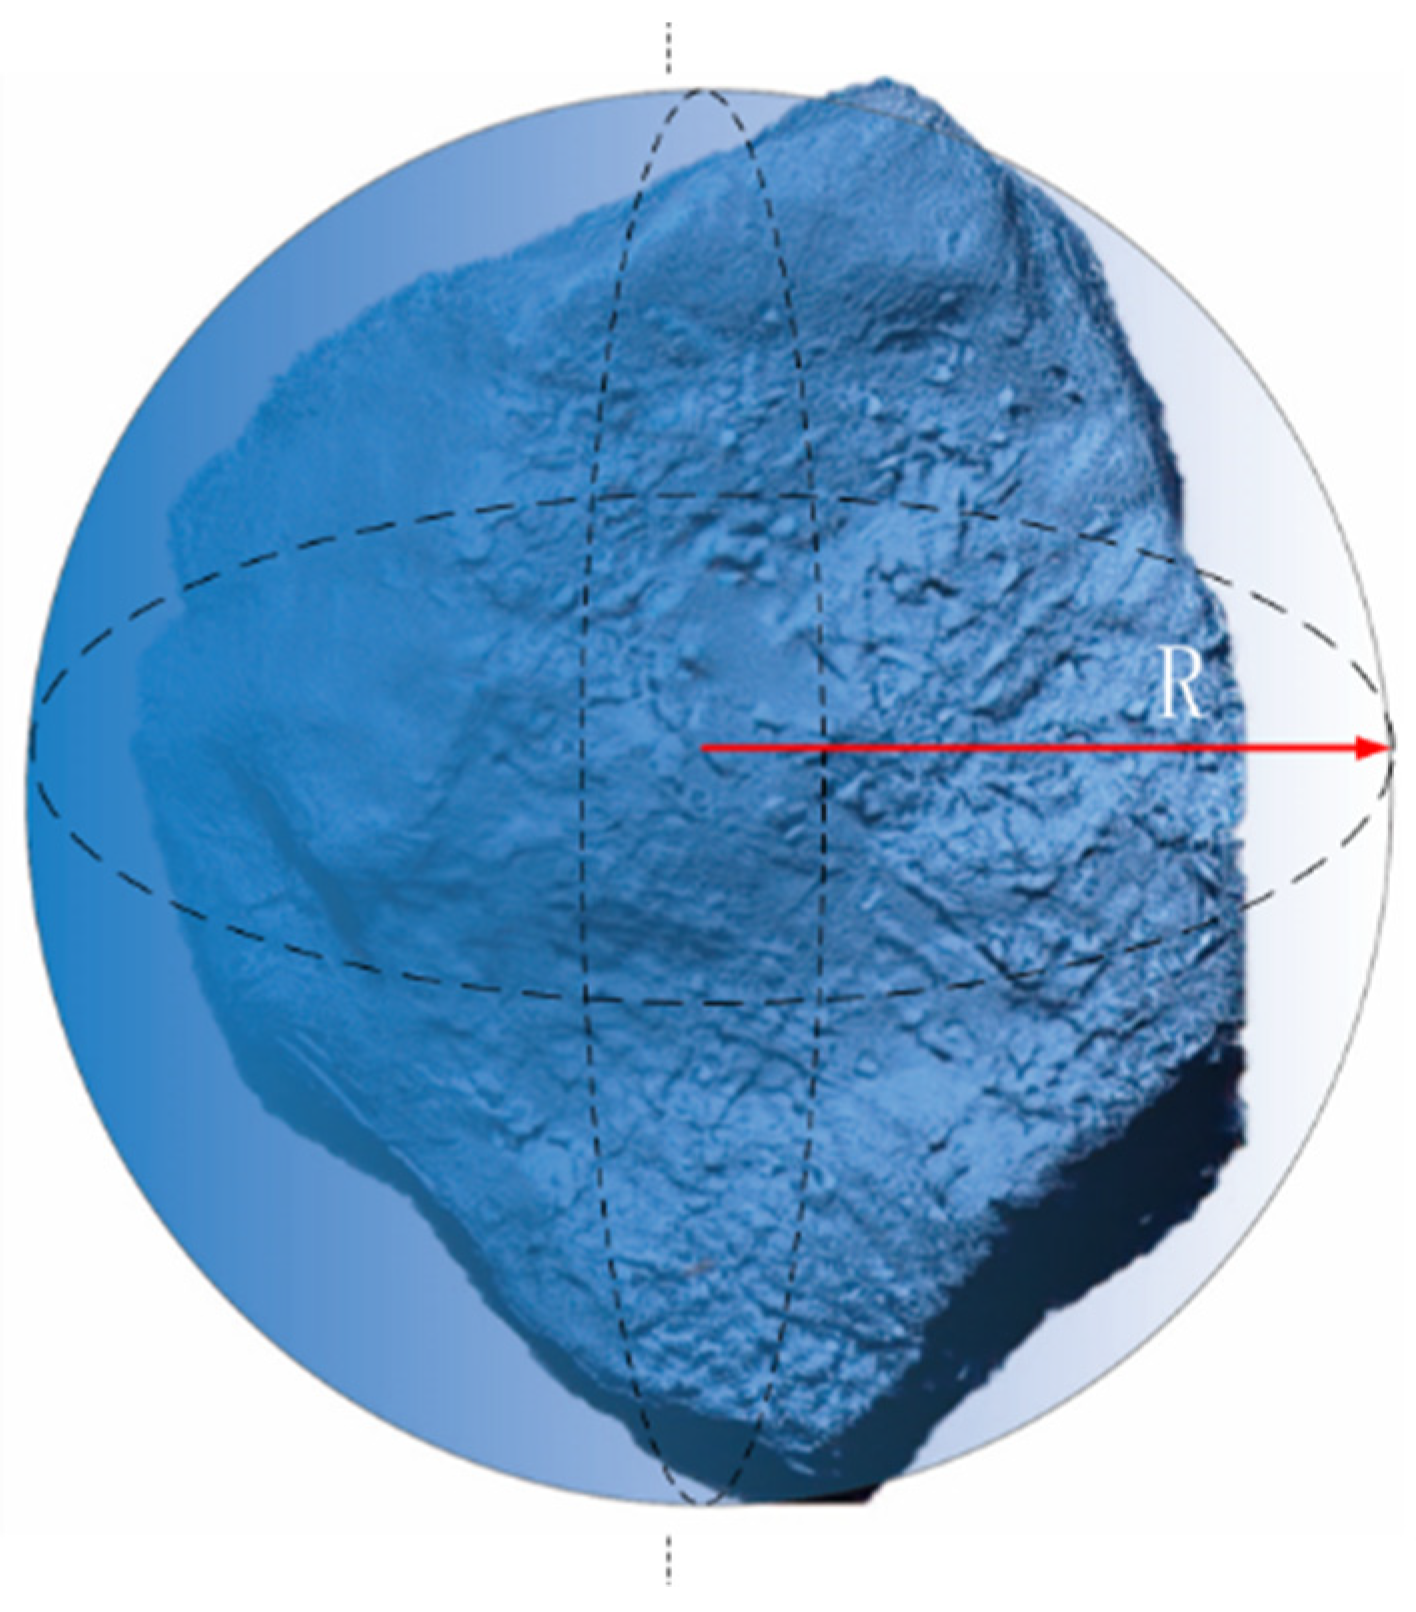
2.1. Fitting Ellipsoidal Value

For the morphological characterization of coarse aggregate, some studies applied rectangularity, i.e., finding the minimum external rectangle at the periphery of the aggregate model, and calculating the ratio relationship between the long, middle, and short axes of the rectangle so as to describe the morphology of aggregate. Other studies employed a sphericity value [20], where the larger sphericity value indicated that the 3D morphology of coarse aggregate is closer to a sphere. Still other studies evaluated the shape of the aggregate based on sphericity value and shape factor, and proposed the index of ellipsoidal value, which was the volume of the original model divided by the volume of the smallest external ellipsoid.
Due to the discrepancy between the models of the studies above and the initial model, this research attempts to characterize the morphology of coarse aggregate by the ratio between the long semi-axis (a), the middle semi-axis (b), and the short semi-axis (c) of the minimum fitted ellipsoid, as shown in Figure 1. Meanwhile, the angularity of coarse aggregate can also be characterized to some extent by calculating the fitted ellipsoidal degree E through the minimum-fit ellipsoidal model, the equation of which is given in Equation (1).
E = V 1 V 2
where V1 represents the volume of the fitted ellipsoid (mm3) and V2 represents the volume of the original 3D aggregate (mm3).
In previous studies, a sphericity value was proposed and used in the characterization of aggregates. However, the sphericity value would be affected by the angularity of coarse aggregate, causing variability due to the large angular projections, and thus making the sphericity model inconsistent with the actual shape. Furthermore, the subsequent studies found that the shape of coarse aggregate was close to an ellipsoidal shape. For this reason, the concept of ellipsoidal value, that is, using the similarity of aggregate to an ellipsoidal sphere, was proposed and verified to be effective in not only characterizing the shape to some extent, but also in reflecting the angularity characteristics of aggregate. Therefore, this study proposes an algorithm and obtains a new fitted ellipsoidal model that is different from the minimum external spherical model, as shown in Figure 2, where R denotes the diameter of the minimum external sphere.

2.1.1. Constructing the Penalty Function

To obtain the new fitted ellipsoid parameters, the penalty function needs to be constructed in the first place, which is based on the principle of minimizing the sum of the distances of all points to the surface of the ellipsoid, so as to find the closest ellipsoid. The ellipsoid is expressed by Equation (2). Then substitute the point cloud coordinates of the model into the ellipsoid equation to derive the function as in Equation (3) so as to find the a, b, and c that make the minimum f.
x 2 a 2 + y 2 b 2 + z 2 c 2 = 1
f = i = 1 n ( x i 2 a 2 + y i 2 b 2 + z i 2 c 2 1 ) 2
Next, a handheld 3D scanner is used to obtain the 3D point cloud coordinates (xi, yi, zi) of the coarse aggregate, and then the 3D point cloud coordinates are substituted into Equation (3) and a new multivariate function is obtained, as is shown in Equation (4). In order to facilitate the program calculation, the function can be simplified to the form of Equation (5), where n is the total number of all 3D point cloud data that make up the 3D model.
a r g m i n f ( x , y , z ) a , b , c = i = 1 n ( x i 2 a 2 + y i 2 b 2 + z i 2 c 2 1 ) 2
a r g m i n f ( x , y , z ) a ˙ , b ˙ , c ˙ = i = 1 n ( a ˙ x i 2 + b ˙ y i 2 + c ˙ z i 2 1 ) 2

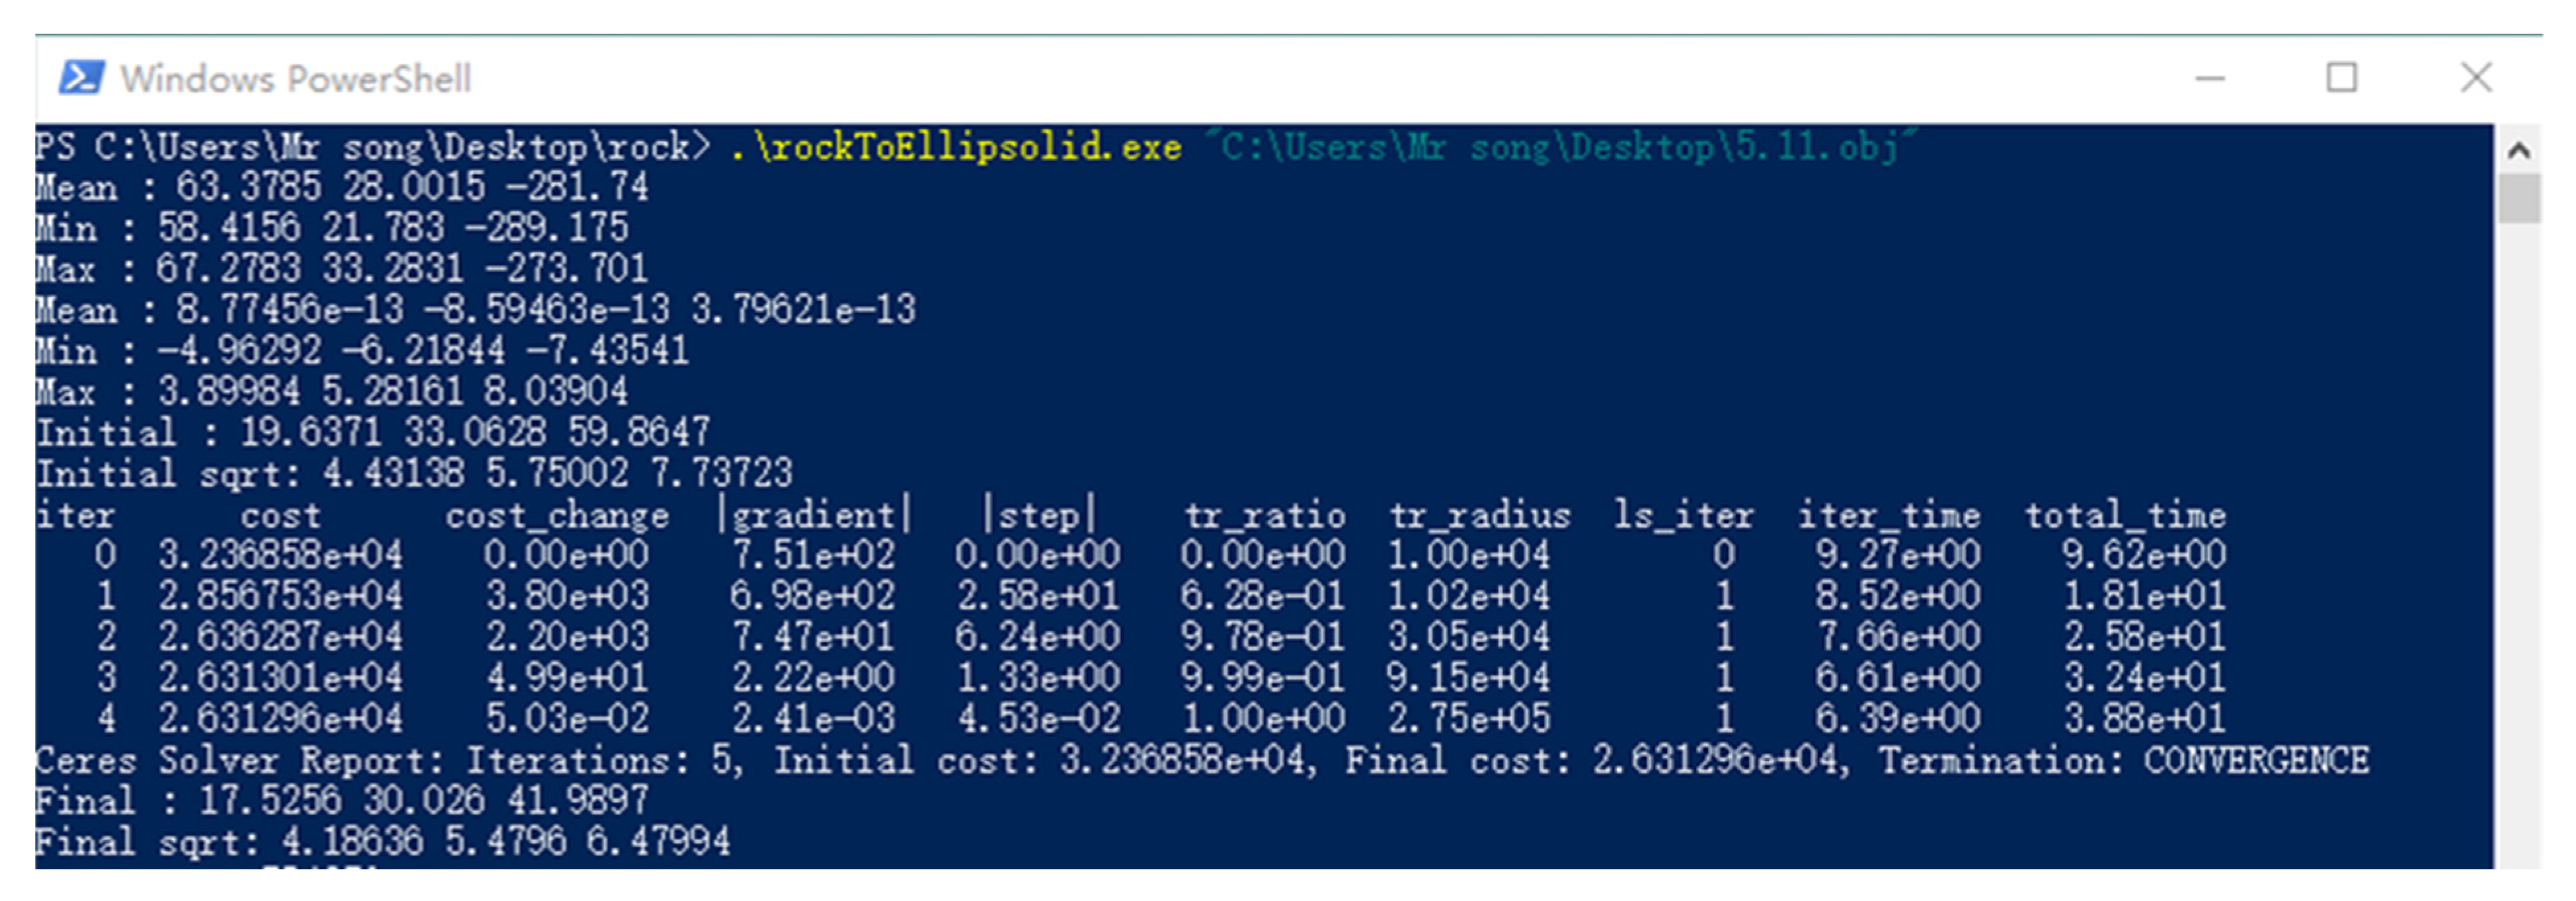
2.1.2. Optimizing Function

In order to improve the computational efficiency, it is necessary to optimize the original model by using optimization algorithms. There are many optimization methods such as gradient descent, the Newton method, conjugate gradient, the dogleg method, etc. Here, the Newton method is used to obtain the best-fitting ellipsoidal model for speeding up the convergence of the function and improving the efficiency of the operation. Substitute the point cloud coordinates of the model into the penalty function. To make the calculation result of the penalty function close to zero, the function is optimized by the Newton method to speed up the efficiency of the calculation, and the optimization stops when the function stops getting small.
Since this algorithm program is written by using the 3D mesh module in CGAL, the source code needs to be transcoded, and Cmake software (a cross-platform installation tool) is used here for transcoding. By transcoding the generated standard source files (C++, Unix), we obtain the runtime program, and the transcoding process is shown in Figure 3.
Based on the principles of the formulas presented above, the C++ algorithm program is written using VS. Several databases (iosteam, string, vector, cmake, and cgal) are used to program the point cloud data in order to apply it to the huge amount of point cloud data. First, the exponential residuals (error terms) are set. Then the triaxial parameters of the fitted ellipsoid are defined, and the equations are set. Here, the parameter squared is used to facilitate the calculation. The equations are then substituted into the main function to calculate the triaxial parameters, followed by parameter optimization until the exponential residuals are close to zero and the operation stops.
The fitted ellipsoid value is obtained by importing the 60 models into the algorithm program for calculation, and here the calculation result of the programming algorithm for one of the models is shown in Figure 4 to provide a parameter basis for later use.
The minimum rectangular bounding box, as a good model for 3D shape characterization, is used to verify the triaxial error of the fitted ellipsoid. The errors of the fitted ellipsoidal model are calculated by comparing the long, middle, and short axes of the minimum rectangular bounding box of all 60 coarse aggregate models with those of the fitted ellipsoidal models. In this article, MAE (mean absolute error) and RMSE (root mean square error) are introduced as the error assessment criteria. It can be seen in Table 1 that MAE ≤ 0.679 and RMSE ≤ 0.764 are both within the allowable error range, indicating that the parameters of the fitted ellipsoidal model are feasible. Compared with the minimum rectangular bounding box, the fitted ellipsoidal model can avoid the adverse effects caused by the large angularity of the aggregate projection and provide more accurate parameters for later calculation (volume and surface area of the fitted ellipsoidal model).

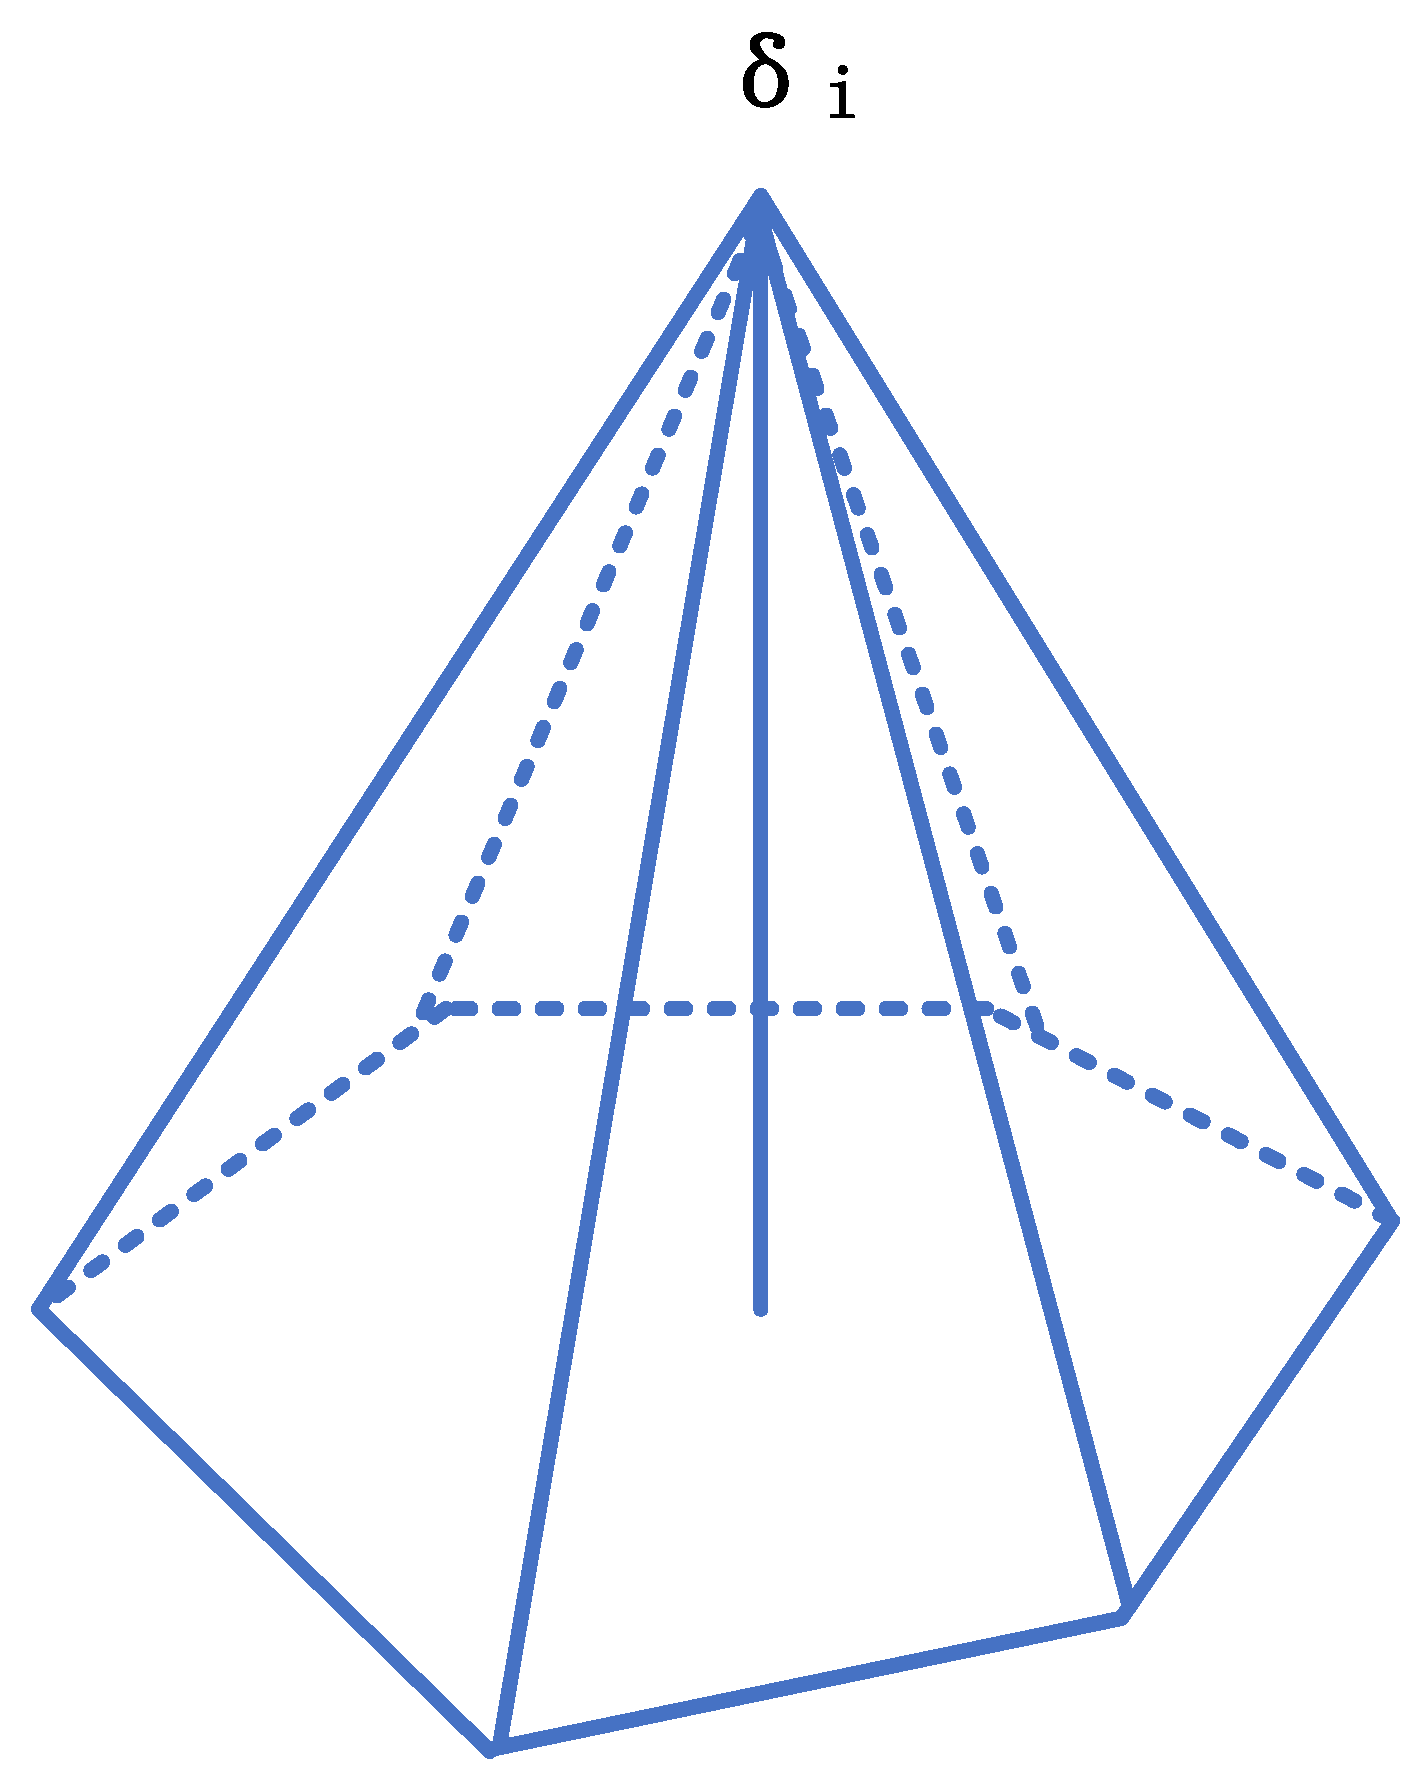
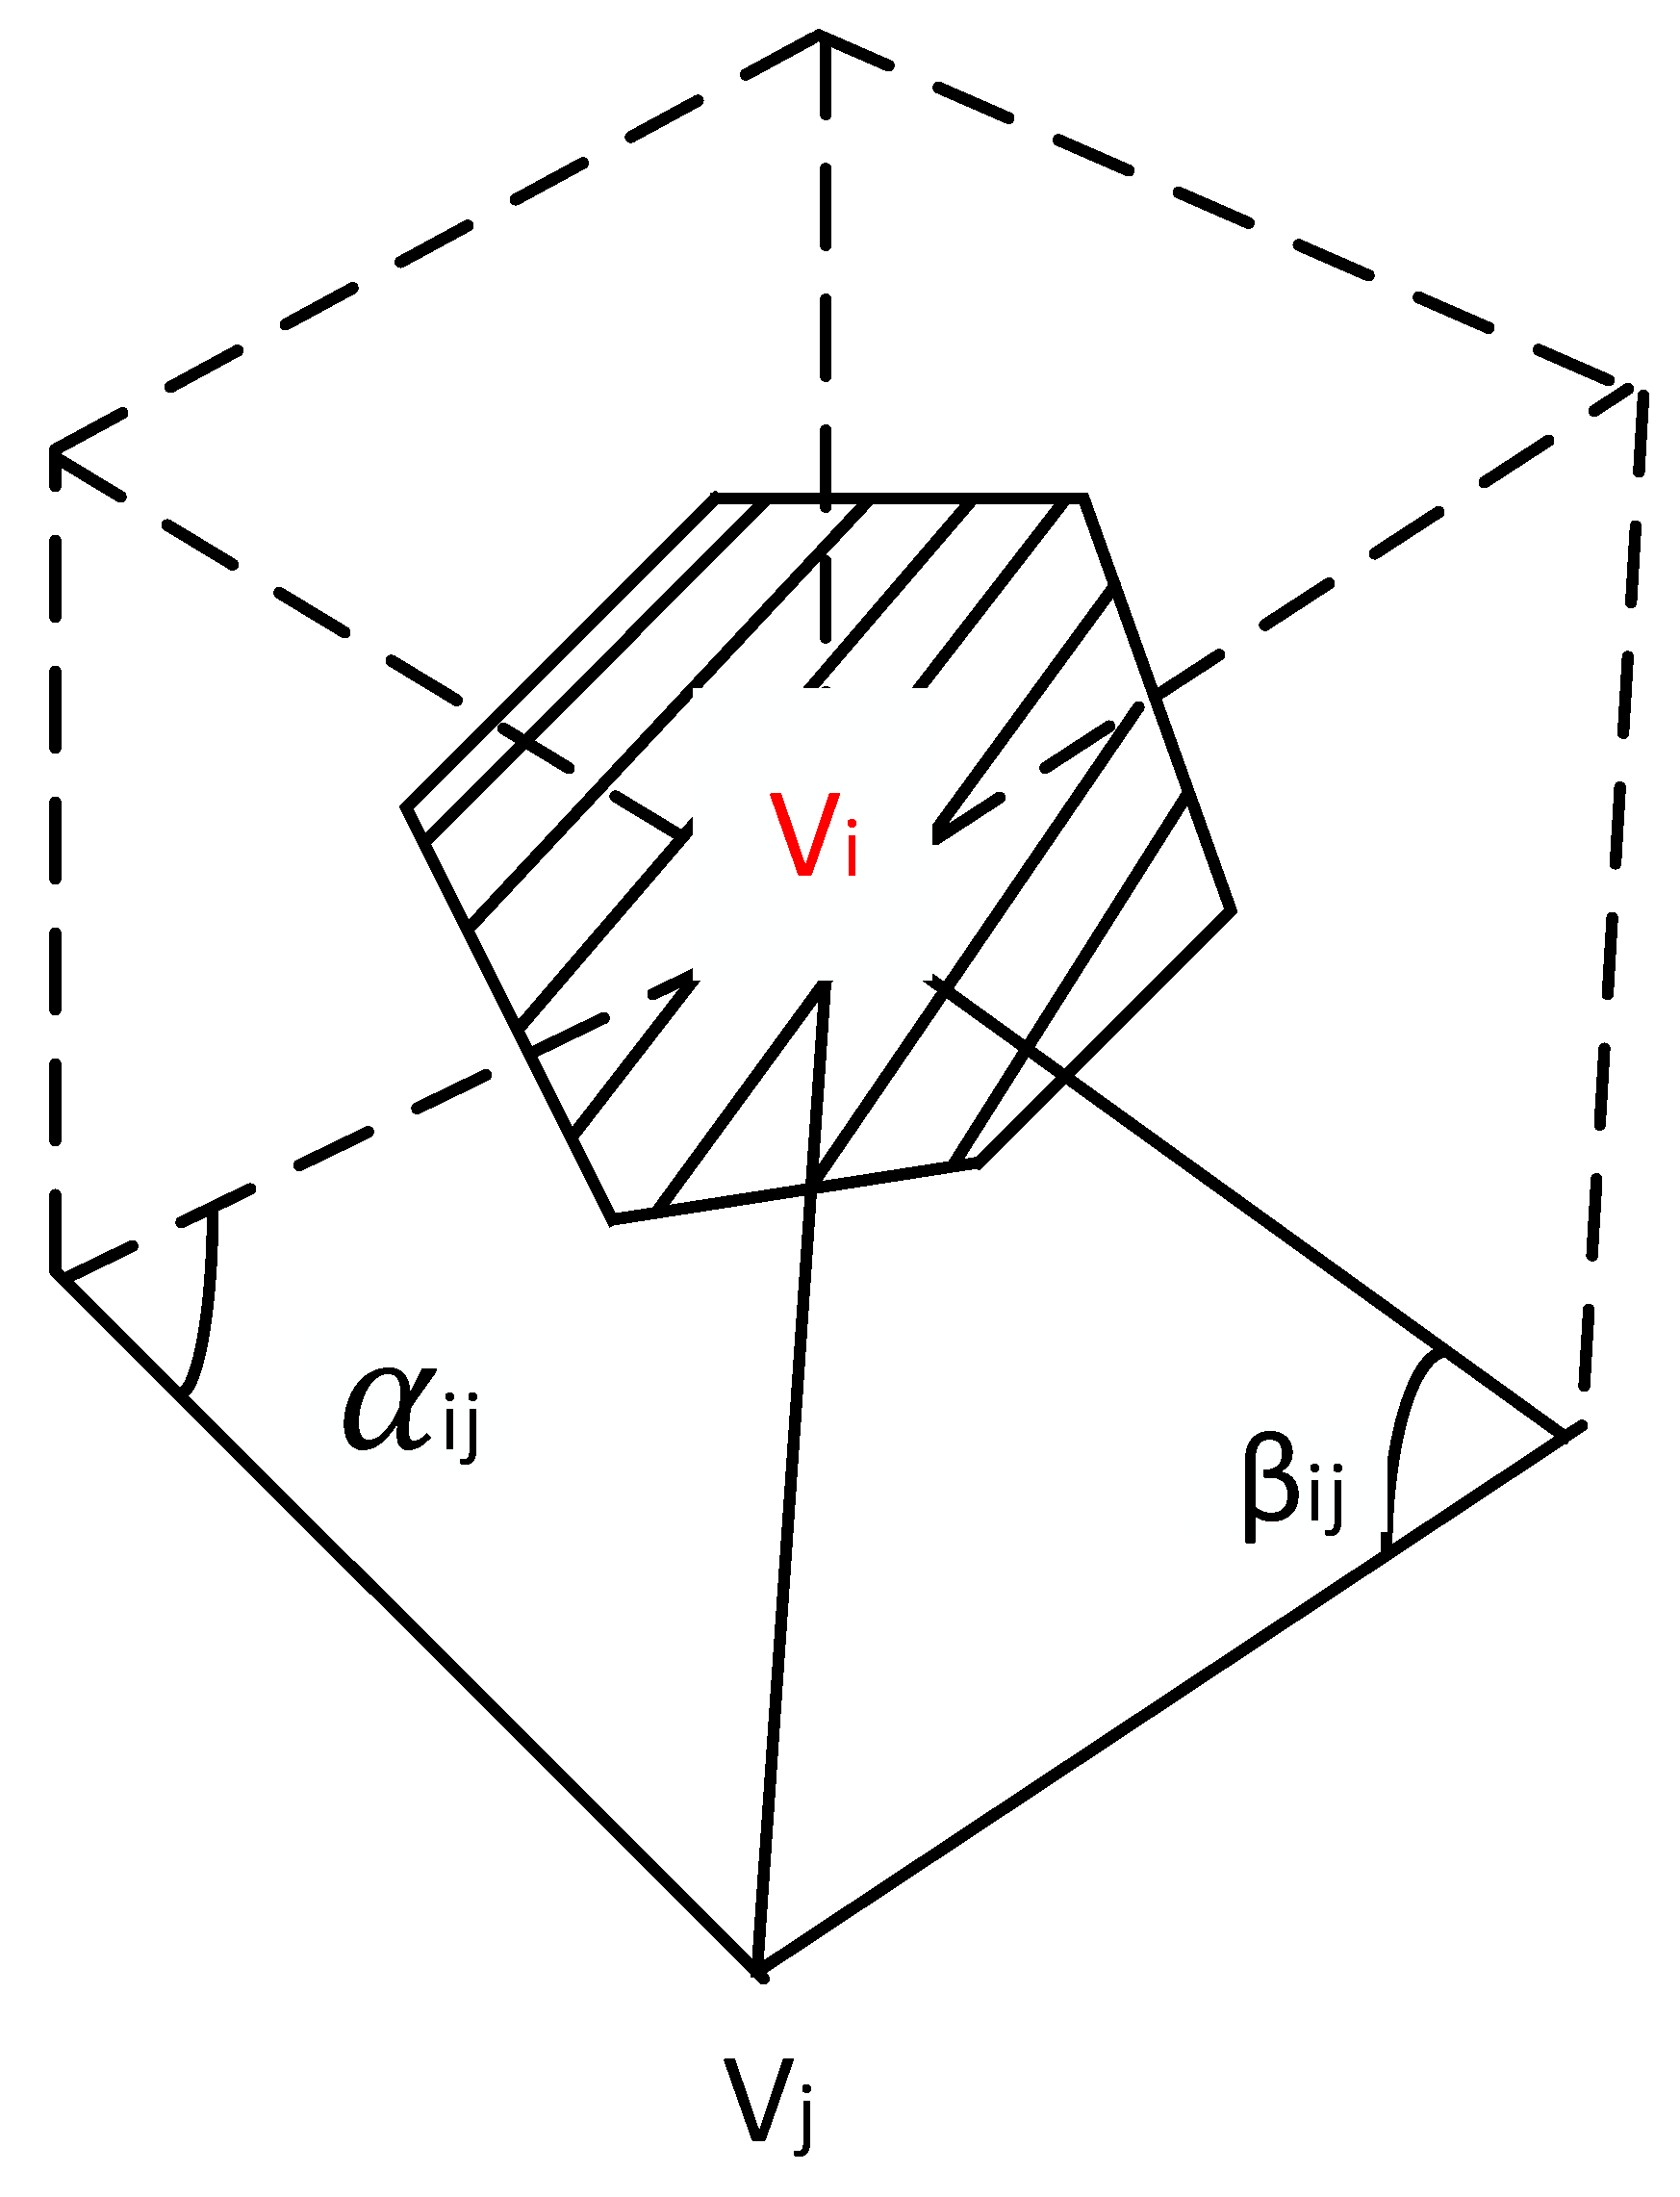
2.2. Rate of Change of Angularity

Before the advancement of 3D technology, the evaluation of the 2D angularity of an aggregate could be expressed by the equivalent area of a circle or an ellipse. There was also the smooth angularity index proposed by Tafesse et al. [21] and others, where the 2D aggregate was connected by smooth curves, and then the angularity of the aggregate was studied by analyzing the smooth curves. With the development of 3D modeling technology, the angularity index of aggregate can be expressed by the sphericity value [22], which is the ratio of the surface area of a sphere of the same volume to the surface area of an aggregate. Moreover, some studies express the angle of aggregate by the standard deviation and the maximum curvature obtained from the analysis of curvature. Since the variability of local angularity is not adequately considered in the calculation of the sphericity value, and since the influence of the aggregate shape on the results cannot be excluded when using the sphere as the equivalent aggregate outer contour, the sphericity cannot well characterize the angularity of aggregate in flake or with relatively large abrupt angular changes. Therefore, it is actually still a shape parameter index that cannot be well adapted to most shapes of aggregate types [23]. In this article, we propose to evaluate the angularity of coarse aggregate by the change rate of angularity, which is the ratio of the original surface area of aggregate to the surface area of the fitted ellipsoid, with the advantage of eliminating the interference of the shape of the aggregate for the angularity index, as shown in Equation (6).
D = S 0 S
where D represents the change rate of angularity; S represents the original surface area of coarse aggregate; S0 represents the surface area of the fitted ellipsoid.

2.3. Change Rate of Surface Area

Based on the textural characterization of the aggregate, some researchers have extended the 2D form of JRC (the evaluation index of rock surface roughness recommended by the International Society of Rock Mechanics) to its 3D form. Additionally, the local area on the fracture surface of the particles can be characterized by the method of point cloud coordinate calculation [24]. In this article, the texture description is based on the area change after the model processing, and through the parameter of surface area change rate, it reflects the textural change pattern of the aggregate more directly, which can provide more convenient verification parameters for other subsequent practical applications. The change in surface area is mainly obtained by smoothing the outer contour of the 3D model, eliminating the obvious protrusions on the surface, and restoring the geometric appearance of the original model to the greatest extent. The parameter of surface area change rate of coarse aggregate can accurately evaluate the complexity of the surface texture of coarse aggregate. The calculation of the parameter is simple and effective, simplifying the complexity of the calculation in previous studies and making it suitable for fast and accurate calculation in engineering. The formula for the surface area change rate is shown in Equation (7).
Δ S = S S 1 S
where ∆S represents change rate of surface area; S represents surface area of the original 3D aggregate model (mm2); S1 represents surface area of the 3D aggregate model after smoothing (mm2).
In order to obtain the surface area of the smoothly processed 3D aggregate model, the method of Laplacian coordinate reconstruction is applied for mesh smoothing, which means that the mode length of the original model’s Laplacian coordinate δ is reduced while the vector direction is not changed, and then further optimization of the model is performed. The principle of optimization is to make the same Laplacian coordinates equal to the Laplacian coordinates of the cosecant, and finally extend the coordinates of one point to the whole 3D model. Then we can get the Laplacian coordinates of all points close to the same as the cosecant Laplacian coordinates, so as to achieve optimization.
The collected point cloud data are processed to obtain the triangular grid model, on which the Laplacian coordinates of the vertex Vi can be interpreted as the difference of the weighted combination between the coordinates of Vi and the coordinates of one of its neighboring vertices. δ i is called the Laplacian operator, expressed as Equation (8), whose spatial geometric form is shown in Figure 5.
δ i = { i , j } E w i j v j v i = [ { i , j } E W i j v j ] v i
The weight satisfies the normalization and can be expressed as Equation (9).
w i j = ω i j { i , k } E ω i k
There are many choices of weights, and the most common ones are uniform weight and residual cut weight, which are shown in Equations (10) and (11), respectively.
ω i j = 1
ω i j = c o t   α + c o t   β
In order to facilitate the calculation, the original algorithm needs to be optimized. The optimization process for the Laplacian triangular grid is as follows: Firstly, the Laplacian coordinates δ are obtained by calculating the cotangent weight of the triangular grid surface. Then, the Laplacian matrix A under uniform weight is constructed. Then solve the equation AX = δ. The final optimized Laplacian operator model is shown in Figure 6.
According to the above theory, this research develops a C++ algorithm based on the VCGL template library (visualization and computer graphics library), which can process the original .obj graphics file and finally output the required .ply file. To eliminate the stitching error at the beginning of the stitching process, process half of the models first and then stitch them at the end to get the complete smoothed-out 3D reconstructed model. The comparison of the processed model and the original model is shown in Figure 7. This processing method can retain the shape of the original model to the greatest extent, making the data more accurate and more realistic.

3. Data Collection of Coarse Aggregate Morphology

3.1. Experimental Materials

Three kinds of coarse aggregates with different lithologies, namely, pebble, granite, and basalt, were used for the experiment, and 10 pieces of each kind with a nominal maximum particle size of 13.2 mm and 9.75 mm were selected, for a total of 60 pieces.

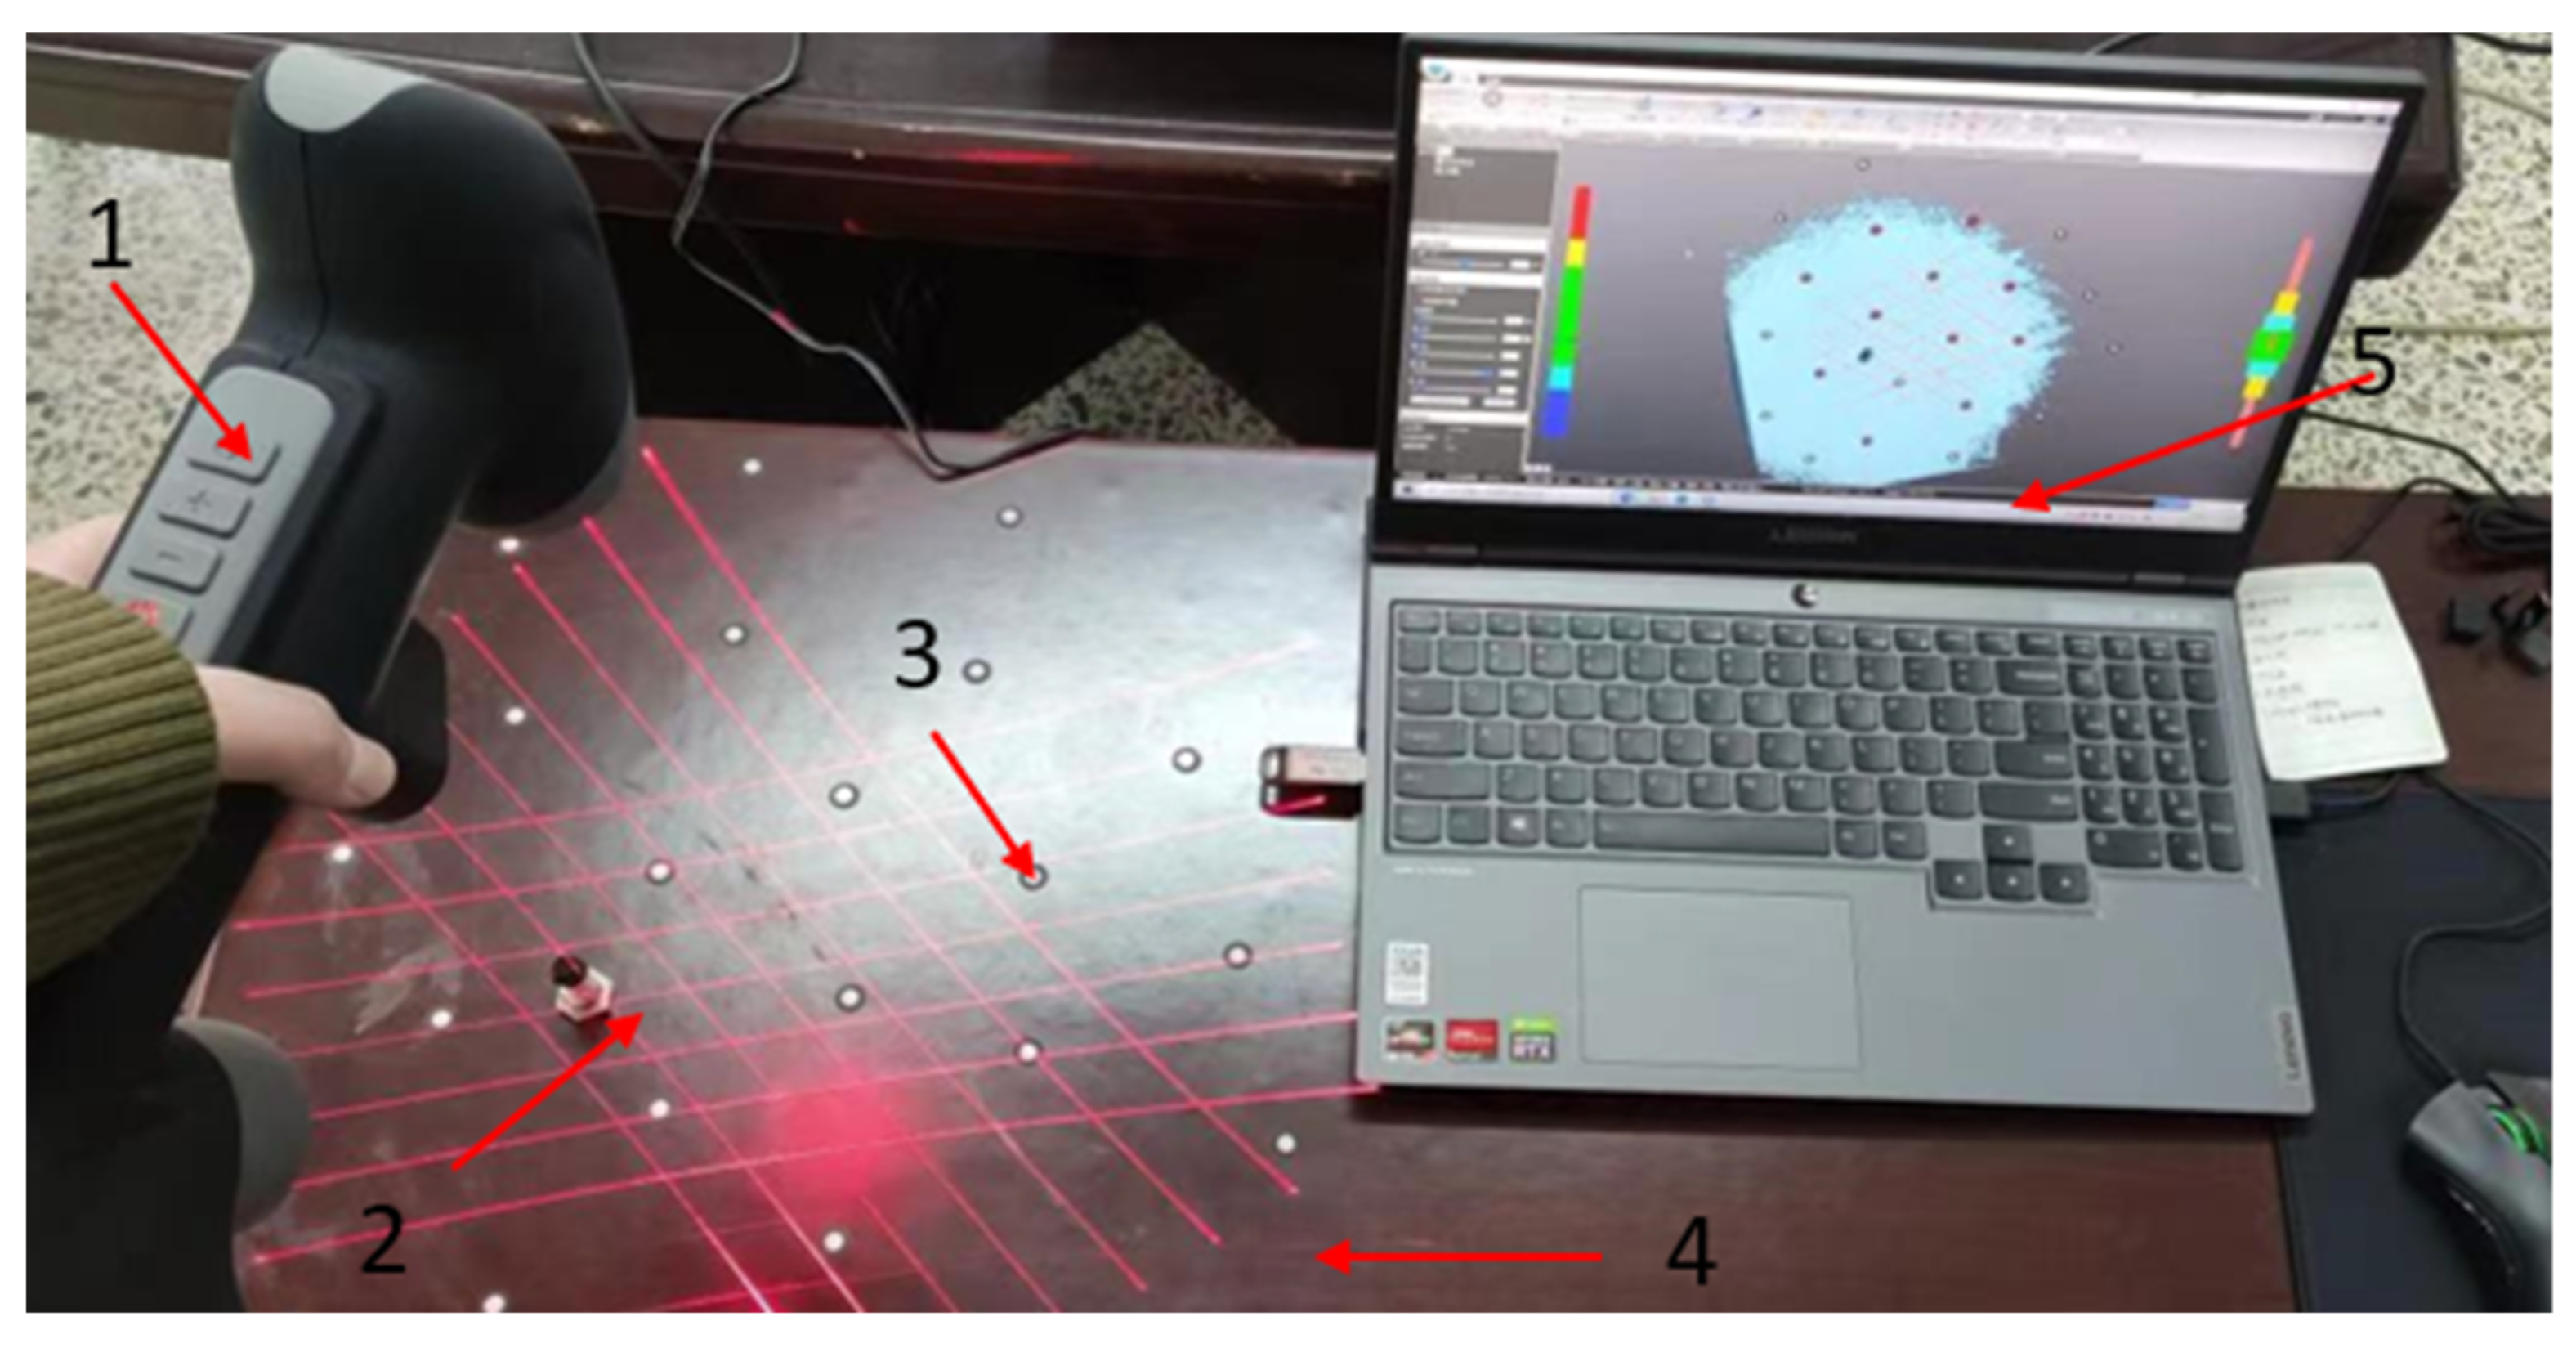
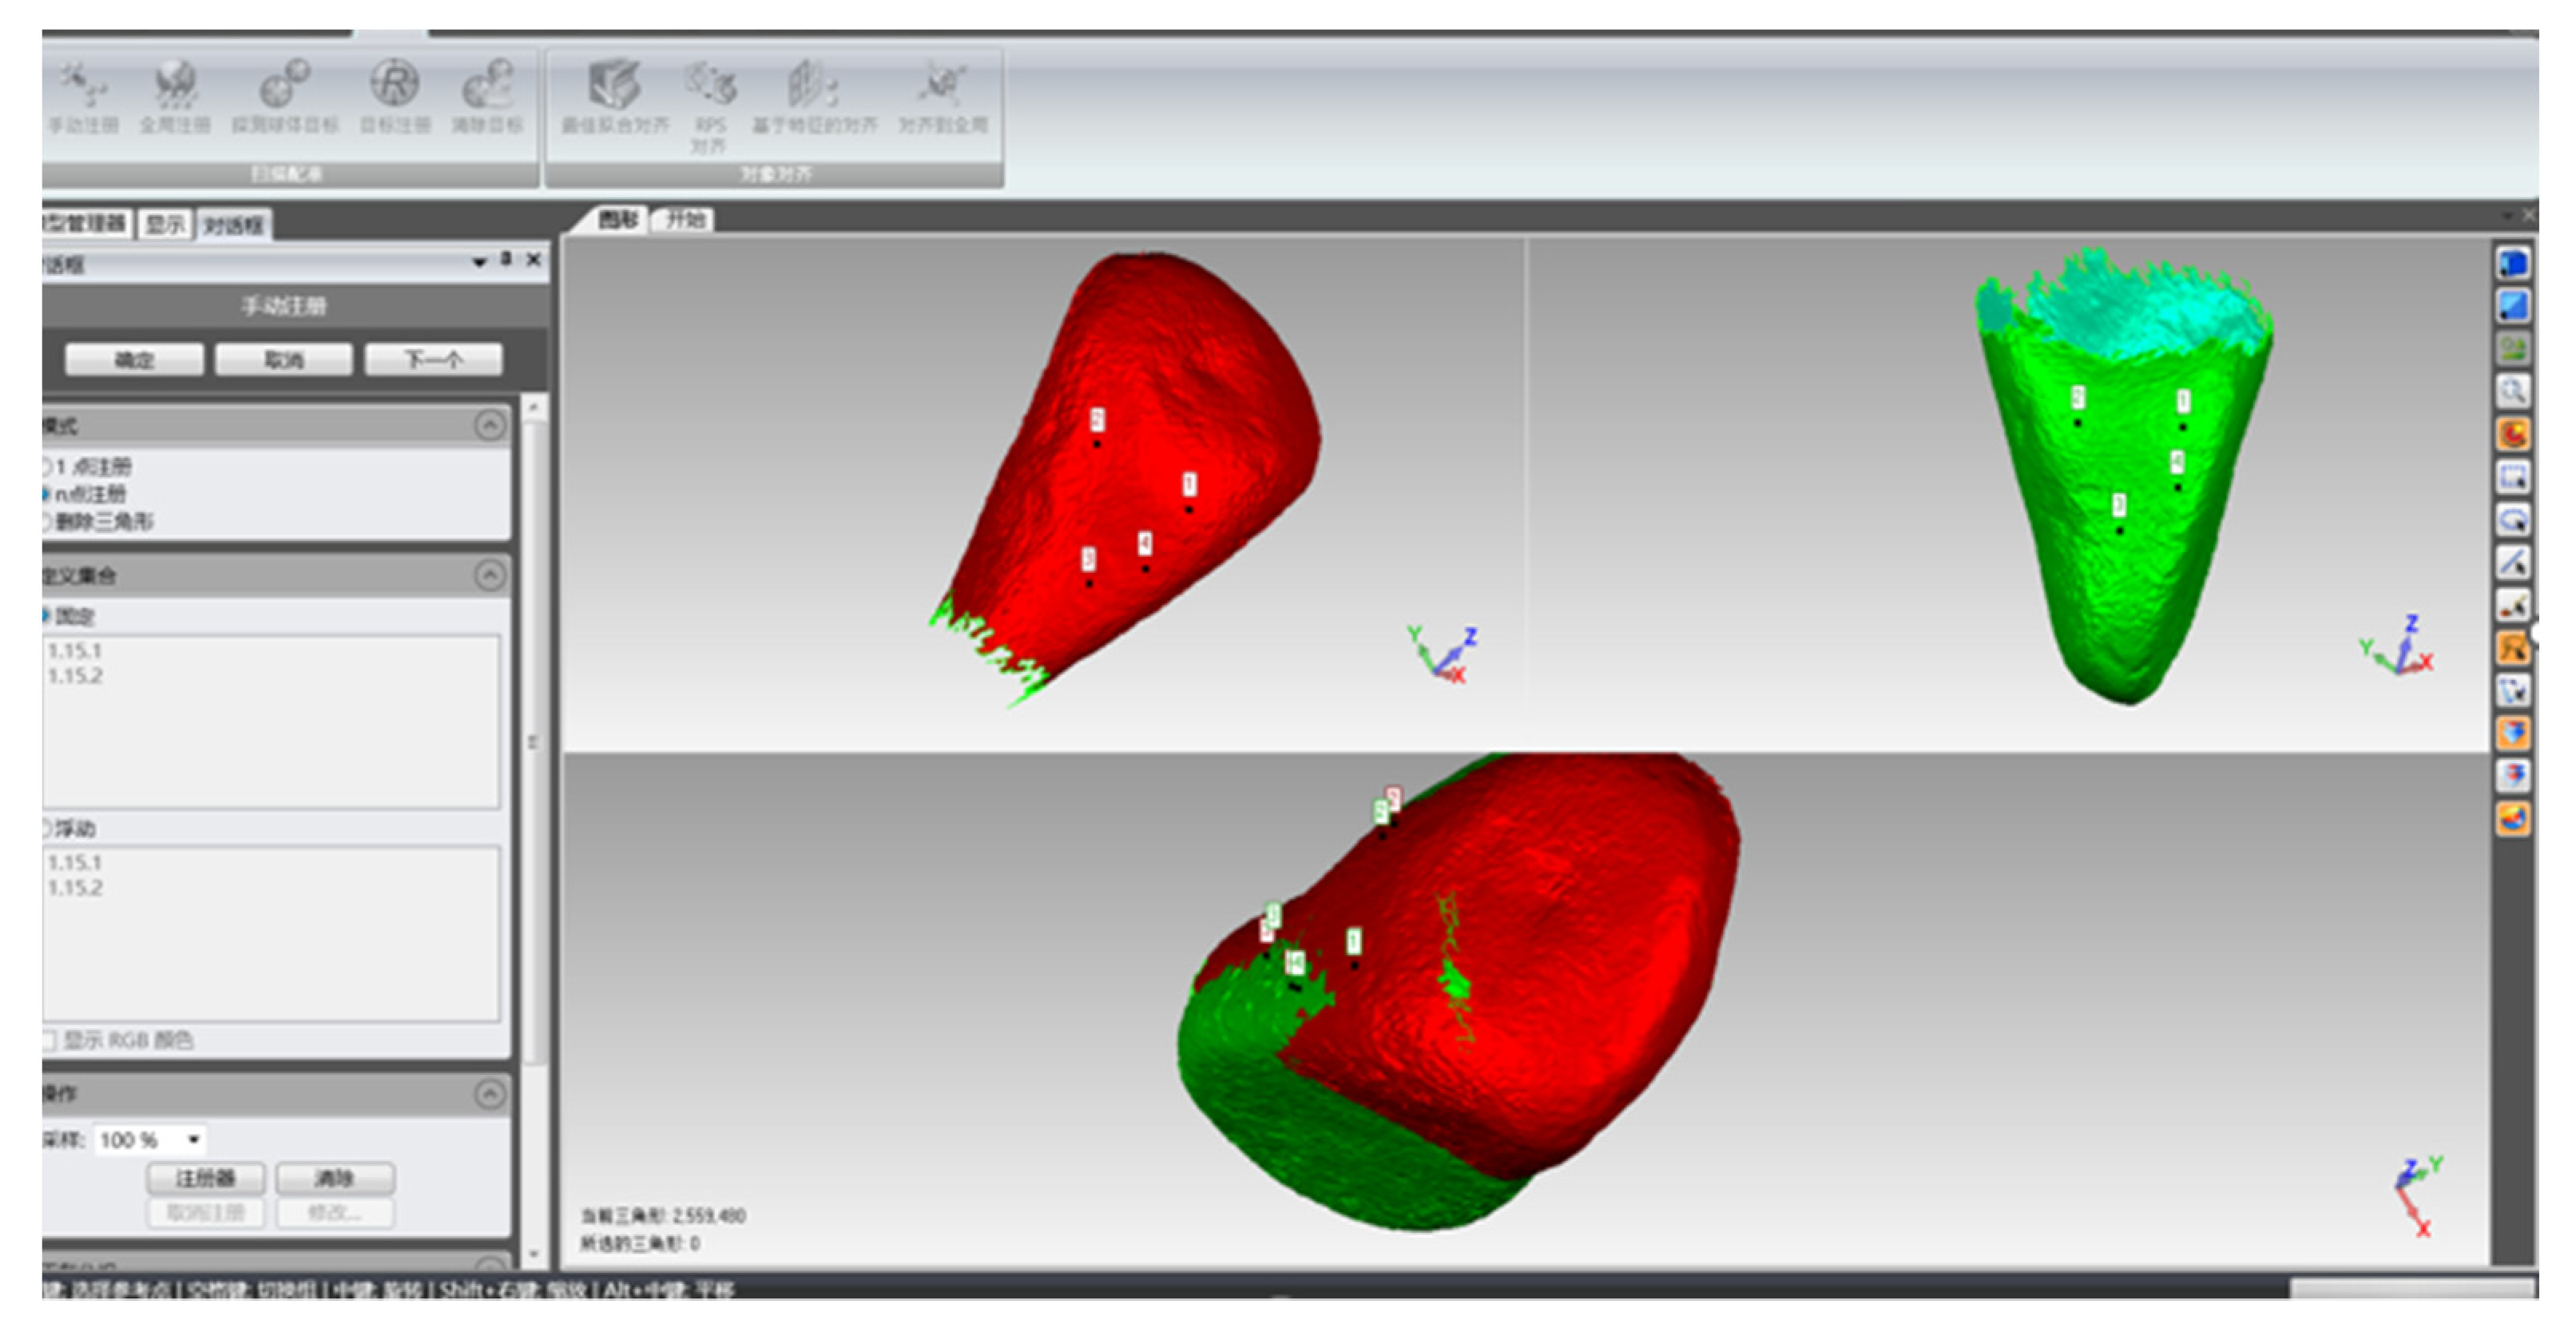
3.2. 3D Image Acquisition and Reconstruction of Coarse Aggregate

The ZGScan 717 handheld 3D laser scanner is used to obtain the surface point cloud data of coarse aggregates. This instrument works on the principle of laser triangulation to measure the target distance. A laser beam is emitted through a focusing lens and collimation system at a certain angle (direct entry, oblique entry), projected onto the measured object, and received by another sensor with diffuse reflected light to obtain an optical signal, which is finally transformed by computer processing to obtain data. The instrument has the highest accuracy of 0.05 mm for transverse scanning and 0.03 mm for longitudinal scanning, and the device has the function of data processing, which can eventually generate grid files in STL format [25]. The instrument is shown in Figure 8.
The experimental steps are as follows: Select a total of 60 pieces of three different lithologies of coarse aggregates (9.75 mm, 13.2 mm), and number them from #1 to #60, as shown in Figure 9. In the preparation stage of scanning coarse aggregates, the surface of the samples needs to be cleaned and dried to eliminate the influence of moisture and other pollutants on scanning. In the preparation stage of the working platform, put marker points on the table plane in advance and place the fixer to fix the coarse aggregates. Connect the interface of the ZGScan717 handheld 3D laser scanner to the computer, start the program, and conduct a trial run to ensure that the scanned data are feasible. Scan the upper surface of the sample, save the data, then invert the sample and scan it again, and finally stitch the two models together into a complete model through the software. Repeat the above operation, and obtain the models of all the 60 samples. The experimental process and operating environment are shown in Figure 10.
Due to the limitations of the handheld laser scanner, the coarse aggregates need to be scanned at different angles and stitched together. Additionally, the 3D model reconstruction is finally realized by the reversible 3D graphics software Geomagic Design X 2020.0, and the reconstruction process is shown in Figure 11.
During the experimental process, the scanning environment, computer equipment, and external incidental noise will cause certain influences on data collection, so the acquired models cannot be directly applied to test models. In order to improve the accuracy and precision of the models, data matching, data noise reduction, data alignment, and data streamlining are needed for the scanned models, and the reconstructed 3D models of coarse aggregates after processing are shown in Figure 12.
The 3D laser scanning technique is used to obtain all the 3D image models of the coarse aggregate samples, and the processed models are obtained by using the fitted ellipsoid algorithm and Laplace smoothing algorithm. After processing and calculation, the following information can be obtained: the long semi-axis (a), middle semi-axis (b), long semi-axis (c) of the fitted ellipsoid, the surface area of the fitted ellipsoid, the volume of the fitted ellipsoid, the volume of the original models, the surface area of the original models, the volume of the models after smoothing, and the surface area of the models after smoothing. Accordingly, the sphericity value, fitted ellipsoidal value, change rate of angularity, and change rate of surface area can be calculated from the obtained information to provide the parameter requirements for the following 3D morphological characterization and evaluation of coarse aggregate.

4. Evaluation of 3D Morphology of Coarse Aggregate

4.1. Shape Evaluation of Coarse Aggregate

According to the fitted ellipsoidal model, the long semi-axis (a), the middle semi-axis (b), and the short semi-axis (c) can be calculated for all 3D models, and then the coarse aggregate shapes are evaluated based on the proportional relationship between the three axes. If c/b < 2/3 and b/a < 2/3, the shape is classified as a plate; if c/b > 2/3 and b/a < 2/3, column; if c/b < 2/3 and b/a > 2/3, pie; if c/b > 2/3 and b/a > 2/3, cube. The typical coarse aggregate shape characteristics and divisions are shown in Figure 13. Statistically, a cubic shape accounts for the largest proportion of all shapes.
From Figure 14, it can be seen that the number of cubic shapes is the biggest, reaching more than 2/3 of the total number of samples. This conclusion is consistent with the information in the actual project, and this pattern was also confirmed in the research conducted by Jiang [25]. The cubic shape of pebbles is more distinctive than that of other aggregates. The investigation of the samples finds that the selected pebbles have more ellipsoidal shapes than flat ones. Accordingly, the calculated results recognize the cubic shape as having the largest proportion of all shapes.
In order to further explore the shape characterization of coarse aggregate, the fitted ellipsoidal value is proposed. According to the fitted ellipsoid value obtained from Section 3.2 and Equation (1), the range of the fitted ellipsoid value is obtained by calculation, as shown in Table 2. From the results of the statistical data, it can be seen that the evaluation results of the fitted ellipsoid value for the coarse aggregates with the maximum nominal size of 13.2 mm range from 0.554 to 0.883; the evaluation result of the fitted ellipsoid value for the coarse aggregates with the maximum nominal size of 9.75 mm ranges from 0.558 to 0.892.
In the process of previous experiments, sphericity value, as a parameter for evaluating coarse aggregate, was used not only to indicate the similarity between coarse aggregate and spherical shape to characterize the shape of coarse aggregate, but also to characterize the angularity of the coarse aggregate. However, in the actual study, it was found that for the aggregate with particularly prominent angularity, or the slender aggregate, the accordant volume calculated by the minimum external sphere model is many times larger than the actual volume. Additionally, the deviation of the volume calculated by the fitted ellipsoidal model is much smaller than that calculated by the minimum external sphere model. The coefficient of variation reflects the sensitivity of the parameter to the samples. In this article, we apply the parameter of fitted ellipsoid value to characterize the shape of coarse aggregate, and by comparing the variation curves of the coefficient of variation of fitted ellipsoid value and sphericity in Figure 15, we find that the coefficient of variation of fitted ellipsoid value is above the sphericity and has better sensitivity to the data. Moreover, in the calculation and data statistics, it is found that the calculated sphericity for different shapes of coarse aggregates has similar and duplicated data. However, the fitted ellipsoid value is more accurate compared with the sphericity, which indicates that the fitted ellipsoid value is more accurate as a parameter for shape characterization.
After data analysis, the range of the fitted ellipsoid value is divided and compared with the actual shape, and the following findings can be obtained: when the fitted ellipsoidal value E < 0.667, the shape of coarse aggregate is closer to a round ellipsoidal shape; when 0.668 ≤ E ≤ 0.780, it is a general ellipsoidal shape; when E > 0.780, it is a long ellipsoidal shape. Coarse aggregate with a small E value presents round ellipsoidal or rectangular-like characteristics, while coarse aggregate with a large E value shows long ellipsoidal, narrow, or plate features.

4.2. Evaluation of Angularity Based on Fitting Ellipsoid Value and Angularity Change Index

The angularity index D of coarse aggregate samples with a maximum nominal particle size of 9.75 mm ranges from 0.444 to 0.560, and the angularity index D of aggregate with a maximum nominal particle size of 13.2 mm ranges from 0.442 to 0.575. Under this experimental condition, when D ≤ 0.442, the coarse aggregate shows a round shape; when 0.442 < D ≤ 0.486, angular shape; when 0.486 < D ≤ 0.530, sub-angular shape; when D > 0.530, sharp angular shape. It is also found that the angularity of granite in 9.75 mm coarse aggregates is relatively strong, and the angularity of basalt in 13.2 mm coarse aggregates is relatively strong. Generally, both basalt and granite have great angularity. The variation rule of the angularity index is shown in Figure 16a,b.
Put the angularity index D corresponding to different aggregates in order from low to high: rounded aggregate < angular aggregate < sub-angular aggregate < sharp angular aggregate. The angularity characteristics of typical aggregate samples are listed below in Table 3.
It was proposed that the angularity of aggregates can be evaluated by sphericity [23]. By observing Table 2 and comparing the fitted ellipsoid value with the shape of coarse aggregate for all samples, it is found that the variation of the fitted ellipsoid value may also correlate with the angularity of coarse aggregate.
On the basis of the above study, this research deeply explores the variation rule between the fitted ellipsoid value and angularity by fitting two different particle sizes of 9.75 mm and 13.2 mm separately. It can be seen from the fitted models in Figure 17 and Figure 18 that, after removing the discrete points, most of the points are close to the fitted line, and the slopes of the coarse aggregates are approximately the same for both particle sizes. However, the determination coefficients of the linear fittings reflect weak linear correlations, where the determination coefficients of both relations are lower than 0.56. Such weak correlations indicate that the fitted ellipsoidal value cannot be used to characterize angularity.

4.3. Evaluation of Texture Features Based on Smoothing

The surface of the 3D models is smoothed by using the method of Laplace smoothing, which can remove the sharp edges prominent on the surface of the coarse aggregates. By comparing the surface area of the coarse aggregates before and after the treatment and characterizing the texture of the coarse aggregates by the change rate of surface area, the parameter range of the change rate of surface area is calculated and shown in Table 4. The results show that the surface area change rate of coarse aggregates with a maximum nominal particle size of 9.75 mm ranges from 1.683% to 5.306%. Additionally, the surface area changes in coarse aggregate with a maximum nominal diameter of 13.2 mm ranges from 0.973% to 3.102%.
The surface area change rate of coarse aggregate, shown in Figure 19, indicates that the surface area change rate of coarse aggregate of smaller particle size is generally larger than that of larger particle size, and the curve change of the small particle size is greater than that of the large particle size. It shows that the surface texture of coarse aggregates with small particle sizes is more complex under this experimental condition. The reason for this phenomenon is that the gaps between coarse aggregates of larger particle size are filled with tiny aggregates or fine aggregates during the moving process. Hence, the surface texture of coarse aggregates could be polished during the mutual extrusion and friction process, causing the texture of coarse aggregates to be less prominent, while the texture of coarse aggregates with smaller particle sizes is more obvious.
The models combined with statistics show that when ΔS (pebble) > 1.865%, there are obvious texture changes; when ΔS (granite) > 2.907%, the surface texture of granite is relatively rough; when ΔS (basalt) > 2.434%, the surface texture of basalt is obviously rough. Under the conditions of this research, it can be found that granite has the largest roughness among the three lithological materials, showing great roughness, and the surface area change rate of pebbles is much “smoother” compared with the others.

4.4. Study on Asphalt-Coarse Aggregate Adhesion

In order to quantitatively study the relationship between asphalt-aggregate adhesion and coarse aggregate morphology, a modified photoelectric colorimetric method is chosen for measurement. The materials and tools to be employed for the experiment include the above three types of coarse aggregates with different lithologies and different particle sizes, 70# matrix asphalt, whose basic data are shown in Table 5, a Type 717 spectrophotometer shown in Figure 20, and a solution of phenosafrnine.
The steps of the experiment are as follows:
(1)
Select five pieces from each of the three coarse aggregates (pebbles, granite, and basalt) with a particle size of 9.75 mm and 13.2 mm, respectively. The selected coarse aggregates are divided into six groups, each group uses five of the same type for the experiment. The solution of phenosafrnine (concentration of 0.010 mg/mL) is formulated and heated to 60 °C in a water bath. Add 200 mL of the solution to each of the five conical flasks containing the sample aggregates, and the water bath is set at 60 °C for two hours.
(2)
Shake the conical flask containing the samples and then take out 5 mL of the solution. After the solution is cooled, use the spectrophotometer to measure the absorbance value at 510 mm and read the corresponding concentration according to the standard curve.
(3)
Clean the samples from the previous step, put them into the insulated cabinet to keep warm for 4–6 h with the temperature set at 160 °C. Heat the asphalt to melt it, take 200 g in total and add 4 g (error not more than 0.1 g) to each group of samples by the reduction method. After mixing the asphalt and samples well, leave the asphalt mixture at room temperature for cooling, and put each group of samples into the corresponding conical flask separately. Repeat the operation in (1) and then take out 5 mL of the solution for the absorbance test.
(4)
The equations for calculation are shown in Equations (12)–(14) below.
q = ( C 0 C 1 ) V m
where q represents the adsorption of sample aggregates (mg/g); C 0 represents the initial concentration of solution of phenosafrnine (mg/mL); C 1 represents the concentration of residual solution after sample adsorption (mg/mL); V represents the volume of solution of phenosafrnine used for the test (mL); m represents sample weight (g).
q = ( C 0 C 1 ) V m
where q represents the adsorption of sample aggregates (mg/g); C 0 represents the initial concentration of solution of phenosafrnine (mg/mL); C 1 represents the concentration of residual solution after adsorption of asphalt mixes (mg/mL); V represents the volume of solution of phenosafrnine used for the test (mL); m represents sample weight (g).
S t = q q × 100 %
where St represents degree of strip.
The degree of strip is used as the coarse aggregate-asphalt adhesion experiment evaluation index to plot Figure 21, Figure 22 and Figure 23. The relationships between the degree of the strip of asphalt and the change rate of surface area, the change rate of angularity, and the fitted ellipsoidal value of coarse aggregates are analyzed based on the figures.
According to the figures above, the degree of strip and the change rate of surface area show a linearly decreasing trend, i.e., the larger the change rate of surface area, the smaller the degree of strip. In contrast, there is no correlation between both the angularity and the fitted ellipsoidal value and the degree of the strip. From the figure of the degree of strip and surface area change rate, it can be seen that the curve of granite is above the other two, and its range of variation is the largest, which indicates that the surface texture of granite is the roughest. It can also be found that the coarse aggregates with small particle sizes have a lower degree of strip than those with larger particle sizes and show better adhesion characteristics. Coarse aggregates of large particle size show weakened adhesion properties due to the reduced surface texture after grinding, whereas the smaller ones tend to be embedded in the gaps between the large ones, where their texture characteristics would be better preserved, and their roughness would also be stronger.

5. Conclusions

In order to characterize the 3D morphological features of coarse aggregate, 3D laser scanning technology and related processing software are used for the rapid reconstruction of 3D models. Additionally, Laplacian smoothing and fitted ellipsoid algorithms are applied in processing the 3D models to calculate the values of the parameters needed for characterization, thus allowing for the evaluation of the 3D morphology of coarse aggregate from different perspectives, respectively, and several conclusions are obtained as follows.
(1)
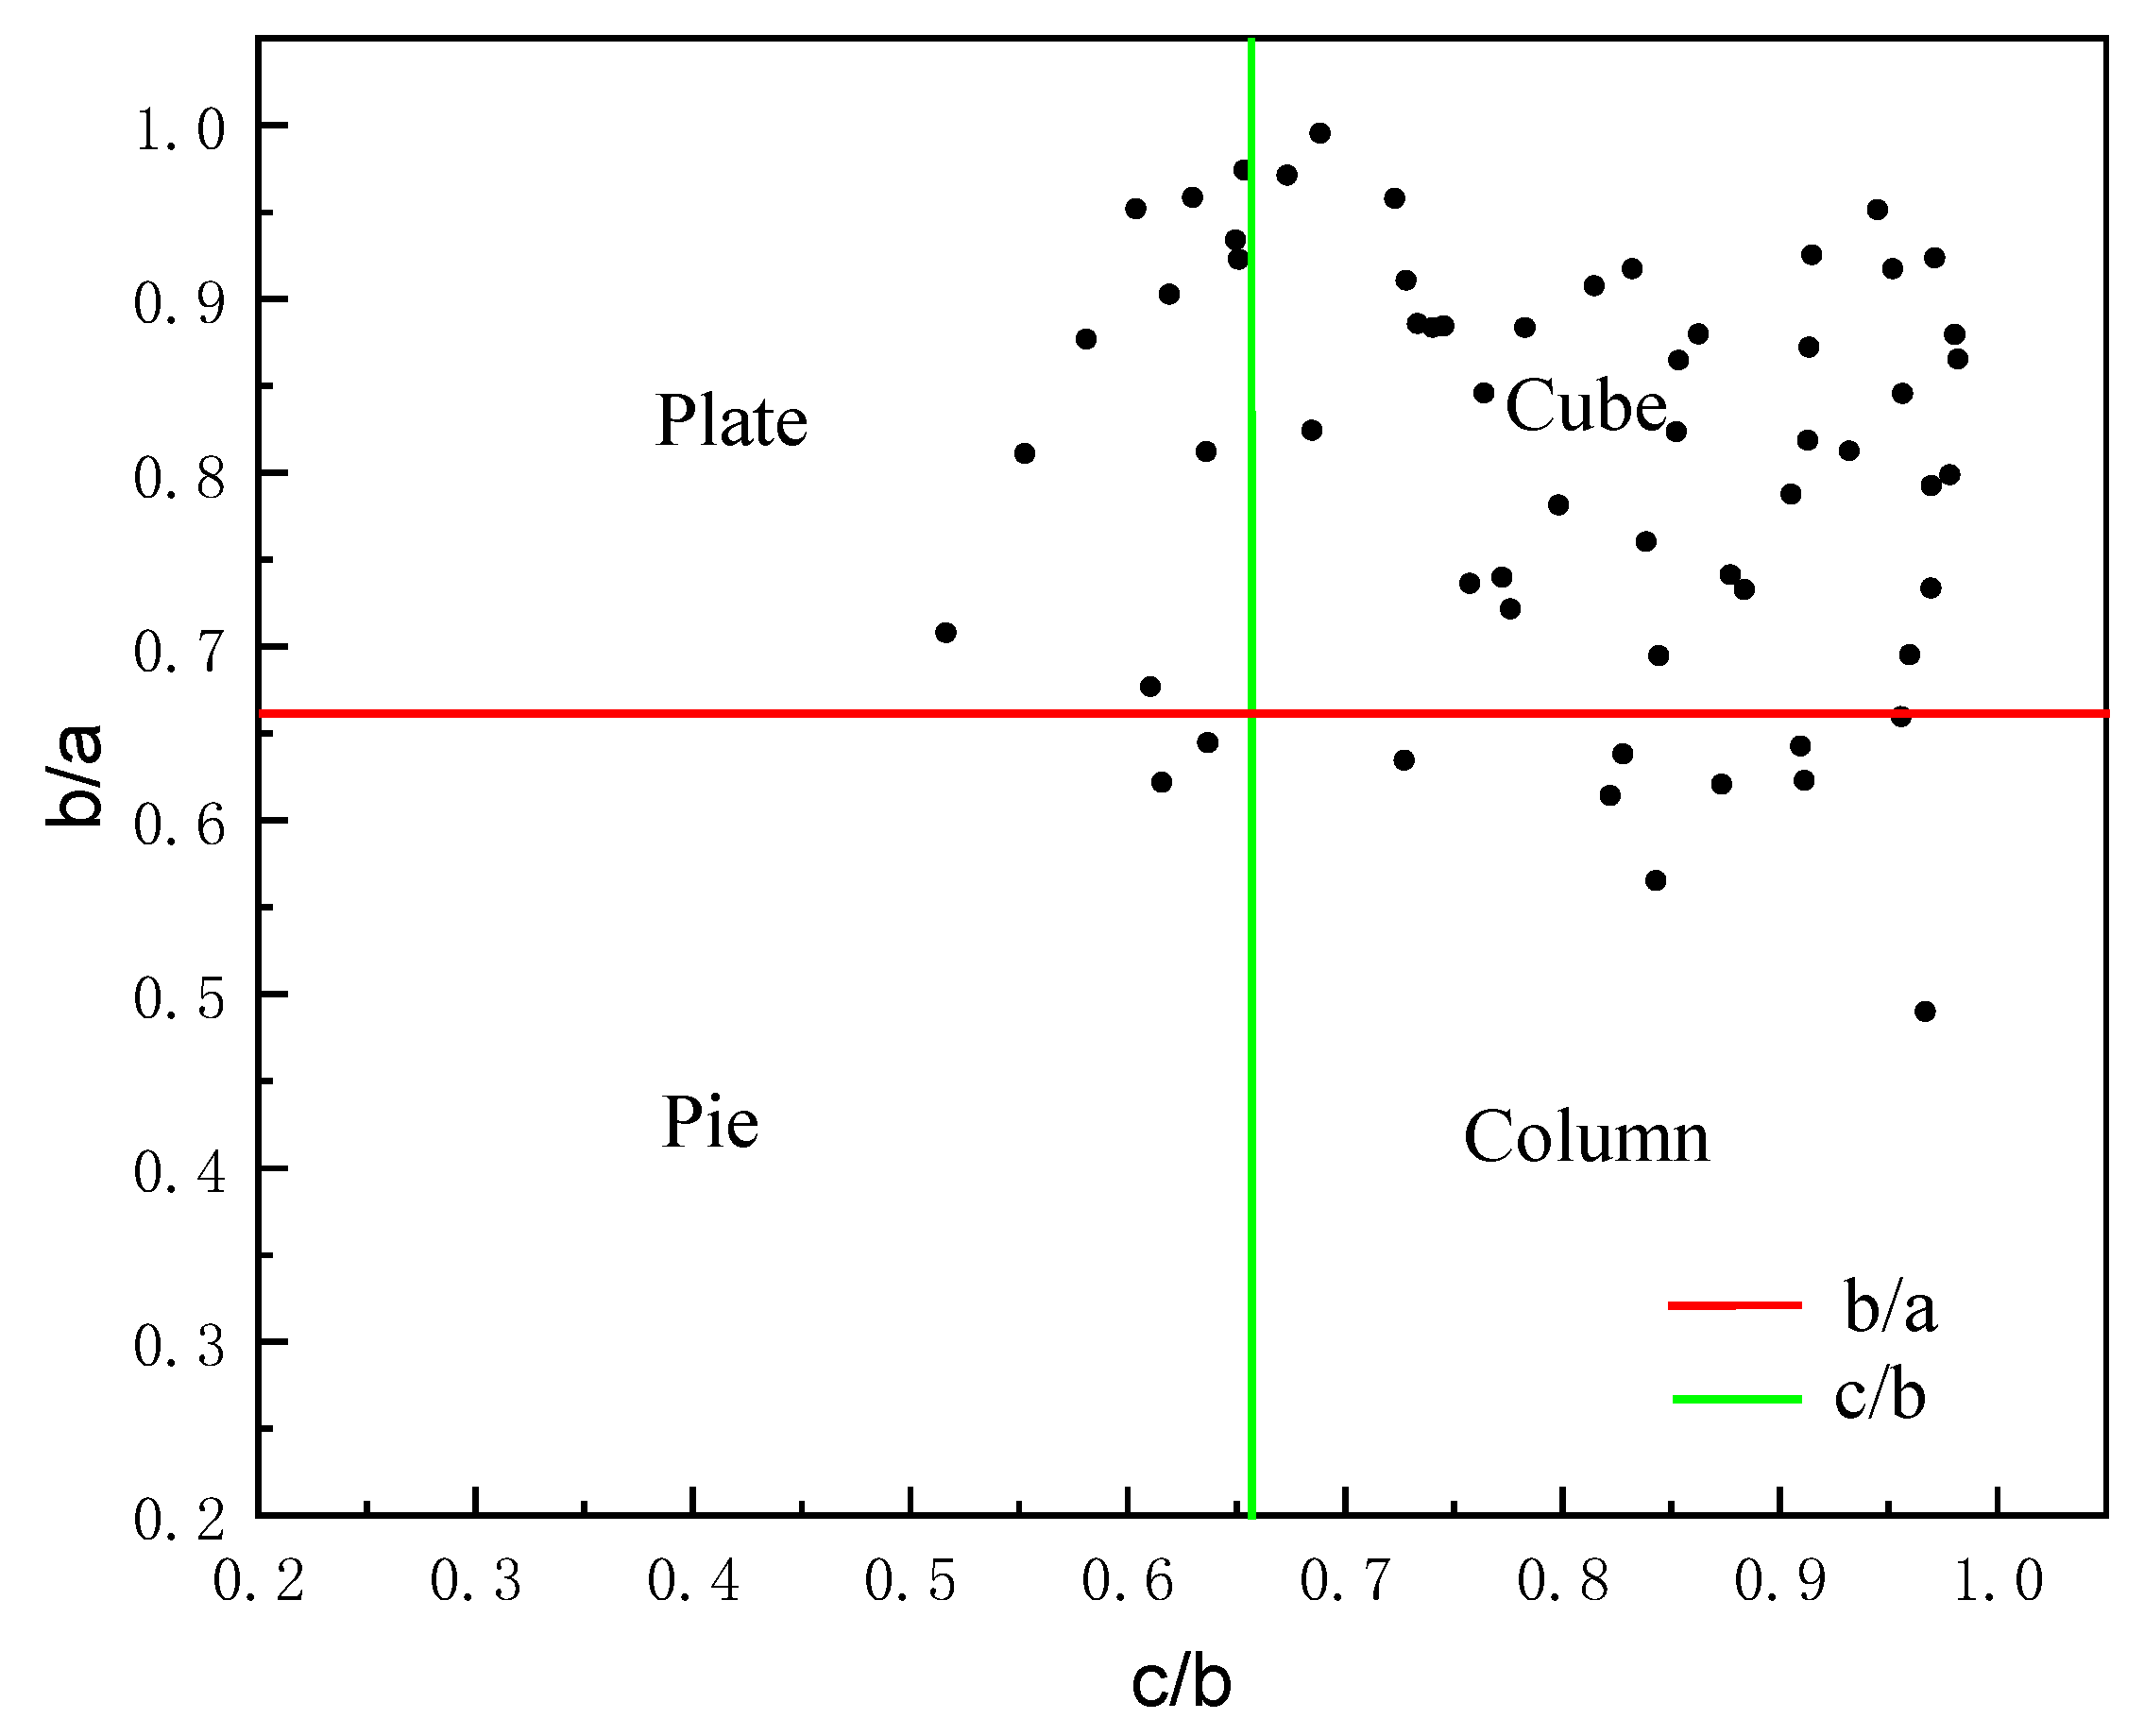
The shape of coarse aggregate is divided into four types by analyzing the relationship between the long semi-axis (a), the middle semi-axis (b), and the short semi-axis (c) of the fitted ellipsoid, in which the cube occupies the largest part, which is consistent with the proportion of the cube in the actual project. The fitted ellipsoidal value can reflect the degree of similarity between coarse aggregate and the fitted ellipsoid. By comparing the coefficient of variation of the data between the sphericity value and fitted ellipsoid value, it is found that the fitted ellipsoid value has a relatively high sensitivity. The data analysis shows that when the fitted ellipsoid value E < 0.667, the shape of the model is close to the round ellipsoid; when 0.668 ≤ E ≤ 0.780, the shape of the model is close to the general ellipsoid; when E > 0.780, the shape of the model is close to the long ellipsoid.
(2)
In this article, the angularity change rate is used to characterize the angular properties of coarse aggregate. Under the experimental conditions of this study, when D ≤ 0.442, the aggregates present a round shape; when 0.442 < D ≤ 0.486, the aggregates present an angular shape; when 0.486 < D ≤ 0.530, the coarse aggregates present a sub-angular shape; when D > 0.530, the coarse aggregates present a sharp angular shape. Among the three types of aggregates, granite and basalt have better angularity.
(3)
The data fittings show that the determination coefficients between the fitted ellipsoidal value and the change rate of angularity are lower than 0.56, which reflect weak correlations. Therefore, the fitted ellipsoidal value cannot characterize the angularity of coarse aggregate. Due to the limitations of this experiment, this conclusion still needs further research.
(4)
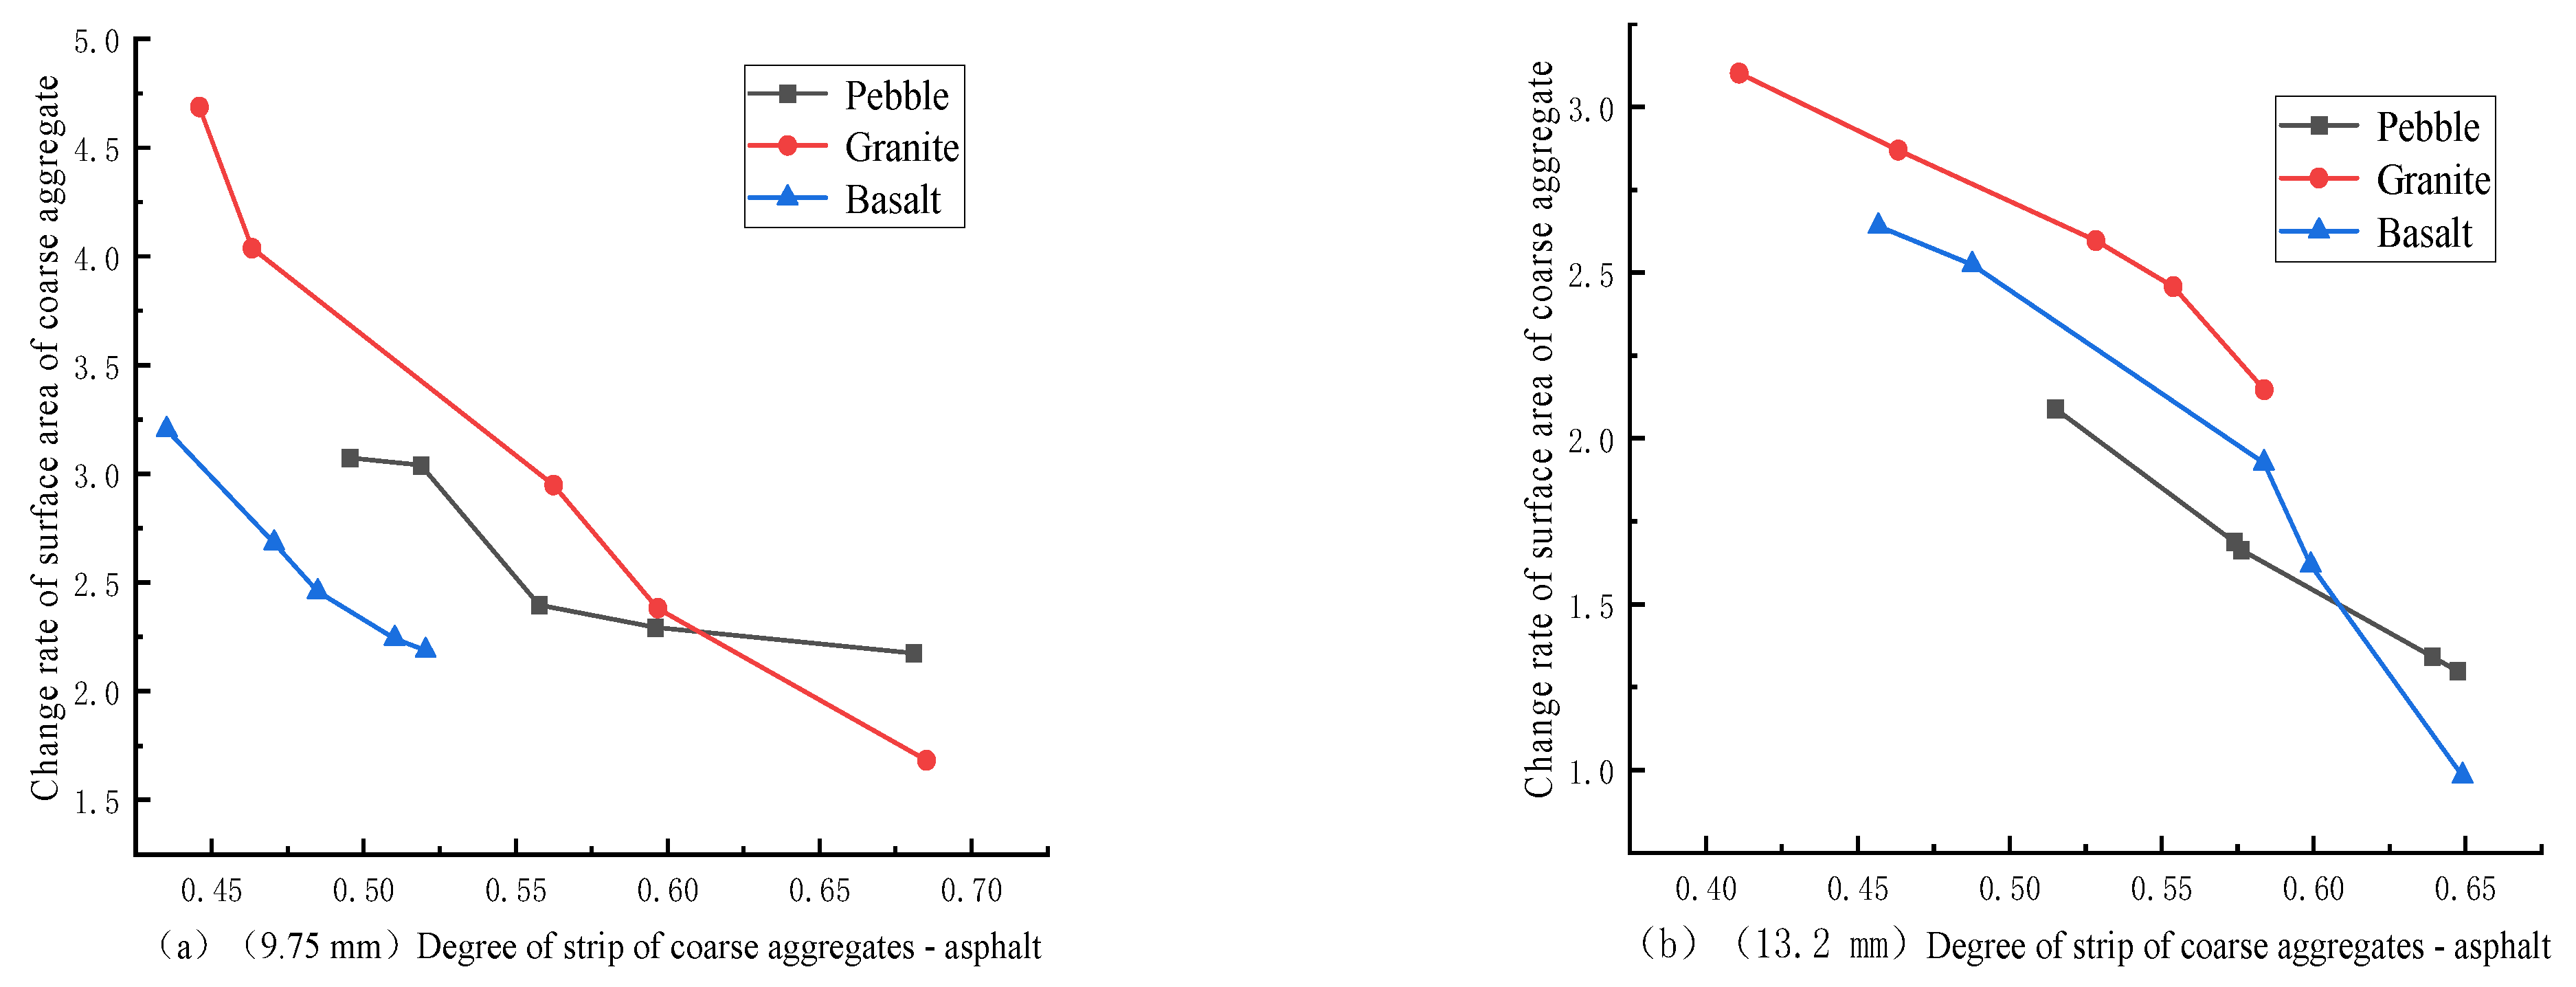
The roughness of the coarse aggregate can be characterized by the change rate of surface area. When ΔS (pebbles) > 1.865%, there is an obvious texture change in pebbles; when ΔS (granite) > 2.907%, the surface texture of granite is relatively rough; when ΔS (basalt) > 2.434%, the surface texture of basalt is obviously rough. The variation range of the surface area change rate of granite is the largest, showing great roughness.
(5)
The quantitative analysis of asphalt-coarse aggregate adhesion by using the photoelectric colorimetric method finds out a correlation between the change rate of surface area and adhesion. Coarse aggregates with smaller particle sizes show a lower degree of strip than coarse aggregates with larger particle sizes and exhibit better adhesion characteristics. This study provides ideas and references for future research on aggregate characterization, while an in-depth analysis of coarse aggregate types and particle size ranges is still needed.

Author Contributions

Conceptualization, J.S. and R.J.; data curation, J.S. and R.J.; funding acquisition, X.Z.; resources, X.Z.; supervision, R.J. and X.Z.; writing—original draft, J.S.; writing—review and editing, J.S. All authors have read and agreed to the published version of the manuscript.

Funding

This study is funded by the National Natural Science Foundation of China (No. 51827812), and the National Natural Science Foundation of China (No. 52172392). All the help and support are greatly appreciated.

Institutional Review Board Statement

Not applicable.

Informed Consent Statement

Informed consent was obtained from all subjects involved in the study.

Data Availability Statement

The data presented in this study are available on request from the corresponding author.

Conflicts of Interest

The authors declare no conflict of interest.

References

  1. Pouranian, M.R.; Shishehbor, M.; Haddock, J.E. Impact of the coarse aggregate shape parameters on compaction characteristics of asphalt mixtures. Powder Technol. 2020, 363, 369–386. [Google Scholar] [CrossRef]
  2. Wang, H.; Xu, H.; Wang, J.; Ying, J.; Shen, S.; Zhang, C. Influence of aggregate physicochemical properties on interfacial adhesion performance of asphalt-aggregate. J. Chang. Univ. (Nat. Sci. Ed.) 2022, 42, 52–61. (In Chinese) [Google Scholar]
  3. Li, L.; Long, G.; Xie, Y.; Zeng, X.; Pan, Z.; Dong, H. Research on the shape feature and gradation of coarse aggregate based on 3D scanning and numerical technology. J. Railw. Sci. Eng. 2022, 19, 714–721. (In Chinese) [Google Scholar]
  4. Wang, W.; Cheng, Y.; Tan, G.; Tao, J. Analysis of aggregate morphological characteristics for viscoelastic properties of asphalt mixes using simplex lattice design. Materials 2018, 11, 1908. [Google Scholar] [CrossRef] [Green Version]
  5. Wang, W.; Shen, A.; Guo, Y.; Zhang, D.; Li, D. Shape feature parameters and distribution rule of coarse aggregate based on image analysis. J. Highw. Transp. Res. Dev. 2020, 37, 25–31. (In Chinese) [Google Scholar]
  6. Zhao, Z. Study on the Evaluation Method of Coarse Aggregate Angularity and its Influence on the Road Performance of Asphalt Mixture. Master’s Thesis, Chang’an University, Xi’an, China, 2018. (In Chinese). [Google Scholar]
  7. Bessa, I.S.; Branco VT, F.C.; Soares, J.B.; Neto, J.A.N. Aggregate shape properties and their influence on the behavior of hot-mix asphalt. J. Mater. Civ. Eng. 2015, 27, 04014212. [Google Scholar] [CrossRef]
  8. Lucas, J.L.O., Jr.; Babadopulos, L.F.A.L.; Soares, J.B. Aggregate-binder adhesiveness assessment and investigation of the influence of morphological and physico-chemical properties of mineral aggregates. Road Mater. Pavement Des. 2019, 20 (Suppl. 1), S79–S94. [Google Scholar] [CrossRef]
  9. Masad, E.; Button, J.W. Unified imaging approach for measuring aggregate angularity and texture. Comput.-Aided Civ. Infrastruct. Eng. 2000, 15, 273–280. [Google Scholar] [CrossRef]
  10. Zhang, X.; Liu, T.; Liu, C.; Chen, Z. Research on skid resistance of asphalt pavement based on three-dimensional laser-scanning technology and pressure-sensitive film. Constr. Build. Mater. 2014, 69, 49–59. [Google Scholar] [CrossRef]
  11. Yang, G.; Yan, X.; Nimbalkar, S.; Xu, J. Effect of particle shape and confining pressure on breakage and deformation of artificial rockfill. Int. J. Geosynth. Ground Eng. 2019, 5, 15. [Google Scholar] [CrossRef]
  12. Yu, F.; Liu, P.; Gao, Y.; Fang, X.; Lou, Z. Research on the influence of coarse aggregate shape characteristics on workability of self-compacting concrete based on image processing technology. Bull. Chin. Ceram. Soc. 2020, 39, 75–82. (In Chinese) [Google Scholar]
  13. Fu, R.; Hu, X.; Zhou, B.; Wang, H.; Wang, J. A quantitative characterization method of 3D morphology of sand particles. Rock Soil Mech. 2018, 39, 483–490. (In Chinese) [Google Scholar]
  14. Li, Z.; Liu, T.; Liu, C. Microscopic structure evaluation of aggregates based on laser measurement and vacuum coating technology. J. South China Univ. Technol. (Nat. Sci. Ed.) 2013, 41, 88–93. [Google Scholar]
  15. Cheng, Y.; Wang, W.; Tao, J.; Xu, M.; Xu, X.; Ma, G.; Wang, S. Influence analysis and optimization for aggregate morphological characteristics on high- and low-temperature viscoelasticity of asphalt mixtures. Materials 2018, 11, 2034. [Google Scholar] [CrossRef] [Green Version]
  16. Gao, J.; Wang, H.; Bu, Y.; You, Z.; Zhang, X.; Irfan, M. Influence of coarse-aggregate angularity on asphalt mixture macro-performance: Skid resistance, high-temperature, and compaction performance. J. Mater. Civ. Eng. 2020, 32, 04020095.1–04020095.11. [Google Scholar] [CrossRef]
  17. Jin, C.; Zou, F.; Yang, X.; Liu, K.; Liu, P.; Oeser, M. Three-dimensional quantification and classification approach for angularity and surface texture based on surface triangulation of reconstructed aggregates. Constr. Build. Mater. 2020, 246, 118120. [Google Scholar] [CrossRef]
  18. Li, W.; Wang, D.; Chen, B.; Hua, K.; Su, W.; Xiong, C.; Zhang, X. Research on three-dimensional morphological characteristics evaluation method and processing quality of coarse aggregate. Buildings 2022, 12, 293. [Google Scholar] [CrossRef]
  19. Lucas Júnior, J.L.; Da Silva, L.S.; Rocha, W.S.; Babadopulos, L.F.; Soares, J.B. Effects of rheology and adhesiveness of asphalt binders to different substrates on the resistance to moisture conditioning. J. Adhes. 2022, 98, 1937–1956. [Google Scholar] [CrossRef]
  20. Mora, C.F.; Kwan, A.K.H. Sphericity, shape factor, and convexity measurement of coarse aggregate for concrete using digital image processing. Cem. Concr. Res. 2000, 30, 351–358. [Google Scholar] [CrossRef]
  21. Tafesse, S.; Robison Fernlund, J.M.; Sun, W.; Bergholm, F. Evaluation of image analysis methods used for quantification of particle angularity. Sedimentology 2013, 60, 1100–1110. [Google Scholar] [CrossRef]
  22. Sun, Z.; Wang, C.; Hao, X.; Li, W.; Zhang, X. Quantitative evaluation for shape characteristics of aggregate particles based on 3D point cloud data. Constr. Build. Mater. 2021, 263, 120156.1–120156.17. [Google Scholar] [CrossRef]
  23. Qu, Y. Study on the Influence of Aggregate Morphology on Asphalt Mixture Microstructure and Mechanical Properties; Harbin Institute of Technology: Harbin, China, 2020. (In Chinese) [Google Scholar]
  24. Li, L.K.; Liu, H.M.; Zhang, Z.G.; Cao, P.; Yan, Y. Study on quantitative characterization of 3D morphology of road aggregate. J. Highw. Transp. Res. Dev. 2021, 38, 16–23. (In Chinese) [Google Scholar]
  25. Jiang, R. Research on 3D Morphological Characteristics of Coarse Aggregate based on Laser Scanning; Wuhan University of Science and Technology: Wuhan, China, 2021. (In Chinese) [Google Scholar]
Figure 1. Schematic diagram of fitting ellipsoid model.
Buildings 13 01029 g001
Figure 2. Schematic diagram of minimum external sphericity model.
Buildings 13 01029 g002
Figure 3. Algorithm transcoding process.
Buildings 13 01029 g003
Figure 4. Calculation result of fitting ellipsoidal model.
Buildings 13 01029 g004
Figure 5. Geometry of Laplace operator.
Buildings 13 01029 g005
Figure 6. Optimized Laplacian operator model.
Buildings 13 01029 g006
Figure 7. Comparison diagram of coarse aggregate before and after smoothing. (a) Pre-processing model; (b) Processed model.
Buildings 13 01029 g007
Figure 8. Handheld laser scanner.
Buildings 13 01029 g008
Figure 9. Coarse aggregates used in the experiment.
Buildings 13 01029 g009
Figure 10. Process diagram of collecting point cloud data on coarse aggregate surface. (1) Laser scanner. (2) Fixer. (3) Marker points. (4) Table plane. (5) Computer.
Buildings 13 01029 g010
Figure 11. Coarse aggregate models splicing process.
Buildings 13 01029 g011
Figure 12. Three-dimensional reconstruction models of coarse aggregates.
Buildings 13 01029 g012
Figure 13. Shape division of coarse aggregate.
Buildings 13 01029 g013
Figure 14. Coarse aggregate shape distribution.
Buildings 13 01029 g014
Figure 15. Comparison of coefficient of variation.
Buildings 13 01029 g015
Figure 16. Change rate of angularity.
Buildings 13 01029 g016
Figure 17. Correlation between fitted ellipsoid value and change in angularity (9.75 mm).
Buildings 13 01029 g017
Figure 18. Correlation between fitted ellipsoid value and change in angularity (13.2 mm).
Buildings 13 01029 g018
Figure 19. Change rate of surface area of coarse aggregates.
Buildings 13 01029 g019
Figure 20. Type 717 spectrophotometer.
Buildings 13 01029 g020
Figure 21. Relationship between degree of strip and change rate of surface area.
Buildings 13 01029 g021
Figure 22. Relationship between degree of strip and the change rate of angularity.
Buildings 13 01029 g022
Figure 23. Relationship between degree of strip and fitted ellipsoidal value.
Buildings 13 01029 g023
Table 1. Error term calculation.
PebbleGraniteBasalt
Error terma (mm)b (mm)c (mm)a (mm)b (mm)c (mm)a (mm)b (mm)c (mm)
MAE0.4920.3570.4030.6790.4220.3800.4660.3880.330
RMSE0.5530.4310.4980.7640.4630.4370.5570.4680.415
Table 2. Statistics of fitting ellipsoid value.
Particle SizePebbleGraniteBasalt
13.2 (mm)0.554~0.8020.587~0.7680.589~0.793
9.75 (mm)0.558~0.7630.605~0.8920.693~0.829
Table 3. Evaluation of angular characteristics of typical aggregate samples.
Number123456
Fitting ellipsoid value0.8830.7390.8060.6620.5540.640
3D shape of coarse aggregateBuildings 13 01029 i001Buildings 13 01029 i002Buildings 13 01029 i003Buildings 13 01029 i004Buildings 13 01029 i005Buildings 13 01029 i006
AngularitySharp angularSubangularSharp angularAngularRoundedAngular
Table 4. Parameter range of surface area change rate.
Particle SizePebbleGraniteBasalt
9.75 (mm)2.049~4.038%1.683~5.306%2.177~4.360%
13.2 (mm)1.298~2.837%1.717~3.102%0.976~2.640%
Table 5. Technical properties of 70# matrix asphalt.
Technical SpecificationsNeedle PenetrationDuctility Index
70# Asphalt15 °C25 °C30 °C10 °C15 °C
31.068.785.0>150>150
Technical specificationsCorrelation coefficientCoefficient ACoefficient KPISoftening pointEquivalent brittle pointEquivalent softening point
70# Asphalt0.94510.06330.64210.741558.8−30.360.9
Disclaimer/Publisher’s Note: The statements, opinions and data contained in all publications are solely those of the individual author(s) and contributor(s) and not of MDPI and/or the editor(s). MDPI and/or the editor(s) disclaim responsibility for any injury to people or property resulting from any ideas, methods, instructions or products referred to in the content.

