Article

Seismic Behavior of UHPC-Filled Rectangular Steel Tube Columns Incorporating Local Buckling

1
School of Civil Engineering, Hubei Engineering University, Xiaogan 432000, China
2
School of Urban Design, Wuhan University, Wuhan 430072, China
3
School of Civil Engineering, Hubei Polytechnic University, Huangshi 435003, China
*
Author to whom correspondence should be addressed.
Buildings 2023, 13(4), 1028; https://doi.org/10.3390/buildings13041028
Submission received: 14 February 2023 / Revised: 11 April 2023 / Accepted: 12 April 2023 / Published: 13 April 2023
(This article belongs to the Special Issue Prefabricated and Modular Steel Structures)

Abstract

:
This paper presents a numerical study on the static behavior and cyclic behavior of UHPC-filled steel tube (UHPCFST) columns. A novel fiber element model is developed based on the effective distribution width method to consider the influence of local buckling. The parameters of the descending branch of the stress–strain curve of constrained concrete have been modified and proposed according to the existing experimental results. Thereafter, the impact parameter analysis of the seismic performance of UHPCFST columns under the pseudo static load is conducted, and the strength of steel and UHPC, width–thickness ratio, length–diameter ratio and axial compression ratio are considered. The results indicate that the proposed fiber element model can accurately predict the static and cyclic nonlinear behaviors of the UHPCFST columns. The bearing capacity and the post-peak ductility of UHPCFST columns can be overestimated, such as neglecting the local buckling of the steel tube, which will lead to the insecurity of structures.

1. Introduction

Concrete-filled steel tube (CFST) columns possess the advantages of high bearing capacity, large stiffness and excellent ductility [1], and are often used as the vertical and horizontal load-bearing structure members in bridges and high-rise building structures, as shown in Figure 1. In the past few decades, many numerical calculation methods have been proposed in order to estimate the static performance, cyclic behavior, as well as the fire resistance behavior of CFSTs, such as existing 3D finite element methods, secondary development based on existing numerical software ABAQUS and OpenSees, and the fiber element model. Compared with the three-dimensional finite element method, the fiber model has been considered a highly efficient algorithm in the state of only uniaxial compression, especially for nonlinear calculations of complicated engineering structures. For CFSTs, the fiber element model can predict their static behaviors, including axial compression behavior [2,3] of stub columns, axial compression behavior and eccentric compression behavior [4,5,6,7] of slender columns, as well as pushover analysis [8]. In addition, it can also be used for evaluating the fire resistance behavior [9], as well as the hysteresis behavior [3,7,8,10] of CFSTs. Generally, there have been mainly two methods to handle the local buckling of steel tubes in the fiber element model: the first method is to modify the yield stress, the stress–strain skeleton curve and the hysteretic criterion of steel in advance, according to the sectional width to thickness ratio [3,7,10]. Another method is to introduce the concept of effective distribution width that is calculated according to the sectional stress state [2,4,5,6]. At present, there is still relatively little research on the cyclic behavior of CFSTs, with local buckling considered by using the fiber element model [3,4,7,10]. In addition, once the local buckling occurs, the partial areas nearby the web are out of work, and the phenomenon of redistribution of the stress in the section occurs, leading to the stress borne by the web being transferred to the flange. On the other hand, by modifying the stress–strain skeleton curve, as well as the hysteretic criterion of steel in advance, can not really reflect the actual stress in the section and the behavior of local buckling [3,7,10].
As modern structures develop toward super-high rise, possessing heavy load bearing capacity and durability, ultra-high performance concrete (UHPC), regarded as an excellent cementitious composite rather than the ordinary concrete [11], has been gradually used in civil engineering because of its ultra-high compressive strength, high tensile strength and high elastic modulus, along with the strain hardening behavior [12,13,14,15,16]. To further improve the performance of CFSTs, the UHPC is filled into steel tubes to form UHPCFST members, which consequently contribute to the reduction of the member size and the self-weight of the structure, as well as the increase in available space in buildings under the same load conditions. In addition, the brittleness of UHPC is also avoided and its bearing capacity, as well as ductility, is further improved.
There is still relatively little research on the axial compression performance of rectangular UHPCFST stub columns at present, whilst research on the hysteresis performance of UHPCFST columns is even fewer. The reinforcement effect of the steel tubes on the core UHPC is not so strong as that of the ordinary concrete due to its ultra-high compressive strength and inherent brittleness of UHPC, and the local buckling of steel tubes is still inevitably submerged under the combined action of axial compression and cyclic loading. In this work, a fiber element model is proposed to assess the axial compression behavior and cyclic behavior of UHPCFST columns, and the local buckling is considered based on the redefined effective distribution width rather than modifying the stress–strain skeleton curve of steel. The parametric analysis is performed based on the verified model, where the effects of the yield strength of steel, the UHPC strength, length–diameter ratio, as well as the axial compression ratio on the hysteretic performance of UHPCFST columns are extensively discussed. What is more, the effects of the steel tube local buckling on the bearing capacity and ductility of UHPCFST columns are also analysed.

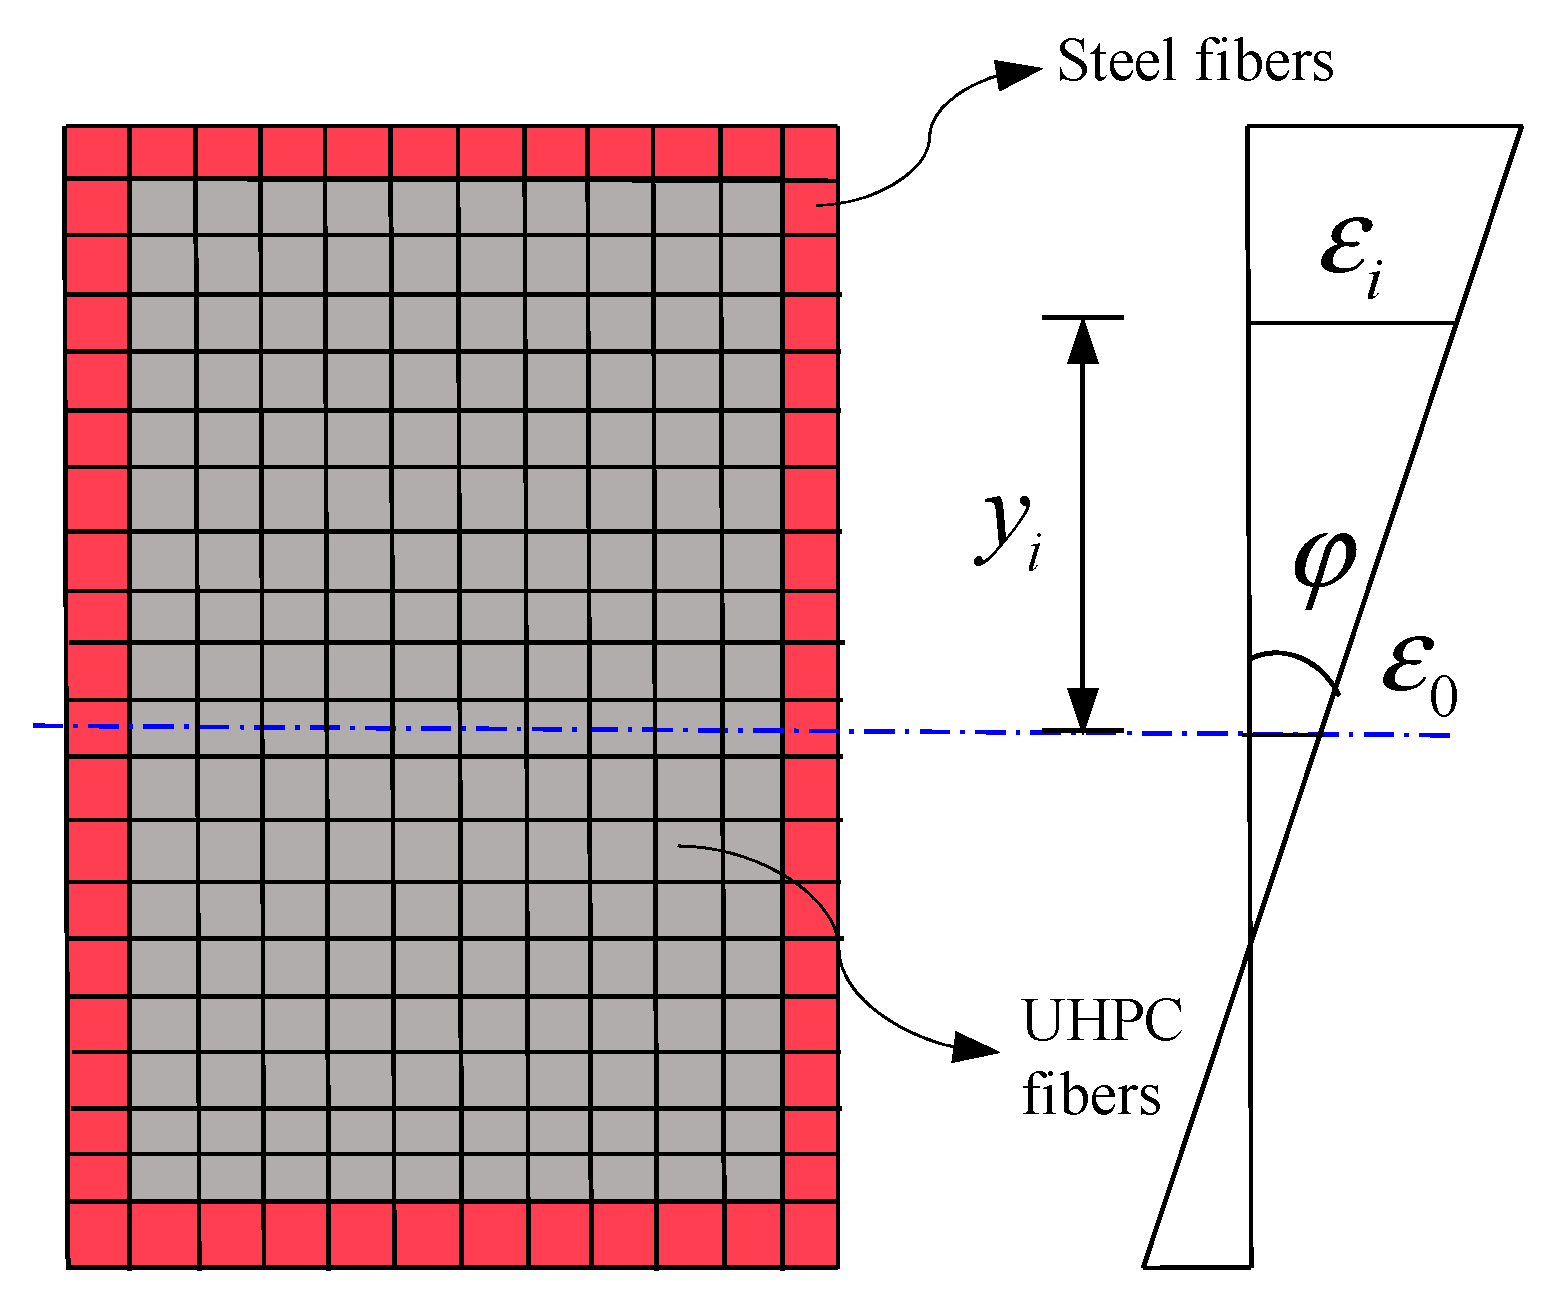
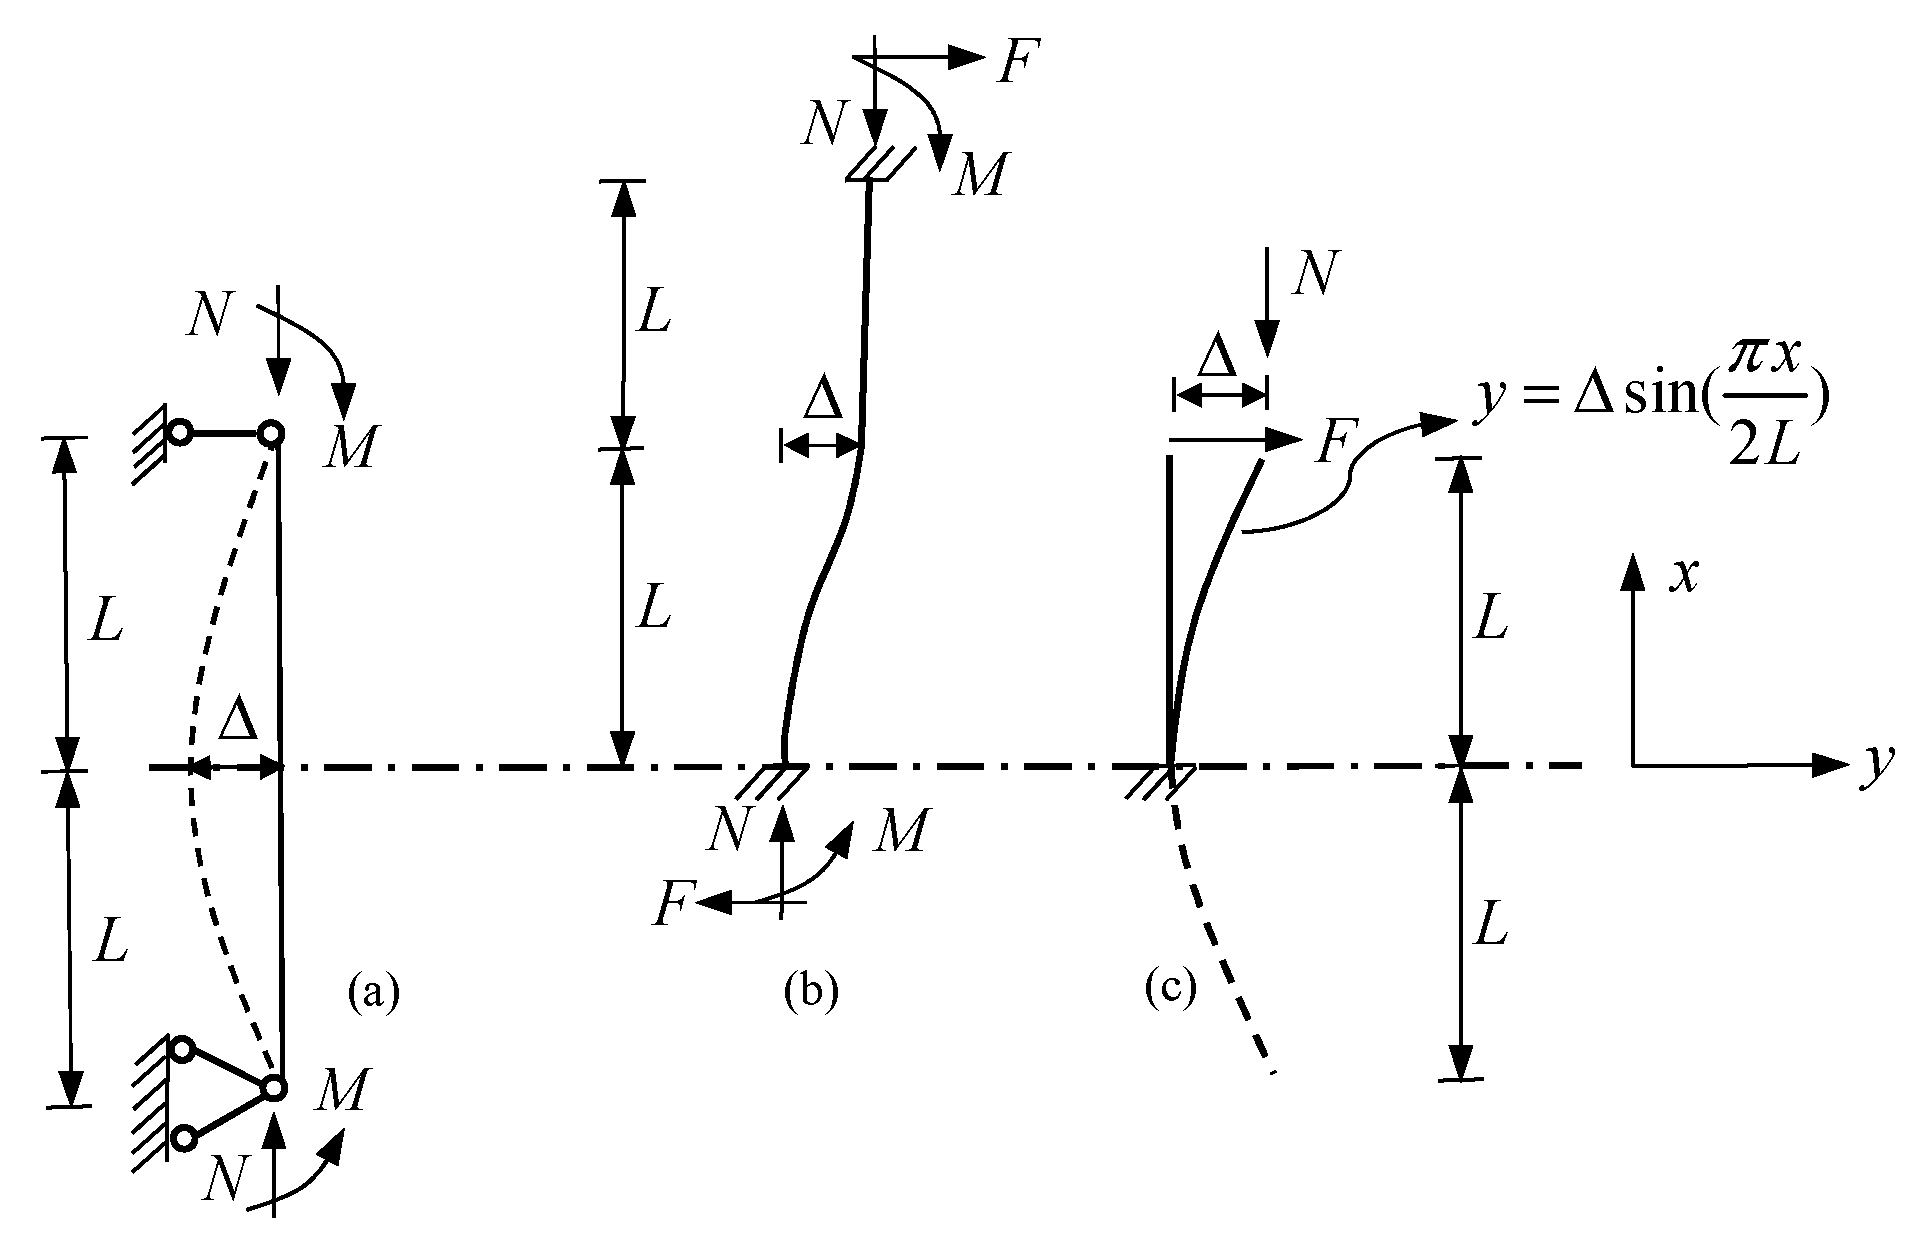
2. Fiber Element Model

In the present work, the sections of the UHPCFST columns are divided into lots of small fiber elements, as shown in Figure 2. To simplify the calculation model, the following assumptions are adopted [1]:
(1)
Plane-section assumption.
(2)
The strains are the same in each individual fiber of the same height of the cross-section.
(3)
The bond-slip at the interface between the two materials is neglected.
(4)
The lateral deflection curve of the member presents the sine curve with half a wave.
It is obvious that the first assumption, that the plane sections remain plane after flexural deformation, has been proven by lots of experiments. When the fibers in the section are discretized finely enough, the errors caused by the second assumption are very small and can be neglected. Considered that there will be large gap at the interface of the two materials when the local buckling of the steel tubes occurs (shown in Figure 1), the slippage between the two materials is neglected. Based on the above assumptions, the central strain of the fiber is given by Equation (1):
ε i = ε 0 + φ y i ,
where ε0 (με) is the strain at the center fiber of the cross-section, yi (mm) is the distance from the center of the i fiber to the center of the cross-section, and φ (με/mm) is the curvature of the cross-section. Hence, according to the stress–strain relationships and loading history of the materials, the internal forces, such as the axial compression force Nin (N) and the bending moment Min (N.mm), are given by Equations (2) and (3):
N i n = i = 1 k σ c i A c i + i = 1 m σ s i A s i
M i n = i = 1 k σ c i A c i y i + i = 1 m σ s i A s i y k ,
where σci (N/mm2) and σsi (N/mm2) are the stress of UHPC and steel, Aci (mm2) and Asi (mm2) are the area of UHPC fiber and steel fiber, and k and m are the fiber numbers of UHPC and steel.
The fourth assumption is reasonable for the members with both ends hinged, as shown in Figure 3a, which can be utilized for the calculation of UHPCFST members under axial compression or eccentric compression. Figure 3b,c are the simplified calculation of reverse bending point of columns under the different restrict boundary. As for the frame column in Figure 3b with both ends fixed and a lateral displacement of one end, the inflection point is in the middle of the column. Therefore, from the inflection point to the fixed end, it can be simplified as a cantilever member with a geometric length L, as shown in Figure 3c. If the influence of lateral load on the lateral deflection curve can be ignored, the cantilever member can be equivalent to the members with both ends hinged, as shown in Figure 3a.
According to the fourth assumption, the relationship between lateral displacement and sectional curvature can be given by Equation (4):
φ = Δ π 2 4 L 2 ,
where Δ (mm) is the lateral displacement, and L (mm) represents the effective length of the UHPCFST column.

2.1. Constitutive Model of Materials

2.1.1. Concrete

There are various forms of stress–strain models for constrained concrete [17,18], and the constitutive relationship of constrained UHPC is the basis for the numerical research on the seismic performance of UHPC-filled rectangular high strength steel tube columns in this paper. For the rectangular section, the constitutive model of the constrained concrete is shown in Figure 4a, which incorporates the skeleton curves and the hysteretic rules. The skeleton curve of constrained concrete proposed by Han [1] is used in this work and the formulas are given by Equations (5)–(7):
f = f c c [ 2 ( ε / ε c c ) ( ε / ε c c ) 2 ] for   ε   ε cc  
f = f c c ( ε / ε c c ) / [ β ( ε / ε c c ) η + ε / ε c c ] for   ε   ε cc  
η = 1.6   +   1.5 / ( ε / ε c c ) ,   β = f c 0.1 / ( γ ξ + 1 )   ( ξ   3 )
In Equations (5)–(7), β, γ and η are the parameters to determine the descending branch, and ξ is the confinement index of steel tube. εcc (με) and fcc (MPa) are the compressive peak strain and stress of the confined concrete, respectively. Although Han’s model considers the reinforcing effect of steel tubes on the core concrete, it is only appropriate for normal concrete and high-strength concrete with an fc (MPa) ranging from 24 MPa to 80 MPa. Le’geron and Paultre [19] (2003) proposed the peak stress fcc and the peak strain εcc of normal and ultra-high strength confined concrete, with an fc ranging from 27 MPa to 124 MPa according to a great quantity of experimental results, and they are given by Equations (8) and (9):
f c c = f c [ 1 + 2.4 ( I e ) 0.7 ]
ε c c = ε c [ 1 + 35 ( I e ) 1.2 ] ,
where Ie is the equivalent effective confinement index at the peak strength, which is given by Le´geron and Paultre [19], εc (με) is the peak compressive strain of unconfined UHPC which has been given by An and Fehling [20], as shown by Equation (10):
ε c = 0.00083 f c 0.276
Considering that the tensile strength of the ultra-high-performance concrete is much smaller than its compressive strength, the contribution of UHPC in the tensile zone to the internal force of the section can be ignored [21].
The hysteretic criterion includes the unloading branch and the reloading branch. The residual plastic strains at the zero-stress point, proposed by Mander et al. [22], is adopted in the present work, and it is given as Equations (11) and (12):
ε p l = ε u n ( ε u n + ε a ) σ u n σ u n + E c ε a
ε a = max ( ε c c ε c c + ε u n , 0.09 ε u n ε c c ) ,
where εun (με) and σun (MPa) are the strains and stress at the unloading point, respectively, εpl (με) is the residual plastic strain, Ec (MPa) is the elastic modulus of UHPC. Considering that the unloading branch and reloading branch suggested by Mander are too complicated, the simplified model is adopted. It is assumed that the unloading branch and the reloading branch are both straight lines between the unloading points and residual plastic strain points. They are given by Equations (13) and (14):
f = E r ( ε ε p l )
E r = σ u n ε u n ε p l ,
where Er (MPa) and f (MPa) are the stiffness and stress of the unloading stage.

2.1.2. Steel

In the present work, the bilinear hardening model with a hardening stiffness of 0.01 Es for the stress–strain skeleton curve of the steel is adopted. The uniaxial hysteretic constitute model for the steel, proposed by Menegotto and Paolo [23], as shown in Figure 4b, is also adopted in the present work.
A lot of previous research indicates that for CFSTs, the local buckling of steel tubes is one of the significant factors affecting the bearing capacity and the ductility [3,7,10], especially for thin-walled steel tubes of which the local buckling is very serious. Therefore, the sectional width–thickness ratios are limited in current provision codes [24,25,26] to avoid local buckling to some extent. As already known, after the local buckling of the steel tube, there is a stress redistribution phenomenon in the cross-section immediately, which will lead to the stress transmission path of steel tubes, with local buckling in the web being transferred to the flange.
The concept of the effective width, shown in Figure 5 is usually used to describe the post-local buckling behavior of thin-walled steel tubes. The effective width and the elastical critical local buckling strength of steel tubes for CFSTs proposed by Liang and Uy [27,28] are adopted in this work, which are given by Equations (15) and (16):
b e / b 0 = 0.675 ( σ c r / f y ) 1 / 3
σ c r f y = 0.5507 + 5.132 × 10 3 ( b 0 t ) 9.869 × 10 5 ( b 0 t ) 2 + 1.198 × 10 7 ( b 0 t ) 3 ,
where be is the total of effective width, b0 is the unsupported width in the section, t is the thickness of the steel tube, σcr is the elastic critical local buckling strength of the steel tubes, which only relies on the width–thickness ratio of the steel tube and yield strength of the steel. During the loading stages, the ineffective width bi gradually increases from zero to the maximum value (bbe). As a consequence, it can be expressed by Equation (17):
b i = ( σ 1 σ c r f y σ c r ) ( b b e )
In the calculation, the maximum compressive stress σ1 at the edge of the cross-section flange is firstly obtained, which is greater than σcr. Then, the ineffective width can be calculated according to Equation (17) and the stresses of the steel fibers within it can be updated as zero until they reach the maximum ineffective width.
It should be noted that since the UHPCFST columns are subjected to combined axial compression and lateral cyclic loading, the stresses of the steel tube and core UHPC are not only depended on the strains, but also depended on the loading history when cyclic behavior is computed.

3. Model Verification

In the present work, the computational process of stub UHPCFST columns under axial compression has been referred to by Ahmed et al. [2,4]. On the other hand, for the predication of cyclic behavior, the UHPCFST member is regarded as a cantilever column subjected to the combined action of axial compression and lateral cyclic loading. Considering the second-order effect of vertical axial compression load on the top of the column, the lateral load can be expressed as Equation (18):
F = ( M N Δ ) / L ,
where M is the calculated bending moment at the bottom of the column and N is the pre-applied axial compression force. The calculated steps of the cyclic behavior for UHPCFST columns are detailed in Figure 6.
The calculated steps of cyclic behavior for UHPCFST columns are as follows:
(1)
Input data.
(2)
Discretize section into fibers and obtain the coordinates.
(3)
Gradually increase the displacement and calculate sectional curvature according to Equation (4).
(4)
Assume the strain at the neutral axis and calculate the fiber stress σci and σsi according to loading history.
(5)
Judge whether the local buckling of steel tubes occurs and calculate the ineffective width; then, update the stress.
(6)
Compute internal force according to Equations (2) and (3), including Min and Nin.
(7)
Judge whether the axial compression load satisfies the equilibrium condition |NinN| < 10−2. If not, return to step (4) until the equilibrium condition is satisfied.
(8)
Compute the lateral load according to Equation (18).
(9)
Repeat steps (3–8) until the maximum lateral displacement is achieved.
(10)
Plot F-Δ hysteretic curves.

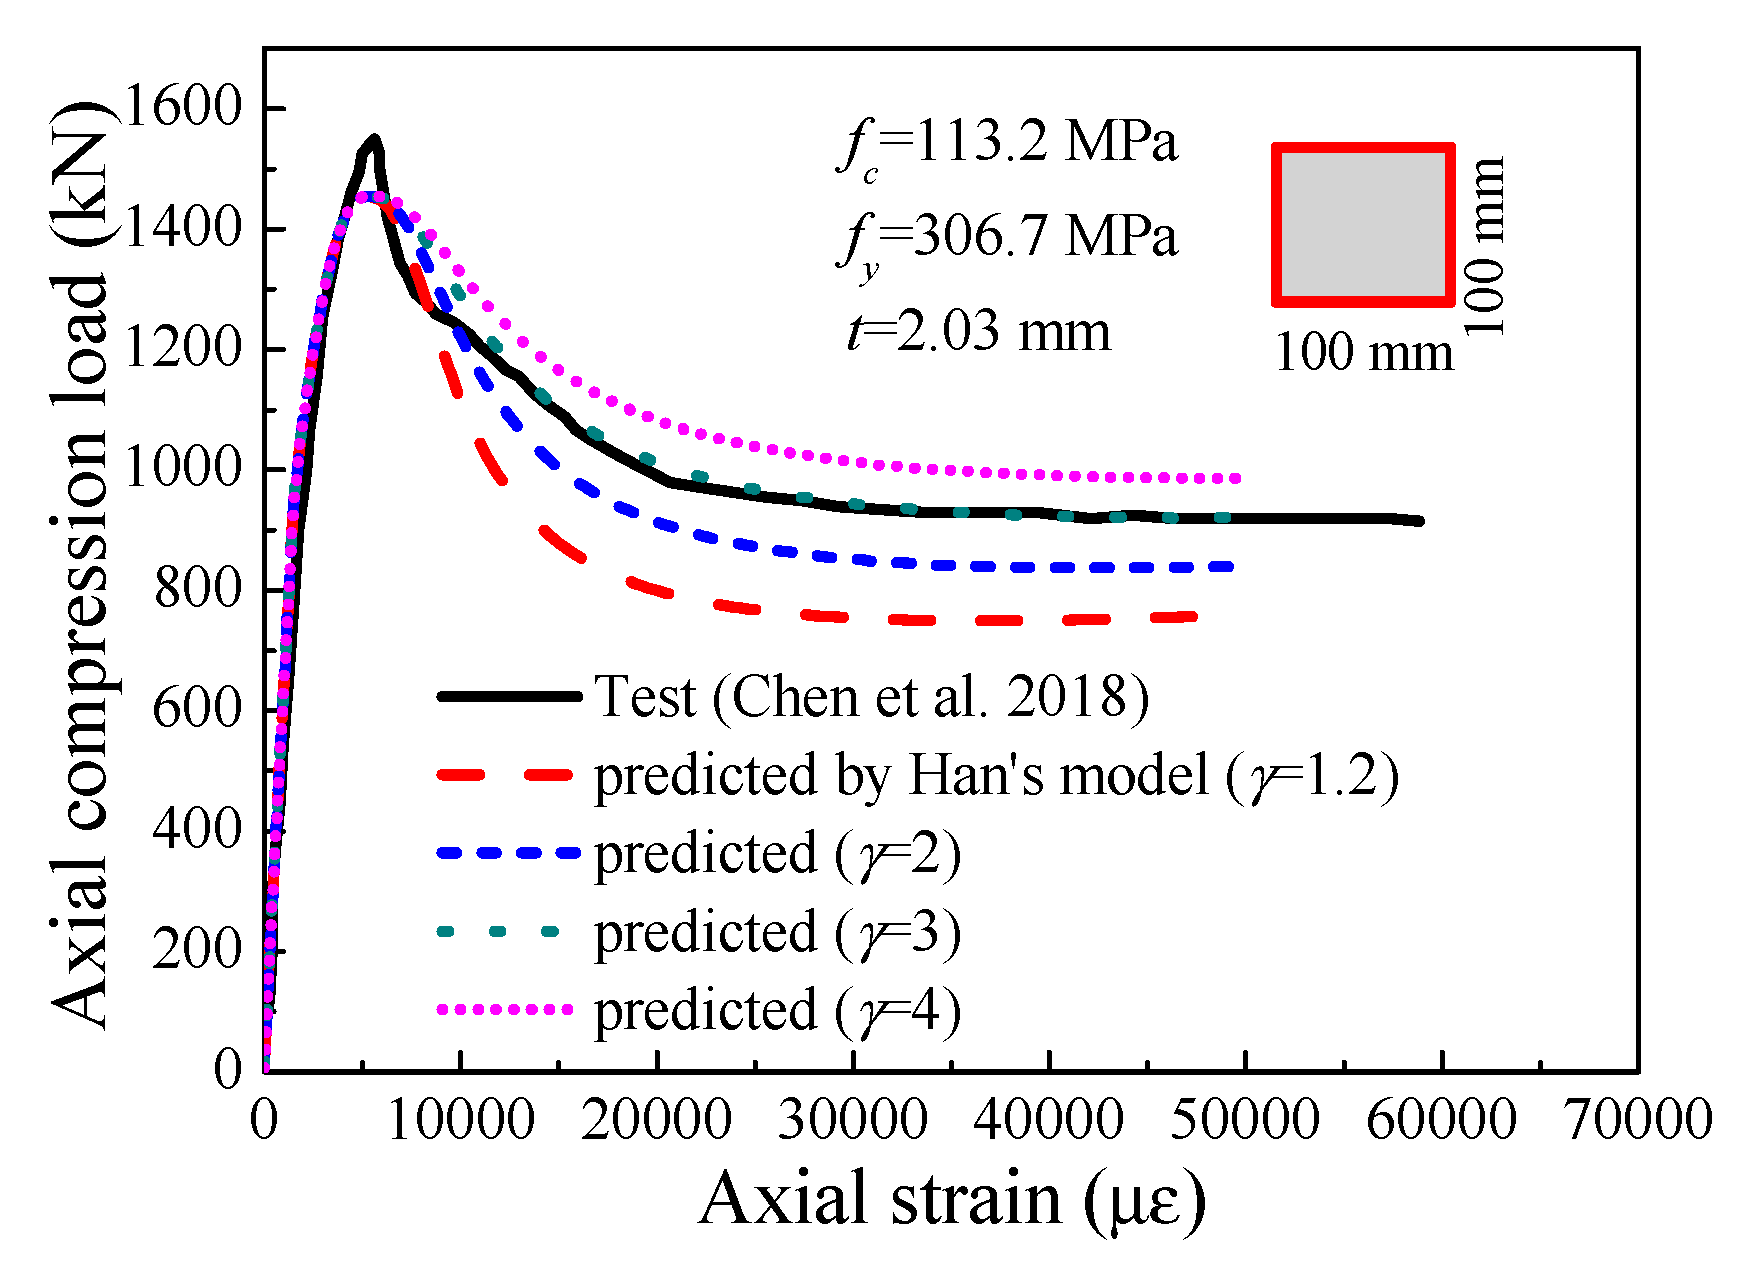
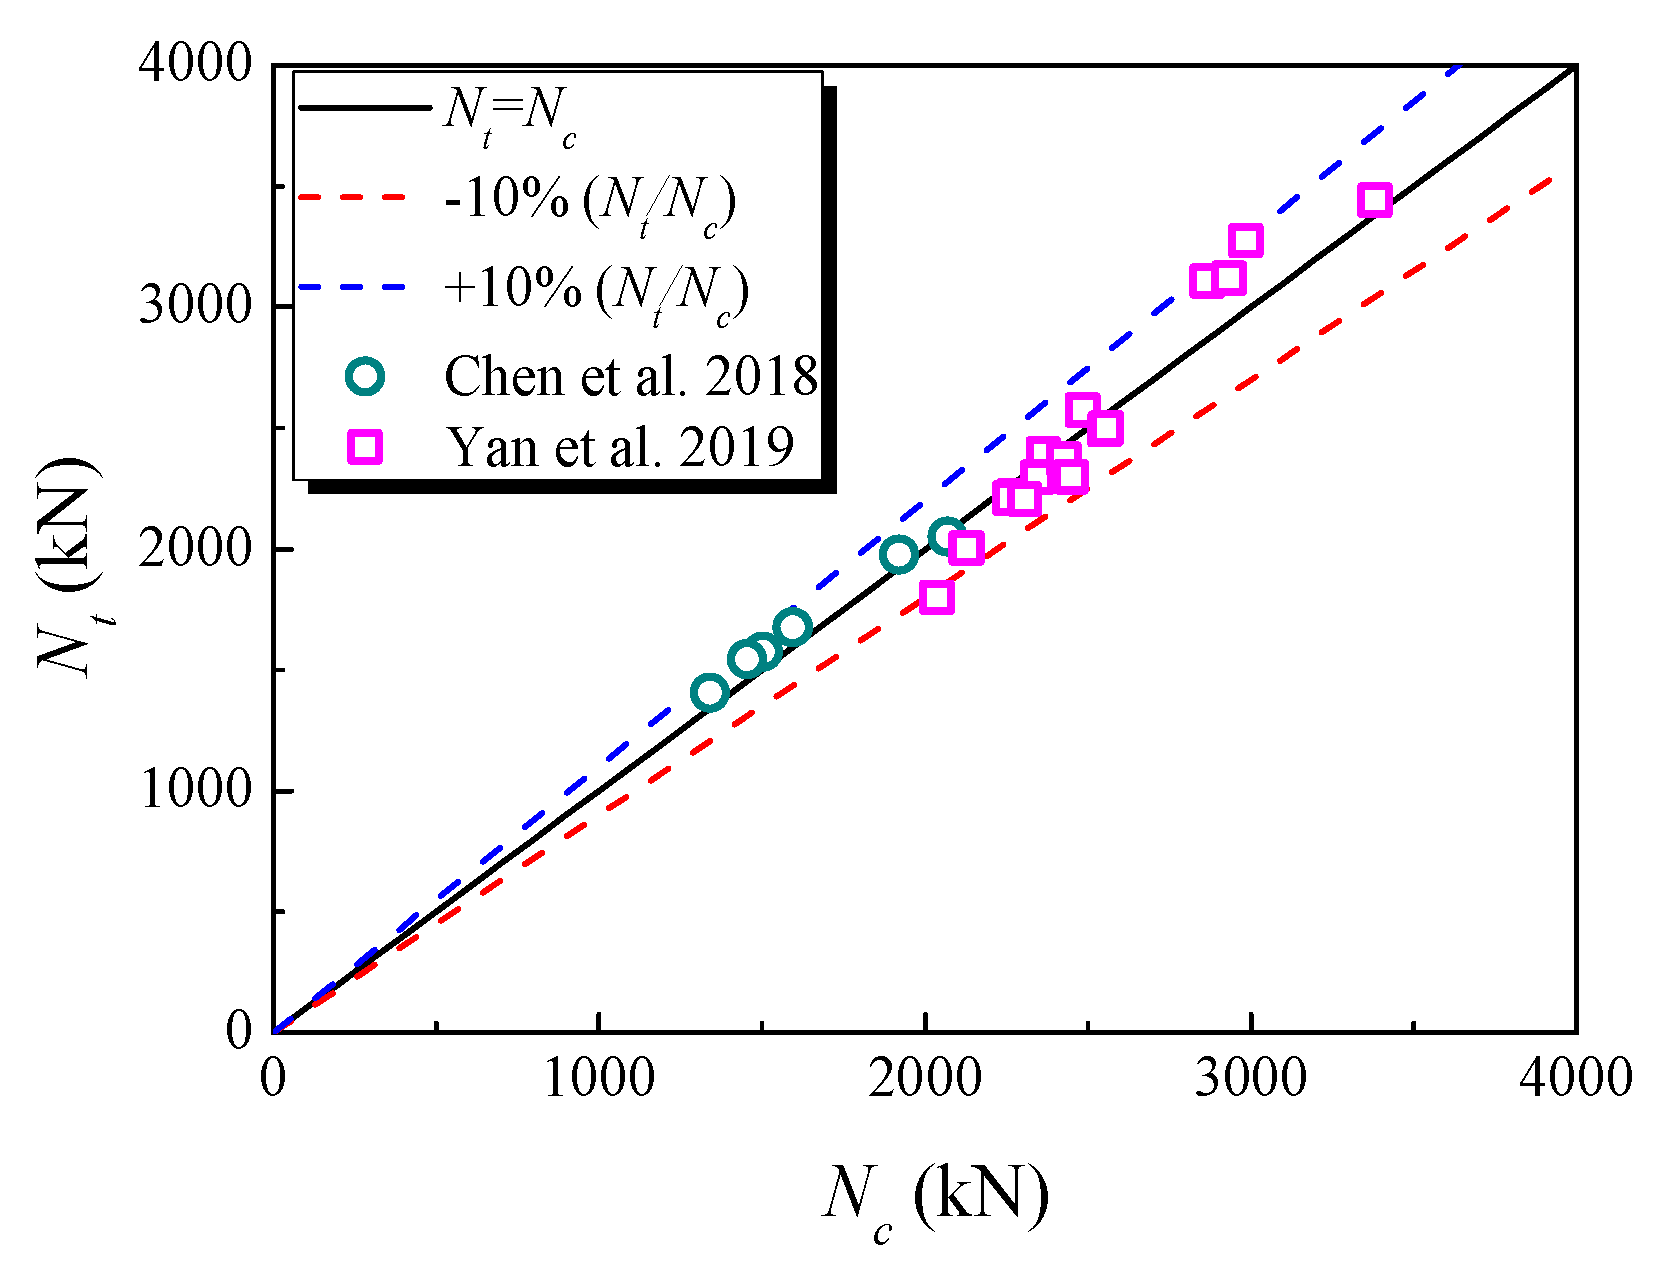
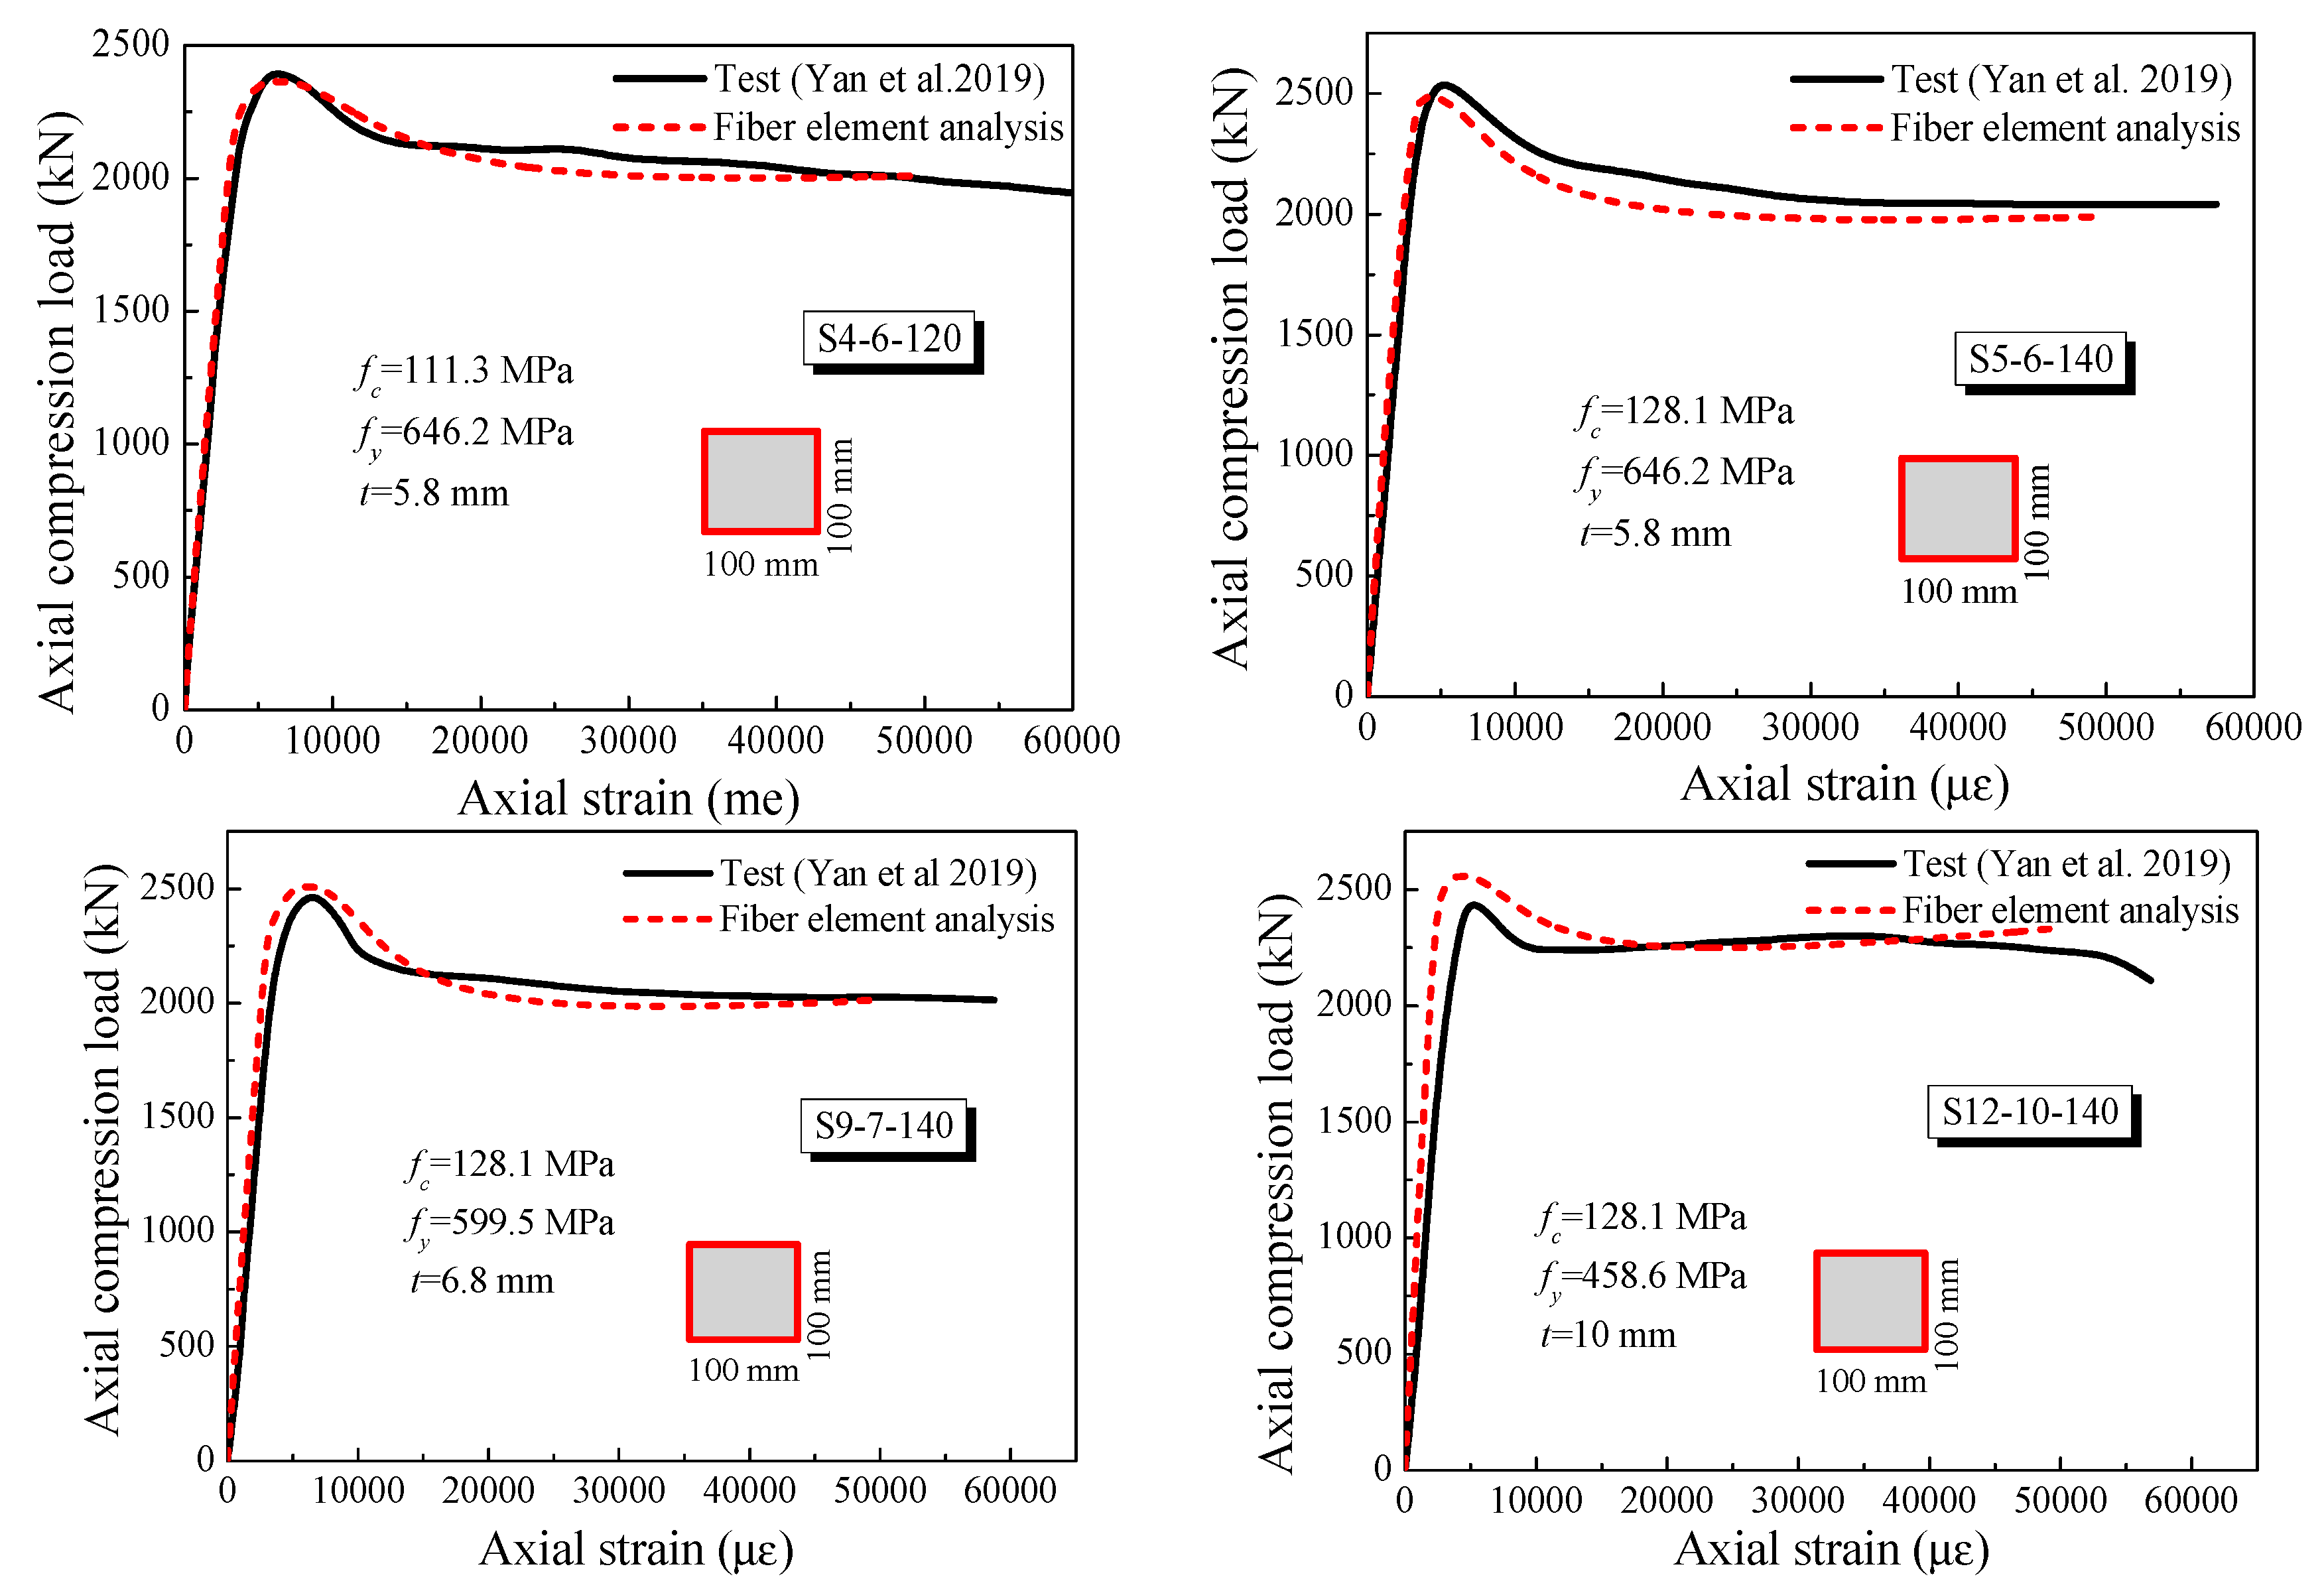
3.1. Stub UHPCFST Columns under Axial Compressive Load

The axial compression behavior is important for UHPCFST columns on the account of the axial compression load–strain (N-ε) curves, showing information of axial compressive stiffness, the ultimate bearing capacity, as well as the residual bearing capacity. Chen et al. [29] and Yan et al. [30] investigated some stub rectangular UHPCFST columns under axial compressive load by experiments. The length of the stub columns were 300 mm, with the dimensions of 100 (mm) × 100 (mm). The strength of the steel tube and the core UHPC, as well as the steel tube thickness of each column varied. The details of the specimens are summarized in Table 1. The specimens are simply supported at both ends, and the axial displacement is imposed to the boundary of the column end.
The full axial compression load–strain (N-ε) curves of specimen SS2-2 with different γ values are shown in Figure 7. The result of the experiment is also plotted in Figure 7. It can be easily concluded that the ascending branch of the full N-ε curve can be well predicted by Han’s model, whilst it is inaccurate for the descending branch. It is obvious that the residual bearing capacity and the post-peak ductility of the stub UHPCFST column are greatly underestimated by Han’s model. Therefore, the descending branch of the stress–strain curve of concrete in Han’s model needs to be revised. The parameter γ in Equation (7) is a key factor to affect the post-peak ductility and residual stress of concrete, and it is taken as 1.2 in Han’s model. In the present work, the fiber element result is compared with the test result by adjusting the value of γ (γ = 1.2, 2, 3, 4) of the stub UHPCFST column. It is found that when γ value is taken as 3, the descending branch predicted by the fiber model is in good agreement with the experimental results, and it can well predict the post-peak ductility and the residual bearing capacity of the stub UHPCFST columns. It can be also seen from Figure 8 and Table 1 that the bearing capacities calculated by the fiber model are shown to agree with test results. Except for specimen S1-5-100, the errors between them are within the range of 10%, whilst for specimen S1-5-100, the error between the fiber model and the test result is 13%. This may be due to the uncertainty of the actual strength of UHPC.
The full N-ε curves of partial specimens predicated by the fiber model in the present work (γ = 3) are plotted in Figure 9 and Figure 10. As illustrated in Figure 9 and Figure 10, the calculations of the fiber model are in good agreement with the test results. In addition, for the strengthening effect of the high-strength steel and the constraint enhancement effect of the steel tubes on the core UHPC, the residual bearing capacity decreases slowly after reaching peak value, and subsequently remains basically constant, which illustrates that the favorable post-peak ductility and the residual bearing capacity of UHPCFST columns are showed.

3.2. UHPCFST Columns under Cyclic Loading

The cyclic load testing is an effective means of evaluating the seismic performance of structures and members. So far, there is limited research on the cyclic behaviors of UHPCFST columns. The seismic performance of the UHPCFST columns under combined axial compression and cyclic lateral loading has been investigated by Xu et al. [31] and Cai et al. [32]. The details of the specimens are summarized in Table 2. The lateral load–displacement skeleton curves of the positive direction of the UHPCFST columns with local buckling considered or not considered are showed in Figure 11, and the corresponding test results are also plotted in Figure 11. As illustrated in Figure 11, the local buckling has a significant impact on the bearing capacity and the ductility of the UHPCFST columns. The larger bearing capacity as well as stiffness (after local buckling occuring) of The UHPCFST columns will be provided if local buckling is neglected. In addition, neglecting the local buckling will greatly overestimate the post-peak ductility of the UHPCFST columns. The reason for this result is that the compressive strength of UHPC is far higher than normal concrete, and the partial area of the cross-section will be out of work when the local buckling of steel tubes occurs, which consequently weakens the restraining effect of steel tubes on the core UHPC and results in a significant reduction of post-peak ductility. The descending branch of the lateral load–displacement curves in Figure 11 are more steeper if the local buckling is considered, and the post-peak ductility is worse, which is closer to the test results.
The lateral load–displacement hysteretic curves of the test, and which were predicted by the fiber element model with the local buckling considered, are shown in Figure 12. The skeleton curve, without considering the influence of local buckling, is also plotted in Figure 12. As illustrated in Figure 12, similarly taking no account the local buckling of steel tubes overestimates the bearing capacity and post-peak ductility of UHPCFST columns under cyclic loading, which will lead to the insecurity of structures. The bearing capacities of specimens named S-10-0.2-1.5 and S-10-0.4-1.5 are overestimated by 3.2% and 11.8%, respectively, and this phenomenon tends to be increased with the increase in the axial compression ratio. In this work, the bearing capacities and the post-peak ductility with local buckling considered are in good agreement with experimental results. The errors of the maximum bearing capacity between the fiber model and the test results in Table 2 are within the range of 10%. However, for the unloading branch and reloading branch, there are a few differences in the local area between the fiber model and the test results. This may be attributed to the fact that the UHPCFST columns are ideal consolidation models (one end fixed to the ground) on the ground in the fiber model, whilst this is not the case in the experiment.
The effective confinement effect of steel tubes on the core UHPC is the basis for UHPCFST members to fully exploit the potential of the two materials; therefore, the adverse effect of the local buckling of steel tubes should be reasonably considered in the seismic design, which is particularly important.

4. Parametric Analysis

In order to further reveal the impact of some parameters on the seismic performance of the UHPCFST columns, the yield strength of steel (fy = 345 MPa, 460 MPa, 560 MPa), compressive strength of UHPC (fcu = 100 MPa, 120 MPa, 140 MPa), length–diameter ratio (λ = 23.1, 34.6, 46.2) and axial compression ratio (n = 0.3, 0.4, 0.5) are comprehensively considered to conduct parametric analysis. Based on the previously validated fiber model, the parameters of the columns for numerical analysis are summarized in Table 3. The bearing capacity, stiffness degradation and cumulative dissipated energy are the main indicators to evaluate the seismic performance of the columns and the structures. The definition of the secant stiffness in this article is as follows:
K = F i / Δ i ,
where Δi is the peak displacement in each hysteresis loop and Fi is the lateral load corresponding to the Δi. The hysteretic curves are plotted in Figure 13, and the bearing capacity, cumulative dissipated energy, as well as lateral stiffness degradation, including initial stiffness (at 0.5% drift ratio level), are shown in Figure 14, Figure 15, Figure 16 and Figure 17. In Figure 13, the blue line represents the skeleton curve of the quasi-static test of the column.

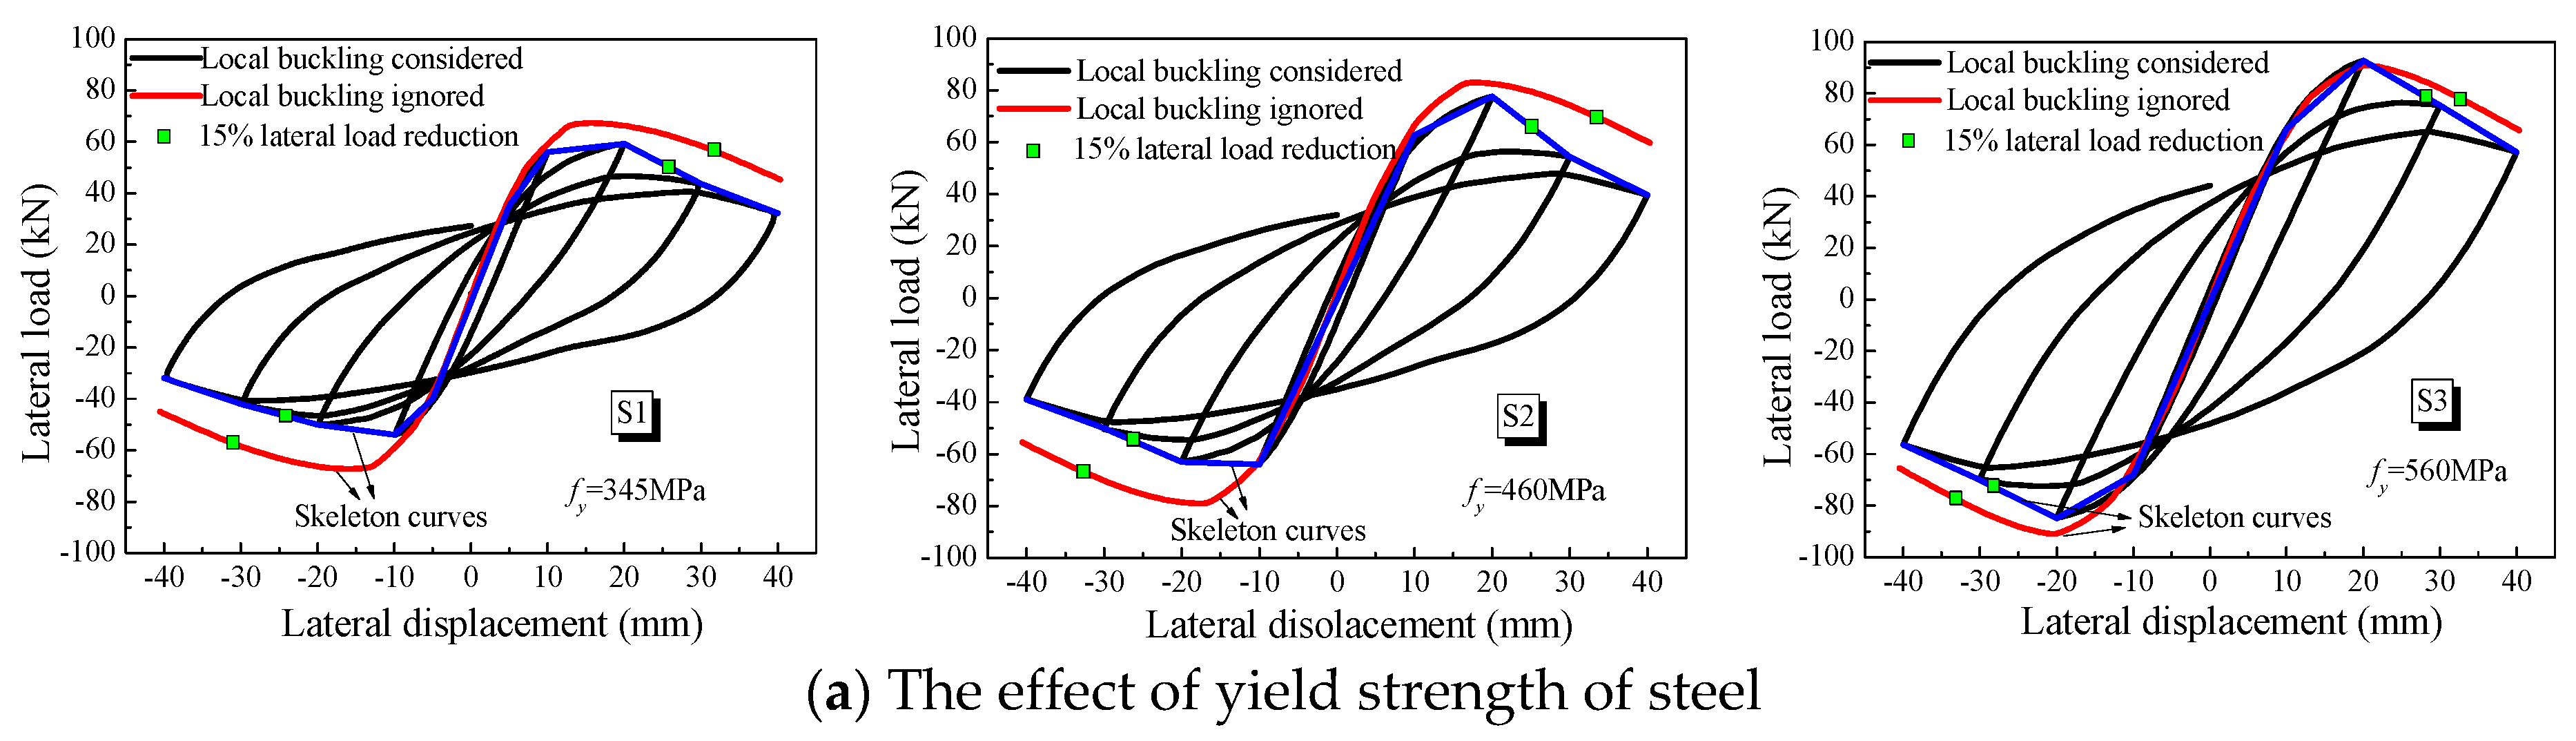
4.1. The Effect of the Strength of Steel

As illustrated in Figure 13a and Figure 14, the bearing capacity, lateral stiffness and cumulative dissipated energy of UHPCFST columns are both increased with the increase in the yield strength of steel. As expected, the bearing capacity and the post-peak ductility could be overestimated, neglecting the local buckling of the steel tube. The bearing capacities of UHPCFST columns are overestimated by 13.7%, 7% and 2.1% if the yield strength of steel is 345 MPa, 460 MPa and 560 MPa, respectively. The errors caused by local buckling are gradually decreased. This is mainly on the account that the steel with higher yield strength possess higher critical local buckling stress. However, the accuracy of post-peak ductility estimation is still not improved.

4.2. The Effect of the UHPC Strength

In Figure 13b and Figure 15, the bearing capacity, the lateral stiffness and the cumulative dissipated energy capacity of UHPCFST columns are only slightly increased with the compressive strength of UHPC increasing from 100 MPa to 140 MPa, which indicates that it is inappropriate to promote the seismic performance of UHPCFST columns by increasing the compressive strength of UHPC. Moreover, the error caused by the local buckling does not seem to be increased with the increase in compressive strength.

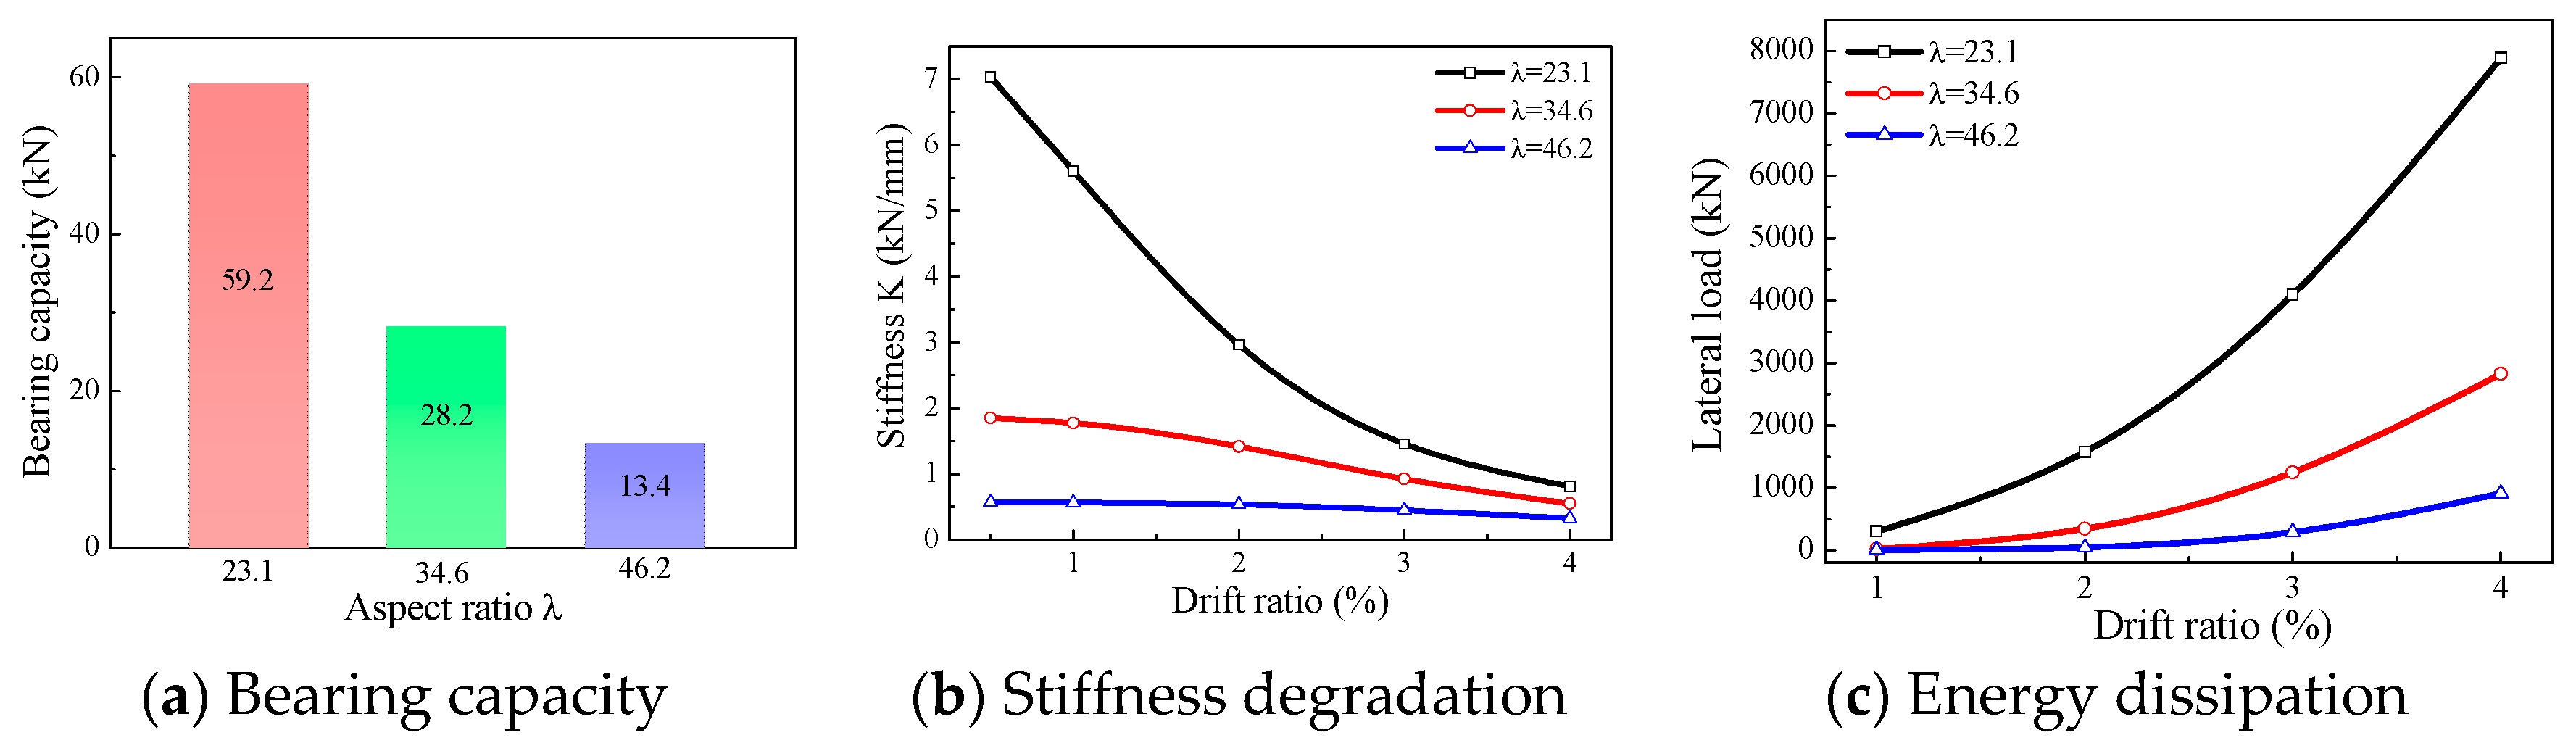
4.3. The Effect of the Length–Diameter Ratio

From Figure 13c and Figure 16, it can be seen that the length–diameter ratio has a significant influence on the seismic performance of UHPCFST columns. The bearing capacity, lateral stiffness and cumulative dissipated energy of the UHPCFST columns have significant negative correlations with the length–diameter ratio. Specimen S1, with a length–diameter ratio of 23.1, possesses plumper hysteretic curves, larger bearing capacity, as well as cumulative dissipated energy; whilst for specimens S6 and S7 with larger length–diameter ratios, although the residual deformation is small, the pinching effects of hysteresis curves are pretty serious and the energy dissipation capacity is worse. In addition, as the length–diameter ratio increases, not considering the local buckling of the steel tube will further increase the overestimation of the bearing capacity and post-peak ductility of the UHPCFST columns. Therefore, slender columns should be avoided in seismic design, or reasonable lateral support should be laid out to decrease the shear span.

4.4. The Effect of the Axial Compression Ratio

The axial compression ratio is one of the major factors to influence the seismic performance of UHPCFST columns. As shown in Figure 13d and Figure 17, the bearing capacity and lateral stiffness of the UHPCFST columns are both decreased with the increment of the axial compression ratio. Specimen S9, with a higher axial compression ratio of 0.5, experiences great lateral stiffness degradation, with the drift ratio ranging from 1 to 3%, and it even shows negative stiffness when the drift ratio reaches 4%, which is closely related to the second-order effect of the vertical load at the top of the columns. As the axial compression ratio increases, the cumulative dissipated energy is slightly increased. It should be noted that when the axial compression ratio reaches 0.5, neglecting the local buckling causes an overestimation of the maximum value rather than the post-peak ductility, the descending branch of the skeleton curve with the local buckling ignored agrees well with the hysteretic curve. This is mainly attributed to a more severe second-order effect of axial compressive load–lateral displacement under the high axial compression ratio.
While analysis of the influencing factors is reported, relatively fewer studies reported mostly the seismic performance of the UHPCFST columns comprising various supplementary columns of a large aspect ratio (h/t ≥ 50) and high strength steel (fy ≥ 560 MPa). Of particular importance, there is relatively little research on analyzing the parameters affecting the seismic performance under the large axial compression ratios (n ≥ 0.6). It is also shown that there is an urgent need to conduct research on the seismic performance of concrete-filled thin-walled steel tube columns composed of ultra-high performance concrete (fcu ≥ 160 Mpa) and high-strength steel (fy ≥ 560 MPa) under high axial compression ratios (n ≥ 0.6).

5. Conclusions

In the present work, a fiber element model of the UHPCFST columns is developed to investigate the static behavior and hysteretic behavior of UHPCFST columns, where the effect of the local buckling of the steel tubes is considered based on the effective distribution width. The correctness and reliability of the fiber element model are verified by lots of experiments. Then, the parametric analysis is presented for discussing the influence of the yield strength of the steel, the strength of UHPC, the length–diameter ratio and the axial compression ratio on the seismic performance of UHPCFST columns. On the basis of the results and discussions presented in the paper, the main conclusions are summarized as follows:
(1)
For the stress–strain model for the confined UHPC, satisfactory results are obtained when the parameter γ is taken as 3.0.
(2)
The proposed fiber element model can predict the nonlinear static and cyclic behavior of UHPCFST columns well.
(3)
Neglecting the local buckling of the thin-walled steel tubes can bring about the overestimation of the bearing capacity and the post-peak ductility of UHPCFST columns.
(4)
The errors caused by the local buckling of the steel tube are increased with the increasing in the length–diameter ratio. The errors in terms of bearing capacity, induced by the local buckling, are decreased with the increasing of the yield strength of steel. A higher axial compression ratio causes an overestimation of the maximum value rather than the post-peak ductility.

Author Contributions

Conceptualization, Y.W. and Y.Y. (Yanxiang Yan).; methodology, H.C.; software, H.C.; validation, Y.W. and Y.Y. (Yanxiang Yan); formal analysis, H.C.; investigation, Y.Y. (Yu Yan); resources, Y.Y. (Yanxiang Yan); data curation, Y.Z.; writing—original draft preparation, Y.Y. (Yu Yan); writing—review and editing, Y.Y. (Yanxiang Yan); visualization, Y.Y. (Yu Yan); supervision, Y.Y. (Yanxiang Yan); project administration, Y.Y. (Yanxiang Yan); funding acquisition, Y.W. All authors have read and agreed to the published version of the manuscript.

Funding

This research was funded by the Natural Science Foundation of Xiaogan City Hubei Province [XGKJ2022010099], the College Students Innovations Special Project of Hubei Engineering University [DC2022037], and the National Natural Science Foundation of China [51508421].

Data Availability Statement

All data is in editable origin images and will no longer be provided separately.

Acknowledgments

Many thanks to Lihua Xu from Wuhan University for providing the research conditions and foundations.

Conflicts of Interest

The authors declare no conflict of interest.

References

  1. Han, L.H. Concrete Filled Steel Tubular Structures from Theory to Practices; Science Press: Beijing, China, 2016. [Google Scholar]
  2. Ahmed, M.; Liang, Q.Q.; Patel, V.I. Nonlinear analysis of rectangular concrete-filled double steel tubular short columns incorporating local buckling. Eng. Struct. 2018, 175, 13–26. [Google Scholar] [CrossRef]
  3. Zubydan, A.H.; ElSabbagh, A.I. Monotonic and cyclic behavior of concrete-filled steel-tube beam-columns considering local buckling effect. Thin-Walled Struct. 2011, 49, 465–481. [Google Scholar] [CrossRef]
  4. Ahmed, M.; Liang, Q.Q.; Patel, V.I.; Hadi, M.N.S. Nonlinear analysis of square concrete-filled double steel tubular slender columns incorporating preload effects. Eng. Struct. 2020, 207, 110272. [Google Scholar] [CrossRef]
  5. Vrcelj, Z.; Uy, B. Strength of slender concrete-filled steel box columns incorporating local buckling. J. Constr. Steel. Res. 2002, 58, 275–300. [Google Scholar] [CrossRef]
  6. Uy, B. Strength of concrete filled steel box columns incorporating local buckling. J. Struct. Eng. 2000, 126, 341–352. [Google Scholar] [CrossRef]
  7. Valipour, H.R.; Foster, S.J. Nonlinear static and cyclic analysis of concrete-filled steel columns. J. Constr. Steel. Res. 2010, 66, 793–802. [Google Scholar] [CrossRef]
  8. Varma, A.H.; Ricles, J.M.; Sause, R. Seismic behavior and modeling of high-strength composite concrete-filled steel tube (CFT) beam–columns. J. Constr. Steel. Res. 2002, 58, 725–758. [Google Scholar] [CrossRef]
  9. Kamila, G.M.; Liang, Q.Q.; Hadi, M.N.S. Fiber element simulation of interaction behavior of local and global buckling in axially loaded rectangular concrete-filled steel tubular slender columns under fire exposure. Thin-Walled Struct. 2019, 145, 106403. [Google Scholar] [CrossRef]
  10. Chung, K.; Chung, J.; Choib, S. Prediction of pre- and post-peak behavior of concrete-filled square steel tube columns under cyclic loads using fiber element method. Thin-Walled Struct. 2007, 45, 747–758. [Google Scholar] [CrossRef]
  11. Richard, P.; Cheyrezy, M. Composition of reactive powder concretes. Cem. Concr. Res. 1995, 25, 1501–1511. [Google Scholar] [CrossRef]
  12. Xu, L.Y.; Huang, B.T.; Lao, J.C. Tensile over-saturated cracking of Ultra-high-strength engineered cementitious composites (UHS-ECC) with artificial geopolymer aggregates. Cem. Concr. Comp. 2023, 136, 104896. [Google Scholar] [CrossRef]
  13. Su, Y.; Wu, C.Q.; Li, J. Development of novel ultra-high performance concrete: From material to structure. Constr. Build. Mater. 2017, 135, 517–528. [Google Scholar] [CrossRef]
  14. Deng, E.F.; Zhang, Z.; Zhang, C.X. Experimental study on flexural behavior of UHPC wet joint in prefabricated multi-girder bridge. Eng. Struct. 2023, 275, 115314. [Google Scholar] [CrossRef]
  15. Kang, S.T.; Chio, J.I.; Koh, K.T. Hybrid effects of steel fiber and microfiber on the tensile behavior of ultra-high performance concrete. Compos. Struct. 2016, 145, 37–42. [Google Scholar] [CrossRef]
  16. Park, S.H.; Kim, D.J.; Ryu, G.S. Tensile behavior of ultra high performance hybrid fiber reinforced concrete. Cem. Concr. Compos. 2012, 34, 172–184. [Google Scholar] [CrossRef]
  17. Montuori, R.; Piluso, V.; Tisi, A. Ultimate behavior of FRP wrapped sections under axial force and bending: Influence of stress-strain confinement model. Compos. Part B-Eng. 2013, 54, 85–96. [Google Scholar] [CrossRef]
  18. Cavaleri, L.; Trapani, F.D.; Ferrotto, M.F. Stress-strain models for normal and high strength confined concrete: Test and comparison of literature models reliability in reproducing experimental results. Ing. Sismica-ital. 2017, 34, 114–137. [Google Scholar]
  19. Le´geron, F.; Paultre, P. Uniaxial confinement model for normal- and high-strength concrete columns. J. Struct. Eng. 2003, 129, 241–252. [Google Scholar] [CrossRef]
  20. An, L.H.; Fehling, E. Assessment of stress-strain model for UHPC confined by steel tube stub columns. Struct. Eng. Mech. 2017, 63, 371–384. [Google Scholar]
  21. Li, G.C.; Liu, D.; Yang, Z.J.; Zhang, C.Y. Flexural behavior of high strength concrete filled high strength square steel tube. J. Constr. Steel. Res. 2017, 128, 732–744. [Google Scholar] [CrossRef]
  22. Mander, J.B.; Priestly, M.N.J.; Park, R. Theoretical stress–strain model for confined concrete. J. Struct. Eng. 1988, 114, 1804–1826. [Google Scholar] [CrossRef] [Green Version]
  23. Menegotto, M.; Paolo, E. Method of analysis for cyclically loaded R.C. plane frames including change in geometry and non-elastic behavior of elements under combines normal force and bending. In Proceedings of the IABSE Symposium on Resistance and Ultimate Deformability of Structures, Lisbon, Portugal, 12–14 September 1973; pp. 15–22. [Google Scholar]
  24. AIJ. Recommendations for Design and Construction of Concrete Filled Steel Tubular Structures; Architectural Institute of Japan: Tokyo, Japan, 2001. [Google Scholar]
  25. AISC. Load and Resistance Factor Design (LRFD) Specification for Structural Steel Buildings; American Institute of Steel Construction: Chicago, IL, USA, 1999. [Google Scholar]
  26. EC4. Design of Composite Steel and Concrete Structures; European Committee for Standardization: Brussels, Belgium, 2004. [Google Scholar]
  27. Liang, Q.Q.; Uy, B.; Liew, J.Y.R. Local buckling of steel plates in concrete filled thin-walled steel tubular beam-columns. J. Constr. Steel. Res. 2007, 63, 396–405. [Google Scholar] [CrossRef] [Green Version]
  28. Liang, Q.Q.; Uy, B. Theoretical study on the post-local buckling of steel plates in concrete filled thin-walled steel box columns. Comput. Struct. 2000, 75, 479–490. [Google Scholar] [CrossRef] [Green Version]
  29. Chen, S.M.; Zhang, R.; Jia, L.J. Structural behavior of UHPC filled steel tube columns under axial loading. Thin-Walled Struct. 2018, 130, 550–563. [Google Scholar] [CrossRef]
  30. Yan, Y.X.; Xu, L.H.; Li, B. Axial behavior of ultra-high performance concrete (UHPC) filled stocky steel tubes with square sections. J. Constr. Steel. Res. 2019, 158, 417–428. [Google Scholar] [CrossRef]
  31. Xu, S.C.; Wu, C.Q.; Liu, Z.X. Experimental investigation on the cyclic behaviors of ultra-high performance steel fiber reinforced concrete filled thin-walled steel tubular columns. Thin-Walled Struct. 2019, 140, 1–20. [Google Scholar] [CrossRef]
  32. Cai, H.; Xu, L.H.; Chi, Y. Seismic performance of rectangular ultra-high performance concrete filled steel tube (UHPCFST) columns. Compos. Struct. 2021, 259, 113242. [Google Scholar] [CrossRef]
Figure 1. Application of CFSTs in structural engineering and its local buckling effects.
Buildings 13 01028 g001
Figure 2. Fiber model cross-section.
Buildings 13 01028 g002
Figure 3. Mechanical models of the UHPCFST members.
Buildings 13 01028 g003
Figure 4. The constitutive models of the two materials.
Buildings 13 01028 g004
Figure 5. The effective distribution width of the steel tube.
Buildings 13 01028 g005
Figure 6. The flowchart of the hysteresis curve calculation.
Buildings 13 01028 g006
Figure 7. Full N-ε curves of specimen SS2-2 with different γ values [29].
Buildings 13 01028 g007
Figure 8. Comparisons of fiber model with test data [29,30].
Buildings 13 01028 g008
Figure 9. Calculations for the UHPCFST specimen columns SS3-2 and SS3-3 [29].
Buildings 13 01028 g009
Figure 10. Calculations for the UHPCFST specimen column [30].
Buildings 13 01028 g010aBuildings 13 01028 g010b
Figure 11. Calculations of the UHPCFST specimens SpeUTH6 and SpeUCR36 [31].
Buildings 13 01028 g011
Figure 12. Calculations of the UHPFST specimens S-10-0.2-1.5, S-10-0.4-1.5 and S-10-0.2-2 [32].
Buildings 13 01028 g012aBuildings 13 01028 g012b
Figure 13. The effects of parameters on hysteretic curves.
Buildings 13 01028 g013aBuildings 13 01028 g013b
Figure 14. The effect of the yield strength of steel.
Buildings 13 01028 g014
Figure 15. The effect of the compressive strength of UHPC.
Buildings 13 01028 g015
Figure 16. The effect of the length–diameter ratio.
Buildings 13 01028 g016
Figure 17. The effect of the axial compression ratio.
Buildings 13 01028 g017
Table 1. Details of stub rectangular UHPCFST specimens under axial compressive load.
OriginSpecimen NameB × h (mm)t (mm)L (mm)fy (MPa)fc (MPa)Nc
(kN)
Nt
(kN)
Nc/Nt
Chen et al. [29]SS1-2100 × 1002.03300348.7113.2134014060.95
SS1-3100 × 1002.05300348.7130.8150315750.95
SS2-2100 × 1003.83300306.7113.2145415440.94
SS2-3100 × 1003.79300306.7130.8159516760.95
SS3-2100 × 1007.59300371.6113.2192119760.97
SS3-3100 × 1007.63300371.6130.8206920511.01
Yan et al. [30]S1-5-100100 × 1004.9300668.889.2203818001.13
S2-5-110100 × 1004.9300668.8100.3212820041.06
S3-6-110100 × 1005.8300646.2100.3227422201.02
S4-6-120100 × 1005.8300646.2111.3236423910.99
S5-6-140100 × 1005.8300646.2128.1248425730.97
S6-7-100100 × 1006.8300599.589.2226222091.02
S7-7-110100 × 1006.8300599.5100.3234522951.02
S8-7-120100 × 1006.8300599.5111.3242723691.02
S9-7-140100 × 1006.8300599.5128.1255224921.02
S10-10-100100 × 10010300458.689.2230522061.04
S11-10-120100 × 10010300458.6111.3244922981.07
S12-10-140100 × 10010300458.6128.1255824991.04
S13-14-100100 × 10014.2300468.689.2286731070.92
S14-14-120100 × 10014.2300468.6111.3293331200.94
S15-14-140100 × 10014.2300468.6128.1298632740.91
S16-18-140100 × 10018.5300444.6128.1338234410.98
Note: Nc is the calculated axial bearing capacity in the present work, Nt is the test results, and the mix ratio of UHPC for experimental and numerical calculations can be found in relevant literature.
Table 2. Details of the UHPCFST specimens under the cyclic load.
SourceSpecimen NameB × h (mm)t (mm)L (mm)fy (MPa)fcu (MPa)nN
(kN)
Pc
(kN)
Pt
(kN)
Pc/Pt
Xu et al. [31]SpeUTH4250 × 25041250360152.60.2417362752881.05
SpeUTH5250 × 25051250360155.40.2417983073311.08
SpeUTH6250 × 25061250360152.20.2418543573691.03
SpeUCR12250 × 25051250360150.40.128992722941.08
SpeUCR36250 × 25051250360151.30.3626973603520.98
Cai et al. [32]S-10-0.2-1.5100 × 150108004601400.26901391430.97
S-10-0.4-1.5100 × 150108004601400.413801161101.05
S-10-0.2-2100 × 200109004601400.28841691730.98
Note: ‘n’ is the axial compression ratio, ‘N’ is the constant axial compression load, ‘Pc’ is the calculated bearing capacity in the present work, and ‘Pt’ is the averaged value of test results in the push and pull directions.
Table 3. The parameters of the columns for numerical analysis.
Specimenfy (MPa)fcu (MPa)L (mm)B × h (mm)t (mm)λwnN (kN)
S13451001000150 × 150523.1300.3823
S24601001000150 × 150523.1300.3924
S35601001000150 × 150523.1300.31010
S43451201000150 × 150523.1300.3965
S53451401000150 × 150523.1300.31053
S63451001500150 × 150534.6300.3823
S73451002000150 × 150546.2300.3823
S83451001000150 × 150523.1300.41098
S93451001000150 × 150523.1300.51372
Note: ‘λ’ is the length–diameter ratio and ‘w’ is the width–thickness ratio. Converting the cube strength of 100 MPa, 120 MPa and 140 MPa to prism strength, they are respectively 89.1 MPa, 111.3 MPa and 128.1 MPa.
Disclaimer/Publisher’s Note: The statements, opinions and data contained in all publications are solely those of the individual author(s) and contributor(s) and not of MDPI and/or the editor(s). MDPI and/or the editor(s) disclaim responsibility for any injury to people or property resulting from any ideas, methods, instructions or products referred to in the content.

