Article

Behavior of Concrete-Filled U-Shaped Steel Beam to CFSST Column Connections

1
School of Civil Engineering, Shandong Jianzhu University, Jinan 250101, China
2
Key Laboratory of Building Structural Retrofitting and Underground Space Engineering, Shandong Jianzhu University, Ministry of Education, Jinan 250101, China
3
College of Transportation and Civil Engineering, Shandong Jiaotong University, Jinan 250351, China
*
Author to whom correspondence should be addressed.
Buildings 2023, 13(2), 517; https://doi.org/10.3390/buildings13020517
Submission received: 29 December 2022 / Revised: 20 January 2023 / Accepted: 2 February 2023 / Published: 14 February 2023
(This article belongs to the Special Issue Prefabricated and Modular Steel Structures)

Abstract

:
Two new types of connection between concrete-filled U-shaped steel (CFUS) beams and concrete-filled square steel tube (CFSST) columns were presented in this study, including rebar-sleeve with internal diaphragm connection and rebar-through with internal diaphragm connection. Based on the experiments of the rebar-plate with internal diaphragm connections between CFUS beams and CFSST columns under cyclic loading, the nonlinear finite element models of the tested specimens were developed and validated by comparing them with the experimental results. The numerical results were in agreement with the experimental results in terms of failure modes, stress distribution, and load-displacement skeleton curves. Based on the FEA results, the mechanical behavior of the two new types of connection were comprehensively discussed and compared. Furthermore, this parametric study was conducted for the rebar-sleeve with internal diaphragm connection to investigate the effect of specific parameters on the capacity of the connection. The parameters included: The thickness of U-shaped steel, the ratio of longitudinal reinforcement in the concrete slab, the strength of concrete in the beam, the strength of the U-shaped steel, and the thickness of the internal diaphragm. The results indicate that the thickness of the U-shaped steel (tb), the ratio of the longitudinal reinforcement in concrete slab (ρ), and the strength of the U-shaped steel have significant effects on the loading capacity of the connection—the loading capacity increases by about 20% when tb increases from 6 mm to 8 mm, increases by about 45% when ρ increases from 1.5% to 4.8% under negative P, and increases by about 20% when the steel yield strength (fy) increases from 235 Mpa to 420 Mpa.

1. Introduction

Concrete-filled square steel tubular (CFSST) columns have been widely used in bridges and buildings due to their higher bearing capacity, higher stiffness, and better seismic performance. Furthermore, the square tube not only serves as formwork for casting concrete, but also offers convenience for beam–column connections [1].
Over the past few years, some types of profiled composite beams have been proposed and explored for better structural properties and constructability. Oehlers [2,3] and Uy and Bradford [4,5] developed composite profiled beams consisting of profiled steel sheets and in-filled concrete. They performed tests to investigate the flexural capacity and deflection of the beam. Chen et al. [6] proposed the checked steel-encased concrete beam and conducted tests to study the bending and slipping performance of the beam. Recently, the concrete-filled U-shaped steel (CFUS) beam (as shown in Figure 1) was gaining popularity in engineering practices. This beam consists of U-shaped steel, T-shaped concrete, and shear connectors, where the U-shaped steel is fabricated using cold forming or the welding of steel plates. The CFUS beam has the merits of higher strength, stiffness, and ductility compared to the steel or reinforced concrete beam. Indeed, the in-filled concrete in the U-shaped steel beam not only prevents the local buckling of the web and flange of the U-shaped steel, but also decreases the thermal effect and enhances fire resistance [7]. In addition, the U-shaped steel serves as the formwork for casting concrete, shortening the construction cost as well as the construction period.
Over the past several years, the majority of connections between CFSST columns and steel beams or CFSST columns and conventional composite beams composed of H-shaped steel and concrete slab have been developed and applied in practice engineering. Some research has been carried out to investigate the structural behavior of these connections, such as that of Parvaria et al., Liu et al., Xue et al., Fan et al., and Zhang et al. [8,9,10,11,12].
Recently, research on the connections for CFUS beams and columns has been conducted. Kim et al. [13] investigated the behavior of CFUS beam to CES (concrete-encased steel) column connections. The results indicate that the in-filled concrete was effective in preventing premature local buckling of the web and flange plates. Moreover, the specimens showed good earthquake resistance which was in accordance with the AISC 341-05 specification. Park et al. [14] tested two connections consisting of CFUS beams and RC columns under cyclic loading. All specimens exhibited higher strength, better ductility, and energy dissipation capacity. Lee et al. [15] conducted an experimental study on the seismic performance of CFUS beams to H-shaped steel column connections with band plates. This study indicated that the specimens had higher loading bearing and deformation capacity. Hwang et al. [16] investigated the seismic behavior of connections between CFUS beams and PSRC (prefabricated steel-reinforced concrete) columns. Based on the test results, the shear strength of connections was evaluated. Ding et al. [17] investigated an optimized connection consisting of U-shaped steel beams and CFSST columns. The results showed that the bearing capacity and seismic performance of the specimens were improved. Chen et al. [18] conducted an experimental test on H-shaped steel beam and square steel tubular column connections with the column thickened near the connection zone. This study indicated that the thickness of the column near the connection zone had a notable effect on the plastic deformation ability.
It appears that most of the past research has focused on the connections of CFUS beams to RC, H-shaped steel, or CES columns. The CFUS beam to CFFST column connection details are not well established and their behaviors are not understood. The lack of this research will prevent the use of the structural system composed of CFUS beams and CFFST columns in practice. Therefore, it is necessary to develop new types of CFUS beam to CFFST column connections and study their behaviors.
In this study, two new types of connections composed of CFUS beams and CFFST columns were proposed, including rebar-through with internal diaphragm connection (i.e., the RT connection) and rebar-sleeve with internal diaphragm connection (i.e., the RS connection). Based on the experimental results of three specimens of the rebar-plate with internal diaphragm connection (i.e., the RP connection) between the CFUS beam and the CFSST column under cyclic loading, the nonlinear finite element analyses of the test specimens were conducted and compared to validate the feasibility of this model in simulating the behavior of the composite connections. Furthermore, on the basis of the validated FEA model, the stress distributions of two new types of connections were comprehensively analyzed and compared to study their load-transfer mechanisms. Subsequently, a parametric study was conducted. The parameters included: the thickness of the U-shaped steel, the ratio of the longitudinal reinforcement in concrete slab, the strength of the concrete in beams, the strength of the U-shaped steel, and the thickness of the internal diaphragm.

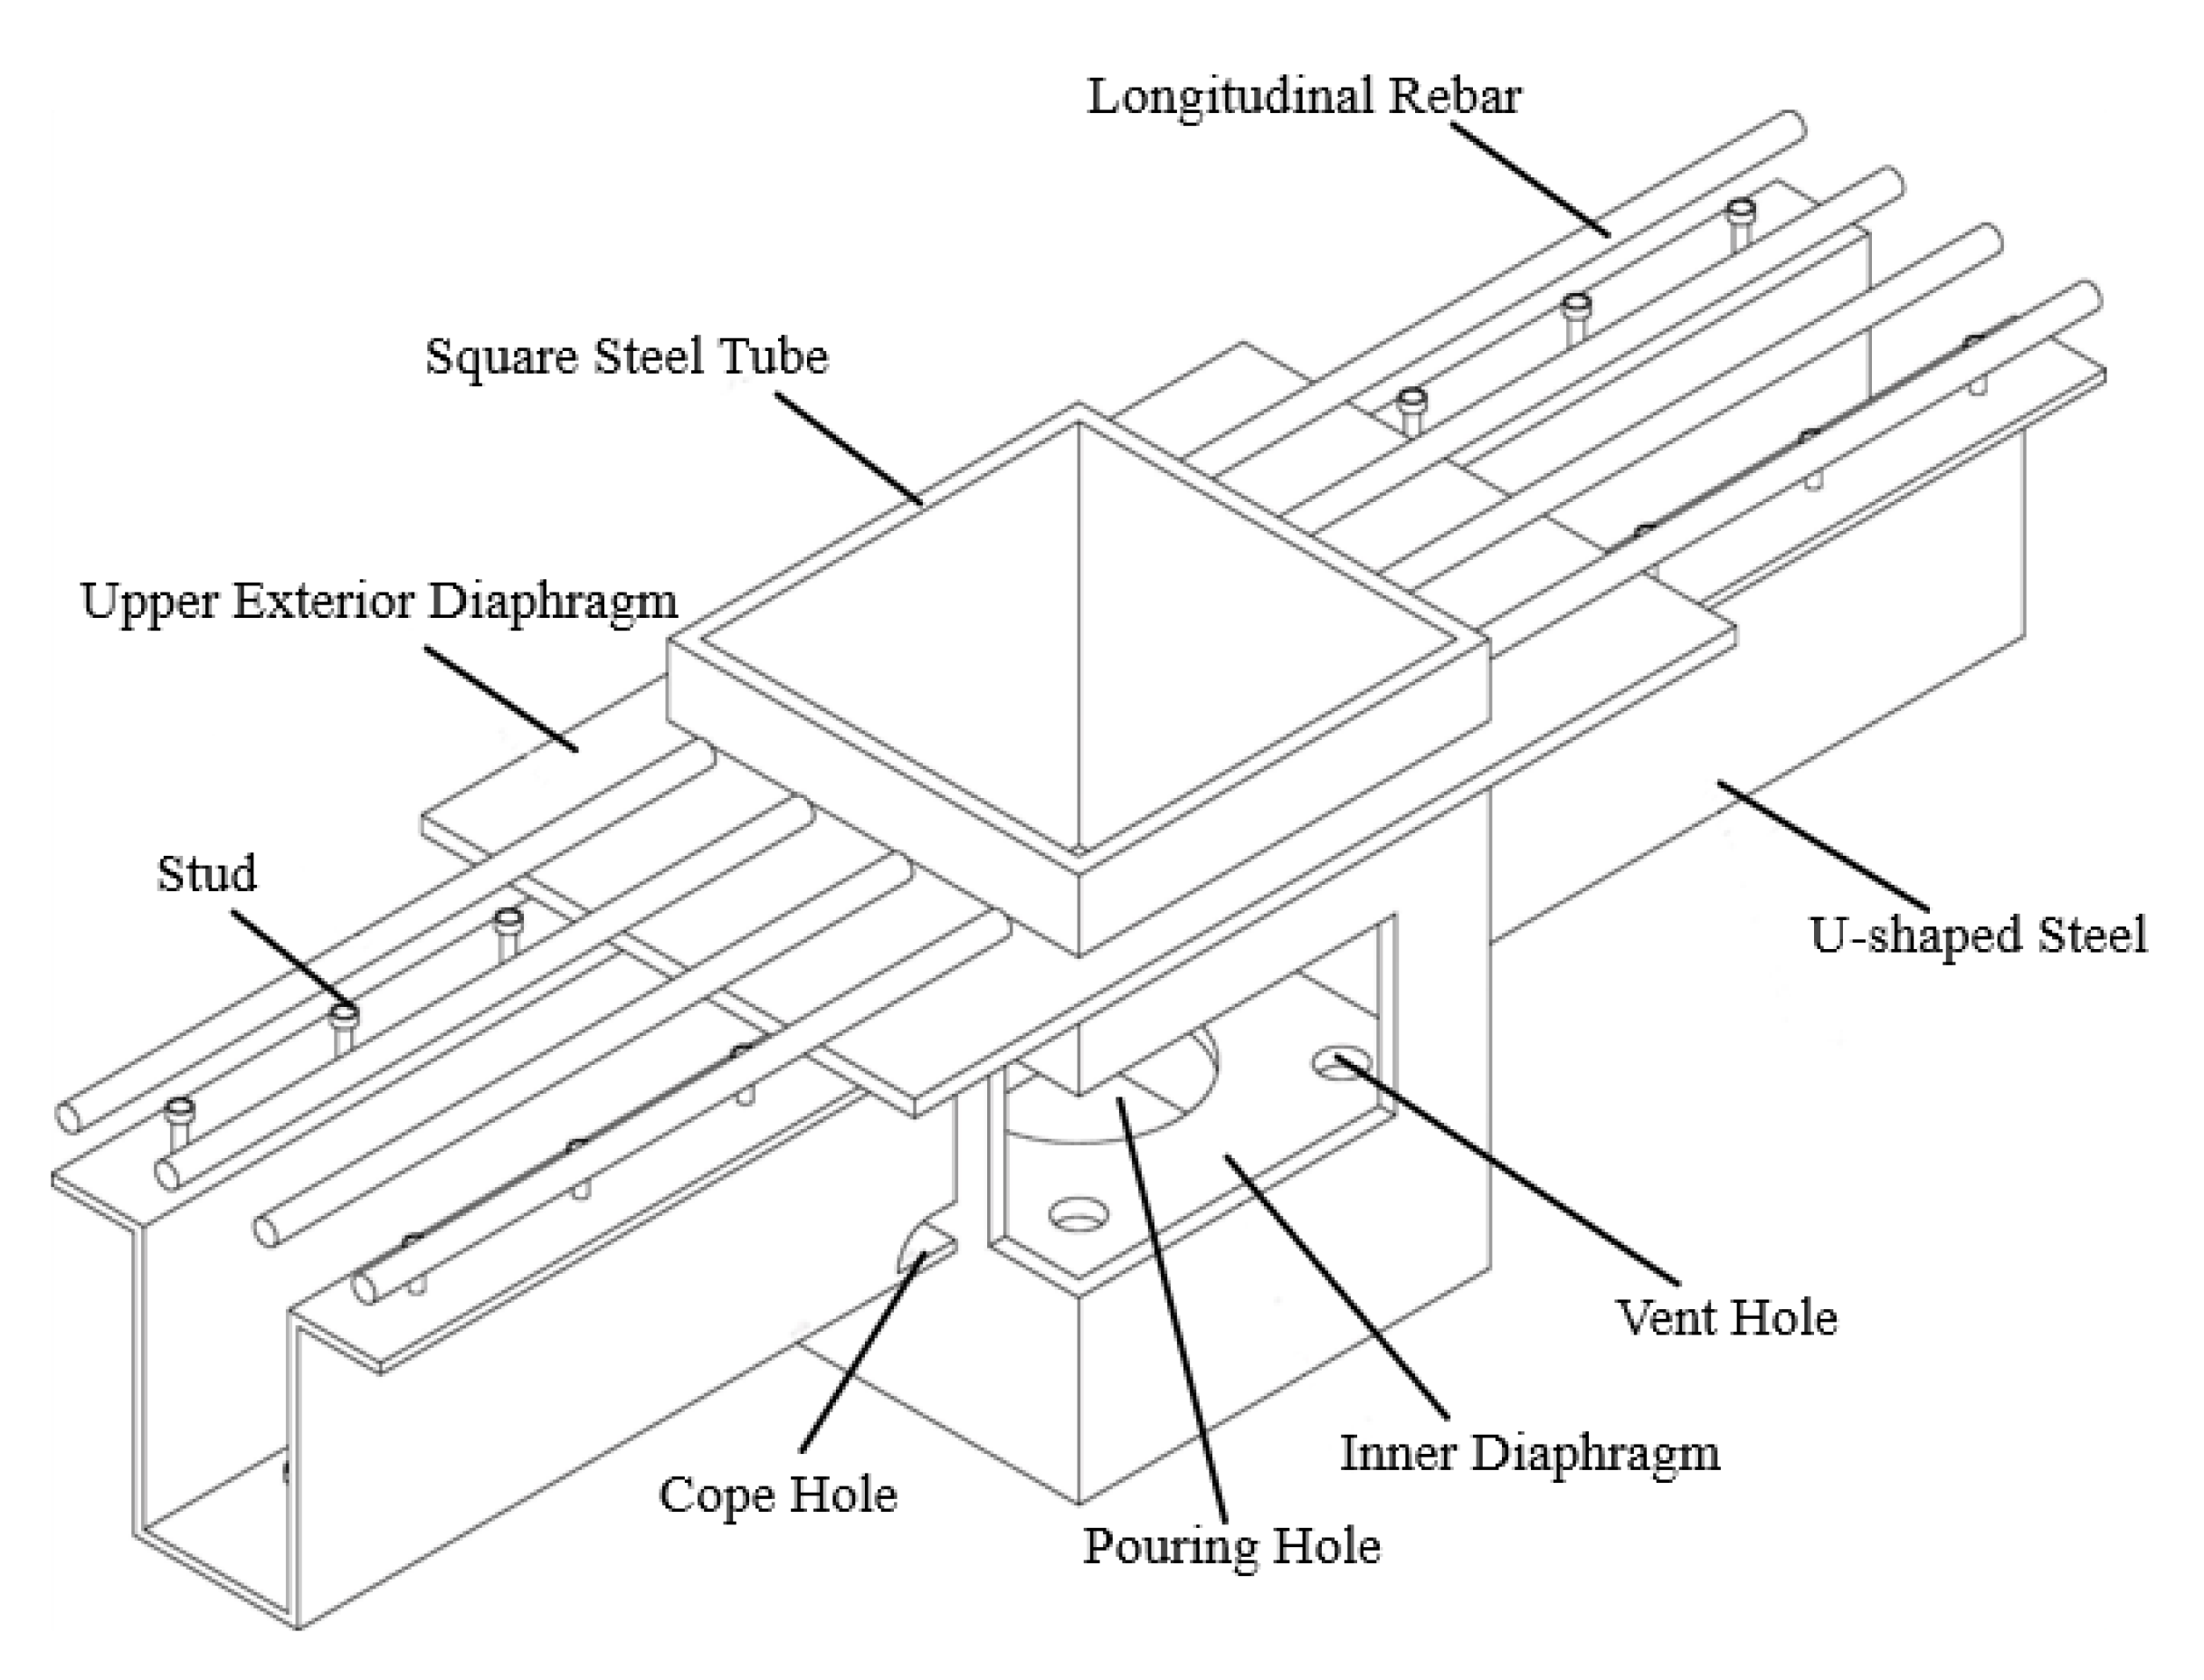
2. Connection Details

Figure 2 depicts the details of the RS connection composed of the CFUS beam and the CFSST column. In this type of connection, there are two internal diaphragms welded to the inside of the steel tube—one of them corresponding to the bottom plate of the U-shaped steel beam location, and the other one corresponding to the position of the longitudinal rebars in the beam. The bottom plate of the U-shaped beam is welded directly to the steel tube wall by a full penetration weld. The webs and the extending flanges of the U-shaped beam are attached to the wall of the steel tube by double fillet welds. The longitudinal rebars in the beam are cut off and connected to the column by sleeves that are welded to the tube wall. In order to ensure the quality of concrete pouring in the connection, the pouring holes and the vent holes should be provided in the upper and lower diaphragms. Moreover, the cope holes should be provided in the bottom plate of the U-shaped steel beam to ensure the quality of welding.
Figure 3 depicts the details of the RT connection composed of the CFUS beam and the CFSST column. In this connection, the longitudinal rebars in the beam are passed through the column through the holes drilled on the face of the tube wall, and there is no upper internal diaphragm in the tube. The connection details between the U-shaped steel beam and the steel tube wall are the same as those of the RS connection described above.

3. Experimental Program

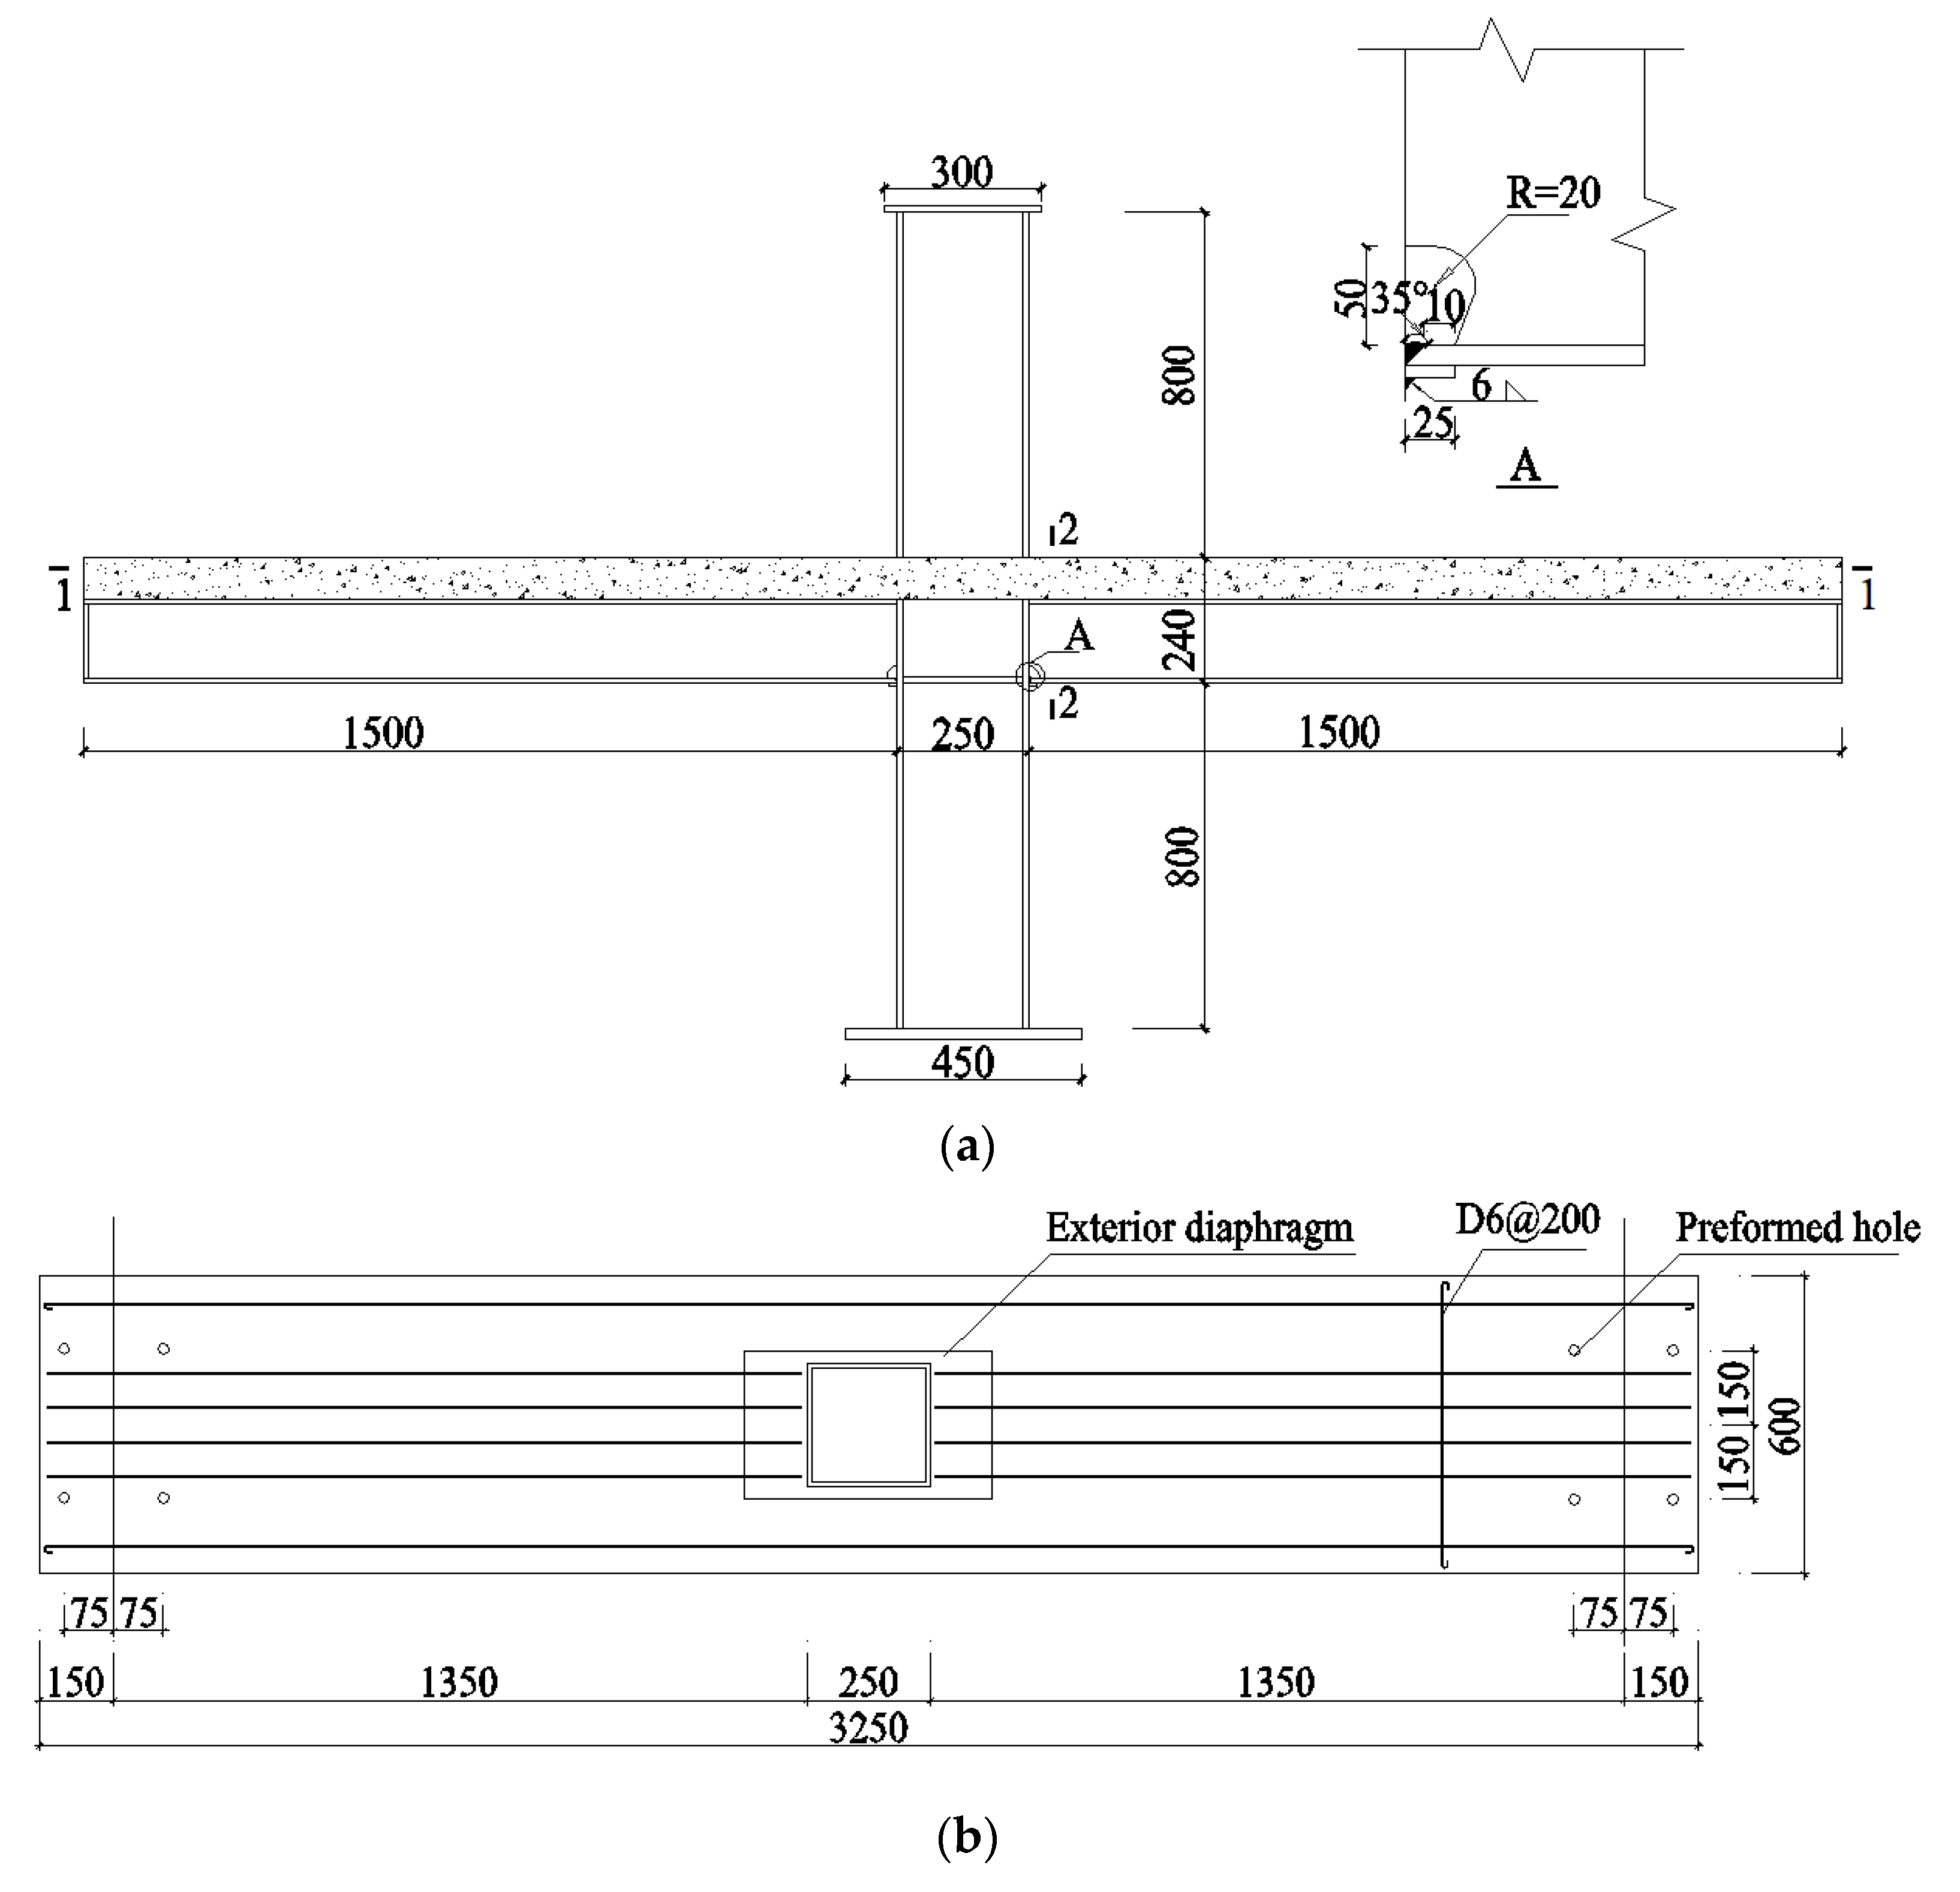
3.1. Design and Production of the Specimens

A total of three specimens of the RP connections between the CFUS beams and the CFSST columns were designed and produced, consisting of C-1, C-2, and C-3. Figure 4 depicts the details of the RP connection. In this type of connection, the longitudinal rebars in each beam were cut off and welded to the upper exterior diaphragm plate set around the steel tube column, and the connection details between the U-shaped steel beam and the steel tube wall were the same as those of an RS or RT connection. For the specimens, the main design variables were the thickness of the square steel tube and the concrete strength in the beam. All the specimens were cruciform-shaped specimens and were approximately 1/2 scale relative to the element sizes needed for the prototype frame. Table 1 shows the dimensions and parameters of the specimens. The bc × bc × tc of the steel tube in Table 1 represents the section size of the tube, where bc is the width of the column and tc is the thickness of the tube. The hw × b × b1 × tb in Table 1 represents the section size of the U-shaped steel beam, where hw is the height of the U-shaped steel beam, b is the width of the bottom plate, b1 is the width of extending flanges, and tb is the thickness of the U-shaped steel beam. Figure 5 shows the connection details and the dimensions of the specimens.
The cold-formed square steel tube was used for the column. The U-shaped steel beam was fabricated using the cold-forming steel plate. Q235B steel with the nominal strength of 235 Mpa was used for all of the steel elements in the three specimens. Concrete with the nominal compressive cubic strength of 40 Mpa was used in the column, and concrete with the nominal compressive cubic strength of 30 Mpa (C-1, C-2) and 20 Mpa (C-3) were used in the beam and slab. Hot-rolled ribbed rebar (HRB) with a nominal yield strength of 335 Mpa was used as the longitudinal rebars in the concrete slab, and hot-rolled plain rebar (HPB) with a nominal yield strength of 235 Mpa was used as the transverse distribution rebar in the slab. In order to achieve full strength and stiffness of the CFUS beam, the shear studs with a diameter of 13 mm were welded onto the bottom plate and the top extending flanges of the U-shaped steel beam. A full penetration weld was used to connect the bottom plate of the U-shaped steel and the steel tube wall, where the welding pad was used during welding and removed after welding to improve the quality of welds. All of the steel members were fabricated in the steel factory, and the subsequent works were carried out at the structural laboratory of Shandong Jianzhu University, such as binding and welding the rebars, and casting and curing the concrete.
Material properties of steel and concrete used for the specimens are given in Table 2 and Table 3.

3.2. Test Setup and Loading Procedure

Figure 6a shows a schematic of the test setup. Axial loads were applied to the top of the column to simulate gravity loading. The two ends of the beam were subjected to equal and opposite vertical cyclic loads to simulate the seismic loading. The method of loading cycle was determined in accordance with the requirements of JGJ 101–96 [19]. The column’s bottom end was fastened to the spherical pin support connected with the ground, which was allowed to rotate in the plane of loading but was constrained from movement. The crossing braces were provided at the top of the column to prevent lateral moving of the column. Meanwhile, the pin joints were used at the connection between the braces and the column wall to allow the top end of the column to rotate. The vertical axial load was applied using a hydraulic jack with 2000 kN capacity. The hydraulic jack was attached to a short column which was connected to the reaction frame. The vertical reversed cyclic loads at the beam ends were applied by the MTS actuators attached to the reaction frame with a 500 kN capacity. Figure 6b shows the loading site.
The displacement-control method was used in the loading procedure. The axial load was first imposed on the top of the column until it reached the value of the axial load ratio—as shown in Table 1—and then remained constant throughout the whole test. The vertical cyclic loads were then applied at the ends of the beams until failure. The loading cycle was repeated only once at each control point of 0.25Δy, 0.5Δy, and 0.75Δy, and then repeated three times at each control point of Δy, 2Δy, 3Δy, 4Δy, etc., where Δy represents the displacement of the beam end corresponding to the yield load estimated from the finite element analysis. The test was terminated in any of the following cases: (1) The load capacity dropped to less than 85% of the peak load. (2) The concrete of the slab adjacent to the column was crushed. (3) The bottom plate of the U-shaped steel beam in the heat affect zone fractured completely.

3.3. Experimental Results

All of the specimens exhibited the same behavior in terms of failure mode. When the maximum load was reached, the fracture occurred in the bottom plate and the webs of the U-shaped steel adjacent to the weld connecting between the steel tube and the bottom plate of the beam, and the was concrete crushed in the compression slab near the tube (as shown in following Figures). For all of the specimens, the deformation of the column in the connection zone was small, and no slip between the T-shaped concrete and the U-shaped steel was found up to the point of failure in all the specimens.
The P–Δ hysteretic curves of three specimens are given in Figure 7, where P is the load imposed onto the end of the beam and Δ is the corresponding displacement. The positive load in Figure 7 means that the bottom plate of the composite beam is in tension and the concrete slab is in compression.
It is indicated that the hysteretic curves of all the specimens were plump and had a shuttle shape without significant pinching, which exhibited better energy dissipation, higher deformation, and better ductility. In addition, the hysteretic curves of all the specimens were obviously asymmetrical due to the effect of the composition of the concrete slab of the beam, where the areas of hysteretic loops under positive moment were larger than those under negative moment.

4. Finite Element Model

4.1. Material Modeling

The concrete damage plasticity model provided by ABAQUS is applied to simulate the concrete where the stress–strain relationship can be selected according to whether the concrete is confined. The stress–strain constitutive model of confined concrete proposed by Han et al. [20] is used for in-filled concrete in the square steel tube, and the stress–strain relationship presented by GB50010-2010 [21] is adapted to simulate the normal concrete for the composite beam, as shown in Figure 8 (σc = stress of concrete and εc = strain of concrete). In the concrete constitution, the damage variables of concrete are defined according to the theory proposed by Du et al. [22]. Five parameters are used to describe the concrete yield function and plastic flow procedure, i.e., the dilation angle (ψ) is 30°, the eccentricity (ε) is 0.1, the ratio of initial equiaxial compressive yield stress to initial uniaxial compressive yield stress (fb0/fc0) is 1.16, the ratio of the second stress invariant on the tensile meridian (K) is 0.6667, and the viscosity parameter (μ) is 0.005.
The bilinear stress–strain curve is used to model the steel and reinforcement. This curve is composed of two segments. The first segment is the elastic segment with the yield strength (fy) and the modulus of elasticity (Es) as shown in Table 2. The second part is the elastoplastic part, where the hardening modulus is usually taken to be 0.01 of the elastic modulus (Es0 = 0.01 Es). The Poisson’s ratio is set to 0.3.

4.2. Finite Element Type and Mesh

The results of the FEA with various element types show that the three-dimensional eight nodes solid element with reduced integration (C3D8R) exhibits the most effective results when modeling for the concrete, steel tube, U-shaped steel beam, diaphragm, and reinforcement. Therefore, the C3D8R element is used for all components in the connection. In order to obtain a more regular element shape, the structured meshing technique is applied, and different mesh densities are adopted for different parts—the grid nodes are relatively dense near the panel zone, while the grid can be relatively sparse away from the panel zone. The three-layer mesh along the thickness of the steel plate is suggested by Ozkilic [23]. However, the results of the FEA with different layers of mesh show that these have a light effect on the numerical results for connections composed of CFUS beams and CFSST columns in our studies. In addition, multilayers of mesh result in the non-convergence of calculation. Therefore, one layer is meshed along the thickness of the steel plate in the analysis.
Due to the fact that there is no relative movement between the steel tube and the concrete inside it during the whole loading cycle, the interaction between them is simulated by adopting the ‘TIE’ command. Due to the same reason, the ‘TIE’ is also selected to model the interaction between the U-shaped steel and the concrete inside the beam, as well as the rebars and the steel members (external plates of RP connection and sleeves of RS connection). The contact between the steel tube wall and the concrete at the end of the beam is set up with the ‘hard’ contact in the normal direction and the ‘Coulomb friction model’ contact (the friction coefficient of 0.25) in the tangential direction. In addition, for the three types of connections, the rebar elements and concrete elements are all connected by adopting the embedded element technique.

4.3. Boundary and Loading Conditions

A rigid block is set on the bottom of the column to model a rigid base. All the degrees of freedom at the middle line of the bottom block except the rotation about the x axis are constrained to simulate hinge support. The displacements in the x and y directions and the rotations about the y and z axes of the middle line at the top of the column are restrained. In order to prevent the lateral flexural-torsional buckling of a beam, the displacements out of the plane at the beam ends are constrained.
In the FE analysis, the loading procedure is divided into two stages. In the first stage, the degrees of freedom in the z direction for all of the nodes on the top of the column are coupled, and then an axial concentrated load is imposed on the principal node and kept constant during the whole procedure. In the second stage, the vertical degrees of freedom for the nodes at the beam ends are coupled, and then the cyclic loads are applied to the principal node in the form of displacement. For all the connections, the displacements applied at the beam ends are the same. Figure 9 shows the boundary conditions scheme and the finite element models of three types of connections.

5. Numerical Results

5.1. Verification of FEA Model
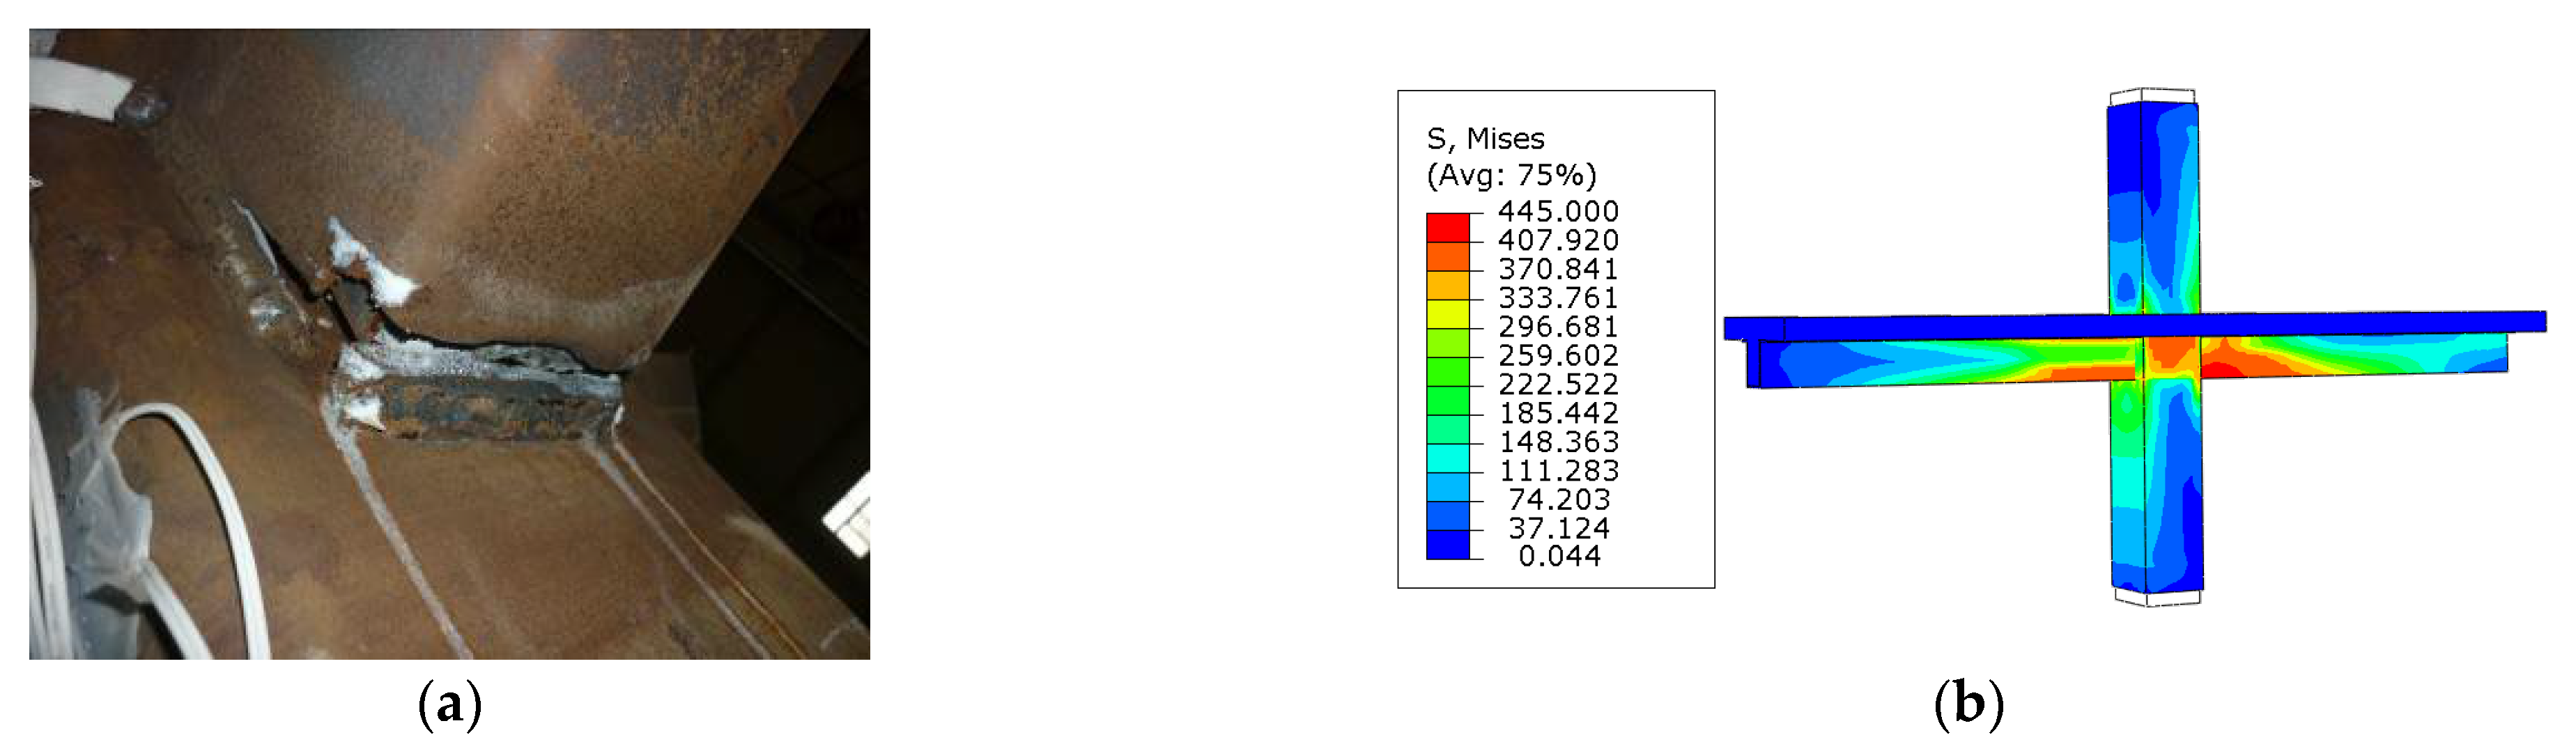
5.1.1. Failure Mode

In order to verify the feasibility and accuracy of the developed finite element model in Section 4, the finite element analyses under cyclic load of the three tested specimens are conducted and the numerical results are compared to those from the experiments.
Due to the fact that the failure mode of each specimen is similar, only the failure mode of specimen C-1 is used to compare with the experimental results. The stress contour is used to simulate the fracture between the U-shaped steel beam and the tube wall in the FE model. The PEEQ contour is used to simulate the crushing of concrete in the FE model. Figure 10 shows the comparison of tested and simulated failure modes of specimen C-1.
From Figure 10, it can be seen that the stress in the region adjacent to the connection between the bottom plate of the U-shaped steel beam and the tube wall has reached the ultimate strength of steel, which indicates that the fracture occurred here. The red part in Figure 10d is the most severe concrete damage area, which means that the concrete slab near the column in this area is crushed. Meanwhile, the stress in the region far away from the connection zone is much smaller than the corresponding yield strength of the material. Therefore, the numerical results are consistent with the experimental results.

5.1.2. Load Versus Displacement Curves

The comparison between the skeleton curves obtained from the finite element analysis and the experimental results for the specimens are shown in Figure 11.
It can be found that the load-displacement curves obtained by the numerical simulations are in reasonable agreement with those obtained by the experiments. However, the loading capacity and the stiffness of the connection from the finite element analysis are higher than the experimental results. There are some reasons for this: (1) The initial geometrical imperfection and the initial residual stress are neglected in the finite element model. (2) The boundary and loading conditions applied in the FEA model are more ideal than when compared with the test setup. (3) The material constitutive relationship used in the FE analysis is a little different from the actual one used. (4) The damage degree of concrete based on the damage variables in the finite element model is less than that in the test. (5) For the test, the fracture in the bottom plate and the webs of the U-shaped steel adjacent to the welding line led to unloading—it is difficult to simulate this fracture in the numerical models; therefore, there is no unloading branch of the skeleton curves in the numerical analysis. Although the factors described above cause the differences between the numerical results and the experimental results, these differences are in the allowable range. In conclusion, the numerical results are in reasonable agreement with the experimental results in terms of the failure modes and the skeleton curves. Therefore, FE analysis is dependable to conduct further study. In addition, on the basis of the simulation method of the validated FEA model of RP connection, the finite element models of the RS and RT connections are dependable to conduct the stress analysis and parametric analysis because the material modeling, the element type and mesh, the interaction, as well as the boundary and loading condition of the RS and RT connections are identical to those of RP connections—in spite of the different connection details of the longitudinal rebars in beams.

5.2. Stress Analysis

The stress distributions of the various components of the RS connection and the RT connection are comprehensively investigated and compared to identify the mechanical characteristics. The geometry and material properties of both specimens are similar to those of the experimental specimen C-1.

5.2.1. Stress Analysis of the End of Bottom Plate for U-Shaped Steel Beam and the Internal Diaphragm

The von Mises stress contours of the end of the bottom plate of the U-shaped steel beam and the internal diaphragm at the yield state for the RS connection and the RT connection are shown in Figure 12.
It can be seen that the stress in the compressive portion (the left side) is much less than that in the tensile portion (the right side) due to the effect of in-filled concrete in the beam and column for each connection. Furthermore, the stress in most regions of the internal diaphragm is much smaller except that the stress in the tensile region adjacent to the line connecting the center of the pouring hole to the center of the vent hole approaches or exceeds the yield strength of steel.

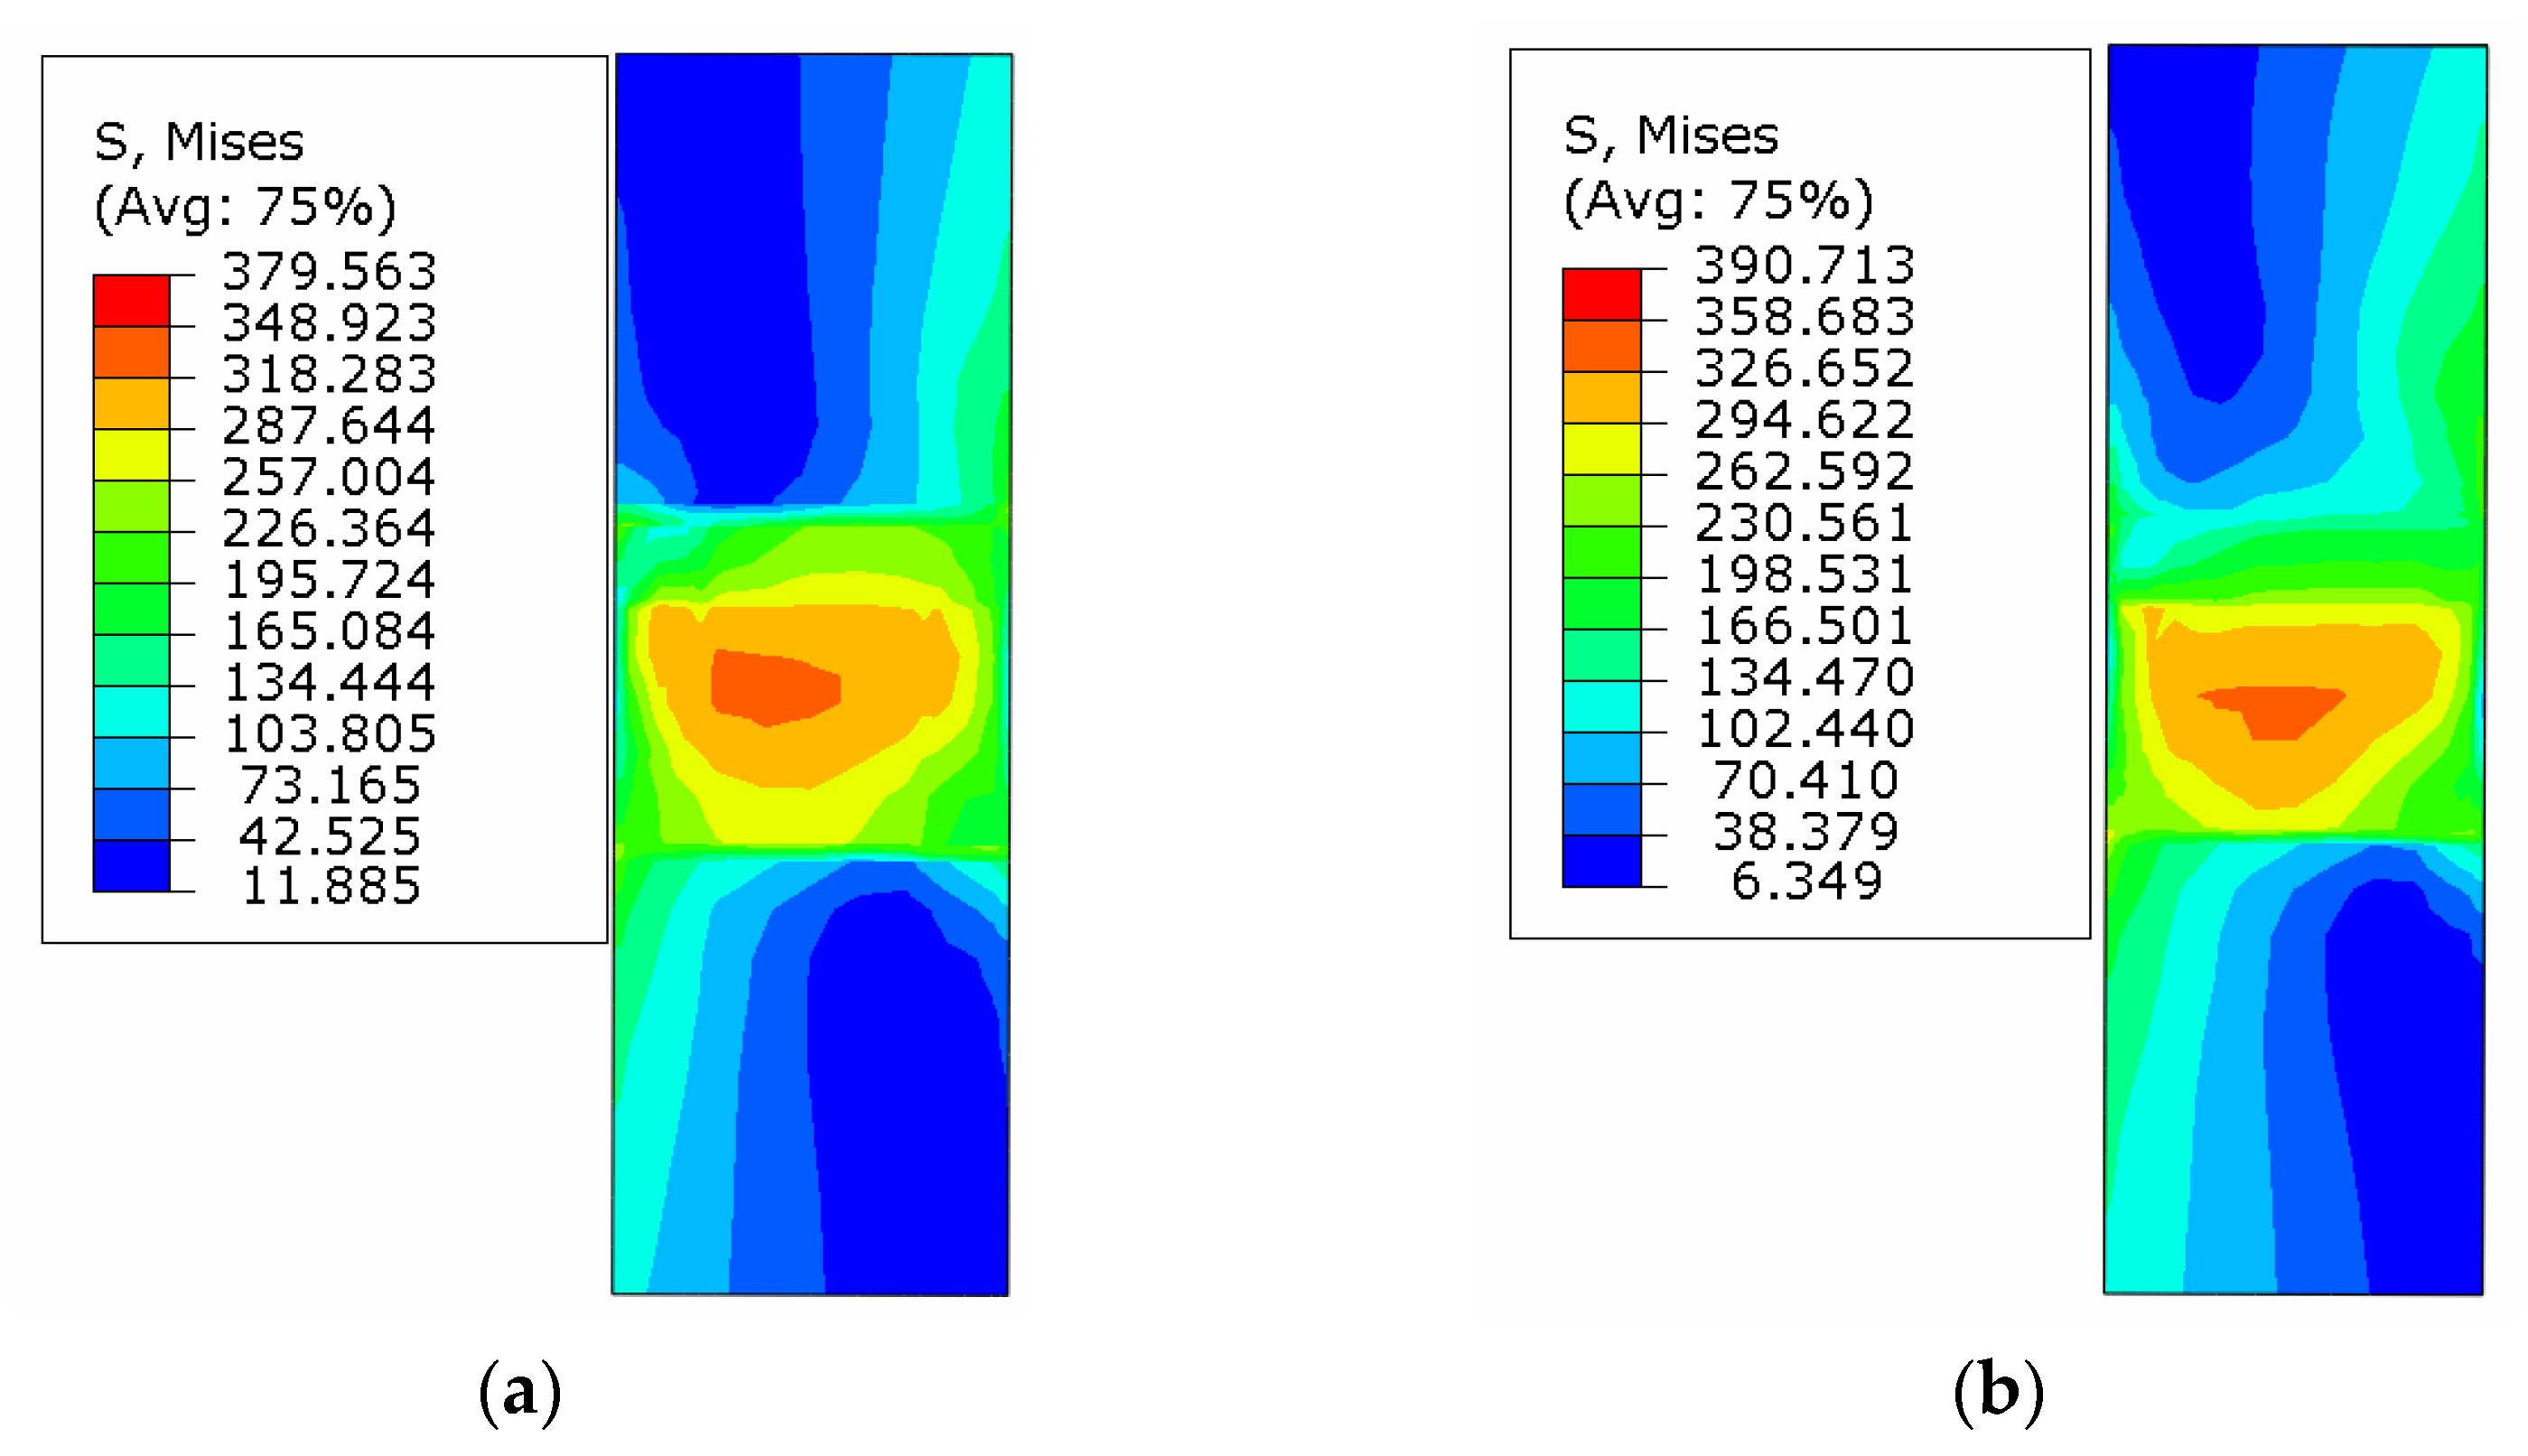
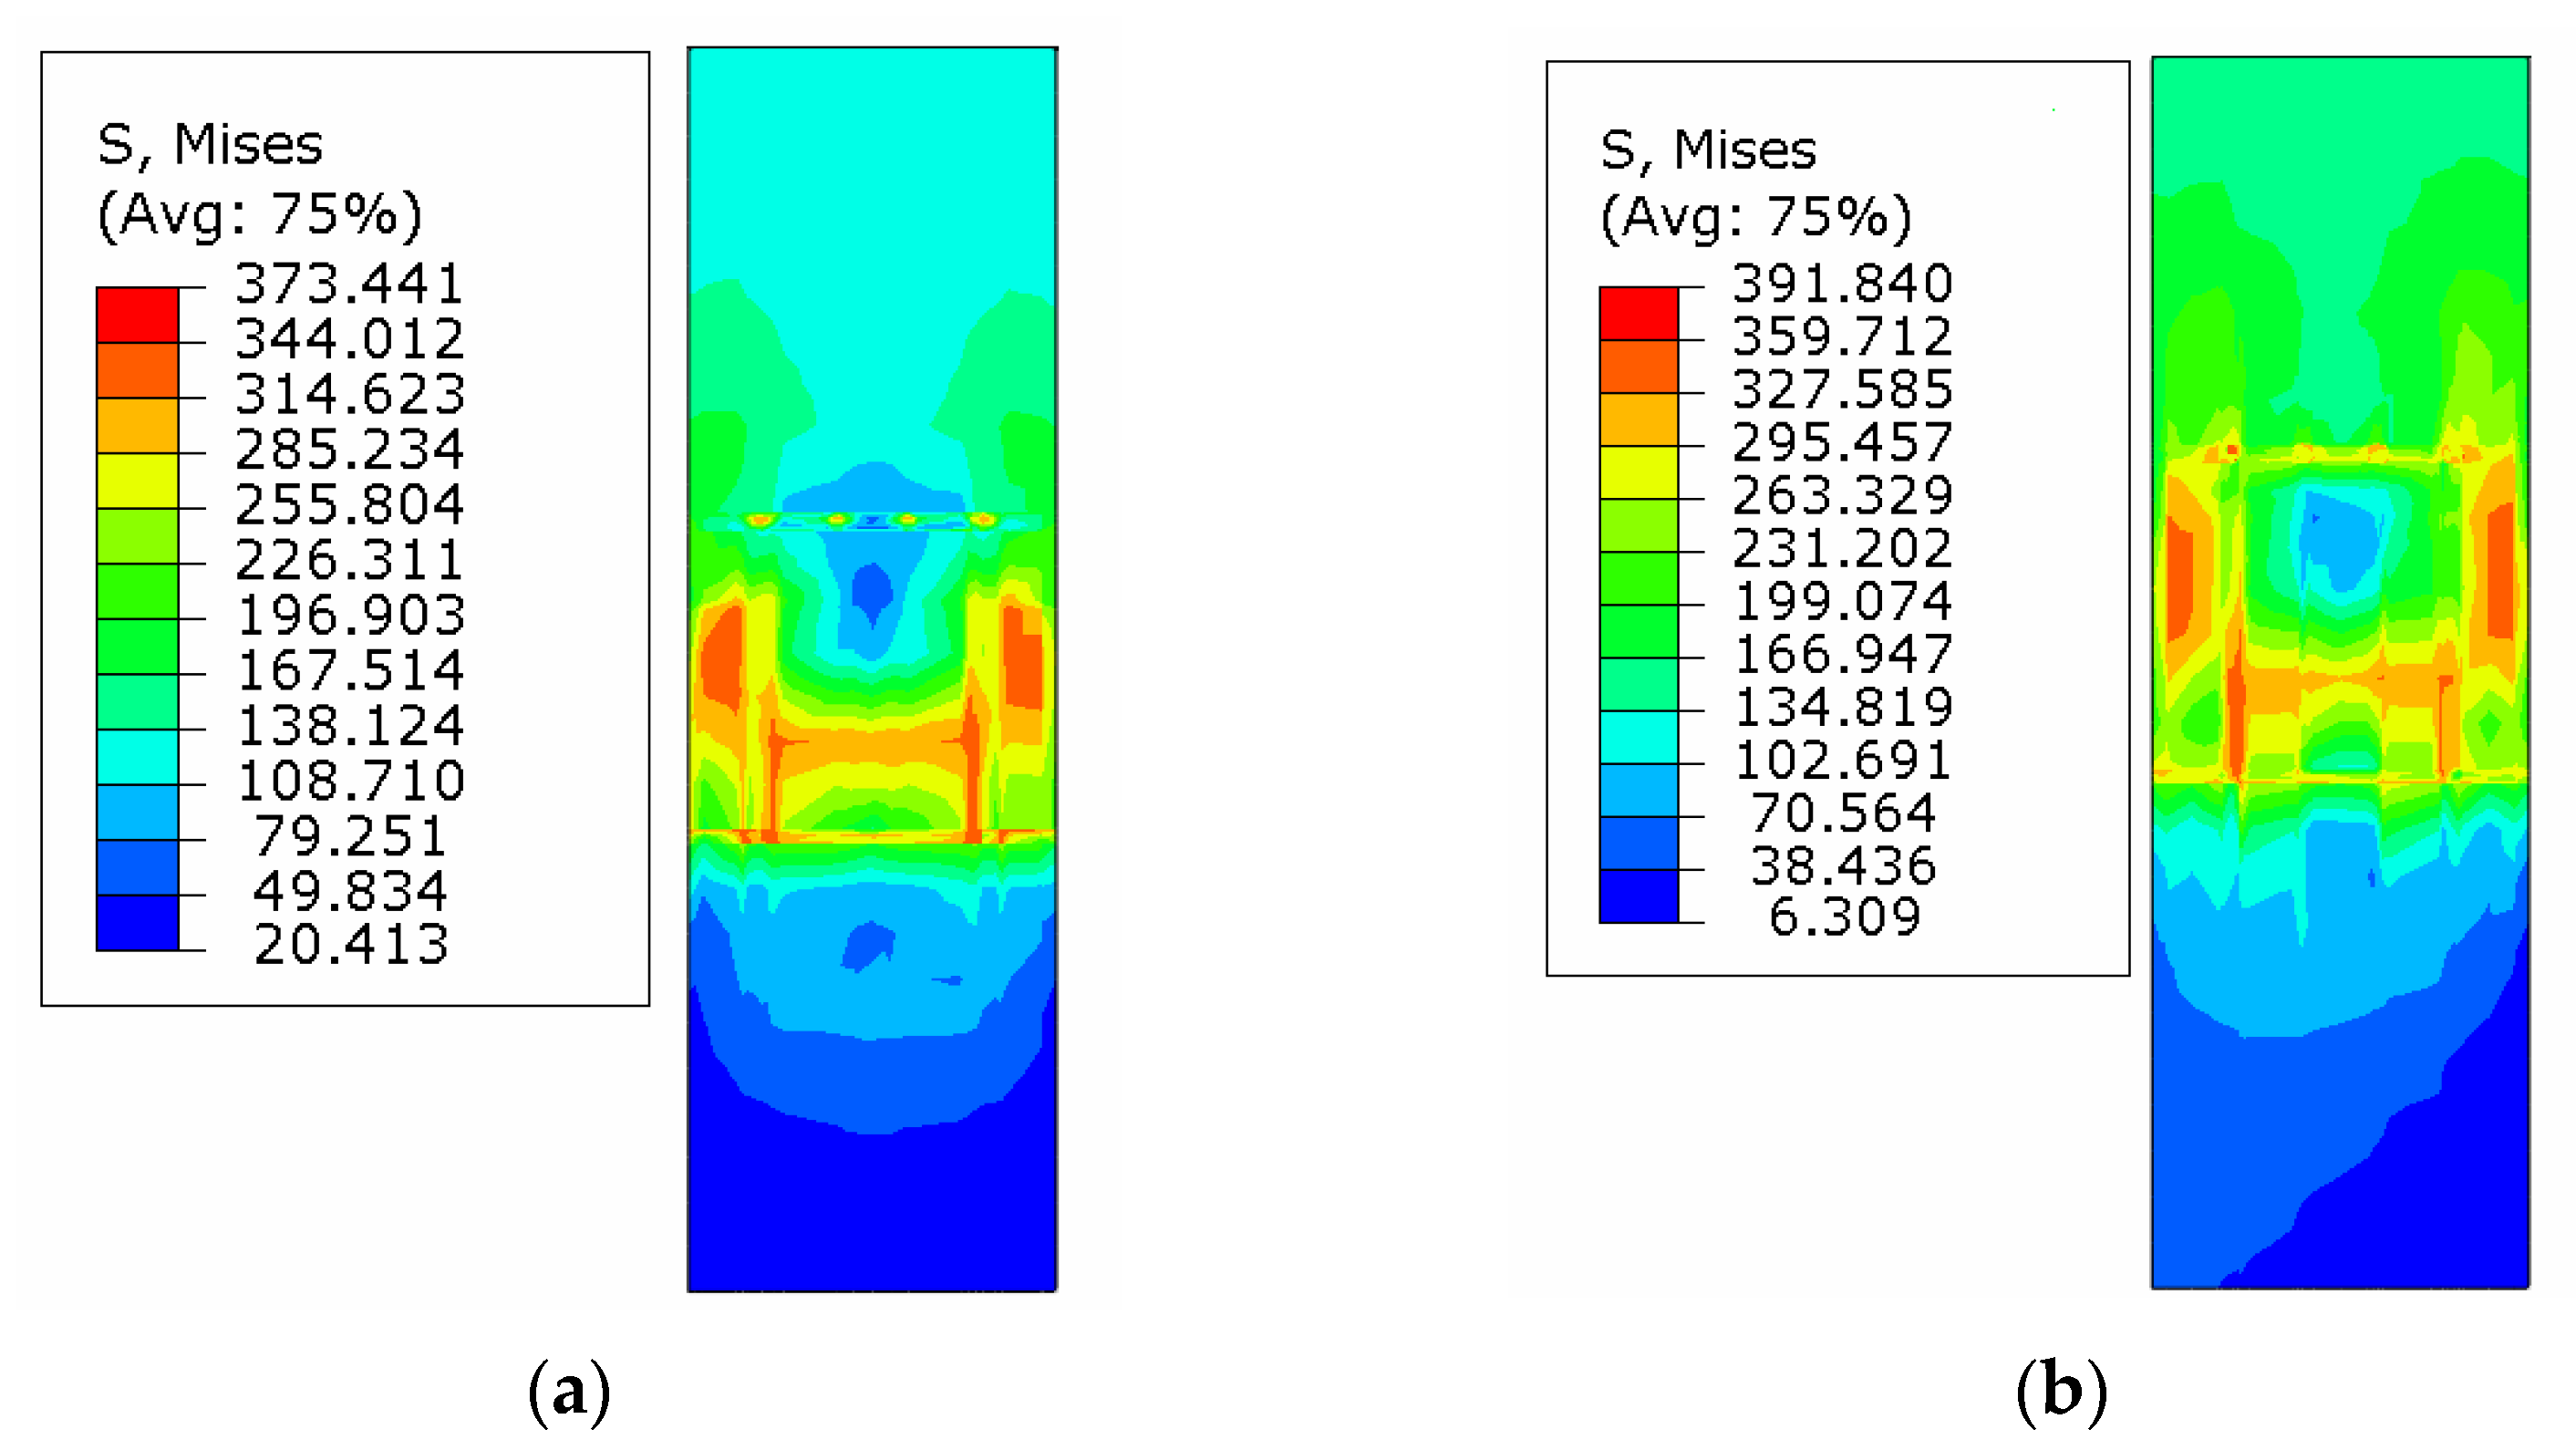
5.2.2. Stress Analysis of Steel Tube in the Connection Zone

Figure 13 shows the von Mises stress contours in the webs of the steel tube in the connection zone at the yield state for the RS connection and the RT connection.
It can be seen that the stress is the largest in the center part of the panel zone and decreases gradually from the center to the outside for each connection. Compared with the RT connection, the stress distribution in the webs of the steel tube adjacent to the upper internal diaphragm of the RS connection is relatively uniform and the stress level in this region is lower. This is mainly due to the fact that the upper internal diaphragm in the RS connection provides support for the column, which limits the out-of-plane deformation of the column webs, resulting in the relatively uniform stress distribution and the decrement of stress in this region.
Figure 14 and Figure 15 depict the von Mises stress contours of the left and right flange of the steel tube in the connection zone at the yield state. The upper part of the left flange given in Figure 14 is in tension and the lower part is in compression. This is because the left flange is connected with the composite beam under a negative moment. The right flange given in Figure 15 is connected with the beam under a positive moment. Consequently, the upper part of the flange is in compression and the lower part is in tension.
From Figure 14 and Figure 15, it can be found that:
  • For each specimen, the stress in the compressive region of the steel tube flange of the connection zone is smaller than that in the tensile region, due to the fact that the concrete in the beam participates in transferring the compressive force and thus increases the loading area of the flange and reduces the stress level in the compressive region. In addition, the concrete in the steel tube is closely compacted under compression, preventing the deformation of the tube wall, which contributes to reduced stress in this region. For the tensile region, however, the tensile forces are mainly transferred to the flange of the steel tube through the steel plate or rebar in the composite beam, resulting in higher stress.
  • For the RS connection, the stress in the left and right flanges of the tube adjacent to the concrete slab is smaller than that of the RT connection due to the fact that there are some holes on the surface of the tube to let the longitudinal rebars pass through, resulting in stress concentration in this region. Furthermore, the upper interior diaphragm of the RS connection can not only transfer the force in the longitudinal rebars but also provide extra support for the steel tube, which constrains the deformation of the column flange and hence reduces the stress in this region.

5.2.3. Stress Analysis of Concrete in Connection Zone

Figure 16 depicts the principal compressive stress σ3 contours of the concrete in the connection zone for the RS connection and the RT connection at the yield state.
It can be seen that the inclined concrete compression strut has been formed along the diagonal line of the connection zone for each connection, and the principal compressive stress in the inclined concrete strut increases gradually from the center to the ends. Compared to the RT connection, the inclined concrete compression strut of the RS connection exhibits better behavior with a regular shape and higher stress level. This is mainly due to the fact that the upper and bottom internal diaphragm of the RS connection formed a confined space within the steel tube which gives a strong restraining effect on its internal concrete, and thus increases the main compressive stress of the concrete and develops the concrete material properties.

5.2.4. Stress Analysis of Rebars

Figure 17 shows the longitudinal stress distribution of rebars in the concrete slab for the RS connection and the RT connection at the yield state.
It can be seen that the maximum stress in both the continuous rebars and cutting rebars of the composite beam occurred near the tube wall, and the stress decreased as it moved away from the tube wall. For both specimens, the stress in the compressive region of the longitudinal rebars is significantly less than that in the tensile region. This indicates that the horizontal forces in the tensile slab are mainly resisted by the longitudinal rebars due to the lower concrete tensile strength, whereas the horizontal forces in the compressive slab are resisted by the longitudinal rebars and concrete together.

5.2.5. Stress Development of Steel Components

The stress development of the steel components in each connection is similar. Therefore, the RS connection is taken as an example to discuss the stress development of the steel components during the whole loading procedure. Figure 18 shows the von Mises stress contours of the RS connection under different states, including axial load on the column state, the yield state, and the ultimate state.
When there is only the axial load imposed on the ends of the column, the stress is small and uniform in most regions of the steel tube, and the initial stress appears in the steel beam adjacent to the steel tube. The maximum stress is located in the region near the junction between the tensile bottom plate of the steel beam and the column after the vertical loads are applied at the beam ends. Consequently, the stress in this region reaches the yield strength of steel with the increase of the vertical loads. As the specimen is at the ultimate state, the stress in the bottom plate of the U-shaped steel beam near the connection zone has significantly exceeded the yield strength, especially for the tensile plate. However, the stress in the components that are far away from the connection zone is much smaller than the yield strength of the corresponding material.

6. Parametric Analysis

On the basis of the RS connection, parametric studies are conducted to investigate the influences of some parameters on the behavior of the connection between CFUS beams and CFSST columns. These parameters include: The thickness of the U-shaped steel, the ratio of the longitudinal rebar in the concrete slab, the strength of the concrete in the beam, the strength of the U-shaped steel, and the thickness of the internal diaphragm. All the specimens are designed to satisfy the seismic principle of ‘strong column–weak beam and strong connection–weak members’. This is accomplished by limiting the beam-to-column linear stiffness ratio to less than 0.6, and the beam-to-column flexural capacity ratio to no more than 0.8 [24,25], resulting in failing at the beam ends for the connections.

6.1. Effects of Thickness of U-Shaped Steel

The comparison of load-displacement curves with different thicknesses of the U-shaped steel are shown in Figure 19. It can be seen that the loading capacity of the connection increases obviously with the increases in the thickness of the U-shaped steel under both positive and negative P, and that the increase of the loading capacity under positive P is bigger than that under negative P. In addition, the increased amplitude of loading capacity for the connection decreases with the increases of tb. The loading capacity increases by about 20% when tb increases from 6 mm to 8 mm, while it increases only about 10% with tb from 10 mm to 12 mm. It can be concluded that the loading capacity of the connection is substantially improved when tb is increased within a certain range.

6.2. Effects of Ratio of Longitudinal Rebar in Concrete Slab

The comparisons of load-displacement curves with different ratios of the longitudinal rebars (ρ) are shown in Figure 20. It can be seen that the ratio of the longitudinal rebars has a notable effect on the loading capacity of the connection—especially under negative P. The loading capacity is increased by about 45% when ρ is increased from 1.5% to 4.8% under negative P. However, the loading capacity only increased by about 15% when ρ increased from 1.5% to 4.8% under positive P.

6.3. Effects of Strength of Concrete in Beam

The comparisons of load-displacement curves with different strengths of concrete in the beam are shown in Figure 21. The strength of concrete in the beam has little effect on the loading capacity of the connection. The loading capacity under positive P is increased by about 10% when the concrete strength (fcu) increased from 30 MPa to 60 MPa. However, the loading capacity under negative P faintly increases.

6.4. Effects of Strength of U-Shaped Steel

The comparisons of load-displacement curves with different strengths of the U-shaped steel are shown in Figure 22. The strength of the U-shaped steel has a definite effect on the loading capacity of the connection under both positive and negative P. The loading capacity is increased by about 20% when the steel yield strength (fy) increased from 235 Mpa to 420 Mpa.

6.5. Effects of Thickness of Internal Diaphragm

The comparisons of load-displacement curves with different thicknesses of the internal diaphragm (h) are shown in Figure 23. It can be seen that the thickness of the internal diaphragm has a slight influence on the loading capacity of the connection under both positive and negative P. The loading capacity hardly increases with an increase in h. This is due to all of the specimens meeting the seismic design principle of strong columns and weak beams, strong junctions and weak components. Therefore, the loading capacity of the connection is mainly dependent on that of the beam ends for the specimens that failed at the beam end.

7. Conclusions

This paper presents two new types of connection details between CFUS beams and CFFST columns. The nonlinear FEA of connections is conducted using the validated model by the experimental results. The stress distribution of two new types of connections is discussed. Furthermore, the parametric studies are conducted to investigate the effects of some parameters, including the thickness of the U-shaped steel, the ratio of the longitudinal rebar in the concrete slab, the strength of concrete in the beam, the strength of the U-shaped steel, and the thickness of the internal diaphragm on the performances of the connections. The conclusions can be summarized as follows:
  • The numerical results are in agreement with the experimental results, which indicate that the developed finite element model could be used to analyze the behavior of the composite connection with proper precision.
  • The stress analysis shows that the stress in the tensile bottom plate of the U-shaped steel beam near the connection zone has reached the ultimate strength of the steel, while the stress in the components that are far away from the panel zone is much smaller when the RS and RT connection fail. Furthermore, for the RS connection, the stress comparison shows that not only the stress distribution in the flanges and webs of the steel tube near the junction is more uniform, but also the inclined concrete compression struts in the panel zone exhibit better behavior due to the upper internal diaphragm.
  • The parametric analysis indicates that the thickness of the U-shaped steel, the ratio of the longitudinal reinforcement in the concrete slab, and the strength of the U-shaped steel have a notable effect on the loading capacity of the connection, while the strength of concrete in the beam and the thickness of the internal diaphragm has a lighter effect on that.
  • Based on the parameter analysis results of the connections and construction practicability, the bearing capacity of connections can be improved by increasing the ratio of the longitudinal reinforcement in the concrete slab and the thickness of the U-shaped steel in practical engineering when the structural requirements of reinforcement and the design conditions of strong column and weak beam are met.

Author Contributions

Conceptualization, methodology, resources, and funding acquisition, Y.L.; formal analysis and investigation, Z.Z. and X.G.; data curation, Z.Z.; writing—original draft preparation, Y.L. and Z.Z.; writing—review and editing, S.Q. and Z.W. All authors have read and agreed to the published version of the manuscript.

Funding

This research was funded by the National Key Research and Development Program (SQ2020YFF0426523), the Research and Innovation Team Supported by the Ministry of Education (IRT13075), the Science and Technology Project of the Ministry of Housing and Urban-Rural Development (2019-k-073), and the Doctoral Foundation of Shandong Jianzhu University (Z0320).

Acknowledgments

All of the specimens were fabricated by Jincheng Steel Structure Company in the Shandong Province. The numerical calculations in this paper have been done on the supercomputing system in Shandong Jianzhu University. The authors appreciate this help.

Conflicts of Interest

The authors declare no conflict of interest.

References

  1. Nie, J.G.; Tao, M.X.; Huang, Y.; Tian, S.M.; Chen, G. Research advances of steel-concrete composite structural systems. J. Build. Struct. 2010, 31, 71–80. (In Chinese) [Google Scholar]
  2. Oehlers, D.J. Composite profiled beams. J. Struct. Eng. 1993, 119, 1085–1100. [Google Scholar] [CrossRef]
  3. Oehlers, D.J.; Wright, H.D.; Burnet, M.J. Flexural strength of profiled beams. J. Struct. Eng. 1994, 120, 378–393. [Google Scholar] [CrossRef]
  4. Uy, B.; Bradford, M.A. Ductility of profiled composite beams. Part I: Experimental study. J. Struct. Eng. 1995, 121, 876–882. [Google Scholar] [CrossRef]
  5. Uy, B.; Bradford, M.A. Ductility of profiled composite beams. Part II: Analytical study. J. Struct. Eng. 1995, 121, 883–889. [Google Scholar] [CrossRef]
  6. Chen, L.H.; Li, S.T.; Zhang, H.Y.; Wu, X.F. Experimental study on mechanical performance of checked steel-encased concrete composite beam. J. Constr. Steel. Res. 2018, 143, 223–232. [Google Scholar] [CrossRef]
  7. Keo, P.; Lepourry, C.; Somja, H.; Palas, F. Behavior of a new shear connector for U-shaped steel-concrete hybrid beams. J. Constr. Steel. Res. 2018, 145, 153–166. [Google Scholar] [CrossRef]
  8. Parvaria, A.; Zahraib, S.M.; Mirhosseinia, S.M. Numerical and experimental study on the behavior of drilled flange steel beam to CFT column connections. J. Struct. 2020, 28, 726–740. [Google Scholar] [CrossRef]
  9. Liu, H.Q.; Liu, Y.Z.; Huo, J.S. Cyclic behaviour of a novel steel beam-to-prefabricated CFST column connection with threaded sleeve bolts. J. Struct. 2021, 34, 615–629. [Google Scholar] [CrossRef]
  10. Xue, J.Y.; Li, H.C.; Chen, X. Experimental research on seismic damage of T-shaped CFST column to steel beam joints. J. Struct. 2022, 38, 1380–1396. [Google Scholar] [CrossRef]
  11. Fan, J.C.; Zhao, J.H.; Zhu, Q. Seismic behavior and analytical model for a fully bolted joint between CFDST columns and steel beams. J. Struct. 2022, 42, 515–530. [Google Scholar] [CrossRef]
  12. Zhang, A.L.; Li, C.H.; Liu, X.C. Seismic performance of joint for H-beam to CFST column with field-bolted flange-splicing. J. Constr. Steel. Res. 2022, 196, 107375. [Google Scholar] [CrossRef]
  13. Kim, S.B.; Ham, J.T.; Lee, C.N.; Kim, S.S. Study on the structural behavior of TSC beam-to-SRC column connection. J. Archit. Inst. Korea 2006, 22, 55–62. (In Korean) [Google Scholar]
  14. Park, H.G.; Hwang, H.J.; Lee, C.H.; Park, C.H.; Lee, C.N. Cyclic loading test for concrete-filled U-shaped steel beam-RC column connections. J. Eng. Struct. 2012, 36, 325–336. [Google Scholar] [CrossRef]
  15. Lee, C.H. Cyclic seismic testing of composite concrete filled U-shaped steel beam to H-shaped column connections. J. Struct. Eng. 2013, 139, 360–378. [Google Scholar] [CrossRef]
  16. Hwang, H.J. Cyclic loading test for beam-column connections of concrete-filled U-shaped steel beams and concrete-encased steel angle columns. J. Struct. Eng. 2015, 141, 04015020-1–04015020-12. [Google Scholar] [CrossRef]
  17. Ding, X.B.; Yang, F. Experimental investigation and finite element analysis of concrete-filled square steel tubular column to cold bending U-shaped steel beam joint. J. Ind. Constr. 2019, 49, 153–159. (In Chinese) [Google Scholar]
  18. Chen, L.H.; Chen, K.; Xia, D.R. Experiment study on seismic performance of H-shaped steel beam joint to square tubular column connection by joint field column wall reinforcement. J. Build. Struct. 2021, 51, 9–16. (In Chinese) [Google Scholar]
  19. JGJ 101-96; Specification for Seismic Test of Buildings. China Architecture and Building Press: Beijing, China, 1996.
  20. Han, L.H. Concrete-Filled Steel Tubular Structures; Science Press: Beijing, China, 2016. [Google Scholar]
  21. GB 50010-2010; Code for Design of Concrete Structures. China Building Industry Press: Beijing, China, 2010.
  22. Du, G.F.; Bie, X.M. Study on constitutive model of shear performance in panel zone of connections composed of CFSSTCs and steel-concrete composite beams with external diaphragms. J. Eng. Struct. 2018, 155, 178–191. [Google Scholar] [CrossRef]
  23. Ozkilic, Y.O. Cyclic and monotonic performance of stiffened extended end-plate connections with large-sized bolts and thin end-plates. J. Bull. Earthq. Eng. 2022, 20, 7441–7475. [Google Scholar] [CrossRef]
  24. Li, W.; Han, L.H. Seismic performance of CFST column-to-steel beam joints with RC slab: Analysis. J. Constr. Steel. Res. 2011, 67, 127–139. [Google Scholar] [CrossRef]
  25. Nie, J.G.; Qin, K.; Cai, C.S. Seismic behavior of connections composed of CFSSTCS and steel-concrete composite beams-finite element analysis. J. Constr. Steel. Res. 2008, 64, 680–688. [Google Scholar] [CrossRef]
Figure 1. Concrete-filled U-shaped steel (CFUS) beam.
Buildings 13 00517 g001
Figure 2. RS connection.
Buildings 13 00517 g002
Figure 3. RT connection.
Buildings 13 00517 g003
Figure 4. RP connection.
Buildings 13 00517 g004
Figure 5. Details and dimensions of specimens: (a) the whole specimen; (b) section 1-1 of specimen C-1; (c) section 2-2 of specimen C-1; (d) inner diaphragm.
Buildings 13 00517 g005aBuildings 13 00517 g005b
Figure 6. Test setup: (a) the schematic of the test setup; (b) test loading site.
Buildings 13 00517 g006aBuildings 13 00517 g006b
Figure 7. P-Δ hysteretic curves of specimens: (a) specimen C-1; (b) specimen C-2; (c) specimen C-3.
Buildings 13 00517 g007
Figure 8. Stress–strain curves: (a) stress–strain relation model used for in-filled concrete in the square steel tube; (b) stress–strain relation model used for the normal concrete of the composite beam.
Buildings 13 00517 g008
Figure 9. Boundary conditions scheme and finite element models: (a) boundary conditions scheme; (b) the whole model; (c) RP connection; (d) RS connection; (e) RT connection.
Buildings 13 00517 g009aBuildings 13 00517 g009b
Figure 10. Comparison of tested and simulated failure modes of specimen C-1: (a) fracture of the bottom plate of U-shaped beam; (b) von Mises stress contour in the connection; (c) concrete crushing in the slab; (d) PEEQ contour in the concrete slab.
Buildings 13 00517 g010aBuildings 13 00517 g010b
Figure 11. Comparison of skeleton curves of three specimens: (a) specimen C-1; (b) specimen C-2; (c) specimen C-3.
Buildings 13 00517 g011
Figure 12. Von Mises stress contours of the end of bottom plate of U-shaped steel beam and the internal diaphragm at the yield state: (a) RS connection; (b) RT connection.
Buildings 13 00517 g012
Figure 13. Von Mises stress contours in the webs of steel tube in connection zone at the yield state: (a) RS connection; (b) RT connection.
Buildings 13 00517 g013
Figure 14. Von Mises stress contours of the left flange of steel tube in the connection zone: (a) RS connection; (b) RT connection.
Buildings 13 00517 g014
Figure 15. Von Mises stress contours of the right flange of steel tube in the connection zone: (a) RS connection; (b) RT connection.
Buildings 13 00517 g015
Figure 16. Principal compressive stress σ3 contours of the concrete in connection zone at the yield state: (a) RS connection; (b) RT connection.
Buildings 13 00517 g016
Figure 17. Longitudinal stress distribution of rebars in concrete slab at the yield state: (a) RS connection; (b) RT connection.
Buildings 13 00517 g017
Figure 18. Development of von Mises stress of steel components: (a) von Mises stress contours of steel components subjected to axial load on the column; (b) von Mises stress contours of steel components at the yield state; (c) von Mises stress contours of steel components at the ultimate state.
Buildings 13 00517 g018
Figure 19. Thickness of U-shaped steel.
Buildings 13 00517 g019
Figure 20. Ratio of longitudinal rebar in concrete slab.
Buildings 13 00517 g020
Figure 21. Strength of concrete in beam.
Buildings 13 00517 g021
Figure 22. Strength of U-shaped steel.
Buildings 13 00517 g022
Figure 23. Thickness of internal diaphragm.
Buildings 13 00517 g023
Table 1. Size of specimens.
SpecimenColumnBeamInternal DiaphragmAxial Load
Ratio
Steel Tube
bc × bc × tc
U-Shaped Steel
hw × b × b1 × tb
Negative
Rebar
WidthLengthThicknessThe Vertical Load Values
C-1250 × 250 × 10160 × 120 × 50 × 64D14230230100.2800 KN
C-2250 × 250 × 8160 × 120 × 50 × 64D14234234100.2800 KN
C-3250 × 250 × 10160 × 120 × 50 × 64D14230230100.2800 KN
Note: Unit in this table is mm.
Table 2. Material properties of steel.
TypeThickness (mm)Yield Strength
fy (MPa)
Ultimate Strength
fu (MPa)
Elastic Modulus
(105 MPa)
Elongation
δ (%)
Steel tube83124551.9935
103304352.0334.5
U-shaped steel beam62854231.9731
Diaphragm103704452.0931.5
Table 3. Material properties of concrete.
GradeMix Proportion (kg/m3)Cube Compressive Strength (MPa)
CementSandGravel
C20336640117221.9
C30360609122029.3
C40420523128042.6
Disclaimer/Publisher’s Note: The statements, opinions and data contained in all publications are solely those of the individual author(s) and contributor(s) and not of MDPI and/or the editor(s). MDPI and/or the editor(s) disclaim responsibility for any injury to people or property resulting from any ideas, methods, instructions or products referred to in the content.

